Article

Learning with Interactive Knowledge Representations

1
Faculty of Education, Amsterdam University of Applied Sciences, 1091 GM Amsterdam, The Netherlands
2
Informatics Institute, Faculty of Science, University of Amsterdam, 1098 XH Amsterdam, The Netherlands
*
Author to whom correspondence should be addressed.
Appl. Sci. 2023, 13(9), 5256; https://doi.org/10.3390/app13095256
Submission received: 2 March 2023 / Revised: 19 April 2023 / Accepted: 20 April 2023 / Published: 23 April 2023
(This article belongs to the Special Issue Information and Communication Technology (ICT) in Education)

Abstract

:
Computers are promising tools for providing educational experiences that meet individual learning needs. However, delivering this promise in practice is challenging, particularly when automated feedback is essential and the learning extends beyond using traditional methods such as writing and solving mathematics problems. We hypothesize that interactive knowledge representations can be deployed to address this challenge. Knowledge representations differ markedly from concept maps. Where the latter uses nodes (concepts) and arcs (links between concepts), a knowledge representation is based on an ontology that facilitates automated reasoning. By adjusting this reasoning towards interacting with learners for the benefit of learning, a new class of educational instruments emerges. In this contribution, we present three projects that use an interactive knowledge representation as their foundation. DynaLearn supports learners in acquiring system thinking skills. Minds-On helps learners to deepen their understanding of phenomena while performing experiments. Interactive Concept Cartoons engage learners in a science-based discussion about controversial topics. Each of these approaches has been developed iteratively in collaboration with teachers and tested in real classrooms, resulting in a suite of lessons available online. Evaluation studies involving pre-/post-tests and action-log data show that learners are easily capable of working with these educational instruments and that the instruments thus enable a semi-automated approach to constructive learning.

1. Introduction

Among the many skills and competencies that learners must develop in their science education, the ability to construct explanations, as well as the ability to relate scientific theories and arguments to real-world phenomena, is especially important. We investigate how knowledge representations can be used to support learners in this respect.
The idea of knowledge representation is one of the valuable inventions of Artificial Intelligence [1]. It can be described as a generic vocabulary (a conceptual framework) with which knowledge can be expressed, i.e., represented or modelled, and conclusions (inferences) derived automatically. Knowledge representation has become a crucial tool for scientists to (i) understand and explain phenomena, (ii) implement and evaluate the insights obtained, and (iii) share the results as external representations with other scientists [2]. Initially, the use of knowledge representations was reserved for a select group of researchers [3], but with contemporary computers, it can be used widely. In our research, we endeavour to deploy the power of knowledge representations for education.
The use of various types of representations, such as graphical and symbolic, to develop such understanding has become a common practice in education [4,5]. These representations aid in learning by making the information more accessible and comprehensible to learners. For instance, diagrams and charts can provide a graphical representation of complex information, making it easier for learners to understand the relationships between various concepts [6]. Symbols and formulas can help learners comprehend abstract concepts by providing a concise representation of the underlying ideas [7]. The way we represent knowledge, and the way in which knowledge representations are used in the classroom, can significantly affect how learners comprehend complex information [8]. Thus, understanding the semantics of representations is an essential aspect of learning in science education. By providing a visual and structured way to represent information, learners can improve their comprehension, retention, and application of knowledge [9,10].
From a cognitive perspective, representations are computationally efficient as a means of learning and problem-solving [11]. Representations can provide a more intuitive and direct overview of the problem or concept being learned, reducing the need for complex verbal instructions and allowing for more efficient and effective learning. The burden on the learners’ working memory can be reduced by the simultaneous learning of visual and verbal information as they are processed through different channels, as proposed by the dual coding theory [12]. Additionally, the utilization of a representation by making knowledge explicit and organizing it, along with facilitating communication and reflection, can augment the co-construction of knowledge amongst learners [13].
The shift from passive learning by reading representations to active construction of representations has been identified as a more effective approach for promoting deep learning and meaningful understanding in education [9,10,14]. The process of constructing representations requires learners to actively interact with complex information, recognize significant ideas, and understand how these ideas are interconnected as they build their own knowledge. Learners must therefore understand the semantics of the representations [9,10]. A representation—especially if there is a concise and formal vocabulary—supports and constrains learners’ reasoning and thereby aids them in refining their mental models. It is essential that there is correspondence between the requirements of the task and the kind of information provided by the representation [9,15]. Of course, there are also potential challenges and limitations associated with learning by constructing representations. For example, learners may struggle to create accurate mental representations of complex phenomena, particularly if they lack the necessary background knowledge or experience [8].
The use of technology in education has opened up new opportunities for representation and learning [16,17]. Educational software and online platforms offer a wide range of interactive tools and multimedia resources that can help learners visualize and comprehend complex information [18]. Knowledge representations are a key aspect of artificial intelligence and cognitive science, as they involve the systematic arrangement and organization of knowledge in a manner that facilitates its utilization by computational systems or cognitive agents [19]. Knowledge representations are increasingly being utilized in education [4] as they provide a structured approach to capturing, storing, and manipulating information about the world. By using knowledge representations, learners gain a deeper understanding of complex concepts.
Various types of knowledge representation exist [1]. The choice of representation depends on the task and domain of the application. We focus on representations relevant to reasoning about the behaviour of dynamic systems, as many of the subjects taught in education concern dynamic systems.
The content of this paper is organized as follows. Section 2 discusses qualitative representations and how these can be used by learners in secondary education to acquire system thinking skills while simultaneously learning about specific phenomena in physics, biology, geography, and economics. Section 3 discusses how, in primary education, interactive diagrams can steer and aid learners in grasping key concepts explored during scientific experiments. Section 4 discusses how the interplay between a sequence of concept cartoons and interactive representations helps teachers and learners in upper primary and lower secondary education discuss controversial topics and work towards science-based argumentation. Section 5 reflects on the presented results and concludes this contribution by summarizing the main achievements.

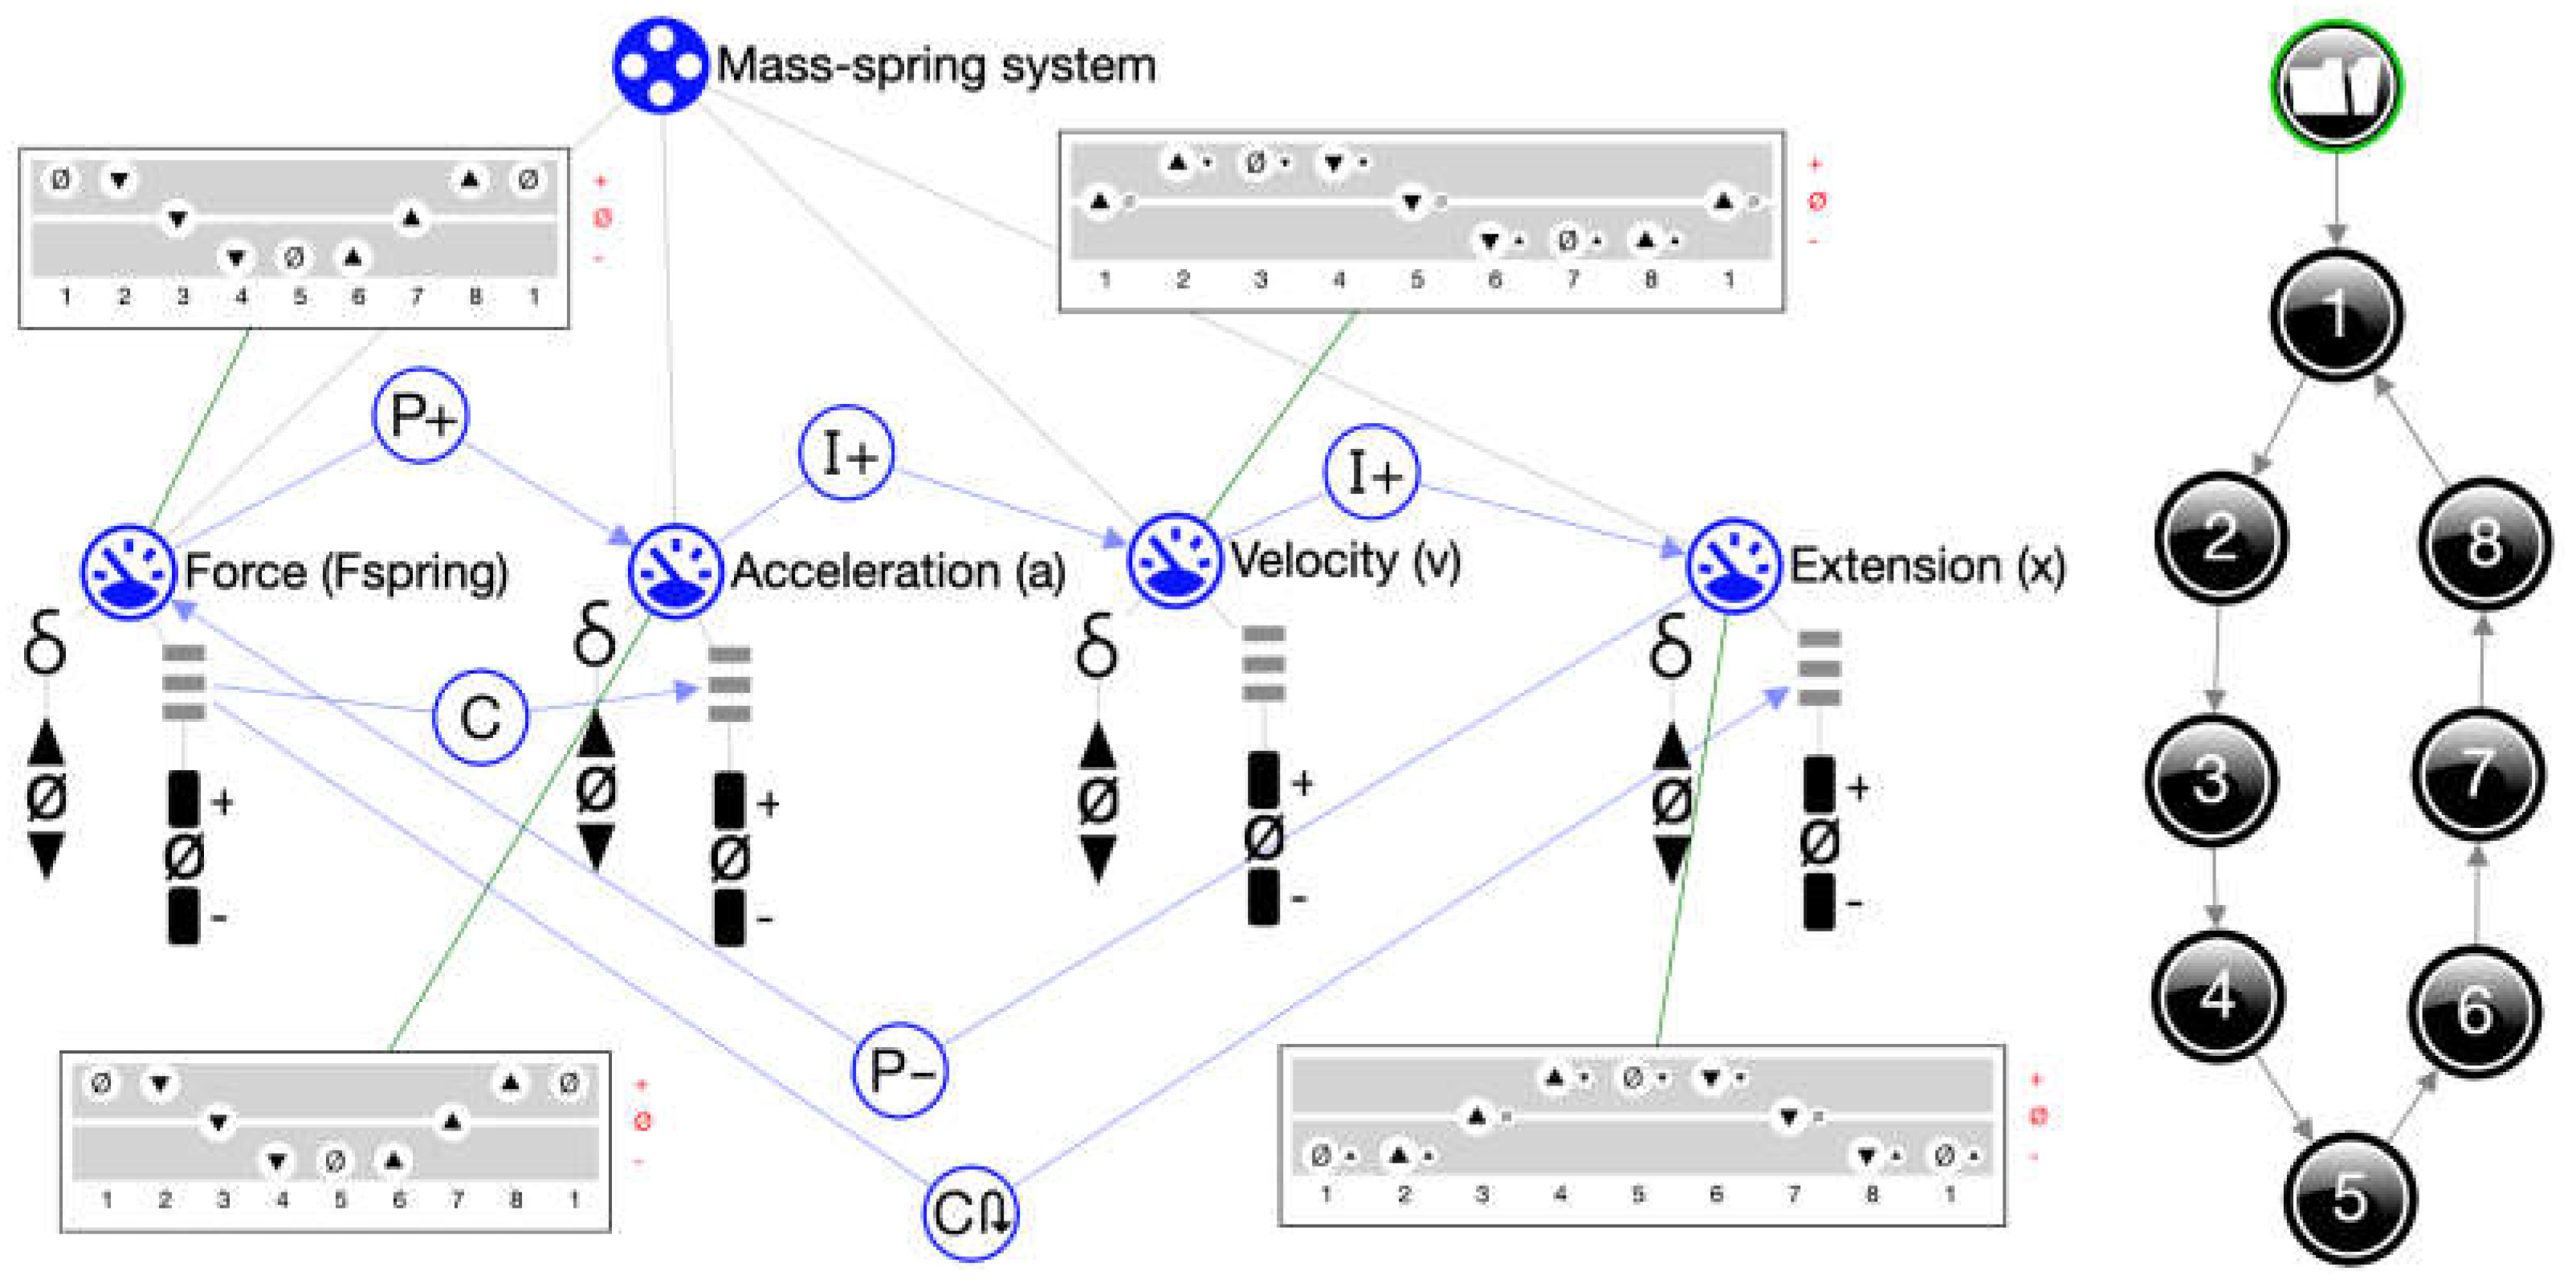
2. Systems Thinking with Qualitative Representations in Secondary Education

Qualitative Reasoning is an area within Artificial Intelligence that develops formalisms for automated reasoning about the behaviour of systems [20]. Various authors have reported on deploying and evaluating aspects of such representations for education (see, e.g., [21] and refs within). In the work presented here, we focus on the challenges formulated in the project Denker (https://denker.nu/ (accessed on 19 February 2023)): learning system thinking and creating knowledge by constructing qualitative representations. Systems thinking is difficult to learn [22,23]. Learners may easily ignore relevant factors, apply causal relationships incorrectly, fail to see feedback mechanisms and understand their impact, and not recognize cause–effect patterns across systems (so-called transfer) [24,25].
The secondary education curriculum contains many learning goals that require learners to understand subject-specific systems (e.g., climate, recession, gravitational acceleration, and predator–prey). However, generic systems thinking skills are often not explicitly taught in secondary education. We investigate how qualitative representations can be used as a method to acquire such understanding. In this contribution, we present our developments on scaffolds, instructional formats, and automated support in order to unleash the potential of qualitative representations for secondary education.

2.1. The Educational Instrument

DynaLearn is an interactive tool that allows learners to create and simulate qualitative representations (https://www.dynalearn.nl (accessed on 19 February 2023)). It provides a web-based graphical user interface to Garp3 [26,27], facilitating online usage of the latter. Table 1 summarizes the ingredients available for creating representations. The software automatically generates simulations based on them. Table 2 shows the ingredients used to express these simulation results. It is important to note that no quantitative information is used. Both the representation and the simulation results are qualitative using a logic-based approach (for technical details, see [27]). To enable its use in education, an approach was developed that uses modelling levels accompanied by various instructional formats.
Modelling levels. The modelling levels refer to the six levels defined earlier [28]. In that approach, level 1 referred to traditional concept maps [29]. The representations reported here start at level 2 because the focus is entirely on systems thinking.
Level 2 allows for simple cause–effect representations to support reasoning about how changes propagate through a system (Figure 1). Learners represent the entities and configurations, the associated quantities, the causal dependencies (+ & −) between these quantities, and the initial change for the quantities at the beginning of the causal paths. When simulating, the initial changes are propagated through the representation determining the possible states of behaviour. This typically results in a single state or multiple states in the case of ambiguity (the latter is shown in Figure 1).
At level 3, quantity spaces are included (for selected quantities as deemed necessary by the educators), which allows for representing the idea that a system can move through different states (e.g., a solid substance becoming liquid) characterized by a ‘state-variable’ (e.g., temperature). Additionally, the ingredients agent (a special kind of entity) and exogenous quantity behaviour (continuously decreasing, increasing, random, etc.) are available. At level 3, learners thus learn to distinguish the ‘system’ from the ‘external factors’ affecting it. Finally, correspondence (C) can be used to specify co-occurring values (e.g., IF Population Size = 0, THEN Natality = 0). When simulating, a state-graph appears (sequence of states and transitions), and the value history (overview of quantity values for a sequence of states) can be used to inspect the simulation results.
Level 4 introduces influence (I+/I−) and proportionality (P+/P−) [20]. Learning now focuses on the distinction between processes (I, initial causes) and their propagation (P) through the system (Figure 2). Positive and negative feedback loops are also possible, and in/equalities (< ≤ = ≥ >) represent the relative impact of competing processes. The inequality history can be used to inspect how in/equality between quantities changes during the evolution of the behaviour.
These modelling levels are an important scaffold for teaching and learning systems thinking. At each level, activities can be defined to work on the specific subject matter (conform to the school curriculum) as well as on the related overarching systems thinking skills. Of course, it makes sense to start at the lowest level and gradually work towards the higher, more complex levels. It is important to note that the subject matter may come from any topic involving the notion of a system and that it is not a priori limited to a particular domain or system. Well-suited areas in secondary education include biology, geography, economics, and physics.
Instructional formats. Having defined the levels and their interdependencies, the question still remains as to how to start working with learners at a specific level. We have developed various formats to address this issue.
Workbook. Most lessons include a written document that explains and instructs the learner step-by-step on the issues relevant to the task. Typically, these workbooks address (i) the subject matter, intertwined with (ii) the involved systems thinking, and (iii) some details regarding the GUI of the software.
Instruction clips. Short videos (approx. one minute each) demonstrate, using different examples, the kind of modelling and simulation steps learners are required to create for their own representation. The clips are shared as an independent asset but are also regularly referred to in the workbook in order to highlight specific systems thinking aspects.
Example model. This is a representation of a small system that learners can relate to and start experimenting with before they start the ‘real’ assignment. Learners can open this representation from a repository, save it as their own work, and perform basic steps, such as setting or changing initial values and inspecting the simulation outcome.
Template. To further steer the work of the learners, a template can be used. A template is a subset of the complete representation that is given to the learners at the start of the lesson. A larger representation can be addressed in a shorter time by using a template. However, care must be taken to ensure that learners still create a significant part of the representation themselves. After all, the learning takes place during the construction of one’s own representation.

2.2. Interactive Features

The described instructional formats are sufficient for formulating assignments that learners can work on independently and successfully complete. However, learners may make mistakes and potentially learn incorrect details or get stuck in executing the assignment. Hence, the teacher must also be alert, monitoring and assessing the progress of the learners and intervening when necessary. Although doable in regular classes, it can make teaching laborious. To alleviate this burden and stimulate learners’ self-reliance, we developed three types of automated support [30].
The norm-based feedback pinpoints errors made by learners (solving these remains a task of the learner). Our current implementation compares a learner-created representation with the norm representation (created by the teacher). After each manipulation performed by the learner in the canvas, a new mapping is made using a Monte-Carlo-based heuristic approach. The engine runs for at most five seconds and then returns the best mapping. Next, for each discrepancy, the support provides two options for feedback. (i) Cueing: a small red circle is placed around each deviating ingredient (Q2 in Figure 3), and a red question mark appears on the right-hand side of the canvas. (ii) Help: when clicking on the question mark, a message box appears showing a sentence for each deviation (in Figure 3: Quantity: Q2: wrong name?). It is important to note that when working on a specific representation, learners are confronted with subject-specific information—for instance, whether they have assigned the correct quantities to each of the entities.
Next to being informed about errors, it may also be helpful for learners to receive information on the degree to which they have completed their representation. Progress is shown via the progress bar (Figure 3). In addition to practically informing learners regarding the number of ingredients and relationships still to be added, the progress bar may also stimulate metacognitive reflection.
Finally, the scenario advisor inspects the status of the model before starting a simulation and automatically identifies and highlights missing initial settings as well as inconsistent settings. The information is shared using a blue exclamation mark on the right side of the canvas. Clicking on the exclamation mark informs learners which initial conditions are still required to start the simulation.

2.3. Results

The project Denker has created over 30 unique lessons covering various topics from the Dutch secondary education curriculum (grade 8–12) for physics, biology, geography and economics (see Table 3 for examples). The effect of the lessons on learning subject matter and systems thinking skills appears to be promising but needs further investigation. Previous studies indicate that learning by making qualitative representations is effective at level 2 [31] and level 3 [32].
The pedagogical approach was developed in collaboration with secondary school teachers, teacher educators, and experts in the field of qualitative representations. The approach was based on practical and theoretical principles, such as performing multiple iterations according to the inquiry cycle [33] and creating a need for learning certain concepts so that information can be delivered just in time. It is important to note that the approach is evolving due to new features being developed in the software during the project to support learning and provide guidance for teachers. For example, as discussed above, the current version of the software offers learners support through cueing and help, which indicate if they made mistakes in their representation. Such features have pedagogical implications that require further investigation.
The degree and type of support provided by the teacher may also vary [34,35]. For example, where one teacher quickly gives the correct answer to a question about the system being created, other teachers will focus more on strategies to stimulate the learners to discover the answer for themselves.

2.4. Discussion

Qualitative representations can be valuable tools for learners to actively develop their systems thinking skills. In this contribution, we present various features that enable the effectiveness of qualitative representations for this purpose, including modelling levels to scaffold learning, various instructional formats, and different kinds of automated support. This conglomerate of features allows learners to engage in active learning, fostering systems thinking as well as learning the domain-specific subject matter. Moreover, learners can, to a large extent, complete the lessons independently.
Ongoing research focuses on establishing and improving the value of the presented approach: (i) do the modelling levels sufficiently match the characteristics of the subject matter in the intended grades, (ii) what is the best use and order of the various instructional formats, and (iii) is the automated support effective and do learners have additional needs [32]?
Future research plans will focus on Learning Analytics and provide teachers with a dashboard to monitor the learning activities and further improve their coaching of the learners. Additionally, we plan to investigate how to support the development of new lessons using a semi-automated approach.

3. The Hands-on and Minds-on Challenge in Primary Education

In primary education, it can be challenging to teach science and technology. Primary school teachers may not have a strong background in science and technology and feel unable and insufficiently equipped to teach science and technology [36,37,38]. In addition, in classroom practice, science and technology research activities (also known as Inquiry-Based Science Education, IBSE) are often limited to practical activities [39,40,41], even though discussion, dialogue and reasoning skills are just as important for understanding the underlying concepts [42].
Reasoning skills can be stimulated by the use of computer-based interactive diagrams [25,43,44]. The goal of the project Minds-On (https://mindson.nl/ (accessed on 19 February 2023)) is to stimulate deep (or minds-on) learning during practical (hands-on) lessons by using such diagrams [45].

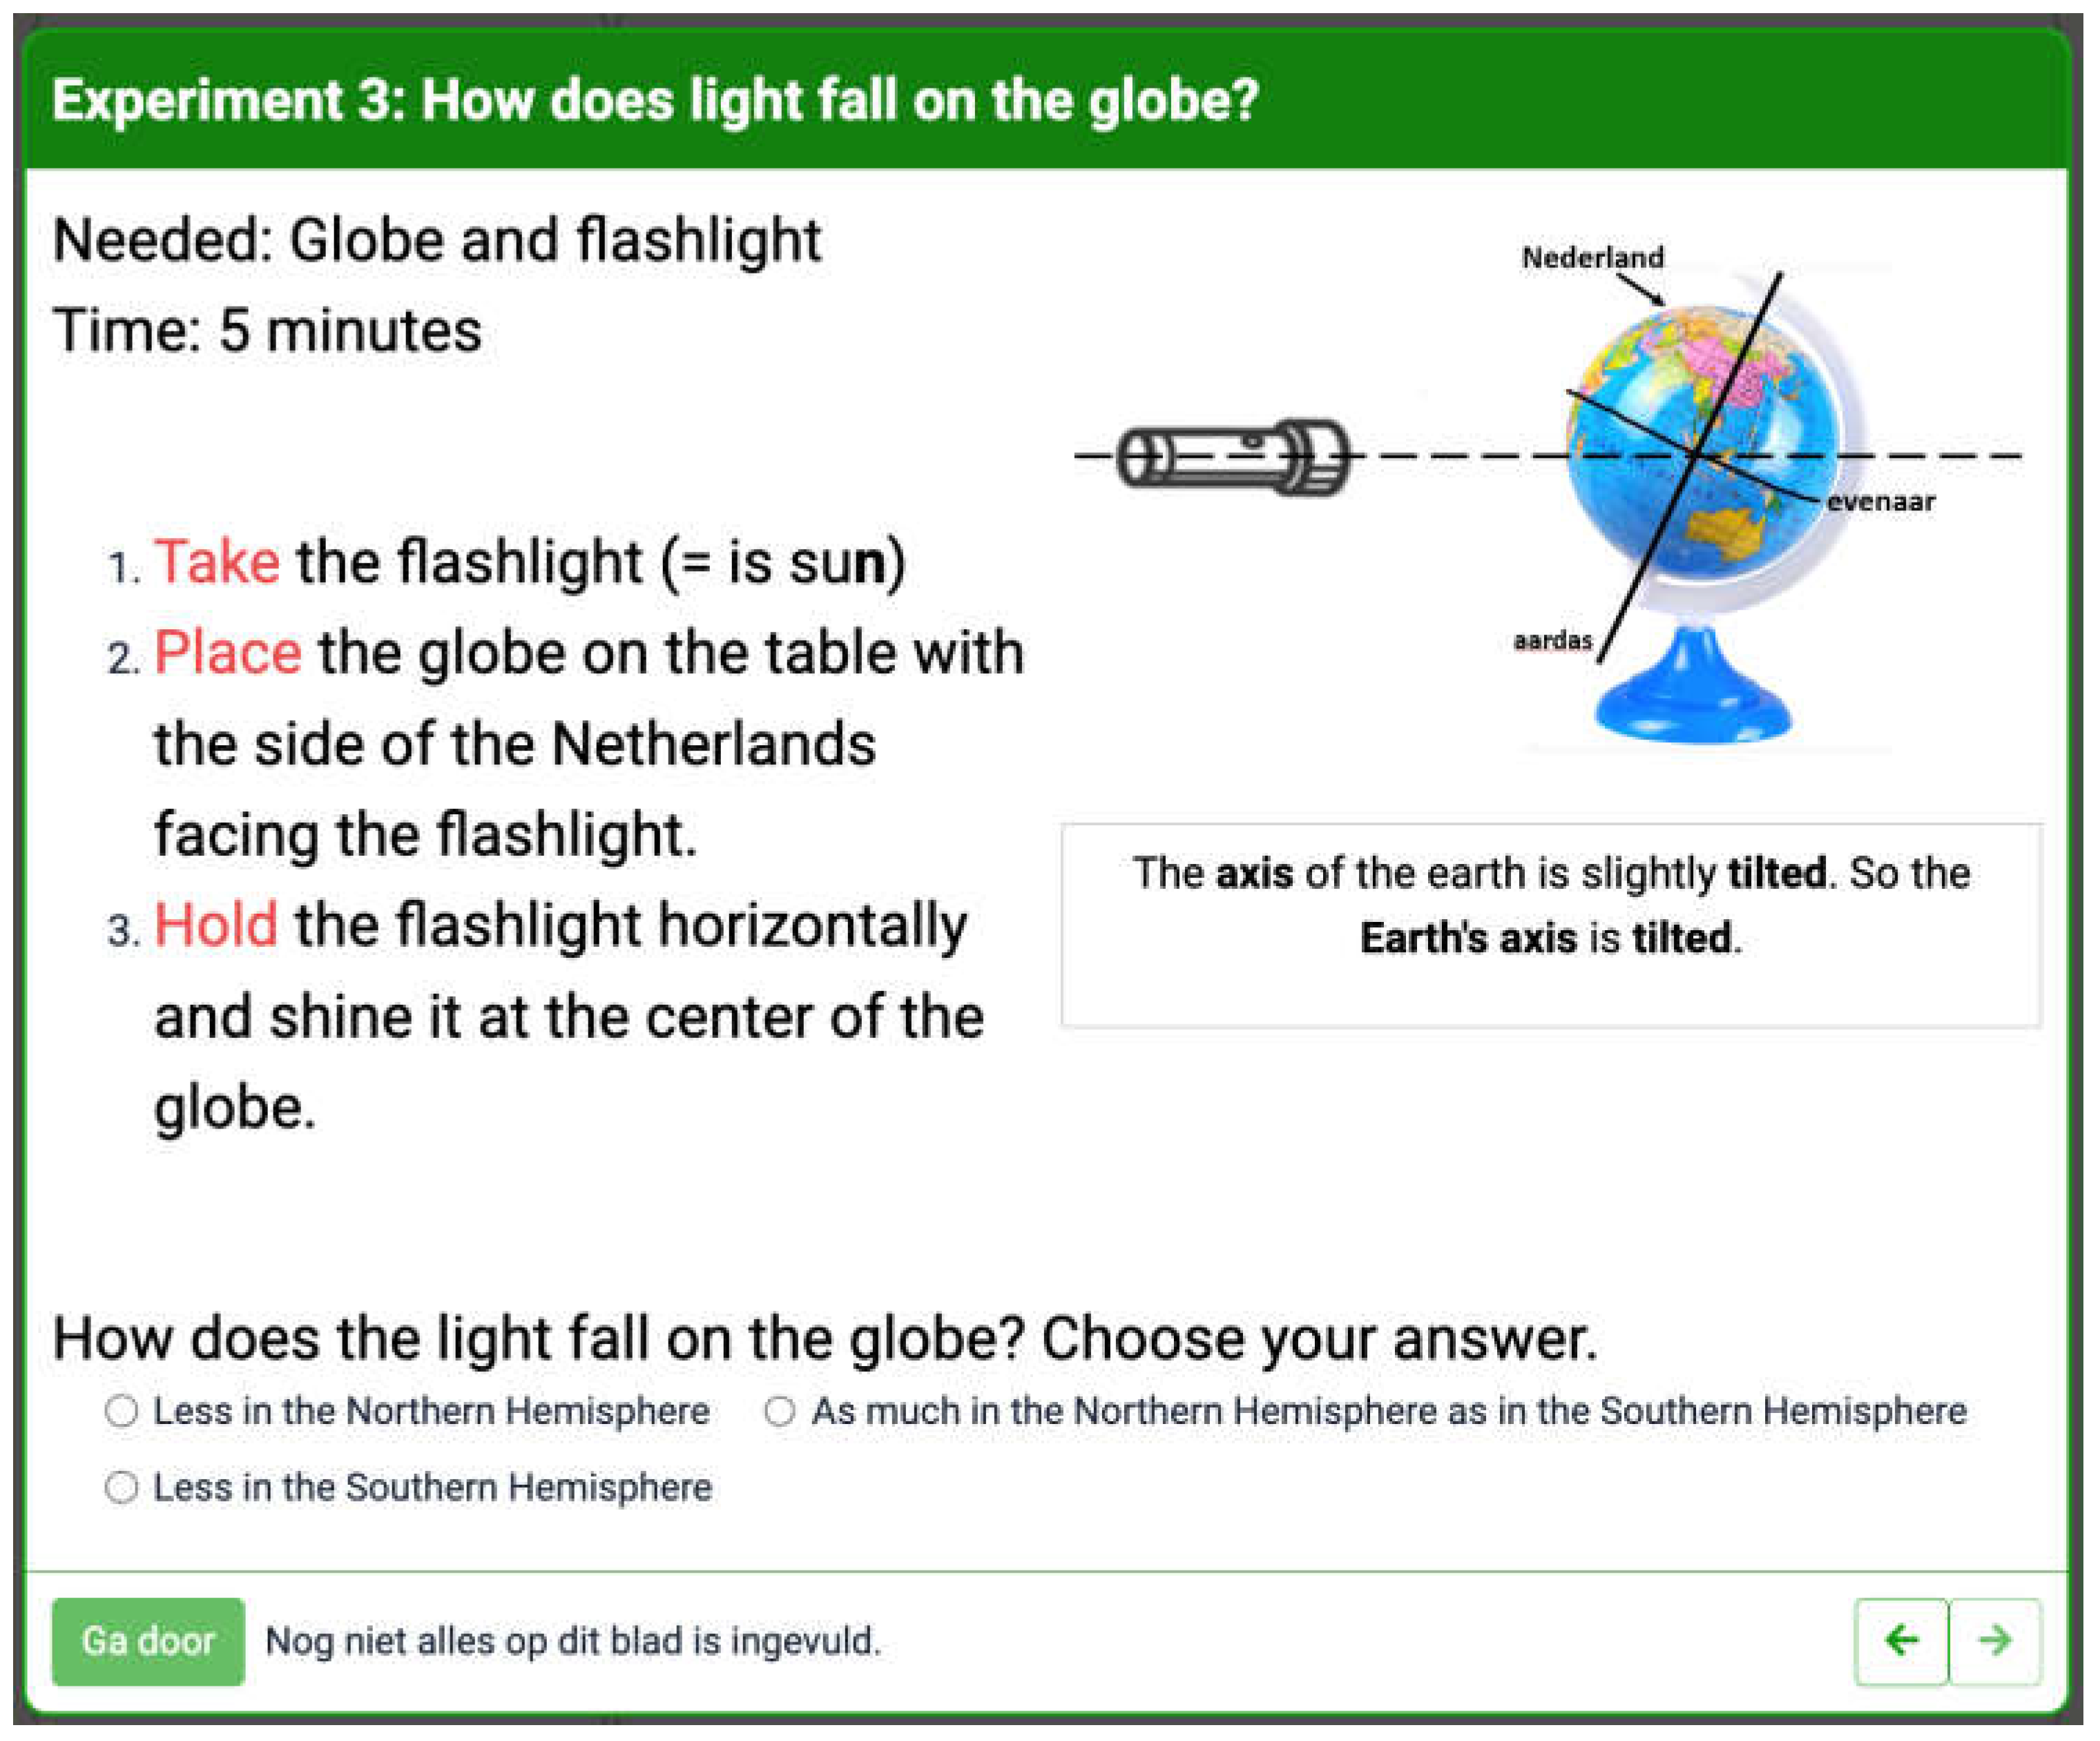
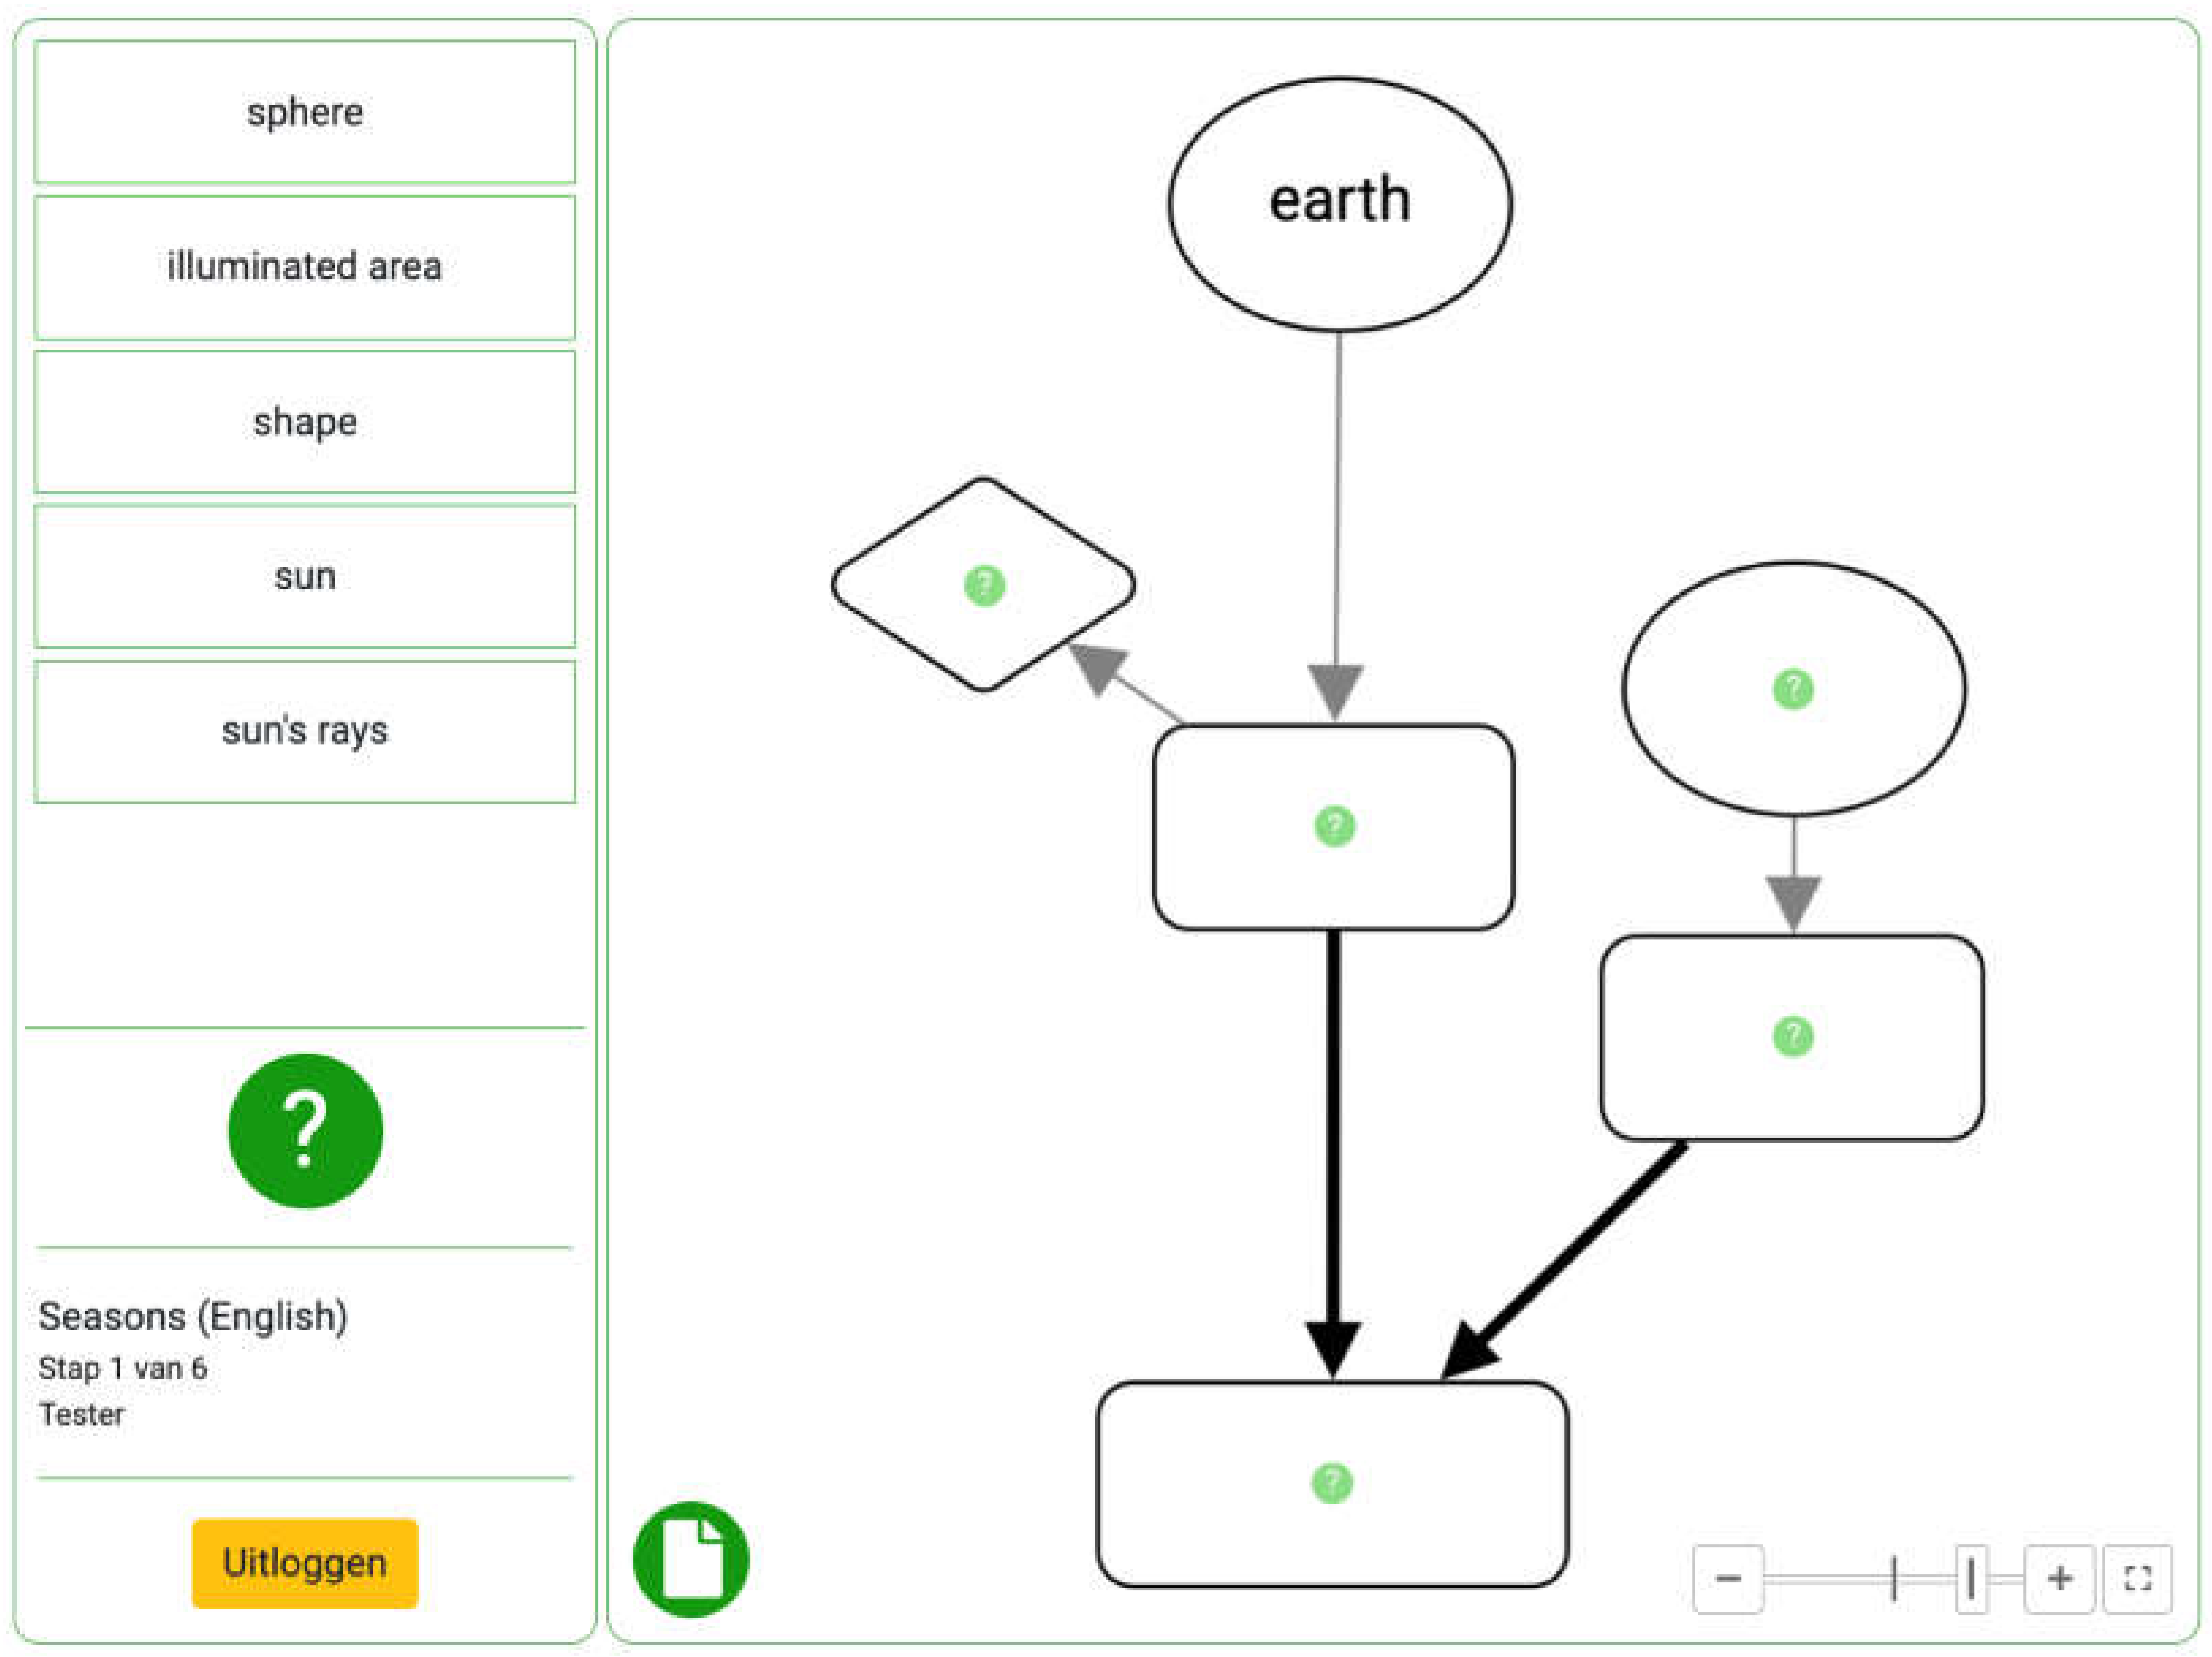
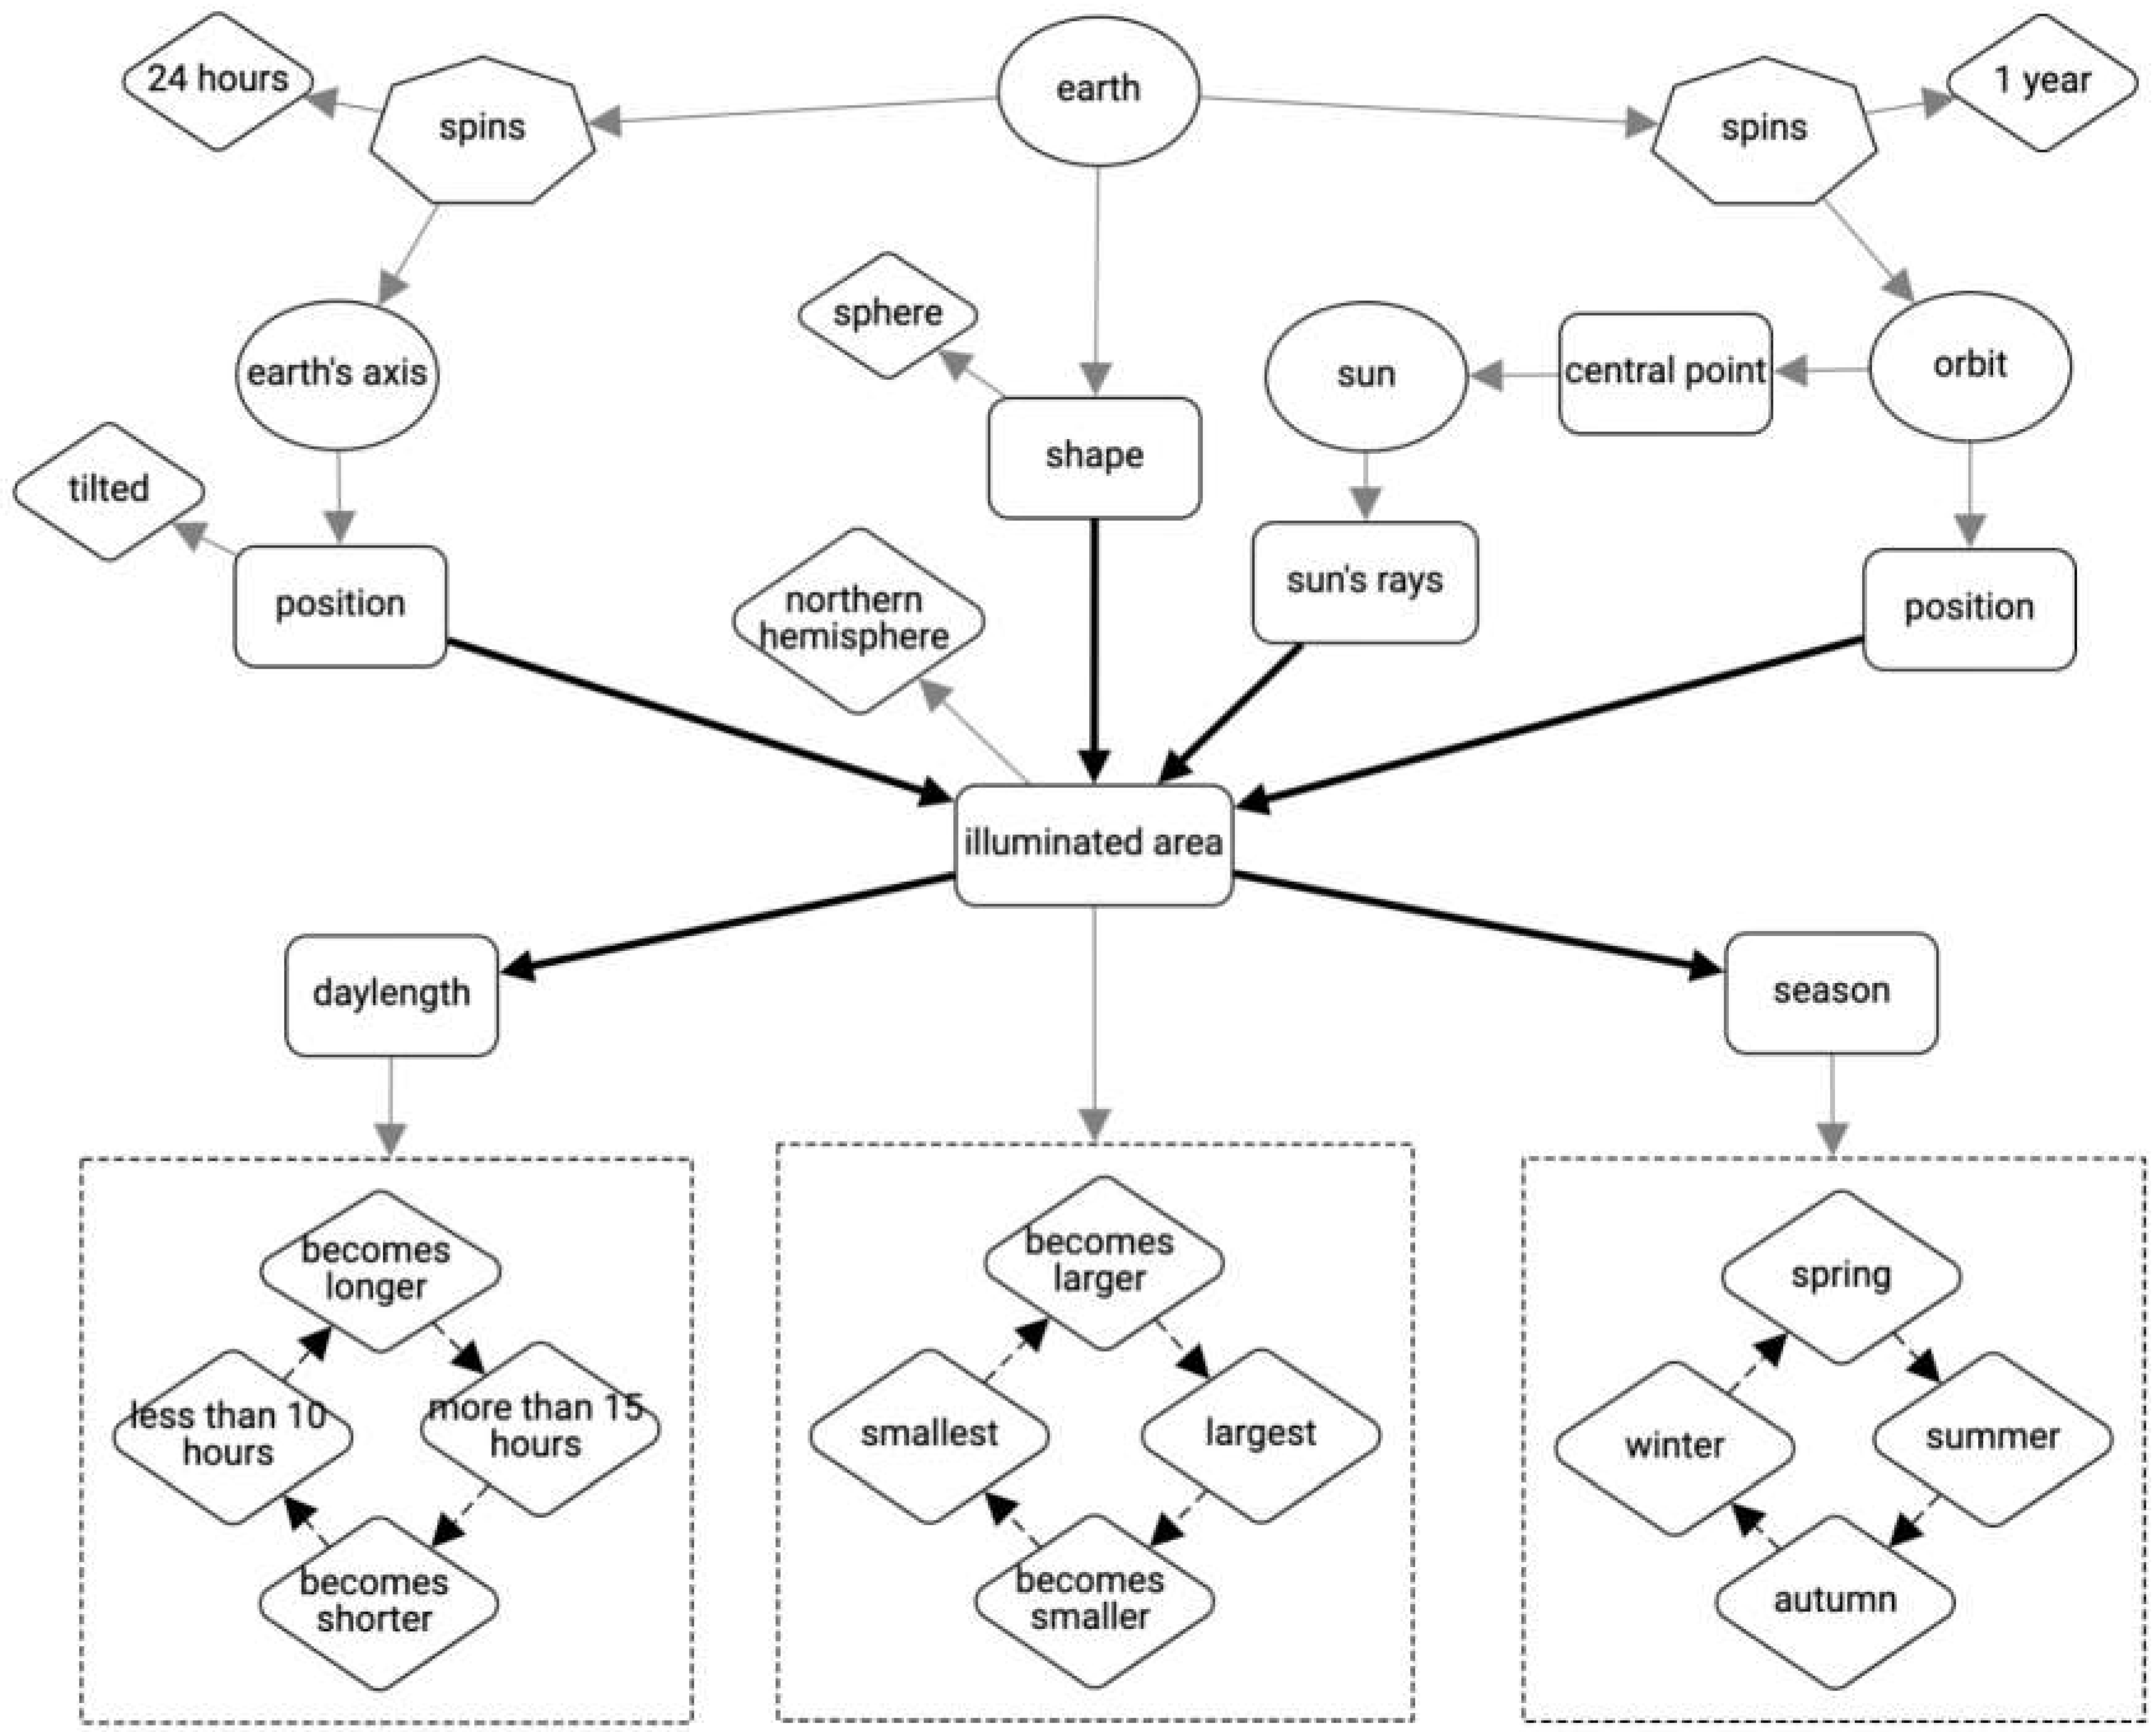
3.1. The Educational Instrument

The Minds-On application contains the complete lesson, including instructions for short practical activities, important definitions, short questions (Figure 4), and the corresponding steps in the interactive diagram (Figure 5). In addition, teachers are provided with a teacher’s guide and a short presentation to introduce the lesson.
In general, learners progress through 5–7 steps. In each step, learners complete a practical activity. Learners then proceed to the corresponding part of the interactive diagram and must place a set of terms associated with the preceding practical activity. This facilitates deeper learning of the underlying concepts. Learners perform the practical activities in pairs but complete the interactive diagram individually.
Each lesson focuses on one of the cross-cutting concepts as defined by the National Research Council [46], such as cause-and-effect relationships, classification, and thinking in systems. Figure 6 shows the complete interactive diagram for the lesson Seasons. Sub-concepts are classified as concepts (objects, ideas and processes: e.g., the Earth), properties (behaviour, variable, and non-variable properties, e.g., shape), movements (e.g., spins), values (e.g., 1 year), and changing values (e.g., increases), each depicted with a unique shape. Relationships are depicted with arrows, again the arrow style being linked to the type of relationship, including basic relationships (e.g., is), cause-and-effect relationships, and time-variable relationships.

3.2. Interactive Features

At the start of a lesson, after a short introduction to the topic by the teacher/researcher, learners log into the Minds-On application using unique class and learner login codes. Learners work through the lesson step-by-step. After each practical activity, the corresponding part of the diagram must be completed. For the lesson Seasons, learners begin with a short practical activity to explore how light illuminates a sphere. After completing the activity and associated questions, learners progress to the first part of the diagram (Figure 5). Learners must place the given concept words correctly into the empty placeholders. If necessary, learners can request help via the ’question mark’ buttons. Help offered includes general help (e.g., ‘drag words into the diagram’) and more specific help (e.g., ‘place an object here’). Once two linked concepts are placed, a feedback box appears showing the completed relationship (e.g., ‘the Earth has a shape’). Learners are asked whether they are satisfied that this is correct. Once all concepts have been inserted into the current step in the diagram, a ‘check’ button appears. If all concepts have been correctly placed, the learner may proceed to the next practical activity. If any concepts have been incorrectly placed, the learner is asked to improve the diagram. Incorrectly placed concepts are highlighted with bold red text.
For the lesson Seasons, learners progress through six practical activities and six diagram steps until the full diagram is complete. Learners are able to move forwards and backwards through the worksheets but cannot return to or edit successfully completed diagram steps. All lessons have a similar number of practical activities and diagram steps.

3.3. Results

Four lessons have been created combining five science topics with three different scientific thinking skills [46]:
  • Seasons, focusing on cause-and-effect relationships.
  • Sound, focusing on cause-and-effect relationships.
  • Fixtures (3a) and Animals (3b), focusing on classification.
  • The bicycle, focusing on thinking in systems.
The lessons were developed during a four-phase development trajectory, starting with the lesson on seasons with cause-and-effect relationships. In each subsequent phase, a new lesson and corresponding concept diagram were created, and the existing lessons/diagrams were improved by implementing the lessons learned from classroom testing during the previous phase.
The lessons were evaluated in real classrooms. Evaluation instruments included pre- and post-tests with items to assess learners’ concept knowledge shortly prior to and immediately after the lesson, experience questionnaires for both teachers and learners, and the data logger embedded in the Minds-On application.
Whilst there were initial concerns from teachers during the development phase that the lessons would be too long and the concept diagrams too complex, the results show a different picture. Almost all learners were able to complete the lessons within the allocated 90 min, with the majority completing the lessons in under an hour. This corresponds to the responses in the experience questionnaire showing that learners enjoyed the lessons and were motivated to complete them. After classroom testing, teachers were also highly positive about the lessons. Results show that for all lessons, learners scored significantly better on the post-test compared to the pre-test, although the extent to which the score increased varied with the Seasons lesson giving the highest learning gain.
Finally, the datalogger within the application gives insights into how learners progress through the lessons and highlights which steps (and corresponding concepts) learners find more difficult. For example, for the lesson Sound, learners took significantly more time to complete it and made more mistakes in the steps addressing the sub-concepts of frequency and amplitude. This can also be seen in the pre- and post-tests—learners struggled more with items relating to these sub-concepts than other elements of the lesson Sound. This information can be used to further improve the lessons in the future.

3.4. Discussion

The results of the classroom evaluation are positive. Learners generally scored better on the post-test compared to the pre-test in all four lessons, although the extent to which this occurred varies between lessons. The increase in the test score was the most significant for the lesson Seasons. Both the teacher and learner questionnaires showed that both groups enjoyed and were motivated to work with the lessons. However, it should be noted that the scores in general on both the pre- and post-tests were low, and the increases in test scores, whilst significant, are not large.

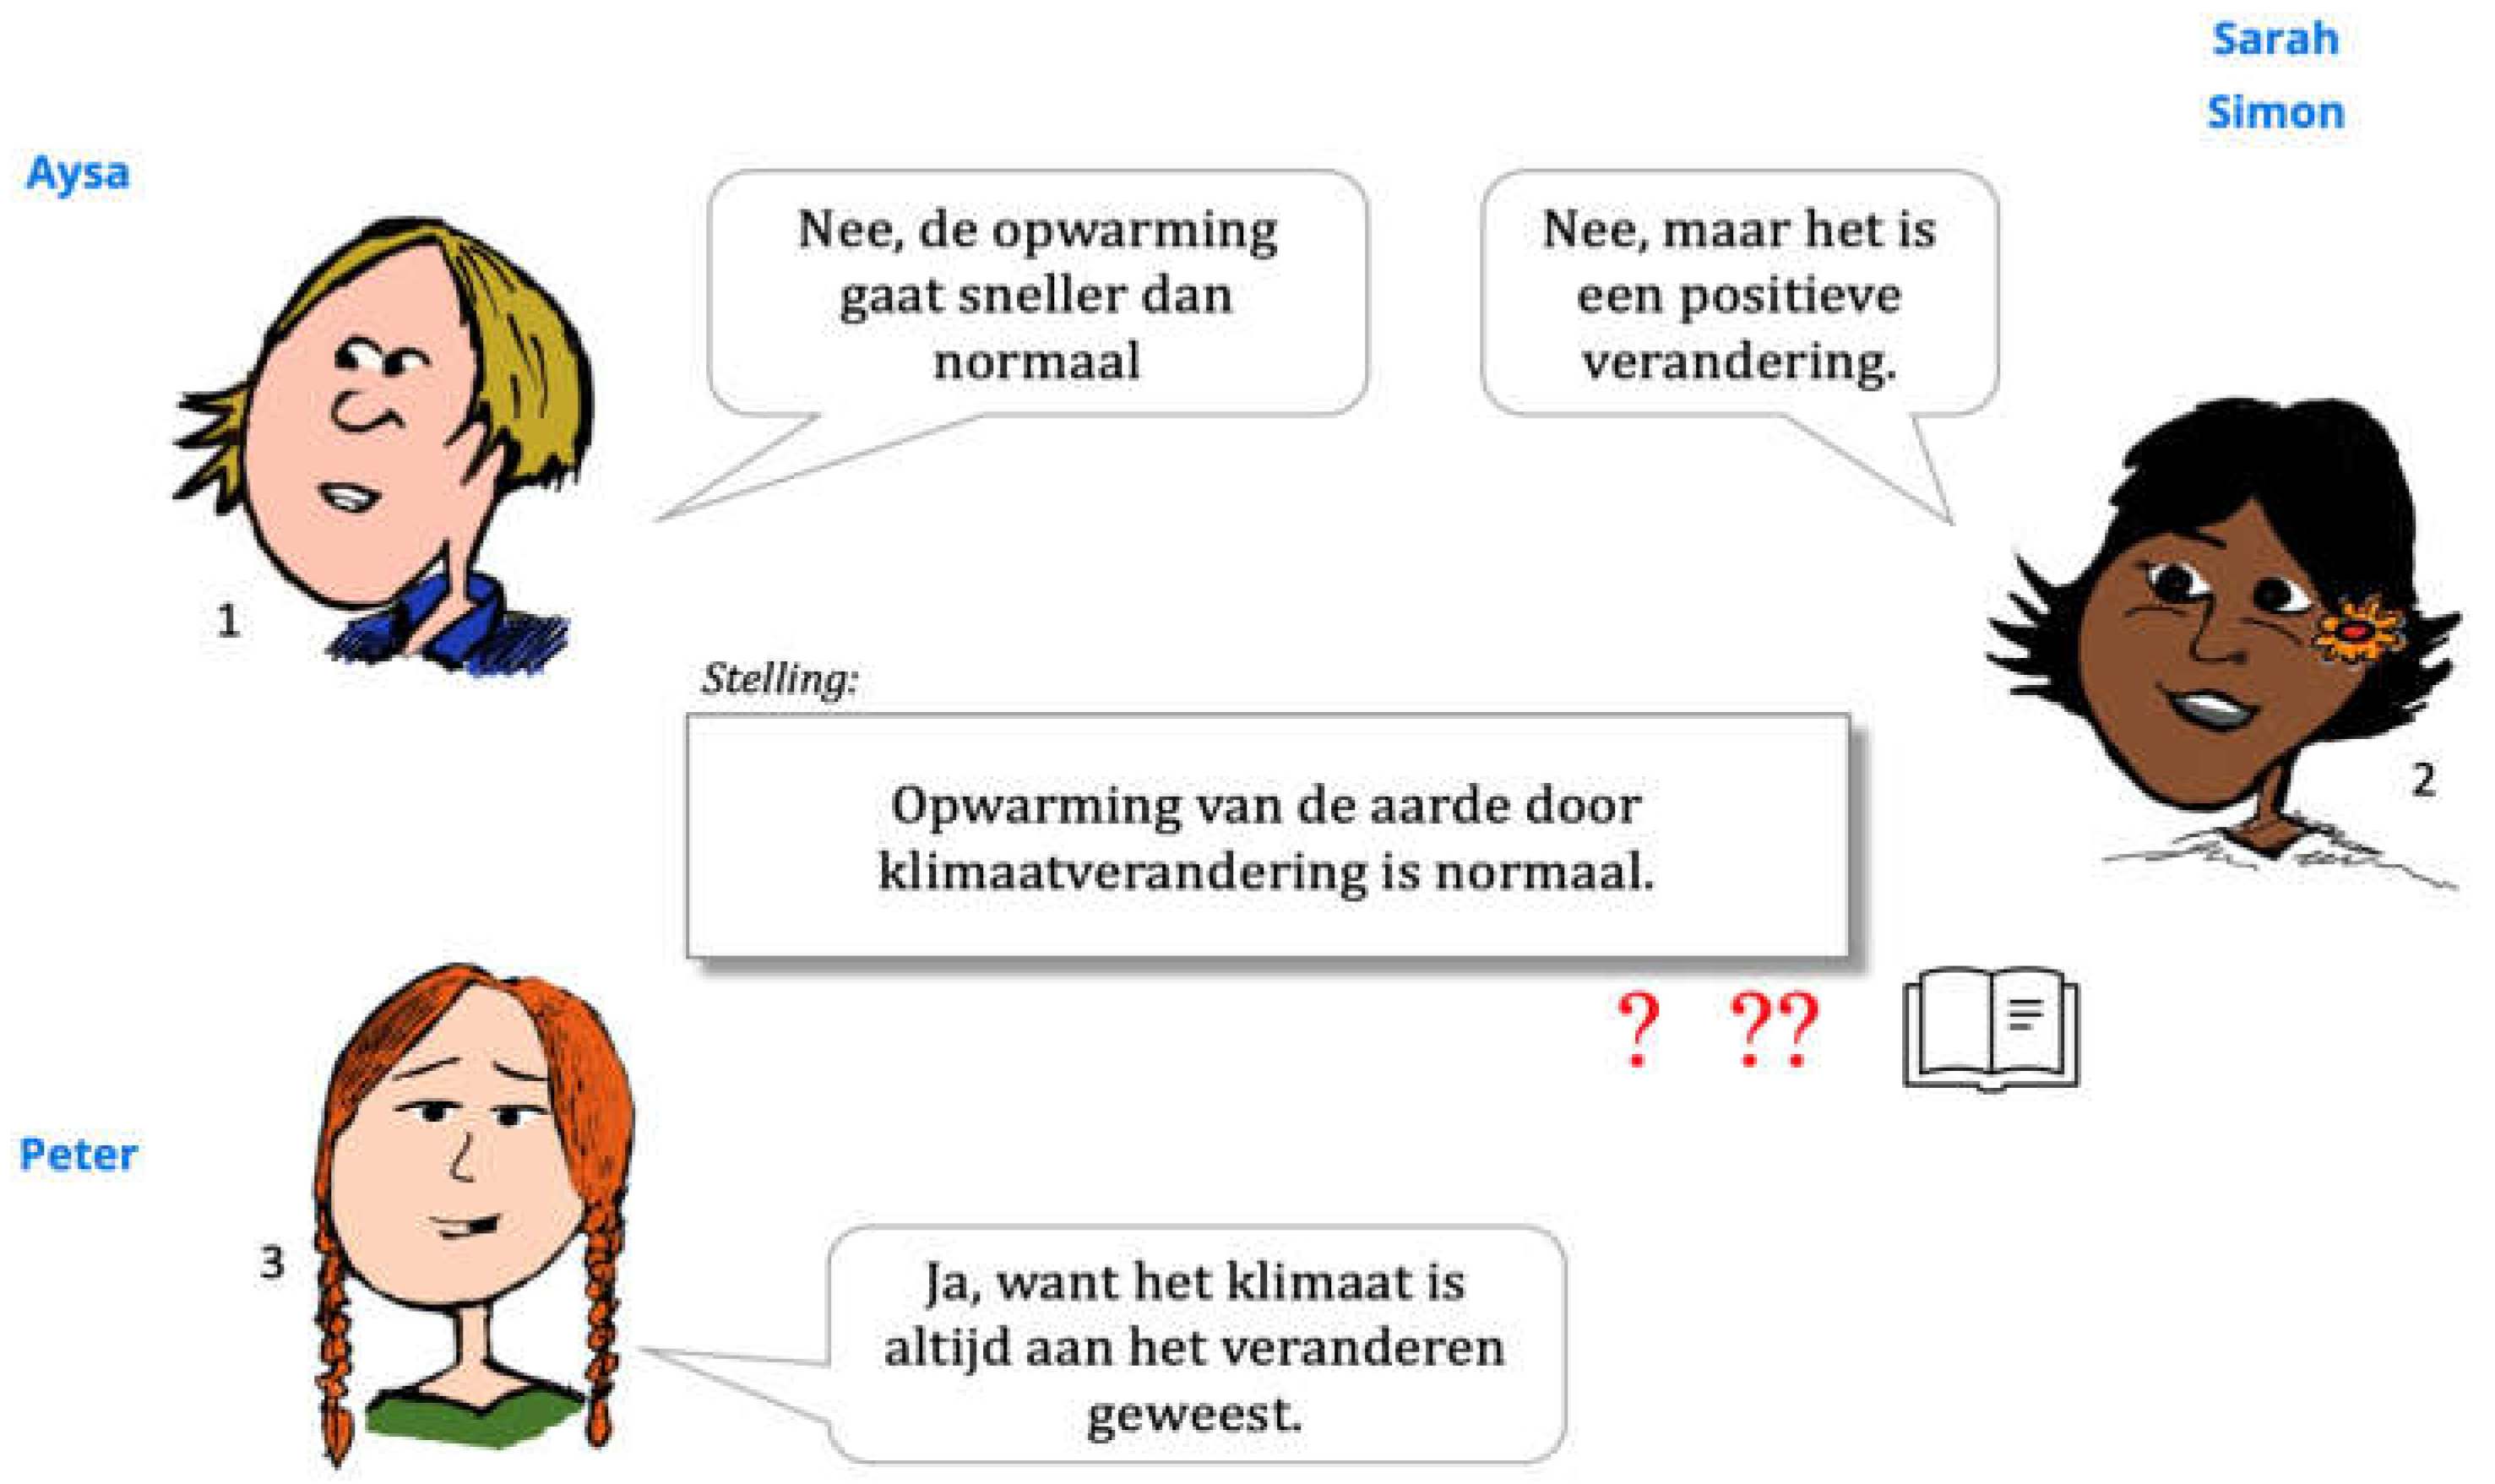
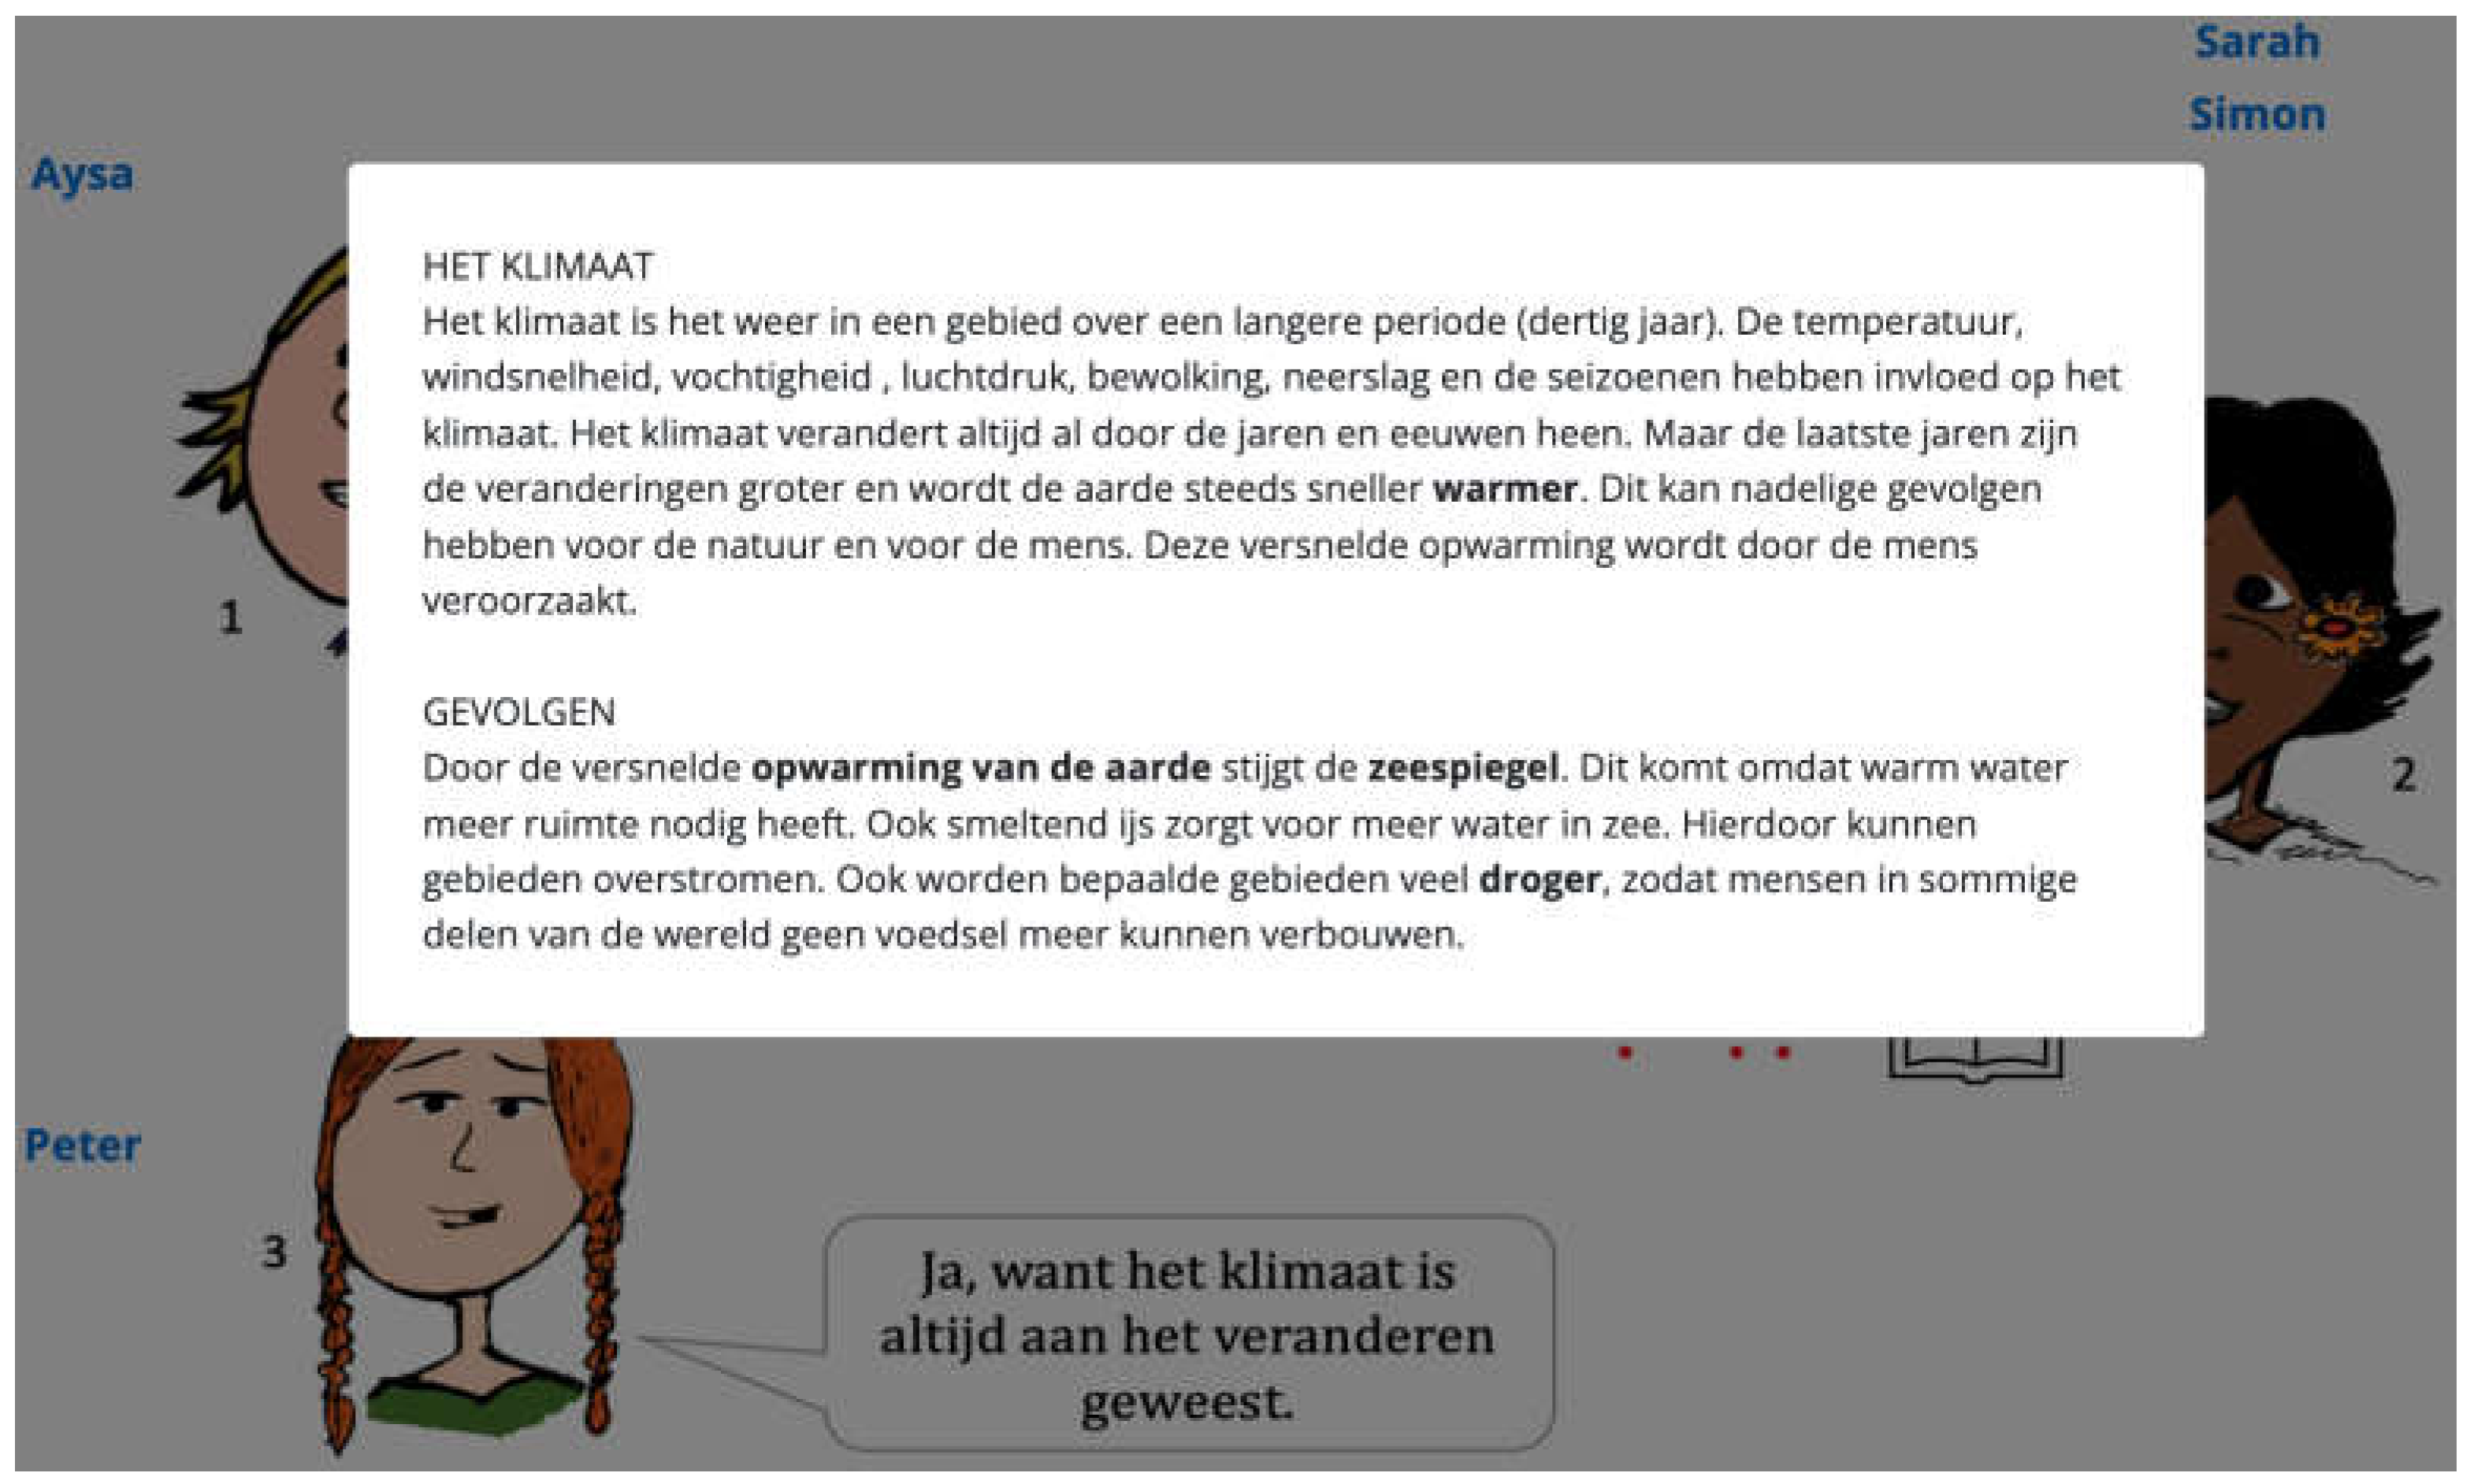
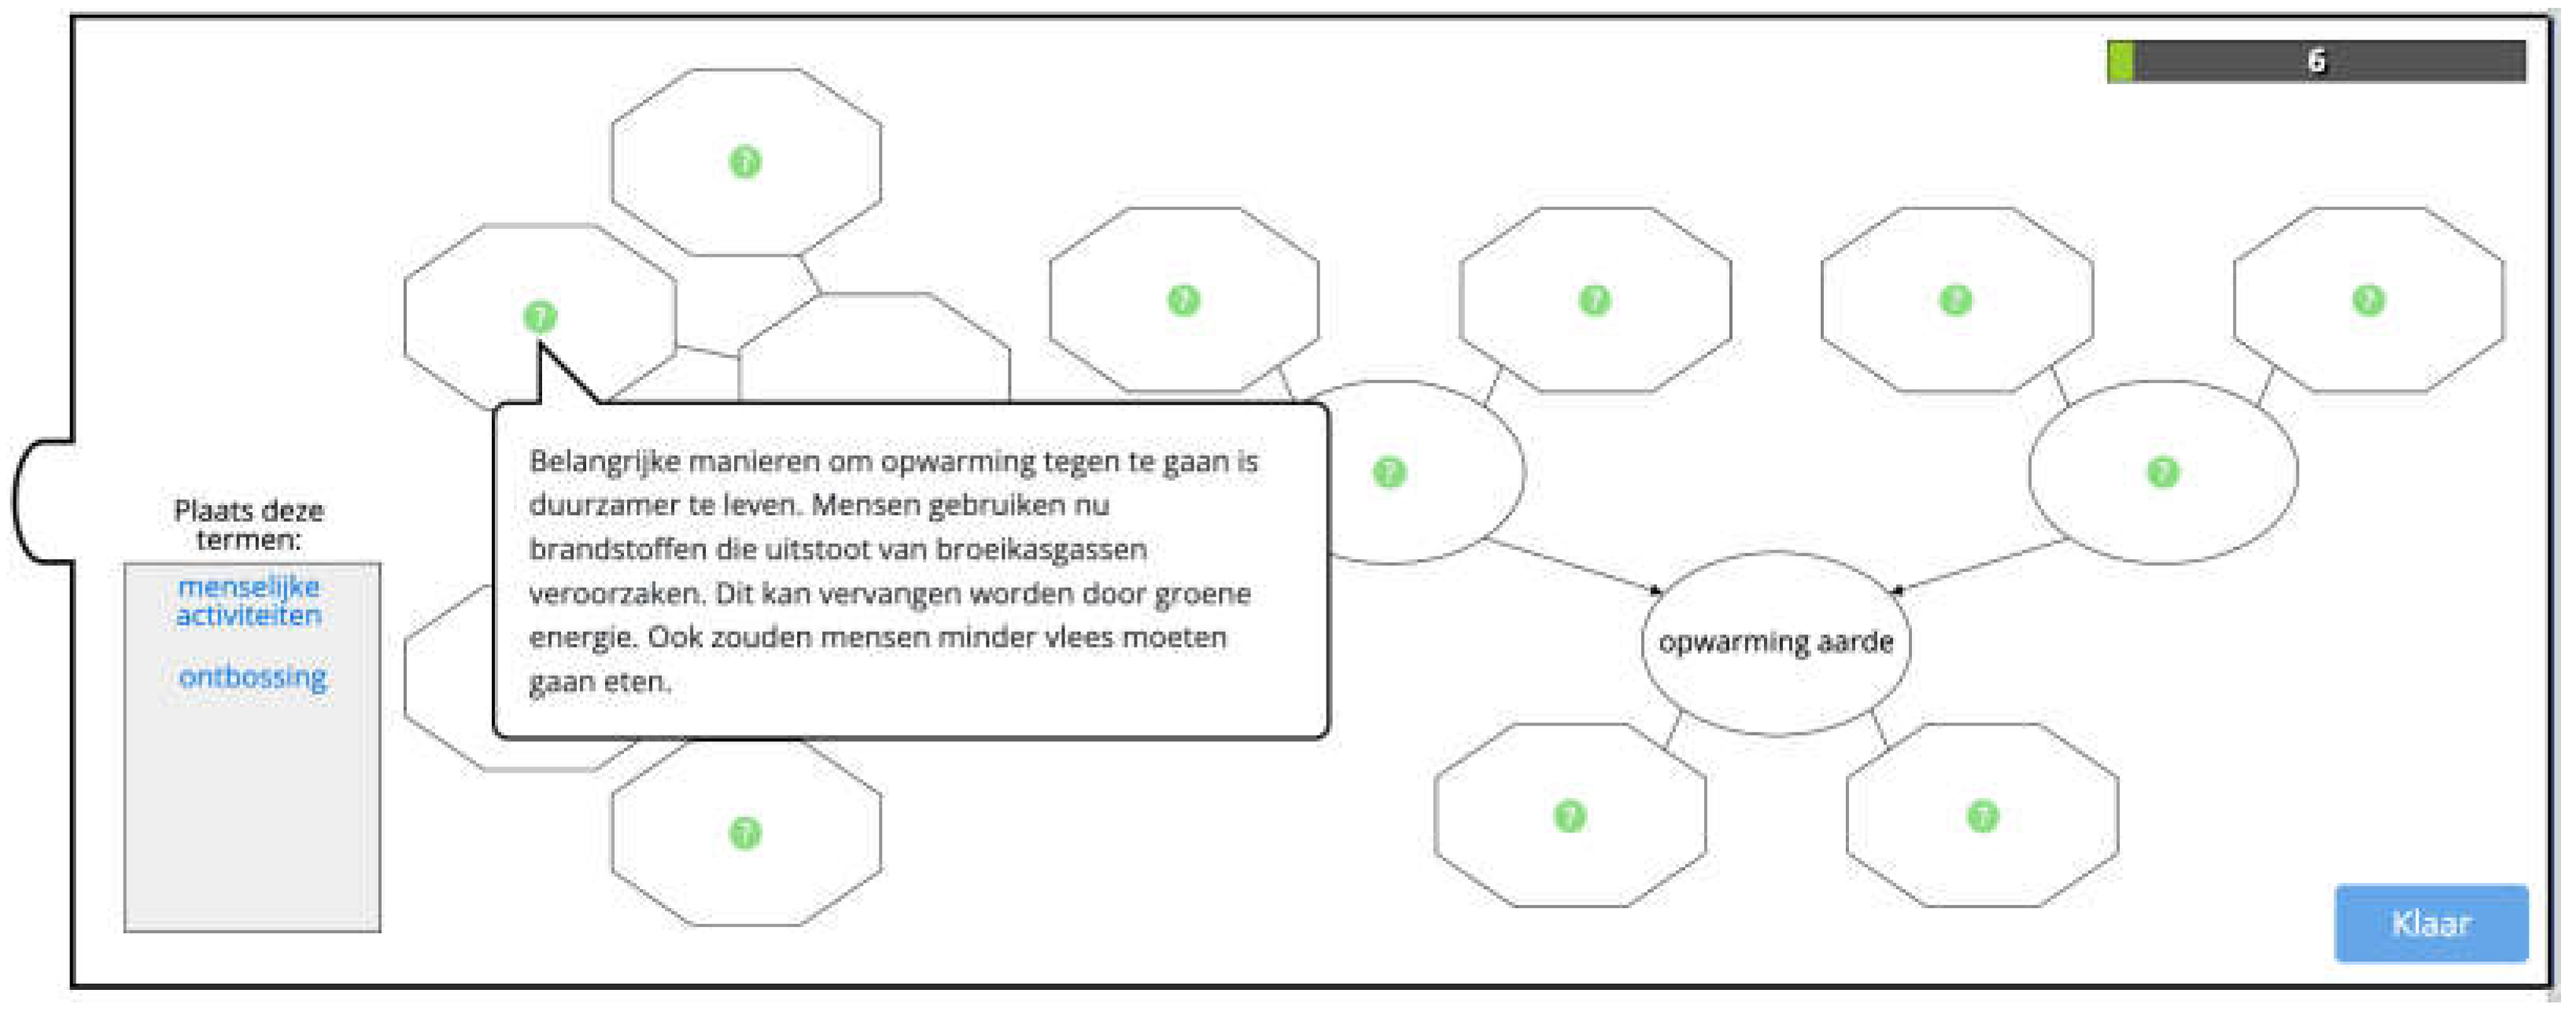
4. Addressing Controversial Topics with Interactive Concept Cartoons

Nowadays, scientific knowledge is increasingly called into question as a reliable source of information, a fact which became particularly evident during the COVID-19 pandemic. Specifically, the discussion surrounding vaccinations revealed a deep mistrust of scientific information, which likely originates from a lack of knowledge and skills to distinguish reliable evidence from untrustworthy sources [47]. Science teachers should therefore focus on discussing socio-scientific issues (e.g., climate change, vaccination), including aspects such as the underlying scientific knowledge, how this knowledge is generated (also referred to as the Nature of Science, NOS), and stimulate the development of argumentation skills [48].
However, although classroom discussions are an effective teaching strategy for developing knowledge and argumentation skills [49], teachers are, in general, reluctant to discuss socio-scientific issues in the classroom [50]. Furthermore, teachers report that they have difficulty teaching NOS aspects of science because they struggle with appropriate teaching strategies [51].
Previous research has shown that concept cartoons can be used to encourage learners to discuss alternative explanations of a given scientific phenomenon and, as a result, develop argumentation skills [52]. The present study explores the design and implementation of an educational instrument that uses concept cartoons to promote discussion about socio-scientific issues while making use of ICT features to support teachers as well as scaffold learners in developing argumentation skills, content knowledge, and an understanding of NOS [53].

4.1. The Educational Instrument

The educational instrument or Interactive Concept Cartoons (ICC) consists of a software application, an accompanying paper-and-pencil worksheet to guide learners through the lesson, and a teacher’s guide (https://conceptcartoons.nl/ (accessed on 19 February 2023)). The software application contains a succession of four or five interactive concept cartoons intended to promote discussion among learners (working in groups of three to five learners). In each cartoon, a statement on a particular socio-scientific issue is shown, surrounded by three different arguments representing one that is correct and two common misconceptions or misinformation (Figure 7). Learners are provided with scientifically correct information to help them evaluate the statement and arguments in the cartoons. In this information, NOS aspects are addressed as well. The information is made available to learners with clickable pop-ups (Figure 8).
The concept cartoons are alternated with an interactive diagram with a set of concepts associated with the statement in the preceding cartoon. Learners are instructed to place the concepts in the diagram, facilitating deeper learning of the content knowledge on the issue at hand. The diagram represents a cohesive process underlying the issue. For each concept, learners can access a small amount of underlying information relating to the specific concept to support them in placing the concepts in the correct field in the diagram (Figure 9).

4.2. Interactive Features

The lesson begins when a concept cartoon appears. Learners are prompted by the worksheet to discuss the statement and arguments shown (Figure 7) and to open and read the pop-up information. Each learner is instructed to drag their name to the argument of choice. Ultimately, the learners must agree on the same argument in order to be able to proceed. Next, the diagram appears with a small set of concepts corresponding to the preceding cartoon (Figure 9). Learners are instructed to drag each concept to one of the empty fields. Hints are available by clicking on the question mark in each respective field. When all learners agree, a new concept cartoon is shown. Depending on which argument in the previous cartoon was chosen, the new statement is either a repetition (formulated differently) or a new statement on a different aspect of the issue. After finishing the second cartoon, learners return to the diagram. Concepts that were placed in the wrong field are now coloured red, indicating that learners should correct their mistakes. This knowledge of correct response (KCR) feedback facilitates learning [54]. After four (or five, depending on the issue) rounds of alternating discussing a concept cartoon and filling in the diagram, the program ends the session, and learners return to the worksheet for a final assignment containing a few questions about the issue.
Finally, the diagram and concept cartoons provide log data files containing information on all clicks by learners. In this way, teachers are able to assess whether learners need more instruction or feedback on the issue.

4.3. Results

Over a period of three years, the ICC was implemented in a variety of primary and secondary classrooms in the urban parts of the Netherlands. Issues addressed were vaccination, COVID-19, and global warming. Learner questionnaires, the log data files, recorded and transcribed discussions of learner groups, classroom observations, expert feedback, and a teacher questionnaire were used to assess the usability and potential effectiveness of the ICC. After each pilot session, the ICC was adjusted. Minor adjustments included correcting textual errors and removing or adding concepts in the diagram.
In general, the data showed that learners were triggered by the statements to discuss the arguments and were actively involved in completing the diagram. Teachers found the ICC easy to implement and were positive about the features but perceived the lesson as somewhat chaotic due to the noise generated by chattering learner groups.
However, the results also indicated some major problems. For instance, in the early version of the ICC, learners were provided with the content information on paper. Data showed that learners were caught up in the program on the screen and were not inclined to read the information. Therefore, for the follow-up pilot, the information was built into the application as pop-ups. However, the log data files from a pilot with 75 groups of learners revealed that only 68% of the learner groups had (at least once) clicked on the information buttons.
Another major adjustment involved learners’ choice of argument in the concept cartoons. In the earliest version, learners dragged their names to the argument of choice, while the selection and order of the statements depended on the majority of votes made by the learners. Although learners were triggered to partake in discussion about the statements, it was hypothesized that learners would feel more need to substantiate their choice when having to reach a consensus [55], stimulating the development of argumentation skills. Therefore, the application was adjusted accordingly so that learners were not able to move on to the next activity unless a consensus was reached. Preliminary results show that learners did not spend substantially more time discussing the statements.
Finally, the integrated NOS aspects were removed, and an additional version dedicated to NOS was developed.

4.4. Discussion

The results show that the ICC can be easily implemented in the classroom and triggers learners to explore socio-scientific issues. The interactive features scaffold learners in discussing the concept cartoons and filling in the diagram. However, learners, in general, need more encouragement to fully use the features, which may benefit learning results [56].
A limitation of the study is that the majority of classroom tests were on vaccination and global warming, so results may differ for COVID-19 and NOS. In addition, only qualitative measurement instruments were used, leaving actual learning gains of the ICC uncertain. Future research includes an evaluation study to assess the learning effects of the ICC on the development of content knowledge, argumentation skills, and a deeper understanding of NOS aspects.

5. General Discussion and Conclusions

Computers are powerful tools for facilitating and supporting learning. Providing learners with interactive knowledge representations can help them to deepen their understanding of complex phenomena and simultaneously aid their digital literacy and their (higher-order) thinking skills. Evaluation studies show that learners are capable of working with such educational instruments and that the instruments enable a semi-automated approach to constructive learning.
In this contribution, we present three pedagogical approaches for learning subject-specific knowledge and general skills using interactive knowledge representations. Key to the developed educational instruments is that the learners are actively engaged in constructing their knowledge and developing their skills by creating a representation of a subject-specific system using a qualitative vocabulary. Learners build the representation step-by-step. Each step focuses on a specific part of the behaviour of a subject-specific system and a set of associated skills.
With the DynaLearn approach, learners in secondary education construct and simulate qualitative models and, by doing so, learn subject-specific knowledge as well as general systems thinking skills. The Minds-On approach uses interactive diagrams to support learners in primary education in deepening their understanding of physical phenomena while conducting practical science experiments. The Interactive Concept Cartoons engage learners in upper primary and lower secondary education in a science-based discussion concerning controversial topics.
The educational instruments are developed iteratively in close collaboration with teachers and their respective schools and are evaluated in real classrooms. Overall, the results appear promising, both in terms of learning outcomes and supporting teachers. However, these approaches are still under development and evaluation studies with large cohorts still need to be performed.
Future research will focus on multiple areas. First, how can the development of new lessons be streamlined to efficiently increase the portfolio? In the approaches described here, a number of experts (including teachers and researchers) are required to select and organize the content knowledge on the basis of which the automated interaction with learners can run. Second, how can we introduce Learning Analytics? The instruments described in this contribution capture a plethora of data regarding learning behaviour. Currently, these data are used during the development process to improve these instruments. However, these data could also be highly useful for teachers, enabling them to monitor and address learners’ (individual) needs. Questions such as which data are the most useful and how these data can be automatically processed require further investigation.

Author Contributions

Conceptualization (full paper), B.B.; methodology (DynaLearn), M.K. and B.B.; methodology (Minds-On), J.H., T.v.E., M.P., A.B. and B.B.; methodology (ICC), P.K. and B.B.; investigation—evaluation studies (DynaLearn), M.K., E.J., M.d.B. and B.B.; investigation—evaluation studies (Minds-On), J.H., T.v.E., M.P., A.B. and B.B.; investigation—evaluation studies (ICC), P.K.; formal analysis (DynaLearn), M.K., M.S. and B.B.; formal analysis (Minds-On), J.H., T.v.E., M.P., M.S., A.B. and B.B.; formal analysis (ICC), P.K.; writing—original draft (full paper), B.B.; writing—original draft (DynaLearn), M.K. and B.B.; writing—original draft (Minds-On), J.H. and B.B.; writing—original draft (ICC), P.K. and B.B.; writing—review and editing, B.B., J.H. and M.P.; project administration, M.S. and B.B.; funding acquisition (DynaLearn), M.K. and B.B.; funding acquisition (Minds-On), T.v.E., M.P., P.K., A.B. and B.B.; funding acquisition (ICC), P.K. and B.B. All authors have read and agreed to the published version of the manuscript.

Funding

The research on Denker was funded by Regieorgaan SIA grant number RAAK.PRO03.098. The research on Minds-On was funded by Regieorgaan SIA grant number RAAK.PUB06.033. The research on ICC was funded by Regieorgaan SIA grant number HBOPD.2018.05.006.

Institutional Review Board Statement

Not applicable.

Informed Consent Statement

Not applicable.

Data Availability Statement

Not applicable.

Acknowledgments

We would like to express our gratitude to the teachers who helped develop the teaching activities described in this paper. We also would like to thank Jelmer Jellema and Spin from het Web (https://spininhetweb.nl (accessed on 19 February 2023)) for their thoughtful and pleasant cooperation.

Conflicts of Interest

The authors declare no conflict of interest.

References

  1. Harmelen, F.V.; Lifschitz, V.; Porter, B. (Eds.) Handbook of Knowledge Representation; Elsevier: Amsterdam, The Netherlands, 2008; p. 1035. [Google Scholar]
  2. Davis, R.; Shrobe, H.; Szolovits, R. What is a knowledge representation? AI Mag. 1993, 14, 17–33. [Google Scholar]
  3. Newell, A.; Simon, H.A. Computer science as empirical inquiry: Symbols and search. In ACM Turing Award Lectures; Elsevier: Amsterdam, The Netherlands, 1976; Volume 19, pp. 113–126. [Google Scholar]
  4. Buitrago, M.; Chiappe, A. Representation of knowledge in digital educational environments: A systematic review of literature. Australas. J. Educ. Techno. 2019, 35, 46–62. [Google Scholar] [CrossRef]
  5. Disessa, A.A. Metarepresentation: Native competence and targets for instruction. Cogn. Instr. 2004, 22, 293–331. [Google Scholar] [CrossRef]
  6. Gilbert, J.K.; Reiner, M.; Nakhleh, M. (Eds.) Visualization: Theory and Practice in Science Education; Springer: Cham, Switzerland, 2008; Volume 3, p. 325. [Google Scholar]
  7. van Buuren, O.; Heck, A.; Ellermeijer, T. Understanding of relation structures of graphical models by lower secondary students. Res. Sci. Educ. 2016, 46, 633–666. [Google Scholar] [CrossRef]
  8. Cook, M.P. Visual representations in science education: The influence of prior knowledge and cognitive load theory on instructional design principles. Sci. Educ. 2006, 90, 1073–1091. [Google Scholar] [CrossRef]
  9. Cox, R. Representation construction, externalised cognition and individual differences. Learn. Instr. 1999, 9, 343–363. [Google Scholar] [CrossRef]
  10. Prain, V.; Tytler, R. Learning through Constructing Representations in Science: A framework of representational construction affordances. Int. J. Sci. Educ. 2012, 34, 2751–2773. [Google Scholar] [CrossRef]
  11. Larkin, J.H.; Simon, H.A. Why a diagram is (sometimes) worth ten thousand words. Cogn. Sci. 1987, 11, 65–100. [Google Scholar] [CrossRef]
  12. Clark, J.M.; Paivio, A. Dual coding theory and education. Educ. Psychol. Rev. 1991, 3, 149–170. [Google Scholar] [CrossRef]
  13. Lin, P.C.; Hou, H.T.; Chang, K.E. The development of a collaborative problem solving environment that integrates a scaffolding mind tool and simulation-based learning: An analysis of learners’ performance and their cognitive process in discussion. Interact. Learn. Environ. 2022, 30, 1273–1290. [Google Scholar] [CrossRef]
  14. Tippett, C.D. What recent research on diagrams suggests about learning with rather than learning from visual representations in science. Int. J. Sci. Educ. 2016, 38, 725–746. [Google Scholar] [CrossRef]
  15. Ainsworth, S. DeFT: A conceptual framework for considering learning with multiple representations. Learn. Instr. 2006, 16, 183–198. [Google Scholar] [CrossRef]
  16. Cox, R.; Brna, P. Twenty Years on: Reflections on Supporting the Use of External Representations in Problem Solving. Int. J. Artif. Intell. Educ. 2016, 26, 193–204. [Google Scholar] [CrossRef]
  17. Jonassen, D.H.; Carr, C.S. Mindtools: Affording multiple knowledge representations for learning. In Computers as Cognitive Tools, No More Walls; Routledge: London, UK, 2020; Volume II, pp. 165–196. [Google Scholar]
  18. Mayer, R.E. The promise of multimedia learning: Using the same instructional design methods across different media. Learn. Instr. 2003, 13, 125–139. [Google Scholar] [CrossRef]
  19. Sharma, L.; Garg, P.K. (Eds.) Knowledge representation in artificial intelligence: An overview. In Artificial Intelligence—Technologies, Applications, and Challenges; Chapman and Hall: London, UK, 2021; pp. 19–28. [Google Scholar]
  20. Forbus, K.D. Qualitative representations. In How People Reason and Learn about the Continuous World; MIT Press: Cambridge, UK, 2018; p. 440. [Google Scholar]
  21. Bredeweg, B.; Forbus, K.D. Qualitative Modeling in Education. AI Mag. 2003, 24, 35–46. [Google Scholar]
  22. Cronin, M.A.; Gonzalez, C.; Sterman, J.D. Why don’t well-educated adults understand accumulation? A challenge to researchers, educators, and citizens. Organ. Behav. Hum. Decis. Process. 2009, 108, 116–130. [Google Scholar] [CrossRef]
  23. Jensen, E.; Brehmer, B. Understanding and control of a simple dynamic system. Syst. Dyn. Rev. 2003, 19, 119–137. [Google Scholar] [CrossRef]
  24. Hajian, S. Transfer of Learning and Teaching: A Review of Transfer Theories and Effective Instructional Practices. IAFOR J. Educ. 2019, 7, 93–111. [Google Scholar] [CrossRef]
  25. Okada, A.L.P.; Buckingham Shum, S.J.; Sherborne, T. (Eds.) Knowledge Cartography: Software Tools and Mapping Techniques; Springer: London, UK, 2014; p. 540. [Google Scholar]
  26. Bouwer, A.; Bredeweg, B. Graphical means for inspecting qualitative models of system behaviour. Instr. Sci. 2010, 38, 173–208. [Google Scholar] [CrossRef]
  27. Bredeweg, B.; Linnebank, F.; Bouwer, A.; Liem, J. Garp3—Workbench for qualitative modelling and simulation. Ecol. Inform. 2009, 4, 263–281. [Google Scholar] [CrossRef]
  28. Bredeweg, B.; Liem, J.; Beek, W.; Salles, P.; Linnebank, F. Learning spaces as representational scaffolds for learning conceptual knowledge of system behaviour. In European Conference on Technology Enhanced Learning; Wolpers, M., Kirschner, P.A., Scheffel, M., Lindstaedt, S., Dimitrova, V., Eds.; Springer: Cham, Switzerland, 2010; LNCS Volume 6383, pp. 46–61. [Google Scholar]
  29. Novak, J.D.; Gowin, D.B. Learning how to Learn; Cambridge University Press: New York, NY, USA, 1984; p. 216. [Google Scholar]
  30. Bredeweg, B.; Kragten, M.; Spitz, L. Qualitative Representations for Systems Thinking in Secondary Education. In Proceedings of the 34th International Workshop on Qualitative Reasoning, Montreal, Canada, 19 August 2021. [Google Scholar]
  31. Kragten, M.; Loek Spitz, L.; Bredeweg, B. Learning Domain Knowledge and Systems Thinking using Qualitative Representations in Secondary Education (grade 9–10). In Proceedings of the 34th International workshop on Qualitative Reasoning, Montreal, QC, Canada, 19 August 2021. [Google Scholar]
  32. Spitz, L.; Kragten, M.; Bredeweg, B. Exploring the working and effectiveness of norm-model feedback in conceptual modelling—A pre-liminary report. In Artificial Intelligence in Education; Roll, I., McNamara, D., Sosnovsky, S., Luckin, R., Dimitrova., V., Eds.; Springer: Cham, Switzerland, 2021; LNAI Volume 12749, pp. 325–330. [Google Scholar]
  33. Sins, P.; Savelsbergh, E.; van Joolingen, W. The Difficult Process of Scientific Modelling: An analysis of novices’ reasoning during computer-based modelling. Int. J. Sci. Educ. 2005, 27, 1695–1721. [Google Scholar] [CrossRef]
  34. Bredeweg, B.; Kragten, M. Requirements and challenges for hybrid intelligence: A case-study in education. Front. Artif. Intell. 2022, 5, 891630. [Google Scholar] [CrossRef] [PubMed]
  35. Holstein, K.; McLaren, B.M.; Aleven, V. Designing for complementarity: Teacher and student needs for orchestration support in AI-enhanced classrooms. In Artificial Intelligence in Education; Isotani, S., Millán, E., Ogan, A., Hastings, P., McLaren, B., Luckin, R., Eds.; Springer: Cham, Switzerland, 2019; LNCS Volume 11625, pp. 157–171. [Google Scholar]
  36. Meelissen, M.; Punter, A. Twintig jaar TIMSS. In Ontwikkelingen in Leerling Prestaties in de Exacte Vakken in het Basisonderwijs 1995–2015; Universiteit Twente: Enschede, The Netherlands, 2016; p. 109. [Google Scholar]
  37. van Aalderen-Smeets, S.I.; Walma van der Molen, J.H.; Asma, L.J.F. Primary teachers’ attitudes toward science: A new theoretical framework. Sci. Educ. 2012, 96, 158–182. [Google Scholar] [CrossRef]
  38. van Slim, T.; van Schaik, J.E.; Dobber, M.; Hotze, A.C.G.; Raijmakers, M.E.J. Struggling or succeeding in science and technology education: Elementary school students’ individual differences during inquiry and design-based learning. Front. Educ. 2022, 7, 842537. [Google Scholar] [CrossRef]
  39. Osborne, J. Teaching scientific practices: Meeting the challenge of change. J. Sci. Teach. Educ. 2014, 25, 177–196. [Google Scholar] [CrossRef]
  40. Roth, K.J. Elementary science teaching. In Handbook of Research on Science Education; Lederman, N.G., Abell, S.K., Eds.; Routledge: London, UK, 2014; Volume II, pp. 361–393. [Google Scholar]
  41. Spaan, W.; Oostdam, R.; Schuitema, J.; Pijls, M. Analysing teacher behaviour in synthesizing hands-on and minds-on during practical work. Res. Sci. Technol. Educ. 2022, 1–18. [Google Scholar] [CrossRef]
  42. Forsthuber, B.; Motiejunaite, A.; de Almeida Coutinho, A.S. Science Education in Europe: National Policies, Practices and Research. In Education, Audiovisual and Culture Executive Agency: European Commission; EU Bookshop: New South Wales, Sydney, 2011; p. 166. [Google Scholar] [CrossRef]
  43. Bredeweg, B. Kunstmatige Intelligentie in Het Onderwijs: Leren Met Interactieve Kennisrepresentaties. Hogeschool van Amsterdam: Amsterdam. 2019. Available online: https://research.hva.nl/en/publications/kunstmatige-intelligentie-in-het-onderwijs-leren-met-interactieve (accessed on 19 February 2023).
  44. Cañas, A.J.; Reiska, P.; Mollits, A. Developing higher-order thinking skills with concept mapping: A case of pedagogic frailty. Knowl. Manag. E-Learn. 2017, 9, 348–365. [Google Scholar]
  45. Louman, E.; van Eijck, T. Leren redeneren. Didactief. 2022. Available online: https://didactiefonline.nl/artikel/leren-redeneren (accessed on 19 February 2023).
  46. National Research Council. A Framework for K-12 Science Education: Practices, Crosscutting Concepts, and Core Ideas. In Committee Conceptual Framework New K-12 Science Education Standards; The National Academies Press: Washington, DC, USA, 2012; p. 401. [Google Scholar]
  47. Cross, R. Will public trust in science survive the pandemic? Chem. Eng. News 2021, 99, 3. Available online: https://cen.acs.org/policy/global-health/Will-public-trust-in-science-survive-the-pandemic/99/i3 (accessed on 19 February 2023).
  48. Lederman, N.G.; Lederman, J.S. Research on teaching and learning of nature of science. In Handbook of Research on Science Education; Lederman, N.G., Abell, S.K., Eds.; Routledge: London, UK, 2014; Volume II, pp. 614–634. [Google Scholar]
  49. Schuitema, J.; Veugelers, W.; Rijlaarsdam, G.; Ten Dam, G. Two instructional designs for dialogic citizenship education: An effect study. Br. J. Educ. Psychol. 2009, 79, 439–461. [Google Scholar] [CrossRef]
  50. Radstake, H.; Leeman, Y. Guiding discussions in the class about ethnic diversity. Intercult. Educ. 2010, 21, 429–442. [Google Scholar] [CrossRef]
  51. Abd-El-Khalick, F. Teaching with and about nature of science, and science teacher knowledge domains. Sci. Educ. 2013, 22, 2087–2107. [Google Scholar] [CrossRef]
  52. Naylor, S.; Keogh, B.; Downing, B. Argumentation and primary science. Res. Sci. Educ. 2007, 37, 17–39. [Google Scholar] [CrossRef]
  53. Kruit, P.; Bredeweg, B. Interactive concept cartoons: Exploring an instrument for developing scientific literacy. In European Conference on Technology Enhanced Learning; Alario-Hoyos, C., Rodríguez-Triana, M.J., Scheffel, M., Arnedillo-Sánchez, I., Dennerlein, S.M., Eds.; Springer: Cham, Switzerland, 2020; LNCS Volume 12315, pp. 404–409. [Google Scholar]
  54. Law, V.; Chen, C.H. Promoting science learning in game-based learning with question prompts and feedback. Comp. Educ. 2016, 103, 134–143. [Google Scholar] [CrossRef]
  55. Mercier, H.; Dan Sperber, D. Why do humans reason? Arguments for an argumentative theory. Behav. Brain Sci. 2011, 34, 57–111. [Google Scholar] [CrossRef]
  56. Biswas, G.; Segedy, J.R.; Bunchongchit, K. From design to implementation to practice a learning by teaching system: Betty’s Brain. Int. J. Artif. Intell. Educ. 2016, 26, 350–364. [Google Scholar] [CrossRef]
Figure 1. (Left) shows a general level 2 representation consisting of one entity (E) with four quantities (Q1–Q4) and three causal dependencies. (Right) shows three possible states: Q4 increases (state 1, shown), remains steady (state 2, not shown), or decreases (state 3, not shown). This is due to ambiguity because Q1 and Q2 increase and have competing impacts on Q3.
Applsci 13 05256 g001
Figure 2. Mass-spring—complete representation. The entity Mass-spring system has four quantities: Force (Fspring), Acceleration (a), Velocity (v) and Extension (x). The dependencies now discriminate between initial cause (influence, I+) and propagation of change (proportional, P+ and P−). Force and Acceleration fully correspond; the value (magnitude) of Acceleration determines the change in Velocity, and likewise, the value of Velocity determines the change in Extension. Extension causes negative feedback on Force; they inversely correspond. The simulation shows a cycle consisting of eight states. The value-history shows the value and direction of change for each quantity in each state (e.g., Acceleration is zero and decreases in state 3).
Applsci 13 05256 g002
Figure 3. Automated support examples. (Left) Cueing and Help. While creating the representation quantity, ‘Q2’ is apparently wrongly named. Cueing highlights the erroneous ingredient (here: Q2). Help suggests an error (here: Quantity: Q2: wrong name? (translated from Dutch)). (Right) Progress bar (partly shown). The status is shown for each ingredient type at the bottom of the canvas. For instance, ‘Quantities 2/3/1’ tells the learner that two quantities have been created, three need to be created in total, and that one is currently incorrect (shown in red). When all ingredients have been created correctly, the numbers become green, as for entities here.
Applsci 13 05256 g003
Figure 4. Screenshot of the Minds-On application. An example worksheet including instructions for the third practical activity for the lesson Seasons (upper and middle left), an illustration to support the practical activity (upper right), key definitions (middle right), and questions about the activity (bottom). Words in red highlight the key steps in the instructions. The controls are shown in Dutch: ‘Ga door’ means ‘Continue’ and ‘Nog niet alles op dit blad is ingevuld’ means ‘Not all questions are complete’.
Applsci 13 05256 g004
Figure 5. Screenshot of the Minds-On application. The first step is the interactive diagram for the lesson Seasons. Learners drag the concepts relating to the practical activity (top left) into the placeholders in the diagram. The question mark symbols can be used to ask for support during the activity and to check the result after all of the concepts have been placed. The controls are shown in Dutch: ‘Uitloggen’ means ‘To log out’ and ‘Stap’ means ‘Step’.
Applsci 13 05256 g005
Figure 6. Interactive diagram for the lesson Seasons. Circles represent concepts, rounded rectangles represent properties, heptagons represent movements, and diamonds represent values. Variable values are clustered within a dashed line. Arrows depict relationships between sub-concepts. Grey lines are basic relationships (e.g., is, has), and bold arrows denote cause-and-effect relationships.
Applsci 13 05256 g006
Figure 7. Interactive concept cartoon. Learners drag their own names to the argument of choice. Before being able to move on to the next activity, learners must reach a consensus on which argument to choose. Clicking on the red question marks provides a pop-up with information, as shown in Figure 8.
Applsci 13 05256 g007
Figure 8. Pop-up information relating to the statements and arguments in the cartoon.
Applsci 13 05256 g008
Figure 9. Interactive diagram. Learners place the concepts (blue) in the respective fields in the diagram. By clicking on the green question marks, pop-ups appear with information about the concept.
Applsci 13 05256 g009
Table 1. Ingredients in the DynaLearn vocabulary used for creating representations.
Ingredient TypeDescription
EntityPhysical objects and/or abstract concepts that together constitute the system.
ConfigurationStructural relationships between entities.
QuantityChangeable and measurable features of entities.
Quantity spaceSet of values that a particular quantity can take on.
ValueSpecific value that a quantity has in a particular state.
Direction of change (∂)In each state, a quantity is either decreasing, steady, or increasing.
Causal dependencyQuantity relationships that define how the causing quantity affects the influenced quantity.
CorrespondenceCo-occurring values and co-occurring directions of change between quantities.
(In)equalityOrdering information between quantities, values, and directions of change (<, ≤, =, ≥, >).
CalculusConstraints between quantities, values, and directions of change (A + B = C or A − B = C).
Conditional statementIF A THEN B, where A and B can refer to any of the above-mentioned ingredients.
Table 2. Ingredients in the DynaLearn vocabulary used for running simulations.
Ingredient TypeDescription
StatePeriod during which a system does not change the dynamics of its behaviour.
TransitionChange in system behaviour resulting in moving from the current state to a successive state.
State-graphTotal set of states and transitions that describe the possible behaviours of the system.
PathSet of successive states and the accompanying transitions.
Value-historyOverview of value assignments present in selected states.
(In)equality-historyOverview of (in)equality statements present in selected states.
Table 3. Topic categories for which lessons have been developed in project Denker.
LevelBiologyEconomicsGeographyPhysics
2Circulatory system, greenhouse effect,
mutations, food chains
Market mechanism, industrial revolutionPovertyCalorimetry, force and
motion, sound, star
properties, electrical circuit
3Blood sugar, biodiversity, photosynthesisPensionsCentre-periphery model, Neolithic ageGas law, energy
transformation, star states
4Enzymes, hormone
regulation, population dynamics, homeostasis
Business cycleClimate changeForce and motion, mass spring system, star formation,
circular and elliptical orbits
Disclaimer/Publisher’s Note: The statements, opinions and data contained in all publications are solely those of the individual author(s) and contributor(s) and not of MDPI and/or the editor(s). MDPI and/or the editor(s) disclaim responsibility for any injury to people or property resulting from any ideas, methods, instructions or products referred to in the content.

