Abstract
Maintaining stable and reliable working conditions is a matter of vital importance for various companies, especially those involving heavy machinery. Due to human exhaustion, as well as unpredicted hazards and dangerous situations, the personnel has to take actions and wisely plan each move. This paper presents a human–computer interaction (HCI)-based system that uses a concentration level measurement function to increase the safety of machine and equipment operators. The system has been developed in response to the results of user experience (UX) analyses of the state of occupational safety, which indicate that the most common cause of accidents is the so-called insufficient concentration while performing work. The paper presents the reasons for addressing this issue and a description of the proposed electroencephalography (EEG)-based solution in the form of a concentration measurement system concept. We discuss in-field measurements of such a prototype solution, together with an analysis of obtained results. The method of implementing a wireless communication interface is also provided, along with a visualization application.
1. Introduction
In human–computer interaction (HCI), electroencephalogram (EEG) signals can be added as an additional input to machines. An integration of real-time EEG-based human emotion recognition algorithms in human–computer interfaces can affect the user’s experience (UX), making it, i.e., more complete or engaging, less or more stressful, depending on the target of the applications. Currently, the most accurate EEG-based emotion recognition algorithms are very subject-dependent. Therefore, a training session is required each time before running the application [1].
The Polish Higher Mining Inspectorate’s analysis of the state of safety, presented in the report from 2015, entitled “Assessment of the state of occupational safety, mine rescue and general safety in connection with mining and geological activities”, shows that one of the most frequent causes of accidents is the so-called insufficient concentration during work [2].
An analysis by specialists from the Cracow University of Technology and the AGH University of Science and Technology on the operator–machine system states that “On the basis of the research carried out, it can be concluded that the parameters related to the psychophysical condition of the operator (experience, fatigue, state of health and motivation of the operator) have the greatest influence on the performance of the operator-machine earthmoving system (...)” [3]. The need to review the operator’s level of concentration also exists in other industries.
In order to improve the level of safety in the operation of machinery and equipment [4,5], a method has been developed to minimize the impact of errors made by machine and equipment operators as a result of insufficient concentration on the work being performed. Any way of eliminating human error can significantly improve the safety of industrial operations. The results of this work can lead to an actual increase in the safety of work of operators of heavy machinery and equipment.
After analyzing domestic and foreign solutions, it was decided to implement a system based on the measurement of the electroencephalographic signal [6,7]. During the conceptual work, a hardware model of the system was built and tests were carried out on a selected group of car drivers and people performing simple manual activities. The selected group of people participating in the study was intended to best represent the profile of an operator of mining machinery and equipment. Conducting similar tests in real conditions would require specific permits and appropriate certification of devices. This paper presents the results of the model, field tests and their analyses. In the future, the system may become a component of the integrated visualization, diagnostic and control system, realized as part of the work carried out at KOMAG Institute of Mining Technology (ITG KOMAG) [8,9,10,11].
This paper is organized as follows: Section 1 provides an introduction to the investigated topic. Section 2 presents a review of related works and the advancements and possibilities of utilizing HCI- and EEG-based solutions in various occupational safety scenarios. Section 3 refers to the materials and methods section, including the concept of a dedicated concentration measurement system, as well as utilized hardware and software layer during our studies. Section 4 presents results of a measurement campaign, involving different levels of stress and required skills. Section 5 includes a discussion, presenting the concept of a dedicated system for the mining industry or any occupation linked with heavy machinery and hazardous working conditions. Section 6 concludes this manuscript and provides an insight into future study directions.
2. Related Works
As we know, everyone experiences stress in life. It should be noted that moderate stress can be beneficial to humans, whereas excessive stress proves to be harmful to their health. In order to monitor stress, different methods can be utilized. In this work [12], an algorithm for stress level recognition from EEG is proposed. The experiment was carried out on nine subjects, in which a Stroop color-word test was used as a stressor to induce four levels of stress. Authors have proposed and analyzed a number of different feature combinations and classifiers. By combining fractal dimension and statistical features, with the aid of Support Vector Machine (SVM) as the classifier, 4 levels of stress could be recognized with an average accuracy of approx. 67%, whereas 3 levels of stress could be detected with an accuracy of approx. 75%, and 2 levels of stress could be recognized with an accuracy of approx. 85%. The levels of stress were visualized in real-time. As pointed out, such a system could be applied for stress monitoring of, i.e., air traffic controllers, operators, etc.
A similar study [13] assessed working memory load during computer use with neural network pattern recognition applied to EEG spectral features. It involved a group of eight participants performing high-, moderate-, and low-load working memory tasks. Frontal theta EEG activity increased and alpha activity decreased with increasing load. As observed, such changes probably reflected task difficulty-related increase in mental effort and the proportion of cortical resources allocated to task performance. Test data segments from high and low load levels were discriminated with approx. 95% accuracy, whereas more than 80% of test data segments associated with a moderate load could be discriminated from high- or low-load data segments. As pointed out, results support the possibility of using EEG-based methods for monitoring cognitive load during human-computer interaction.
According to [14], in case of tasks requiring sustained attention, human alertness varies on a minute time scale. This can imply serious consequences in crucial occupations, ranging from, i.e., air traffic control to monitoring of nuclear power plants. Changes in the electroencephalographic power spectrum accompany these fluctuations in the level of alertness, as assessed by measuring simultaneous changes in EEG and performance on an auditory monitoring task. By combining power spectrum estimation, principal component analysis and artificial neural networks (ANN), the authors show that continuous, accurate, noninvasive, and near real-time estimation of an operator’s global level of alertness is indeed feasible. In this experiment, data were recorded from two central scalp sites. This could enable a practical system for noninvasive monitoring of the cognitive state of human operators in attention-critical settings.
In [15], EEG recordings were obtained from a group of 16 individuals interacting with a personal-computer-based flight simulation. Their tasks have been labeled as low, moderate, and high difficulty. With higher task difficulty, frontal theta activity increased, whereas alpha activity decreased. Index values were computed for every 4 s of task data. Across participants, mean task load index values increased systematically with growing task difficulty and differed significantly between various task versions. Results of this study may be utilized in case of multivariate EEG-based methods to monitor task loading during naturalistic computer-based work.
Another paper [16] describes a brain–computer interface (BCI) system, which uses a set of adaptive linear preprocessing and classification algorithms for single-trial detection of error-related negativity (ERN). We use the detected ERN as an estimate of a subject’s perceived error during an alternative forced choice visual discrimination task. The detected ERN was used to correct subject errors. Results have shown average improvement in subject performance by 21% when errors were automatically corrected via the BCI.
3. Materials and Methods
3.1. Concept of a Concentration Measurement System
The concept of the system, in which the operator’s electromagnetic brain signal is read and analyzed by a measurement module, is shown in Figure 1. After processing the data, a decision is made to forward the signal to the machine’s control panel in order to generate a possible warning signal if the operator’s minimum concentration threshold is exceeded [6].
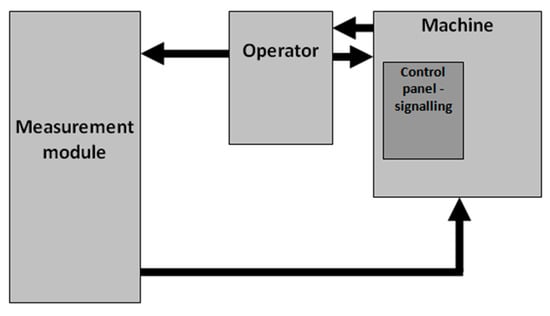
Figure 1.
Block diagram of the operator concentration measurement system model.
It was decided to use EEG signal because the electroencephalographic analysis makes it possible to determine the bioelectrical activity of the cerebral cortex [17], which, depending on the frequency, provides the following information:
- Alpha waves (frequency range 8–13 Hz, amplitude 20–100 µV)—these waves occur in the case of adults with complete relaxation and eyes closed. The waveform is sinusoidal in nature, with the largest amplitudes received above the visual cortex. The alpha rhythm is blocked during attention (especially visual attention) and mental effort.
- Beta waves (frequency range 14–35 Hz, amplitude up to 20 µV)—these waves occur during states of activity, information processing, attention or arousal. They are received by the frontal-central region.
- Theta waves (frequency range 4–7 Hz, up to 30 µV)—they occur mainly in case of children. When it comes to adults, they appear in a state of deep meditation, sleep, trance, hypnosis, dreaming, intense emotion, etc.
- Delta waves (frequency range 0.5–4 Hz, amplitude 75–200 µV)—very characteristic for deep sleep. They are collected from the entire surface of the skull.
- Gamma waves (frequency range 35–100 Hz)—these waves that occur in stressful situations during stage fright, anxiety and so-called emergency situations.
This work focuses on measuring the EEG signal using the biofeedback method, in which the measured signal is given back to the patient in the form of, i.e., a visualization or computer game. The feedback contains information about which brain waves are predominant at a given moment. These waves are used, for example, to control a virtual element when brain activity increases in the desired frequency band. The corresponding correlation of alpha, beta and theta wave activity allows the identification of the subject’s level of concentration.
3.2. Hardware and Software Layer
In order to verify the assumptions of the system model concept, tests were carried out to check, in particular, the correctness of the choice of the measurement of the EEG signal emitted by the operator’s brain in order to identify his/her level of concentration. In our study, we utilized the MindWave Mobile device 1, coming from NeuroSky (San Jose, CA, USA) [18]. We intended to verify whether the single-electrode EEG signal measurement is sufficient to monitor the concentration level of the operator of machinery and equipment.
The MindWave Mobile is equipped with a single, dry frontal electrode named Fp1 (according to the international 10–20 standard defining electrode placement points during EEG signal analysis) and an ear-mounted reference clip.
NeuroSky’s product is powered by a single AAA battery, which provides between 6 and 8 h of continuous operation. The data transmission rate realized by the device is equal to 250 kbit/s. The device operates in the frequency range of 2.420–2.471 GHz. The maximum signal strength is equal to 6 dBm. The sampling frequency for measurements carried out using the NeuroSky MindWave Mobile is set to 512 Hz [6].
In addition to the raw EEG signal, the device transmits the level of focus (attention) and relaxation (meditation). Both ratios are dimensionless. The manufacturers of the equipment do not provide details of their determination, only information on their correlation with alpha, beta and theta waves are given [19].
For the purpose of this study, a custom-build software was developed to record the data, i.e., time, focus and meditation level, and save the data for further analysis. The software is compatible with any kind of device running the Android operating system. It contains summation filters that process the data from the data logger and correlate it according to the time base with the events that were gathered by the video recorder.
Figure 2 shows the block diagram of the test bed for the operator’s concentration measurement system. The testbed was equipped with an EEG measurement tool, namely the MindWave Mobile device, from which data were recorded in a data logger, which is a mobile application running on a mobile Android-powered terminal. The workstation also consisted of a video recorder, which allowed the measurement results to be correlated with specific recorded events, namely visual information. It should be noted that all devices were synchronized in time.
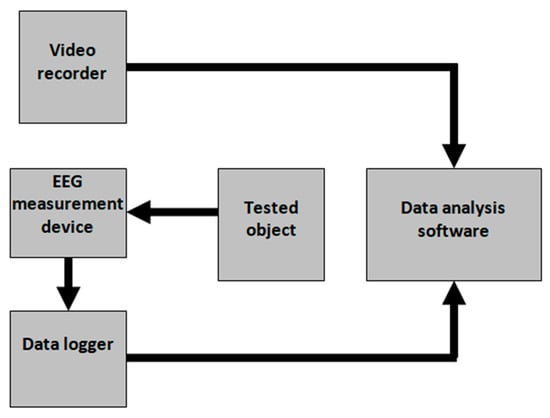
Figure 2.
Block diagram of the operator’s concentration measurement system model.
Tests were carried out for two variants of machine operators: car drivers and people performing simple manual tasks. Drivers of passenger cars consisted of o groups: people who have a driving license for more than 10 years, and people who have a driving license for less than 1 year. People performing precise manual activities were assemblers of SMD electronic components with 10 years of experience.
During our study, the following system functions were verified:
- Whether the system is able to identify the response to specific stimuli while driving (short-distance driving).
- Whether the system can identify measurement differences (driving two drivers on the same route with different driving skills).
- Whether it is possible to identify distractions over short and long periods of time (long-distance driving and simple manual tasks).
During the field tests, the following parameters were recorded and monitored: time, level of concentration and level of meditation (relaxation).
4. Results
The measurement data from the data logger were subjected to a summation filter in the data analysis software and correlated with the corresponding events obtained by the video recorder. An example of the oscillogram obtained during tests is shown in Figure 3. It represents the level of concentration of a driver during two short trips. Four events were listed that could have affected his/her level of concentration.
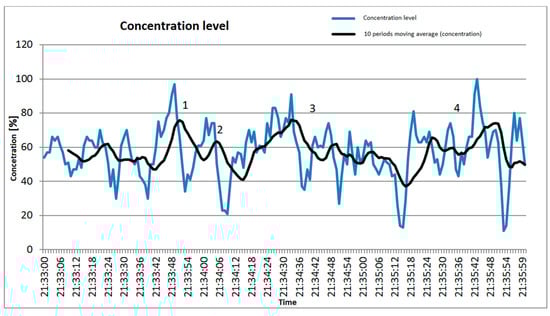
Figure 3.
Level of driver concentration.
Events 1, 2 and 3 occurred in the evening when there was little traffic on the road. Locations were identified where the driver reacted to passing vehicles (events 1, 2 and 3), as shown in Figure 4. Increased levels of concentration were observed when approaching a junction, recorded as event number 4.
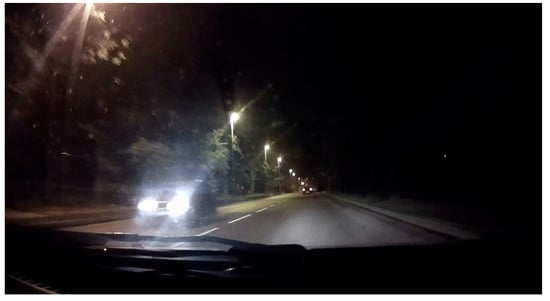
Figure 4.
Example of recorded event—passing another vehicle.
The recording of concentration levels was repeated on route 2, which is characterized by increased traffic (motorway). Elevated levels were recorded on 9 occasions. One of these was an access to a section where there were difficulties due to ongoing road works, as shown in Figure 5.
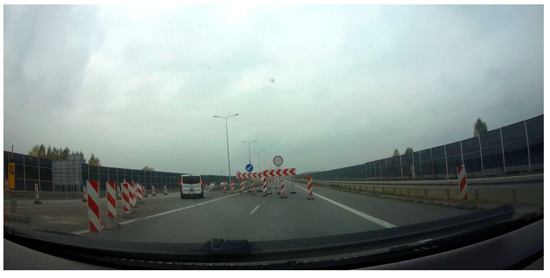
Figure 5.
Example of a recorded event—unexpected road works.
The study found that the system detects the test driver’s reaction to certain driving situations in the form of an increased level of concentration.
Tests were also carried out on a route of about 700 km long. Drivers drove in mixed areas, including built-up areas, expressways and motorways. Figure 6 shows the time intervals during which the drivers drove on motorways and expressways.
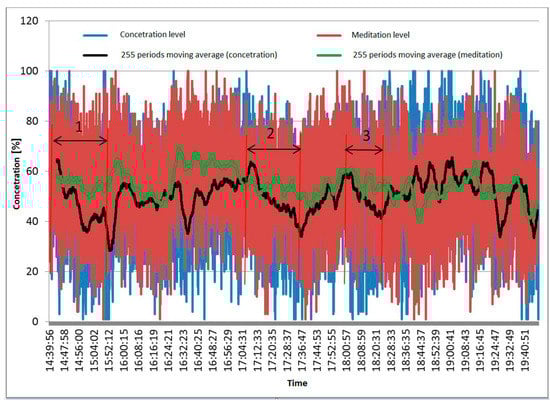
Figure 6.
Average concentration level of drivers on a motorway or expressway.
In case of interval 1, a decrease in the average concentration level of the drivers up to the stop was observed. For intervals 2 and 3, a decrease in the average concentration level was also observed (after a stop, the vehicle was driven by the same person). It was found that the average concentration level for compartment 1 increased in a short period of time when there was a change of driver (person).
The average concentration level recorded on the motorway (Section 1) was equal to 45.8% (driving time of approx. 1 h 12 min), while the average concentration level calculated at the same time on the mixed section (urban expressways) was equal to 50.3%, as shown in Figure 7.
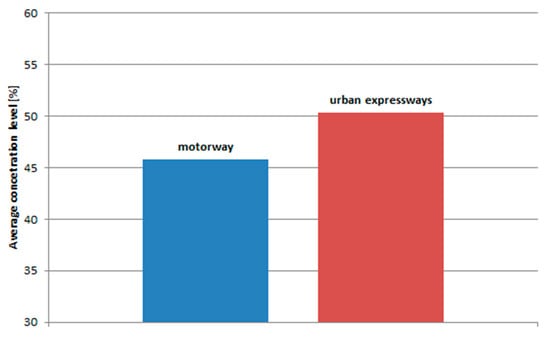
Figure 7.
Average concentration level of drivers on a motorway or expressway—first data part.
The average concentration level calculated on motorway (Section 2 and Section 3) was equal to 50% and 49% respectively. The corresponding average value of the concentration level recorded in the urban area was equal to 58%, as shown in Figure 8.
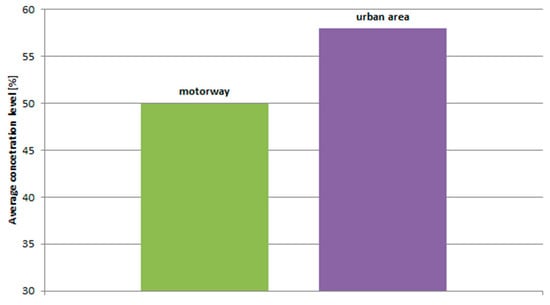
Figure 8.
Average concentration level of drivers on a motorway or expressway—second data part.
The level of concentration of drivers with varying levels of driving skills was also verified, as shown in Figure 9, Figure 10 and Figure 11. As observed, the average level of concentration while driving for inexperienced drivers was equal to 53.6%.
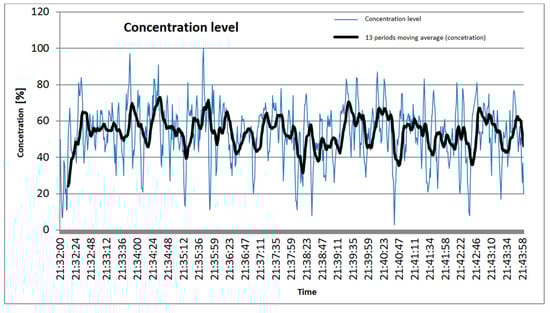
Figure 9.
Concentration of a less experienced drivers.
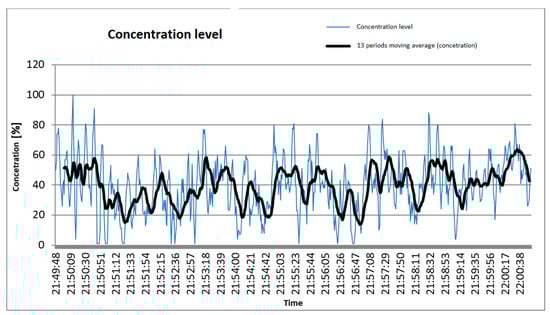
Figure 10.
Concentration level of an experienced driver.
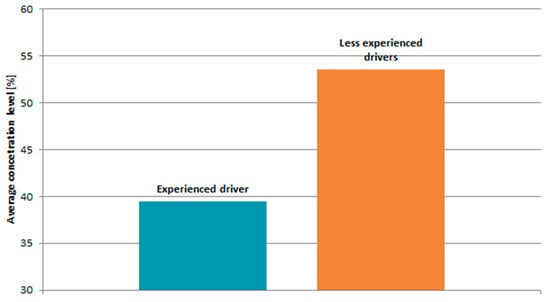
Figure 11.
Concentration level of an experienced driver and a less experienced drivers.
The average level of concentration while driving in case of an experienced driver, as shown in Figure 11 and Figure 12, was equal to 39.5%.
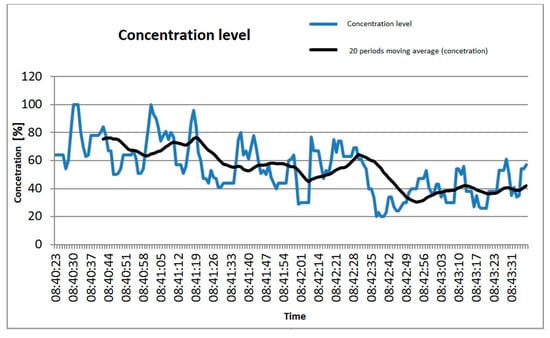
Figure 12.
Concentration level of people performing simple manual tasks.
It was found that the system was able to detect differences in driving in urban areas (more driving events occurring) and motorway areas (fewer driving events occurring) after averaging the focus level values. The system also detected a difference in focus between experienced and inexperienced drivers. During long, monotonous driving sessions, there was a large drop in the driver’s average concentration levels.
A study was also carried out on the concentration of people performing the activity of moving small objects from one container to another using tweezers. As shown in Figure 12, the task lasted 3 min, where the concentration level of those performing simple activities rose to a peak and then fell. The situation was repeated, but the maxima reached in the second minute were smaller than the previous ones.
The level of concentration was highest when there were few items left in the first container and decreased when the subject began to move items from a full container to an empty one.
5. Discussion
One of the main limitations of EEG monitoring is the recording electrode; its principle of operation and application to the scalp has changed very little since EEG’s first introduction as a clinical tool. With the evolution of amplifiers and data acquisition systems, modern-day EEG systems now have the capability to record for multiple hours or even days with little intervention [20].
The research carried out has confirmed that it is possible to detect the level of concentration of machine and vehicle operators during their work. As the working characteristics of a mining machine operator are very different from those of a car driver, it will be necessary to carry out specific studies in order to propose a dedicated system concept designed for this group of people.
It is assumed that, for reasons of user comfort, the measuring elements should not interfere with the work. It was therefore decided to place them inside the operator’s helmet, as shown in Figure 13.
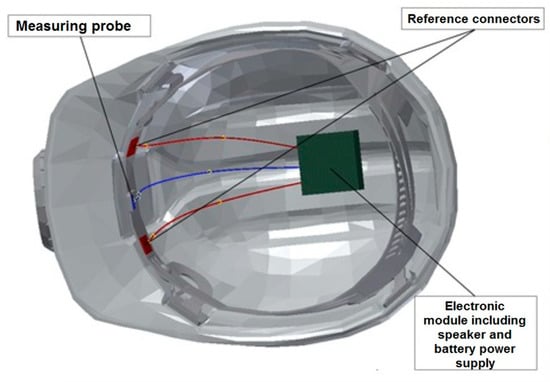
Figure 13.
Prototype of a device for measuring EEG signals for machine operators.
The electronic module shall be mounted in the upper part of the miner’s helmet, and the measuring probe will be guided to two points on the operator’s forehead, which are the reference points for measuring the EEG signals. A suitable housing shall be used as the EEG signal inputs need to be protected against electromagnetic pulses (EMP) in accordance with the IEC 61000-4-2 recommendation [21].
The system model was built on the basis of a freely available market solution, MindWave Mobile, which analyses the acquired EEG signal and performs its evaluation by generating a focus level signal. In the proposed 3D prototype model of the system, it will be necessary to develop a hardware solution and algorithms that will allow appropriate analysis of the acquired EEG signal. It will also be necessary to verify the proposed placement of the measurement electrodes.
The readable field strength of the electromagnetic field emitted by the operator’s brain ranges from a few to tens of microvolts (µV). It was therefore necessary to use a signal amplification circuit. After amplification, the signal was filtered in order to extract specific frequencies. It is planned to use a band-pass filter to extract the frequencies of alpha waves (8–13 Hz) and theta waves (4–8 Hz) from the amplified EEG signal [22,23,24]. These waves carry information about the level of focus and meditation. In our prototype solution, we intend to use a single-electrode solution for EEG signal measurement. The electrode will be placed on the forehead of the operator. There is a possibility of interfering with the measurement in a single-electrode system. However, this matter was verified during the carried out tests. In addition, the location indicated for the measurement of alpha waves was the occipital region, while theta waves were found in the temporal region. However, these waves were also present in the frontal region, as confirmed by this study. However, if the results of the prototype tests under real-time operating conditions will indicate too high level of interference, additional measuring electrodes will be used.
The operator’s focus level data will be delivered in a wireless manner to the main server in an underground mine environment and then transmitted on the surface to the supervisory visualization system, shown in Figure 14 and Figure 15.
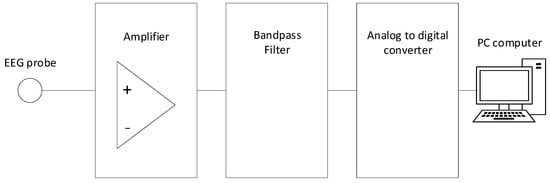
Figure 14.
Proposed block diagram of the EEG signal measurement system of the prototype solution.
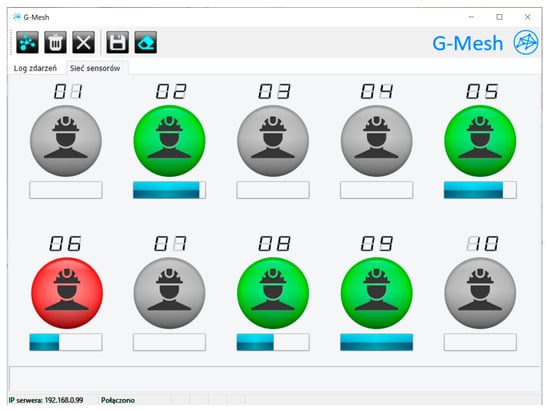
Figure 15.
Interface of the G-Mesh monitoring application (gray—inactive device; green—high level of concentration; red—low level of concentration).
The device mounted inside a helmet will be one of the nodes in a wireless network with a mesh topology, where the routing process will be performed by algorithms based on swarm intelligence (SI). These algorithms are characterized by the fact that, regardless of the number of variables in the solution space, they adapt to the constraints and help to solve the optimization problem. The use of these algorithms makes it possible to maintain the transmission parameters of the data transmitted in sensor networks at an appropriate level of quality. Factors that need to be properly addressed include throughput, low latency, and high reliability. Sensor networks based on swarm intelligence algorithms are self-organizing and multi-redundant. Additional information may be found in [25,26,27,28,29,30].
To sum up, a 3D model of the device prototype was developed and a graphical interface of the software for visualizing measurement data was also introduced, along with guidelines for building a sensor network.
6. Conclusions
This paper presents a system utilizing a focus level measurement function to improve machine operator’s safety. In this study, a dedicated solution was proposed, evaluated and discussed. Additionally, field tests were conducted to verify the design assumptions. The experiments were conducted on two groups of people with skills similar to a mining machine operator: a car driver and a person performing manual work requiring high level of concentration. The conclusions of the research were as follows:
- The recorded concentration levels were correlated with particular road events (increased concentration level value)—the driver (operator) reacts with increased concentration levels to particular road events. The measurement of the EEG signal could be used to identify the operating process of a machine or equipment.
- During a long monotonous drive, a decrease in concentration level was observed—EEG signal measurement of the machine operator was able to identify a decrease in work performance. It was therefore possible to generate an arousal signal when a reduced level of concentration on the activity being performed was detected.
- During manual tasks, the recorded concentration level decreased with every minute of work performed—manual tasks requiring a high level of concentration through repetition were also capable of causing a decrease in concentration level on the work performed. A system that uses the measurement of the machine operator’s EEG signal could increase occupational safety by generating alarm (arousal) signals when a decrease in concentration level is detected.
Our research confirmed that the proposed concept of a concentration measurement system could be used to build a prototype device to control the concentration level of heavy machinery operators, especially in the oil and mining industry.
Guidelines for the construction of a prototype system were presented, along with a 3D model showing the proposed installation of a single-electrode device in a mining helmet. The concept of a single-electrode measurement channel was also introduced. The amplitudes and frequencies of the EEG signal, which will be used in the prototype to identify the concentration level and meditation of the operator, were discussed. The concept of a reliable wireless data transmission link to the master unit was also discussed.
Further work will be undertaken in the near future to adapt the system to the requirements of working in underground mines, which may involve building a proprietary hardware solution for EEG signal analysis and conducting tests on operators of mining machinery and equipment. The results of such experiments will allow the establishment of minimum focus values (thresholds) that must not be exceeded in order to maintain stable and safe working conditions. If these thresholds would be exceeded, appropriate voice or graphic information could be generated to increase the operator’s concentration level. Our research could also determine the impact of the operator’s concentration level on the level of occupational safety. Additional inspiration for future research directions can be found in [31,32,33,34].
Author Contributions
Conceptualization, J.J., B.P. and M.W.; methodology, J.J., B.P. and M.W.; software, J.J. and M.W.; validation, J.J. and M.W.; formal analysis, J.J., B.P. and M.W.; investigation, J.J., B.P. and M.W.; resources, J.J., B.P. and M.W.; data curation, J.J. and M.W.; writing—original draft preparation, J.J., M.W., B.P. and P.F.-G.; writing—review and editing, J.J., M.W., B.P. and P.F.-G.; visualization, J.J. and M.W.; supervision, J.J., B.P. and M.W.; project administration, J.J., M.W. and P.F.-G.; funding acquisition, P.F.-G. All authors have read and agreed to the published version of the manuscript.
Funding
This research received no external funding. The APC was funded by Gdansk University of Technology.
Institutional Review Board Statement
The study was conducted in accordance with the Declaration of Helsinki and approved by the Institutional Review Board (or Ethics Committee) of KOMAG Institute of Mining Technology.
Informed Consent Statement
Informed consent was obtained from all subjects involved in the study. Written informed consent has been obtained from the patient(s) to publish this paper.
Data Availability Statement
Not applicable.
Conflicts of Interest
The authors declare no conflict of interest.
References
- Lan, Z.; Sourina, O.; Wang, L.; Liu, Y. Real-time EEG-based emotion monitoring using stable features. Vis. Comput. 2016, 32, 347–358. [Google Scholar] [CrossRef]
- Polish Higher Mining Office. Available online: www.wug.gov.pl/download/6178.pdf (accessed on 8 March 2023).
- Radziszewska-Zielina, E.; Sobotka, A.; Plebankiewicz, E.; Zima, K. Preliminary identification and evaluation of parameters affecting the performance of the operator-machine earthmoving system. Build. Arch. 2013, 12, 53–60. [Google Scholar]
- Grieger, A.; Sawicki, T.; Sędłak, P.; Janicki, W.; Lewaszkiewicz, Ł. Safety situation in the workplace as function of a machine operator’s level of training. Logistika 2015, 5, 909–916. [Google Scholar]
- Jukiewicz, M.; Merkisz, J.; Orszulak, B. Using mindwave to biomeasurment attention factor in research field related with passenger vehicle simulator. Logistika 2014, 3, 2650–2656. [Google Scholar]
- Jagoda, J. System pomiaru koncentracji operatora maszyn i urządzeń górniczych. Masz. Górn. 2017, 2, 71–80. [Google Scholar]
- Wedde, F. BeeAdHoc: An energy efficient routing algorithm for mobile ad hoc networks inspired by bee beahavior. In Proceedings of the Genetic and Evolutionary Computation Conference, Washington, DC, USA, 25–29 June 2005. [Google Scholar]
- Jasiulek, D.; Świder, J. Mechatronic systems in mining roadheaders—Examples of solutions. Pom. Automat. Robot. 2013, 1, 121–127. [Google Scholar]
- Jasiulek, D.; Stankiewicz, K.; Woszczyński, M. Intelligent self-powered sensors in the state-of-the-art control systems of mining machines. Arch. Min. Sci. 2016, 61, 907–915. [Google Scholar] [CrossRef]
- Jendrysik, S.; Jasiulek, D.; Stankiewicz, K. System sterowania ścianowym przenośnikiem zgrzebłowym. Masz. Górn. 2015, 1, 29–32. [Google Scholar]
- Kostka, M.; Krzak, Ł.; Gawliński, A.; Jasiulek, D.; Latos, M.; Rogala-Rojek, J.; Stankiewicz, K.; Bartoszek, S.; Jendrysik, S.; Jura, J. Systemy monitoringu, diagnostyki i sterowania maszyn górniczych. Masz. Gór. 2015, 3, 88–96. [Google Scholar]
- Hou, X.; Liu, Y.; Sourina, O.; Tan, Y.R.E.; Wang, L.; Mueller-Wittig, W. EEG based stress monitoring. In Proceedings of the 2015 IEEE International Conference on Systems, Man, and Cybernetics, Hong Kong, China, 9–12 October 2015. [Google Scholar]
- Gevins, A.; Smith, M.E.; Leong, H.; McEvoy, L.; Whitfield, S.; Du, R.; Rush, G. Monitoring working memory load during computer-based tasks with EEG pattern recognition methods. Hum. Factors 1998, 40, 79–91. [Google Scholar] [CrossRef]
- Jung, T.P.; Makeig, S.; Stensmo, M.; Sejnowski, T.J. Estimating alertness from the EEG power spectrum. IEEE Trans. Biomed. Eng. 1997, 44, 60–69. [Google Scholar] [CrossRef] [PubMed]
- Smith, M.E.; Gevins, A.; Brown, H.; Karnik, A.; Du, R. Monitoring task loading with multivariate EEG measures during complex forms of human-computer interaction. Hum. Factors 2001, 43, 366–380. [Google Scholar] [CrossRef] [PubMed]
- Parra, L.C.; Spence, C.D.; Gerson, A.D.; Sajda, P. Response error correction-a demonstration of improved human-machine performance using real-time EEG monitoring. IEEE Trans. Neural Syst. Rehabil. Eng. 2003, 11, 173–177. [Google Scholar] [CrossRef]
- Broniec, A.; Chodak, J. Control of a simple electrical device by means of an EEG signal. Automation 2009, 13, 1059–1067. [Google Scholar]
- NeuroSky. Available online: https://neurosky.com/biosensors/eeg-sensor/biosensors/ (accessed on 8 March 2023).
- Paszkiel, S. EEG signal acquisition using Neurosky Mindwave Mobile for control processes implemented from the android system level. Pozn. Univ. Technol. Acad. J. 2015, 84, 237–244. [Google Scholar]
- Ives, J.R. New chronic EEG electrode for critical/intensive care unit monitoring. J. Clin. Neurophysiol. 2005, 22, 119–123. [Google Scholar] [CrossRef]
- International Electrotechnical Commission. IEC 61000-4-2 Recommendation; Electromagnetic Compatibility (EMC)—Part 4-2: Testing and Measurement Techniques—Electrostatic Discharge Immunity Test; International Electrotechnical Commission: Geneva, Switzerland, 2008. [Google Scholar]
- Rana, K.D.; Vaina, L.M. Functional roles of 10 Hz alpha-band power modulating engagement and disengagement of cortical networks in a complex visual motion task. PLoS ONE 2014, 9, e107715. [Google Scholar] [CrossRef]
- Brown, T.; Johnson, R.; Milavetz, G. Identifying periods of drowsy driving using EEG. Ann. Adv. Automot. Med. 2013, 57, 99–108. [Google Scholar]
- Malar, E.; Gauthaam, M.; Kalaikamal, M.; Muthukrishnan, S. The EEG based driver safety system. IACSIT Int. J. Eng. Technol. 2012, 4, 340–343. [Google Scholar] [CrossRef]
- Jagoda, J.; Hetmańczyk, M.; Stankiewicz, K. Dispersed, self-organizing sensory networks supporting the technological processes. Min. Mach. 2021, 2, 13–23. [Google Scholar]
- Jagoda, J.; Stankiewicz, K. Intelligent routing algorithms in the complex sensors network for control energy storage. In Proceedings of the 20th International Conference on Advanced Batteries, Accumulators and Fuel Cells, Brno, Czech Republic, 25–28 August 2019. [Google Scholar]
- Stankiewicz, K. A method for the self-organization of a sensor network in belt conveyor exploitation. Maint. Probl. 2016, 3, 145–154. [Google Scholar]
- Smolarek, A.; Malinowski, T. Protokoły trasowania w sieciach ad hoc. Zesz. Nauk. Wyższ. Szkoł. Informat. 2012, 8, 47–60. [Google Scholar]
- Di Caro, G.; Ducatelle, F.; Gamberdella, L.M. Swarm intelligence for routing in mobile ad hoc networks. In Proceedings of the 2015 IEEE Swarm Intelligence Symposium, Pasadena, CA, USA, 8–10 June 2005. [Google Scholar]
- Lech, M.; Berry, B.M.; Topcu, C.; Kremen, V.; Nejedly, P.; Lega, B.; Gross, R.E.; Sperling, M.R.; Jobst, B.C.; Sheth, S.A.; et al. Direct electrical stimulation of the human brain has inverse effects on the theta and gamma neural activities. IEEE Trans. Biomed. Eng. 2021, 68, 3701–3712. [Google Scholar] [CrossRef] [PubMed]
- Marks, V.S.; Saboo, K.V.; Topçu, Ç.; Lech, M.; Thayib, T.P.; Nejedly, P.; Kremen, V.; Worrell, G.A.; Kucewicz, M.T. Independent dynamics of low, intermediate, and high frequency spectral intracranial EEG activities during human memory formation. NeuroImage 2021, 245, 118637. [Google Scholar] [CrossRef] [PubMed]
- Cimbalnik, J.; Dolezal, J.; Topcu, C.; Lech, M.; Marks, V.S.; Joseph, B.; Dobias, M.; Van Gompel, J.; Worrell, G.; Kucewicz, M.T. Intracranial electrophysiological recordings from the human brain during memory tasks with pupillometry. Sci. Data 2022, 9, 6. [Google Scholar] [CrossRef] [PubMed]
- Stańczak, L.; Kaniak, W. Occupational health and safety management in hard coal mines in the aspect of dust hazard. Min. Mach. 2021, 2, 53–62. [Google Scholar]
- Stankiewicz, K. Mechatronic systems developed at the KOMAG. Min. Mach. 2020, 2, 59–68. [Google Scholar]


Disclaimer/Publisher’s Note: The statements, opinions and data contained in all publications are solely those of the individual author(s) and contributor(s) and not of MDPI and/or the editor(s). MDPI and/or the editor(s) disclaim responsibility for any injury to people or property resulting from any ideas, methods, instructions or products referred to in the content. |
© 2023 by the authors. Licensee MDPI, Basel, Switzerland. This article is an open access article distributed under the terms and conditions of the Creative Commons Attribution (CC BY) license (https://creativecommons.org/licenses/by/4.0/).