Study on the Change in Vegetation Coverage in Desert Oasis and Its Driving Factors from 1990 to 2020 Based on Google Earth Engine
Abstract
1. Introduction
2. Materials and Methods
2.1. Study Area
2.2. Data Sources
2.3. Research Method
2.3.1. Dimidiate Pixel Model
2.3.2. Trend Analysis
2.3.3. Coefficient of Variance
2.3.4. Hurst Index
3. Results and Discussion
3.1. Characteristics of Interannual Variation in Vegetation Cover
3.2. Spatial Distribution Characteristics of Vegetation Cover
3.3. Vegetation Cover Stability Analysis
3.4. Vegetation Cover Persistence Analysis
4. Conclusions
- (1)
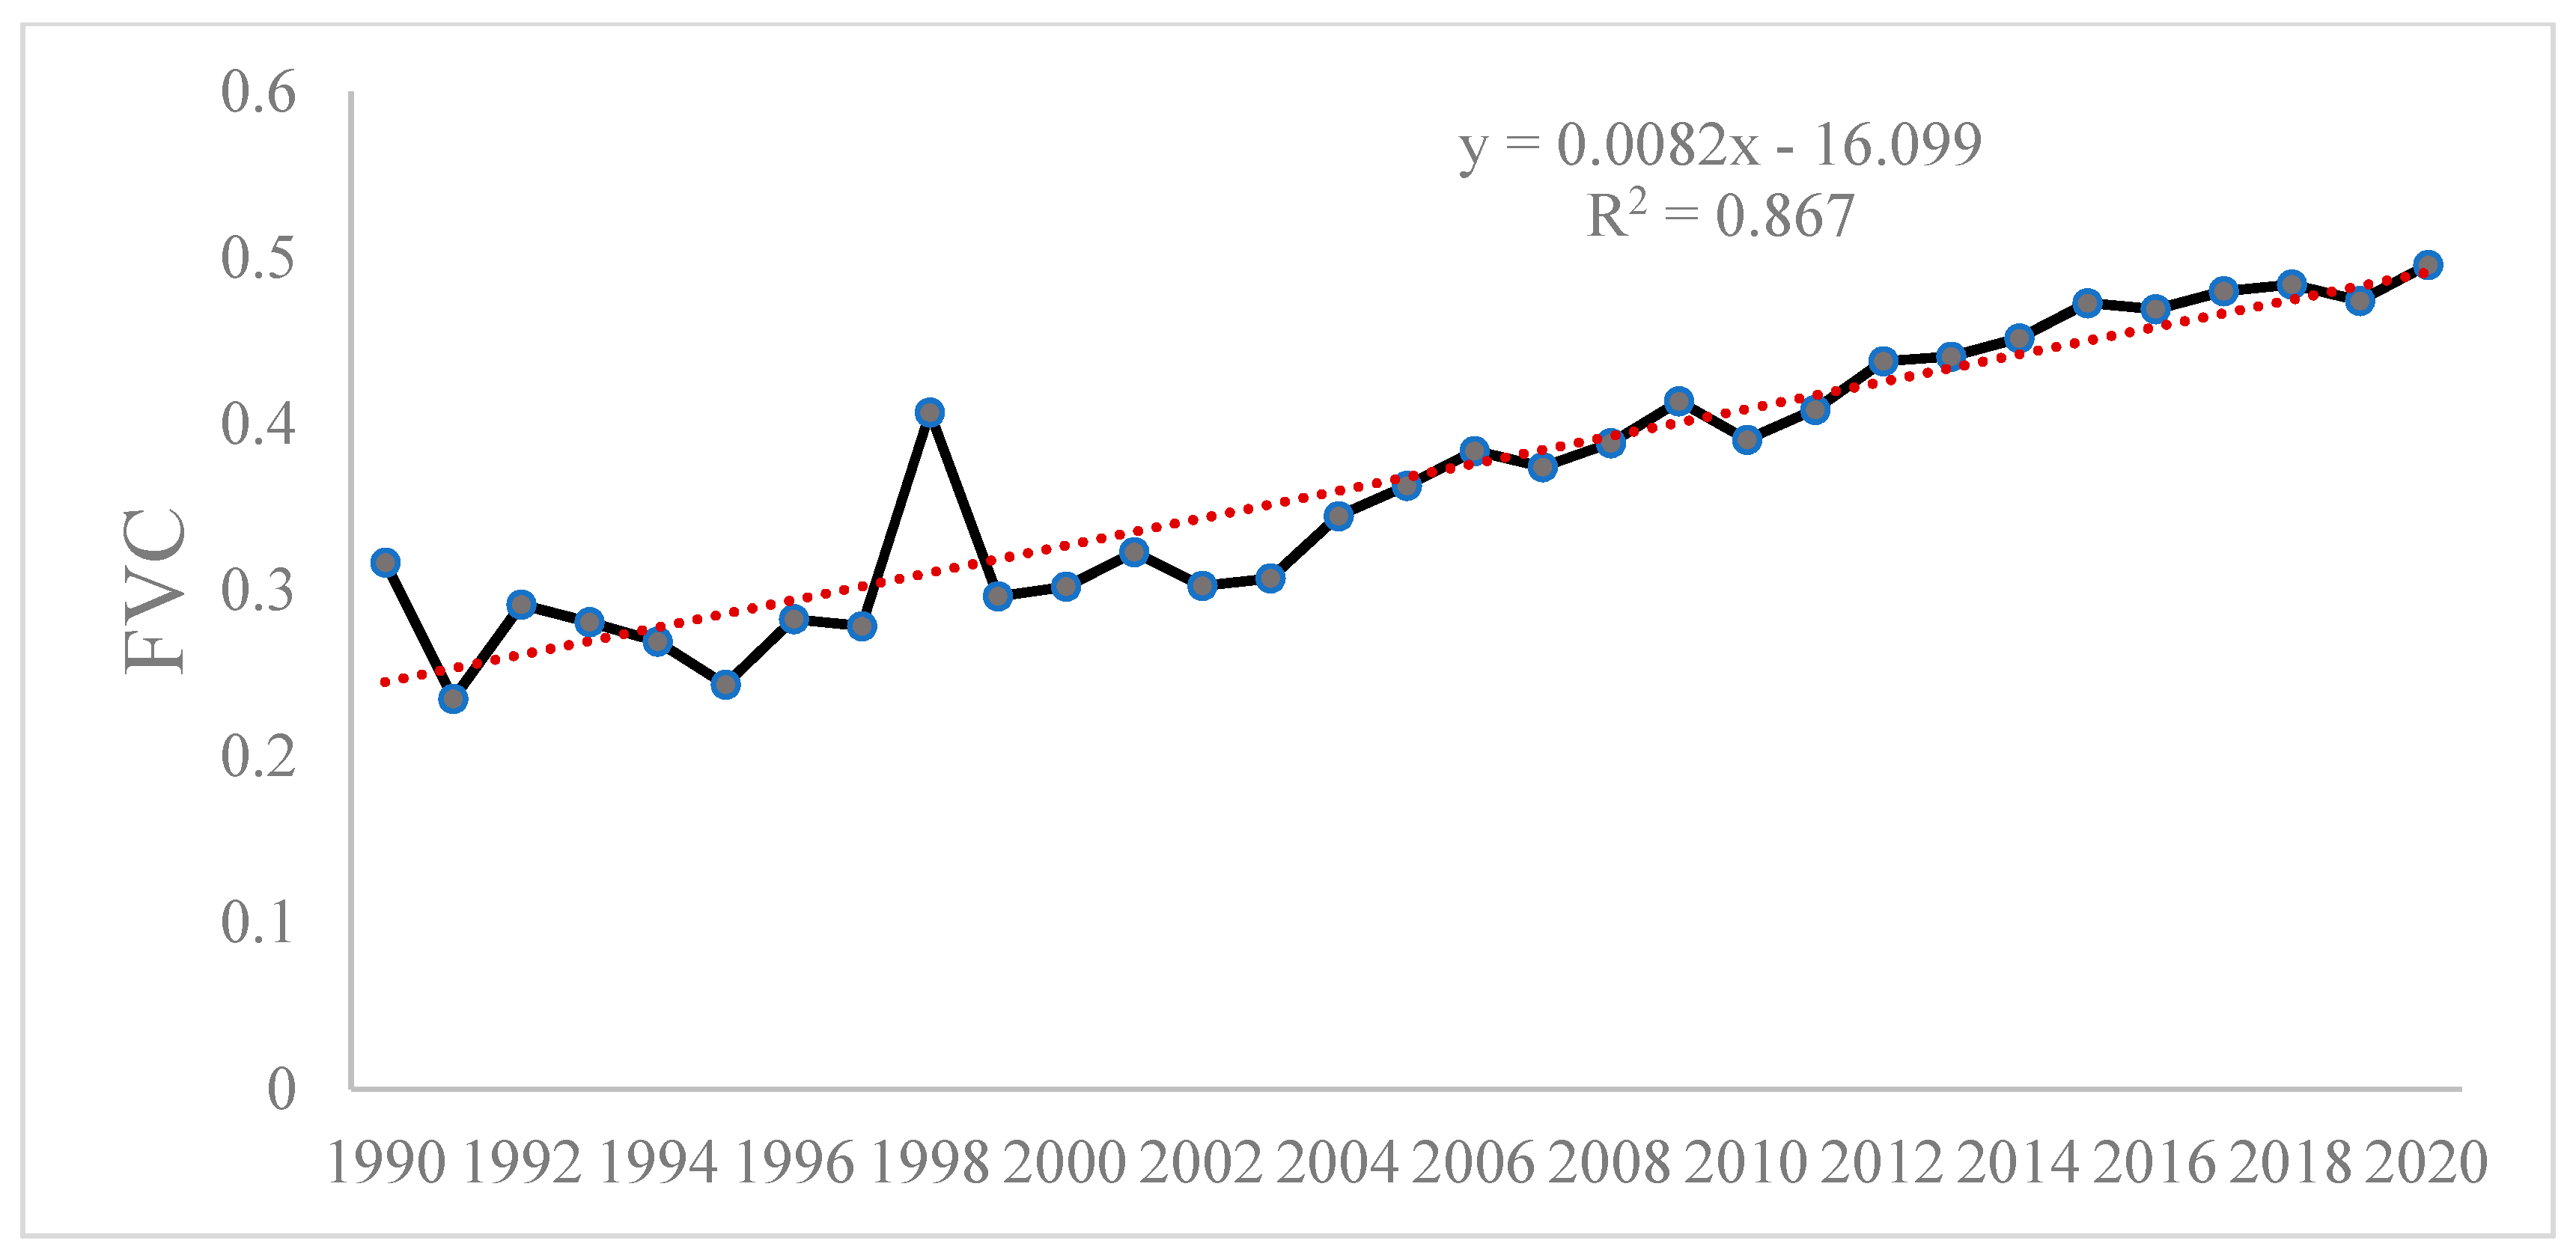
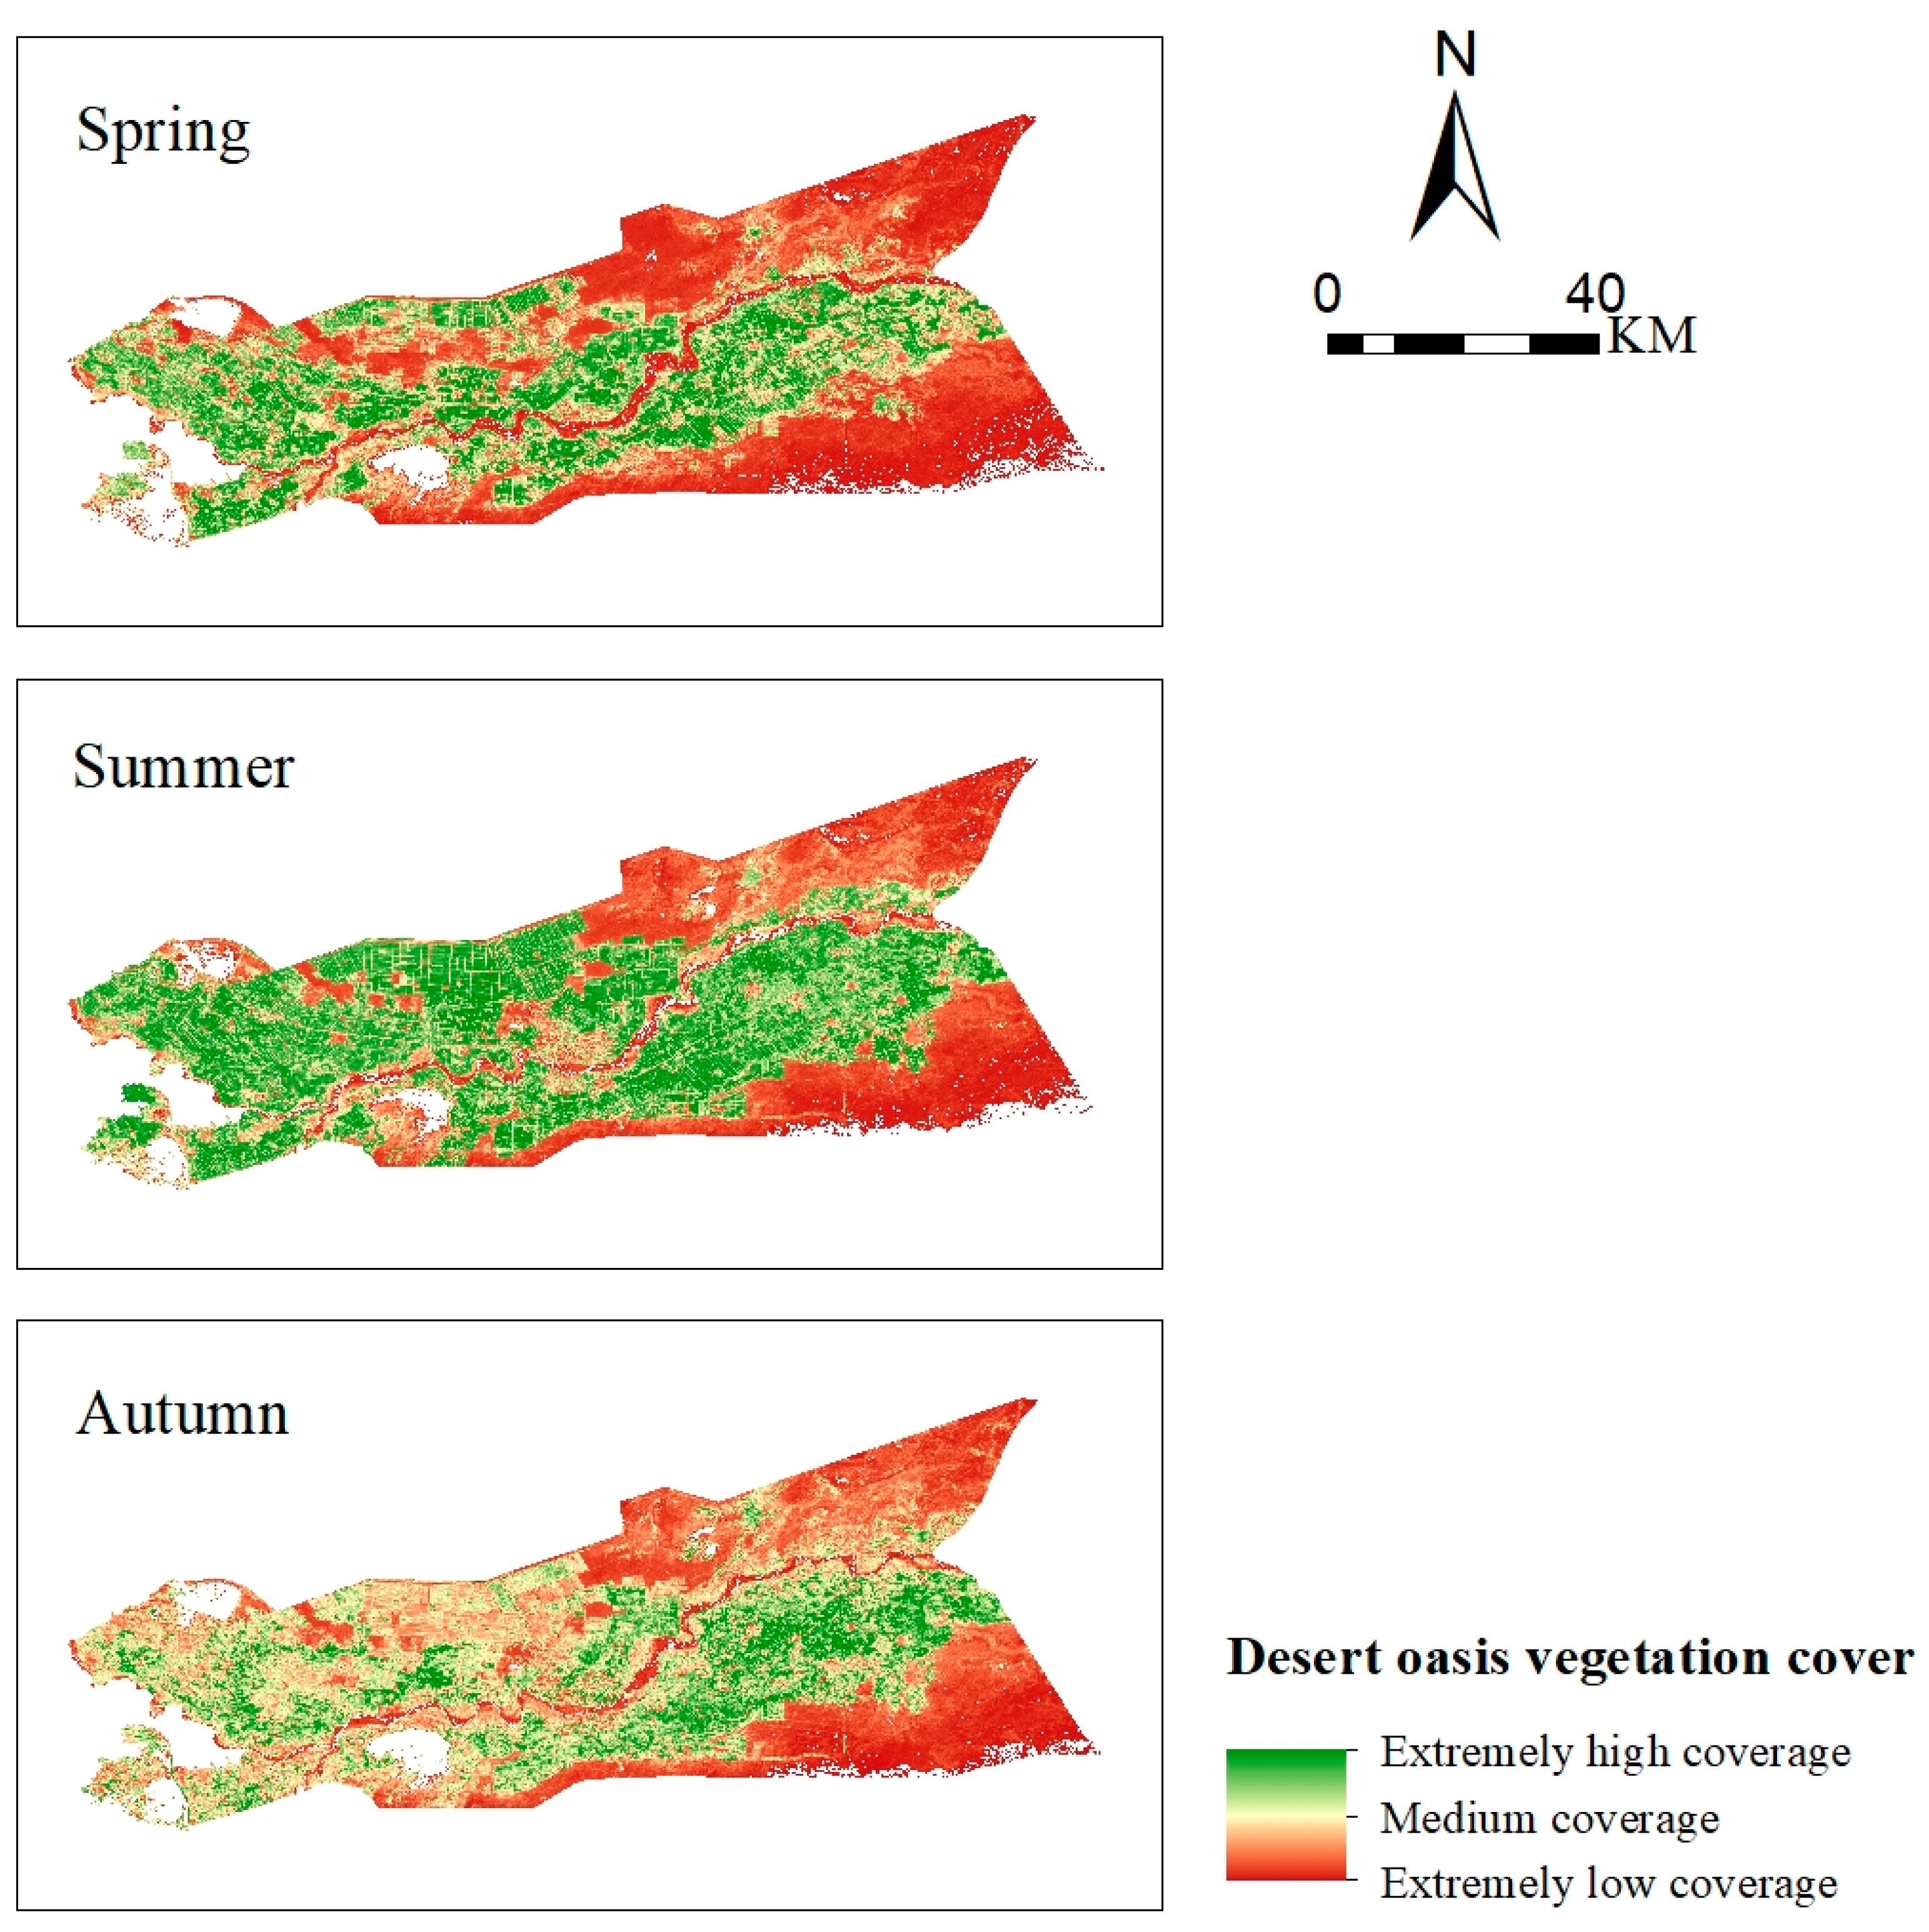
- From 1990 to 2020, desert control in the Alar Reclamation area achieved notable results, and the vegetation coverage showed a significant upward trend, with the R2 of 0.89 and the annual growth rate of 3.8%/10a. The overall trend of FVC remained positive, but the variation rate and amplitude were different. The climate improved with the management of the environment and, due to its geographical location and other characteristics, the average annual amount of sunshine is currently sufficient and the vegetation cover is at its highest in the summer and lower in the spring due to the presence of extreme weather such as dust storms. The annual FCV mean in the research area shows a positive correlation trend of fluctuation change with a slow increase.
- (2)
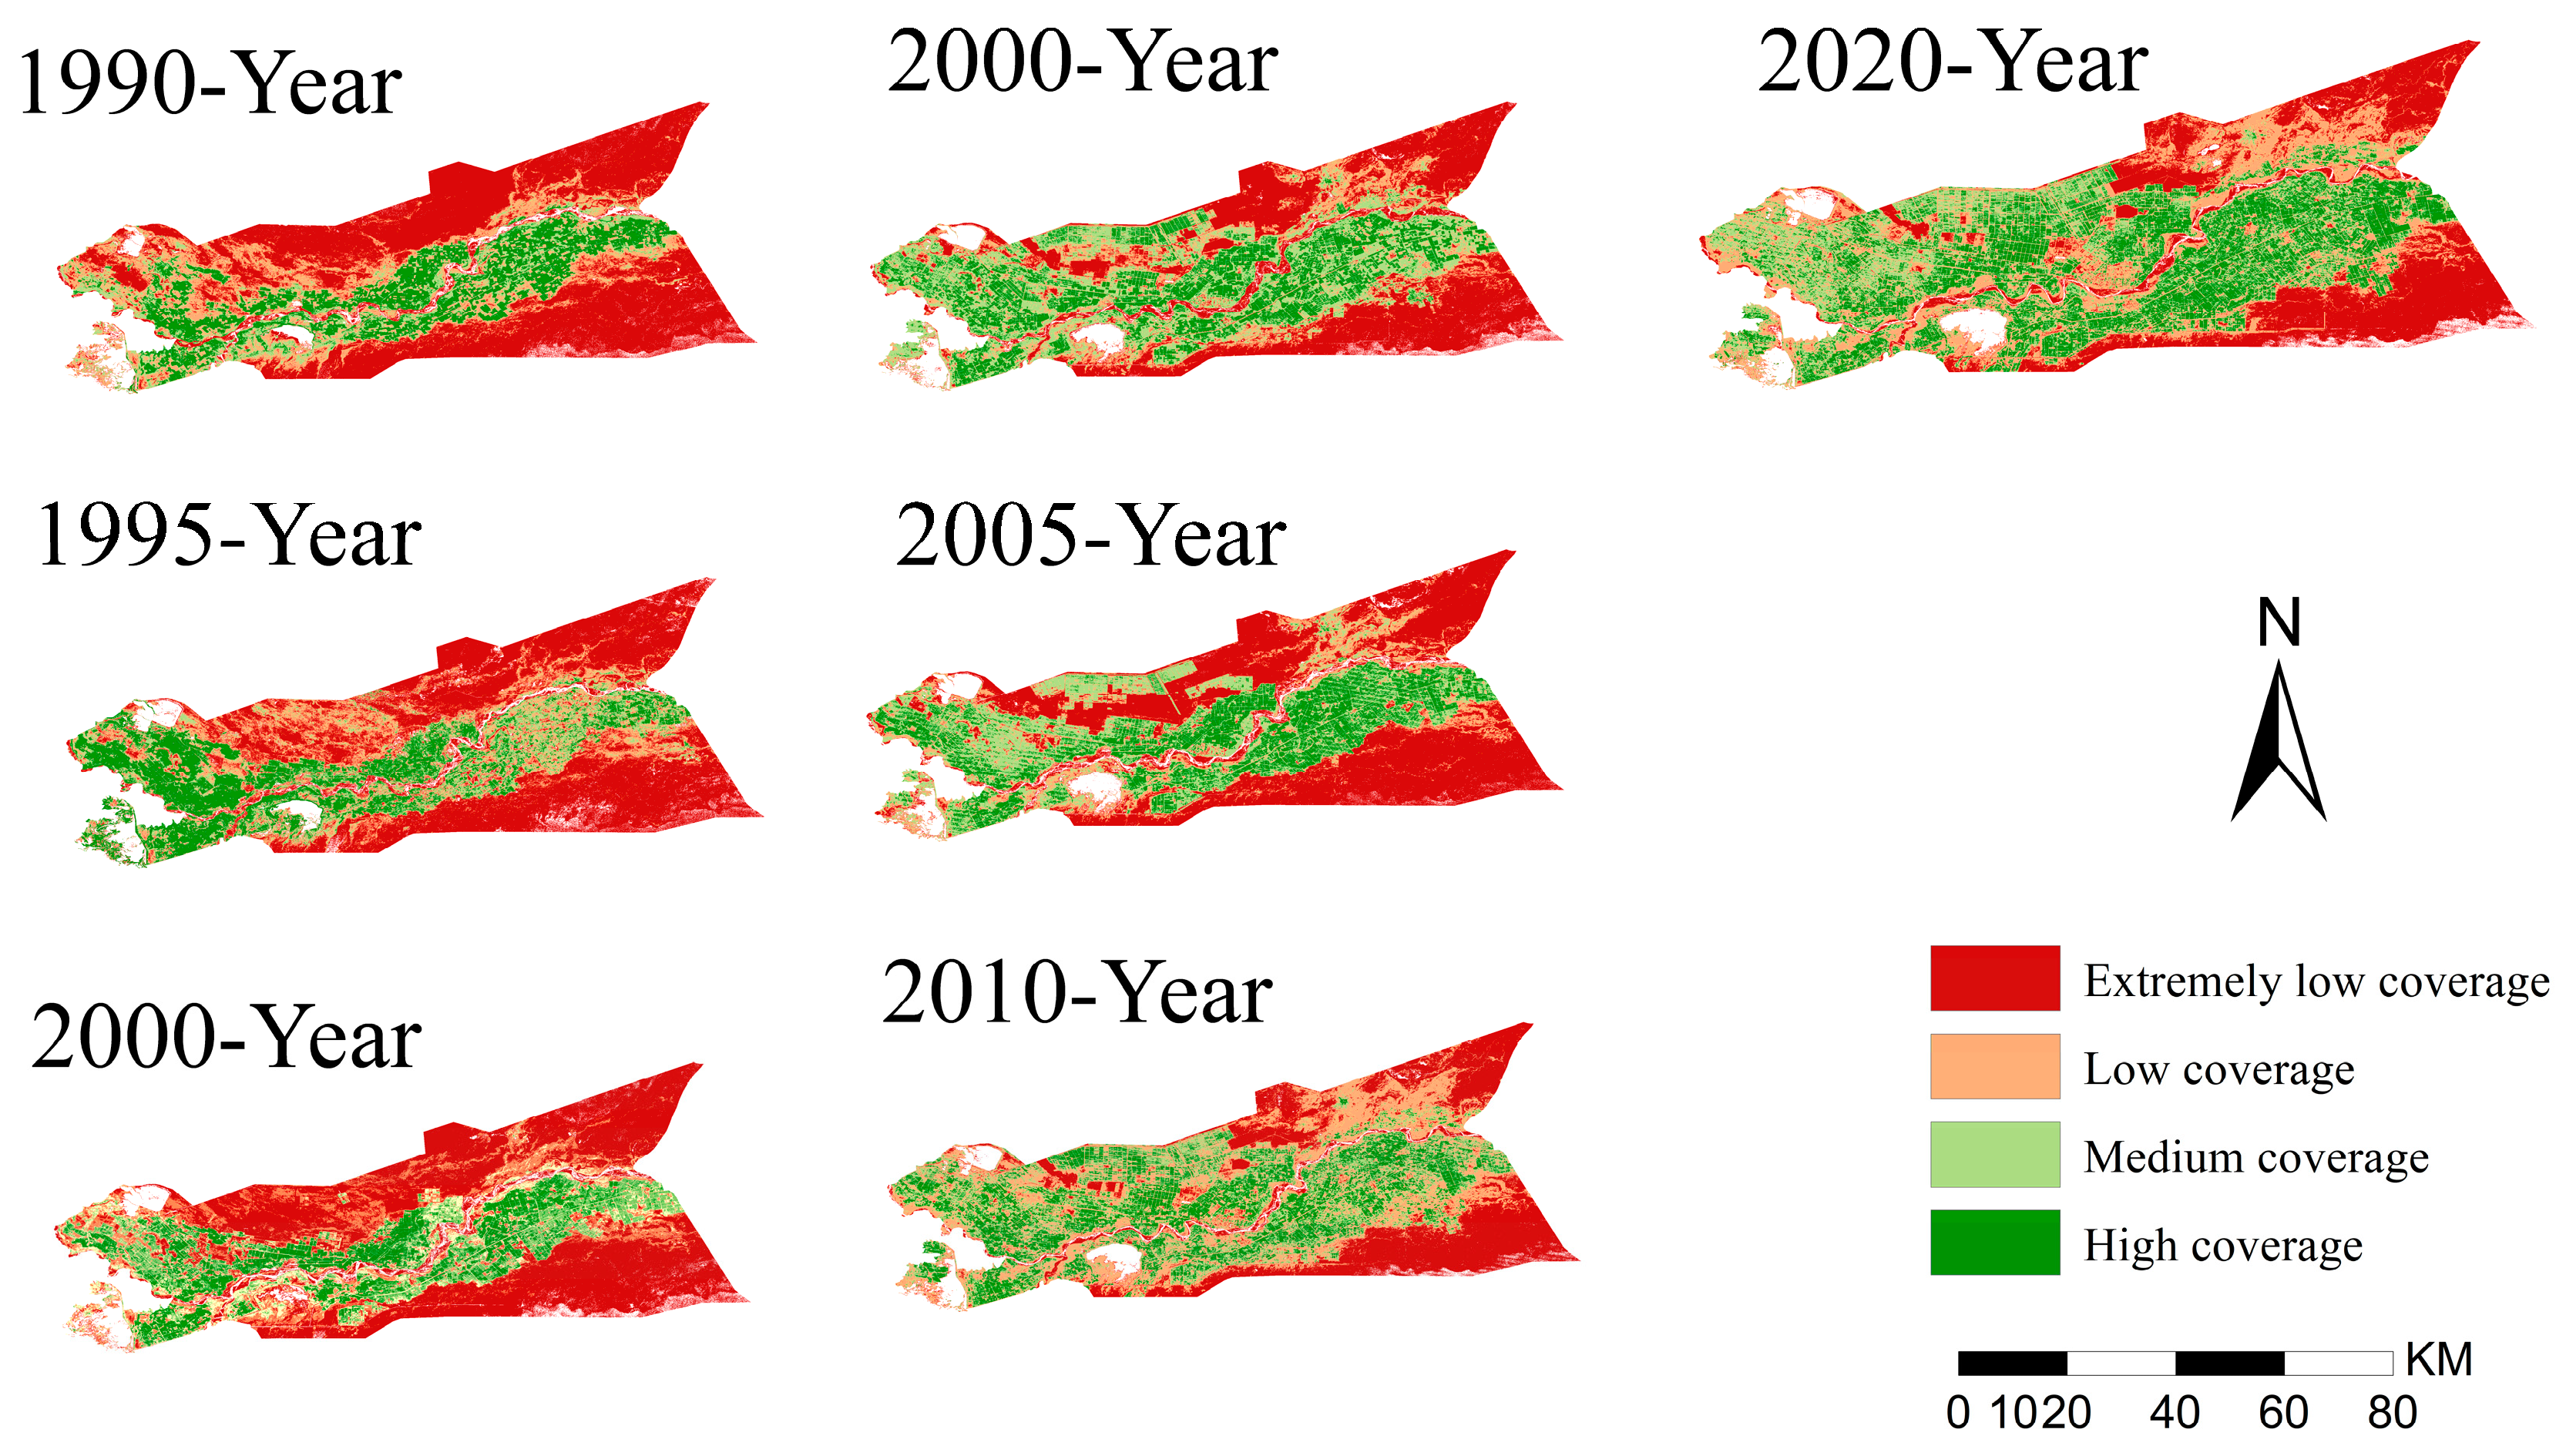
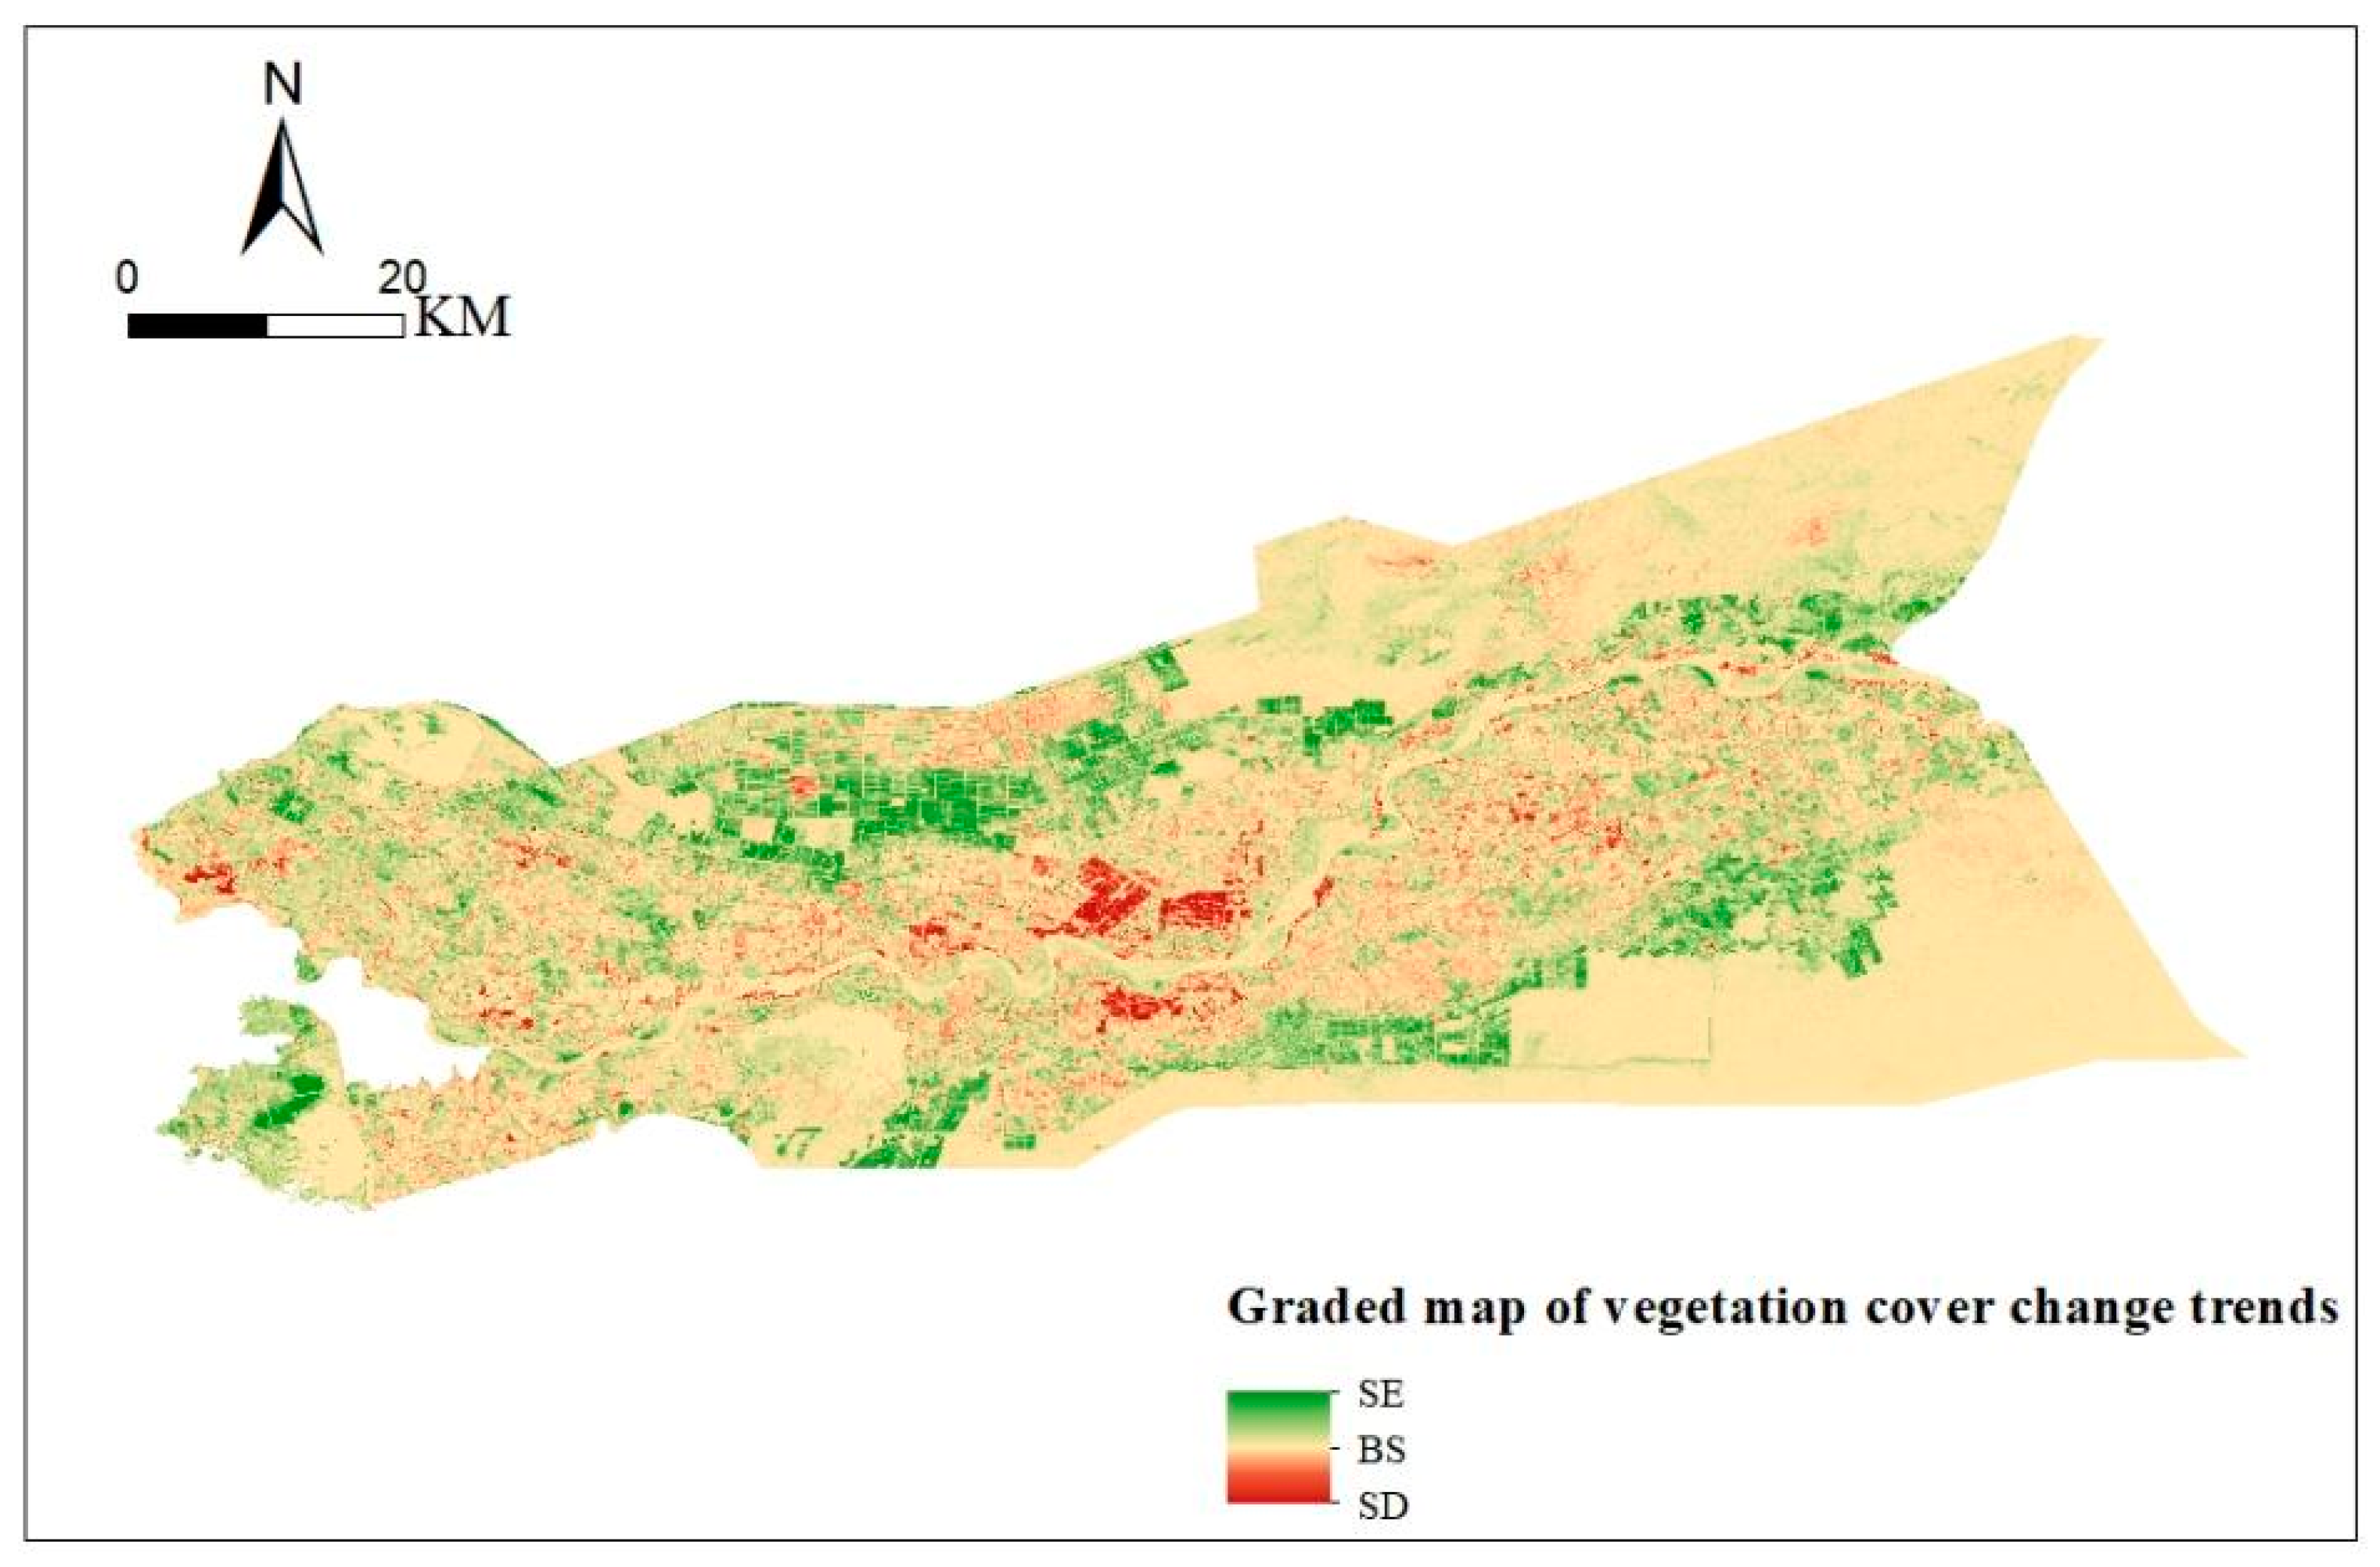
- Based on the estimation of the Slope trend analysis, the vegetation coverage in the Alar Reclamation area in the recent 30 years has significantly improved, with the vegetation coverage improvement area accounting for 62.6% and the basically invariant area accounting for 19%. Among them, the area that has been improved and passed the significance testing accounts for 42.8% of the total area, showing a spatial distribution pattern of “high vegetation coverage on both sides of the north and south of the Tarim River valley, low vegetation coverage in desert areas”.
- (3)
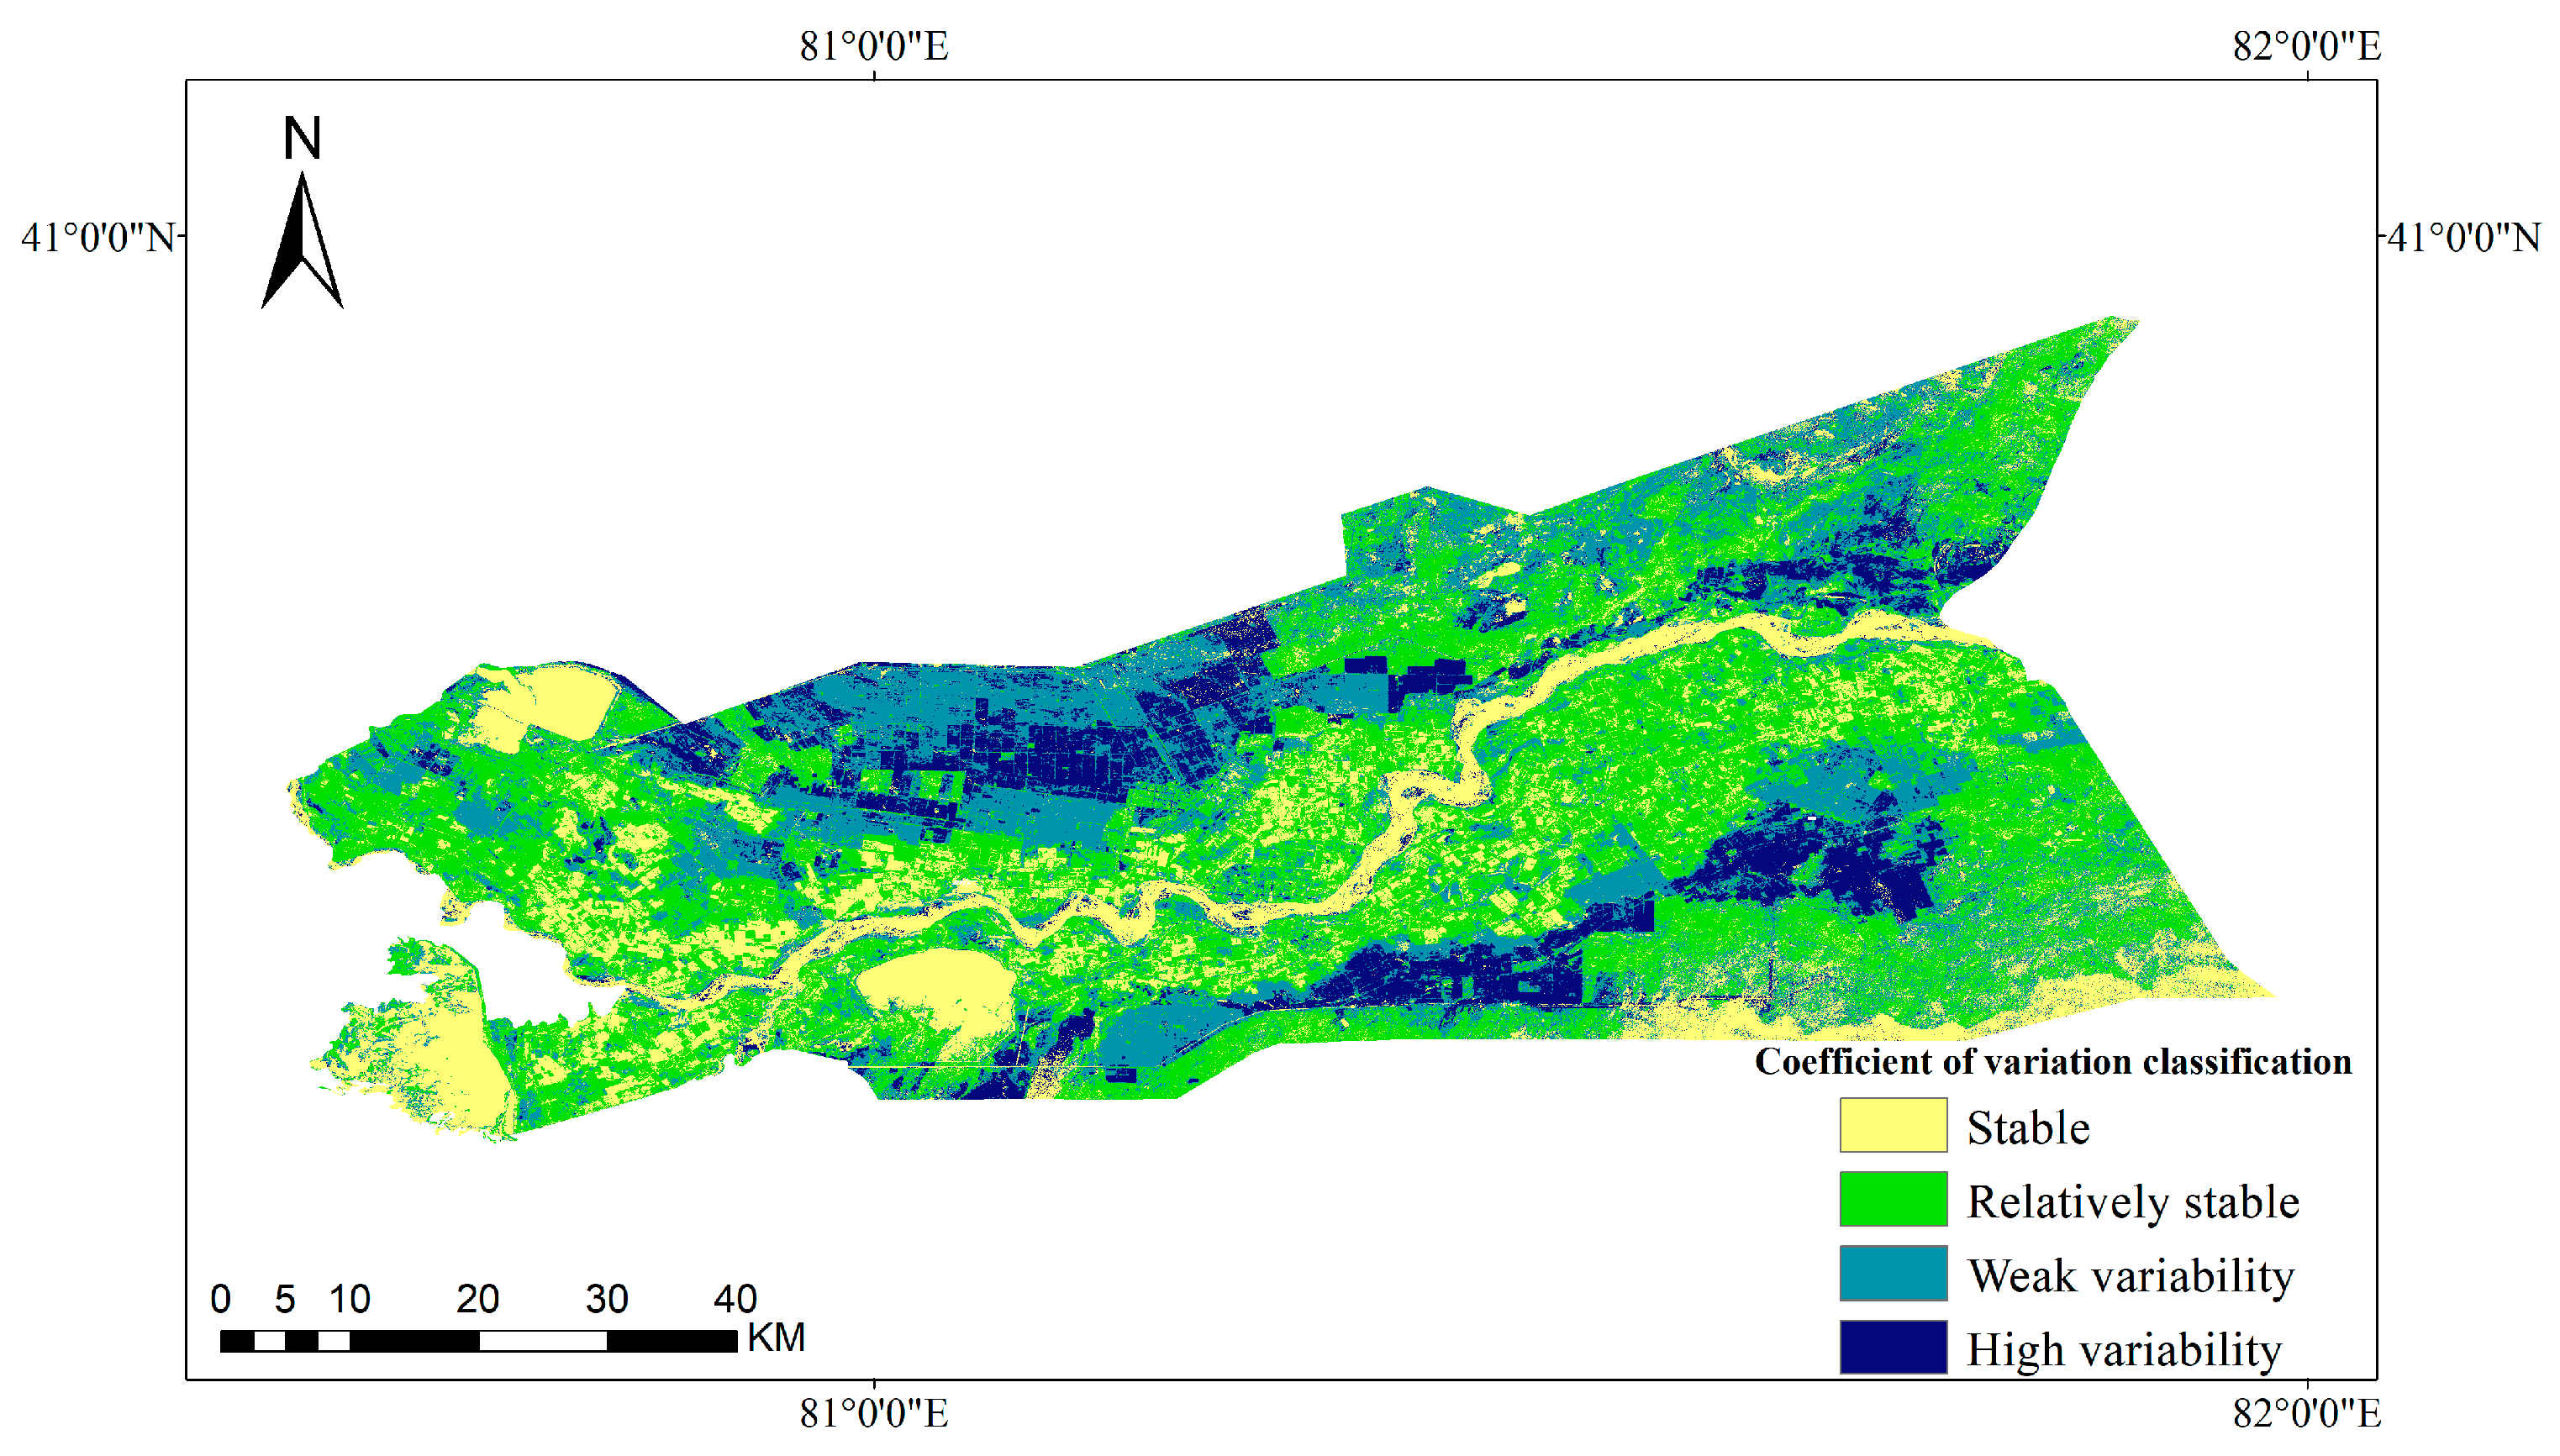
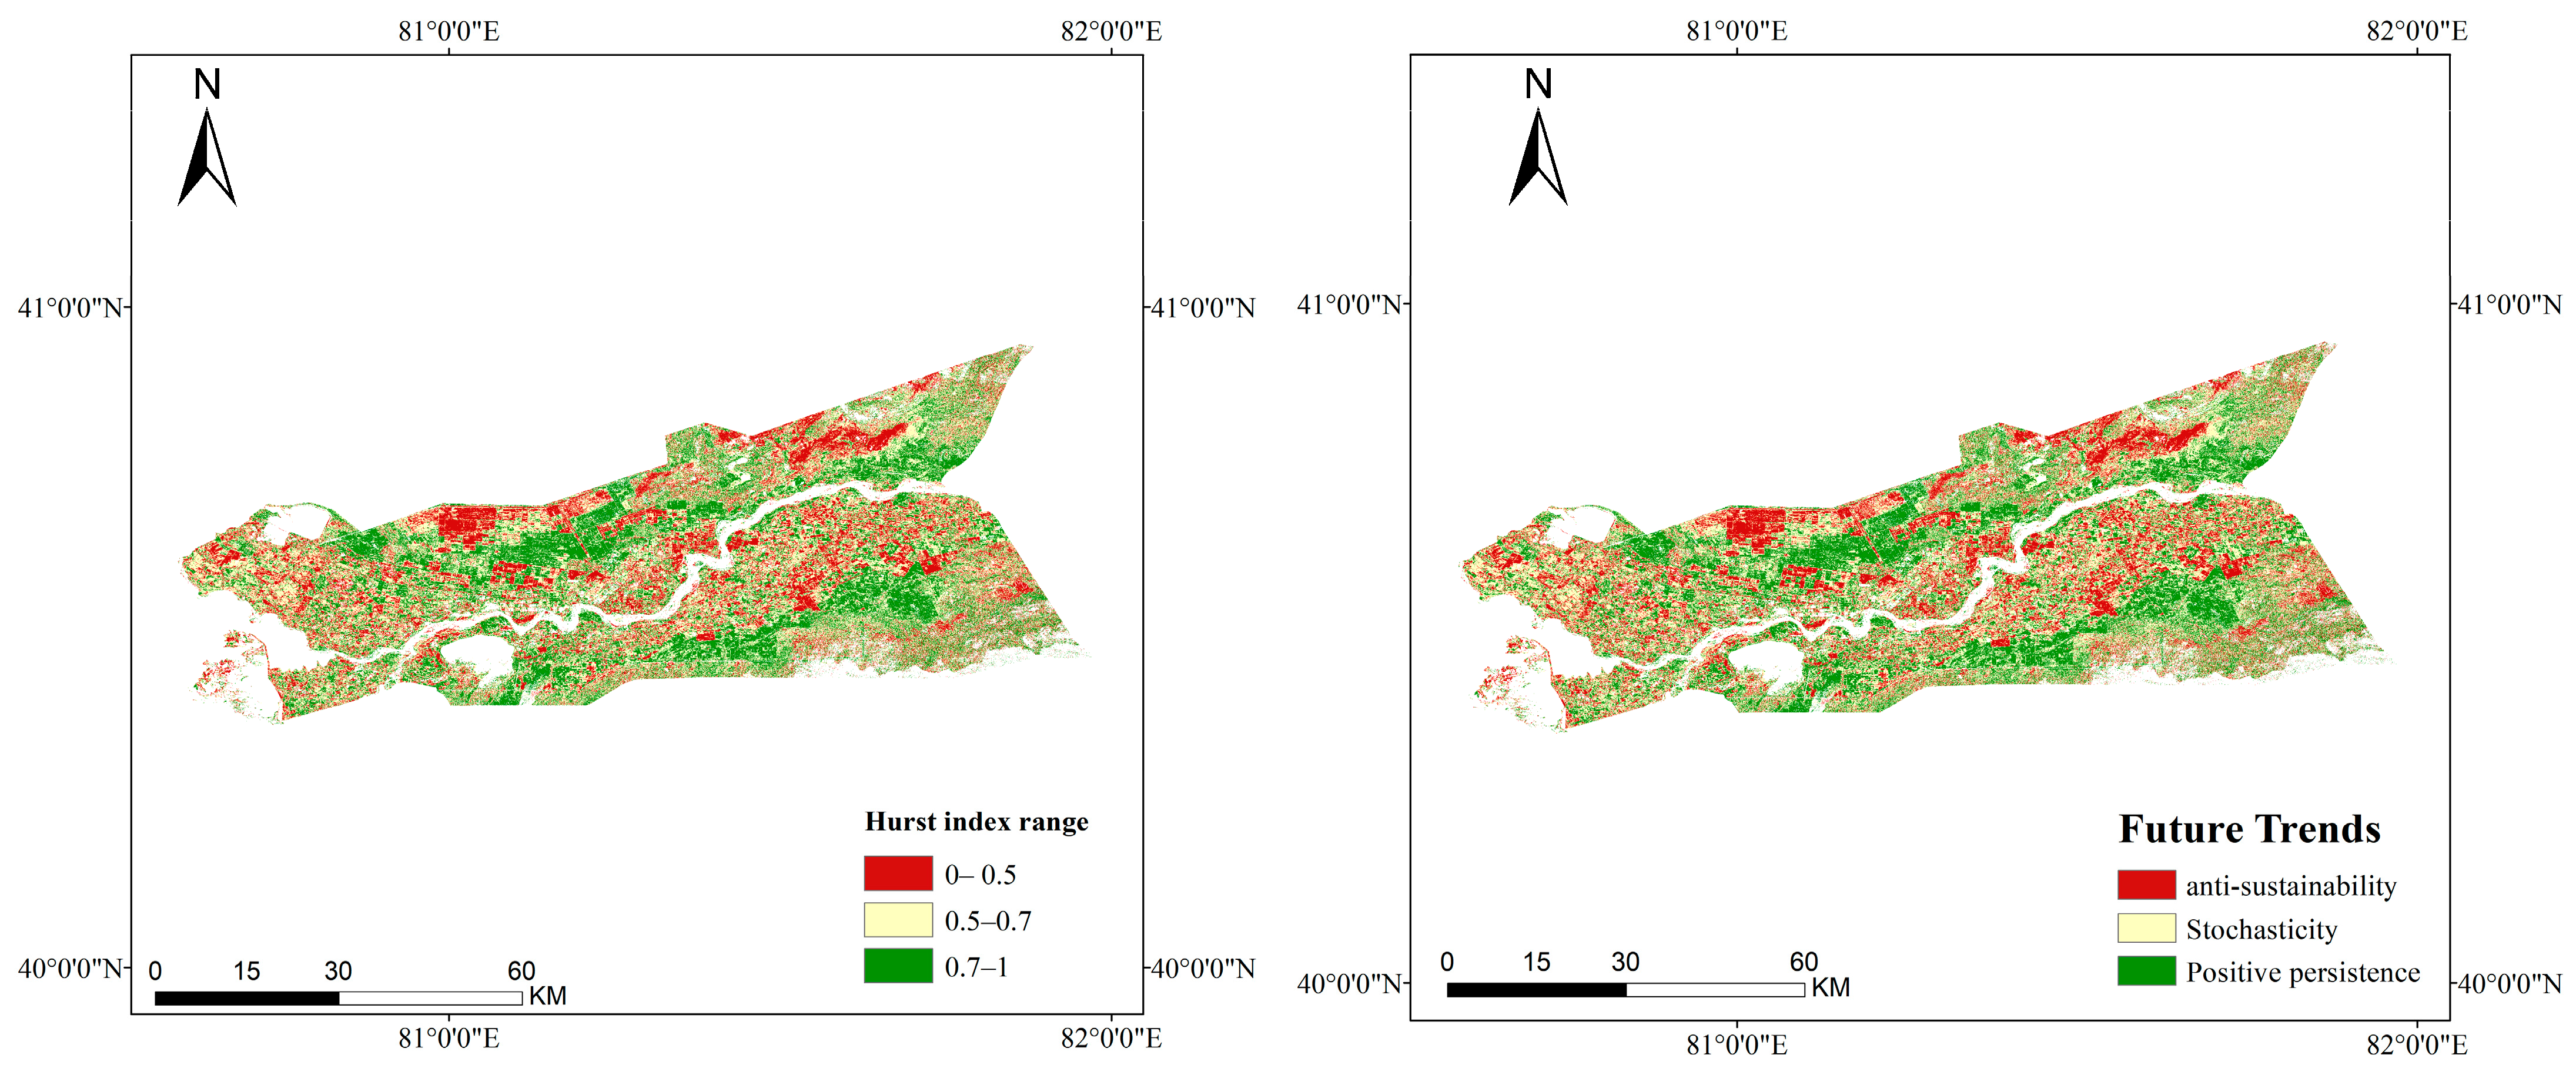
- The comprehensive analysis of the coefficient of variance and Hurst index shows that the overall variation trend and persistence of vegetation coverage in the whole research area are positively correlated with each other. In total, 89.52% of the regions with the coefficient of variance below 0.8 are in a relatively stable variation state, and 81.7% of the regions are characterized by medium and strong persistence in the Hurst index, concentrated on both sides of the Tarim River.
- (4)
- Human activities are the main driving factor for the improvement of vegetation coverage in the Alar Reclamation area; among the natural factors, precipitation is the most important factor affecting the vegetation growth in the research area, because the climate in the research area is mainly arid, with temperature having little influence.
- (5)
- There is a remote sensing image with long time span and multiresolution on the Google Earth Engine cloud platform, leading to a strong analytical and calculation ability with low time consumption. It is an effective tool to achieve monitoring of vegetation coverage at different scales.
Author Contributions
Funding
Institutional Review Board Statement
Informed Consent Statement
Data Availability Statement
Acknowledgments
Conflicts of Interest
References
- Zhang, Y.; Ye, A. Spatial and temporal variations in vegetation coverage observed using AVHRR GIMMS and Terra MODIS data in the mainland of China. Int. J. Remote Sens. 2020, 41, 4238–4268. [Google Scholar] [CrossRef]
- Giri, C.; Zhu, Z.; Reed, B. A comparative analysis of the Global Land Cover 2000 and MODIS land cover data sets. Remote Sens. Environ. 2005, 94, 123–132. [Google Scholar] [CrossRef]
- Nemani, R.R.; Keeling, C.D.; Hashimoto, H.; Jolly, W.M.; Piper, S.C.; Tucker, C.J.; Myneni, R.B.; Running, S.W. Climate-driven increases in global terrestrial net primary production from 1982 to 1999. Science 2003, 300, 1560–1563. [Google Scholar] [CrossRef] [PubMed]
- Carlson, T.N.; Ripley, D.A. On the relation between NDVI, fractional vegetation cover, and leaf area index. Remote Sens. Environ. 1997, 62, 241–252. [Google Scholar] [CrossRef]
- Anyamba, A.; Tucker, C.J. Analysis of Sahelian vegetation dynamics using NOAA-AVHRR NDVI data from 1981–2003. J. Arid. Environ. 2005, 63, 596–614. [Google Scholar] [CrossRef]
- Piao, S.; Wang, X.; Ciais, P.; Zhu, B.; Wang, T.; Liu, J. Changes in satellite–derived vegetation growth trend in temperate and boreal Eurasia from 1982 to 2006. Glob. Change Biol. 2011, 17, 3228–3239. [Google Scholar] [CrossRef]
- Tehrany, M.S.; Pradhan, B.; Jebuv, M.N. A comparative assessment between object and pixel-based classification approaches for land use/land cover mapping using SPOT 5 imagery. Geocarto Int. 2014, 29, 351–369. [Google Scholar] [CrossRef]
- Wang, H.; Zhao, X.; Zhang, X.; Wu, D.; Du, X. Long time series land cover classification in China from 1982 to 2015 based on Bi-LSTM deep learning. Remote Sens. 2019, 11, 1639. [Google Scholar] [CrossRef]
- Arias, H.A.; Zamora, R.M.; Bolaños, C.V. Metodología para la corrección atmosférica de imágenes Aster, Rapideye, Spot 2 y Landsat 8 con el módulo Flaash del software ENVI. Rev. Geográfica América Cent. 2014, 2, 39–59. [Google Scholar]
- Shao, Y.; Lunetta, R.S.; Wheeler, B.; Iiames, J.S.; Campbell, J.B. An evaluation of time-series smoothing algorithms for land-cover classifications using MODIS-NDVI multi-temporal data. Remote Sens. Environ. 2016, 174, 258–265. [Google Scholar] [CrossRef]
- Zoungrana, B.J.; Conrad, C.; Thiel, M.; Amekudzi, L.K.; Da, E.D. MODIS NDVI trends and fractional land cover change for improved assessments of vegetation degradation in Burkina Faso, West Africa. J. Arid. Environ. 2018, 153, 66–75. [Google Scholar] [CrossRef]
- Gorelick, N.; Hancher, M.; Dixon, M.; Ilyushchenko, S.; Thau, D.; Moore, R. Google Earth Engine: Planetary-scale geospatial analysis for everyone. Remote Sens. Environ. 2017, 202, 18–27. [Google Scholar] [CrossRef]
- Gong, L.; He, G.; Liu, W. Long-term cropping effects on agricultural sustainability in Alar oasis of Xinjiang, China. Sustainability 2016, 8, 61. [Google Scholar] [CrossRef]
- Li, W.; Jia, S.; He, W.; Raza, S.; Zamanian, K.; Zhao, X. Analysis of the consequences of land-use changes and soil types on organic carbon storage in the Tarim River Basin from 2000 to 2020. Agric. Ecosyst. Environ. 2022, 327, 107824. [Google Scholar] [CrossRef]
- Huang, H.; Chen, Y.; Clinton, N.; Wang, J.; Wang, X.; Liu, C.; Gong, P.; Yang, J.; Bai, Y.; Zheng, Y. Mapping major land cover dynamics in Beijing using all Landsat images in Google Earth Engine. Remote Sens. Environ. 2017, 202, 166–176. [Google Scholar] [CrossRef]
- Li, F.; Chen, W.; Zeng, Y.; Zhao, Q.; Wu, B. Improving estimates of grassland fractional vegetation cover based on a pixel dichotomy model: A case study in Inner Mongolia, China. Remote Sens. 2014, 6, 4705–4722. [Google Scholar] [CrossRef]
- Jiapaer, G.; Chen, X.; Bao, A. A comparison of methods for estimating fractional vegetation cover in arid regions. Agric. For. Meteorol. 2011, 151, 1698–1710. [Google Scholar] [CrossRef]
- Gao, L.; Wang, X.; Johnson, B.A.; Tian, Q.; Wang, Y.; Verrelst, J.; Mu, X.; Gu, X. Remote sensing algorithms for estimation of fractional vegetation cover using pure vegetation index values: A review. ISPRS J. Photogramm. Remote Sens. 2020, 159, 364–377. [Google Scholar] [CrossRef]
- Da Silva, R.M.; Santos, C.A.; Moreira, M.; Corte-Real, J.; Silva, V.C.; Medeiros, I.C. Rainfall and river flow trends using Mann–Kendall and Sen’s slope estimator statistical tests in the Cobres River basin. Nat. Hazards 2015, 77, 1205–1221. [Google Scholar] [CrossRef]
- Leigang, S.; Jianfeng, L.; Quanhong, X. Remote Sensing based temporal and spatial analysis of vegetation cover changes in Bashang Area of Hebei Province. Remote Sens. Nat. Resour. 2014, 26, 167–172. [Google Scholar]
- von Wehrden, H.; Wesche, K. Relationships between climate, productivity and vegetation in southern Mongolian drylands. Basic Appl. Dryland Res. 2007, 1, 100. [Google Scholar] [CrossRef]
- Hájková, P.; Wolf, P.; Hájek, M. Environmental factors and Carpathian spring fen vegetation: The importance of scale and temporal variation. Ann. Bot. Fenn. 2004, 41, 249–262. [Google Scholar]
- Xie, Y.; Qiu, K.; Xu, D.; Shi, X.; Qi, T.; Pott, R. Spatial heterogeneity of soil and vegetation characteristics and soil-vegetation relationships along an ecotone in Southern Mu Us Sandy Land, China. J. Soils Sediments 2015, 15, 1584–1601. [Google Scholar] [CrossRef]
- Gui-gang, W.; Ke-fa, Z.; Li, S.; Yan-fang, Q.; Xue-mei, L. Study on the vegetation dynamic change and R/S analysis in the past ten years in Xinjiang. Remote Sens. Technol. Appl. 2011, 25, 84–90. [Google Scholar]
- Kalisa, W.; Igbawua, T.; Henchiri, M.; Ali, S.; Zhang, S.; Bai, Y.; Zhang, J. Assessment of climate impact on vegetation dynamics over East Africa from 1982 to 2015. Sci. Rep. 2019, 9, 1–20. [Google Scholar]
- Ying, L.; Enke, H.; Hui, Y. Dynamic monitoring and trend analysis of vegetation change in Shendong mining area based on MODIS. Remote Sens. Nat. Resour. 2017, 29, 132–137. [Google Scholar]
- Schulz, J.J.; Cayuela, L.; Rey-Benayas, J.M.; Schröder, B. Factors influencing vegetation cover change in Mediterranean Central Chile (1975–2008). Appl. Veg. Sci. 2011, 14, 571–582. [Google Scholar] [CrossRef]
- Feike, T.; Mamitimin, Y.; Li, L.; Doluschitz, R. Development of agricultural land and water use and its driving forces along the Aksu and Tarim River, PR China. Environ. Earth Sci. 2015, 73, 517–531. [Google Scholar] [CrossRef]
- Zhang, Z.; Xia, F.; Yang, D.; Huo, J.; Wang, G.; Chen, H. Spatiotemporal characteristics in ecosystem service value and its interaction with human activities in Xinjiang, China. Ecol. Indic. 2020, 110, 105826. [Google Scholar] [CrossRef]
| Landsat | Sensor | Red Band | Near-Infrared Band | Image Dataset ID | Dataset Availability |
|---|---|---|---|---|---|
| Landsat 5 | ETM | B3 | B4 | LANDSAT/LT05/C01/T1_SR | 1990-03 to 1998-10 |
| Landsat 7 | ETM+ | B3 | B4 | LANDSAT/LE07/C01/T1_SR | 1999-03 to 2012-10 |
| Landsat 8 | OLI/TIRS | B4 | B5 | LANDSAT/LC08/C01/T1_SR | 2013-03 to 2020-10 |
| Levels | FVC (%) | Classification Characteristics |
|---|---|---|
| Ⅰ | <20 | Low vegetation cover (basically no vegetation on the surface, bare soil, bare rock, water, etc.) |
| Ⅱ | 20~40 | Medium–low vegetation cover |
| Ⅲ | 40~60 | Medium vegetation cover |
| Ⅳ | 60~80 | Medium–high vegetation cover |
| Ⅴ | ≥80 | High vegetation cover |
| CV Variation Range | Degree of Variation | Number of Pixels | Image Area as a Percentage |
|---|---|---|---|
| 0 < CV ≤ 0.2 | Stable | 12,263,553 | 23.82% |
| 0.2 ≤ CV < 0.5 | Relatively stable | 22,340,090 | 43.40% |
| 0.5 ≤ CV < 0.8 | Weakly variable | 11,477,889 | 22.30% |
| 0.8 ≤ CV < 2.13 | Highly variable | 5,396,171 | 10.48% |
| H Value Range | Number of Pixels | Image Area as a Percentage |
|---|---|---|
| 0 < H < 0.4 | 2,483,059 | 5.7% |
| 0.4 < H < 0.5 | 5,537,241 | 12.6% |
| 0.5 < H < 0.6 | 8,140,309 | 18.5% |
| 0.6 < H < 0.7 | 11,019,379 | 25.1% |
| 0.7 < H < 0.8 | 10,202,826 | 23.2% |
| 0.8 < H < 1 | 6,540,831 | 14.9% |
| Grassland | Cropland | Bare | Artificial Surface | Forests | Wetlands | Water Bodies | |
|---|---|---|---|---|---|---|---|
| Area of different land use types in 2000/(km2) | 745.88 | 2257.67 | 1379.38 | 81.97 | 33.10 | 94.30 | 237.39 |
| Area of different land use types in 2020/(km2) | 385.78 | 2028.55 | 904.69 | 71.00 | 15.63 | 41.51 | 142.97 |
| Area transfer difference/(km2) | 360.1 | 229.12 | 474.69 | 10.97 | 17.47 | 52.79 | 94.42 |
Disclaimer/Publisher’s Note: The statements, opinions and data contained in all publications are solely those of the individual author(s) and contributor(s) and not of MDPI and/or the editor(s). MDPI and/or the editor(s) disclaim responsibility for any injury to people or property resulting from any ideas, methods, instructions or products referred to in the content. |
© 2023 by the authors. Licensee MDPI, Basel, Switzerland. This article is an open access article distributed under the terms and conditions of the Creative Commons Attribution (CC BY) license (https://creativecommons.org/licenses/by/4.0/).
Share and Cite
Li, X.; Shi, Z.; Yu, J.; Liang, J. Study on the Change in Vegetation Coverage in Desert Oasis and Its Driving Factors from 1990 to 2020 Based on Google Earth Engine. Appl. Sci. 2023, 13, 5394. https://doi.org/10.3390/app13095394
Li X, Shi Z, Yu J, Liang J. Study on the Change in Vegetation Coverage in Desert Oasis and Its Driving Factors from 1990 to 2020 Based on Google Earth Engine. Applied Sciences. 2023; 13(9):5394. https://doi.org/10.3390/app13095394
Chicago/Turabian StyleLi, Xu, Ziyan Shi, Jun Yu, and Jiye Liang. 2023. "Study on the Change in Vegetation Coverage in Desert Oasis and Its Driving Factors from 1990 to 2020 Based on Google Earth Engine" Applied Sciences 13, no. 9: 5394. https://doi.org/10.3390/app13095394
APA StyleLi, X., Shi, Z., Yu, J., & Liang, J. (2023). Study on the Change in Vegetation Coverage in Desert Oasis and Its Driving Factors from 1990 to 2020 Based on Google Earth Engine. Applied Sciences, 13(9), 5394. https://doi.org/10.3390/app13095394


