
Terahertz Time-Domain Spectroscopy of Glioma Patient Blood Plasma: Diagnosis and Treatment
 , , , , , ,
  , ,
, ,
Abstract
:1. Introduction
- The dysregulation of the signaling pathway implemented through growth factors based on the amplification and mutation of tyrosine kinase receptors (TKRs). TKRs present a heterogeneous group of membrane proteins interacting with epithelial growth factor, vascular endothelial growth factor, and platelet growth factor. TRKs also interact with cytokines, hormones, and other signaling systems;
- The activation of phosphotidylinositol-3-OH kinase (PI3K)/AKT/mTOR the intracellular signaling pathway ensures cell survival under certain conditions;
- The inactivation of P53 protein and retinoblastoma suppression pathways;
- Ras/Raf/MEK/ERK signaling pathway;
- The regulation of cellular responses by protein kinase C (PKC), including protein secretion, gene expression, and cell proliferation;
- Cell progression through pRB pathway suppression;
- O6-methylguanine-DNA methyltransferase (MGMT);
- TGF-β signaling [19].
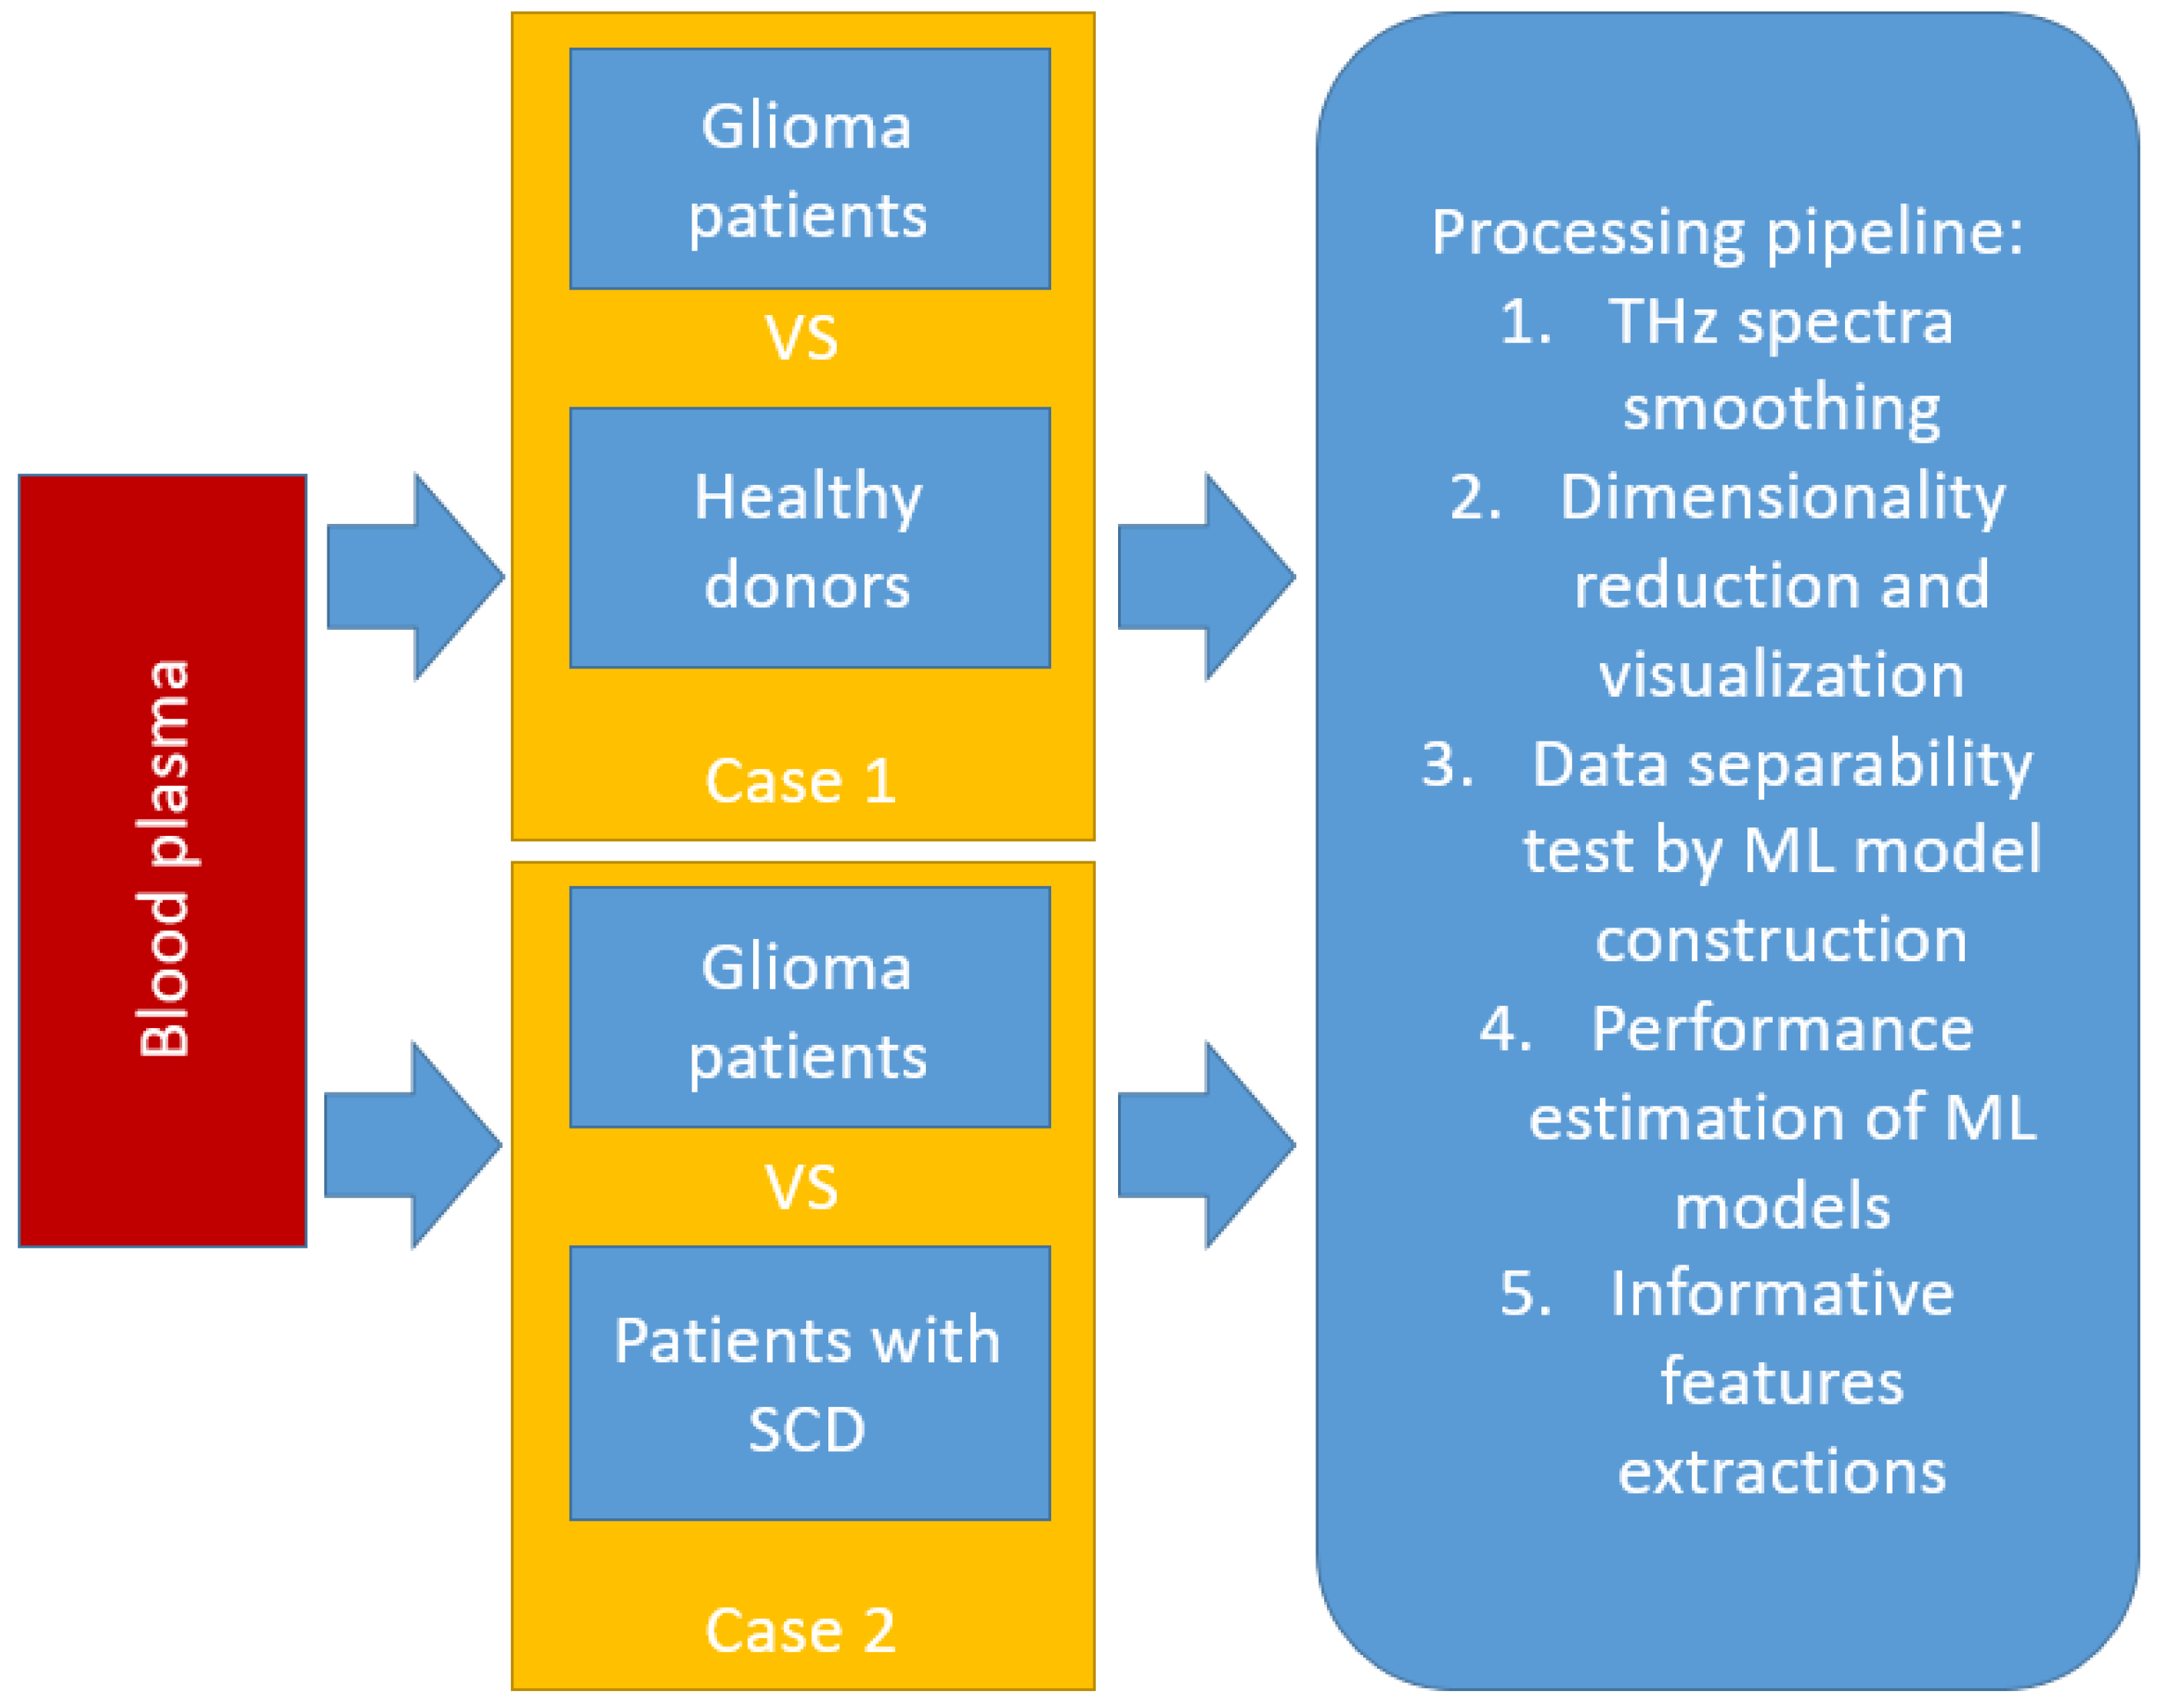
2. Materials and Methods
2.1. Samples
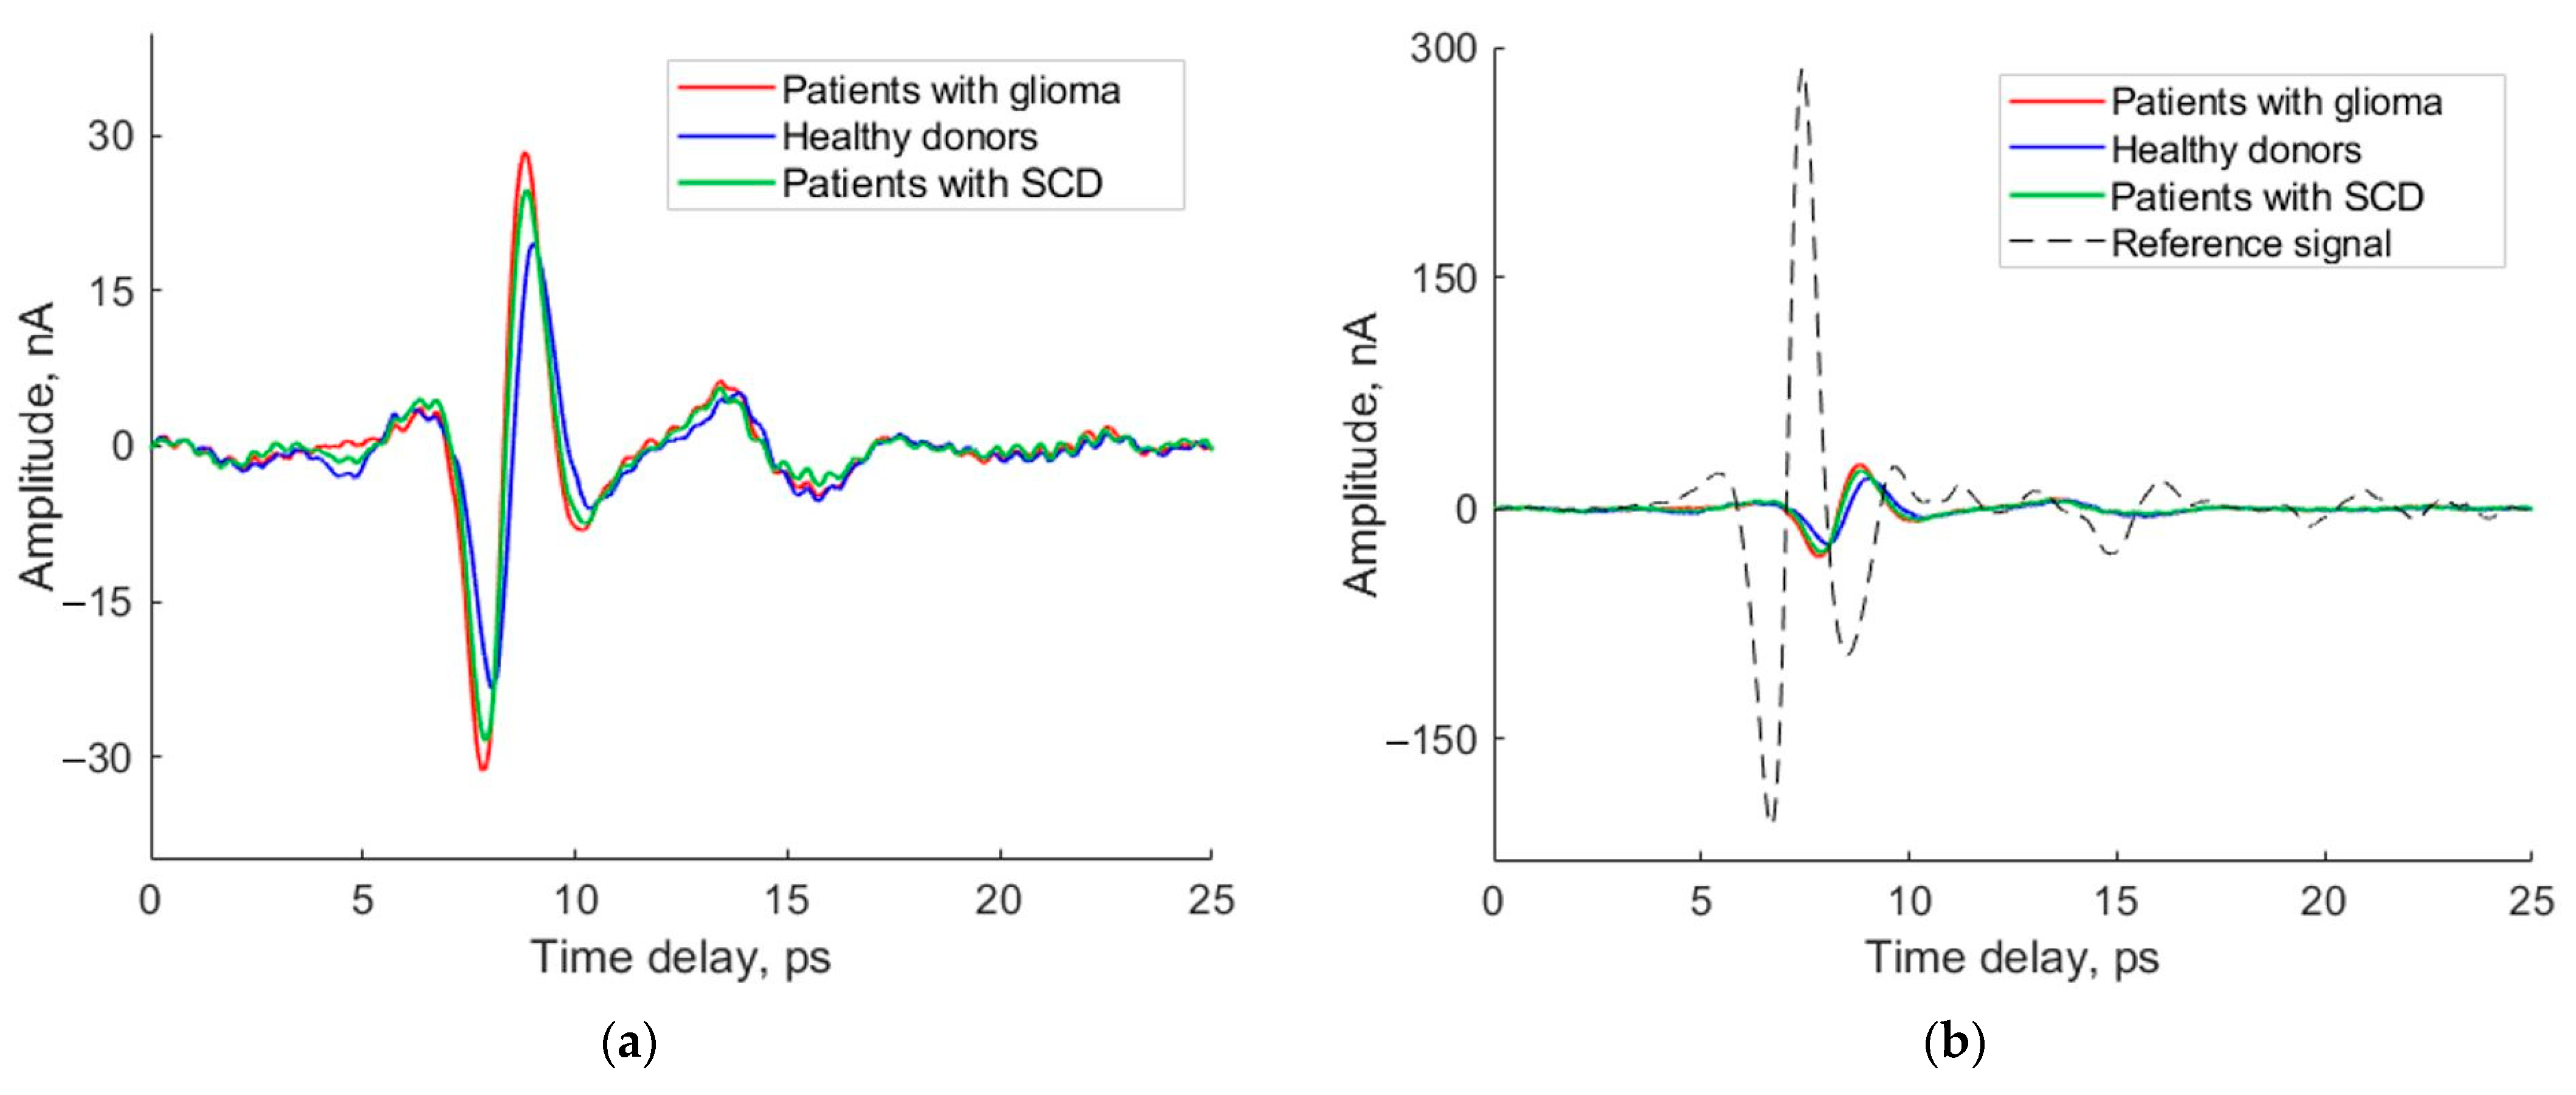
2.2. THz Spectroscopy
2.3. Machine Learning Methods
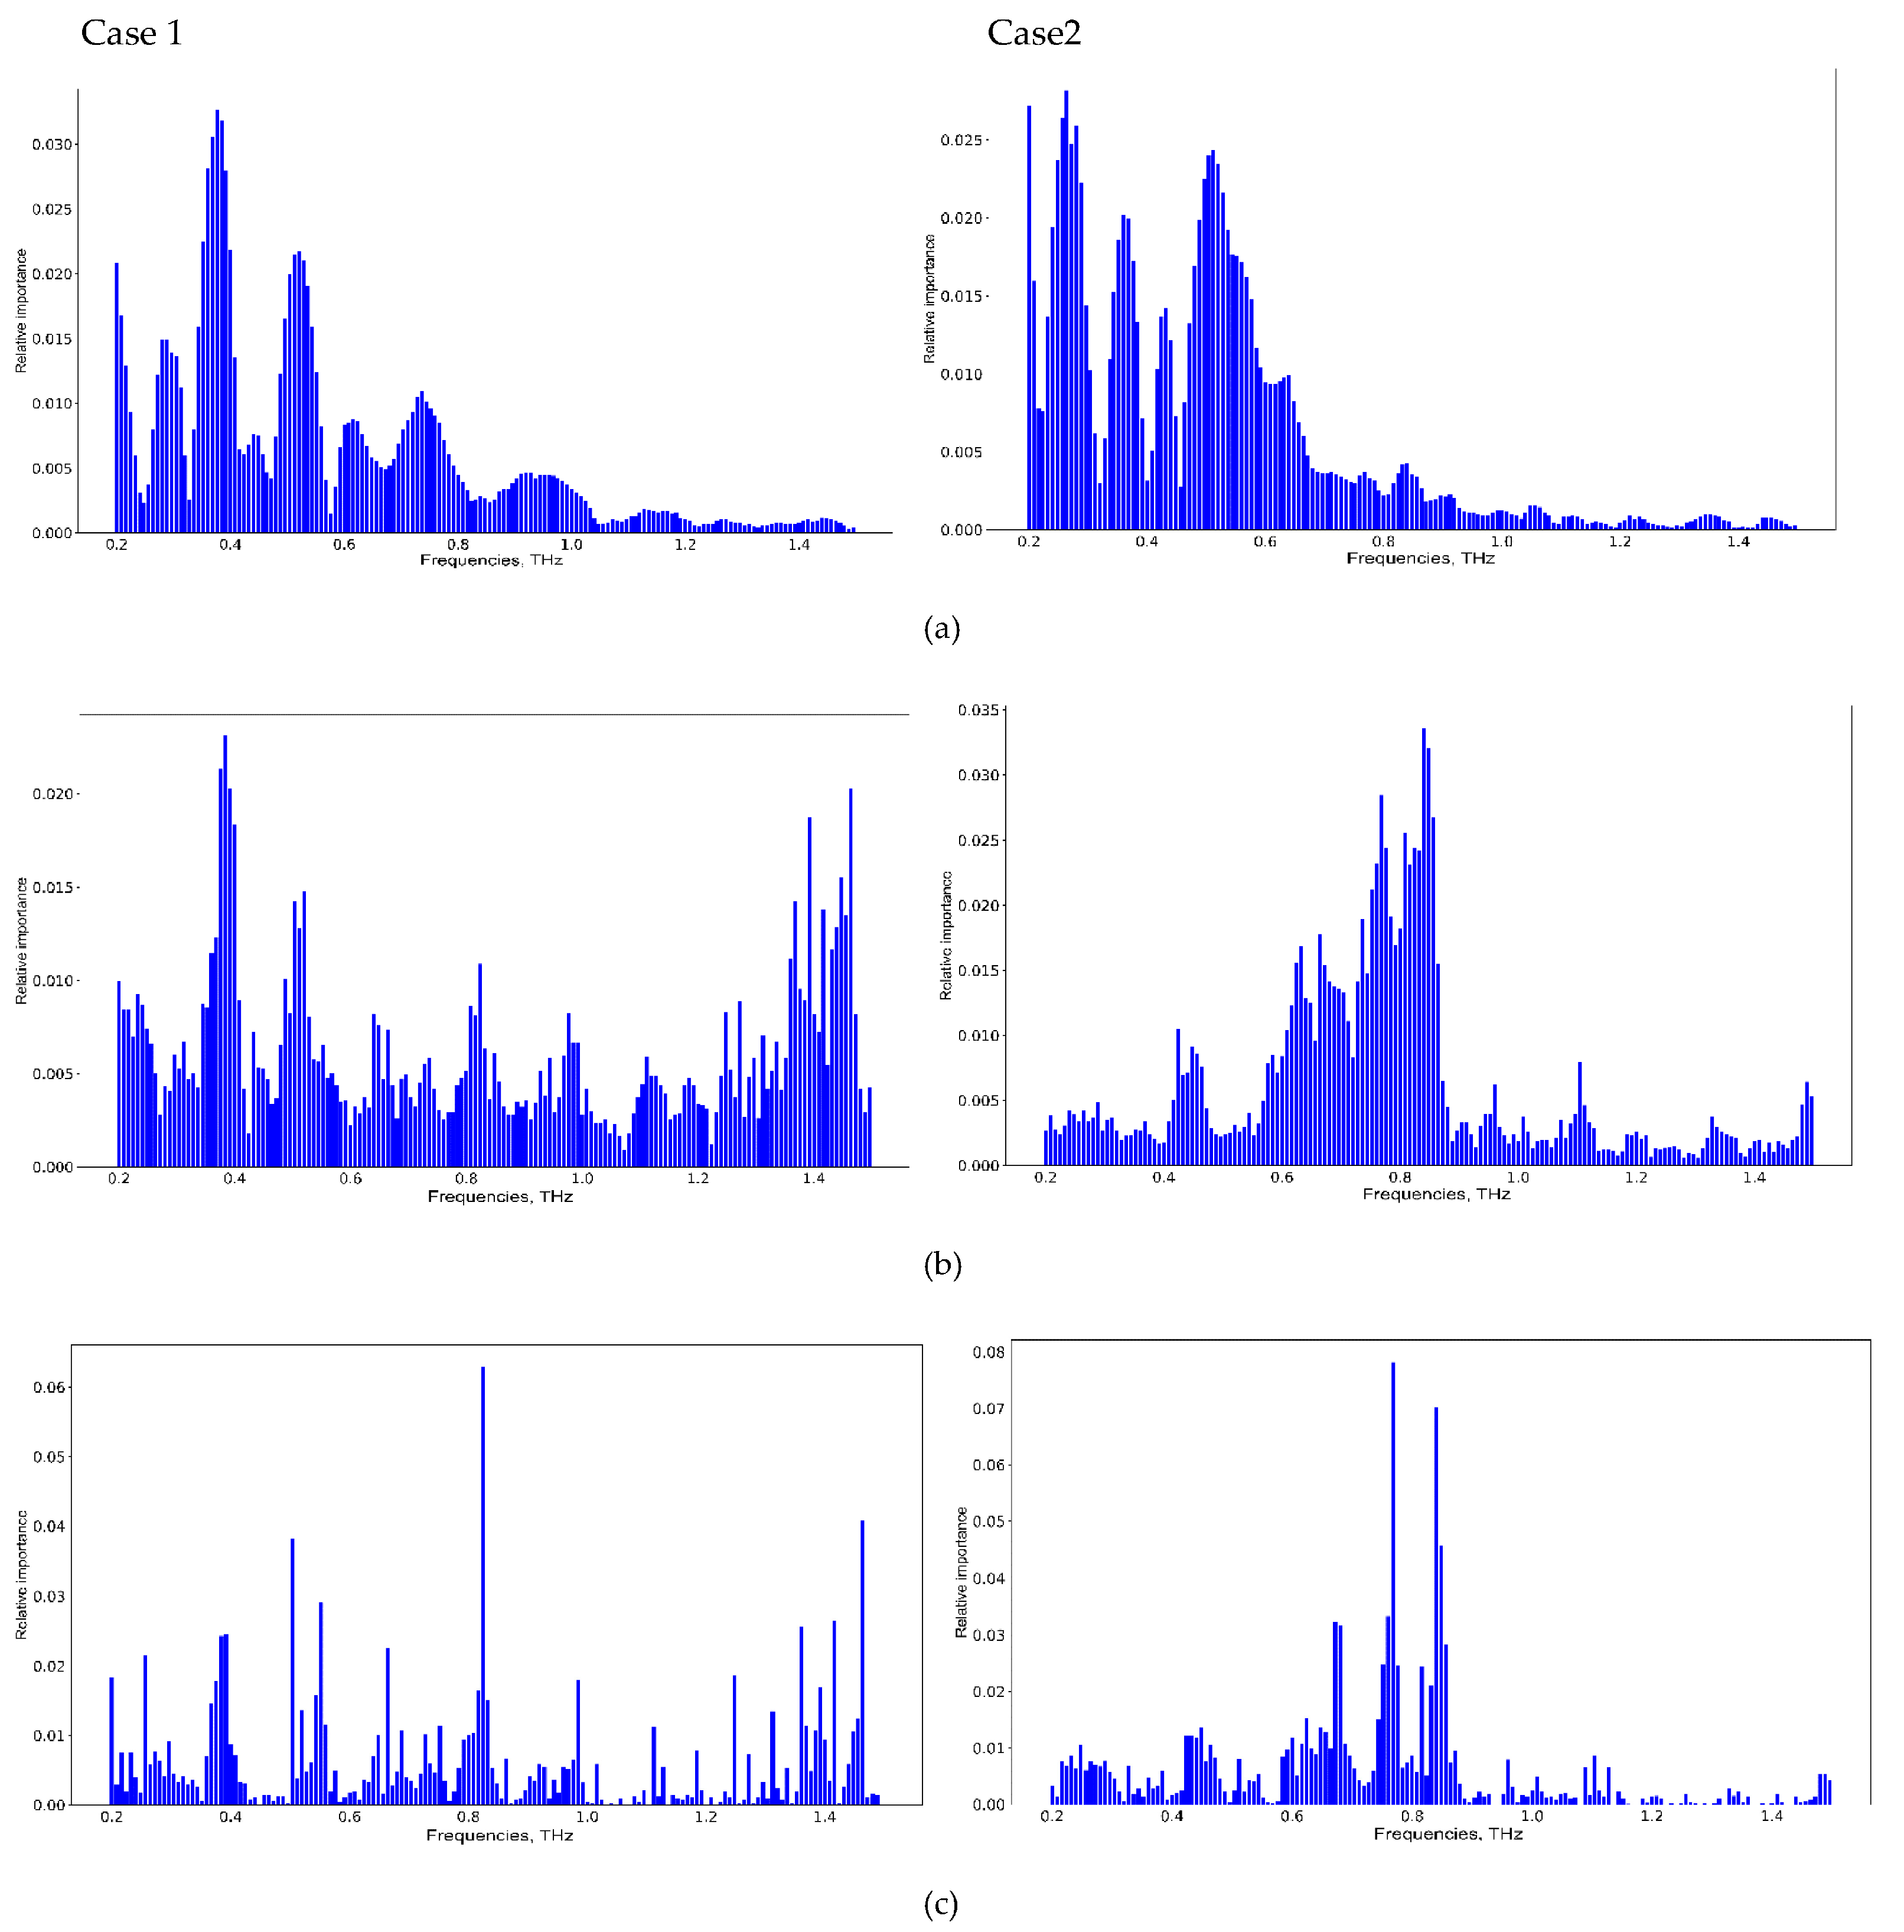
3. Results
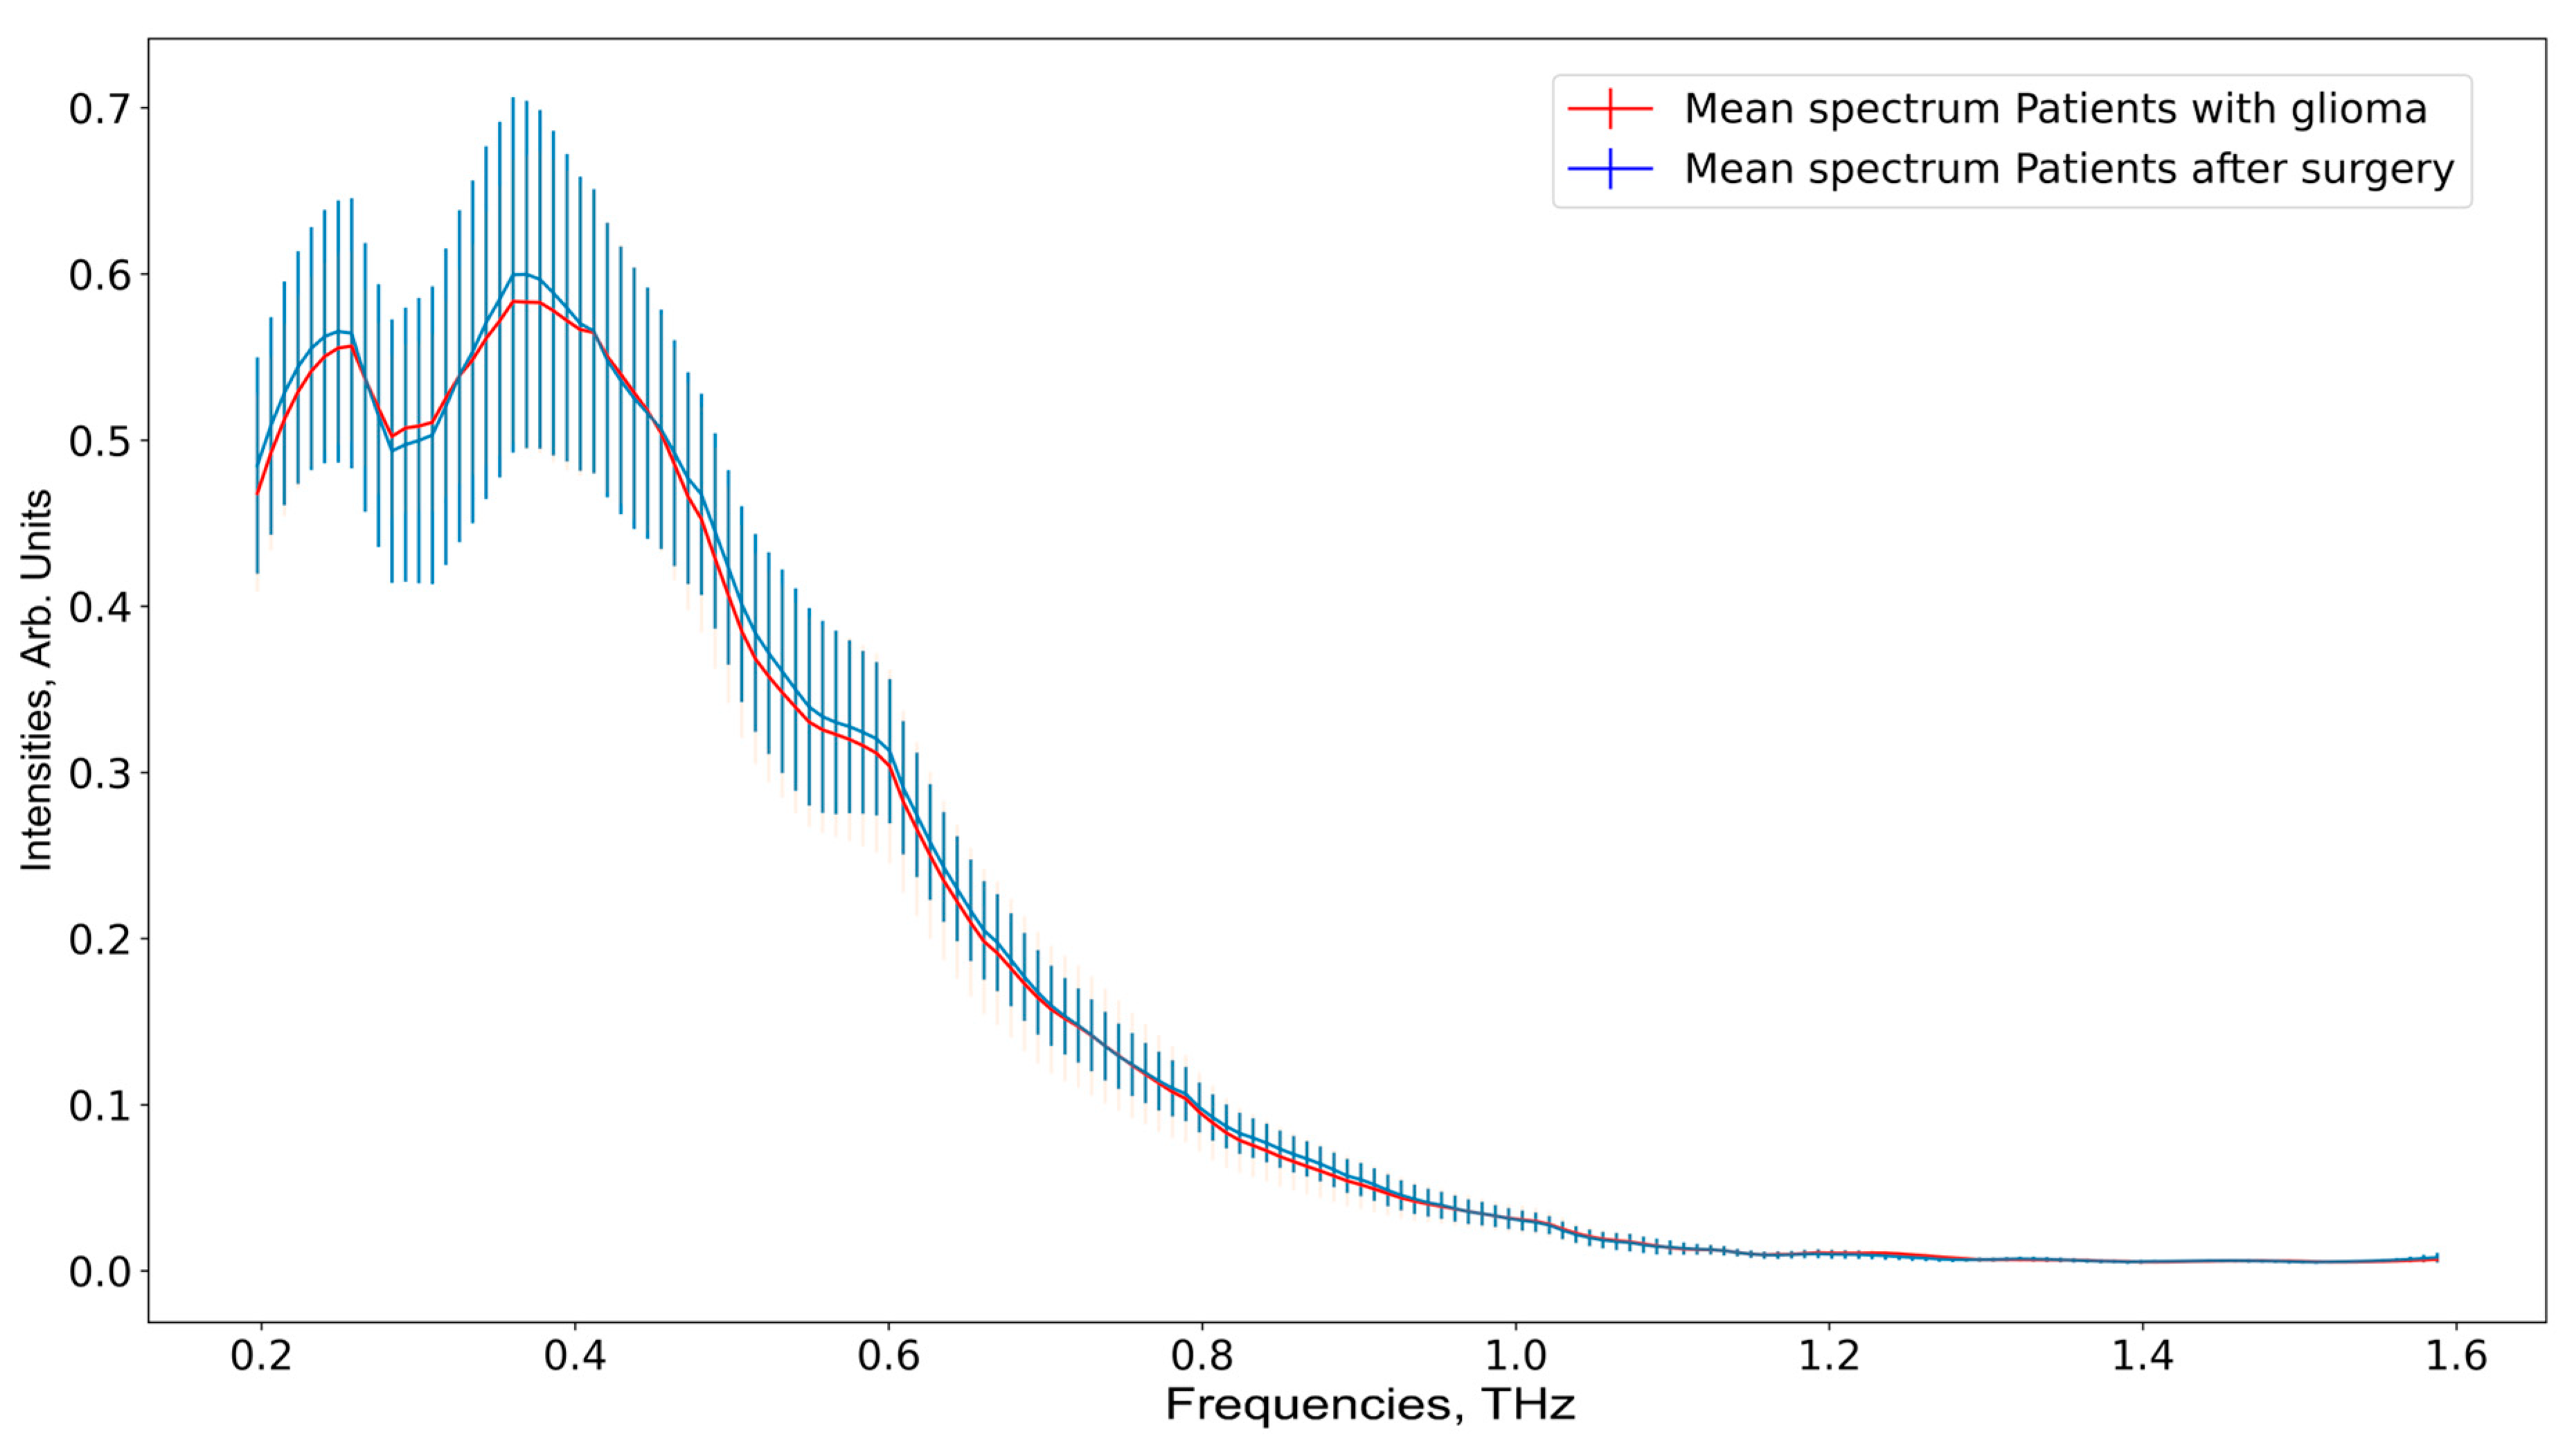
4. Discussion
5. Conclusions
Supplementary Materials
Author Contributions
Funding
Institutional Review Board Statement
Informed Consent Statement
Data Availability Statement
Conflicts of Interest
References
- Ferlay, J.; Colombet, M.; Soerjomataram, I.; Parkin, D.M.; Piñeros, M.; Znaor, A.; Bray, F. Cancer statistics for the year 2020: An overview. Int. J. Cancer 2021. [Google Scholar] [CrossRef] [PubMed]
- Louis, D.N.; Perry, A.; Wesseling, P.; Brat, D.J.; Cree, I.A.; Figarella-Branger, D.; Hawkins, C.; Ng, H.K.; Pfister, S.M.; Reifenberger, G.; et al. The 2021 WHO Classification of Tumors of the Central Nervous System: A summary. Neuro Oncol. 2021, 23, 1231–1251. [Google Scholar] [CrossRef]
- Ostrom, Q.T.; Price, M.; Neff, C.; Cioffi, G.; Waite, K.A.; Kruchko, C.; Barnholtz-Sloan, J.S. CBTRUS Statistical Report: Primary Brain and Other Central Nervous System Tumors Diagnosed in the United States in 2015–2019. Neuro-Oncology 2022, 24, v1–v95. [Google Scholar] [CrossRef] [PubMed]
- Agnihotri, S.; Burrell, K.E.; Wolf, A.; Jalali, S.; Hawkins, C.; Rutka, J.T.; Zadeh, G. Glioblastoma, a brief review of history, molecular genetics, animal models and novel therapeutic strategies. Arch. Immunol. Ther. Exp. 2013, 61, 25–41. [Google Scholar] [CrossRef] [PubMed]
- Tykocki, T.; Eltayeb, M. Ten-year survival in glioblastoma. A systematic review. J. Clin. Neurosci. 2018, 54, 7–13. [Google Scholar] [CrossRef]
- Torp, S.H.; Solheim, O.; Skjulsvik, A.J. The WHO 2021 Classification of Central Nervous System tumours: A practical update on what neurosurgeons need to know-a minireview. Acta Neurochir. 2022, 164, 2453–2464. [Google Scholar] [CrossRef] [PubMed]
- Carrete, L.R.; Young, J.S.; Cha, S. Advanced Imaging Techniques for Newly Diagnosed and Recurrent Gliomas. Front. Neurosci. 2022, 16, 787755. [Google Scholar] [CrossRef] [PubMed]
- Auer, T.A. Advanced MR techniques in glioblastoma imaging—Upcoming challenges and how to face them. Eur. Radiol. 2021, 31, 6652–6654. [Google Scholar] [CrossRef]
- Bernstock, J.D.; E Gary, S.; Klinger, N.; A Valdes, P.; Ibn Essayed, W.; E Olsen, H.; Chagoya, G.; Elsayed, G.; Yamashita, D.; Schuss, P.; et al. Standard clinical approaches and emerging modalities for glioblastoma imaging. Neuro-Oncol. Adv. 2022, 4, vdac080. [Google Scholar] [CrossRef]
- Rucco, M.; Viticchi, G. Fast Glioblastoma Detection in Fluid-attenuated inversion recovery (FLAIR) images by Topological Explainable Automatic Machine Learning. arXiv 2020, arXiv:1912.08167v4. [Google Scholar]
- Mărginean, L.; Ștefan, P.A.; Lebovici, A.; Opincariu, I.; Csutak, C.; Lupean, R.A.; Coroian, P.A.; Suciu, B.A. CT in the Differentiation of Gliomas from Brain Metastases: The Radiomics Analysis of the Peritumoral Zone. Brain Sci. 2022, 12, 109. [Google Scholar] [CrossRef]
- Swanson, K.R.; Chakraborty, G.; Wang, C.H.; Rockne, R.; Harpold, H.L.P.; Muzi, M.; Adamsen, T.C.H.; Krohn, K.A.; Spence, A.M. Complementary but distinct roles for MRI and 18F-Fluoromisonidazole PET in the assessment of human glioblastomas. J. Nucl. Med. 2009, 50, 36–44. [Google Scholar] [CrossRef]
- Ulutin, C.; Fayda, M.; Aksu, G.; Cetinayak, O.; Kuzhan, O.; Ors, F.; Beyzadeoglu, M. Primary glioblastoma multiforme in youngers patients: A single-instruction experience. Tumori 2006, 92, 407–411. [Google Scholar] [CrossRef]
- Powell, R.T.; Olar, A.; Narang, S.; Rao, G.; Sulman, E.; Fuller, G.N.; Rao, A. Identification of Histological Correlates of Overall Survival in Lower Grade Gliomas Using a Bag-of-words Paradigm: A Preliminary Analysis Based on Hematoxylin & Eosin Stained Slides from the Lower Grade Glioma Cohort of The Cancer Genome Atlas. J. Pathol. Inform. 2017, 8, 9. [Google Scholar]
- Kruchko, C.; Gittleman, H.; Ruhl, J.; Hofferkamp, J.; Ward, E.M.; Ostrom, Q.T.; Sherman, R.L.; Jones, S.F.; Barnholtz-Sloan, J.S.; Wilson, R.J. Cancer collection efforts in the United States provide clinically relevant data on all primary brain and other CNS tumors. Neurooncol. Pract. 2019, 6, 330–339. [Google Scholar] [CrossRef]
- Furnari, F.B.; Fenton, T.; Bachoo, R.M.; Mukasa, A.; Stommel, J.M.; Stegh, A.; Hahn, W.C.; Ligon, K.L.; Louis, D.N.; Brennan, C.; et al. Malignant astrocytic glioma: Genetics, biology, and paths to treatment. Genes Dev. 2007, 21, 2683–2710. [Google Scholar] [CrossRef] [PubMed]
- Pearson, J.R.D.; Regad, T. Targeting cellular pathways in glioblastoma multiforme. Signal Transduct. Target. Ther. 2017, 2, e17040. [Google Scholar] [CrossRef]
- Mohan, A.A.; Tomaszewski, W.H.; Haskell-Mendoza, A.P.; Hotchkiss, K.M.; Singh, K.; Reedy, J.L.; Fecci, P.E.; Sampson, J.H.; Khasraw, M. Targeting Immunometabolism in Glioblastoma. Front. Oncol. 2021, 11, 696402. [Google Scholar] [CrossRef] [PubMed]
- Han, J.; Alvarez-Breckenridge, C.A.; Wang, Q.E.; Yu, J. TGF-beta signaling and its targeting for glioma treatment. Am. J. Cancer Res. 2015, 5, 945–955. [Google Scholar] [PubMed]
- Peng, Y.; Shi, C.; Kistenev, Y.V.; Vrazhnov, D.A.; Cherkasova, O.P. Indirect Imaging. In Advances in Brain Imaging Techniques; Mazumder, N., Gangadharan, G., Kistenev, Y.V., Eds.; Springer: Singapore, 2022. [Google Scholar]
- Lone, S.N.; Nisar, S.; Masoodi, T.; Singh, M.; Rizwan, A.; Hashem, S.; El-Rifai, W.; Bedognetti, D.; Batra, S.K.; Haris, M.; et al. Liquid biopsy: A step closer to transform diagnosis, prognosis and future of cancer treatments. Mol. Cancer 2022, 21, 79. [Google Scholar] [CrossRef] [PubMed]
- Ronvaux, L.; Riva, M.; Coosemans, A.; Herzog, M.; Rommelaere, G.; Donis, N.; D’Hondt, L.; Douxfils, J. Liquid Biopsy in Glioblastoma. Cancers 2022, 14, 3394. [Google Scholar] [CrossRef]
- Cherkasova, O.; Peng, Y.; Konnikova, M.; Kistenev, Y.; Shi, C.; Vrazhnov, D.; Shevelev, O.; Zavjalov, E.; Kuznetsov, S.; Shkurinov, A. Diagnosis of Glioma Molecular Markers by Terahertz Technologies. Photonics 2021, 8, 22. [Google Scholar] [CrossRef]
- Bi, J.; Chowdhry, S.; Wu, S.; Zhang, W.; Masui, K.; Mischel, P.S. Altered cellular metabolism in gliomas—An emerging landscape of actionable co-dependency targets. Nat. Rev. Cancer 2020, 20, 57–70. [Google Scholar] [CrossRef] [PubMed]
- Ali, H.; Harting, R.; de Vries, R.; Ali, M.; Wurdinger, T.; Best, M.G. Blood-Based Biomarkers for Glioma in the Context of Gliomagenesis: A Systematic Review. Front. Oncol. 2021, 11, 665235. [Google Scholar] [CrossRef]
- Chen, W.; Peng, Y.; Jiang, X.; Zhao, J.; Zhao, H.; Zhu, Y. Isomers Identification of 2-hydroxyglutarate acid disodium salt (2HG) by Terahertz Time-domain Spectroscopy. Sci. Rep. 2017, 7, 12166. [Google Scholar] [CrossRef] [PubMed]
- Gezimati, M.; Singh, G. Advances in terahertz technology for cancer detection applications. Opt. Quantum Electron. 2023, 55, 151. [Google Scholar] [CrossRef]
- Tian, K.V.; Yang, B.; Yue, Y.; Bowron, D.T.; Mayers, J.; Donnan, R.S.; Dobó-Nagy, C.; Nicholson, J.W.; Fang, D.C.; Greer, A.L.; et al. Atomic and vibrational origins of mechanical toughness in bioactive cement during setting. Nat. Commun. 2015, 6, 8631. [Google Scholar] [CrossRef]
- Song, F.V.; Yang, B.; Di Tommaso, D.; Donnan, R.S.; Chass, G.A.; Yada, R.Y.; Farrar, D.H.; Tian, K.V. Resolving nanoscopic structuring and interfacial THz dynamics in setting cements. Mater. Adv. 2022, 3, 4982–4990. [Google Scholar] [CrossRef]
- Smolyanskaya, O.; Chernomyrdin, N.; Konovko, A.; Zaytsev, K.; Ozheredov, I.; Cherkasova, O.; Nazarov, M.; Guillet, J.-P.; Kozlov, S.; Kistenev, Y.; et al. Terahertz biopho-tonics as a tool for studies of dielectric and spectral properties of biological tissues and liquids. Prog. Quantum Electron. 2018, 62, 1–77. [Google Scholar] [CrossRef]
- Zaytsev, K.I.; Dolganova, I.N.; Chernomyrdin, N.V.; Katyba, G.M.; Gavdush, A.A.; Cherkasova, O.P.; Komandin, G.A.; Shchedrina, M.A.; Khodan, A.N.; Ponomarev, D.S.; et al. The progress and perspectives of terahertz technology for diagnosis of neoplasms: A review. J. Opt. 2020, 22, 013001. [Google Scholar] [CrossRef]
- Gavdush, A.A.; Chernomyrdin, N.V.; Malakhov, K.M.; Beshplav, S.-I.T.; Dolganova, I.N.; Kosyrkova, A.V.; Nikitin, P.V.; Musina, G.R.; Katyba, G.M.; Reshetov, I.V.; et al. Terahertz spectroscopy of gelatin-embedded human brain gliomas of different grades: A road toward intraoperative THz diagnosis. J. Biomed. Opt. 2019, 24, 027001. [Google Scholar] [CrossRef] [PubMed]
- Peng, Y.; Shi, C.; Wu, X.; Zhu, Y.; Zhuang, S. Terahertz Imaging and Spectroscopy in Cancer Diagnostics: A Technical Review. BME Front. 2020, 2020, 2547609. [Google Scholar] [CrossRef]
- Wu, X.; Tao, R.; Zhang, T.; Liu, X.; Wang, J.; Zhang, Z.; Zhao, X.; Yang, P. Biomedical applications of terahertz spectra in clinical and molecular pathology of human glioma. Spectrochim. Acta Part A Mol. Biomol. Spectrosc. 2023, 285, 121933. [Google Scholar] [CrossRef] [PubMed]
- Wei, L.; Yu, L.; Jiaoqi, H.; Guorong, H.; Yang, Z.; Weiling, F. Application of terahertz spectroscopy in biomolecule detection. Front. Lab. Med. 2019, 2, 127–133. [Google Scholar] [CrossRef]
- Konnikova, M.R.; Cherkasova, O.P.; Nazarov, M.M.; Vrazhnov, D.A.; Kistenev, Y.V.; Titov, S.E.; Kopeikina, E.V.; Shevchenko, S.P.; Shkurinov, A.P. Malignant and benign thyroid nodule differentiation through the analysis of blood plasma with terahertz spectroscopy. Biomed. Opt. Express 2021, 12, 1020–1035. [Google Scholar] [CrossRef]
- Kistenev, Y.V.; Teteneva, A.V.; Sorokina, T.V.; Knyazkova, A.I.; Zakharova, O.A.; Cuisset, A.; Vaks, V.L.; Domracheva, E.G.; Chernyaeva, M.B.; Anfert’ev, V.A.; et al. Diagnosis of Diabetes Based on Analysis of Exhaled Air by Terahertz Spectroscopy and Machine Learning. Opt. Spectrosc. 2020, 128, 809–814. [Google Scholar] [CrossRef]
- Lykina, A.A.; Nazarov, M.M.; Konnikova, M.R.; Mustafin, I.A.; Vaks, V.L.; Anfertev, V.A.; Domracheva, E.G.; Chernyaeva, M.B.; Kistenev, Y.V.; Vrazhnov, D.A.; et al. Terahertz spectroscopy of diabetic and non-diabetic human blood plasma pellets. J. Biomed. Opt. 2021, 26, 04300. [Google Scholar] [CrossRef]
- Kistenev, Y.; Borisov, A.; Titarenko, M.; Baydik, O.; Shapovalov, A. Diagnosis of oral lichen planus from analysis of saliva samples using terahertz time-domain spectroscopy and chemometrics. J. Biomed. Opt. 2018, 23, 045001. [Google Scholar] [CrossRef]
- Nazarov, M.M.; Cherkasova, O.P.; Lazareva, E.N.; Bucharskaya, A.B.; Navolokin, N.A.; Tuchin, V.V.; Shkurinov, A.P. A complex study of the peculiarities of blood serum absorption of rats with experimental liver cancer. Opt. Spectrosc. 2019, 126, 721–729. [Google Scholar] [CrossRef]
- Vrazhnov, D.; Knyazkova, A.; Konnikova, M.; Shevelev, O.; Razumov, I.; Zavjalov, E.; Kistenev, Y.; Shkurinov, A.; Cherkasova, O. Analysis of Mouse Blood Serum in the Dynamics of U87 Glioblastoma by Terahertz Spectroscopy and Machine Learning. Appl. Sci. 2022, 12, 10533. [Google Scholar] [CrossRef]
- Wang, Y.; Wang, G.; Xu, D.; Jiang, B.; Ge, M.; Wu, L.; Yang, C.; Mu, N.; Wang, S.; Chang, C.; et al. Terahertz spectroscopic diagnosis of early blast-induced traumatic brain injury in rats. Biomed. Opt. Express 2020, 11, 4085–4098. [Google Scholar] [CrossRef] [PubMed]
- Lv, R.; Wang, Z.; Ma, Y.; Li, W.; Tian, J. Machine Learning Enhanced Optical Spectroscopy for Disease Detection. J. Phys. Chem. Lett. 2022, 13, 9238–9249. [Google Scholar] [CrossRef] [PubMed]
- Hinton, G.E.; Sam, R. Stochastic neighbor embedding. Adv. Neural Inf. Process. Syst. 2002, 15, 833–840. [Google Scholar]
- Van der Maaten, L.; Geoffrey, H. Visualizing data using t-SNE. J. Mach. Learn. Res. 2008, 9, 2579–2605. [Google Scholar]
- Vrazhnov, D.; Mankova, A.; Stupak, E.; Kistenev, Y.; Shkurinov, A.; Cherkasova, O. Discovering Glioma Tissue through Its Biomarkers’ Detection in Blood by Raman Spectroscopy and Machine Learning. Pharmaceutics 2023, 15, 203. [Google Scholar] [CrossRef]
- Uddin, S.; Khan, A.; Hossain, E.; Moni, M.A. Comparing different supervised machine learning algorithms for disease prediction. BMC Med. Inform. Decis. Mak. 2019, 19, 281. [Google Scholar] [CrossRef]
- Hinton, G.; Oriol, V.; Jeff, D. Distilling the knowledge in a neural network. arXiv 2015, arXiv:1503.02531. [Google Scholar]
- Fryer, D.; Strümke, I.; Nguyen, H. Shapley values for feature selection: The good, the bad, and the axioms. IEEE Access 2021, 9, 144352–144360. [Google Scholar] [CrossRef]
- Kumar, I.E.; Venkatasubramanian, S.; Scheidegger, C.; Friedler, S. Problems with Shapley-value-based explanations as feature importance measures. Int. Conf. Mach. Learn. 2020, 119, 5491–5500. [Google Scholar] [CrossRef]
- Hira, Z.M.; Duncan, F.G. A review of feature selection and feature extraction methods applied on microarray data. Adv. Bioinform. 2015, 2015, 198363. [Google Scholar] [CrossRef]
- Chen, C.; Zhang, Q.; Yu, B.; Yu, Z.; Skillman-Lawrence, P.; Ma, Q.; Zhang, Y. Improving protein-protein interactions prediction accuracy using XGBoost feature selection and stacked ensemble classifier. Comput. Biol. Med. 2020, 123, 103899. [Google Scholar] [CrossRef] [PubMed]
- Adeola, O.; Wang, Q. XGBoost model for chronic kidney disease diagnosis. IEEE/ACM Trans. Comput. Biol. Bioinform. 2019, 17, 2131–2140. [Google Scholar]
- Kistenev, Y.V.; Borisov, A.V.; Vrazhnov, D.A. Medical applications of laser molecular imaging and machine learning. Soc. Photo-Opt. Instrum. Eng. 2021, PM333, 252. [Google Scholar]
- Available online: https://www.teravil.lt/t-spec.php (accessed on 20 April 2023).
- Zyatkov, D.O.; Kochnev, Z.S.; Knyazkova, A.I.; Borisov, A.V. Analysis of the Spectral Characteristics of Promising Liquid Carriers in the Terahertz Spectral Range. Russ. Phys. J. 2019, 62, 400–405. [Google Scholar] [CrossRef]
- Wang, X.-W.; Liu, Y.-Y. Comparative study of classifiers for human microbiome data. Med. Microecol. 2020, 4, 100013. [Google Scholar] [CrossRef] [PubMed]
- Hamerla, G.; Meyer, H.-J.; Schob, S.; Ginat, D.T.; Altman, A.; Lim, T.; Gihr, G.A.; Horvath-Rizea, D.; Hoffmann, K.-T.; Surov, A. Comparison of machine learning classifiers for differentiation of grade 1 from higher gradings in meningioma: A multicenter radiomics study. Magn. Reson. Imaging 2019, 63, 244–249. [Google Scholar] [CrossRef]
- Zebari, R.; AbdulAzeez, A.; Zeebaree, D.; Zebari, D.; Saeed, J. A comprehensive review of dimensionality reduction techniques for feature selection and feature extraction. J. Appl. Sci. Technol. Trends 2020, 1, 56–70. [Google Scholar] [CrossRef]
- Da Silva, A.M.; Oliveira, F.S.A.D.S.E.; De Brito, P.L.; Silveira, L. Spectral model for diagnosis of acute leukemias in whole blood and plasma through Raman spectroscopy. J. Biomed. Opt. 2018, 23, 107002. [Google Scholar] [CrossRef]
- Bettegowda, C.; Sausen, M.; Leary, R.J.; Kinde, I.; Wang, Y.; Agrawal, N.; Bartlett, B.R.; Wang, H.; Luber, B.; Alani, R.M.; et al. Detection of circulating tumor DNA in early- and late-stage human malignancies. Sci. Transl. Med. 2014, 6, 224ra24. [Google Scholar] [CrossRef]
- Park, H.; Son, J.H. Machine Learning Techniques for THz Imaging and Time-Domain Spectroscopy. Sensors 2021, 21, 1186. [Google Scholar] [CrossRef]
- Sun, Z.; Wu, X.; Tao, R.; Zhang, T.; Liu, X.; Wang, J.; Wan, H.; Zheng, S.; Zhao, X.; Zhang, Z.; et al. Prediction of IDH mutation status of glioma based on terahertz spectral data. Spectrochim. Acta Part A Mol. Biomol. Spectrosc. 2023, 295, 122629. [Google Scholar] [CrossRef]
- Alieva, M.; van Rheenen, J.; Broekman, M.L.D. Potential impact of invasive surgical procedures on primary tumor growth and metastasis. Clin. Exp. Metastasis. 2018, 35, 319–331. [Google Scholar] [CrossRef] [PubMed]


| “Window_Length” Value | 5 | 15 | 31 | No Smoothing |
|---|---|---|---|---|
| Average SE of SVM/RF/XGBoost | 0.60/0.62/0.68 | 0.60/0.57/0.58 | 0.70/0.52/0.68 | 0.60/0.57/0.58 |
| Average SP of SVM/RF/XGBoost | 0.47/0.50/0.50 | 0.39/0.47/0.44 | 0.28/0.42/0.42 | 0.60/0.57/0.58 |
| Average ACC of SVM/RF/XGBoost | 0.55/0.57/0.61 | 0.52/0.53/0.53 | 0.54/0.48/0.58 | 0.60/0.57/0.58 |
| Average PR of SVM/RF/XGBoost | 0.65/0.67/0.69 | 0.62/0.64/0.64 | 0.62/0.60/0.66 | 0.60/0.57/0.58 |
| Case Number | Averaged AUC, Linear Kernel SVM | Averaged AUC, RF | Averaged AUC, XGBoost |
|---|---|---|---|
| Case 1 | 0.72 ± 0.3 | 0.82 ± 0.25 | 0.82 ± 0.21 |
| Case 2 | 0.70 ± 0.3 | 0.84 ± 0.20 | 0.81 ± 0.25 |
Disclaimer/Publisher’s Note: The statements, opinions and data contained in all publications are solely those of the individual author(s) and contributor(s) and not of MDPI and/or the editor(s). MDPI and/or the editor(s) disclaim responsibility for any injury to people or property resulting from any ideas, methods, instructions or products referred to in the content. |
© 2023 by the authors. Licensee MDPI, Basel, Switzerland. This article is an open access article distributed under the terms and conditions of the Creative Commons Attribution (CC BY) license (https://creativecommons.org/licenses/by/4.0/).
Share and Cite
Cherkasova, O.; Vrazhnov, D.; Knyazkova, A.; Konnikova, M.; Stupak, E.; Glotov, V.; Stupak, V.; Nikolaev, N.; Paulish, A.; Peng, Y.; et al. Terahertz Time-Domain Spectroscopy of Glioma Patient Blood Plasma: Diagnosis and Treatment. Appl. Sci. 2023, 13, 5434. https://doi.org/10.3390/app13095434
Cherkasova O, Vrazhnov D, Knyazkova A, Konnikova M, Stupak E, Glotov V, Stupak V, Nikolaev N, Paulish A, Peng Y, et al. Terahertz Time-Domain Spectroscopy of Glioma Patient Blood Plasma: Diagnosis and Treatment. Applied Sciences. 2023; 13(9):5434. https://doi.org/10.3390/app13095434
Chicago/Turabian StyleCherkasova, Olga, Denis Vrazhnov, Anastasia Knyazkova, Maria Konnikova, Evgeny Stupak, Vadim Glotov, Vyacheslav Stupak, Nazar Nikolaev, Andrey Paulish, Yan Peng, and et al. 2023. "Terahertz Time-Domain Spectroscopy of Glioma Patient Blood Plasma: Diagnosis and Treatment" Applied Sciences 13, no. 9: 5434. https://doi.org/10.3390/app13095434