Article

Aging of PA12 Powder in Powder Bed Fusion

Dipartimento di Ingegneria Civile e Meccanica, Università degli Studi di Cassino e del Lazio Meridionale, Via G. di Biasio 43, 03043 Cassino, Italy
*
Author to whom correspondence should be addressed.
Appl. Sci. 2023, 13(9), 5599; https://doi.org/10.3390/app13095599
Submission received: 15 February 2023 / Revised: 26 April 2023 / Accepted: 27 April 2023 / Published: 1 May 2023
(This article belongs to the Special Issue Advanced Materials for Polymeric 3D Printing Applications)

Abstract

:
Powder Bed Fusion (PBF) is a popular additive manufacturing technology due to its high build resolution and ability to produce microscale geometries without the use of additional support. Despite the many benefits of PBF, there are still some limitations associated with the materials to be built. A critical industrial limit is the aging of PA12 powder, which is the degradation of its physical and chemical properties due to high temperatures and long building cycles of the powder that is not directly fused into the final part but supports the part under construction. This powder is now being used to make another part in order to reduce manufacturing costs. The mechanical properties of the built parts are reduced due to the reused powder. The current study aims to characterize powder aging using experimental tests such as Differential Scanning Calorimetry, Dynamic Mechanical Analysis, and Thermogravimetric Analysis to define the physical and chemical parameters of the powder that will be used inside a simulation software to optimize the process.

1. Introduction

The first layer-by-layer additive manufacturing technique dates from 1986 [1,2]. Generally, traditional technologies do not allow obtaining the same level of geometry that is generally manufactured in a very short time through the additive approach.
Layered additive manufacturing systems include powder bed fusion (PBF), where the designed geometry is produced using a laser source that fuses a thermoplastic powder. In this way, the non-fused powder acts as support, reducing process time and raw material consumption. Moreover, PBF technology allows the adoption of a broad range of metals and plastics [3].
There are several studies focusing on the design and optimization of support structures in AM processes. Considering the design, there are three aspects in PBF that are of crucial importance for strategic decisions in order to adapt AM: firstly, due to the layer-by-layer fabrication of products, design complexities are no longer an obstacle at the production level, and thus the functionality of products is not sacrificed by processing and production limitations. Furthermore, designers would be able to consolidate the product into a single object, free from the multiple assemblies that must be present in conventional technologies. This would directly translate into a reduction in overall weight, waste, resources, and energy, while increasing product functionality. Secondly, PBF’s high level of design flexibility would offer manufacturers a valuable window of opportunity to instantly change product design. This is a valuable opportunity for manufacturers whose product designs need to be revised or completely redesigned in the final stage, right before market launch. Thirdly, the PBF design features allow for high levels of customization according to customer needs and requirements. The ability to reduce the overall number of parts made with complicated geometric designs, which is the ultimate goal in some sensitive industries such as aerospace, the reduction of the need for large supplies of raw materials, high material efficiency compared to traditional processes, on-demand production of spare parts, and environmental benefits such as a low carbon footprint are some of the most important features of PBF in terms of sustainability and advantages over traditional manufacturing [4].
Using this technology involves a reduction in production costs by reusing the powder; a ratio between used and virgin powder of about 70/30 is commonly adopted [5]. Nevertheless, thermal cycles, which affect reused powder, influence negatively the chemical and physical properties of the fused part [6].
Polyamide-12 represents one of the most used thermoplastic materials for PBF. In particular, the broad range between the temperature at which melting starts and the temperature at which crystallization begins, associated with the melting point at about 180 °C, makes PA12 a material very suitable for PBF manufacturing. The powder is melted by a laser beam, after which a cooling phase begins, leading to minimal deformation [7].
Mechanical properties of built products vary greatly in the PBF building process and are affected by a wide range of process variables. The implementation of technology for structural part production is complicated.
It was recently demonstrated that the orientation of the fabrication within the build volume, as well as its thickness, have a significant influence on the mechanical properties of PA12 fused parts. Sindinger et al. investigated why workpieces oriented differently within the build volume exhibit different mechanical performances [8].
However, the applicability of 3D building technology remains relatively limited due to its low cost-effectiveness and high variability of part sizes and mechanical properties. Among the various 3D building technologies, PBF has proven to be superior in the manufacture of automotive parts with material flexibility and without support. A limitation of the PBF building process is dimensional errors due to thermomechanical deformation. These dimensional errors result from numerous factors, such as material properties, temperature control, and the inherent PBF technology, which affect the shrinkage of horizontal layers and vertical bending deformation. In addition, layer height and powder size are also dimensional error factors in PBF. Although builder manufacturers suggest that the quality of 3D-built samples can be better controlled by placing them in the center of the builder within two-thirds of the entire space, these recommendations limit operational management plans by increasing processing time and costs. In addition, practitioners are recommended to use a range of constant scaling factors (SF) during the three-dimensional building (3DP) process to compensate for dimensional inaccuracy and shrinkage [9].
It appears in the literature that the deviations from the nominal were lower in the samples built at 0° than in the samples built at 90°; those deviations need to be minimized in order to reduce their transfer to assembly products [10,11,12,13].
As a result, it is estimated that only 10% of the powder used in a build cycle is fused. To reduce building costs, it is recommended that powder be reused for subsequent build cycles. Dadbakhsh et al. conducted extensive research on the reuse of the powder, its modifications, and performance changes [14].
The aging of PA12 powders is due to thermal oxidation reactions accompanied by chain cross-linking, chain scission, and post-condensation. Studies show that the surface morphology, microstructure, thermochemical properties, and fluidity of aged powders vary compared to virgin powders, while the size distribution remains unchanged. The microstructure of components made from aged powders shows coarse spherulites and a degraded surface. Higher energy density in the building process for aged powders can improve the mechanics of molded parts [15].
The degradation of the material depends on the applied laser energy. High values increase deterioration while low values prevent the particles from melting, thus improving the mechanical strength of the molded components; therefore, unused PA12 becomes less effective after several cycles of use [16].
The aging of the powder is mainly due to two causes. The first is related to the crystals that in the virgin powder have a denser and more homogenous shape, while in the aged powder they have a greater spacing. The second is related to the polycondensation in the solid state; the polymer chains grow, leading to an increase in the amorphous phase and therefore to a lower crystallinity of the aged powder. These variations are reflected in a macro-performance analysis of molded components [17,18]; the next step will be focused on the relationships between aging status and the reflected mechanical properties [19,20].
Further research revealed that increasing the molecular weight also increases the powder viscosity [21,22], resulting in an involved effect on the surface finish of the built part, whose skin resembles an orange peel [23].
The goal of this work is to mechanically characterize PA12 molded specimens using virgin or aged powder and then to analyze the PA12 powder to determine the physical and chemical parameter values of the powder in order to use those values inside simulation software to optimize the process. To accomplish this goal, a set of specimens was designed, built, measured, and mechanically tested; the results were then compared to the values of the process parameters used to build them. The building area in this work was located on the x-y plane, the powder layers were deposited along the z-axis, and three orientations of the built specimens were considered: horizontal, vertical, and tilted. The specimens’ dimensions were measured with a coordinate measuring machine and a digital micrometer. Three-point bending and short-beam tests were performed on the manufactured specimens. Then, on samples of virgin and aged PA12 powder, differential scanning calorimetry (DSC), dynamic mechanical analysis (DMA), and thermogravimetric analysis (TGA) tests were performed.

2. Material and Methods

The powder bed fusion machine used in this work is the Sintratec KIT. It consists of two parts: the casing and the core (Figure 1). The first one isolates the core from the environment, while the second contains all the main parts of the machine.
The core is the place where the laser fusion process is realized. In the core, the powder is shifted from the feeding platform to the building platform through a moving comb. The powder is compressed by the comb, which, moving horizontally along two linear guides, distributes the powder on the building platform and discharges the possible excess of powder inside a box. After the deposition of the powder layer, the feeding platform goes up while the building platform goes down in such a way that the distance between the two surfaces is equal to the height of the layer to be subsequently deposited. At this time, the comb can start the deposition of another layer, restarting the described cycle.
The chamber is heated by a heating coil located on the back of the core, while the surface of the powder layer is heated up to the process temperature using three IR lamps positioned in the upper part of the core. The comb and the platform are activated by three stepper motors. Into the hat of the machine, a galvo scanner directs the laser beam emitted from a laser diode to the working surface. The used powder consisted of an industrial polyamide, known as Sintratec PA12, and was produced by the same producer of the PBF machine.

2.1. Choice of Process Parameter Values

The first step consisted of defining the process parameters. The layer thickness, the contour number and offset created along the contour of the part from the laser beam, the distance between internal building and contour (known as hatch offset), and the spacing of the hatch into the building area, must be defined before fusing. In addition, beam speed and process temperature have an important influence on the manufactured parts, so they have to be carefully set. In particular, the adopted process parameter values are shown in Table 1.

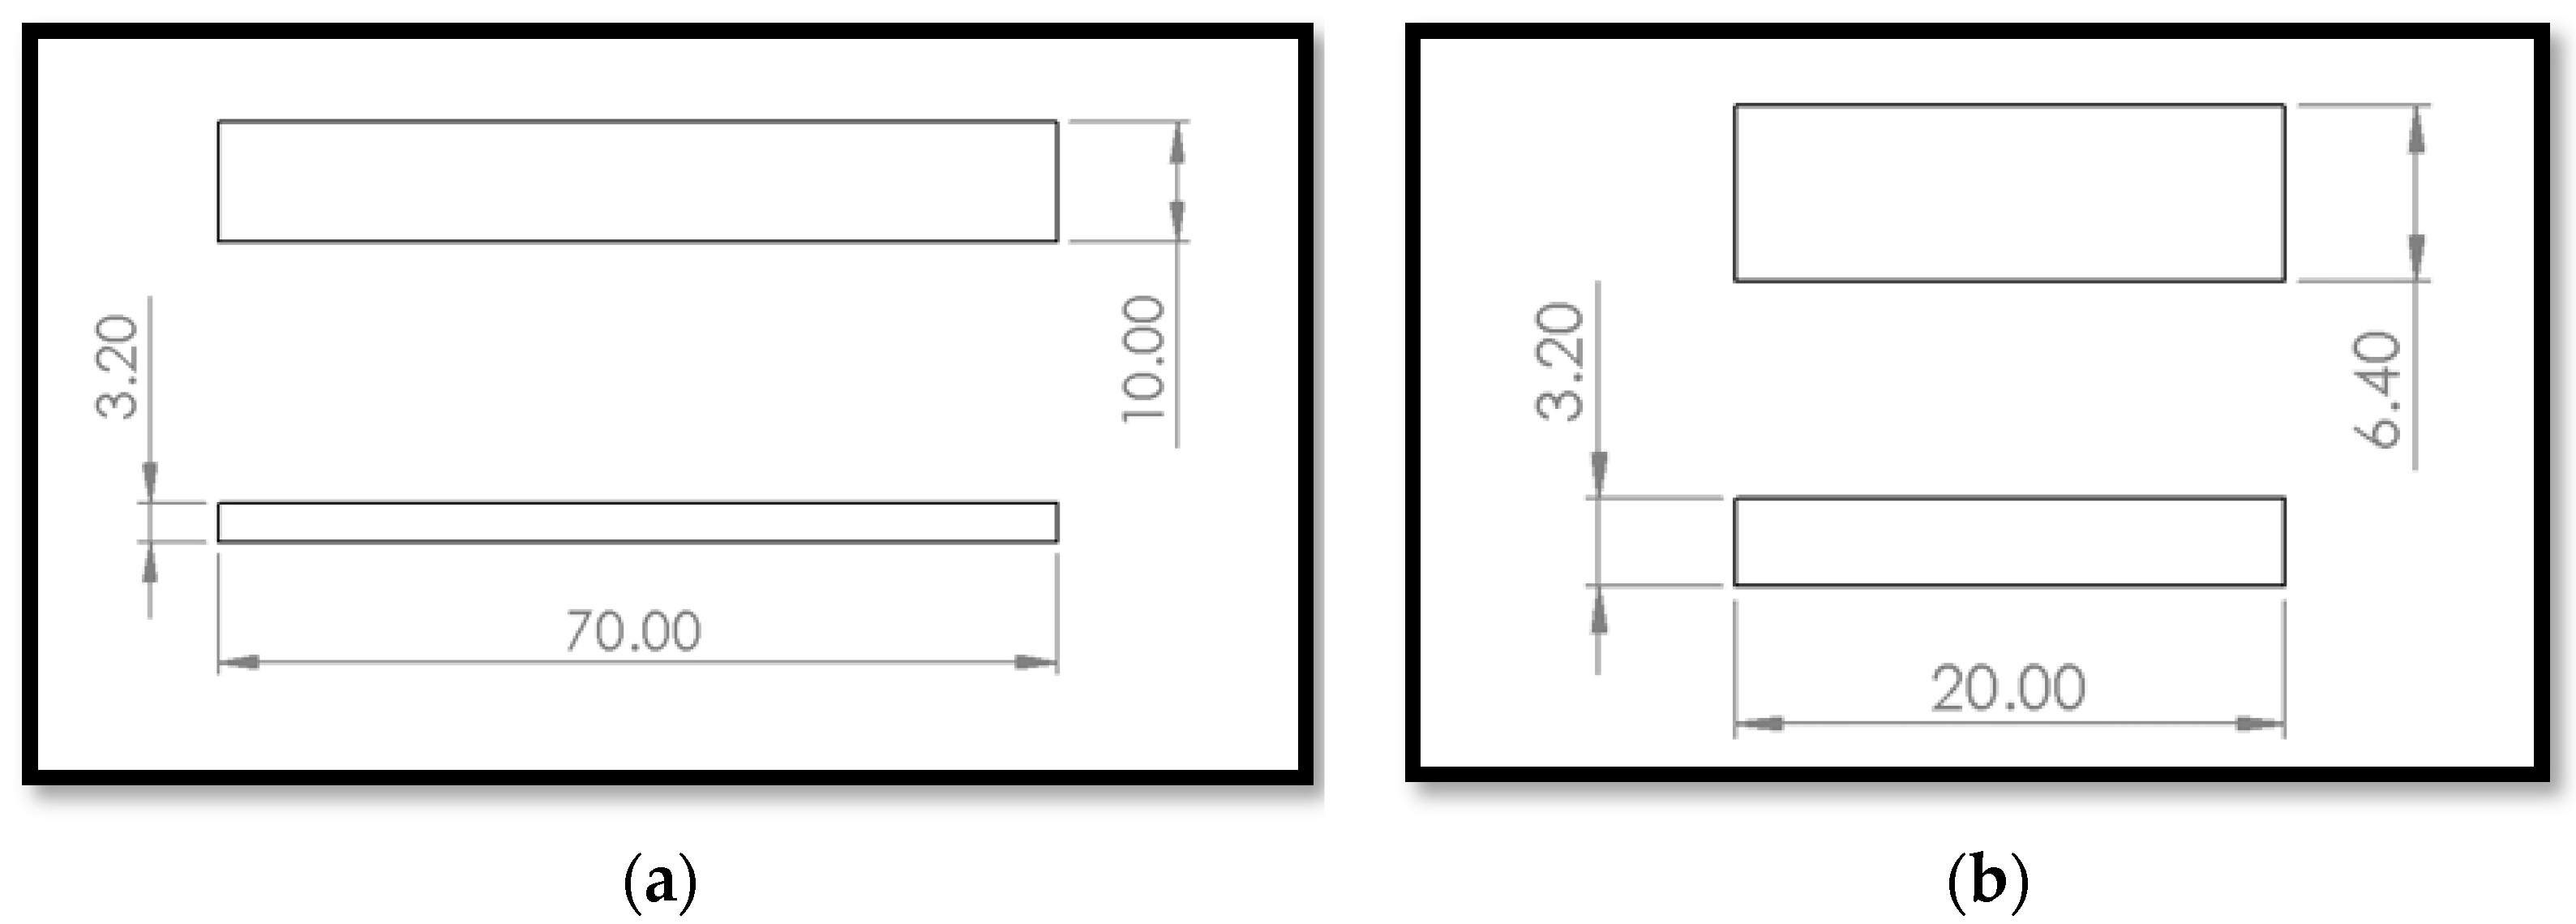
2.2. Layout of PBF Specimens

According to ASTM D790 and ASTM D2344, the specimens were manufactured with the geometry and dimensions reported in Figure 2. The effect of the specimen positions on the build volume was investigated at two different levels along the z-axis of the machine: 0 mm (L0) and 50 mm (L1), as shown in Figure 3.
The specimens were positioned with a reduced building area in comparison to the nominal one: the nominal building area of the Sintratec KIT is 130 mm × 130 mm, and the specimens were positioned 14 mm and 20 mm from the edges in the y and x directions, respectively.
Each build cycle produced ten and twelve specimens for bending and shearing tests, respectively (see Figure 3); the experimental plan is reported in Table 2. As shown in Table 2, six build cycles were made: two with aged powder and four with virgin powder, two for each type of mechanical test (bending and shearing). The aged powder was only used five times to support parts built for 180 min using the manufacturing parameters shown in Section 2.1.
The building duration was divided into a one-hour and 45-min preheating phase, after which the building phase for the bending specimens lasted 3 h and that for the shear specimens 2 h; for both build cycles, there was a cooling down to room temperature phase.
This means that the two build cycles with an aged powder use 100% of the powder from five previous build cycles using the parameters shown in Section 2.1 and the same building time of 180 min. Previously, many build cycles were performed with the same manufacturing parameters, such as those shown in Section 2.1 and a building time of 180 min, and the unbuilt powder was collected and used for this study.
The specimens for the 3-point bending test were made first. Being oriented in the x-direction of the building area, they allowed the evaluation of the variation in mechanical characteristics along the y-axis of the machine. To evaluate the mechanical performance in the y-direction of the machine, the short-beam specimens were built through the x-direction. Into the build volume, a cylinder was built with the axis oriented in the z-direction with a height of 50 mm: this was due to the need of the machine to fuse powder in each deposed layer.

2.3. Preparation of Work

CAD software was used for designing the models of the two types of specimens and saving them in STL format. The Sintratec proprietary software was used for loading the two STL files and positioning them into the build volume, setting the building parameters, and starting the job. At the start of the job, the builder heated the chamber and, after the thermal stabilization, started the building. At the end of the building cycle, the builder waited for the chamber to cool to room temperature, at which point the built specimens were removed and cleaned.

2.4. Mechanical Characterization of the Specimens

Mechanical tests were realized using an Instron 5586 dynamometer device; the standard ASTM D790 was adopted for the bending tests. In particular, the span between the supports was equal to 51.2 mm, the radius of the supports was 3.15 mm, the radius of the punch was 3.91 mm and the crosshead speed of the testing machine was set to 13.65 mm/min, according to procedure B. Instead, the shear tests were led according to ASTM D2344, with a span between the supports equal to 12.8 mm, namely four times the thickness of the specimens. In this case, the support radius was 1.5 mm and the punch radius was 3 mm, while the crosshead speed of the testing machine was set to 1 mm/min.

2.5. Chemical-Physical Characterization

Thermal analysis of material refers to a group of techniques in which a physical property of the substance under investigation is measured as a function of temperature or time while the sample is subjected to a controlled and programmed heat treatment. Therefore, thermal analysis measures the effects of the energy exchange that occurs between the environment and the material, which in turn results in a change in the interactions that exist in the mass of the sample under investigation. DSC analysis, widely used in many areas of research, development, and quality control, intercepts any phenomenon involving a change in the thermal capacity of a material to be studied, exploring a wide range of temperatures and requiring small sample quantities.
DSC is one of the most widely used techniques for polymer characterization. A DSC calorimeter measures the heat fluxes associated with thermal transitions that occur in a sample when it is heated/cooled (dynamic conditions) or maintained at a constant temperature (isothermal conditions) in a controlled manner.
An experimental plan was drawn up with three replications to find some traceability in the data and highlight any anomalies generated in the experimental process. Analyzing three replications made it possible to make the trend of the phenomena found on the PA12 powder specimens more precise and clearer. The tests on the powder specimens were carried out with the aid of a DSC testing calorimeter: the purpose of the machine is to submit the samples to programmed temperature trends to assess the chemical/physical properties of the used materials.
Specifically, three powders were chosen: powder used five times with the process parameters shown in Section 2.1, powder used one or two times with the process parameters shown in Section 2.1, and virgin powder. The powder was taken directly from the Sintratec machine, with the exception of the unaged virgin powder, which did not undergo thermal cycles. Two measurements were taken at temperatures of 150 °C and 170 °C and at time intervals of two and three hours for each temperature. Working on three powders allowed us to evaluate the chemical/physical properties and, in particular, the degree of crystallinity found in the material that underwent one or more thermal cycles, respectively, and to compare them with those presented by the virgin powder used as a reference sample.
Moreover, the choice of temperatures was not arbitrary: 150 °C represents the temperature to which the top surface of the powder in the building chamber is brought before starting the PBF process. The 170 °C, on the other hand, simulates the temperature due to the laser beam during the fusing process. It would be inappropriate to proceed at higher temperatures because it would involve the complete melting of the polymer material, which is estimated to occur at around 177 °C. The DSC calorimeter also allows the ramp time to be set, i.e., the time required to reach the temperatures described here; this time is 1 h 45 min. This parameter is chosen to be congruent with that set on the Sintratec machine before the building process; finally, the choice of the time intervals over which to carry out the tests is because, generally, a Powder Bed Fusion (PBF) production process lasts from two to three hours.
Table 3 shows the plan of the tests carried out with the respective temperatures and dwell times; each test was repeated three times.
DMA and TGA tests were then developed on the powder samples that presented the most different behaviors from the DSC tests, i.e., the virgin and the n-times reused powder.
A DMA instrumentation measures the response of a specimen to an external force in terms of deformation; it gives the stiffness of the specimen, i.e., the ratio between the applied force and the obtained deformation that depends on the material properties and the shape of the specimen. Two specimens with a rectangular cross-section of 60 mm × 12 mm were manufactured through the PBF process, one with virgin powder and one with n-times reused powder, on which a three-point bending test was performed by ASTM E1640-99.
After preparing the specimens and placing them in the DMA test calorimeter, a temperature gradient was set at a heating rate of 5 °C/min, starting at an ambient temperature of 30 °C and progressing to a temperature of 160 °C. This test returned the values of E′ and E″, which are the elastic storage modulus and flexural loss modulus characterizing the material, respectively. Next, the ratio of these two measurements was calculated; this, termed the damping factor tanδ, indicates the damping in the material. It stands for the viscoelastic properties of the material. This test method provides a simple way to characterize the thermomechanical behavior of plastic materials using very small amounts of material. The data obtained can be used for quality control, research, and development to optimize processing conditions.
TGA is a technique to measure the weight of a substance while it is heated at a controlled temperature growth. In the case of polymers, heating causes chemical changes with bond splitting usually leading to the formation of volatile products.
Following ASTM E1131-0 3, 5 mg of powder was loaded onto the balance of the instrument. Then, the test performed controlled heating from room temperature to a temperature of 160 °C. The machine was stopped before the powder melted.

3. Results and Discussion

The obtained results were subjected to an analysis of variance (ANOVA) to evaluate the possible correlation between the mechanical performance of the specimens and the process parameters.

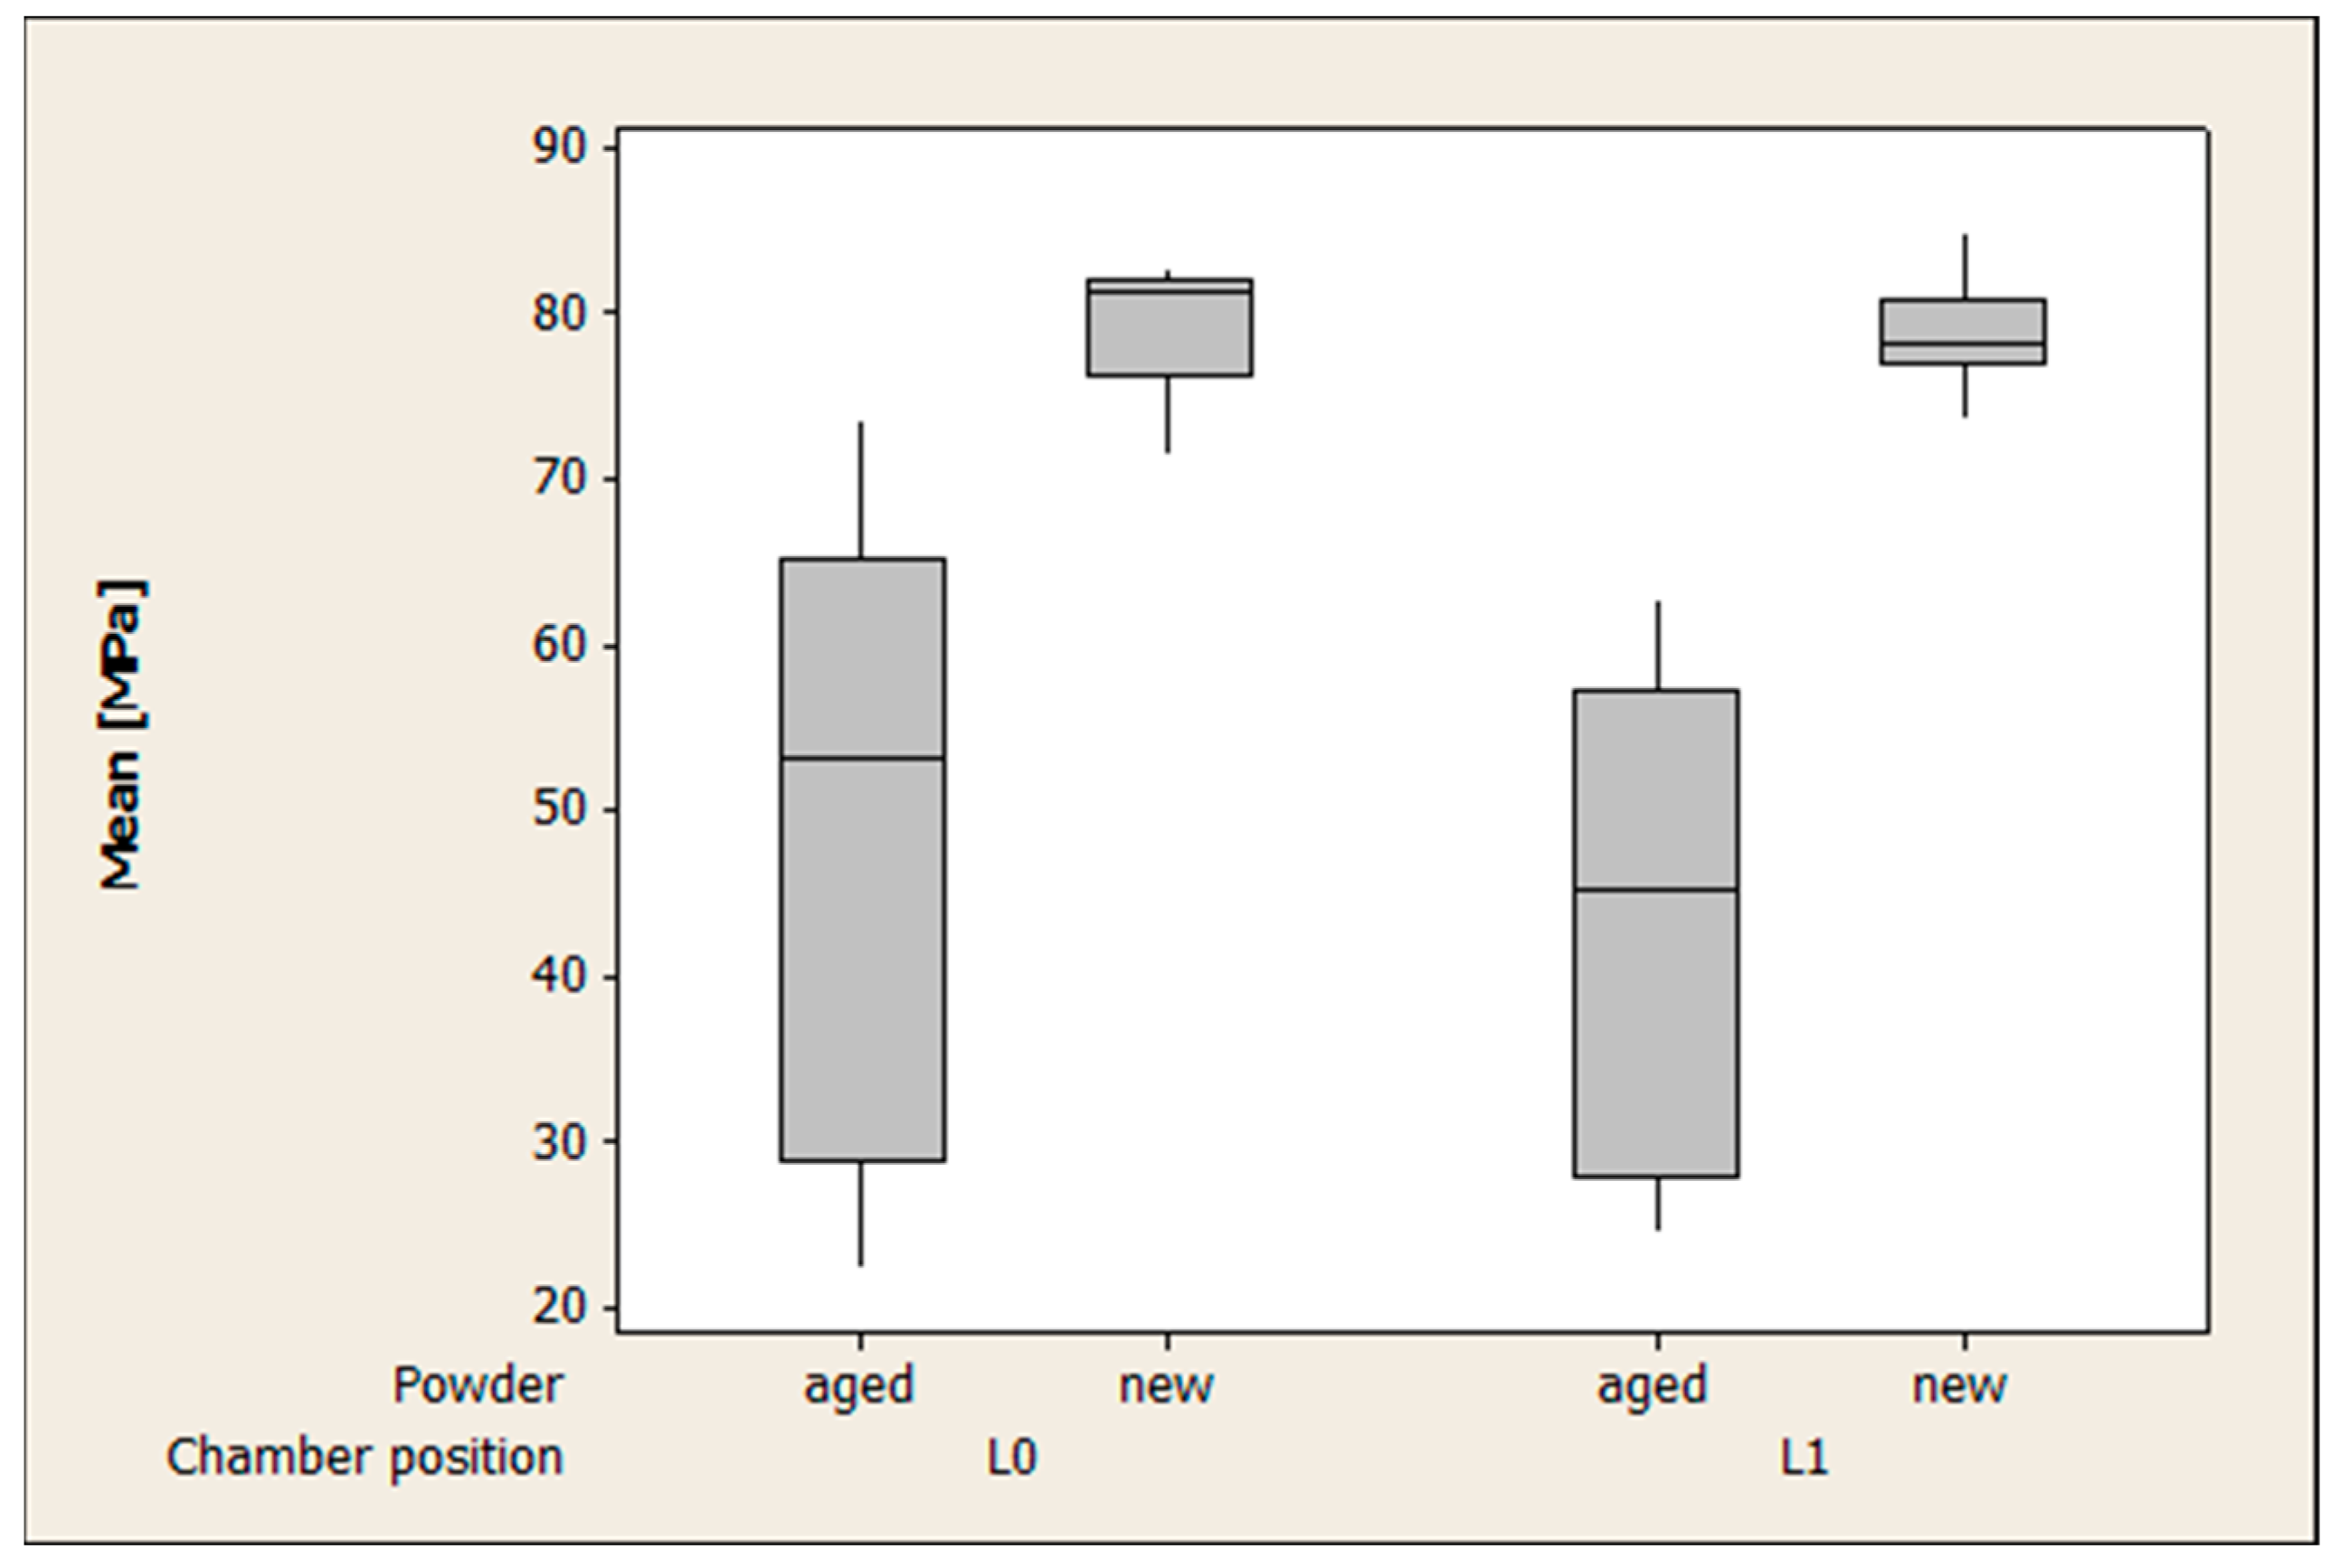
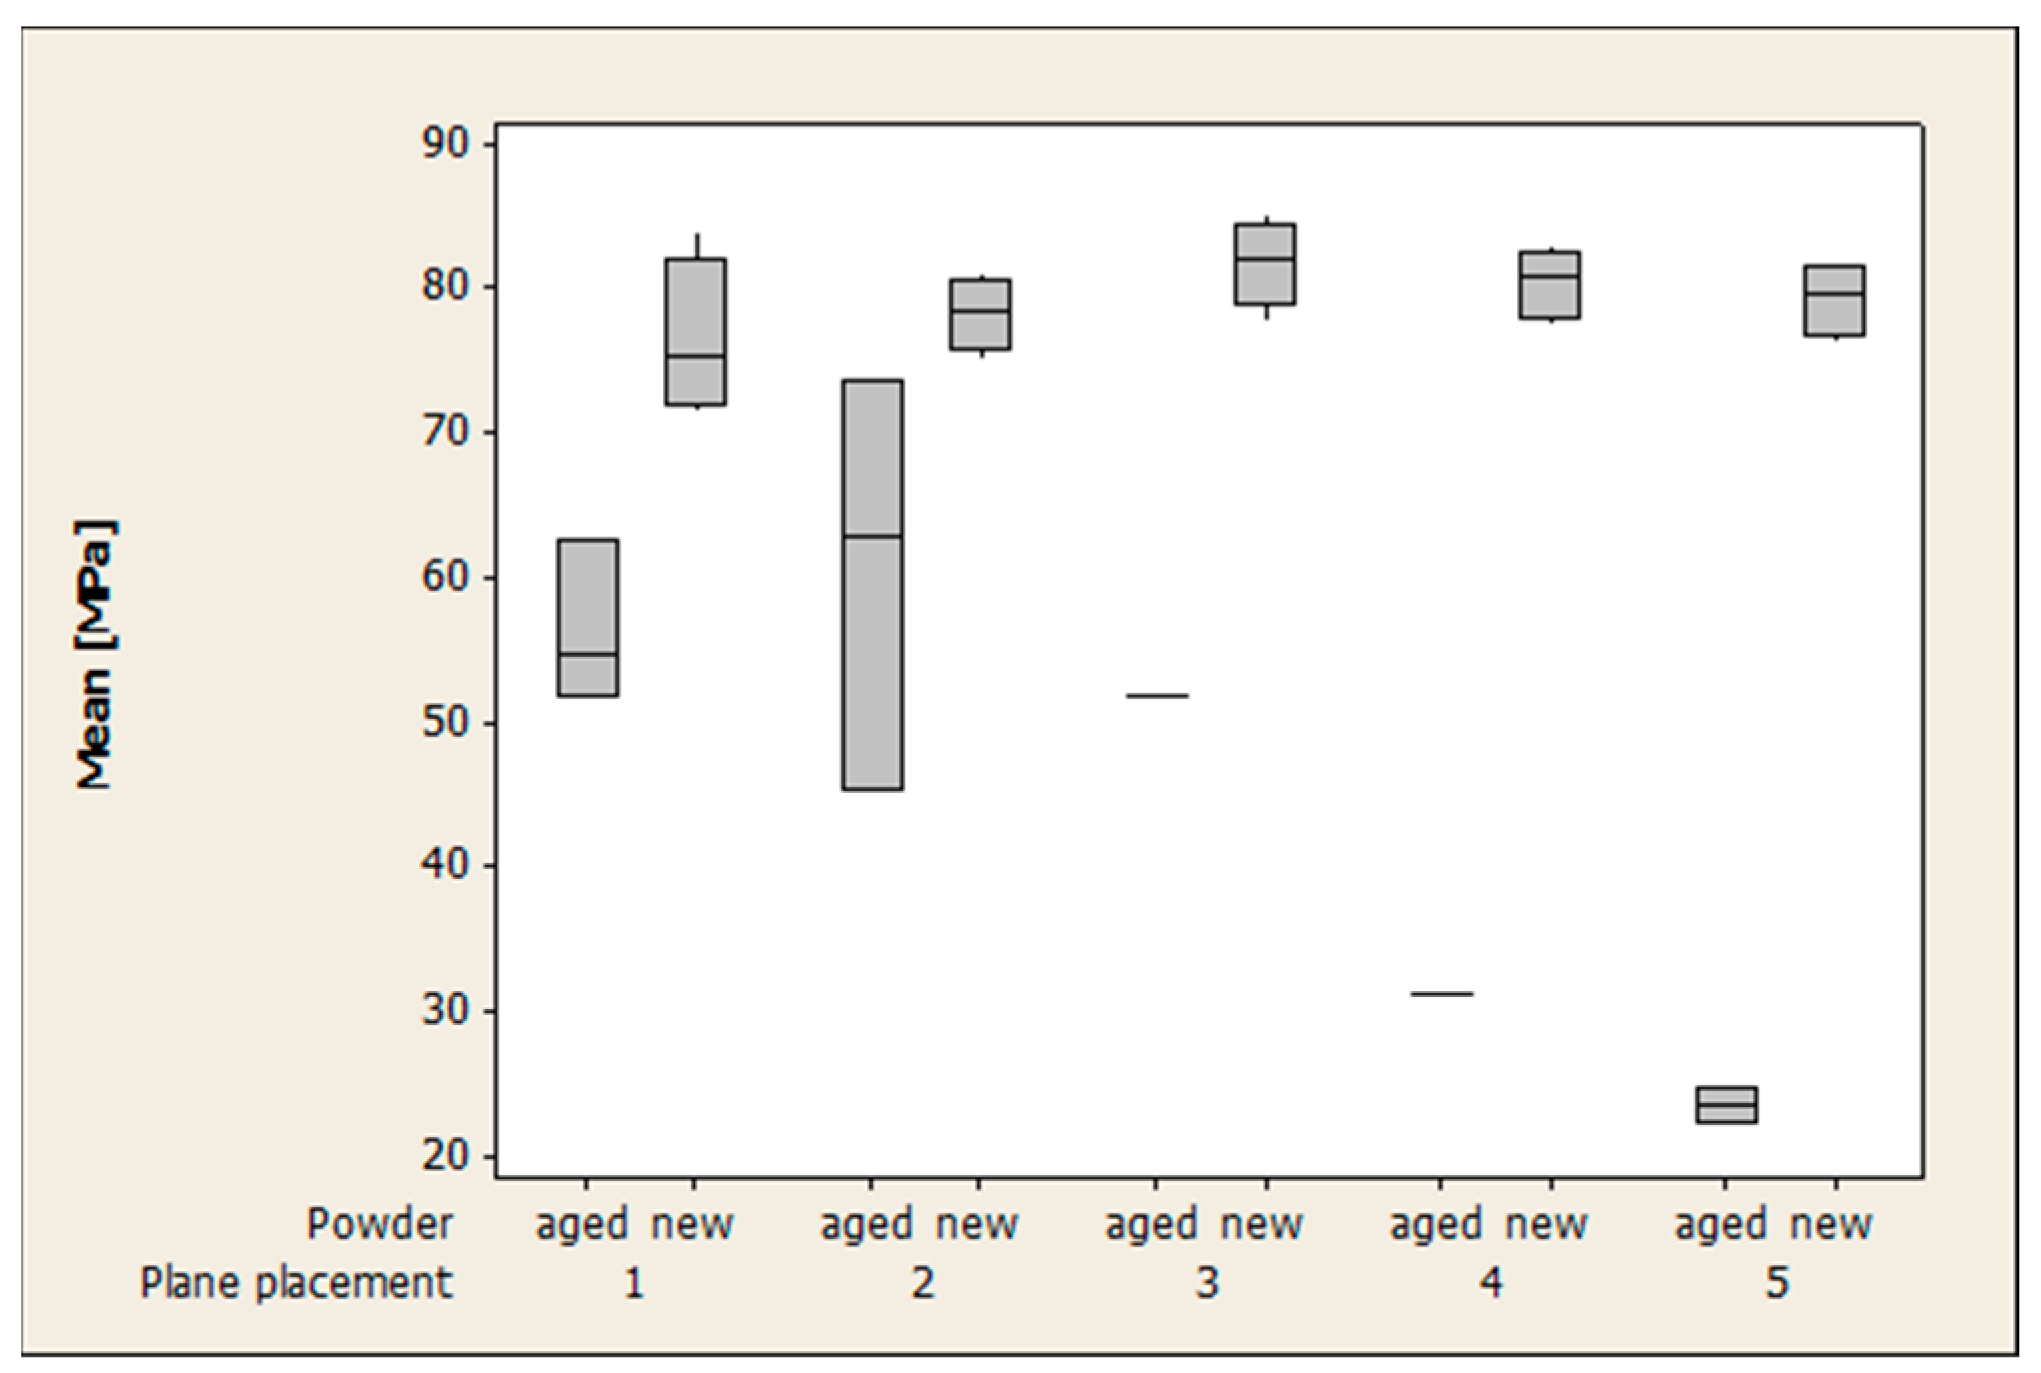
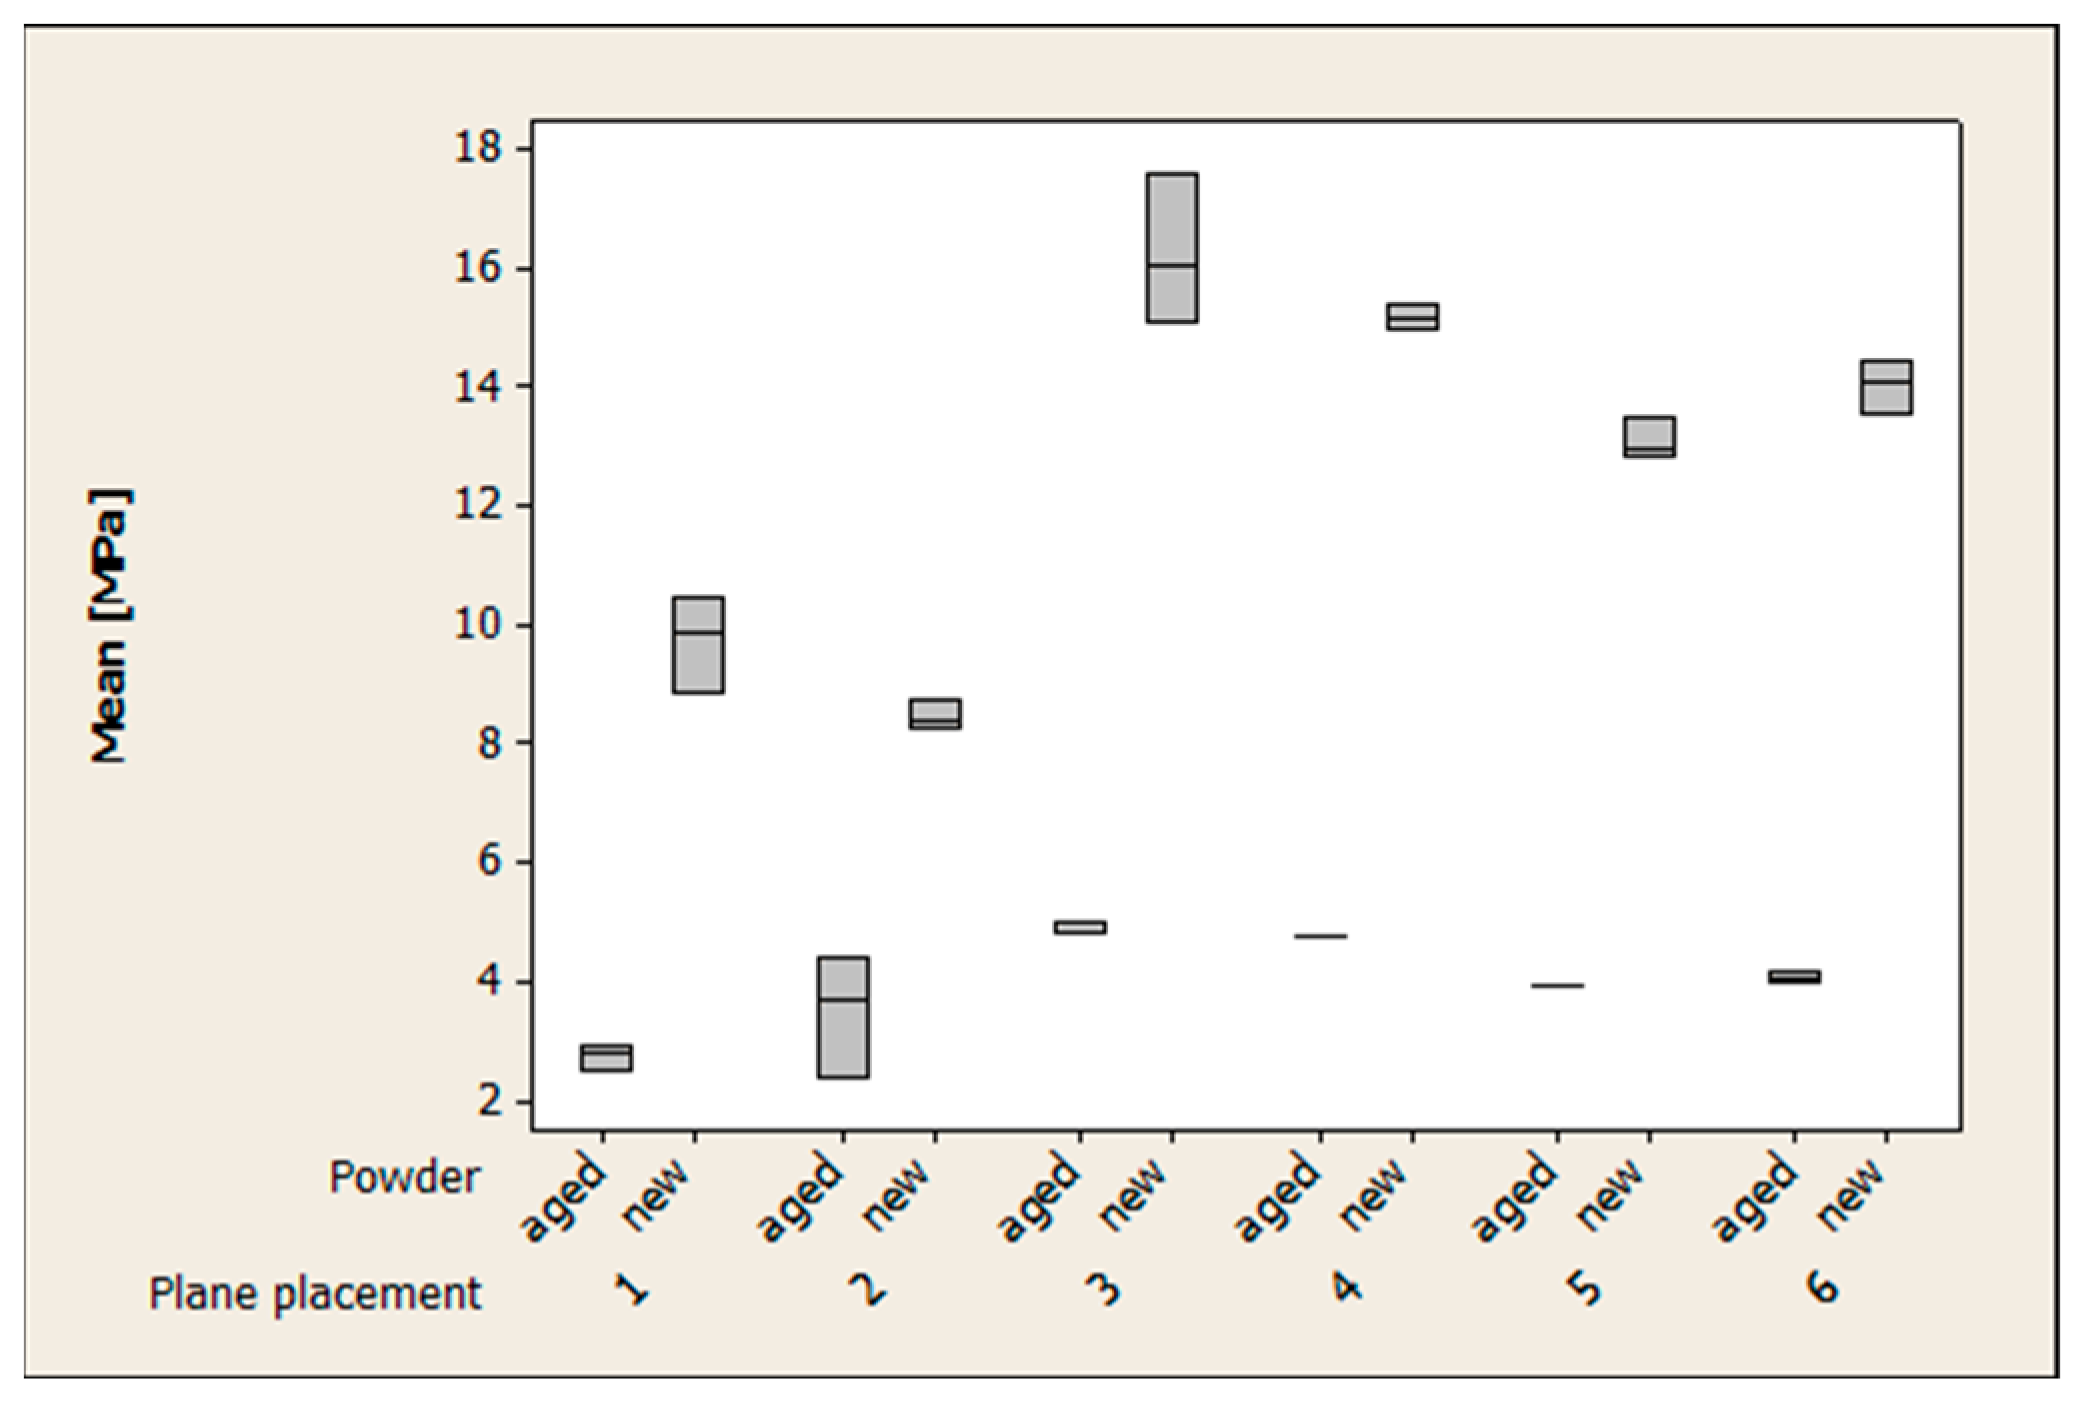
3.1. Mechanical Testing

The maximum stress obtained from the bending tests is shown in the boxplots of Figure 4 and Figure 5. The results show that the kind of powder and the position of the specimens on the building plane were the two parameters that affect significantly the mean value of the maximum bending stress. Specimens built with the aged powder showed a decrease of about 41% of the reached maximum stress, while specimens built near the edges showed a decrease of 20% of the maximum stress. Instead, specimens built in the central zone building area presented the best mechanical resistance. The bending stress was also influenced by the interaction between the position of the specimens on the building plane and the kind of powder.
Results obtained from shearing specimens gave results similar to those due to the bending tests. The mean value of the shearing force (Fsbs) is shown in the boxplots of Figure 6 and Figure 7. Specimens built using aged powder showed a decrease of about 69% of the maximum stress, while specimens built near the edges showed a decrease of 46% of the maximum stress. Furthermore, specimens fused into the bulk zone of the building area presented the best mechanical resistance. Similar to the results of bending tests, the interaction between the position of specimens in the building area and the kind of powder had a big influence on the bending stress too. Probably this phenomenon was due to the different thermal inertias of the powder in the building area. The building plane is confined on the right by the hot powder tank and on the left by the cold tank used to collect the excess powder. The specimens in the central area (3–6) are near the hot tank, while the others (1–2) are near the cold tank.

3.2. Chemical and Physical Analysis

The ASTM reference standard (D 3418-03) on DSC was used to study PA12 powder. At the end of the experiments, the degree of crystallinity of the virgin and n-times reused powder at temperatures close to the melting temperature (170 °C) remain for a time of 180 min. The results show that the degree of crystallinity decreases by 13% from virgin powder to different grades of aged powder.
Figure 8 shows the results due to DMA tests; the virgin powder has an elastic behavior that progressively reduces the more the powder is used; therefore, the n-times reused powder appears stiff. The E’ value of n-times reused powder is 6% higher than that of virgin powder. The DMA tests highlighted that samples made with aged powder show higher viscosity than samples made with virgin powder. A higher viscosity involves a reduction of the part strength, as shown in the previous paragraph.
Figure 9 shows the TGA results; a weight loss appears for virgin and n-times reused powder. In detail, at the building temperature (170 °C), a weight loss of 0.30% was observed for the virgin powder and of 0.45% for n-times reused powder. For the TGA test, a weight loss up to the fusing temperature of PA12 was chosen to assess the behavior of this material as a function of the building process, which brings the material to a temperature just below the melting temperature. A larger weight loss involves a larger density reduction of the powder and, therefore, a greater reduction of the part weight and of its strength, as shown in the previous paragraph.

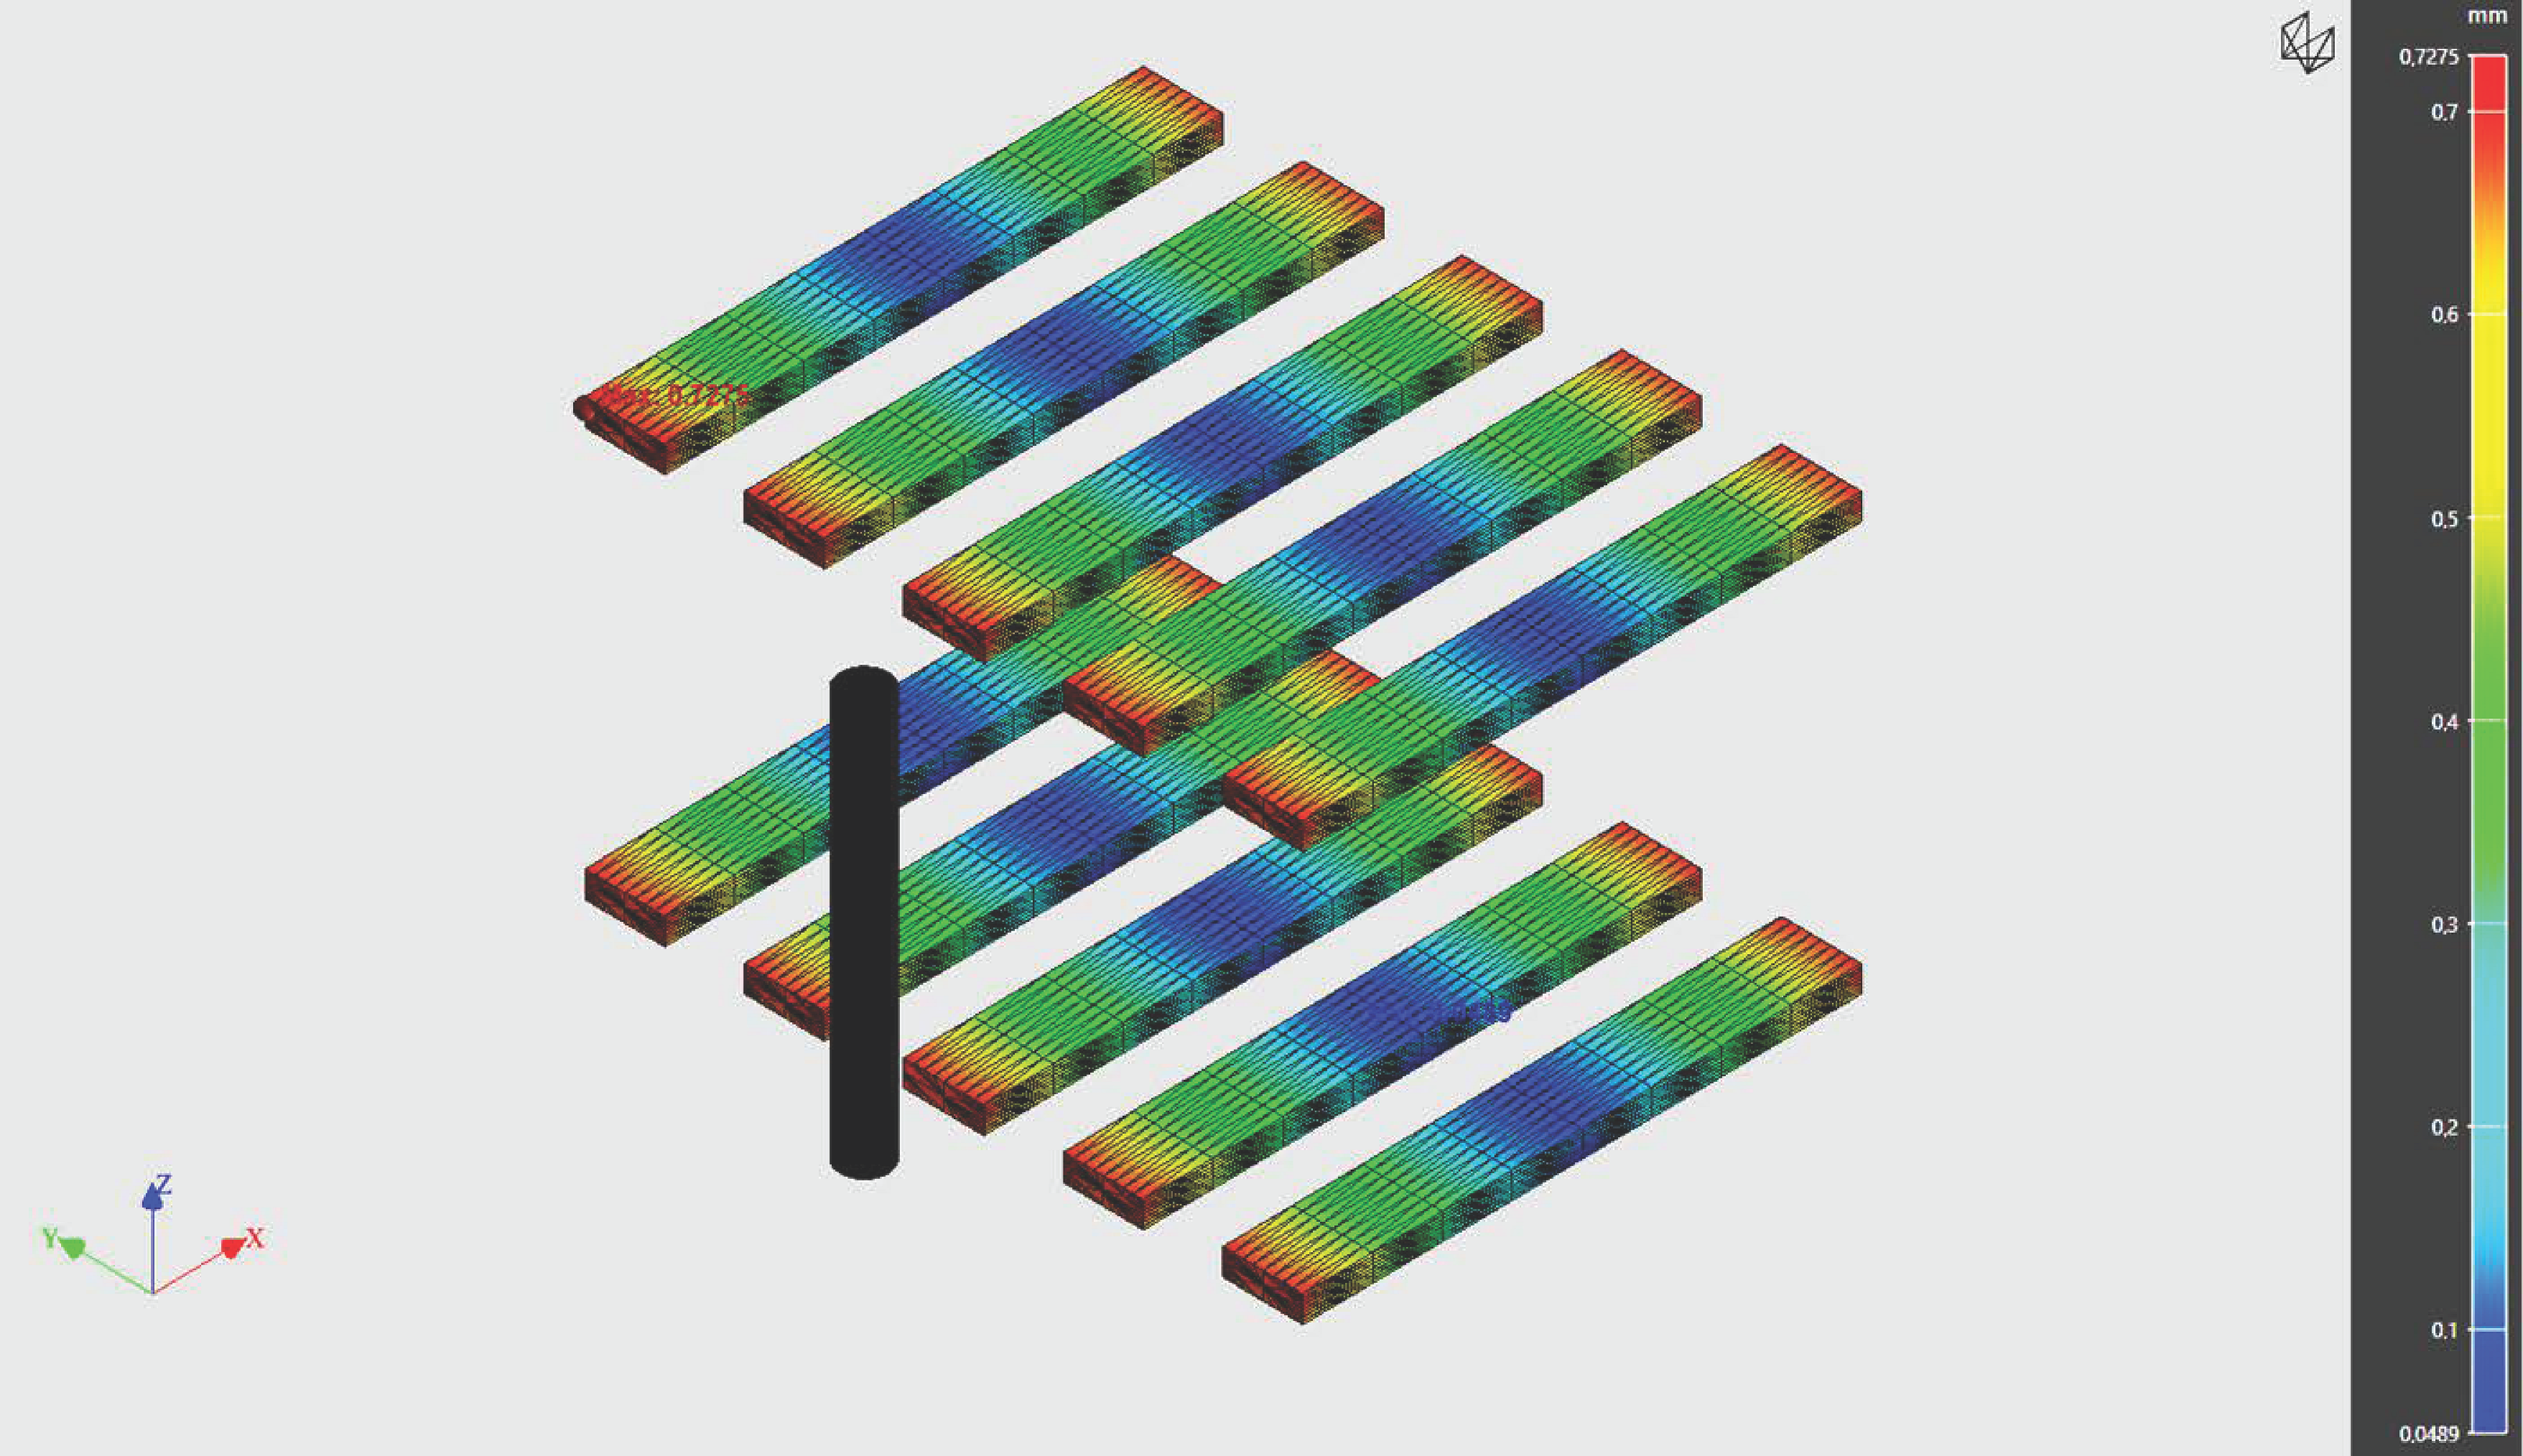
4. Numerical Analysis

The results obtained using DSC, DMA, and TGA tests were used to simulate the PBF process of n-times reused powder through the Digimat-AM software package, while the data of Sintratec powder were considered to simulate the process of virgin powder. The simulation was related to the building of the bending test specimens.
The SLS process was simulated through the Digimat® software package, Release 2022.1 [17]. For the simulation, the reference input parameters on the type of the used printer and powder were imported.
In order to carry out a study able to significantly analyze the repeatability and potential of the simulation process, ten specimens of 3-point bending tests were manufactured, and five for two levels of the building volume (see Figure 3b).
Using the software, four steps were performed: definition, manufacturing, simulation, and outcomes analysis. The initial stage involves entering printer parameters, importing a benchmark, and specifying material.
For this purpose, the Sintratec-Kit printer was used [18], and it was equipped with a laser power of 2000 mW. The parameters reported in Table 1 were used to simulate the manufacturing process.
The results obtained through the simulations were the deviation from the nominal of the built specimens, as shown in Figure 10. They were compared with the experimental data. Figure 11 shows that the difference between the numerical and experimental data is completely negligible for virgin and n-times reused powder and that there is no substantial difference between the specimens built on the lower plane and those on the upper plane, as experimentally detected.

5. Conclusions

In this work, the mechanical performance of specimens manufactured with PA12 powder by a powder bed fusion was investigated. In particular, the mechanical performance was evaluated through shearing and bending tests.
Mechanical results showed that the type of powder and the positioning of the specimens on the building table significantly influence the mechanical performance of the built parts. In particular, specimens made from virgin powder and placed in the central building area show the best mechanical performance.
The maximum stress value obtained by the specimens manufactured with aged powder showed a reduction of about 41% and 69% for bending and shear test, respectively, in comparison with virgin powder.
DSC results showed that the degree of crystallinity decreases of 13% in the n-times reused powder with temperatures close to the melting temperature (170 °C) for a three-hour residence time.
DMA test highlighted that samples made with aged powder show higher viscosity than samples made with virgin powder. An higher viscosity involves a reduction of the part strength, as shown in the previous paragraph.
First, numerical analyses were carried out, and they agree with the experimental results. Further studies aim to derive from the chemical-physical tests the behavior models of the virgin and n-times aged powder which can be given as input for the building process simulations.
The obtained results demonstrate that it is not possible to use powder used many times to produce parts that require mechanical strength. Moreover, the obtained chemical-physical results may be used to be put into simulation software to characterize the properties of the used powder.

Author Contributions

Conceptualization, A.G. and W.P.; methodology, A.G. and L.S.; simulation, A.G. and G.G.; validation, A.G. and W.P.; writing—original draft preparation, W.P.; writing—review and editing, L.S. All authors have read and agreed to the published version of the manuscript.

Funding

This research received no external funding.

Institutional Review Board Statement

Not applicable.

Informed Consent Statement

Not applicable.

Data Availability Statement

No material is available online.

Conflicts of Interest

The authors declare no conflict of interest.

References

  1. Choi, D.S.; Lee, S.H.; Shin, B.S.; Wang, K.H.; Song, Y.A.; Park, S.H.; Lee, H.S. Development of a direct metal freeform fabrication technique using CO2 laser welding and milling technology. J. Mater. Process. Technol. 2001, 113, 273–279. [Google Scholar] [CrossRef]
  2. Erhard, P.; Seidel, A.; Vogt, J.; Volk, W.; Günther, D. Evaluation and optimisation of a slurry-based layer casting process in additive manufacturing using multiphase simulations and spatial reconstruction. Prod. Eng. 2022, 16, 43–54. [Google Scholar] [CrossRef]
  3. Ahmesthin, R.; Fedorov, V.; Kostikov, K.; Martyushev, N.; Ovchinnikov, V.; Rasin, A.; Yakovlev, A. SLS setup and its working procedure. Key Eng. Mater. 2016, 685, 477–481. [Google Scholar] [CrossRef]
  4. Ashourpour, M.; Zanardini, M.; Bacchetti, A.; Zanoni, S. Additive Manufacturing Impacts on Productions and Logistics Systems. IFAC-PapersOnLine 2016, 49, 1679–1684. [Google Scholar] [CrossRef]
  5. Dewulf, W.; Pavan, M.; Craeghs, T.; Kruth, J. Using X-ray computer tomograpghy to improve the pososity level of polyamide-12 laser sintred parts. CIRP Ann. Manuf. Technolology 2016, 65, 205–208. [Google Scholar] [CrossRef]
  6. Dizob, J.; Espera, A.; Chen, Q.; Advincula, R. Mechanical characterization of 3D-printed polymers. Addit. Manuf. 2018, 20, 44–67. [Google Scholar] [CrossRef]
  7. Goodridge, R.D.; Tuck, C.J.; Hague, R.J.M. Laser sintering of polyamides and other polymers. Prog. Mater. Sci. 2012, 57, 229–267. [Google Scholar] [CrossRef]
  8. Sindingera, S.L.; Kraloveca, C.; Tascha, D.; Martin, S. Thickness dependent anisotropy of mechanical properties and inhomogeneous porosity characteristics in laser-sintered polyamide 12 specimens. Addit. Manuf. 2020, 33, 101141. [Google Scholar] [CrossRef]
  9. Ha, S.; Ransikarbum, K.; Han, H.; Kwon, D.; Kim, H.; Kim, N. A dimensional compensation algorithm for vertical bending deformation of 3D printed parts in selective laser sintering. Rapid Prototyp. J. 2018, 24, 955–963. [Google Scholar] [CrossRef]
  10. Corrado, A.; Polini, W. Assembly design in aeronautic field: From assembly jigs to tolerance analysis. Proc. Inst. Mech. Eng. Part B J. Eng. Manuf. 2017, 231, 2652–2663. [Google Scholar] [CrossRef]
  11. Corrado, A.; Polini, W. Measurement of high flexibility components in composite material by touch probe and force sensing resistors. J. Manuf. Process. 2019, 45, 520–531. [Google Scholar] [CrossRef]
  12. Carrino, L.; Giorleo, G.; Polini, W.; Prisco, U. Dimensional errors in longitudinal turning based on the unified generalized mechanics of cutting approach. Part II: Machining process analysis and dimensional error estimate. Int. J. Mach. Tools Manuf. 2002, 42, 1517–1525. [Google Scholar] [CrossRef]
  13. Corrado, A.; Polini, W.; Moroni, G. Manufacturing signature and operating conditions in a variational model for tolerance analysis of rigid assemblies. Res. Eng. Des. 2017, 28, 529–544. [Google Scholar] [CrossRef]
  14. Dadbakhsha, S.; Verbelenb, L.; Verkinderenc, O.; Strobbea, D.; Van Puyveldeb, P.; Kruth, J.P. Effect of PA12 powder reuse on coalescence behaviour and microstructure of SLS parts. Eur. Polym. J. 2017, 92, 250–262. [Google Scholar] [CrossRef]
  15. Goodridge, R.D.; Hague, R.J.M.; Tuck, C.J. Effect of long-term ageing on the tensile properties of a polyamide 12 laser sintering material. Polym. Test. 2010, 29, 483–493. [Google Scholar] [CrossRef]
  16. Yang, F.; Zobeiry, N.; Mamidala, R.; Chen, X. A review of aging, degradation, and reusability of PA12 powders in selective laser sintering additive manufacturing. Mater. Today Commun. 2023, 34, 105279. [Google Scholar] [CrossRef]
  17. Martynková, G.S.; Sliva, A.; Kratošová, G.; Barabaszová, K.C.; Študentová, S.; Klusák, J.; Brožová, S.; Dokoupil, T.; Holešová, S. Polyamide 12 Materials Study of Morpho-Structural Changes during Laser Sintering of 3D Printing. Polymers 2021, 13, 810. [Google Scholar] [CrossRef]
  18. Stiller, T.; Berer, M.; Katta, A.D.; Haar, B.; Truszkiewicz, E.; Kraschitzer, W.; Stepanvosky, H.; Pinter, G.; Lackner, J.M. Powder ageing of Polyamide 6 in laser sintering and its effects on powder and component characteristics. Addit. Manuf. 2022, 58, 102987. [Google Scholar] [CrossRef]
  19. Gazzerro, A.; Polini, W.; Sorrentino, L. Investigation on selective laser sintering of PA12: Dimensional accuracy and mechanical performance. Rapid Prototyp. J. 2021, 27, 1010–1019. [Google Scholar] [CrossRef]
  20. Vendittoli, V.; Polini, W.; Walter, M.S.J. Geometrical deviations of green parts due to additive manufacturing: A synthetic geometrical performance index. Procedia CIRP 2022, 114, 159–164. [Google Scholar] [CrossRef]
  21. Gornet, T.J.; Davis, K.R.; Starr, T.L.; Mulloy, K.M. Characterization of selective laser sintering materials to determine process stability. In Proceedings of the 2002 International Solid Freeform Fabrication Symposium, Austin, TX, USA, 5–7 August 2002; pp. 546–553. [Google Scholar] [CrossRef]
  22. Zarringhalam, H.; Hopkinson, N.; Kamperman, N.F.; De Vlieger, J.J. Effects of processing on microstructure and properties of SLS Nylon 12. Mater. Sci. Eng. A 2006, 435–436, 172–180. [Google Scholar] [CrossRef]
  23. Kuehnlein, F.; Drummer, D.; Rietzel, D.; Seefried, A. Degradation behavior and material properties of PA12-plastic powders processed by powder based additive. In Annals of DAAAM for 2010 & Proceedings of the 21st International DAAAM Symposium; DAAAM International: Vienna, Austria, 2010; Volume 21, pp. 1547–1548. [Google Scholar]
Figure 1. Casing and core of SINTRATEC machine.
Applsci 13 05599 g001
Figure 2. Sketch of specimens with related dimensions (in mm) for: (a) 3-point bending test; (b) short-beam test.
Applsci 13 05599 g002
Figure 3. Specimens inside building volume: L0 = level 0 (z = 0 mm); L1 = level 1 (z = 50 mm): (a) for 3-point bending test; (b) for short-beam test.
Applsci 13 05599 g003
Figure 4. Mean Effect Plot of maximum stress vs. chamber position for 3-point bending tests.
Applsci 13 05599 g004
Figure 5. Mean Effect Plot of maximum stress vs. plane placement for 3-point bending tests.
Applsci 13 05599 g005
Figure 6. Mean Effect Plot of shearing force vs. chamber position of specimens for short-beam tests.
Applsci 13 05599 g006
Figure 7. Mean Effect Plot of shearing force vs. plane placement of specimens for short-beam tests.
Applsci 13 05599 g007
Figure 8. DMA results.
Applsci 13 05599 g008
Figure 9. TGA results.
Applsci 13 05599 g009
Figure 10. Simulation results.
Applsci 13 05599 g010
Figure 11. Numerical—experimental comparison.
Applsci 13 05599 g011
Table 1. Building parameters.
ParameterValueUnit of Measurement
Layer thickness100µm
Number of contours3
Hatch offset50µm
Hatching spacing150µm
Contour offset50µm
The heating temperature of the powder surface150°C
Chamber heating temperature140°C
Building temperature of the powder surface170°C
Laser velocity550mm/s
Table 2. Experimental plan.
Nominal Length [mm]Nominal Width
[mm]
Nominal Thickness
[mm]
N. SpecimensN. Build CyclesN. Kinds of PowderTotal Specimens
3-point bending testLevel 0
(z = 0 mm)
70.0010.003.2052220
Level 1
(z = 50 mm)
52220
Short-beam testLevel 0
(z = 0 mm)
20.006.403.2062224
Level 1
(z = 50 mm)
62224
Table 3. DSC test planning.
Virgin Powder1-Time Reused Powdern-Times Reused Powder
Temperature (°C)Time
(min)
Temperature (°C)Time
(min)
Temperature (°C)Time
(min)
DSC150t1: 120150t1: 120150t1: 120
150t2: 180150t2: 180150t2: 180
170t1: 120170t1: 120170t1: 120
170t2: 180170t2: 180170t2: 180
Disclaimer/Publisher’s Note: The statements, opinions and data contained in all publications are solely those of the individual author(s) and contributor(s) and not of MDPI and/or the editor(s). MDPI and/or the editor(s) disclaim responsibility for any injury to people or property resulting from any ideas, methods, instructions or products referred to in the content.

