Abstract
The traceability of the geographical origin of coffee is a challenging issue to protect producers and consumers from the risk of fraud. A total of 162 Arabica from Peru, Colombia and Brazil, and Robusta from India, Vietnam and Uganda, espresso coffee (EC) samples of different degrees of roasting (light, medium and dark) were characterized for physico-chemical features (lipids, solids, and chlorogenic acids) and analyzed via SHS-GC/MS analysis, with the aim of discriminating the samples according to their geographical origin. Linear discriminant analysis (LDA), performed on the data of the chemical classes of the volatile organic compounds (VOCs), was able to correctly identify 97.53% of the tested samples through cross-validation. The dark roasting of the coffee beans implied a higher quantity of volatile compounds in the headspace of the EC, belonging to chemical classes of furans, esters, N-heterocyclic and sulfur compounds, reducing the differences by geographical origin. Light- and medium-roasted Robusta EC showed a major contribution of pyrazines and pyrimidines, while aldehydes, alcohols and ketones were generally more representative in Arabica samples. The quantitative distribution of volatile compounds proved to be a useful tool to discriminate samples by geographical origin.
1. Introduction
The formation of volatile organic compounds (VOCs) during coffee roasting is a key process that significantly impacts the aroma and flavor of the resulting espresso coffee (EC). The profile of VOCs can be influenced by several factors, ranging from the genetics of the coffee plant to the brewing method used to prepare the final cup [1,2,3,4,5]. Among these factors, coffee varieties (Arabica and Robusta) directly connected with their cultivars, geographical origin and climate environment, as well as roasting conditions, have been widely investigated in previous literature [6,7,8,9]. Although the different sugar, lipid, caffeine and chlorogenic acid content of the Arabica and Robusta coffee fruits make the aroma of Arabica more complex and nuanced, the growing conditions (soil type, climate, and agricultural practices) affect the chemical composition of the coffee beans. Consequently, the VOC profile of espresso coffee could help control the geographical origin of coffee fruits. The degree of roasting and the condition of the roasting process are significant factors in determining the final overall VOC profile of EC, resulting in a fruity aroma for the lighter roast evolving toward caramel, dark chocolate, and smokiness notes for the darker roast [10].
Gas chromatography coupled with mass spectrometry (GC/MS), proton-transfer-reaction mass spectrometry (PTR-MS) and electronic nose (EN) are the main analytical techniques reported in the literature, which have allowed for the identification of almost 850 VOCs in EC. Within the GC/MS, the sampling by static headspace extraction (SHS) without using sorbents or solvents leads to a more realistic representation of EC aroma as experienced by consumers [11], limiting the production of artifacts. Earlier studies have developed statistical models demonstrating the potential of using VOCs for the geographical origin determination of Arabica and Robusta green and roasted coffee beans [12,13,14]. However, the profile of volatile compounds in EC has never been used for the geographical discrimination of coffee beans. Secondly, the role of different roasting levels in the discrimination of coffee geographical origin by VOC analysis of EC has never been explored. Previously, Vezzulli et al. [15] demonstrated the discrimination ability of the physico-chemical parameters of roasted beans, such as acrylamide, caffeine, acidity and total phenolics, to cluster samples of different origins.
Therefore, the traceability of geographical origin of coffee beans using VOCs of EC as chemical markers can be a challenging issue for producers and consumers eager for reliable criteria of authenticity. This study uses SHS-GC/MS analysis to discriminate a total of 162 samples of Arabica and Robusta EC subjected to three different levels of roasting (light, medium, and dark), of different origins (India, Vietnam, Uganda, Brazil, Colombia and Peru). A linear discriminant analysis (LDA) was performed on the major VOC chemical classes to classify coffee samples according to their geographical origin.
2. Materials and Methods
2.1. Chemical and Coffee Samples
Six green coffee samples (three Arabica and three Robusta) were provided by Kimbo S.p.a. (Melito di Napoli, Italy). As far as Robusta is concerned, 2 samples came from Asia (India Cherry and Vietnam) and 1 from Africa (Uganda), whereas the Arabica samples came from South America (Peru, Colombia and Brazil). Reference chemical compounds were obtained from Sigma-Aldrich (Steinheim, Germany).
2.2. Experimental Design
The green coffee was roasted using a rotating drum Probatino roaster (Probat, Emmerich am Rhein, Germany). A preliminary phase involved tuning 3 roasting curves to obtain light-, medium- and dark-roasted coffee. The degree of the roast was measured using a polychromatic LED reflection colorimeter (https://my-tonino.com/shop/en/tonino; accessed on 27 February 2023) and a “Gourmet” Agtron scale. An average of two readings, one for the whole-bean and the other for the ground, gave a score of 38, 50 and 65 for dark-, medium- and light-roasted coffee, respectively. The roasting curve resulting from the preliminary analysis was carried out on 1 kg of green coffee for each roasting and geographical origin. The Arabica coffee species required lower roasting temperatures and a shorter roasting time compared to the Robusta coffee species (Figure 1), as reported in the literature [16]. Robusta beans are denser than Arabica beans, and thus require more heat to be roasted. The roasted coffee beans were stored in triple-layer bags (PET/AL/PE) for 48 h, to allow for the residual gases to completely evaporate. Subsequently, the coffee was ground using a typical grinder with flat burrs (Promac, Milan, Italy). The degree of grinding was adjusted based on the typical extraction speed of an EC, which is 1 mL/s, to obtain a well-extracted and high-quality espresso [17]. Espresso coffee was prepared for each sample from 15 g of coffee powder, through which purified water of 90 °C was forced at 7–9 bar of pressure and a double-holder filter diameter of 38 mm (Rancilio, Model: Rancilio Classe 11 USB). A fixed volume of EC (8 mL) was introduced in 5 vials (20 mL), immediately closed and sealed. Three aliquots of EC (40 mL) were extracted for each roasting degree and geographical origin to be analyzed, in triplicate.
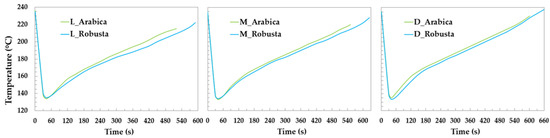
Figure 1.
Roasting profile of Arabica (green) and Robusta (blue); L = light; M = medium; D = dark.
2.3. Lipid, Solid and Chlorogenic Acid Determination
Lipids, total solids and chlorogenic acids (3-CQA, 4-CQA and 5-CQA) were determined as described in De Vivo et al. [2]. Roughly, the total amount of lipids was estimated by liquid–liquid extraction using hexane. Solids were determined by oven-drying 5 mL of EC to a constant weight (102 °C). Caffeoylquinic acids (CQAs) were detected via an UHPLC (Thermo Scientific Dionex UltiMate 3000) equipped with a Kinetex EVO C18 analytical column (100 × 4.6 mm I.D., 2.6 μm particle size; Phenomenex) and a diode array detector. The mobile phase consisted of 10 mM acetic acid in water (v/v) (solvent A) and methanol (solvent B). The elution conditions applied were as follows: 0–2 min, linear gradient to 15% B; 2–10 min, linear gradient from 15 to 30% B; 10–11 min, linear gradient from 30 to 95%; 11–15 min, 95% B isocratic; 15–16 min, linear gradient from 95 to 5% B; 16–20 min, 5% B isocratic. The flow rate was 0.7 mL min−1. CQAs were quantified at 325 nm. All metabolites were analyzed in triplicate from 3 different extractions.
2.4. Analysis of VOCs by SHS–GC/MS
The profiles of volatile compounds were analyzed using the method described by De Vivo et al. [2], using a gas chromatograph (TRACE 1310) equipped with mass spectrometry (TSQ 8000 Evo triple quadrupole, Thermo Fisher Scientific, Waltham, MA, USA). Each vial was equilibrated at 70 °C for 30 min, and 1 mL of the coffee headspace sample was injected into the ZB-FFAP capillary column (Length: 60 m; internal diameter: 0.25 mm; film thickness: 0.25µm) (Phenomenex, Torrance, CA, USA). The injector temperature was set at 180 °C and the carrier gas (helium) flow rate was set at 1 mL/min. The GC oven program was set as follows: 40 °C held for 6 min, followed by an increase to 220 °C at a rate of 3 °C min−1 (maintained for 2 min), continuing with an increase of 3 °C min−1 until the temperature reached 250 °C, which was held for 5 min. The mass spectrometer operated with electron ionization (70 eV), with a scan range of 33–300 amu. The ion source temperature was set at 260 °C.
The identification of compounds was confirmed by comparing the experimental spectra with the spectra from NIST14 libraries with a match factor higher than 97% and by comparison of the retention times with those of standard compounds when reference compounds were available. GC/MS analysis in selective ion monitoring (SIM) was applied to quantify the volatile compounds. The results were expressed as relative percentage of each peak area of quantifying ion to the total GC-MS peak area. Data were processed using the software TraceFinder™ (version 5.1 SP1; Thermo Fisher Scientific, Waltham, MA, USA).
2.5. Statistical Analysis
Results were expressed as the mean ± standard deviation. Statistical analysis and visualization were carried out in XLStat (Version 2019 v.2.2), an add-in software package for Microsoft Excel (Addinsoft Corp., Paris, France). The differences between the physico-chemical and VOC variables for the EC samples were assessed by an ANOVA with Tukey’s HSD test, for a significance level set at p < 0.05. The data of the chemical classes of VOCs for the 162 EC samples were processed by linear discriminant analysis (LDA), in order to classify samples by geographical origin. Principal component analysis (PCA) was performed on the average of the chemical classes of VOCs of the EC samples to assess the distribution of the chemical classes of VOCs among the samples.
3. Results and Discussion
3.1. Chemical Analysis
Arabica and Robusta EC samples, obtained by using coffee coming from different geograhycal origin, were compared in terms of chemical characterization by quantification of solid content, lipids and caffeoylquinic acids. As shown in Table 1, higher levels of CQAs, 3-CQA, 4-CQA and 5-CQA were found in Arabica ECs compared to Robusta, in agreement with the previous studies [18,19,20]. This result can be explained, since during the roasting process, the CGAs present in the Robusta samples are degraded more rapidly than in those of Arabica, resulting in low levels of CGAs in Robusta EC [21]. Furthermore, the results have shown no significant differences among different cultivars of Robusta in acid content. The degradation of CQAs during the roasting process, as a consequence of the breakage of carbon–carbon bonds, has been extensively reported in previous literature [18,22,23,24], as also demonstrated by the findings of this study. The major lipid fraction was found in Arabica EC samples, whatever the geographical origin and roasting degree [25]. It is known that VOCs are trapped in oil droplets and are released during extraction, and finally reach the nasal receptor of the consumers. Thus, the oil fraction explains the difference between Arabica and Robusta flavor. Additionally, the lipid content has shown a decrease with increasing the roasting degree, as reported in previous literature [26]. Solid content of EC samples seemed unable to discriminate coffee varieties, as well as geographical origin, as given in Table 1. However, the stronger the roasting conditions, the higher the amount of total solids, even if no significant differences were found between the medium and dark roast degree [26].

Table 1.
Influence of geographical origin and roasting treatment on chemical parameters of EC samples 1.
3.2. Discriminant Analysis of EC Samples
Linear discriminant analysis (LDA, after log transformation) was performed on the data of the chemical classes of volatile compounds quantified in the 162 total coffee samples, with the aim of discriminating them by geographical origin. The results of the analysis are shown in Figure 2.
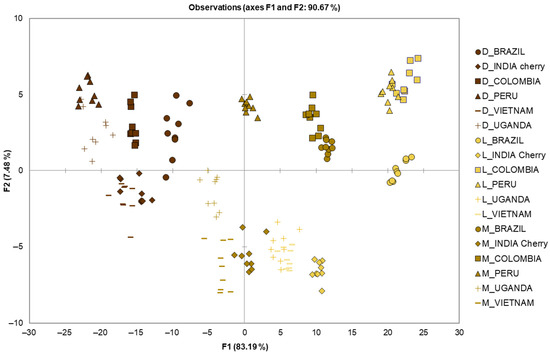
Figure 2.
Identification of geographical origin by LDA using the chemical classes of volatile compounds quantified in the 162 EC samples. L = light; M = medium; D = dark.
The chemiometric model obtained by LDA showed a λWilks value 0.000, suggesting that the group means were different. The LDA (probability of F to remove 0.10 and to enter 0.05) selected all chemical classes as discriminant of two discriminant factors, based on standardized canonical discriminant function coefficients, for FD1 (83.19%): aldehydes (2.149), esters (−1.536), sulphur compounds (−1.054), N-heterocycle (−0.892), phenols (0.549), pyrazines (0.516), alcohols (−0.386), ketones (0.359), furans (−0.208), pyrimidine (0.190) and acids (0.091); and for FD2 (7.48%): ketones (2.093), N-heterocycle (−1.609), aldehydes (−1.460), pyrazines (−0.699), esters (0.697), phenols (0.522), alcohols (−0.391), sulphur compounds (0.370), furans (0.121), pyrimidine (−0.071) and acids (0.066).
The LDA showed 98.15% correctly classified samples. The model was leave-one-out cross-validate, obtaining 97.53% correctly validated samples, and the confusion matrix for the cross-validated results is shown in Table 2. Apart from samples D_VIETNAM and D_COLUMBIA, all other samples were correctly classified, leading to a total correct classification of 97.53%. Specifically, D_VIETNAM was misclassified as D_COLUMBIA twice, and vice versa. Previously, Demianová et al. [13] reported the correct classification of coffee samples according to geographical origin of 82.61%. The authors focused on nine green coffee Arabica samples from Africa, South and Central America, for a total of 23 samples, using the chemical classes of volatile compounds as model parameters for LDA analysis.
Table 2.
Confusion matrix of the EC samples.
In our study, we examined nine samples from Brazil, Peru, Colombia, India, Vietnam and Uganda, also investigating the effect of three different roasting levels. The score plot (Figure 2) showed a clear separation not only for the origin of the samples, but also for the different roasting degree, suggesting that the volatile compounds were effective in discriminating both origin and roasting level. Interestingly, the lower the level of roasting, the more evident the separation of the samples according to their geographical origin. Therefore, the light roasting showed a better separation than dark roasting, where the latter was the cause of misclassification for the D_VIETNAM and D_COLUMBIA samples. The increase in the level of roasting of the coffee beans led to the development of new volatile compounds, such as furans and sulfur compounds, which reduced the differences originally present in the green coffee beans, and higher classification errors occur in ECs with higher roasting levels [14], corroborating our findings of better classification for light- and medium-roasted samples.
3.3. Volatile Compound Analysis
The results of the analysis of volatile compounds were reported in Table 3. In general, volatile compounds belonging to aldehyde, ketone and alcohol chemical classes discriminated the geographical origin of EC samples, especially for light and medium roasting conditions. However, the development of furans and sulfur compounds was pronounced in dark roasting EC samples [27,28], reducing the differences attributable to the geographical origin. N-heterocyclic compounds, e.g., pyrroles, increase as the degree of roasting increases (D treatment), while pyrazines decrease [29].
Table 3.
Changes in the VOCs identified in headspace of ECs resulting from different geographical origin and different roasting treatments.
In order to summarize the results and reduce the dataset dimensionality [30], PCA was conducted. Figure 3 shows the biplot of the PCA, carried out on the chemical classes quantified in the EC samples. As previously stated, the dark roasting treatment caused a higher abundance of volatile compounds, in agreement with the work of Wu et al. [31] and Charles et al. [32]. In particular, a greater quantity of furan, ester, N-heterocyclic and sulfur compounds were present in the dark-treated samples. Moreover, the dark roasting of coffee beans reduced differences in VOCs by variety and provenance, corroborating the results obtained in the LDA. Esters were more abundant in the coffee Arabica varieties, as previously found by Abdelwareth et al. [33]. Alcohols, ketones and aldehydes, as well as pyrazines, phenols and pyrimidines, were distributed between the light and medium treatments. Furthermore, the Arabica coffee samples had a higher quantity of phenols, contributing to spicy and smoky odors [33]. The roasted light and medium Robusta varieties, i.e., INDIA Cherry and VIETNAM, showed higher amounts of pyrazines and pyrimidines, while aldehydes, alcohols and ketones were generally more abundant in the Arabica variety samples. These results confirm the findings of Procida et al. [14], who reported higher amounts of alcohols in Arabica green coffee varieties. Furthermore, Sanz et al. [34] reported a higher quantity of sulfur compounds in coffee with 80% of Robusta variety, while aldehydes, ketones and alcohols were present in higher quantities in samples with 80 % of Arabica variety.
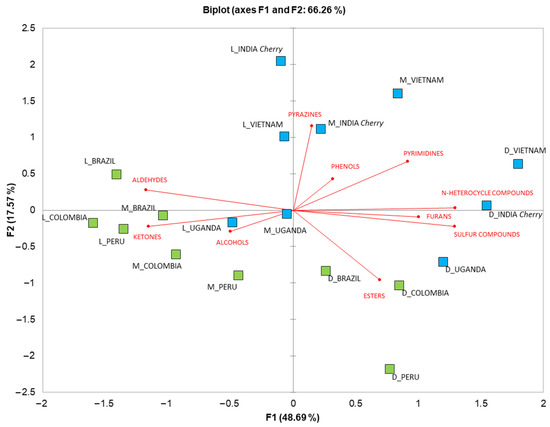
Figure 3.
Principal component analysis biplot of VOC classes detected in Arabica (in green) EC from Peru, Colombia and Brazil (in green), and Robusta (in blue) EC from India Cherry, Uganda and Vietnam (in blue) at three different roasting levels (L = light; M = medium; D = dark).
4. Conclusions
The present study has examined the role of volatile compounds in ECs brewed using Arabica and Robusta coffee, in discriminating the geographical origin of coffee at three different roasting levels. Using linear discriminant analysis to process VOC chemical class data, the coffee samples were 97.53% correctly classified in cross-validation. Classification errors occurred for coffee samples with a higher degree of roasting (dark), due to the formation of volatile compounds, such as furans and sulfur compounds, which reduced the differences in the VOC profiles. A second major finding was the possibility to discriminate the samples according to the Arabica or Robusta variety, as particular chemical classes of VOCs are more representative of one or the other variety. The evidence from this study implies that volatile compounds in espresso coffee may be potential markers of coffee origin, variety, and roasting, providing the possibility to check several quality parameters in a single analysis.
Author Contributions
Conceptualization, F.S.; methodology, F.S., A.D.V. and A.B.; formal analysis, A.D.V. and A.B.; investigation, A.D.V. and A.B; resources, F.S.; data curation, A.D.V. and A.B.; writing—original draft preparation, A.D.V. and A.B.; writing—review and editing, F.S., A.D.V. and A.B.; supervision, F.S.; project administration, F.S. All authors have read and agreed to the published version of the manuscript.
Funding
This research received no external funding.
Institutional Review Board Statement
No ethical approval was required for this study, since the animals were reared under actual farm conditions, and no distress, pain, suffering or lasting harm was caused to them. The animals were managed in compliance with the European requirements concerning the protection of animals used for scientific purposes (Dir. 2010/63/UE), as implemented by the Italian legislation (DL n. 26, 4 March 2014).
Informed Consent Statement
Not applicable.
Data Availability Statement
Data supporting the conclusions of this article not already presented in the tables and figures will be available from the corresponding author (A.D.V.) upon reasonable request.
Conflicts of Interest
The authors declare no conflict of interest. The funders had no role in the design of the study; in the collection, analyses or interpretation of data; in the writing of the manuscript, or in the decision to publish the results.
References
- Seninde, D.R.; Chambers, E., IV. Coffee Flavor: A Review. Beverages 2020, 6, 44. [Google Scholar] [CrossRef]
- De Vivo, A.; Tricarico, M.C.; Sarghini, F. Espresso coffee design based on non-monotonic granulometric distribution of aromatic profile. Food Res. Int. 2019, 123, 650–661. [Google Scholar] [CrossRef] [PubMed]
- Toledo, P.R.A.B.; Pezza, L.; Pezza, H.R.; Toci, A.T. Relationship Between the Different Aspects Related to Coffee Quality and Their Volatile Compounds. CRFSFS 2016, 15, 705–719. [Google Scholar] [CrossRef] [PubMed]
- Wang, X.; Wang, Y.; Hu, G.; Hong, D.; Guo, T.; Li, J.; Li, Z.; Qiu, M. Review on factors affecting coffee volatiles: From seed to cup. J. Sci. Food Agric. 2022, 102, 1341–1352. [Google Scholar] [CrossRef]
- De Vivo, A.; Genovese, A.; Tricarico, M.C.; Aprea, A.; Sacchi, R.; Sarghini, F. Volatile compounds in espresso resulting from a refined selection of particle size of coffee powder. J. Food Compost. Anal. 2022, 114, 104779. [Google Scholar] [CrossRef]
- Toci, A.T.; Azevedo, D.A.; Farah, A. Effect of roasting speed on the volatile composition of coffees with different cup quality. Food Res. Int. 2020, 137, 109546. [Google Scholar] [CrossRef]
- Gloess, A.N.; Vietri, A.; Wieland, F.; Smrke, S.; Schönbächler, B.; López, J.A.S.; Petrozzi, S.; Bongers, S.; Koziorowski, T.; Yeretzian, C. Evidence of different flavour formation dynamics by roasting coffee from different origins: On-line analysis with PTR-ToF-MS. Int. J. Mass Spectrom. 2014, 365, 324–337. [Google Scholar] [CrossRef]
- Bertrand, B.; Boulanger, R.; Dussert, S.; Ribeyre, F.; Berthiot, L.; Descroix, F.; Joët, T. Climatic factors directly impact the volatile organic compound fingerprint in green Arabica coffee bean as well as coffee beverage quality. Food Chem. 2012, 125, 2575–2583. [Google Scholar] [CrossRef]
- Joёt, T.; Laffargue, A.; Descroix, F.; Doulbeau, S.; Bertrand, B.; de kochko, A.; Dussert, S. Influence of environmental factors, wet processing and their interactions on the biochemical composition of green Arabica coffee beans. Food Chem. 2010, 118, 693–701. [Google Scholar] [CrossRef]
- Zakidou, P.; Plati, F.; Matsakidou, A.; Varka, E.M.; Blekas, G.; Paraskevopoulou, A. Single Origin Coffee Aroma: From Optimized Flavor Protocols and Coffee Customization to Instrumental Volatile Characterization and Chemometrics. Molecules 2021, 26, 4609. [Google Scholar] [CrossRef]
- Angeloni, S.; Mustafa, A.M.; Abouelenein, D.; Alessandroni, L.; Acquaticci, L.; Nzekoue, F.K.; Petrelli, R.; Sagratini, G.; Vittori, S.; Torregiani, E.; et al. Characterization of the Aroma Profile and Main Key Odorants of Espresso Coffee. Molecules 2021, 26, 3856. [Google Scholar] [CrossRef] [PubMed]
- Marek, G.; Dobrzanski, B.; Oniszczuk, T.; Combrzynski, M.; Cwikła, D.; Rusinek, R. Detection and Differentiation of Volatile Compound Profiles in Roasted Coffee Arabica Beans from Different Countries Using an Electronic Nose and GC-MS. Sensors 2020, 20, 2124. [Google Scholar] [CrossRef] [PubMed]
- Demianová, A.; Bobkova, A.; Lidiková, J.; Jurcaga, L.; Bobko, M.; Belej, L.; Kolek, E.; Poláková, K.; Iriondo-DeHond, A.; del Castillo, M.D. Volatiles as chemical markers suitable for identification of the geographical origin of green Coffea arab. L. Food Control 2022, 136, 108869. [Google Scholar] [CrossRef]
- Procida, G.; Lagazio, C.; Cateni, F.; Zacchigna, M.; Cichelli, A. Characterization of Arabica and Robusta volatile coffees composition by reverse carrier gas headspace gas chromatography–mass spectrometry based on a statistical approach. Food Sci. Biotechnol. 2020, 29, 1319–1330. [Google Scholar] [CrossRef]
- Vezzulli, F.; Bertuzzi, T.; Rastelli, S.; Mulazzi, A.; Lambri, M. Sensory profile of Italian Espresso brewed Arabica Specialty Coffee under three roasting profiles with chemical and safety insight on roasted beans. Int. J. Food Sci. 2021, 56, 6765–6776. [Google Scholar] [CrossRef]
- Clarke, R. Roasting and Grinding. In Coffee: Volume 2: Technology, 2nd ed.; Clarke, R., Macrae, R., Eds.; Elsevier Applied Science: Barking, UK, 1989; pp. 73–108. [Google Scholar]
- Petracco, M. Percolation. In Espresso Coffee: The science of Quality, 2nd ed.; Illy, A., Viani, R., Eds.; Elsevier Academic Press: San Diego, CA, USA, 2005; pp. 259–289. [Google Scholar]
- Trugo, L.C.; Macrae, R. A Study of the Effect of Roasting on the Chlorogenic Acid Composition of Coffee Using HPLC Food. Food Chem. 1984, 15, 219–227. [Google Scholar] [CrossRef]
- Caprioli, G.; Cortese, M.; Odello, L.; Ricciutelli, M.; Sagratini, G.; Tomassoni, G.; Torregiani, E.; Vittori, S. Importance of Espresso Coffee Machine Parameters on the Extraction of Chlorogenic Acids in a Certified Italian Espresso by Using SPE-HPLC-DAD. J. Food Res. 2013, 2, 55–64. [Google Scholar] [CrossRef]
- Salamanca, C.A.; Fiol, N.; González, C.; Saez, M.; Villaescusa, I. Extraction of espresso coffee by using gradient of temperature. Effect on physicochemical and sensorial characteristics of espresso. Food Chem. 2017, 214, 622–630. [Google Scholar] [CrossRef]
- Rodrigues, N.P.; Bragagnolo, N. Identification and quantification of bioactive compounds in coffee brews by HPLC–DAD–MSn. J. Food Compost. Anal. 2013, 32, 105–115. [Google Scholar] [CrossRef]
- Moon, J.K.; Yoo, H.S.; Shibamoto, T. Role of Roasting Conditions in the Level of Chlorogenic Acid Content in Coffee Beans: Correlation with Coffee Acidity. J. Agric. Food Chem. 2009, 57, 5365–5369. [Google Scholar] [CrossRef]
- Tsai, C.F.; Jioe, I.P.J. The Analysis of Chlorogenic Acid and Caffeine Content and Its Correlation with Coffee Bean Color under Different Roasting Degree and Sources of Coffee (Coffea arabica Typica). Processes 2021, 9, 2040. [Google Scholar] [CrossRef]
- Petracco, M. Technology IV: Beverage Preparation: Brewing Trends for the New Millennium. In Coffee: Recent Developments, 1st ed.; Clarke, R.J., Vitzthum, O.G., Eds.; Blackwell Science Ltd.: Malden, MA, USA, 2001; pp. 140–164. [Google Scholar]
- Petracco, M. The cup. In Espresso Coffee: The science of Quality, 2nd ed.; Illy, A., Viani, R., Eds.; Elsevier Academic Press: San Diego, CA, USA, 2005; pp. 290–315. [Google Scholar]
- Nunes, F.M.; Coimbra, M.A.; Duarte, A.C.; Delgadillo, I. Foamability, Foam Stability, and Chemical Composition of Espresso Coffee as Affected by the Degree of Roast. J. Agric. Food Chem. 1997, 45, 3238–3243. [Google Scholar] [CrossRef]
- Petisca, C.; Pérez-Palacios, T.; Pinho, O.; Ferreira, I.M.P.L.V.O. Optimization and Application of a HS-SPME-GC-MS Methodology for Quantification of Furanic Compounds in Espresso Coffee. Food Anal. Methods 2014, 7, 81–88. [Google Scholar] [CrossRef]
- Kim, S.Y.; Ko, J.A.; Kang, B.S.; Park, H.J. Prediction of key aroma development in coffees roasted to different degrees by colorimetric sensor array. Food Chem. 2017, 240, 808–816. [Google Scholar] [CrossRef] [PubMed]
- Romano, A.; Luca Cappellin, L.; Sara Bogialli, S.; Pastore, P.; Navarini, L.; Biasioli, F. Monitoring In Vitro and In Vivo Aroma Release of Espresso Coffees with Proton-Transfer-Reaction Time-of-Flight Mass Spectrometry. Appl. Sci. 2022, 12, 10272. [Google Scholar] [CrossRef]
- Bro, R.; Smilde, A.K. Principal component analysis. Anal. Methods 2014, 6, 2812–2831. [Google Scholar] [CrossRef]
- Wu, H.; Lu, P.; Liu, Z.; Sharifi-Rad, J.; Suleria, H.A.R. Impact of roasting on the phenolic and volatile compounds in coffee beans. Food Sci. Nutr. 2022, 10, 2408–2425. [Google Scholar] [CrossRef]
- Charles, M.; Romano, A.; Yener, S.; Barnabà, M.; Navarini, L.; Märk, T.D.; Biasoli, F.; Gasperi, F. Understanding flavour perception of espresso coffee by the combination of a dynamic sensory method and in-vivo nosespace analysis. Food Res. Int. 2015, 69, 9–20. [Google Scholar] [CrossRef]
- Abdelwareth, A.; Zayed, A.; Farag, M.A. Chemometrics-based aroma profiling for revealing origin, roasting indices, and brewing method in coffee seeds and its commercial blends in the Middle East. Food Chem. 2021, 349, 129162. [Google Scholar] [CrossRef]
- Sanz, C.; Maeztu, L.; Zapelena, M.J.; Bello, J.; Cid, C. Profiles of volatile compounds and sensory analysis of three blends of coffee: Influence of different proportions of Arabica and Robusta and influence of roasting coffee with sugar. J. Sci. Food Agric. 2002, 82, 840–847. [Google Scholar] [CrossRef]


Disclaimer/Publisher’s Note: The statements, opinions and data contained in all publications are solely those of the individual author(s) and contributor(s) and not of MDPI and/or the editor(s). MDPI and/or the editor(s) disclaim responsibility for any injury to people or property resulting from any ideas, methods, instructions or products referred to in the content. |
© 2023 by the authors. Licensee MDPI, Basel, Switzerland. This article is an open access article distributed under the terms and conditions of the Creative Commons Attribution (CC BY) license (https://creativecommons.org/licenses/by/4.0/).