4. Discussion
Satisfactory esthetics following orthognathic surgery are the result of using reliable and accurate prediction software [
13,
14]. Therefore, there have been several attempts to clarify the accuracy of such programs. As the popularity of 3D orthognathic treatment planning using virtual models has increased, many commercial 3D planning programs with varying algorithms and models have been released on the market. Dolphin imaging software (Chatsworth, CA, USA) was one of the most widely used programs in the previous study, with plenty of evidence supporting its accuracy. However, Dolphin cannot superimpose or compare STL files. A majority of studies employed another program to address this issue [
7,
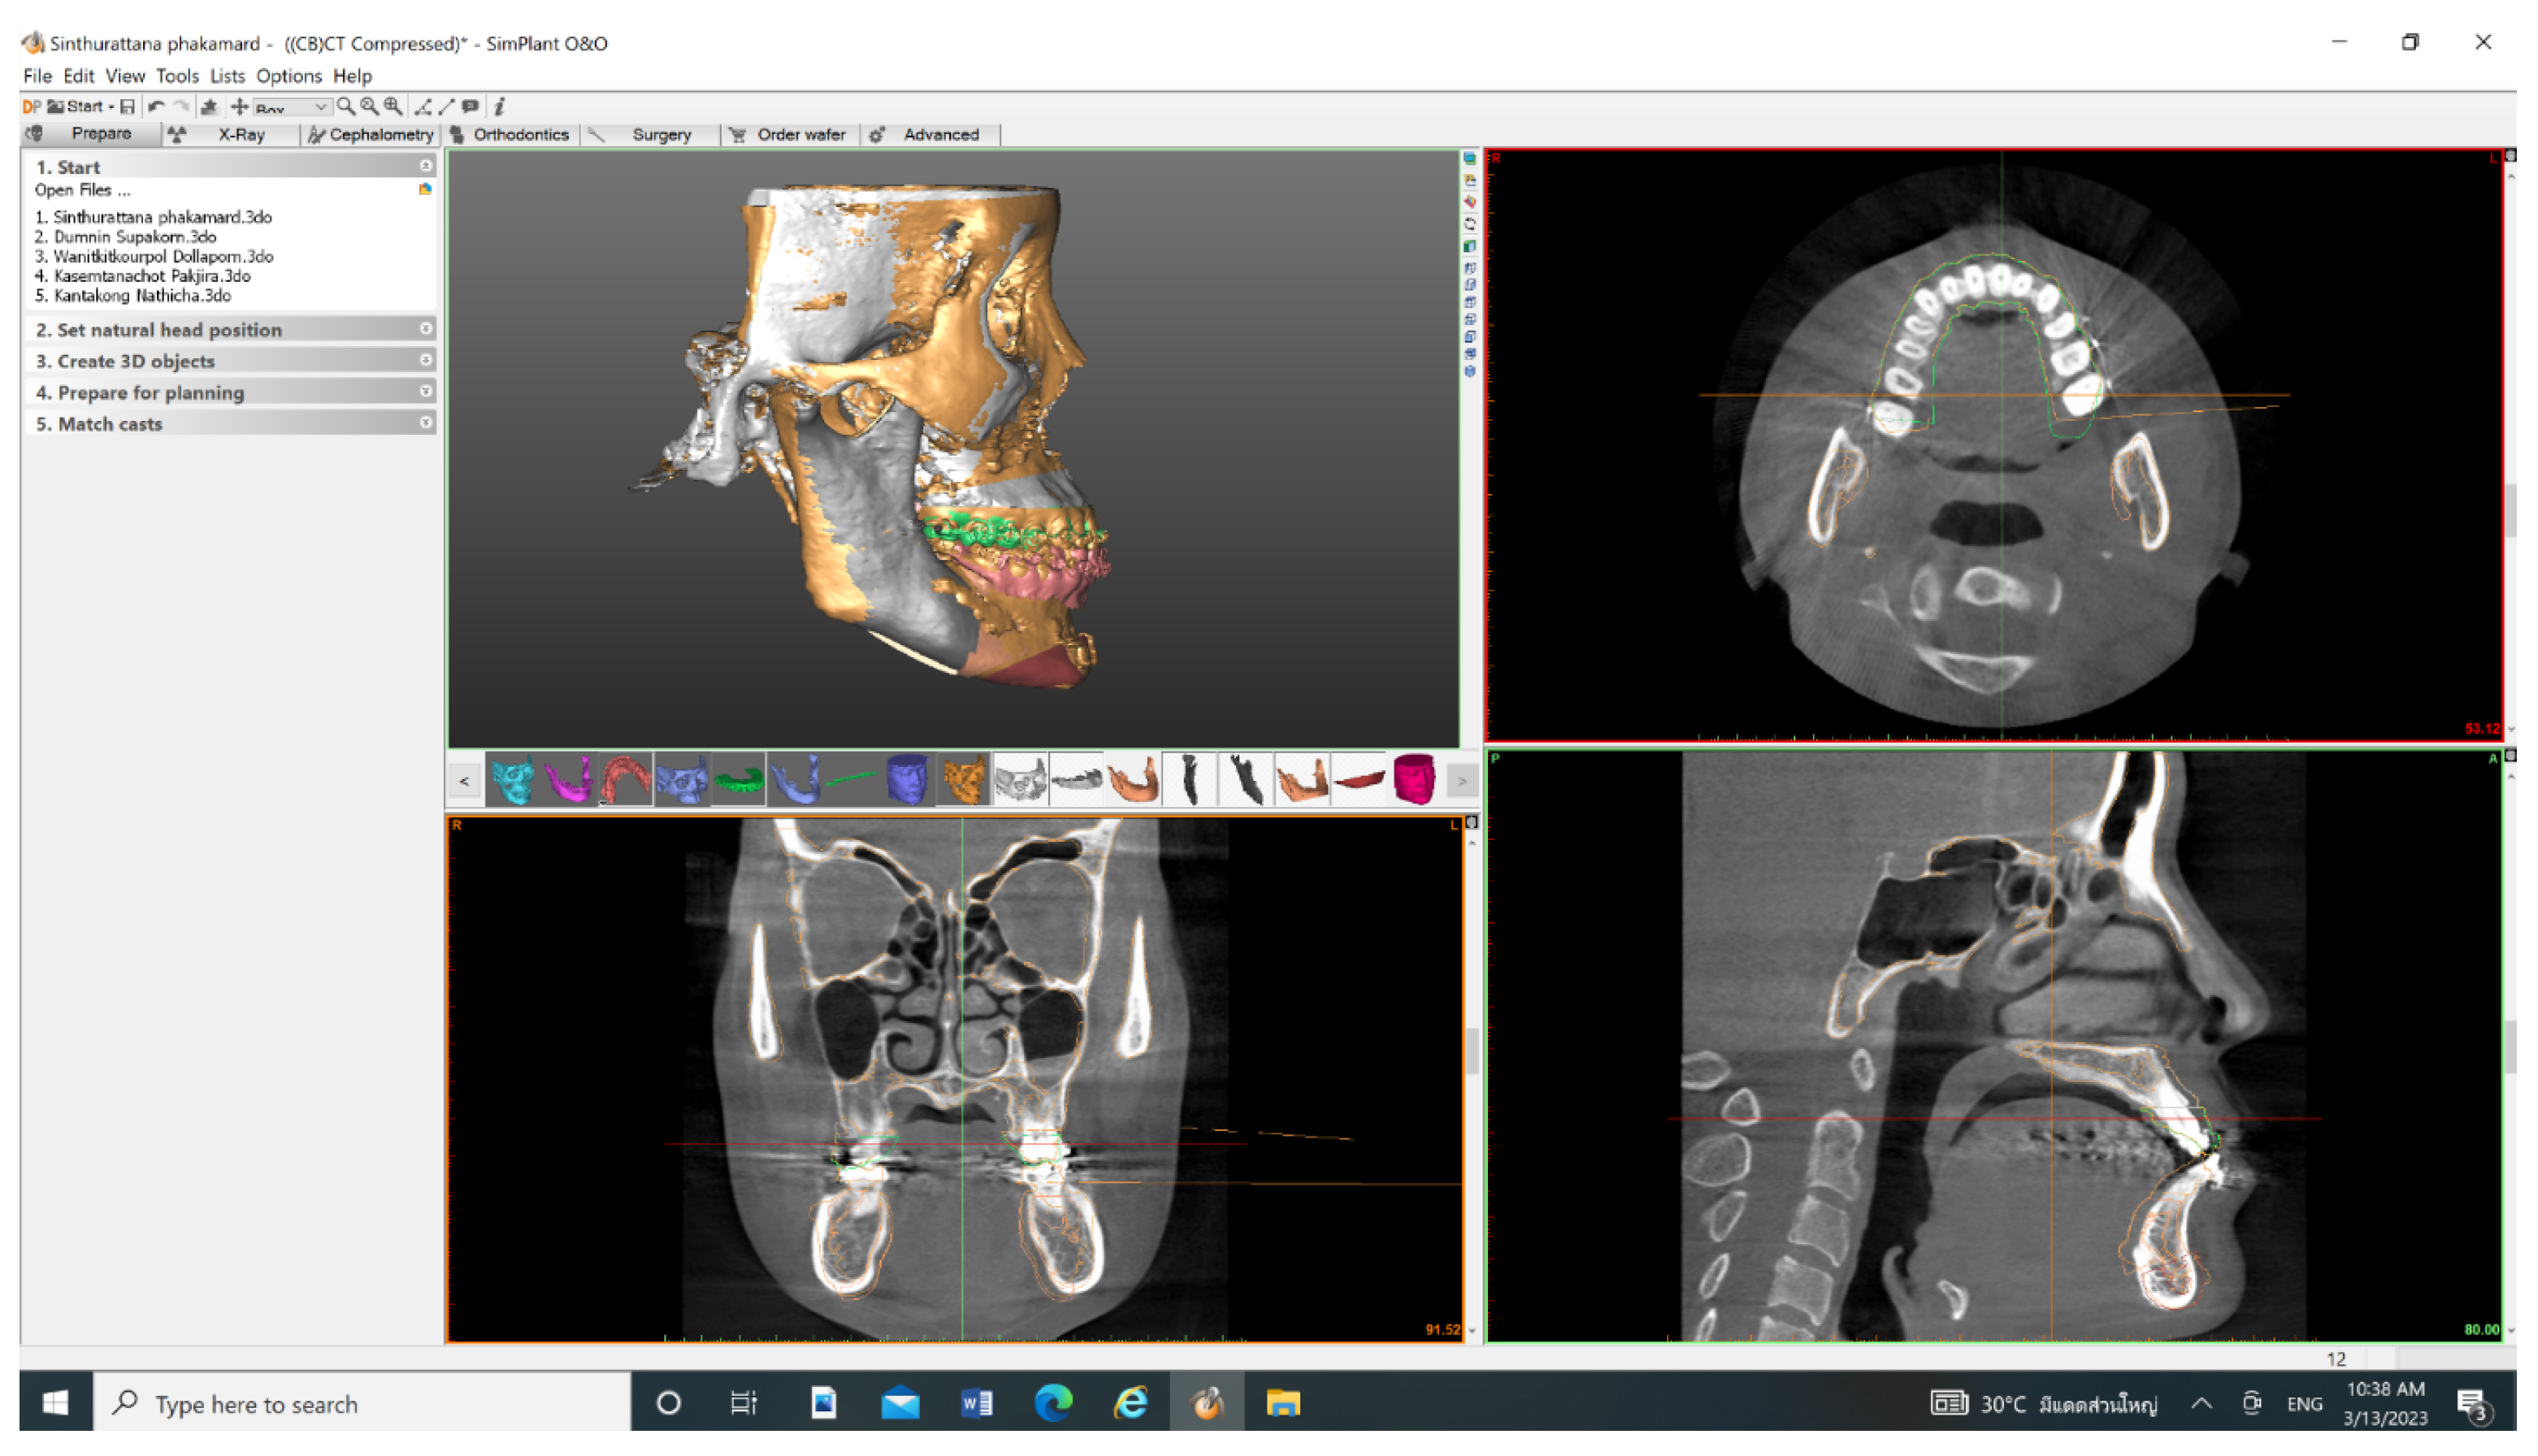
15]. Simplant O&O, on the other hand, can both create and superimpose STL files, removing the need for additional software and reducing the error introduced by the imaging registration process. As a result, the goal of this study was to assess the soft tissue prediction accuracy of Simplant O&O software. Previously, many articles investigated the precision of this program in predicting osseous structures and its ability to transfer virtual planning to an actual surgical outcome, and they discovered that this program provided satisfactory results [
16,
17]. However, there is a scarcity of literature on soft tissue prediction. To the best of our knowledge, this is the first study to assess Simplant O&O’s soft tissue prediction accuracy in patients with type III skeletal malocclusion.
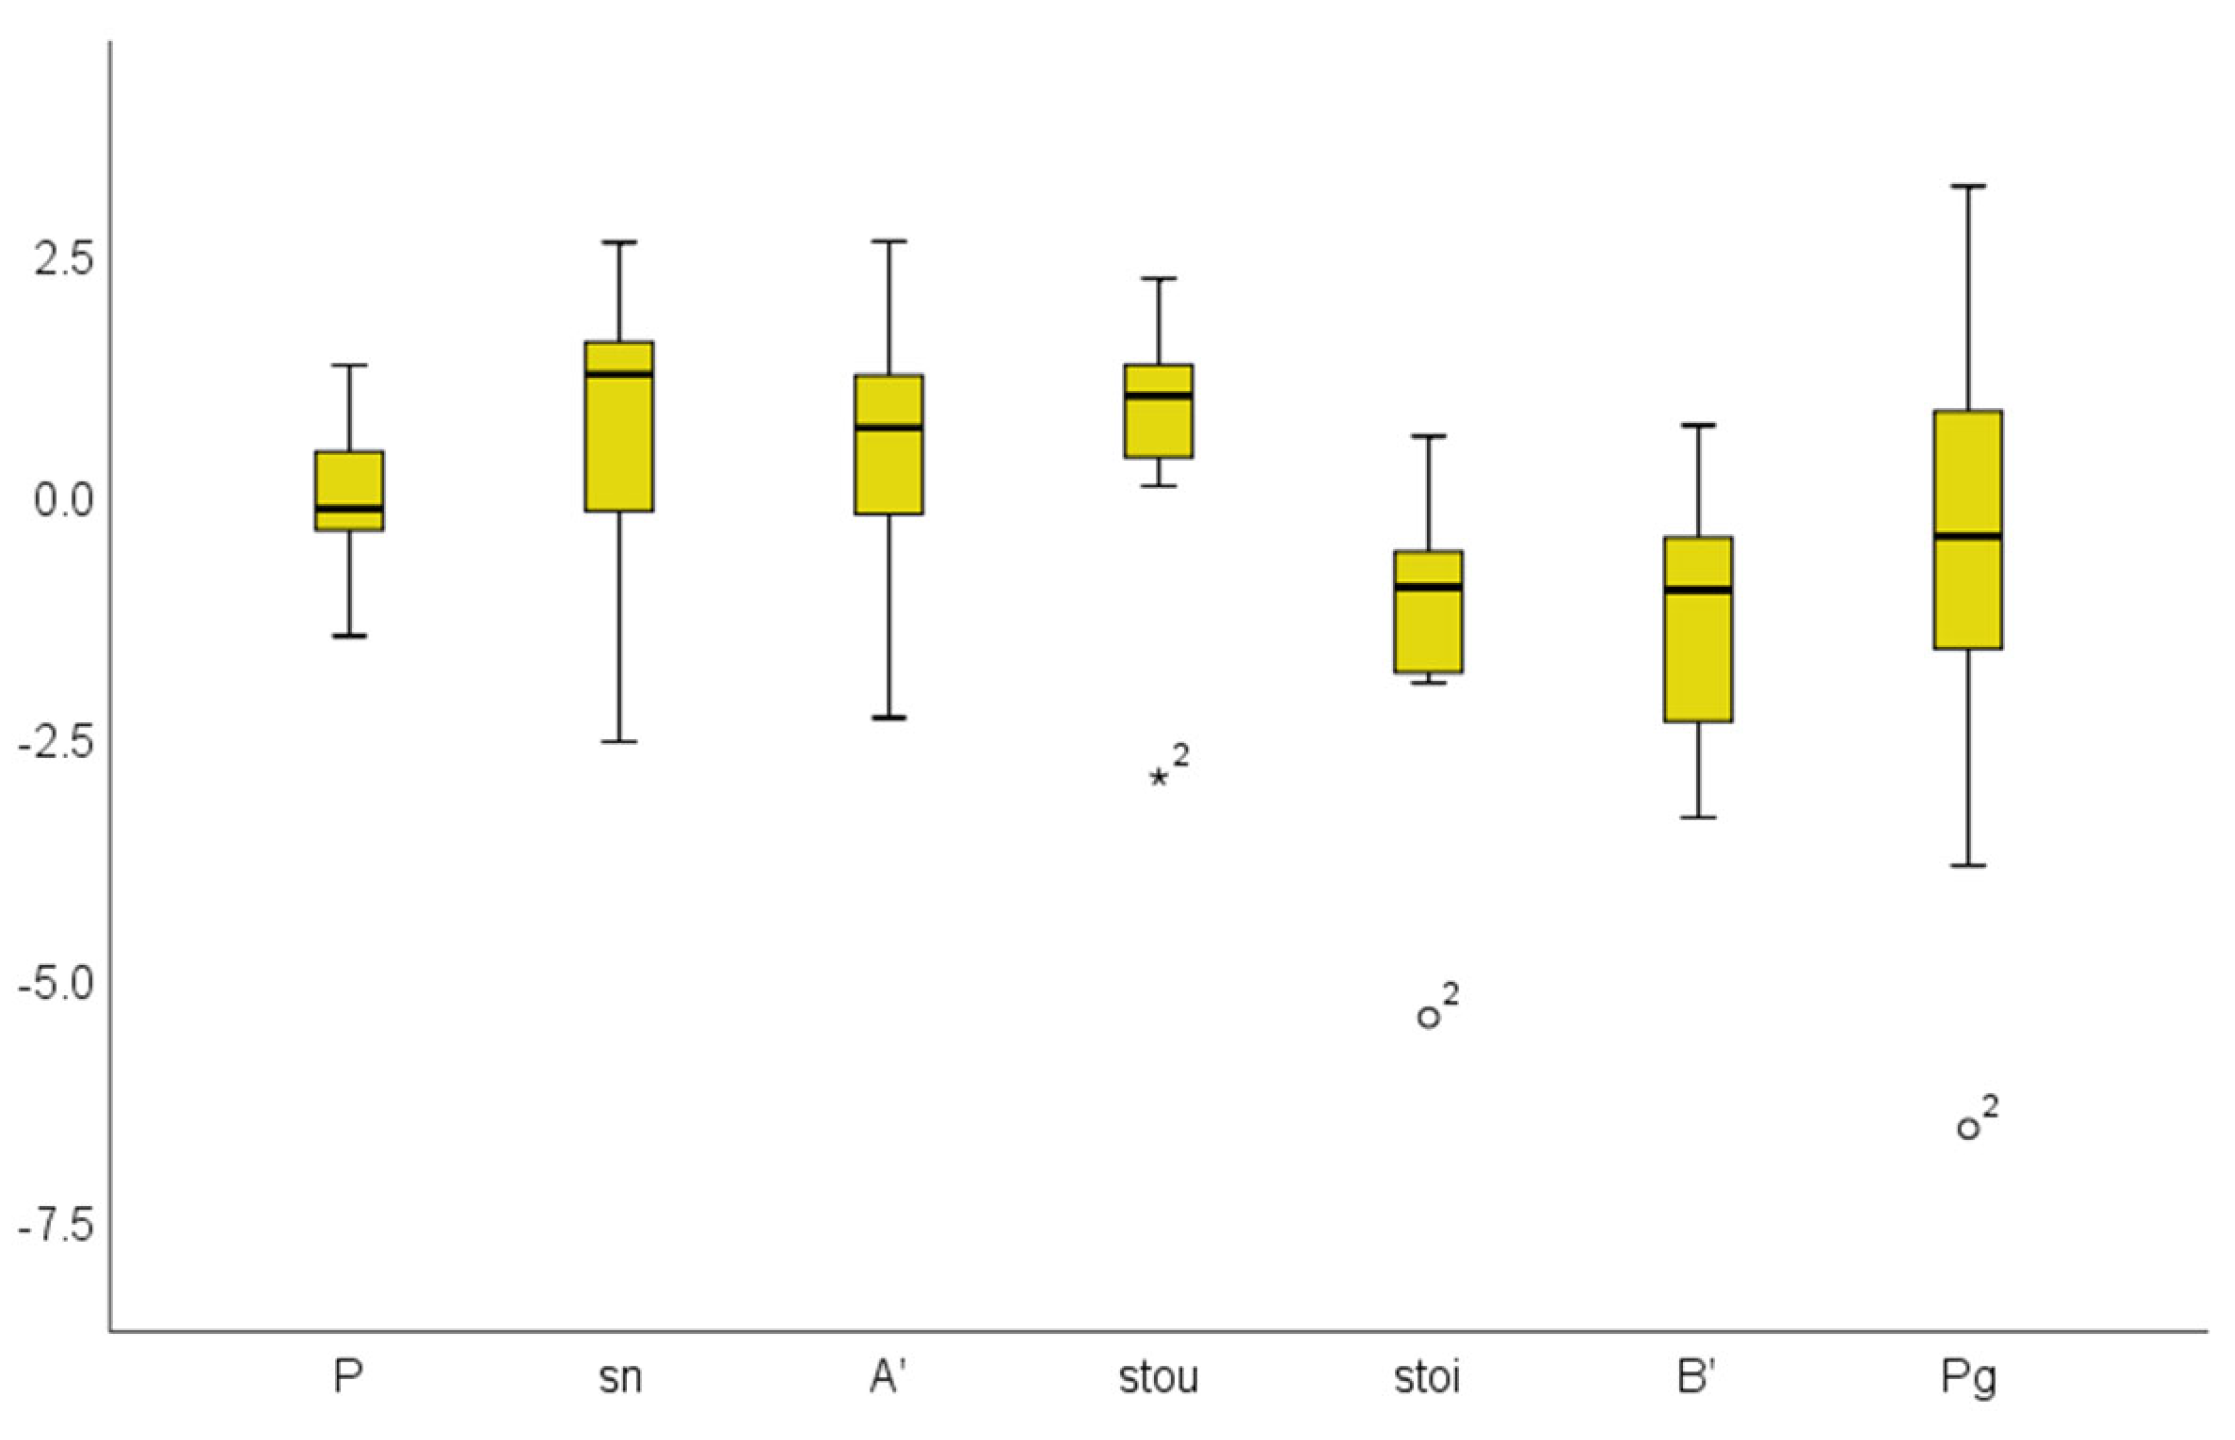
According to our findings, the Simplant prediction images had an overall linear mean errors of 1.73 and 1.03 mm for the one-jaw and two-jaw groups, respectively. Pronasele had the highest accuracy of both groups while pogonion and soft tissue point B had the lowest. The simulation errors in the mandible area were higher for two reasons. First, the mandible has more bony movements than the maxilla. The average sagittal advancement of the maxilla was 1.8 ± 1.3 mm, while the average mandibular setback distances were 4.5 and 6.5 mm for the one-jaw and two-jaw groups, respectively. This discrepancy corresponded to the surgical movement distance. Second, for the two-jaw group, the greater complexities in two-jaw surgeries may have resulted in small errors in the maxilla and larger errors in the mandible [
18]. Even though five patients of the one-jaw group had only mandibular setbacks, all landmarks showed some discrepancies, indicating that there were also soft tissue changes in the upper jaws, even when no interventions on the maxilla were performed. According to the findings of Jokic et al. [
19] and Naoumova et al. [
20], the thickness of the upper lip decreases after BSSRO because the surgery eliminates the pseudo-position of the lip that occurs as a result of compensation in class III cases.
In both groups, all of the landmarks showed significant differences when compared to the actual postoperative CBCTs. Simplant O&O’s soft-tissue prediction errors were expected to be less than 2 mm. Differences in the human face less than 2 mm are not visible to the human eye, according to Kaipatur et al. [
12]. Furthermore, many researchers in the literature have stated that prediction errors of less than 3 mm are not clinically significant [
21,
22,
23,
24]. Therefore, despite the fact that all of the landmarks showed significant differences, the mean values did not exceed the 2 mm accuracy threshold except for those of the stomian inferius and pogonion in the one-jaw group, as this is generally considered to be a visually perceptible facial difference, indicating that this error was not clinically significant.
There was also a correlation between the surgical distances and the landmark discrepancies. The sagittal mandibular movements in the one-jaw group were significantly correlated with stomian inferius whereas the sagittal maxilla and mandibular movements in the two-jaw group were significantly correlated with pronasele and pogonion, respectively. As a result, it could be implied that the greater the surgical movement, the lower the correlation expected from these areas.
Aside from the interpretation of the absolute values, the vector values represented the error directions. Pronasele, stomian inferius, soft tissue point B, and pogonion were all negative for both groups whereas other maxillary landmarks had positive values. As a result, this program’s soft tissue predictions for the maxilla, except for pronasele, are more posterior than they should be. The mandibular predictions, on the other hand, were more anterior than in reality. This could have occurred because orthodontic treatment after surgery can alter the Pg position due to the vertical force of elastic or tooth extrusion, which induces downward and backward mandibular rotational movements. The soft tissue pogonion will also move backward in relation to the underlying hard tissue [
25]. Other orthodontic tooth movements, such as upper or lower anterior retraction, can also affect lip position. Ramos et al. [
26] revealed that upper lip retraction due to maxillary incisor retraction occurred at a mean ratio of 1:0.75, and Kusnoto et al. [
27] found that every millimeter of mandibular incisor retraction resulted in 0.4 mm of upper lip retraction and 0.6 mm of lower lip retraction. Al-Abdwani et al. [
28] discovered that each 10-degree change in maxillary and mandibular incisor inclinations result in average horizontal changes of 0.4 mm and 0.3 mm for point A and point B, respectively. However, tooth extraction to relieve crowding or to correct abnormal inclination is usually required prior to surgery; therefore, the extensive changes in tooth movements occurred and were completed before taking the preoperative CBCTs. Only minor tooth movements occurred during the postoperative period, and they had a minor influence on the soft tissue changes after surgery, with no significant impacts on the results interpretation.
There are some differences between the results of Simplant O&O and those of other well-known programs. Maxilim 3D software (Medicim—Medical Image Computing, Mechelen, Belgium) was studied by Liebregts et al. [
13] and Shafi et al. [
29]. Both authors concluded that Maxilim’s 3D soft tissue prediction was clinically acceptable in general. Liebregts et al. found that the lower lip region had the lowest accuracy and the sub-nasal region had the highest accuracy when used for patients who had undergone BSSO for mandibular advancements. Shafi et al., on the other hand, studied 13 patients who underwent Le Fort I surgeries and concluded that the upper lip area was the most unpredictable. For Dolphin software studies, Resnick et al. [
15] and Knoops et al. [
7] studied patients who underwent only Le Fort I maxillary movements, and they identified subnasale and subalar areas as having the poorest midline agreement. Meanwhile, Elshebiny et al. [
30] studied patients who underwent bimaxillary surgery and discovered that the most underpredicted areas for Dolphin 3D were nasolabial angle, soft tissue point A, and subalar area, which are roughly the same areas identified in the two studies above. As a result, we can conclude that 3D soft tissue prediction using Dolphin has acceptable accuracy, though with limitations in the subalar region. Our findings were more in line with Maxilim than with Dolphin. It is possible that this was due to the fact that both Simplant O&O and Maxilim software use the mass tensor model algorithm (MTM) [
31,
32] whereas Dolphin 3D imaging employs the region growing algorithm for segmentation and the sparse landmark-based photographic morphing algorithm for virtual model prediction, which was originally developed for two-dimensional predictions and then adapted to three-dimensional predictions [
7,
33]. All of the aforementioned programs rely on semi-automatic segmentation tools that necessitate user intervention to locate seed points or initiate contours. Recently, artificial intelligence (AI) systems or fully automatic segmentation have been validated and found to be accurate for the goal of maximizing efficiency and reducing operator variability, and they are capable of improving prediction errors [
8]. However, more studies are required prior to determining actual clinical relevance.
There were several limitations in this study. First, the small sample size was a major impediment to reaching a definitive conclusion, especially for the one-jaw group. Because the inclusion criteria were quite strict, the number of subjects included was limited. The patients had skeletal type III malocclusion, and they also underwent orthognathic surgery with the same surgeon. To eliminate magnification discrepancies, both preoperative and postoperative CBCTs must be obtained from the same device. An intraoral scan and CBCT must be performed on the same day to reduce tooth movement caused by orthodontic force, which influences the fusion of the dental model to the virtual skull using voxel-based matching methods. Furthermore, only five of the fourteen patients had single-jaw surgeries. Bimaxillary surgery for skeletal type III correction has been on the rise in recent centuries, while mandibular setback surgery has been on the decline [
34], which is due to the discovery that mandibular setback surgery may result in increased upper airway resistance and a narrowing of the size and proportion of the pharyngeal airway more than would result from bimaxillary surgery, leading to airway obstruction and contributing to the development of obstructive sleep apnea syndrome [
33,
35]. As a result, combined maxillary and mandibular osteotomies are frequently used for patients who have a significant anteroposterior discrepancy, resulting in a limited number of single-jaw samples. A larger study sample size may enable stronger conclusions to be drawn.
Second, the sample was not perfectly homogeneous. As previously stated, in addition to the fewer samples in the one-jaw group, some participants in both groups underwent genioplasty. Considering that this procedure only affects pogonion landmarks, we established the results without performing the subset analysis. To eliminate this confounding factor, a future study with definitive homogeneous samples is required.
Third, this study only examined midline landmarks and did not evaluate lateral landmarks. Since this study used soft tissue volumes and the postoperative CBCTs were collected at least 4 months after surgery, the fixed appliances remained in place. Metal artifacts from the metal brackets were scattered and had strong impacts on the landmark identifications in the lateral areas, making it difficult to produce reliable results from the lateral areas of the face. The use of a facial scan imported and fused with a virtual model, rather than a soft tissue volume created from a CBCT, can possibly solve this problem and produce a more definitive conclusion.
Finally, the time interval between surgery and postoperative CBCT varies between 4 and 13 months. Due to an ethical issue, there is no protocol for taking CBCTs six months after surgery or after completing orthodontic treatment, and this is to be accomplished in a way that does not expose a patient to additional radiation. Therefore, the postoperative CBCTs used in the study were taken when the surgeon needed to check bone healing and remove plate fixations, which occurred approximately 4–6 months after surgery. According to Van der Vlis et al. [
36], only 20% of the initial edema remained after three months. However, significant reductions in soft tissue swelling continue to occur 6–12 months after surgery. As a result, some participants may have residual soft tissue swelling, which alters the interpretation of the results.


 and
and 


