Article

Analysis of Shield Tunnels Undercrossing an Existing Building and Tunnel Reinforcement Measures

1
School of Civil Engineering, Central South University, Changsha 410075, China
2
Key Laboratory of Heavy Railway Engineering Structure of Education Ministry, Central South University, Changsha 410075, China
3
China Railway Transportation Investment Group Co., Ltd., Nanning 530000, China
*
Author to whom correspondence should be addressed.
Appl. Sci. 2023, 13(9), 5729; https://doi.org/10.3390/app13095729
Submission received: 4 April 2023 / Revised: 21 April 2023 / Accepted: 25 April 2023 / Published: 6 May 2023
(This article belongs to the Special Issue Advances in Sustainable Geotechnical Engineering)

Abstract

:
Research on tunnel excavation has rarely considered the effect of the tunnel excavation on a complete building. Therefore, this paper considered a building with a double basement and piles, and a three-dimensional finite-element model for shield tunnels undercrossing an existing building was established to study the effects of the excavation of double-shield tunnels on the displacement and internal forces of soil, segments, piles, and buildings. Grouting reinforcement technology was used in the model to analyze the effect of grouting reinforcement on pile displacement and building subsidence. The results showed that for every 100 kPa increase in grouting pressure, the maximum subsidence of the soil was reduced by 3.512 mm. The successive excavation of double-shield tunnels resulted in elliptical segments. The longitudinal and transverse stresses of the segments were effectively reduced by grouting pressure of 250 kPa. The excavation of tunnels had an obvious nonlinear effect on the maximum lateral displacement of the piles along the direction of excavation and the maximum subsidence of the building. When using deep-hole grouting reinforcement, the maximum lateral displacement of piles and the maximum subsidence of the building were effectively reduced by increasing the radial grouting reinforcement radius and adjusting the reinforcement range.

1. Introduction

With increasing urban populations, vehicle traffic in cities is becoming increasingly congested [1,2]. Metro systems greatly free up space at the street level, so hastening the construction of metro systems is one of the important means of relieving such urban problems as overground traffic congestion [3,4]. As one of the methods of tunnel excavation, shield tunneling is widely used because of its fast construction and small disturbance to the surrounding environment [5]. However, shield tunnels inevitably pass through complex strata, even under buildings. Therefore, during the construction phase of shield tunneling, it is very important to ensure little deformation of the soil and good mechanical properties of the segments and to control the deformation and subsidence of buildings [6,7].
Much research has been carried out on not only the subsidence and damage of soil but also the influencing factors of the mechanical properties of segments and improvement methods in the excavation stage of shield tunnels [8,9,10]. On the basis of monitoring data, Liu et al. [11] established a logical curve model to forecast surface subsidence. Lou et al. [12,13,14] researched the effects of working conditions on the ground surface and rock formation by establishing a 3D finite-element model for double-shield tunnels’ underpass pits, excavation of double-shield tunnels with steep slopes, and shield tunneling with small radii, respectively. Zhang et al. [15] proposed a new set of analytical methods for predicting ground-level subsidence and that of tunnels due to joint leakage. For a more rational selection of parameters for shield tunneling, Hou et al. [16] proposed the EAIW-IPSO algorithm. Islam and Iskander [17] summarized effect factors such as construction sequence, pillar width, and overburden depth on ground subsidence and internal force of tunnel lining by collecting a large quantity of field-measured data, experimental test data, and finite-element analysis data. Lv J et al. [18] developed a numerical model and concluded that shield tunnel construction with isolation pile reinforcement could abate the deformation of the tunnel lining and ground subsidence. Lin et al. [19] developed a numerical model to study ground subsidence in straight and curved tunnels by shield- and pipe-jacking methods. Hou et al. [20] proposed a new, simplified method of exploring the relationship between coupling resonance frequency and Young’s modulus for tunnels. Using a 3D finite-difference simulation approach, Do et al. [21] evaluated the impact of shield performance factors on surface subsidence and lining reactions. Kang et al. [22] proposed a deformation-analysis method for shield tunnels considering the tunnel-shear effect and tunnel depth and verified the effectiveness and feasibility of the method by using three-dimensional finite-element analysis and measured data. Gan et al. [23] and Liu et al. [24] used theoretical methods to study the impact of ground displacement caused by tunnel excavation on existing tunnels. Lu et al. [25] developed suitability charts that can reasonably select stabilizers for improving the engineering performance of tunnels.
As can be seen from the above, some scholars [8,9,10,11] studied the impact of shield tunneling on soil subsidence, while others [16,17,25] studied the impact of shield parameters on surface subsidence. Other scholars [12,23,24] conducted studies on the impact of shield tunnel excavation on existing pits and tunnels. From the existing studies, most scholars have focused on the effects of shield tunnel excavation on soil, segments, existing pits, and tunnels. However, few have considered the effects of shield tunnel excavation on external buildings, especially the effect of tunnel excavation on complete buildings with basements and piles. Many scholars have conducted studies on grouting reinforcement technology, but many of these focused on the effects of grouting reinforcement technology on shield tunnels and soils and a few on the effects of grouting reinforcement technology on complete buildings with basements and piles. In view of this, this paper studies the effect of double-shield tunnel excavation on a complete building with a basement and piles by using a mathematical model and combining engineering measurement data. We add grouting reinforcement measures to the model to study the effect of grouting reinforcement technology on a complete building with a basement and piles, which will make up for the shortcomings of existing research and provide a theoretical basis for future excavation of shield tunnels undercrossing existing buildings.
Against a background of a section of Changsha Metro Line 6 where double-shield tunnels cross under an existing building, as shown in Figure 1, this paper establishes the model of the eight-story building with a double basement and piles, with shield tunnel excavation carried out under the building. Using the established model, the effects of the excavation of double-shield tunnels on soil displacement, segment displacement and internal force, pile displacement, and building subsidence were studied. In addition, the influence of grouting pressure on soil displacement, segment displacement and internal force, pile displacement, and building subsidence was analyzed, and reasonable grouting pressure parameters were further explored. At the same time, grouting reinforcement technology was used in the model, and the control effect of grouting reinforcement on pile displacement and building subsidence was analyzed. Grouting reinforcement parameters that can effectively reduce pile foundation displacement and building subsidence caused by shield tunnel excavation are further proposed.

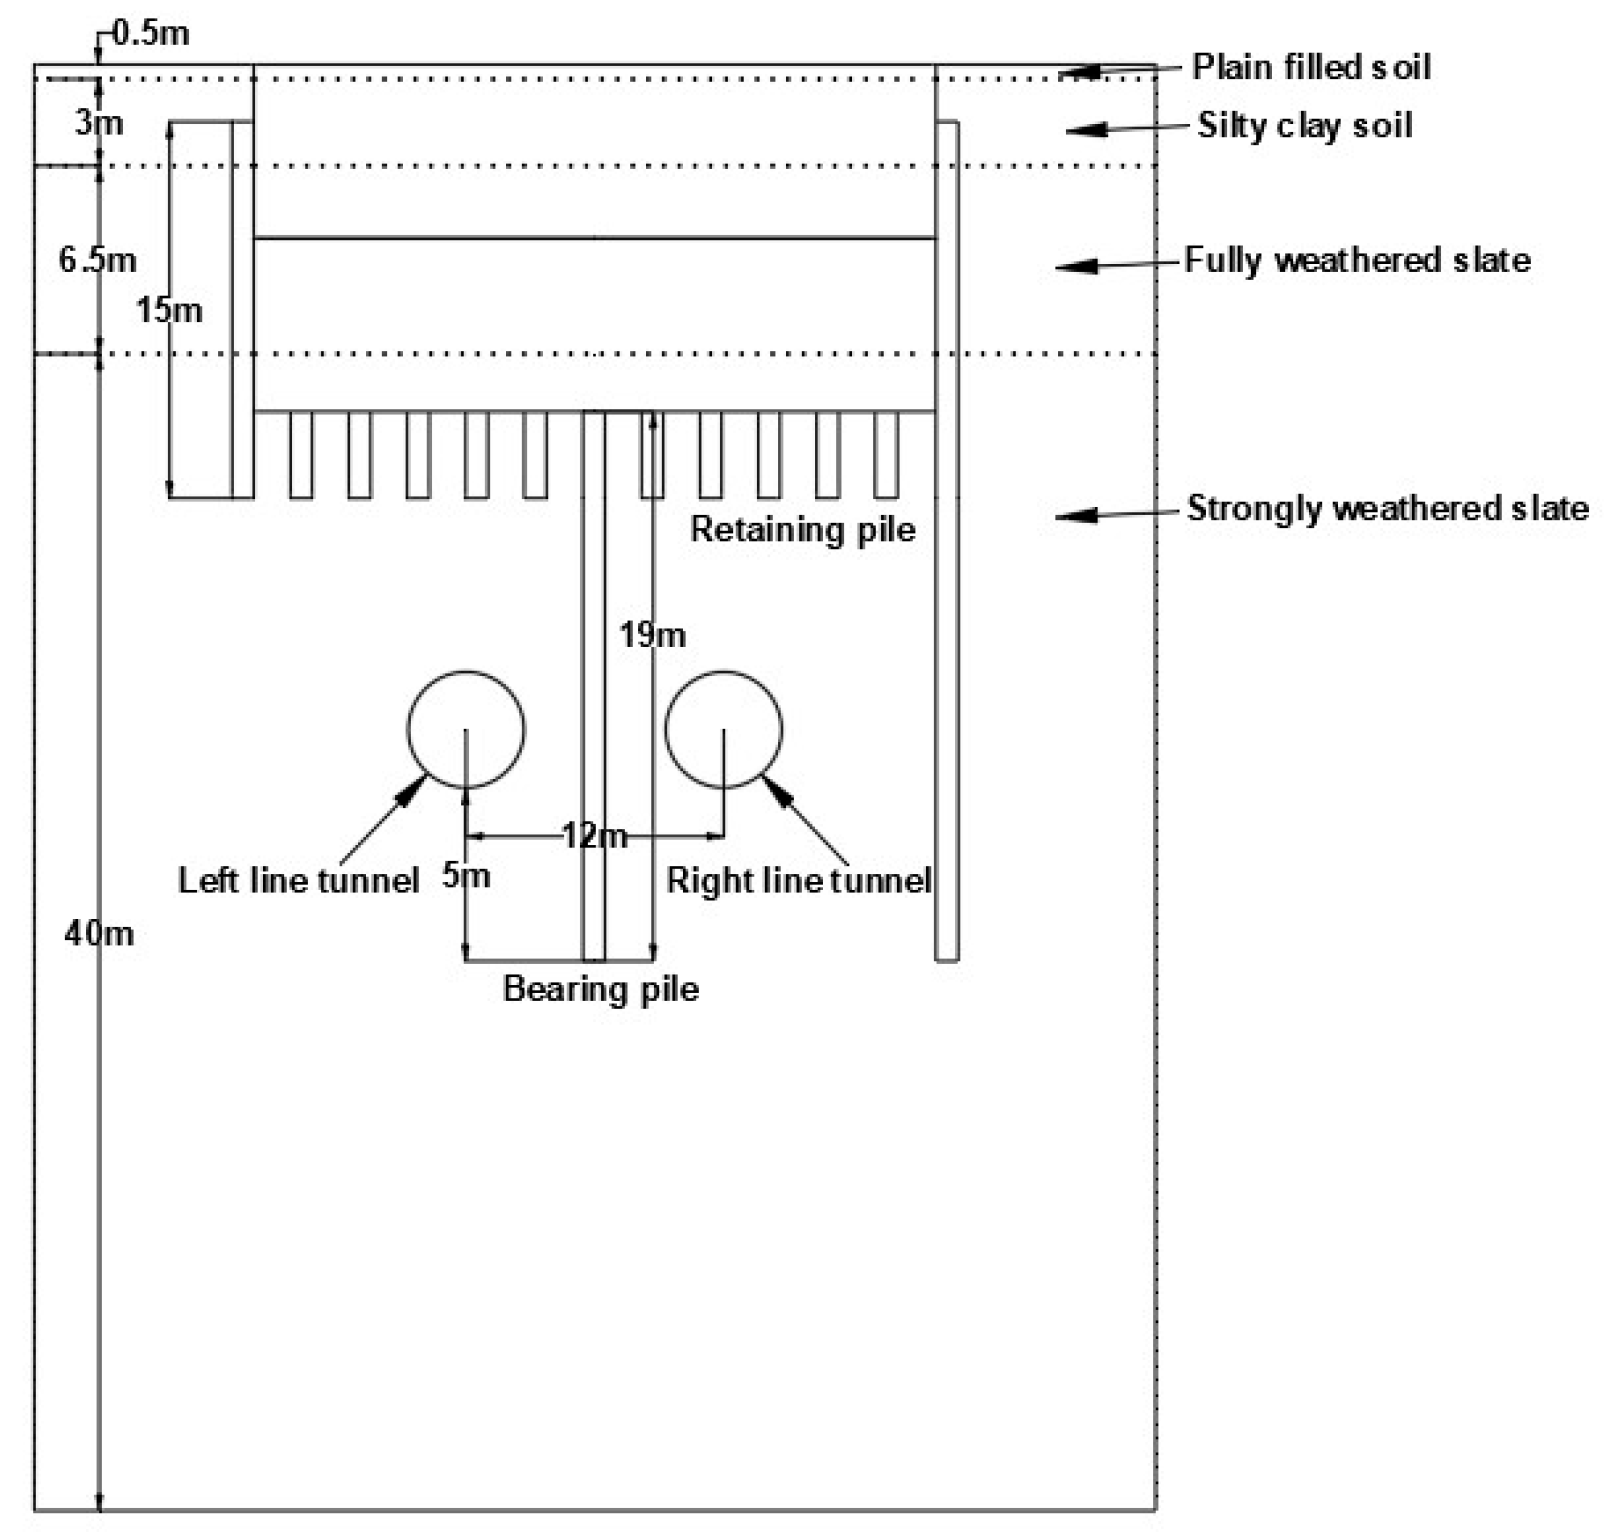
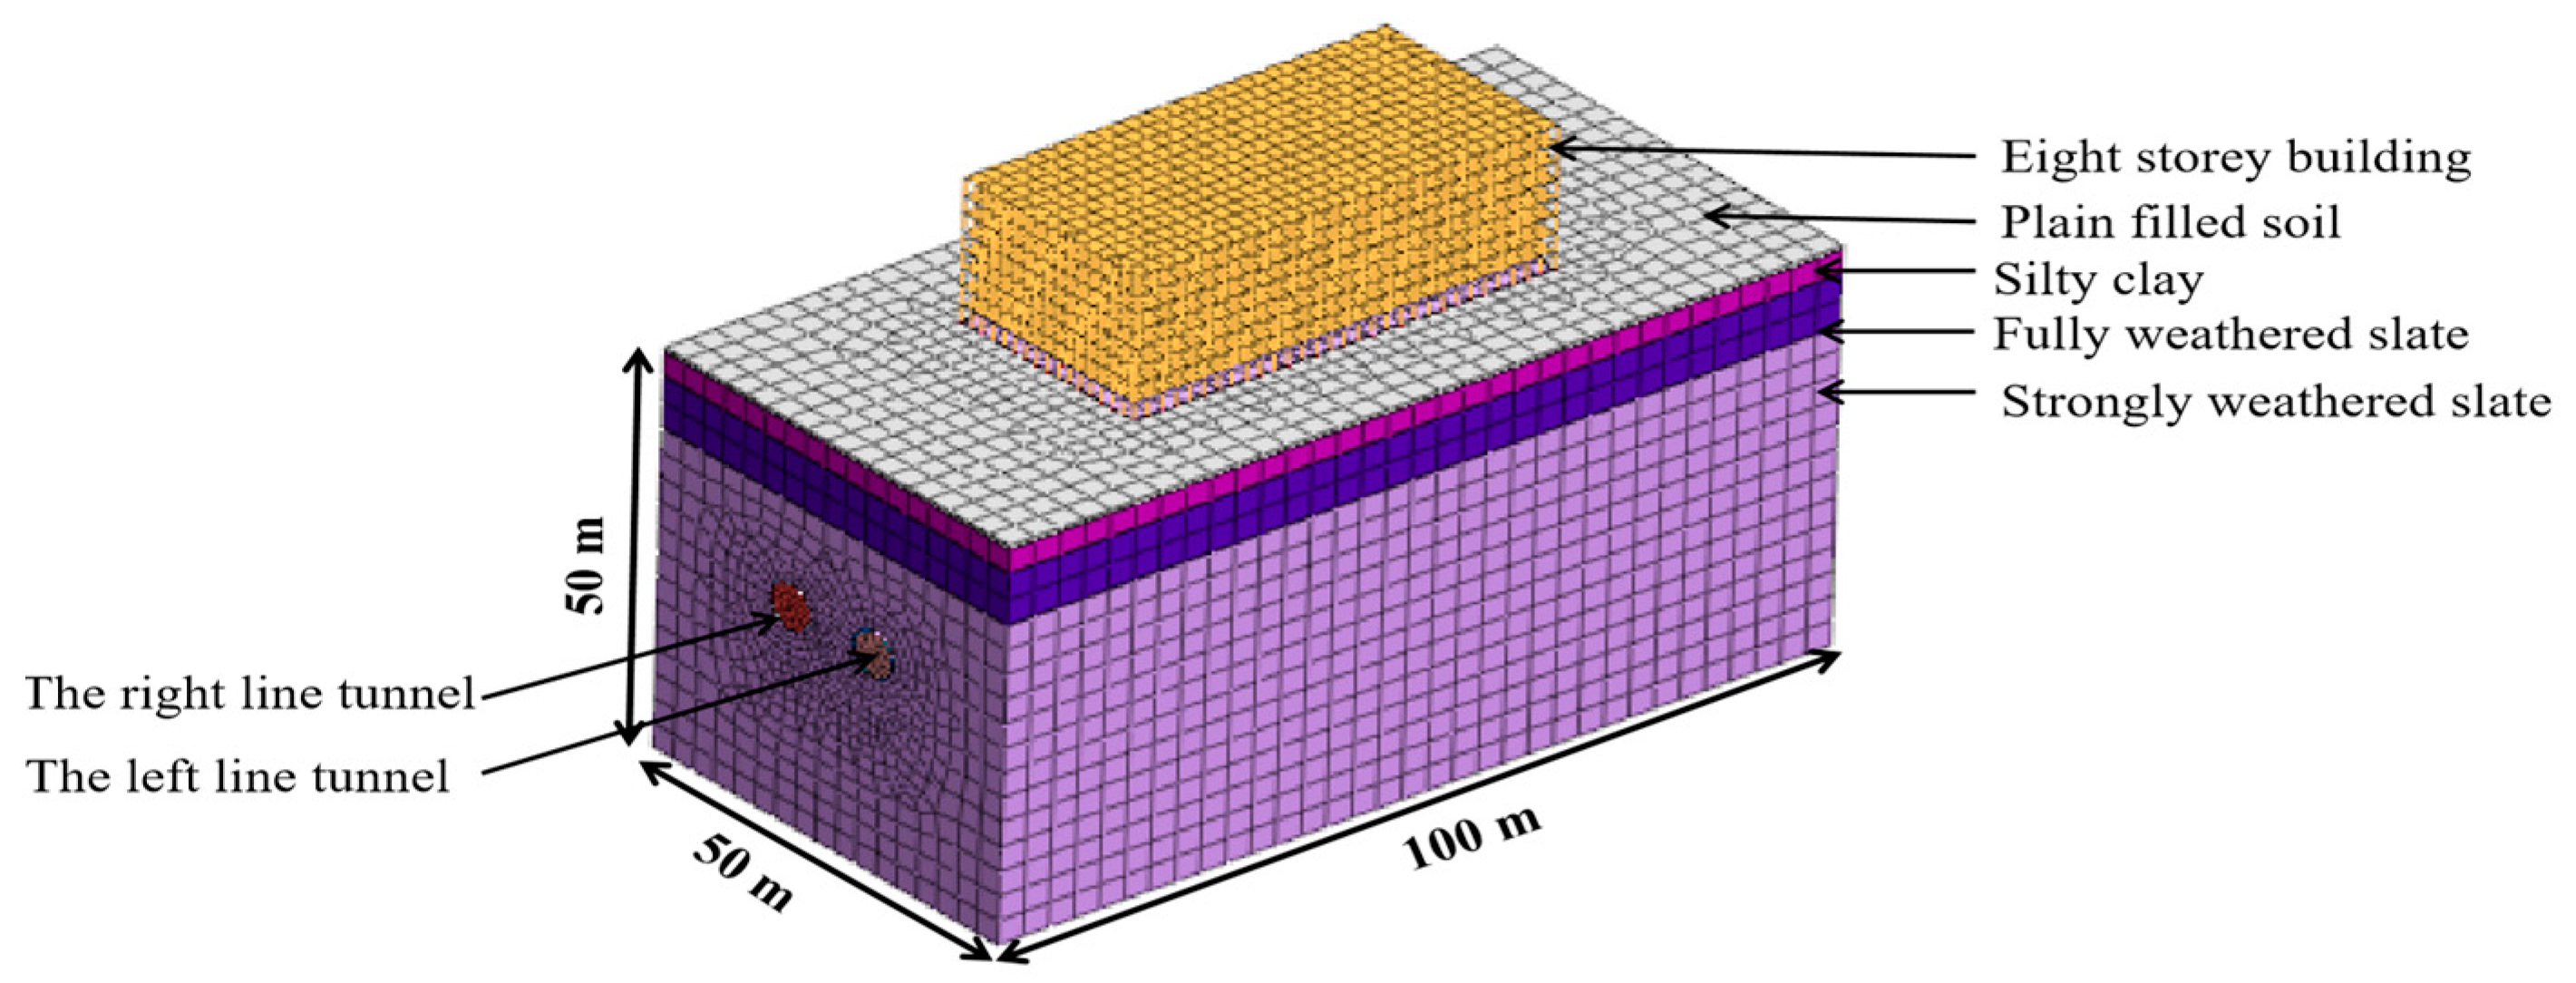
2. Engineering Background

Double shield tunnels in a section of Changsha Metro Line 6 passed through an existing building, and the outside diameter of the tunnel was 6.2 m, the distance between the centers of the two lines was 12 m, the average thickness of the soil layer above the tunnel was 21.22 m, and the thickness and the width of the shield section were 0.35 m and 1.5 m, respectively. The excavation scheme was firstly the left line tunnel and then the right line tunnel after the grouting body of the left line tunnel was hardened. The section of double shield tunnels was under the existing building. The building was an eight-story concrete structure with two basement floors buried in the soil, each of which was a height of 6 m. The dimensions of the rectangular column were 0.6 m × 0.6 m. The diameters of the bearing and retaining piles of the building were 0.9 m and 1.2 m, respectively. The soil layers from top to bottom were the plain filled soil with a thickness of 0.5 m, the silty clay with a thickness of 3 m, the fully weathered slate with a thickness of 6.5 m, and the strongly weathered slate with a thickness of 40 m. The cross-sections of bearing and retaining piles, double tunnels, and strata are shown in Figure 2. From the field geotechnical tests, Table 1 shows the calculated parameters of soil (rock) layers and materials.

3. Mathematical Model

The mathematical model was established to simulate the construction process of the double shield tunnels by the Midas GTS NX software. The dimensions of the model for length, width, and height were 100 m, 50 m, and 50 m, respectively. The flow chart of the modeling steps of the model is shown in Figure 3.
The modeling steps of the model are as follows.
Step 1: Build the geometric model.
(1)
Plain fill, silty clay, completely weathered slate, and strongly weathered slate were simulated by 3D solid units. The constitutive models were the isotropic Mohr–Coulomb model [26], abbreviated as the MC model, an ideal elastic–plastic model that combines Hooke’s law and Coulomb’s failure criterion widely used to simulate most geotechnical materials. The MC model used the Coulomb formula as the shear strength formula, and the failure criterion was based on whether the shear stress reached the shear strength. As shown in Equation (1), when the shear stress at a point on any plane in the soil was equal to the shear strength of the soil, that point was in a critical state of near failure, which was called the “ultimate equilibrium state”. The relationship between various stresses in this state was called the “ultimate equilibrium condition”. In the MC model of Midas GTS NX, elastic modulus and Poisson’s ratio controlled elastic behavior, while cohesion, internal friction angle, and shear expansion angle controlled plastic behavior.
τ f = f ( σ )
where  τ f  is the shear strength of soil, and  σ  is the soil stress.
(2)
Bearing piles, retaining piles, basement columns, and building columns were simulated by beam element, while the basement floors and building floors were simulated by 2D plate element with the constitutive model of the isotropic elastic model. Suppose the property of a material did not change with direction, which was isotropic. The isotropic elastic material had the same elastic modulus, Poisson’s ratio, thermal expansion coefficient, and thermal conductivity in all directions. The expression for isotropic elasticity is shown in Equation (2).
σ i j = E 1 + υ ε i j + υ E ( 1 + υ ) ( 1 2 υ ) ε k k σ i j
where  E  is elastic modulus,  υ  is Poisson’s ratio, and  σ  and  ε  are the stress and strain of the material.
(3)
The segment and shield shell were simulated by a 2D plate element, and the constitutive model was the isotropic elastic model. The grouting body was simulated by a 3D solid element, and the constitutive model was an isotropic MC model.
Step 2: Assign material properties.
Assign various parameters and attributes to the corresponding geometric model.
Step 3: Create mesh.
In order to highlight the research focus, the pile and shield tunnel structures were divided into mesh with a spacing of 2 m, and the soil was divided into mesh with a spacing of 4 m. Because of the higher accuracy of the hexahedron element, the hexahedron hybrid mesh generator was used to generate soil and shield tunnel structures.
Step 4: Apply boundary conditions.
The upper surface of the model was free [27], a fixed constraint was applied to the lower surface, and a normal constraint was applied to the other four sides of the model.
Step 5: Apply load.
The weight of the building was converted into a single-column load, which was simulated by applying concentrated force to the bottom of the floor column.
In order to improve computational efficiency, the following assumptions were adopted during the modeling process.
Due to the small thickness of the segments and shield shells, shell elements were used to simulate the segments and shield shells. Piles and columns were simulated as beam elements, while basement floors and building floors were simulated by 2D plate elements with the constitutive model of the isotropic elastic model. Using the equivalent layer theory to simulate the grouting layer, without considering the intermediate process from softening to hardening of the grouting layer, the process from softening to hardening of the grouting layer was simulated by changing the elastic modulus of the grouting layer.
As shown in Figure 4, Figure 5 and Figure 6, the excavation pressure was applied to the front surface of the soil to be excavated in the next step to simulate the pressure caused by excavation soil in shield tunnels. The jack force was applied to the segment to simulate the advance of the shield. The grouting pressure acted on the inner and outer surface of the grouting body, simulating the extrusion effect of the grouting body on the outer surrounding rock and the inner segment.
Figure 7 shows the 3D mathematical shield tunnel model, and Figure 8 shows the location relationship of the basement, pile, and tunnel.
In the shield tunneling simulation, the forward distance of each step was 3 m. By methodically altering the grouting body’s calculation parameters, the grouting hardening process was simulated during the shield tunneling. The simulations of the shield tunnel’s excavation stage are as follows.
(1)
Conduct the initial stress field analysis, load the soil layer, clear displacement, and complete consolidation subsidence.
(2)
Carry out building construction; that is, load the building and pile, and clear the displacement.
(3)
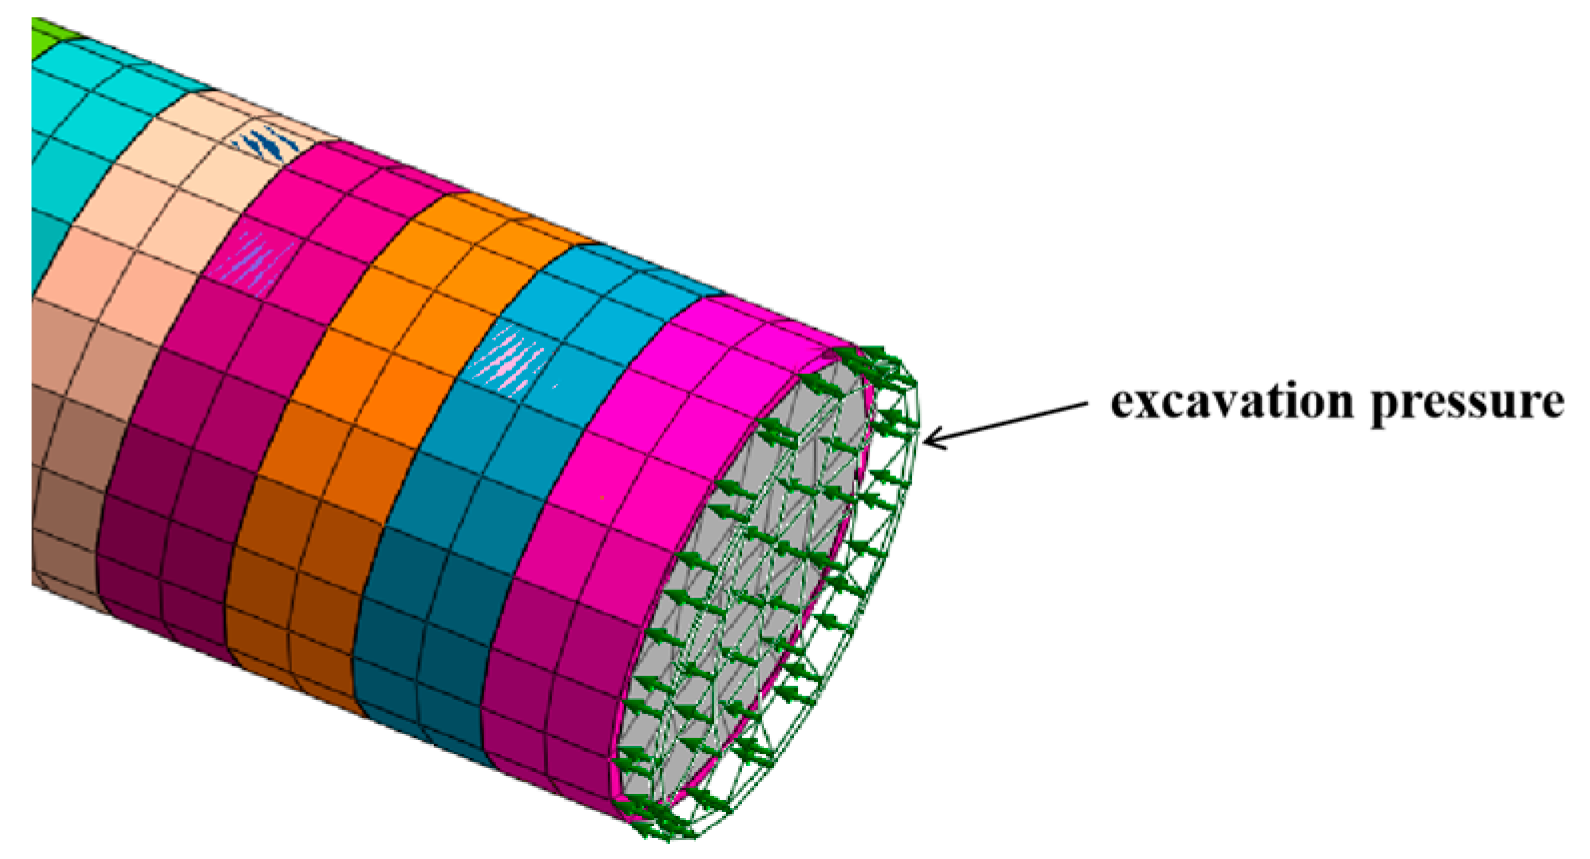
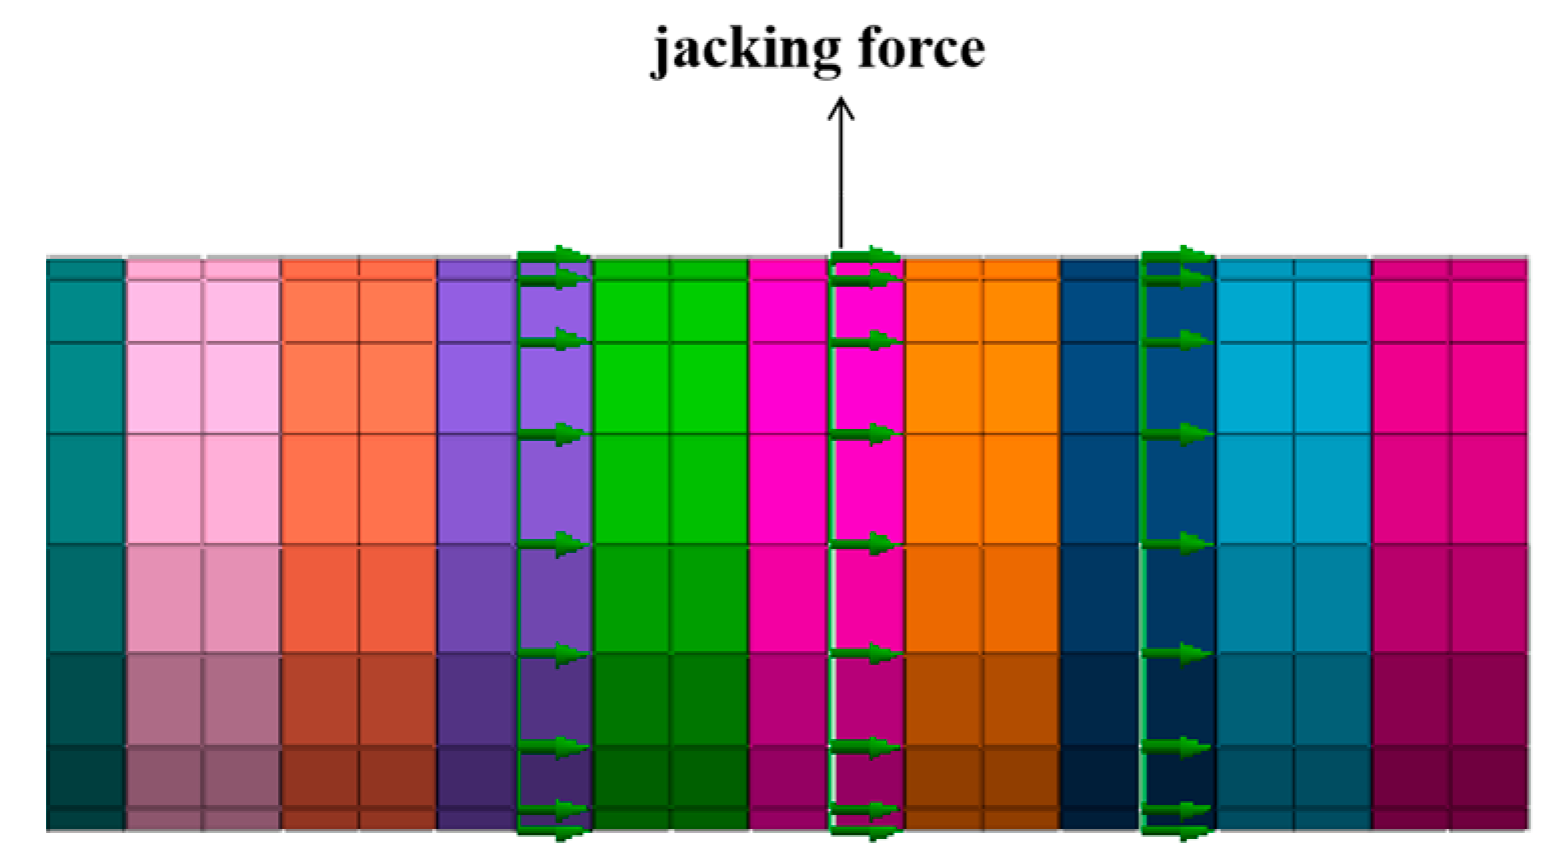
Excavation of the soil using the shield method, with a forward distance of 3 m for each step and a shield shell to support the newly excavated tunnel.
(4)
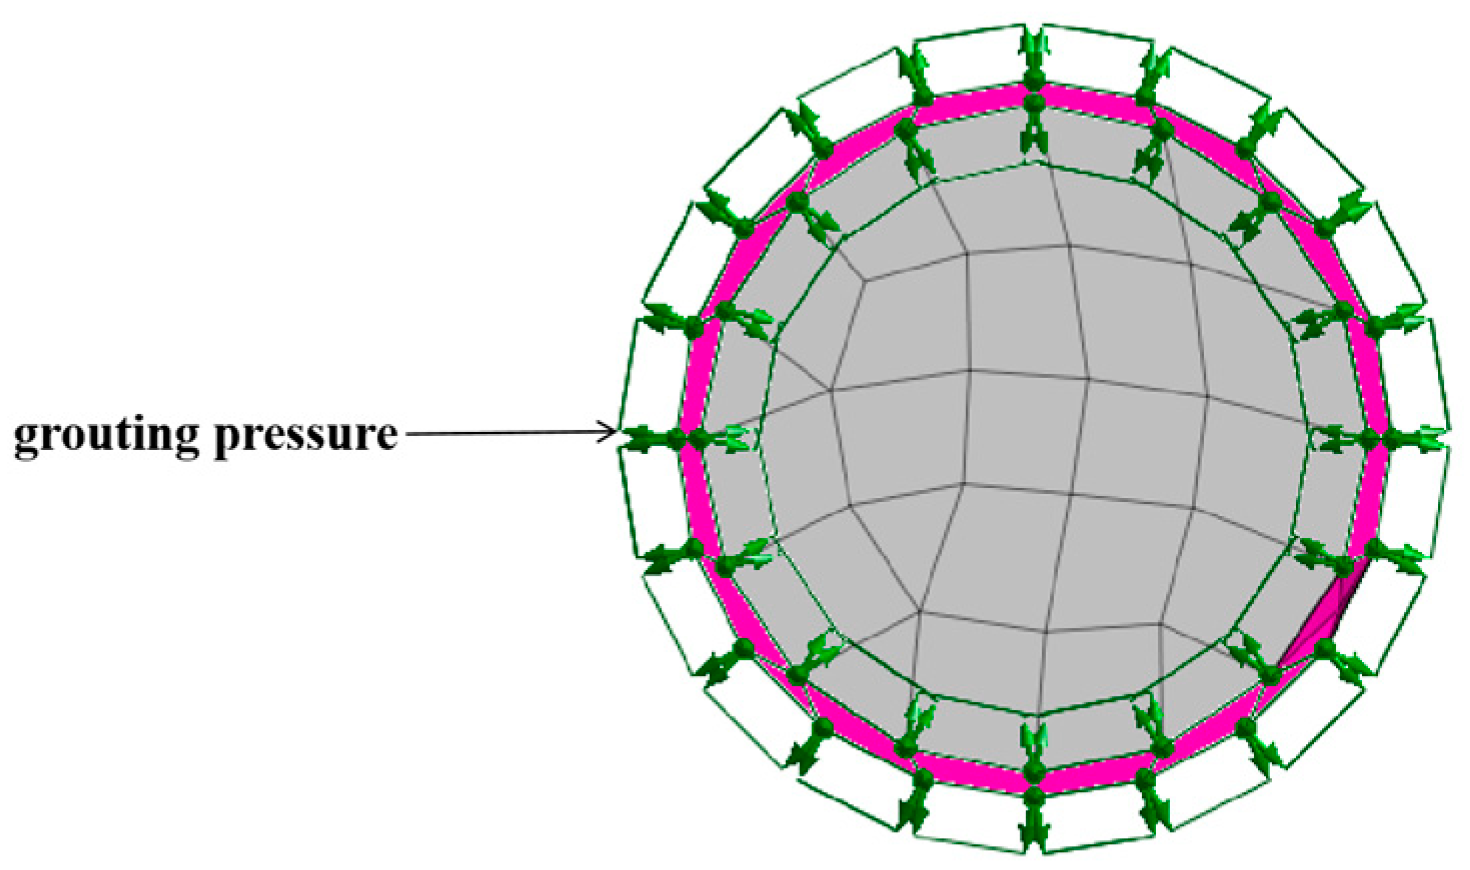
Continuation of step (3), removal of the shield shell from step (1), and installation of the segment and grouting body (soft) around the tunnel in the previous step.
(5)
Repeat step (4) continuously and harden the foremost soft grouting body when the excavation distance reaches 10 segments’ width (15 m).
(6)
Continue steps (3)–(5) until the excavation of double shield tunnels is completed.
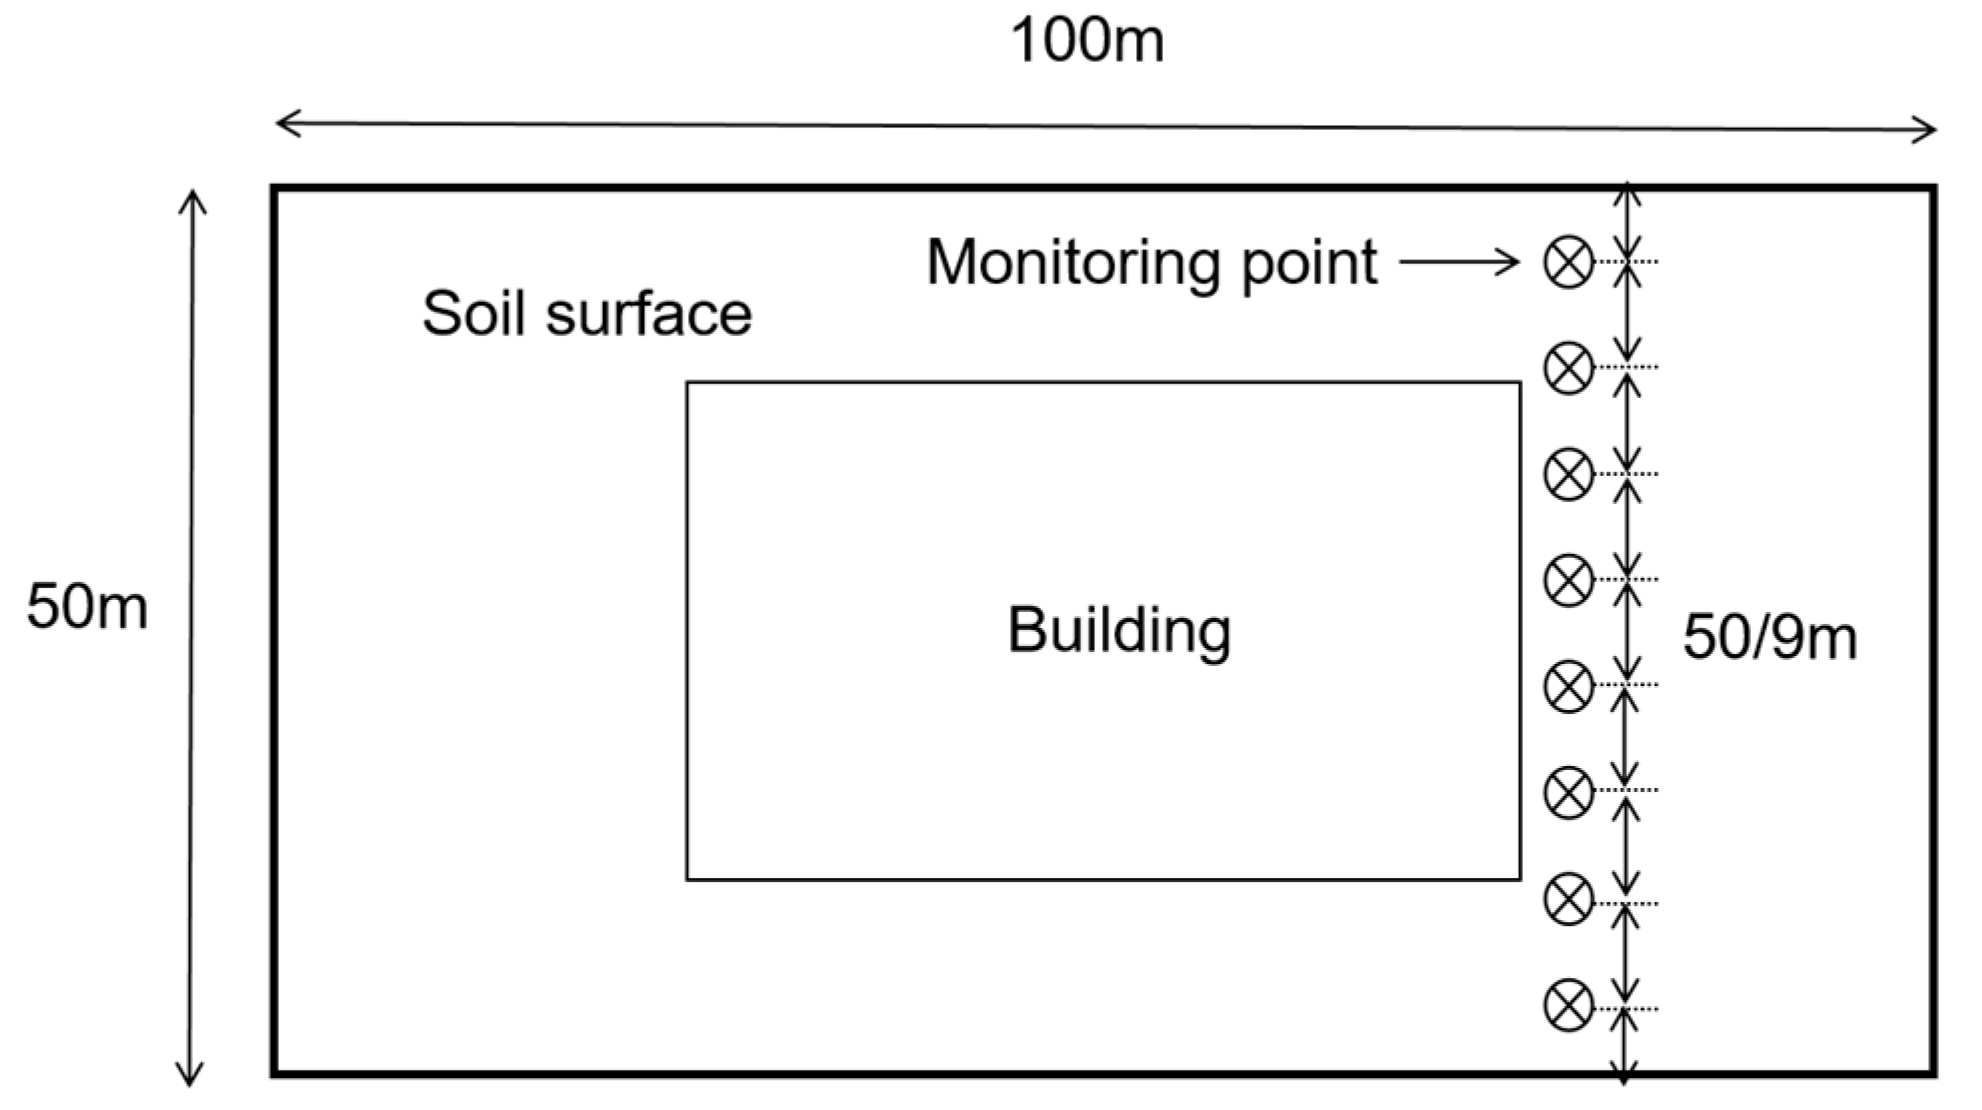
4. Model Validation

In the actual construction stage, with an excavation pressure of 200 kPa, a jack pressure of 150 kPa, and a grouting pressure of 250 kPa, the successive excavation scheme was adopted. The placement of the eight monitoring stations at the building site was depicted in Figure 9, and there were eight measuring points installed at the site to track the subsidence of the ground surface. Figure 10 shows the measured surface subsidence and the mathematical simulation results when the excavation of the shield tunnels was completed. Table 2 displays the error computation of the monitoring values and the values of the mathematical simulation. From Figure 3 and Table 2, it can be seen that the values of the mathematical simulation were relatively similar to the monitoring data, which confirmed that the mathematical model was reliable.

5. Effect of the Successive Excavation of Double Shield Tunnels on the Mechanical Behaviors of Soil, Segment, and Building

The project used a distributed excavation method in which the left line tunnel was excavated first and then the right line tunnel. For the sake of exploring the effect of the successive excavation of double shield tunnels on the mechanical behaviors of soil, segment, and building, the excavation pressure of 200 kPa, a jack pressure of 150 kPa, and the grouting pressure of 250 kPa remained unchanged according to the common parameter settings of most domestic projects.

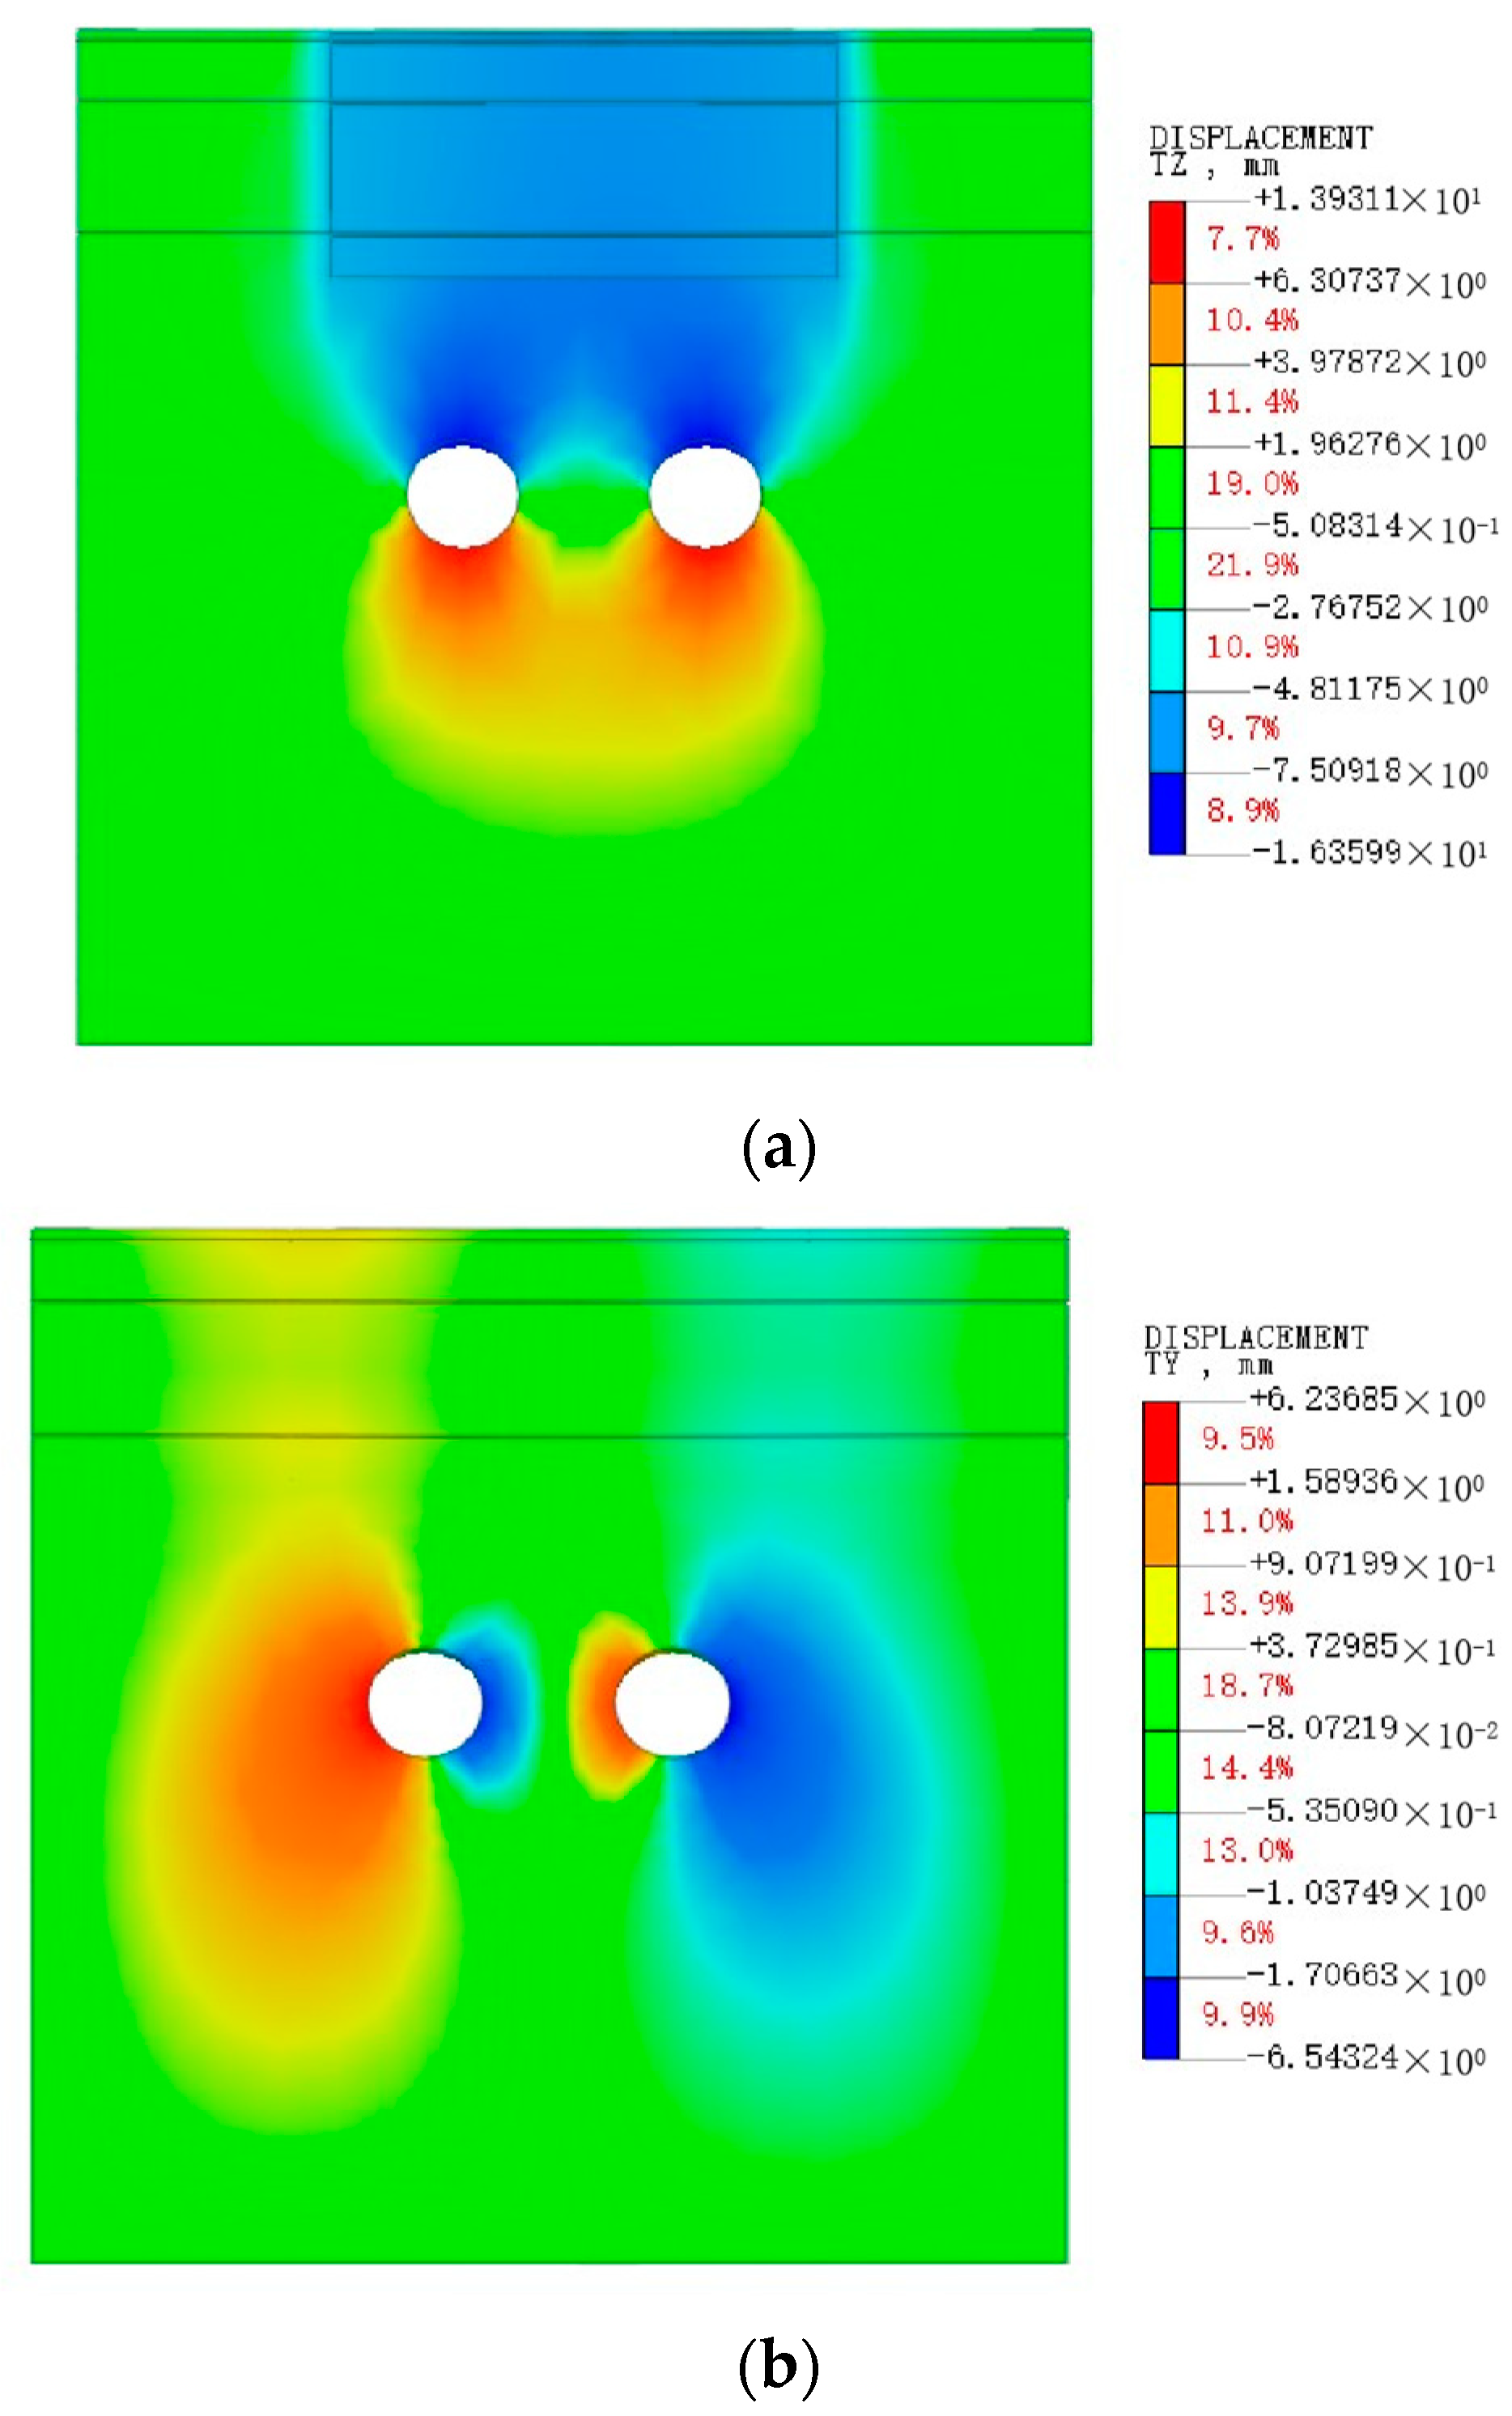
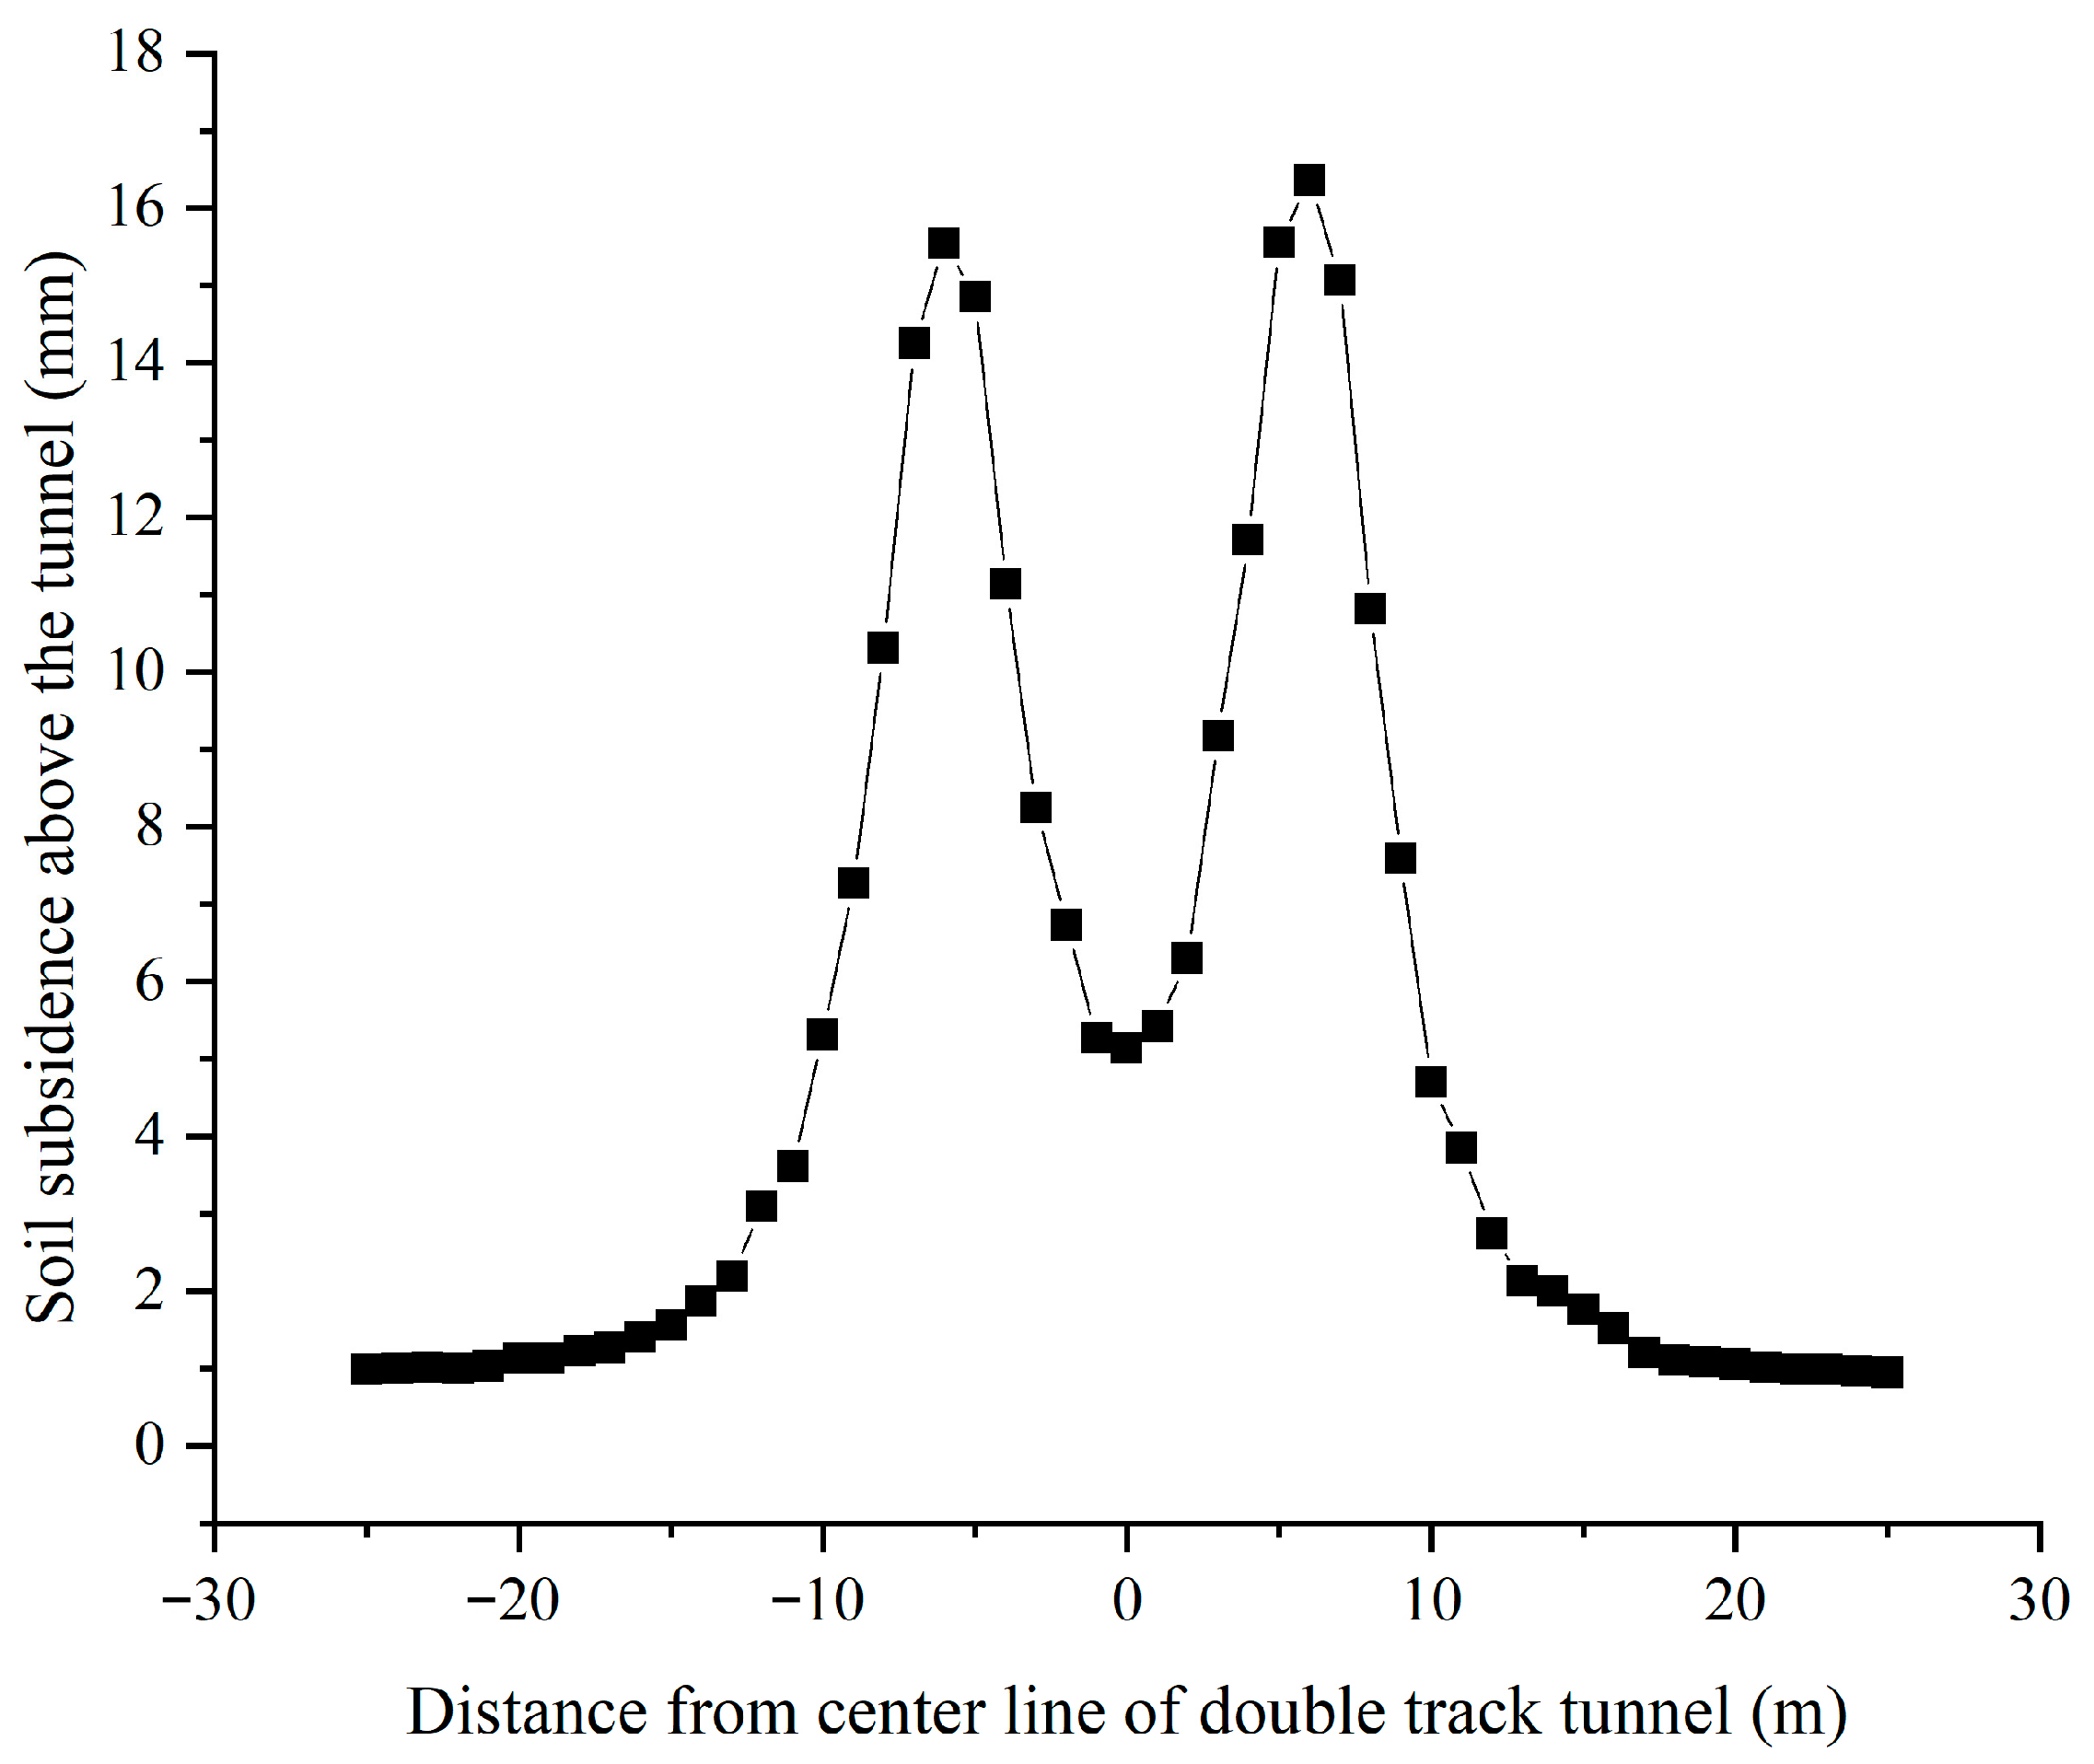
5.1. Effect of Successive Excavation of Double Shield Tunnels on Displacements of Soil

The vertical and lateral displacements of soil after the completion of the double shield tunnel excavation are shown in Figure 11. From Figure 11a, it can be found that the balance of soil stress was destroyed during the tunnel excavation, and the soil released stress to the excavation face, forming a “bowl-shaped” subsidence area above the excavation face and an “inverted bowl-shaped” uplift area below the excavation face. From Figure 11b, it can be found that due to the displacement of the soil above and below the tunnel in the direction of the tunnel, the soil outside the extrusion tunnel was displaced to both sides, making the lateral displacement of the soil in a “butterfly shape”.
The top of the tunnel vault was where the maximum subsidence of the soil was during the excavation of double shield tunnels. The cross-section in the middle of the model was selected to explore the law of subsidence of soil above the double tunnels. Figure 12 shows the subsidence of the soil at the plane directly above the tunnel. It can be found that the subsidence of soil on the left and right sides of the centerline of the double tunnels was basically symmetrically distributed, which was basically consistent with the conclusion in reference [28]. The maximum subsidence of the soil in reference [28] was close to 12 mm. From Figure 12, it can be seen that the maximum subsidence of the soil in this article was close to 17 mm. This is because there were no buildings above the shield tunnels in reference [28], while there was an existing building above the shield tunnels in this article. The gravity of the existing building will further increase the soil subsidence caused by tunnel excavation. The subsidence curve of soil above the tunnel with the distance from the center line shows the “M” shaped distribution. The two maximum subsidence of soil were located directly above the two tunnels. As the distance from the center line got closer, the subsidence of soil gradually reduced. This was due to the fact that the excavation of the double shield tunnels caused the surrounding soil to squeeze, causing the surrounding soil to have a tendency to converge towards the centerline of the tunnels.

5.2. Effect of Successive Excavation of Double Shield Tunnels on Displacements and Internal Forces of Segment

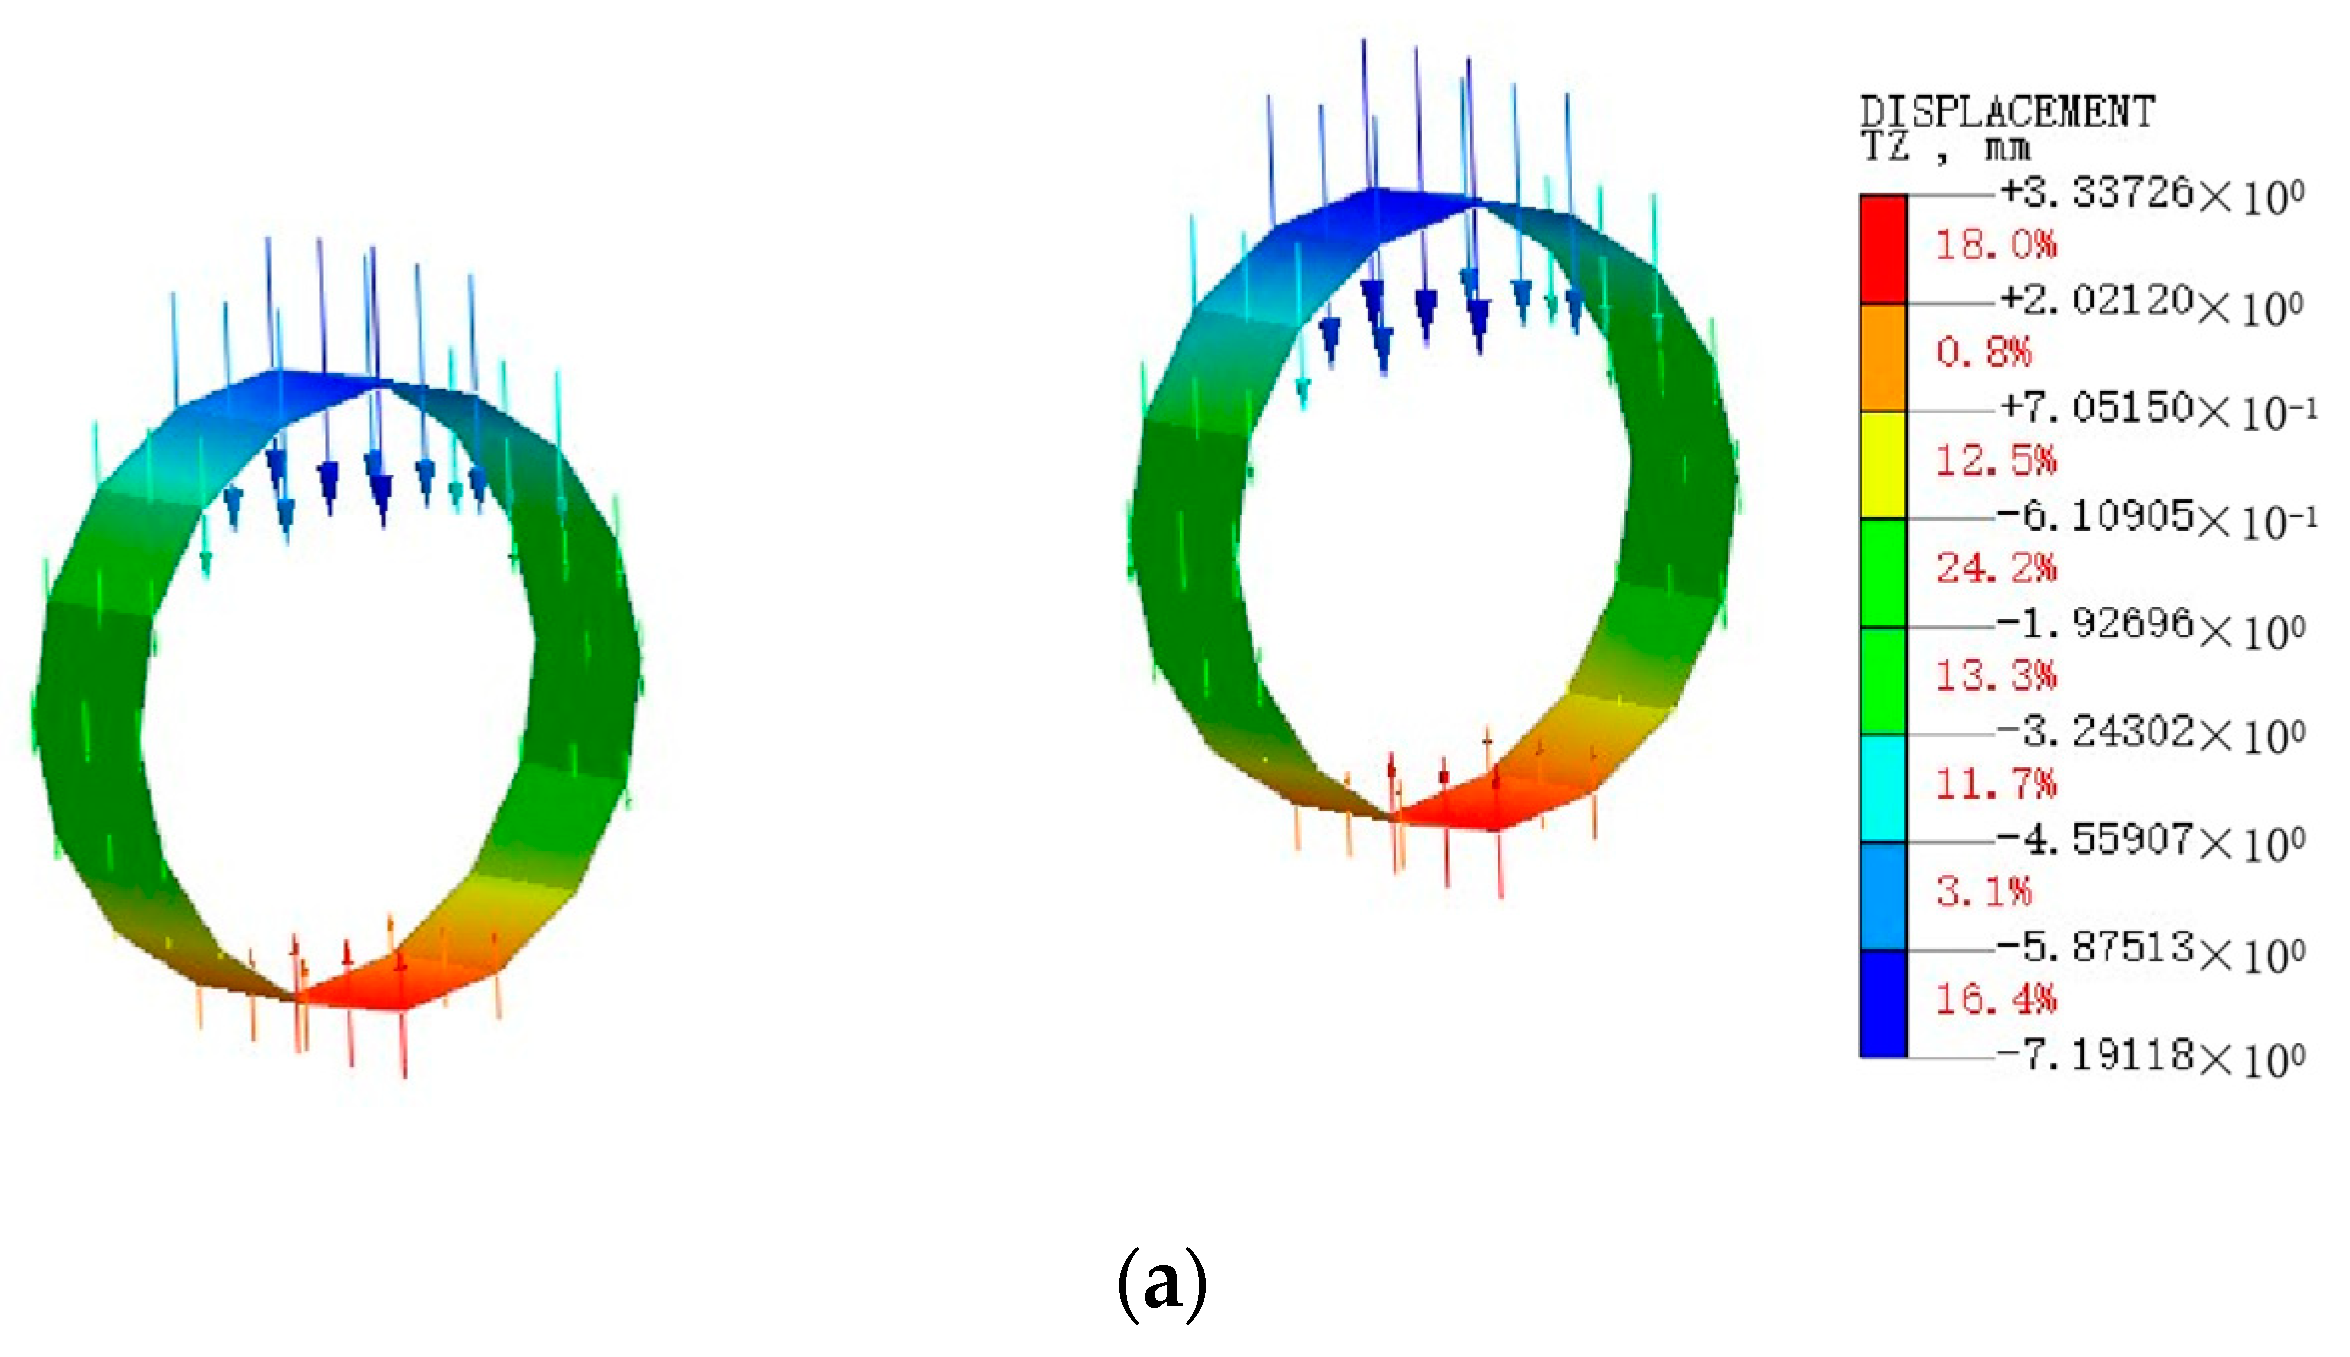
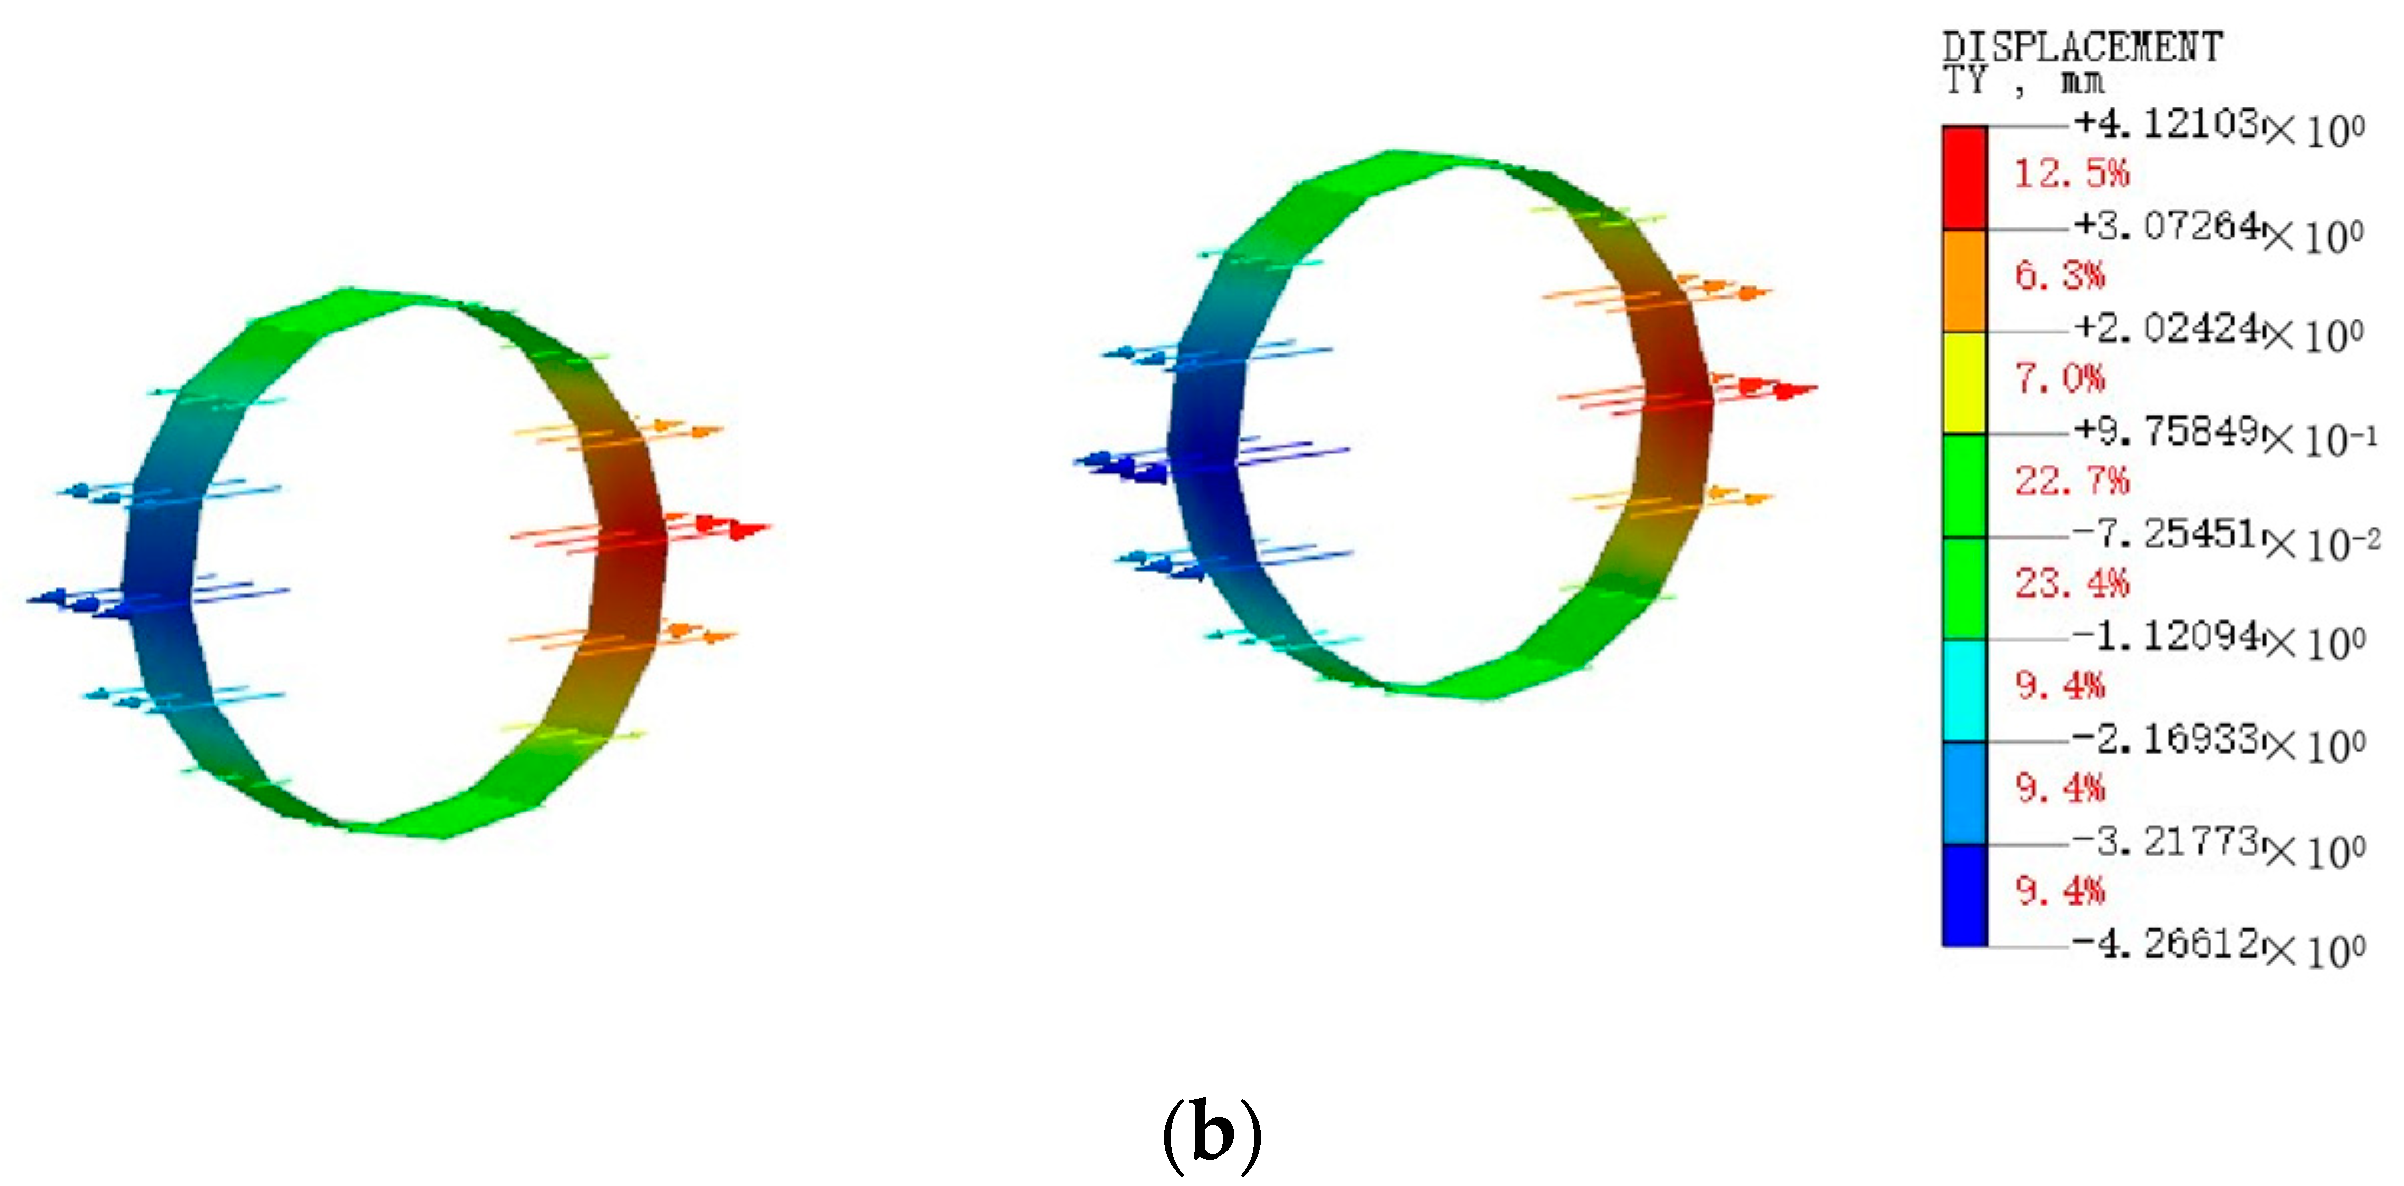
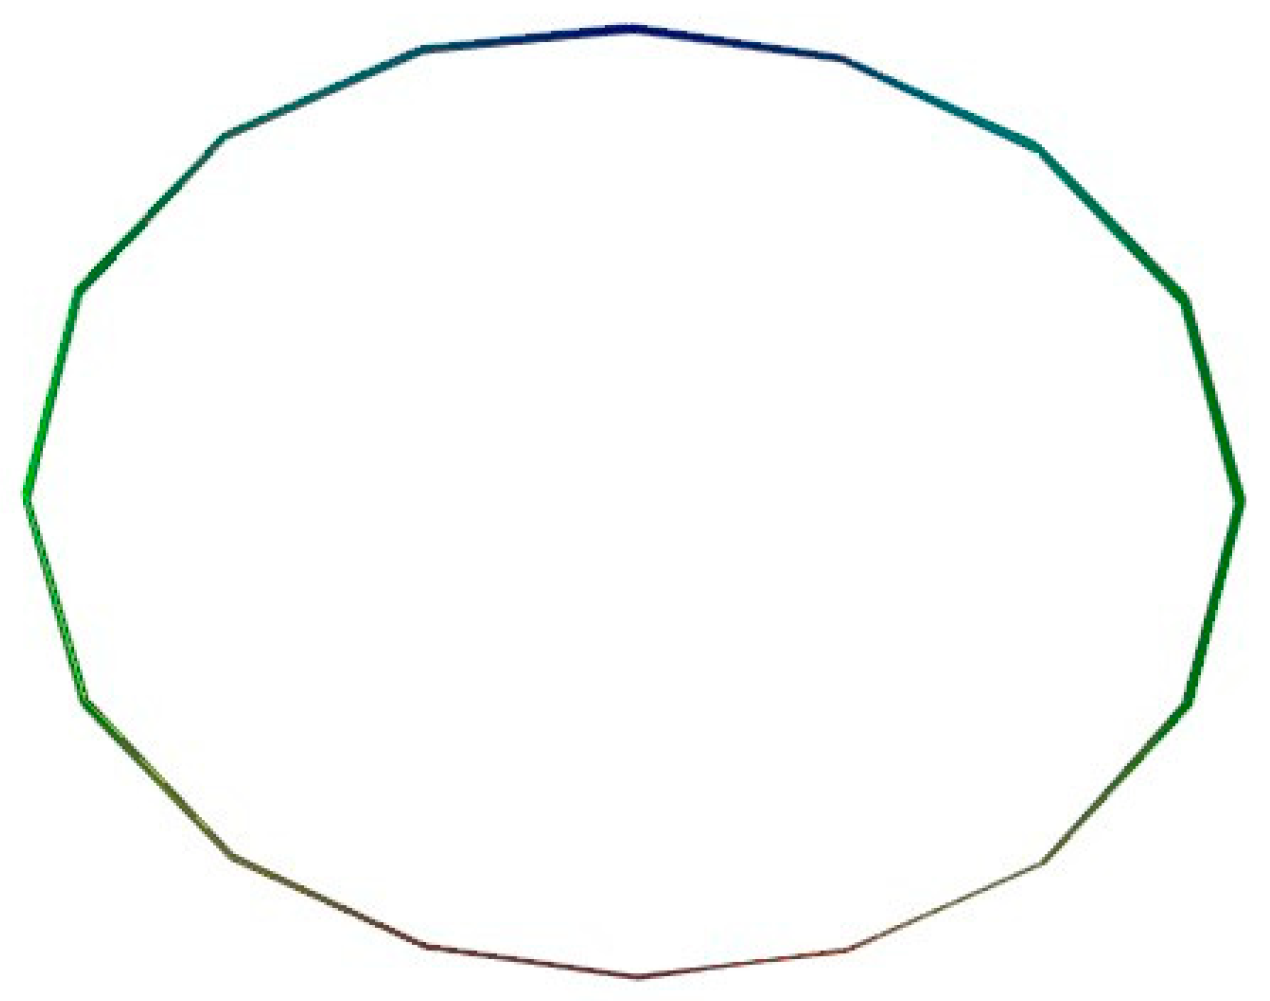
5.2.1. Displacements of Segment

After the completion of the excavation of double shield tunnels, the ring segment below the center of the building was considered the analysis objective. Figure 13 shows the corresponding vertical and lateral displacements of the segment. It can be found that the top and bottom of the segment had downward and upward displacements, respectively, and the waist of the segments had a displacement towards the outside of the tunnel, resulting in the elliptical shape of the segment. In Figure 14, it is shown that the maximum subsidence value of 7.19 mm, the maximum bulge value of 3.34 mm, and the maximum lateral displacement of 4.27 mm were located at the vault, upset, and waist of the segment, respectively. From this, it was clear that the segment subsidence was the most significant after the completion of the excavation of double shield tunnels. Therefore, the subsidence of the arch crown segment should be monitored during excavation.

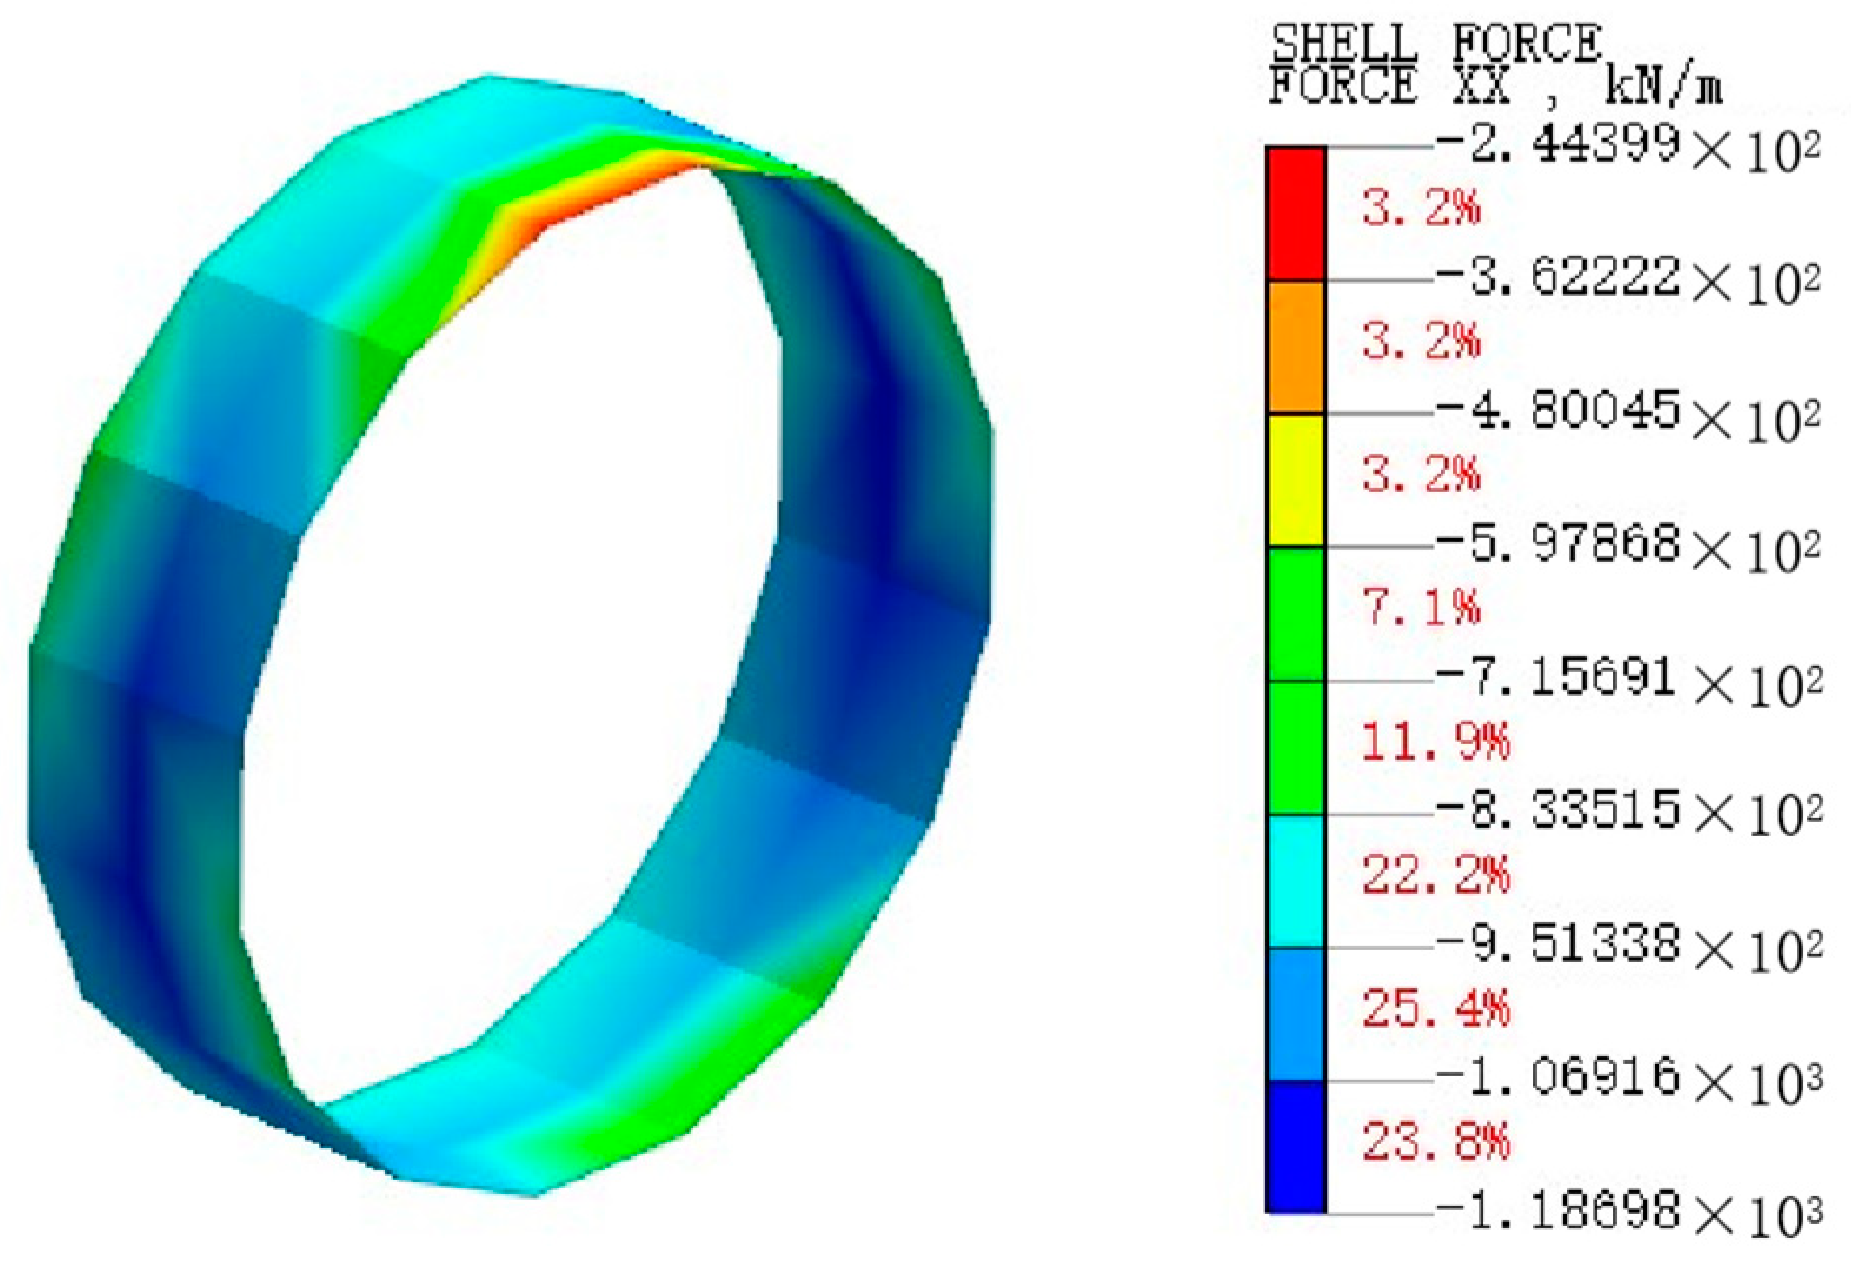
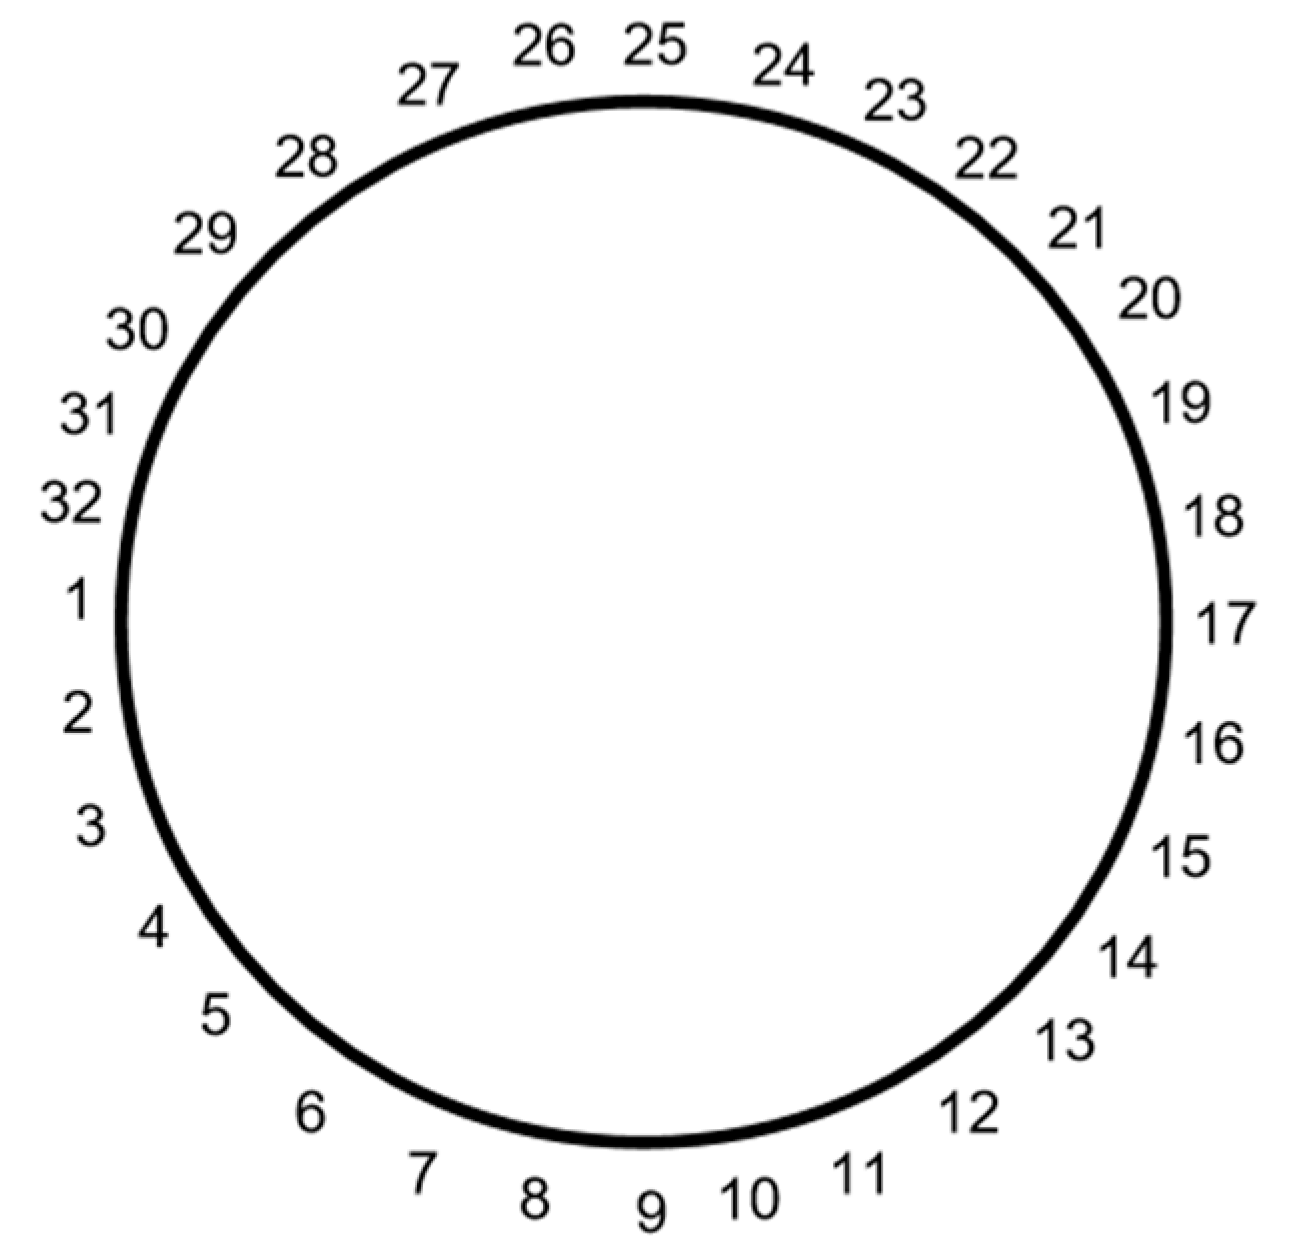
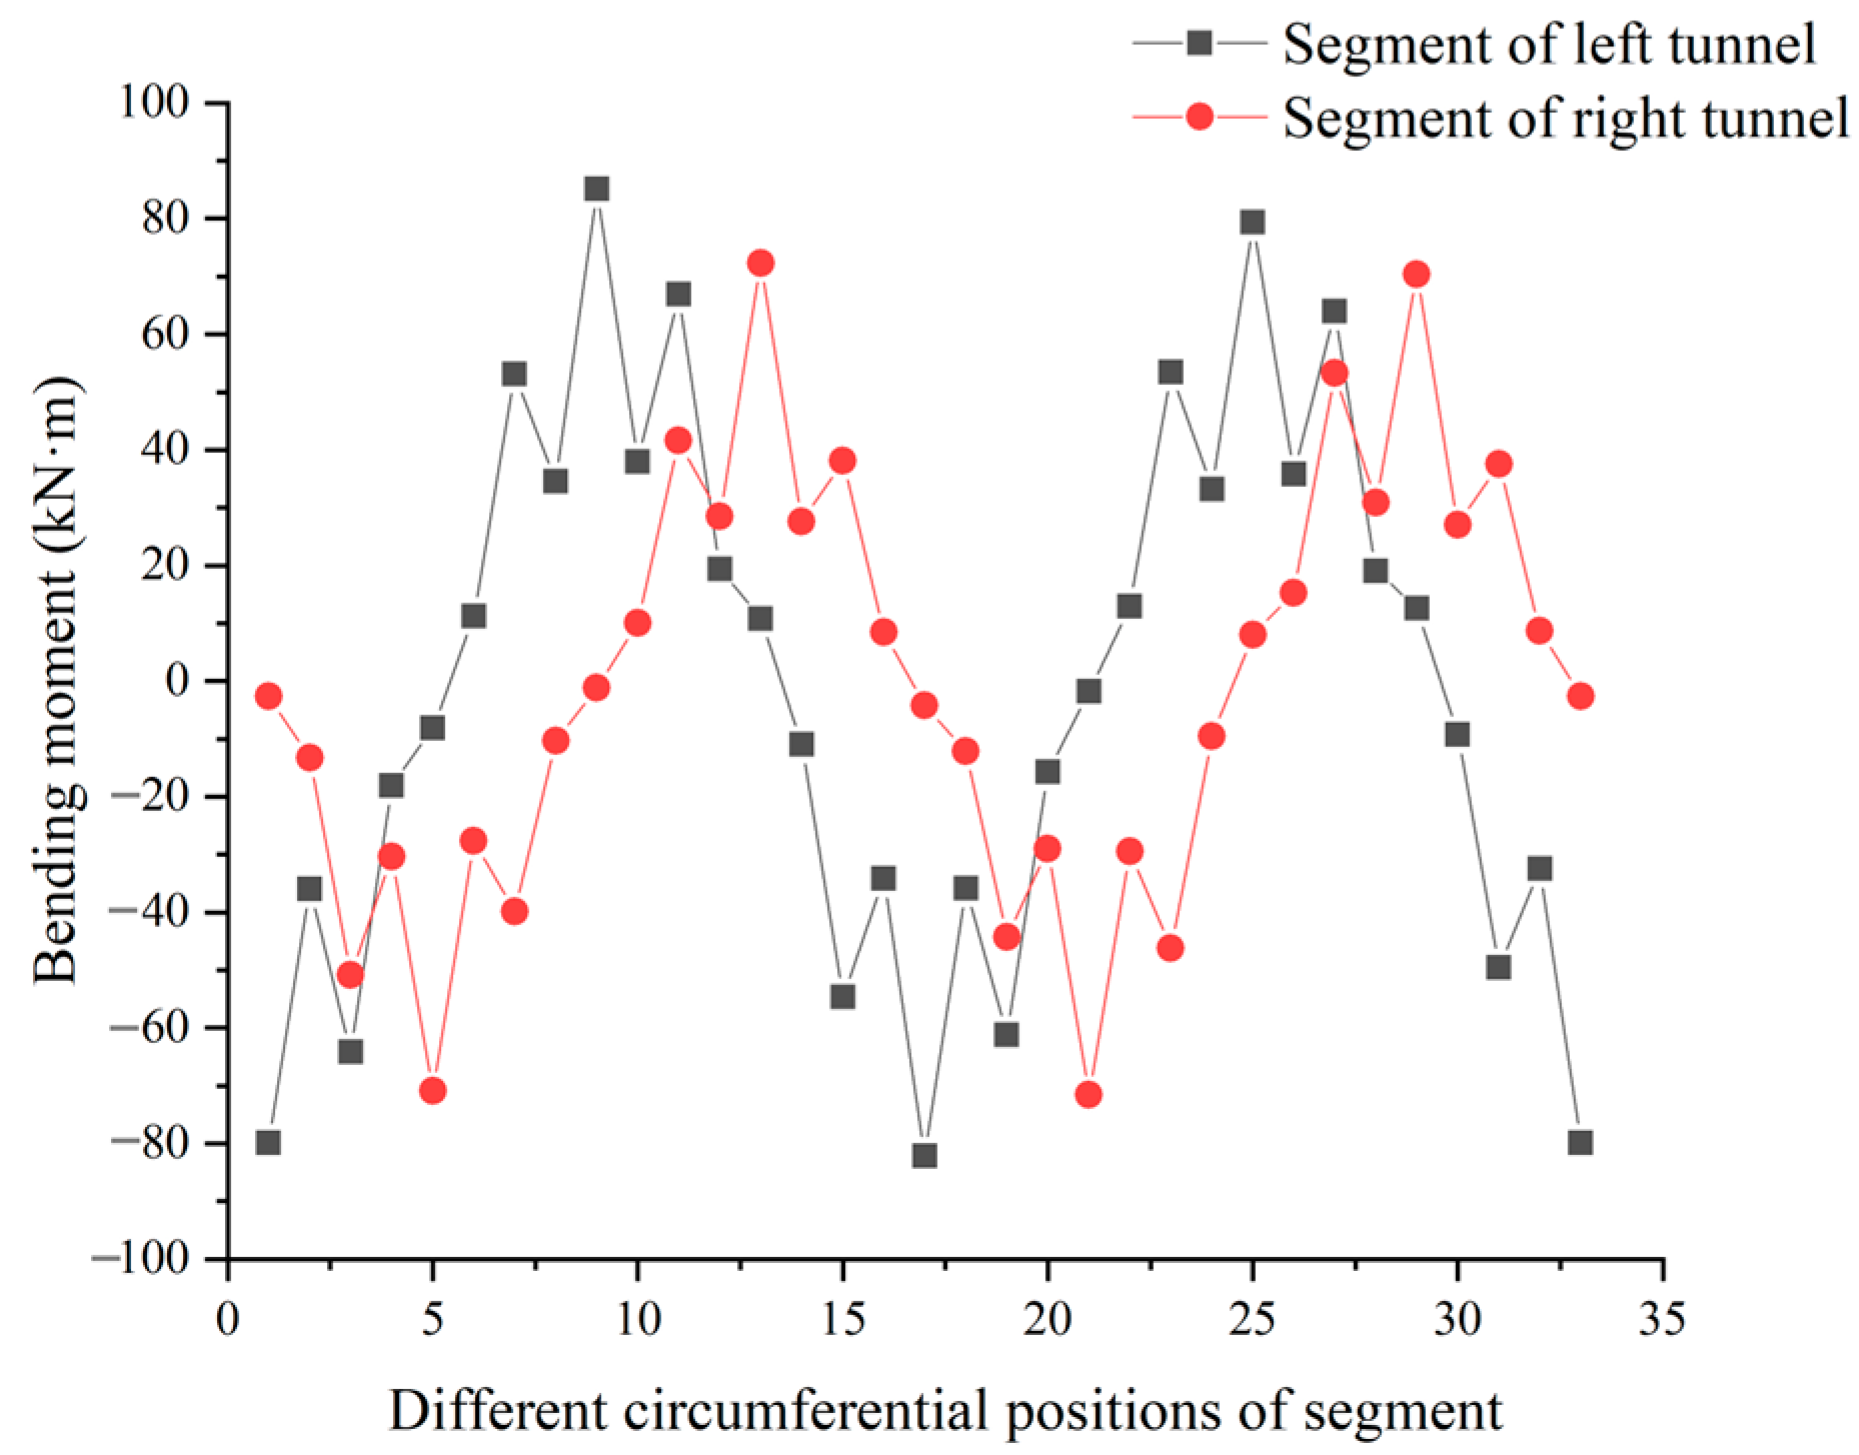
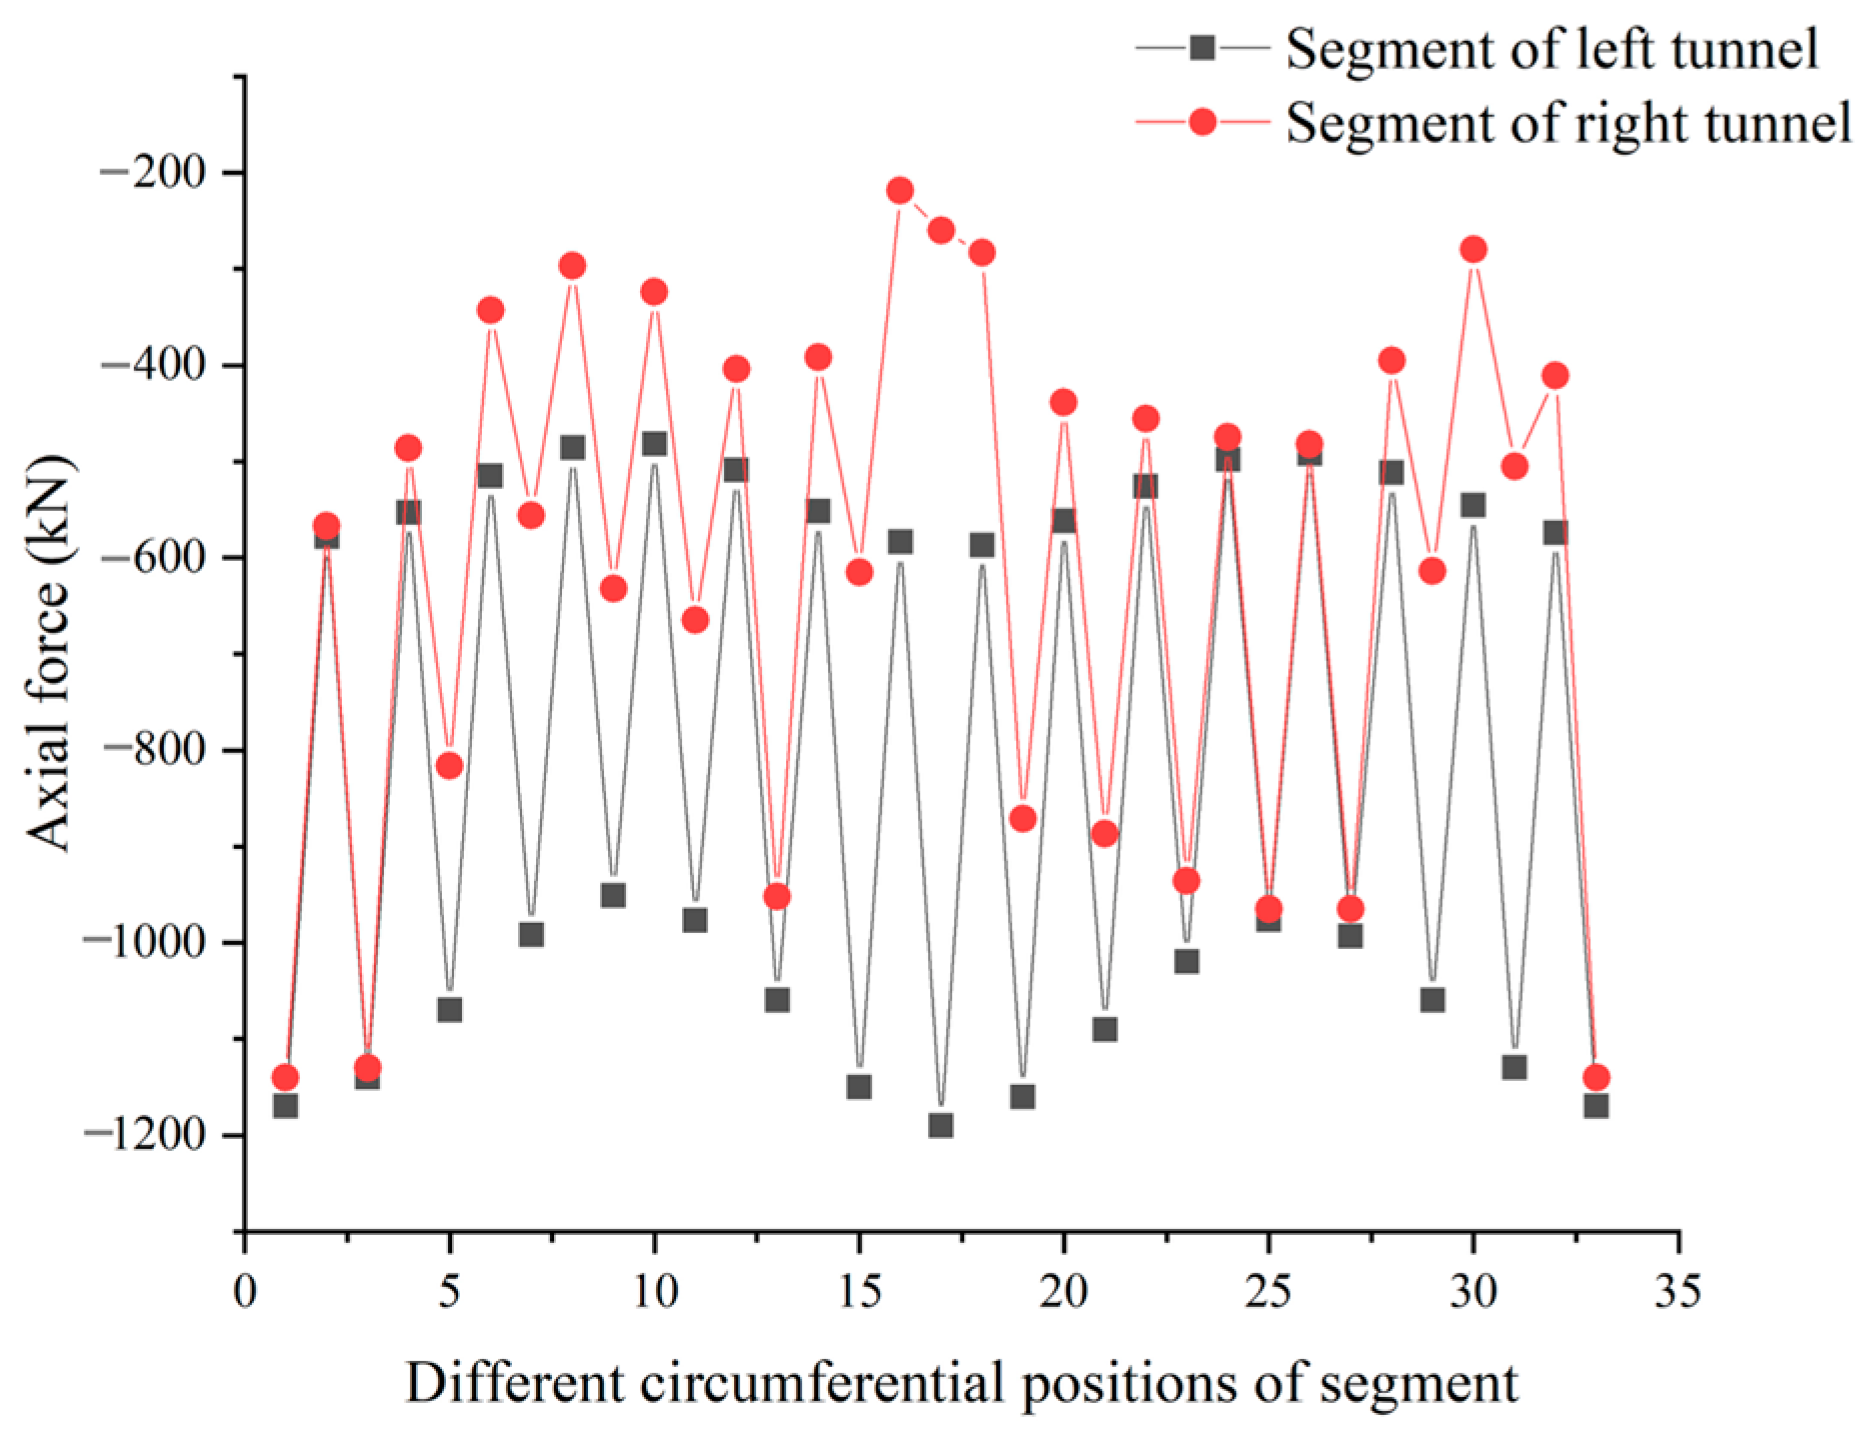
5.2.2. Internal Forces of Segment

Figure 15 and Figure 16 show the nephograms of the bending moment and axial force of the segment, respectively. Figure 15 shows that the bending moment of the segment was symmetrically distributed. The top and bottom of the segment were subject to positive bending moments, while the waist of the segments was subject to negative bending moments, which was basically consistent with the conclusion in reference [29]. The maximum positive bending moment of 85.07 kN∙m was located at the vault, and the maximum negative bending moment of −82.12 kN∙m was located at the waist. Figure 16 shows that the pressure was everywhere in the segment. The pressure at the front end of the segment was greater than that at the rear end, and the maximum pressure was 1186.98 kN.
For the convenience of describing the bending moment and axial force at different circumferential positions of the segment, as shown in Figure 17, different numbers were used, and the numbers were counterclockwise from the left side of the segment at the arch waist (number 1). Figure 18 and Figure 19, respectively, showed the bending moments and the axial forces at different circumferential positions of segments of left and right tunnels under successive excavation of double shield tunnels, in which the left and right tunnels denoted the left and right excavation tunnels, respectively.
From Figure 18, it can be found that for the sake of the secondary disturbance to the soil caused by the excavation of the right tunnel [30], the magnitudes and locations of the maximum positive and negative bending moments of the segments of the left and right tunnels were different. The maximum positive and negative bending moments of the left tunnel were 87.64 kN∙m and −88.56 kN∙m, respectively, while the maximum positive and negative bending moments of the right tunnel were 74.01 kN∙m and −77.68 kN∙m, respectively. Compared to the left tunnel, the maximum positive bending moment of the segment of the right tunnel was reduced by 15.56%, and the maximum negative bending moment was reduced by 12.29%.
From Figure 19, it can be found that the maximum and minimum axial forces and the positions of the segments of the left and right tunnels were different. The excavation resulted in a secondary release of soil stress so that the maximum axial force of the right tunnel segment was smaller than that of the left tunnel segment. The pressure was everywhere in the segment. The maximum axial forces of the left and right tunnel segments were 1218.7 kN and 1136.9 kN, respectively. The maximum circumferential axial force of the segment of the right tunnel was 6.71% lower than that of the left tunnel.
During the construction process, the maximum positive bending moment, the maximum negative bending moment, and the maximum circumferential axial force applied to the segment of the left tunnel were larger than those of the right tunnel. Therefore, for the successive excavation, the bending moment and axial force of the segment of the left tunnel should be monitored in real-time.

5.3. Effect of Successive Excavation of Double Shield Tunnels on Mechanical Behaviors of Building

Using excavation distance as the horizontal coordinate, the effects of double shield tunnel excavation on the mechanical properties of the building were studied. Figure 20 shows the variation of building subsidence and lateral displacement of piles (in the direction of shield excavation) with excavation distance, while Figure 21 shows the variation of the basement tensile stress and pile shear with excavation distance. The left side of the vertical dotted line in the Figure 20 and Figure 21 represented the excavation of the left line tunnel, while the right side represented the excavation of the right line tunnel.
From Figure 20, it can be found that the successive excavation of double shield tunnels had a significant nonlinear effect on the lateral displacement of the pile along the excavation direction and the subsidence of the building. Building subsidence increases with the increase of shield tunneling distance, and the building subsidence increases from 0.09 mm at the beginning to 7.22 mm at the end of the excavation. When the excavation distance of the left (right) tunnel was less than 50 m, the subsidence of the building increased sharply with the increase of shield tunneling distance. When the excavation distance was greater than 50 m, the subsidence of the building increased slowly with the shield tunneling distance. This phenomenon was similar to the conclusions obtained in reference [31]. Due to the accumulation of subsidence and the secondary disturbance to the soil of the right tunnel excavation, the subsidence of the building caused by the excavation of the right line tunnel was always greater than the subsidence of the building caused by the excavation of the left line tunnel. The lateral displacement of the pile increased from 0.09 mm at the beginning to 3.82 mm during the excavation of the right tunnel. In addition, from Figure 20, it can be found that when the left (right) line excavation distance was less than 50 m, the lateral displacement of the pile increased sharply with the increase of shield tunneling distance. When the excavation distance was greater than 50 m, the lateral displacement of the pile reduced slowly with the excavation of the shield tunnel.
From Figure 21, it can be found that with the construction of shield tunnels, the tensile stress in the basement varied from 7902.7 kPa to 7958.2 kPa, with a variation of 0.70%. The shear force of the pile varied from 111.8 kN to 113.2 kN, with a variation of 1.25%. It can be seen that the effect of the successive excavation of the shield tunnels on the tensile stress of the basement and the shear force of the pile can be ignored.
From Figure 22, combined with the variation of the subsidence of the building with the excavation distance, it can be found that the shield tunneling caused uneven subsidence of the building. When the excavation of the shield tunnel started, subsidence would occur in front of the building along the shield excavation direction but not yet behind the building, causing the building to tilt and leading to lateral displacement of the pile. When the shield tunneling reached the rear part of the building, the rear part of the building also gradually started to settle, which made the uneven subsidence of the building balanced. Therefore the tilt of the building gradually reduced, and the lateral displacement of the pile also slowly reduced. In addition, the excavation of the double shield tunnels would result in lateral displacement of the soil around the tunnel. Lateral displacement of the pile would also occur due to the interaction between the piles and the soil. Due to the secondary disturbance of soil caused by the excavation of the right tunnel and the accumulation of subsidence, the maximum lateral displacement of the pile caused by the excavation of the right tunnel was always greater than that caused by the excavation of the left tunnel.

6. Effect of Grouting Pressure on Mechanical Behaviors of Soil, Segment, and Building

To investigate the effect of grouting pressure on soil, segment, and building, we adopted the successive excavation scheme; the excavation pressure was taken as 200 kPa, and the jack pressure was taken as 150 kPa. The grouting pressure was changed from 50 kPa to 550 kPa with an increment of 100 kPa.

6.1. Effect of Grouting Pressure on Displacements of Soil

The cross-section in the middle of the model was taken to study the law of soil subsidence above the double tunnels. Figure 23 shows the change curves of soil subsidence at each position above the tunnels with different grouting pressures. From Figure 23, it can be found that the change laws of soil subsidence were the same for the different grouting pressures. The subsidence of soil directly above the double shield tunnel was the largest. As shown in Figure 24, the maximum subsidence of soil reduced linearly with the increase of grouting pressure. For the grouting pressures of 50 kPa and 550 kPa, the corresponding maximum subsidence of soil were 23.93 mm and 6.37 mm, with a reduction of 73.38%. According to the calculation, the maximum subsidence value of the soil mass would decrease by 3.512 mm when the grouting pressure increased by 100 kPa. From this, it is clear that increasing the grouting pressure appropriately during the excavation of double shield tunnels can effectively reduce the subsidence of soil, which was consistent with the conclusion in reference [32].

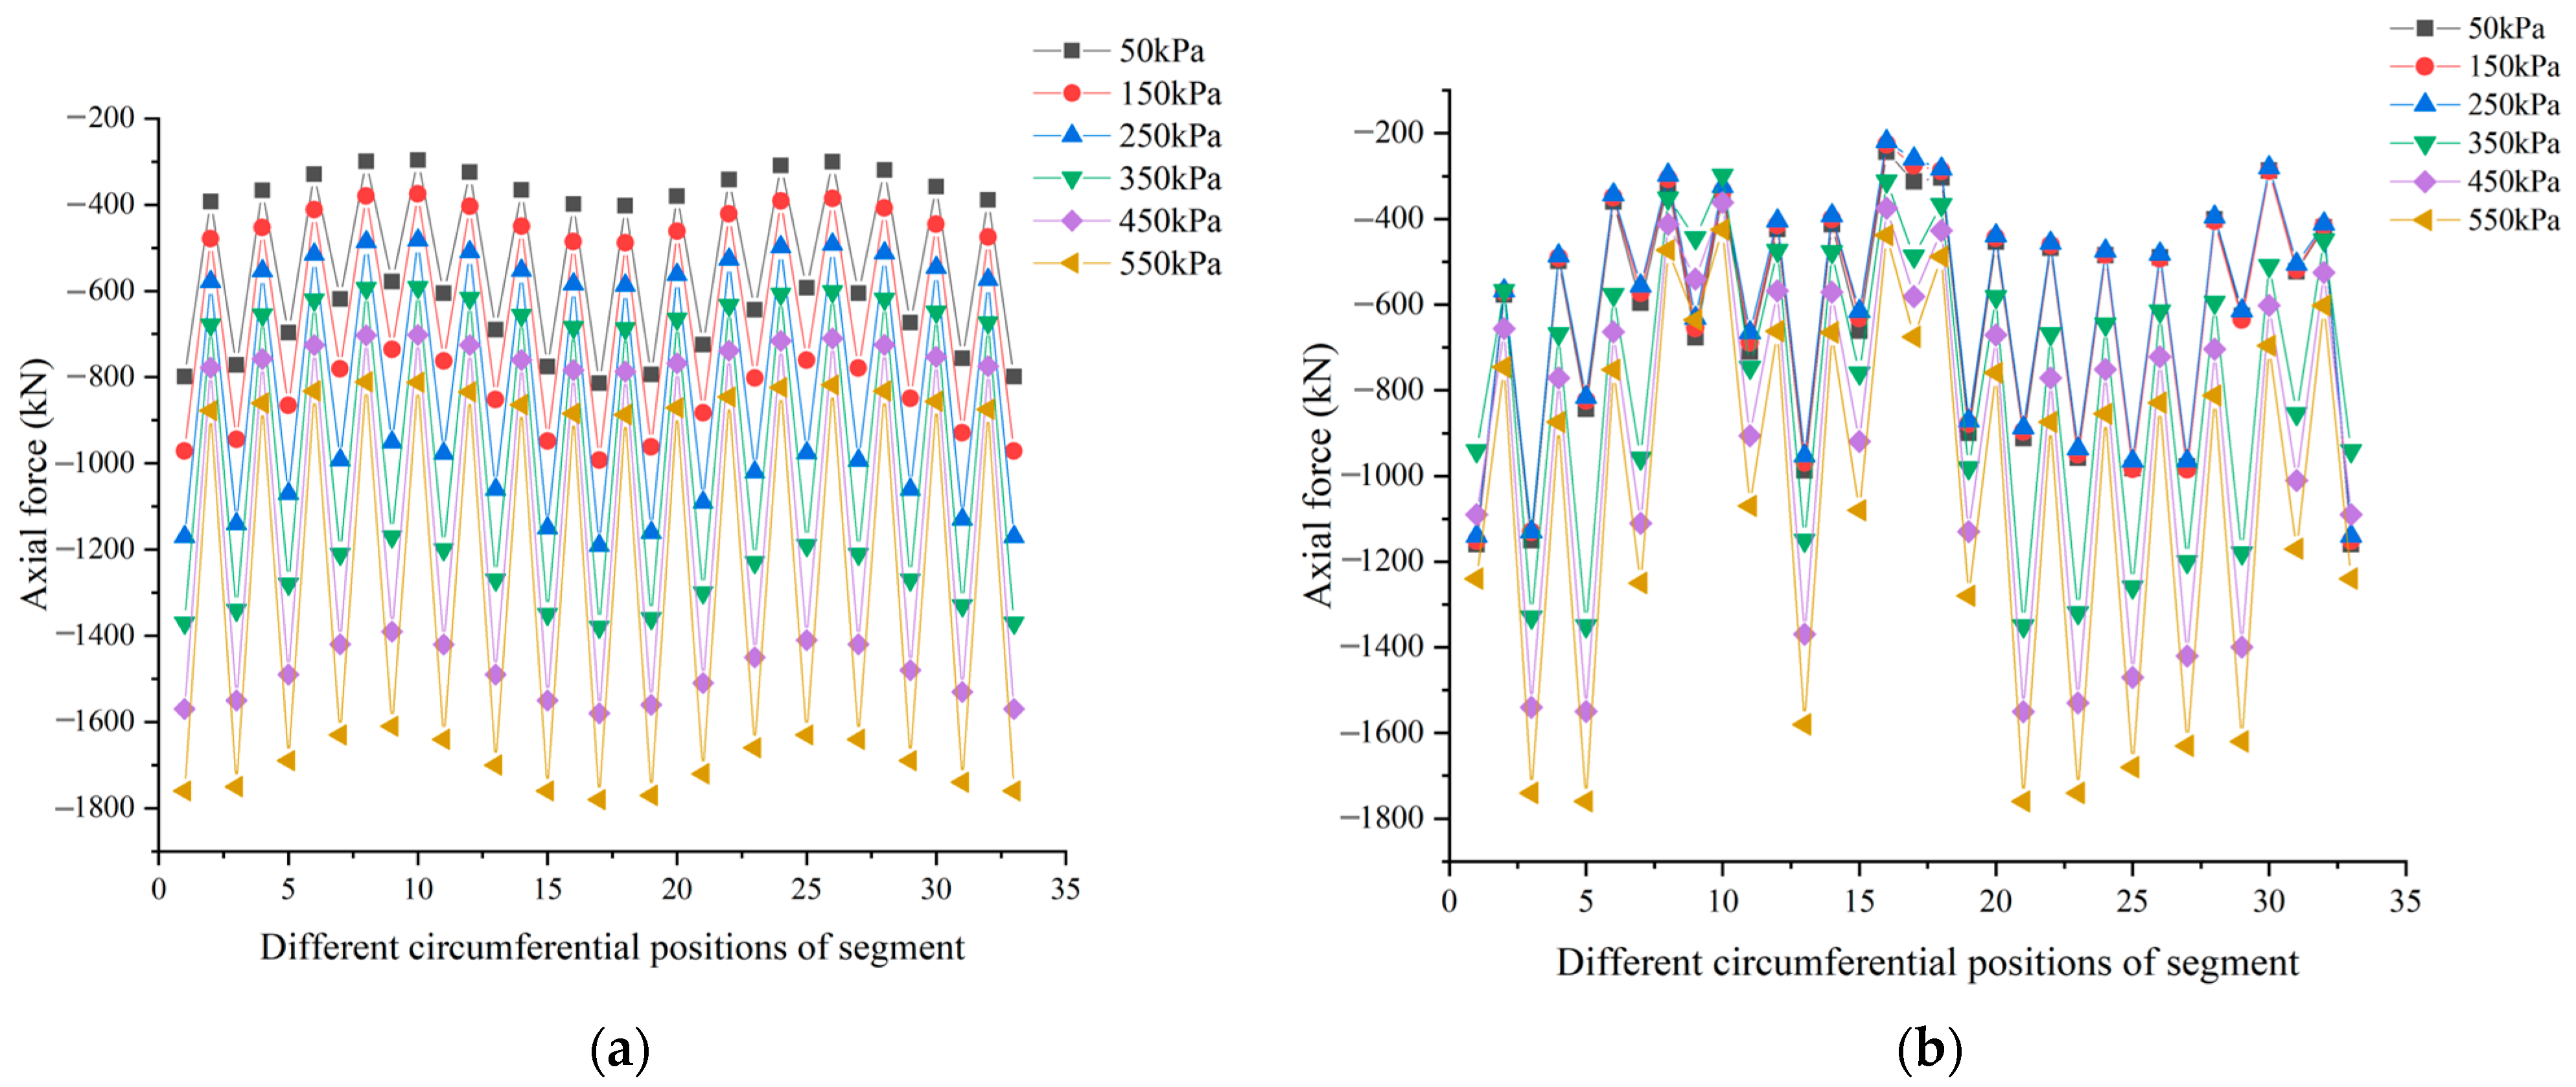
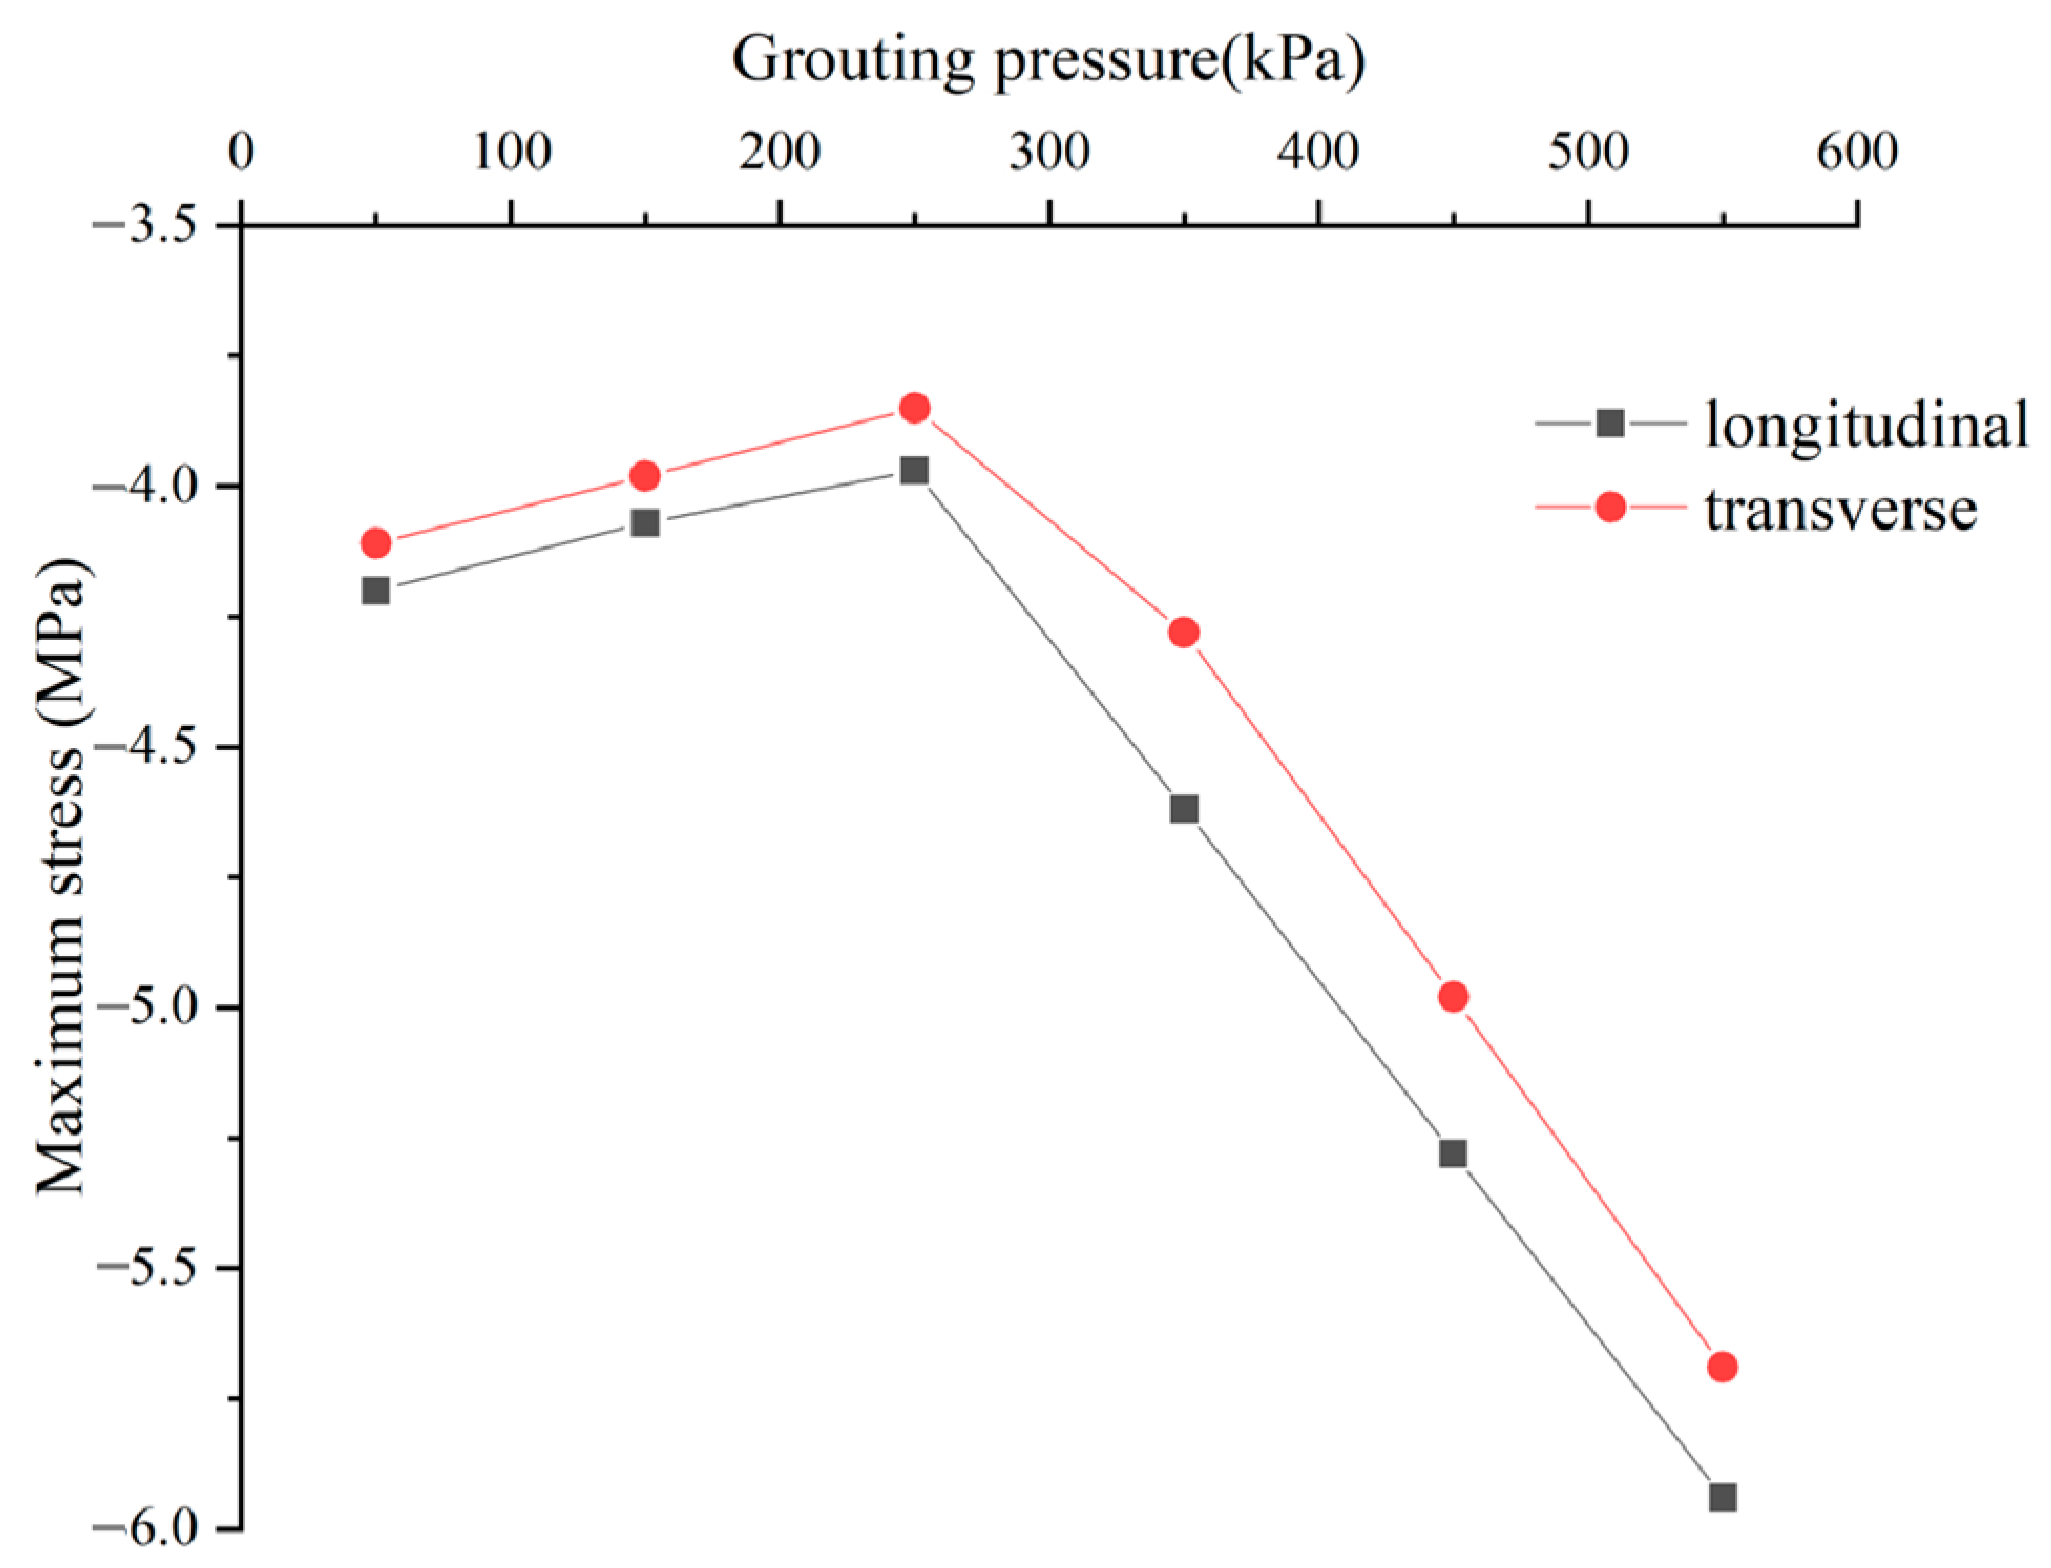
6.2. Effect of Grouting Pressure on Internal Forces of Segment

Similar to Section 5.2.1, the ring segment below the center of the building was considered the analysis objective. The numbers at different circumferential positions of the segment were also found in Figure 17. Figure 25 and Figure 26 show the variation curves of the bending moment and circumferential axial force of segments with grouting pressure, respectively.
From Figure 25, it can be found that for the same segment, no matter the left tunnel or the right tunnel, the variety rule of the bending moment was the same with different grouting pressures. The maximum positive bending moment of the segments still occurred near the tunnel arch crown and arch bottom, and the maximum negative bending moment occurred near the arch waist. For the segment of the left line tunnel, when the grouting pressure was 150 kPa, the bending moment of the segment was the largest, and its maximum value was 89.73 kN∙m. When the grouting pressure was 550 kPa, the maximum bending moment of the segment was 61.24 kN∙m, which was 31.75% less than the maximum bending moment of the segment for the grouting pressure of 150 kPa. For the segment of the right line tunnel, when the grouting pressure was 150 kPa, the bending moment of the segment was the largest, and its maximum value was 72.65 kN∙m. While the grouting pressure was 550 kPa, the maximum bending moment of the segment was 57.33 kN∙m, which was 21.09% less than the maximum bending moment of the segment for the grouting pressure of 150 kPa.
From Figure 26, it can be found that for the same segment, no matter which tunnel, the variety rule of axial force was the same with different grouting pressures. The axial force everywhere in the segment was still pressure. For the left line tunnel, when the grouting pressure increased, the axial force of the segment also increased. When the grouting pressure was 50 kPa, the maximum axial force of the segment was 810.56 kN; when the grouting pressure was 550 kPa, the maximum axial force of the segment was 1782.71 kN, which was 119.34% higher than that for the grouting pressure of 50 kPa. From Figure 26, it can be found that for the right line tunnel, when the grouting pressures were 50 kPa, 150 kPa, and 250 kPa, the axial forces of the segment directly below the right line tunnel building were basically the same, and the maximum value was 1178.94 kN, while the grouting pressures were within the range of 250~550 kPa, the axial force of the segment of the right line tunnel increased with the increase of the grouting pressure. While the grouting pressure was 550 kPa, the maximum axial force of the segment was 1768.52 kN, which was 50.01% higher than that for the grouting pressures of 50 kPa, 150 kPa, and 250 kPa.
For researching the effect of grouting pressure on the extremum of internal force of segment of double shield tunnels, the maximum longitudinal and transverse stresses of all segments of double shield tunnels under each grouting pressure value were extracted. Figure 27 shows the curve of its relationship with grouting pressure. From Figure 27, it can be found that when the grouting pressures were in the range of 50 kPa~250 kPa, the maximum longitudinal and transverse stresses reduced linearly with the increase of grouting pressure. When the grouting pressures were in the range of 250 kPa~550 kPa, the maximum longitudinal and transverse stresses increased linearly with the increase of grouting pressure.

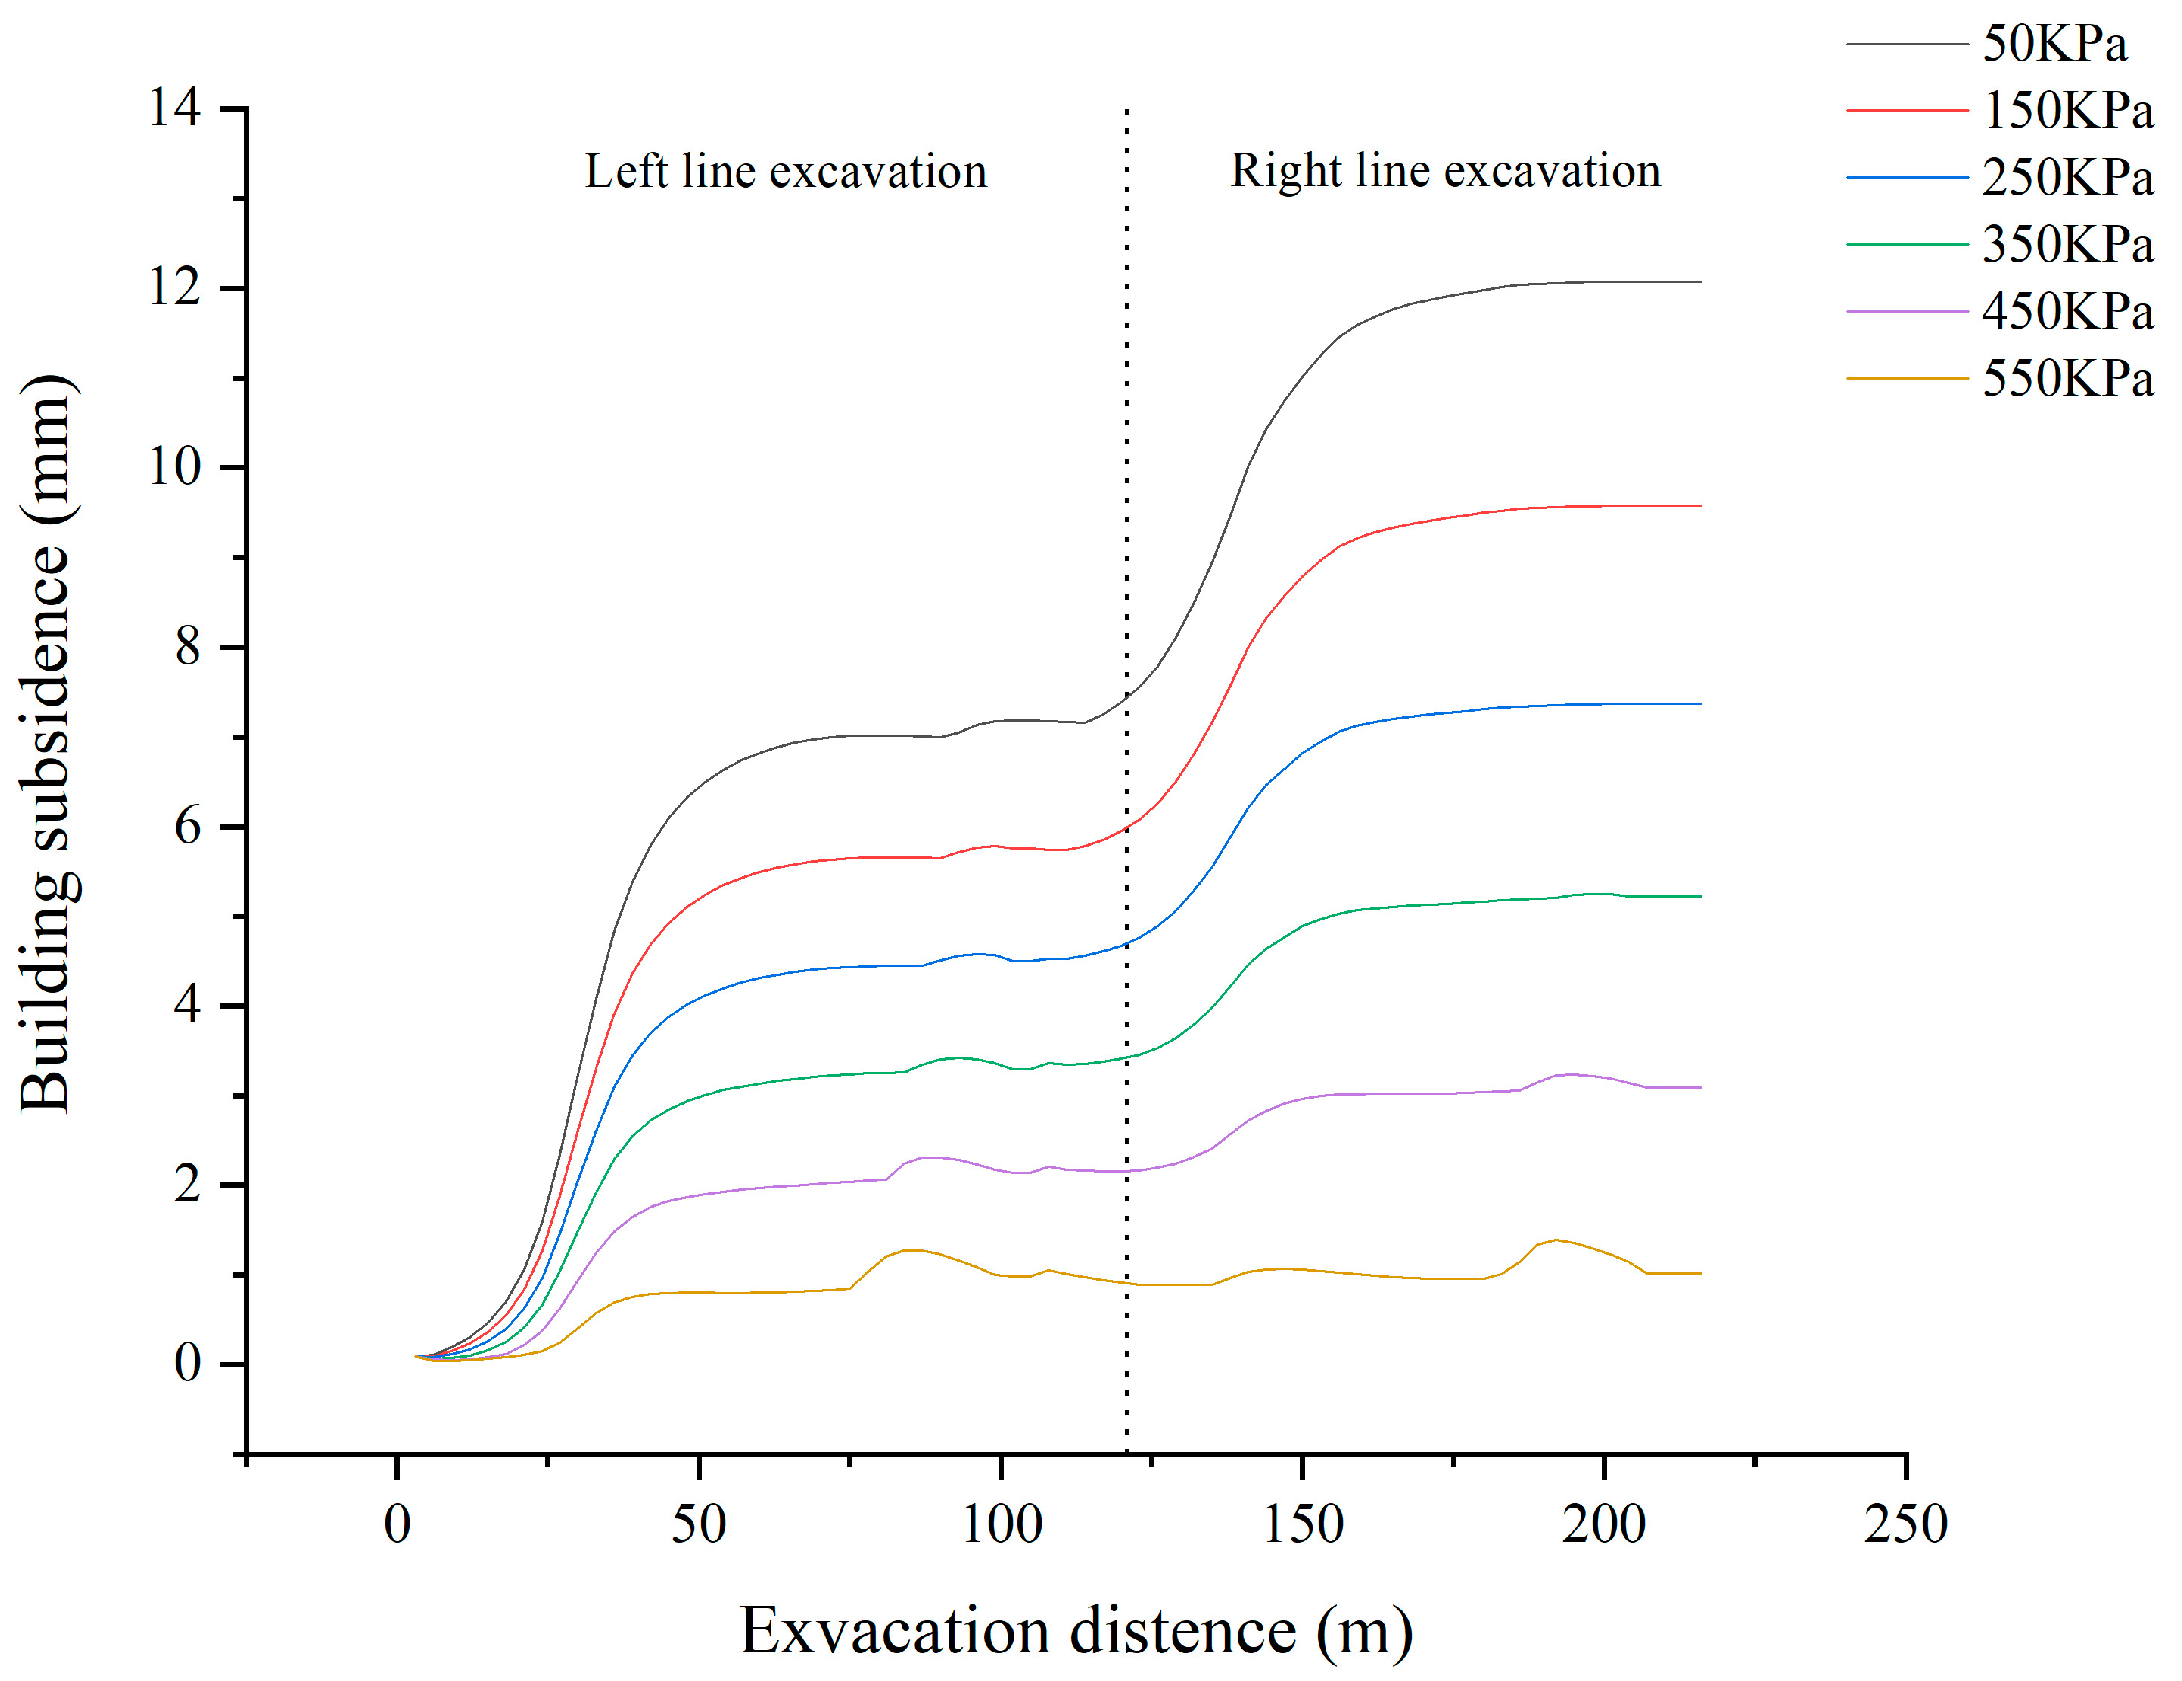
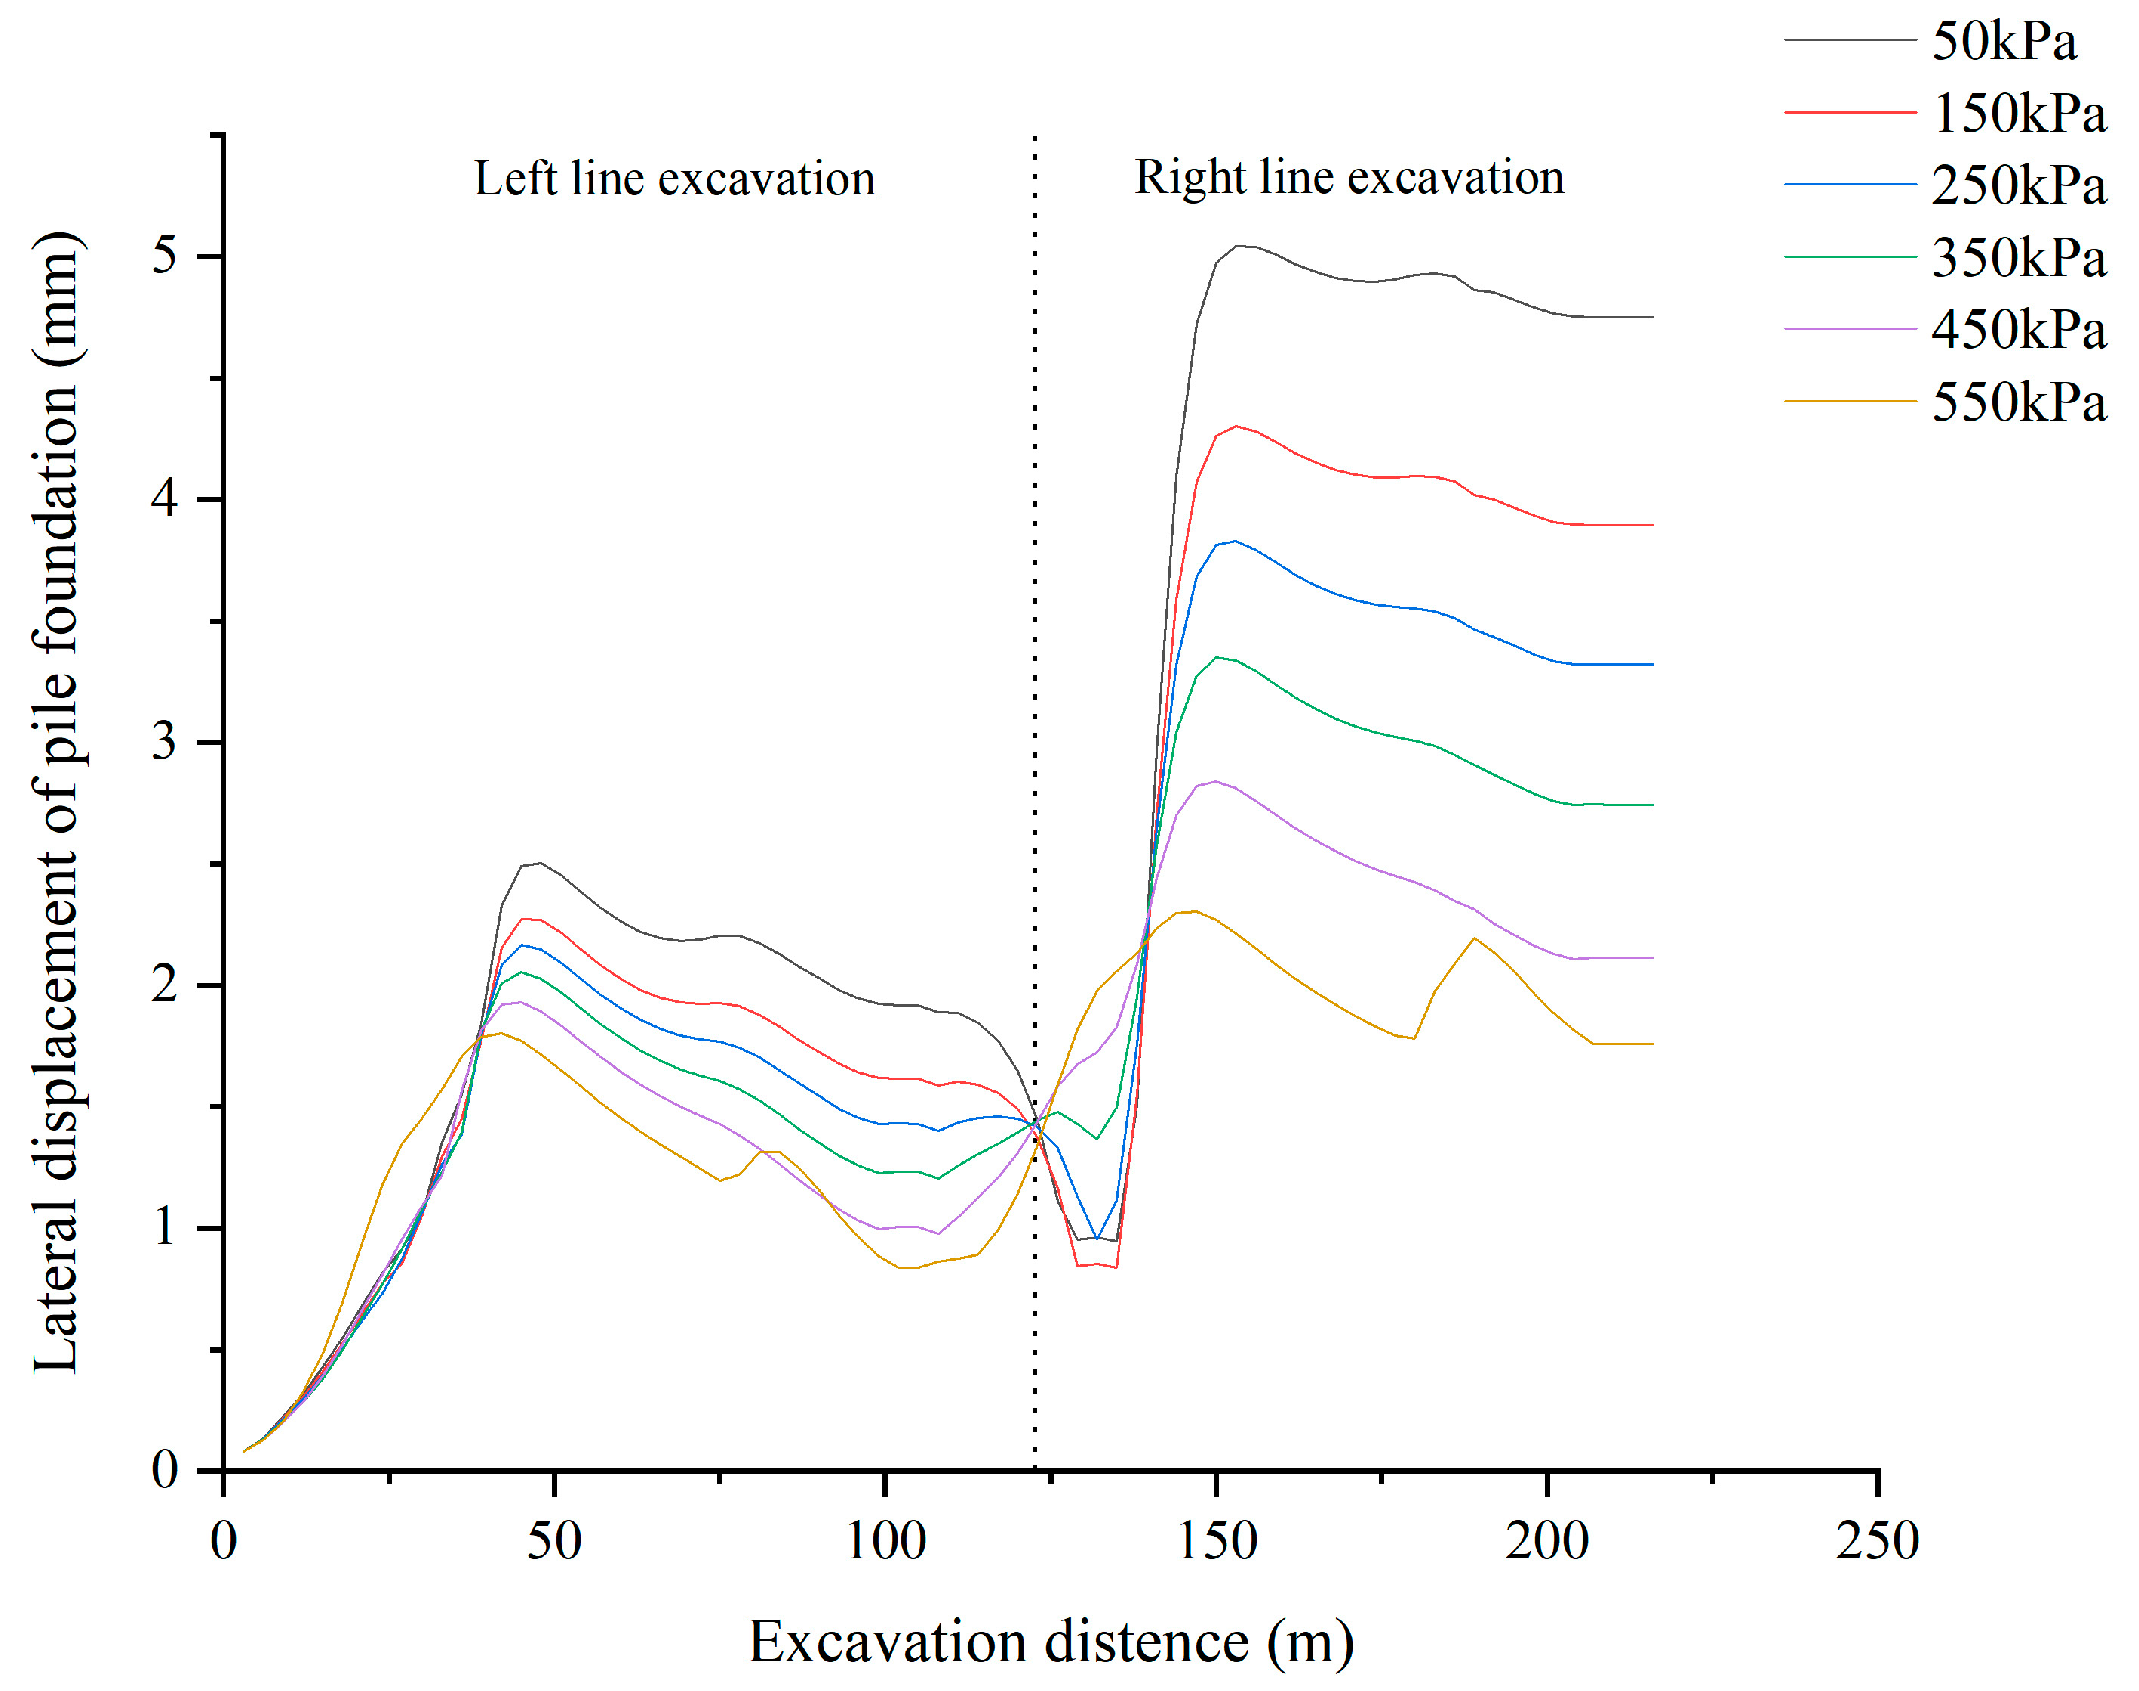
6.3. Effect of Grouting Pressure on Mechanical Behaviors of Building

From Section 5.3, the successive excavation of the double shield tunnels had an obvious nonlinear effect on the subsidence of the building and the lateral displacement of the pile along the excavation direction, while the effect on the tensile stress of the basement and the shear force of the pile can be negligible. Therefore, this section explored the variety of rules of the lateral displacement of piles and the subsidence of buildings under different grouting pressures. Figure 28 and Figure 29 show the subsidence of the building and the lateral displacement of the pile under different grouting pressures, respectively.
From Figure 28, it can be found that the changing pattern of building subsidence with the shield tunneling process was the same for different grouting pressures, and the subsidence of the building reduced gradually with the increase of grouting pressure. For the grouting pressure was 50 kPa, the subsidence of the building was 12.14 mm, while the grouting pressure was 550 kPa, the subsidence of the building was 1.36 mm, which was 88.80% less than that for the grouting pressure of 50 kPa. From Figure 29, it can be found that different grouting pressures resulted in comparable patterns of change in the lateral displacement of the pile during shield tunneling, and the lateral displacement of the pile gradually reduced as grouting pressure increased. When the grouting pressure was 50 kPa, the lateral displacement of the pile was 5.07 mm, while the grouting pressure was 550 kPa, the lateral displacement of the pile was 2.36 mm, which was 53.45% less than that for grouting pressure of 50 kPa. It can be seen from this that the stability of the building and piles can be effectively guaranteed by appropriately increasing the grouting pressure when excavating the double shield tunnels successively.

7. Deep Hole Grouting Reinforcement Technology for Shield Tunnel

From Section 5.3, the successive excavation of the double shield tunnels had an obvious nonlinear effect on the subsidence of the building and the lateral displacement of the pile along the excavation direction, affecting the safety and durability of the building and piles. The grouting reinforcement technology was one of the effective measures to reduce this impact [33,34]. At present, the grouting reinforcement technology is divided into the ground grouting measures and the deep hole grouting reinforcement technology in the tunnel. The latter was gradually becoming one of the main auxiliary measures for shield tunneling through various buildings due to its good reinforcement effect, as it can be carried out inside the tunnel and is not impacted by the external environment. This section studied the impact of the technical parameters of deep hole grouting reinforcement on the building and piles caused by the successive excavation of double shield tunnels. The radius of radial reinforcement and the reinforcement range before and after the building were considered the main technical parameters. The effects of these two parameters on the maximum subsidence of the building and the maximum lateral displacement of the pile were analyzed. Table 3 shows the comparison of the parameters of soil after grouting and the parameters of undisturbed soil.

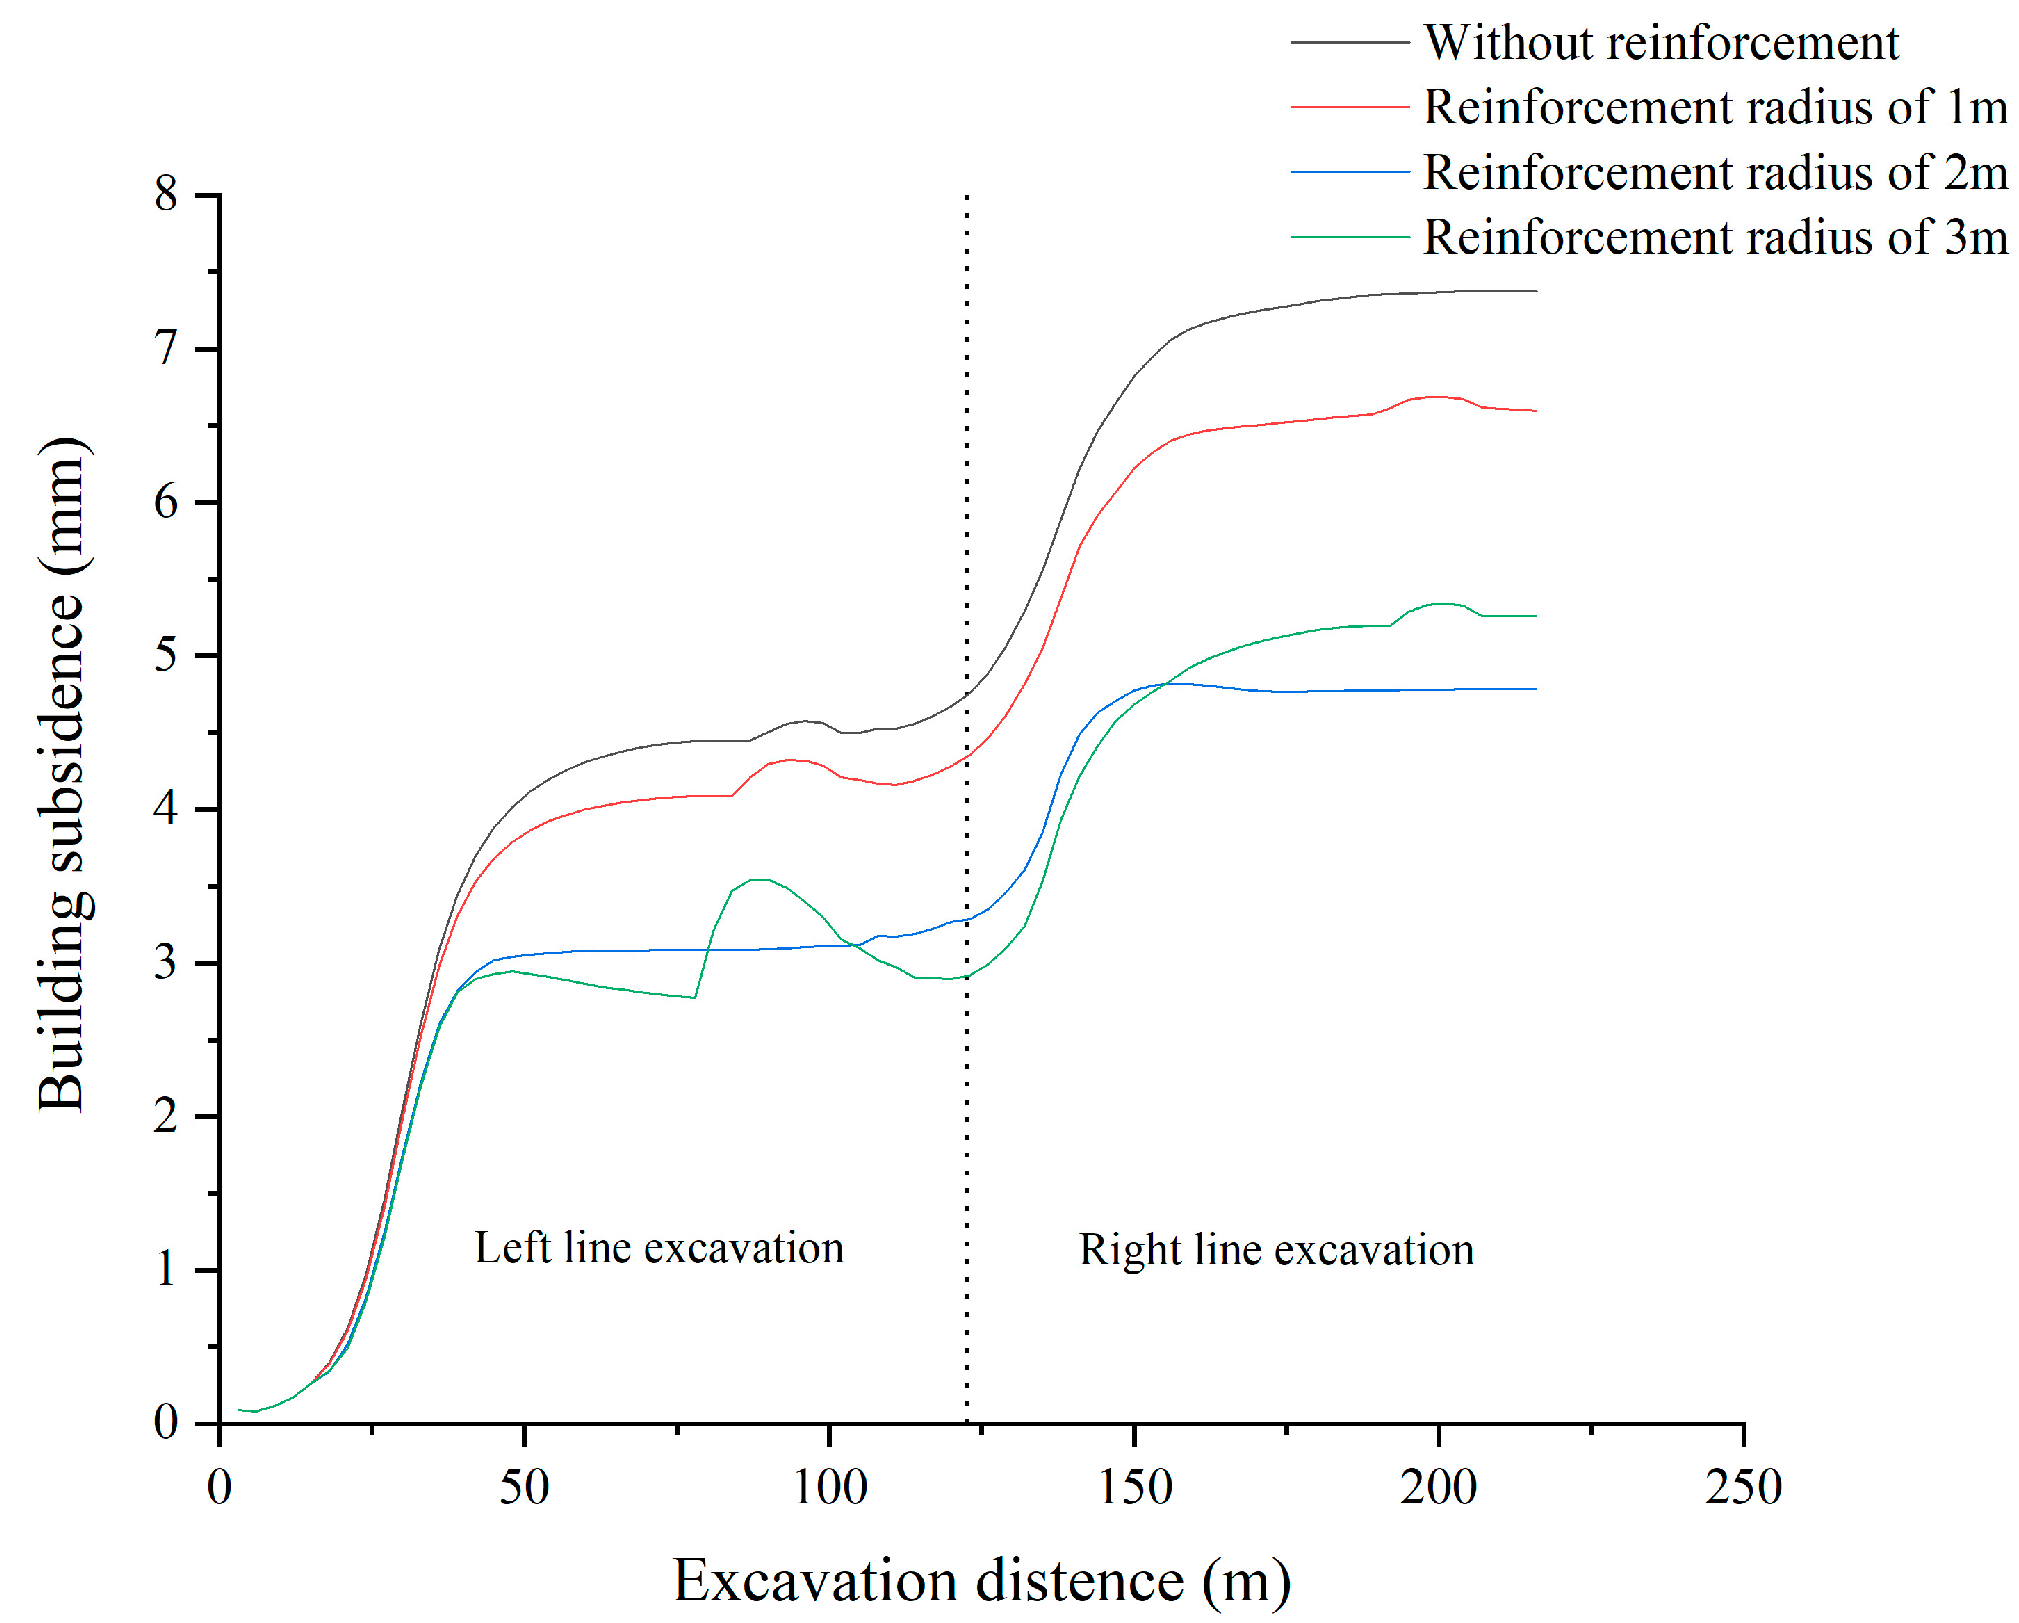
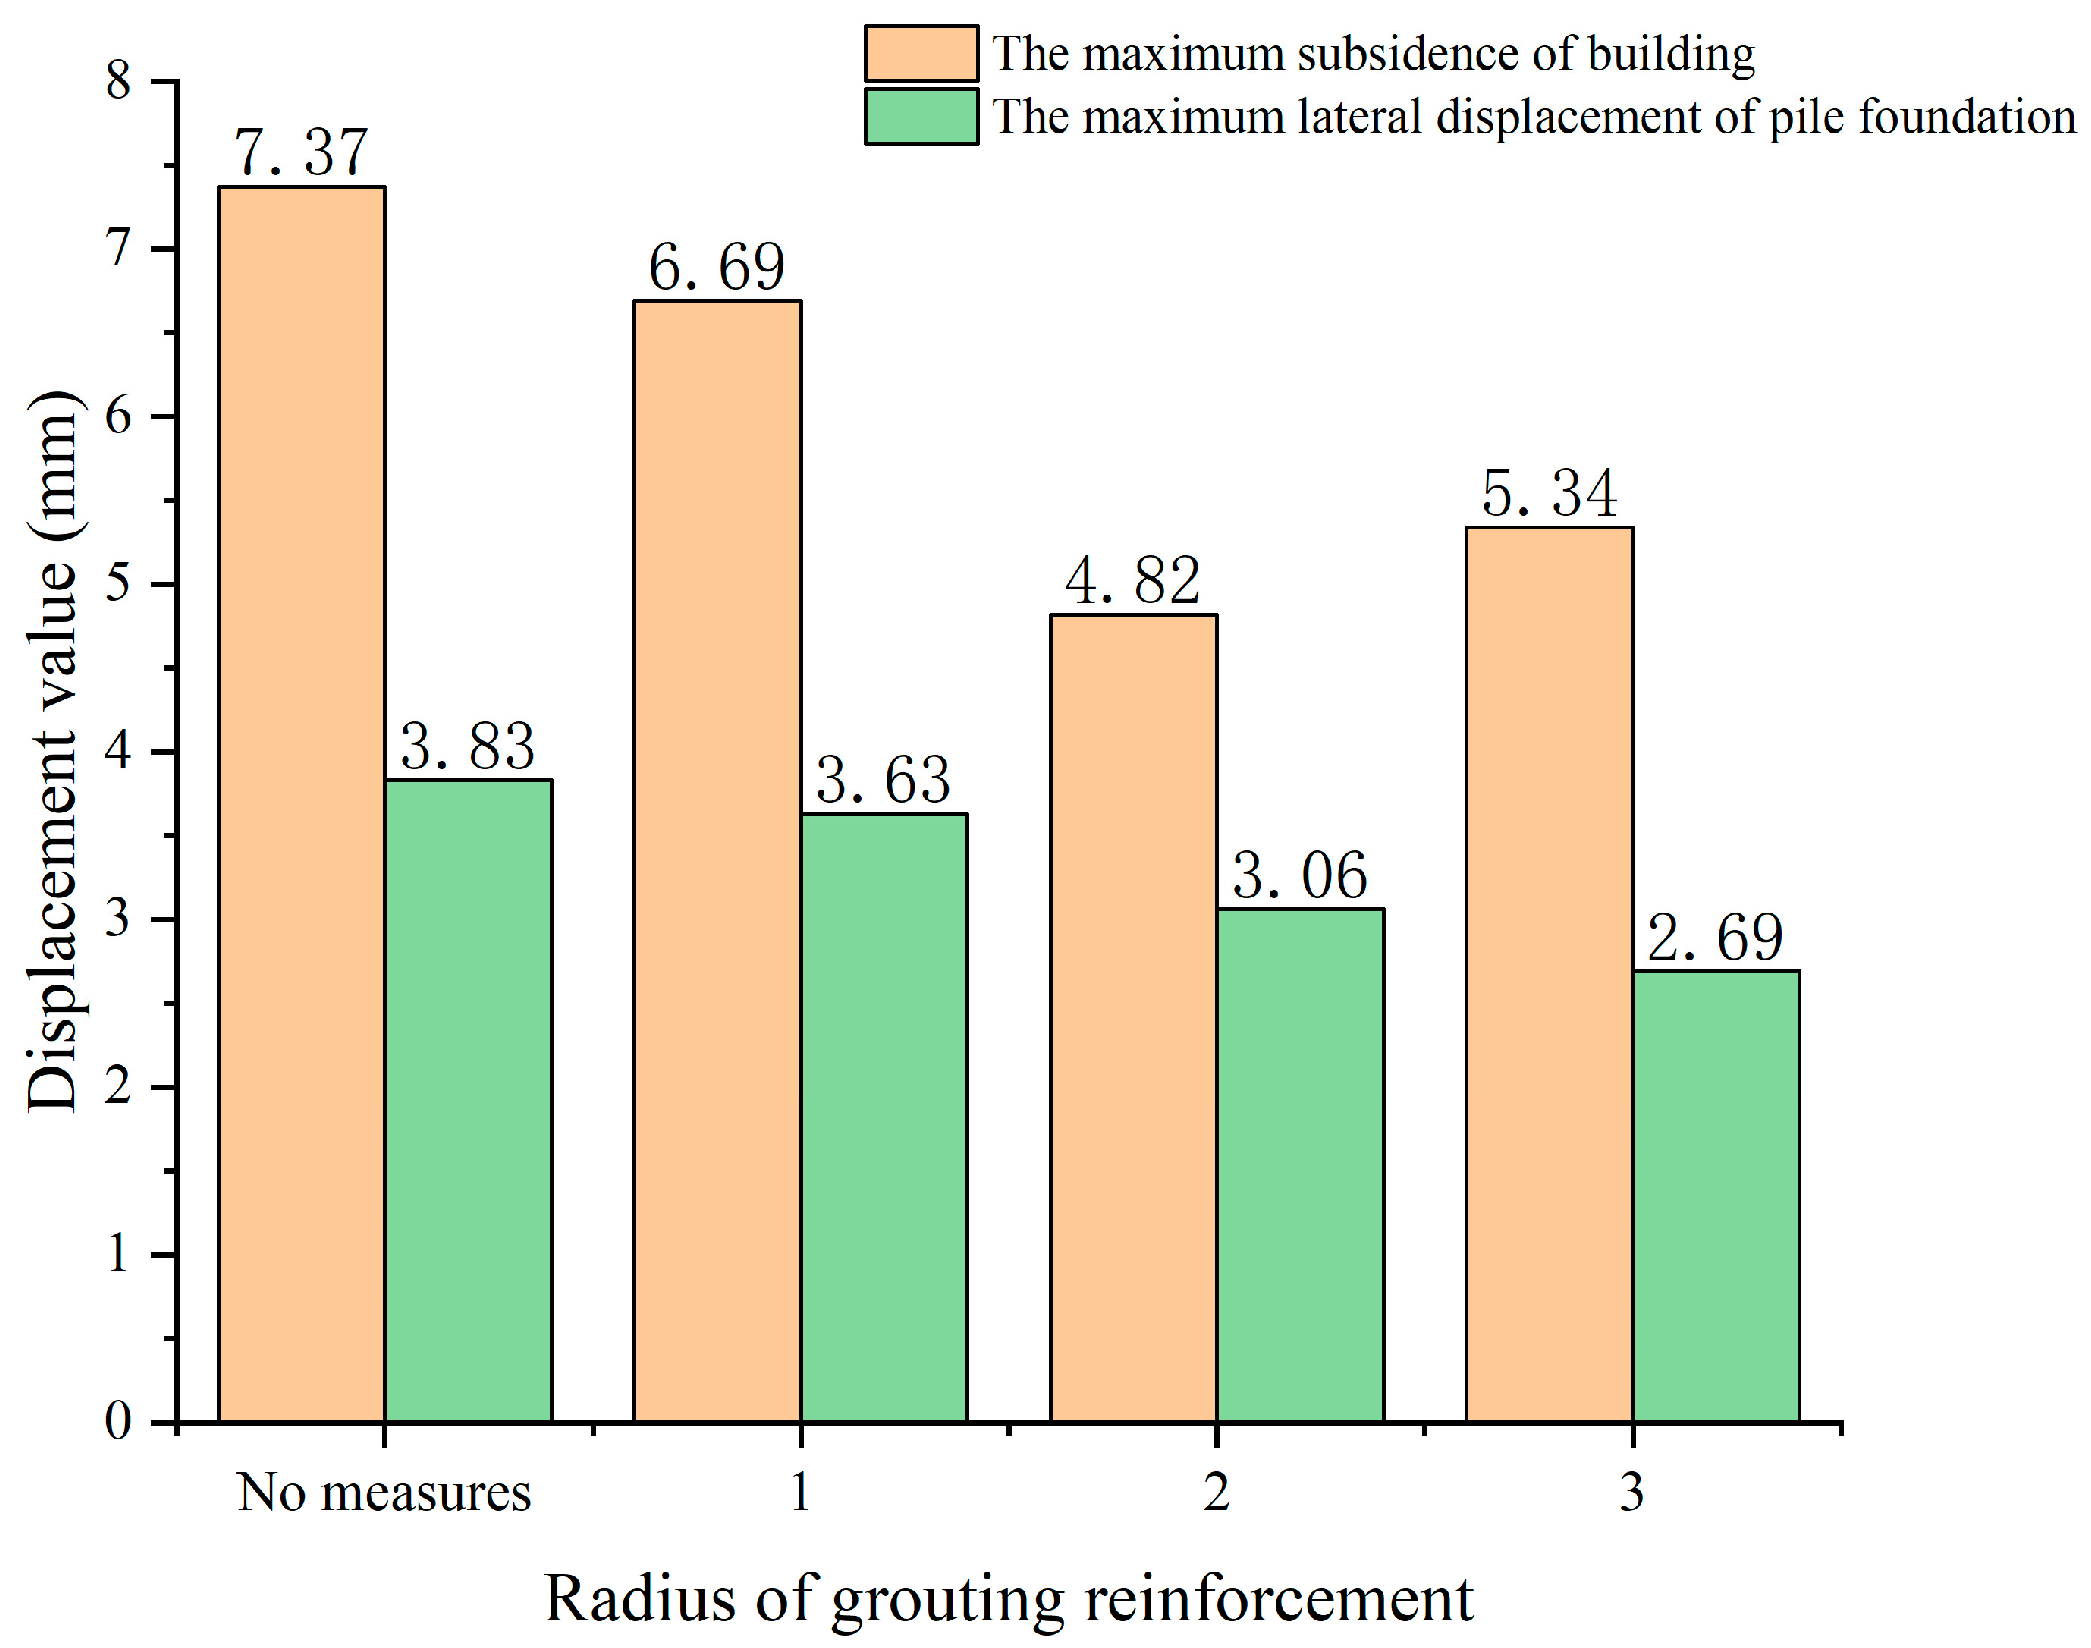
7.1. Effect of Radius of Radial Reinforcement on Reinforcement Effect of Deep Hole Grouting in Tunnel

The radius of radial reinforcement refers to the length of the grouting pipe entering the soil layer and extending out of the shield segments. As the pressure of deep hole grouting was usually large, if the grouting was done too early, the slurry would break the shield tail brush and cause damage to the shield machine, making the synchronous grouting slurry leak and inadequate grouting, so the deep hole grouting reinforcement was generally carried out after the segments were released from the five rings of the shield tail. Therefore, in this section, the surrounding soil would be grouted for reinforcement after the segments were separated from the five rings at the tail of the shield. According to the above analysis, the grouting pressure was set to 250 kPa, the excavation pressure was still set to 200 kPa, and the jack pressure was still set to 150 kPa. The slurry solidified and hardened after five rings of grouting. There was a small clear distance for the double shield tunnels, and the distance was only 6.1 m between the outer walls of the two tunnels, so the radius of radial reinforcement was selected as 1 m, 2 m, and 3 m, respectively. The grouting range in front and behind the building was taken as eight rings. The maximum lateral displacement of the pile and the maximum subsidence of the building with the excavation of the shield tunnels under different radii of radial reinforcement were shown in Figure 30 and Figure 31, respectively. Figure 32 shows the histogram of the maximum subsidence of the building and the maximum lateral displacement of the pile with the excavation of the shield tunnels under different radii of radial reinforcement where the grouting reinforcement radius of 0 m meant no grouting reinforcement measures.
From Figure 30, it can be found that the variety rule of the maximum subsidence of building under different radii of grouting reinforcement was basically the same during the excavation of the tunnel. Compared with no grouting reinforcement measures, the use of grouting reinforcement measures for deep holes in the tunnel can effectively reduce the subsidence of the building. When the radius of grouting reinforcement was 2 m, the subsidence of the building can be reduced to the maximum extent. Figure 32 showed that the maximum subsidence of the building was 7.37 mm without grouting reinforcement, while the radius of grouting reinforcement was 2 m, the maximum subsidence of the building was 4.82 mm for the radius of grouting reinforcement of 2 m, with the reduction of 34.60%. From Figure 31, it can be found that the lateral displacement of the pile with different radii of grouting reinforcement during shield tunneling was basically the same. Compared with no grouting reinforcement measures, the use of grouting reinforcement measures for deep holes in the tunnels can evidently abate the lateral displacement of piles, and as the radius of grouting reinforcement increases, the lateral displacement of piles is reduced. Figure 32 shows that the maximum subsidence of the building was 3.83 mm without grouting reinforcement, while the maximum subsidence of the building was 2.69 mm for the radius of grouting reinforcement of 3 m, with a reduction of 29.77%. Therefore, if the deep hole grouting reinforcement measures were taken in this project to reduce the impact of the excavation of shield tunnels on the building and piles, the radius of radial grouting reinforcement can be set to 2 m or 3 m, which was similar to the conclusion in reference [35].

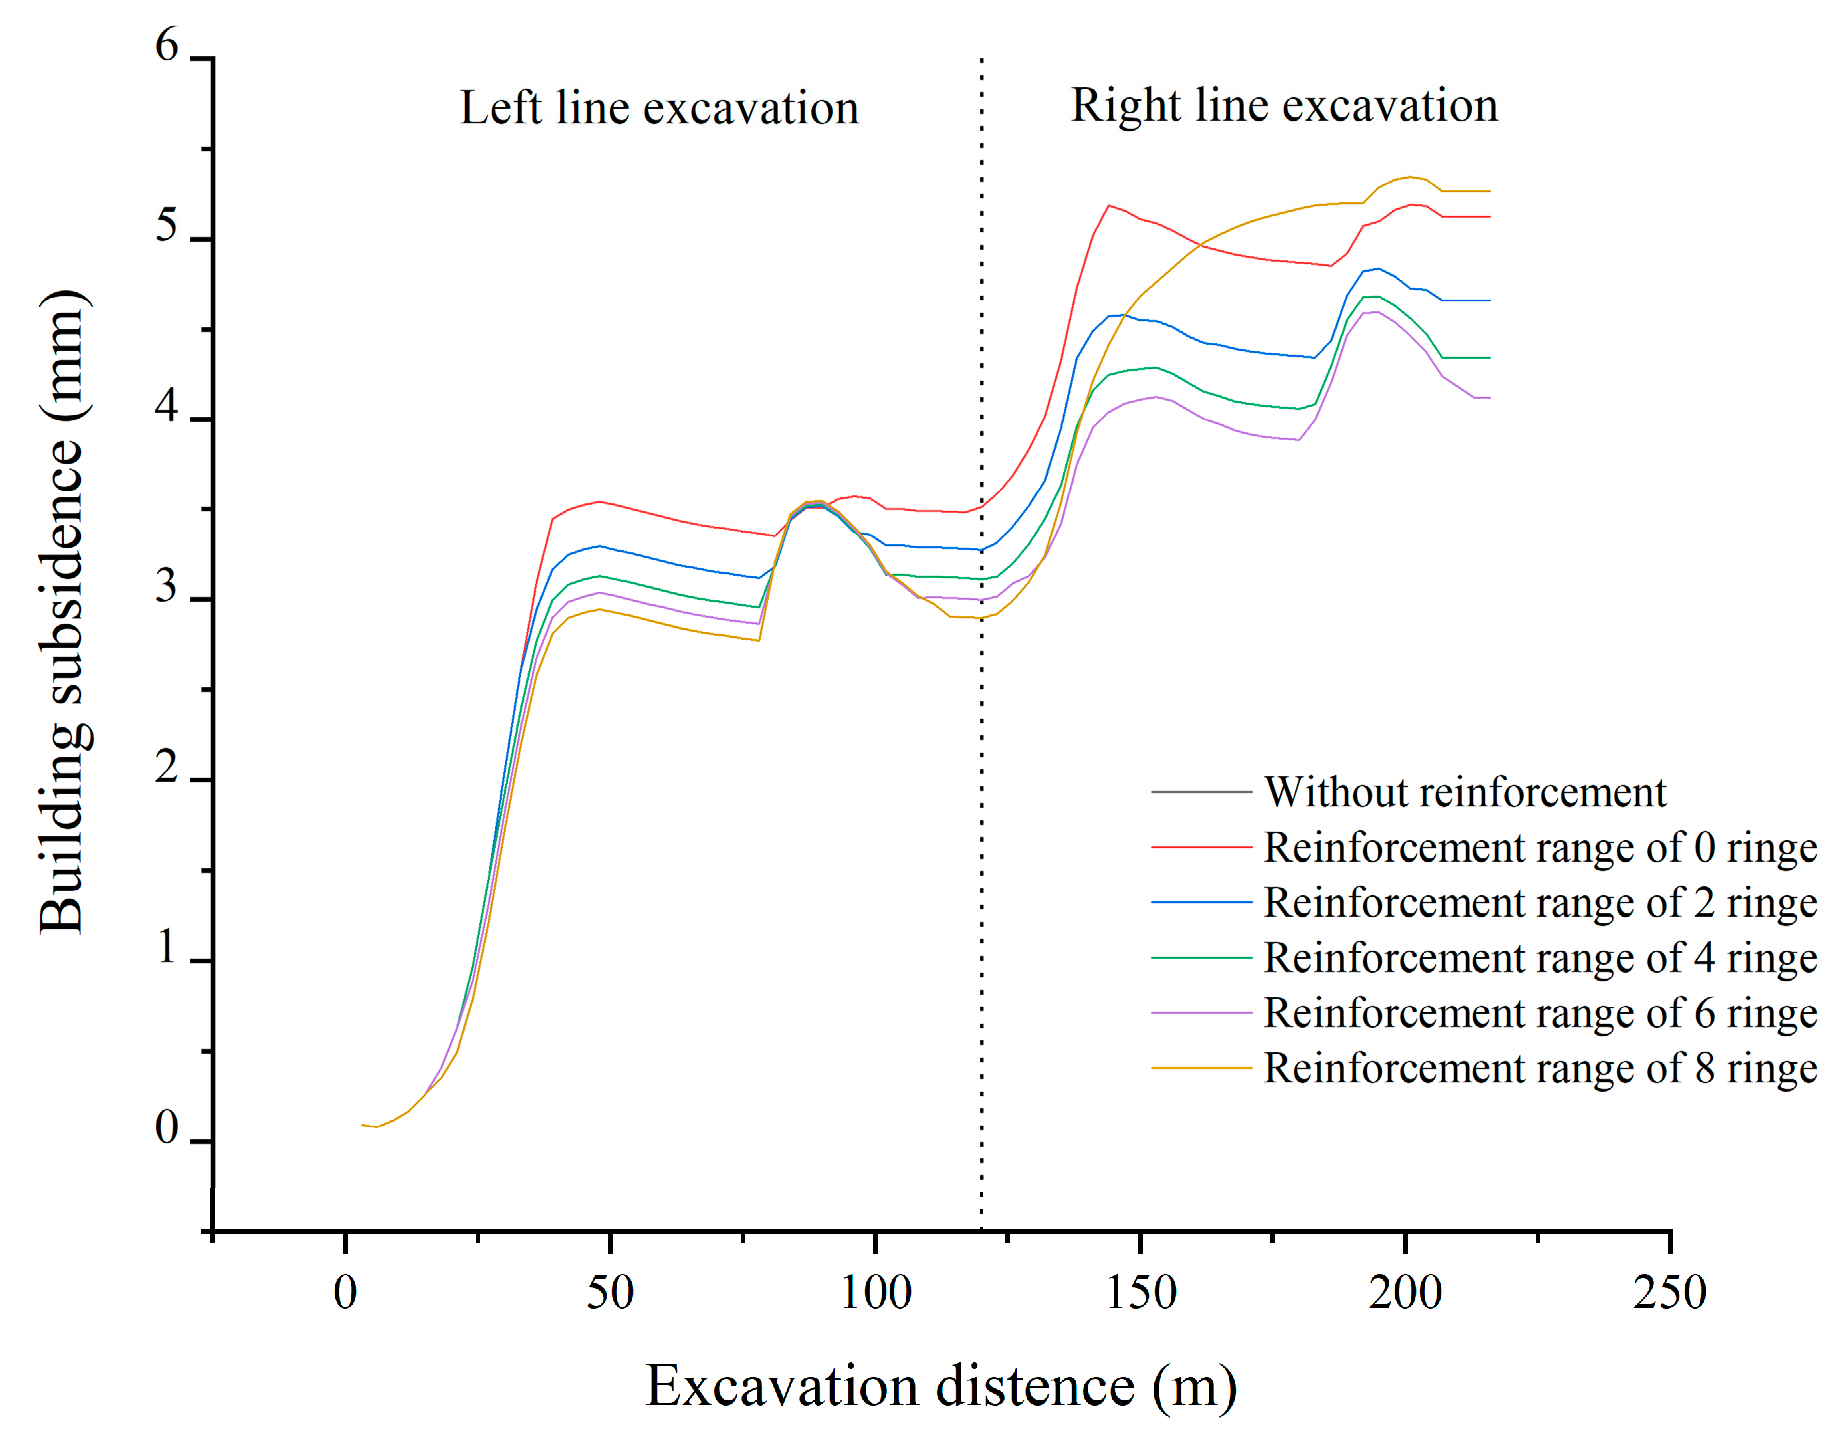
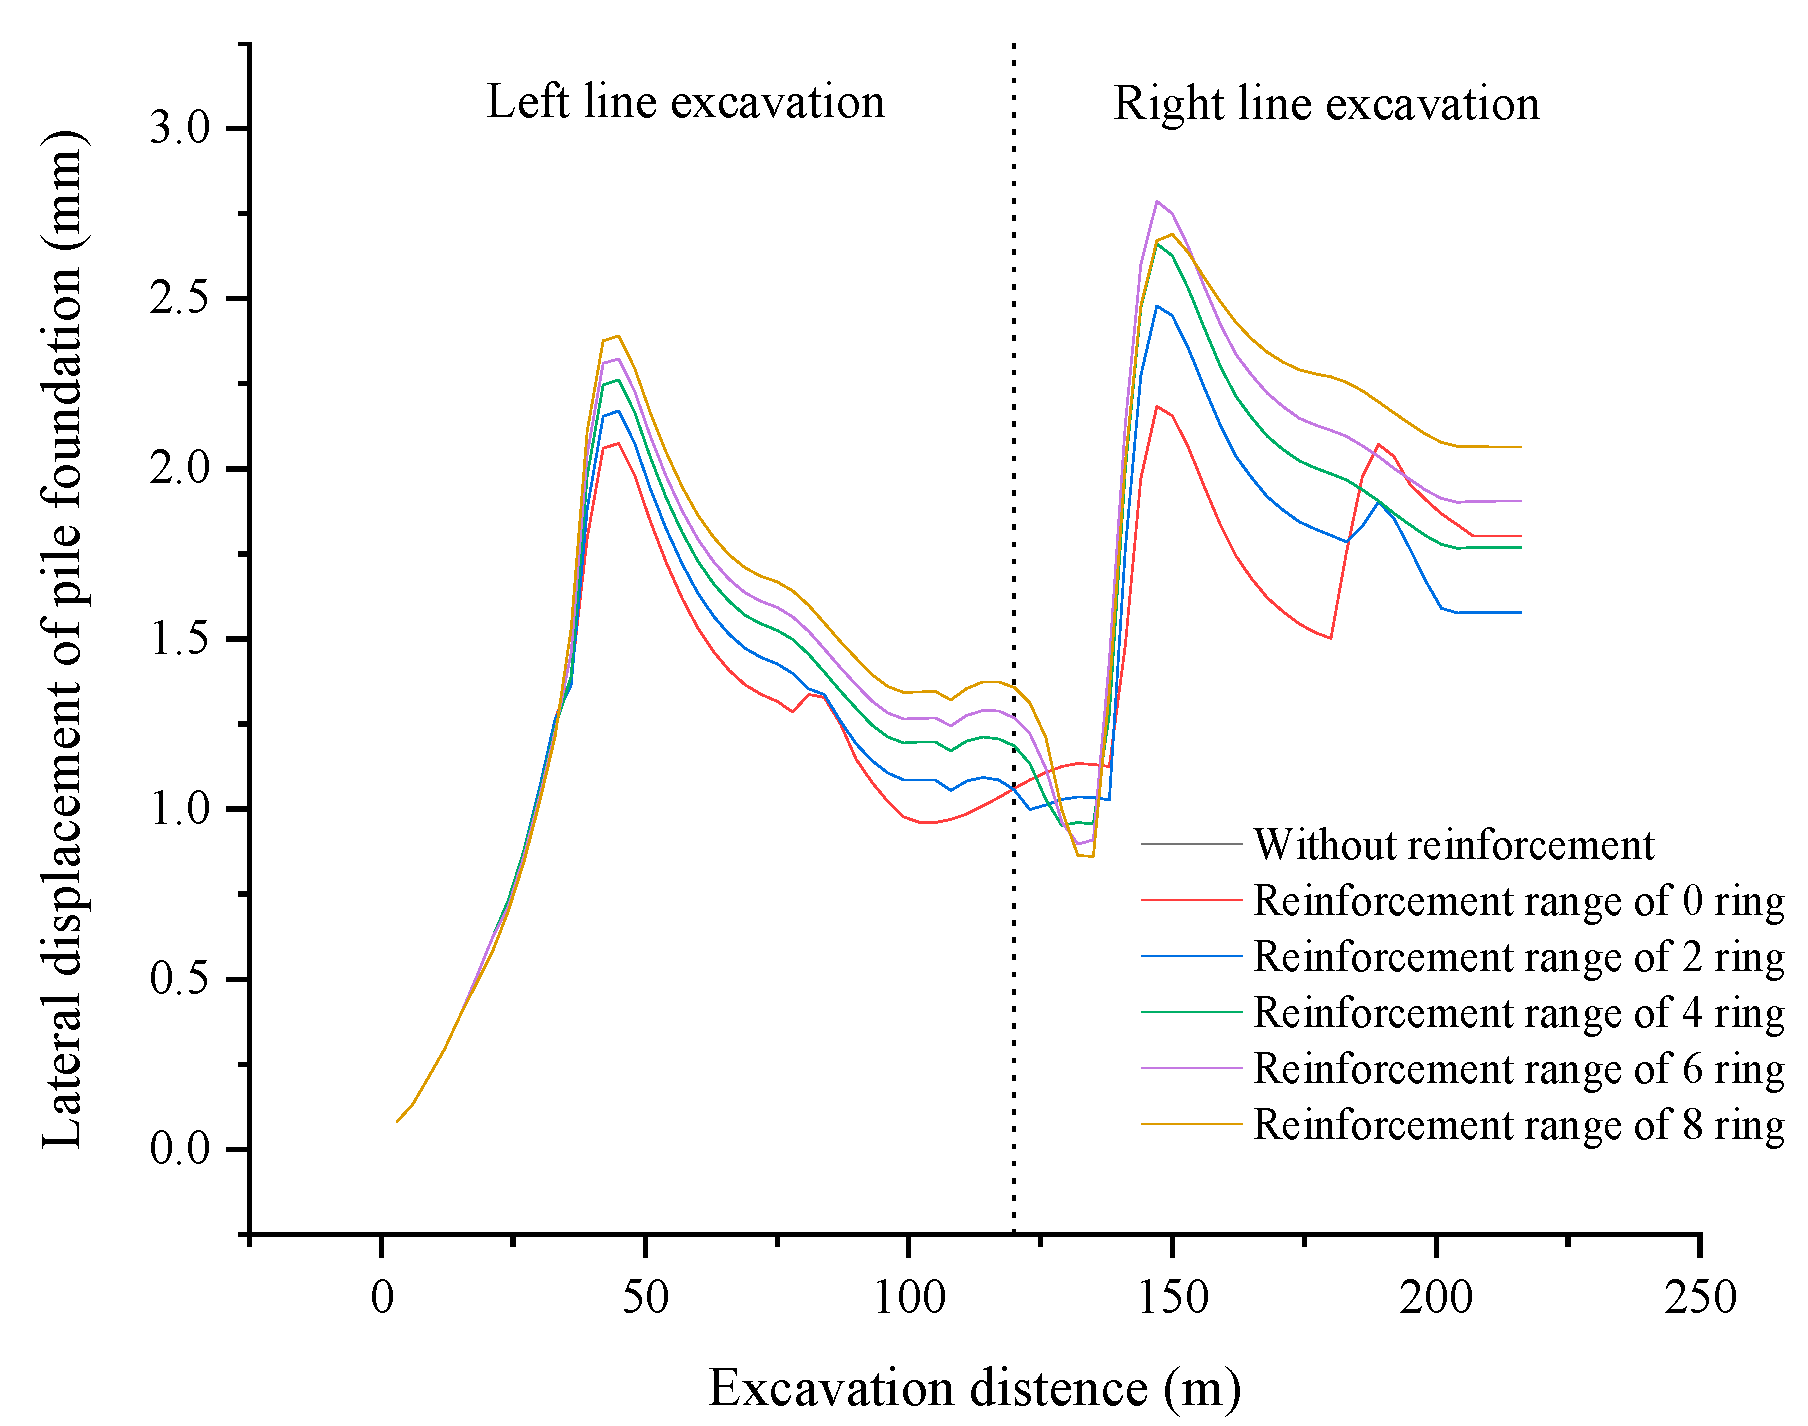
7.2. Effect of the Reinforcement Range before and after the Building on the Reinforcement Effect of Deep Hole Grouting in Tunnel

The reinforcement range before and after the building referred to the surrounding soil of the segments participating in the deep hole grouting reinforcement in the front and rear of the building. As analyzed above, in this section, the surrounding soil was grouted and reinforced after the segments came out of the five rings at the tail of the shield. The grouting pressure was set to 250 kPa, and the excavation pressure was still set to 200 kPa, the jack pressure was still set to 150 kPa. The slurry solidified and hardened after five rings of grouting. The radius of grouting reinforcement was taken as 3 m. The soil within the range of rings of 0, 2, 4, 6, and 8 in front and behind the building was reinforced. The ring of 0 was only used to reinforce the soil around the segments under the building. During the shield tunneling process, the maximum subsidence of the building and the maximum lateral displacement of the pile with the excavation of the shield tunnels under different reinforcement ranges were shown in Figure 33 and Figure 34, respectively. Figure 35 shows the histogram of the maximum subsidence of the building and the maximum lateral displacement of the pile under the different reinforcement ranges during shield tunneling.
From Figure 33, it can be found that the variety rule of the subsidence of building with different reinforcement ranges was basically the same during the process of shield tunneling. Compared with no grouting reinforcement measures, the use of grouting reinforcement measures for deep holes in the tunnels can evidently abate the subsidence of the building. When the reinforcement range was 0–6 rings, the subsidence of the building reduced with the increase of the reinforcement range, while the building subsidence increased when the reinforcement range increased to eight rings. Figure 35 shows that the maximum subsidence of the building was 7.37 mm without grouting reinforcement, while the maximum subsidence of the building was 4.59 mm for the reinforcement range of 6 rings, with a reduction of 37.72%. From Figure 34, it can be found that the variety rule of the lateral displacement of the pile with the different reinforcement ranges was basically the same during the process of shield tunneling. Compared with no grouting reinforcement measures, the use of grouting reinforcement measures for deep holes in the tunnels can evidently abate the lateral displacement of the pile. When the reinforcement range was approximately zero to six rings, with an increase in the reinforcement range, the pile’s lateral displacement increased, while the lateral displacement of the pile reduced when the reinforcement range was eight rings. Figure 35 shows that the maximum lateral displacement of the pile was 3.83 mm without grouting reinforcement, while the maximum lateral displacement of 2.18 mm of the pile was the minimum for the reinforcement range of zero rings, with a reduction of 43.08%.

8. Discussion

8.1. Discussion on the Effect of the Excavation of Double Shield Tunnels on Soil, Segment and Building

From Figure 11, it can be seen that the excavation of double shield tunnels caused the soil around the tunnel to approach the tunnel in the longitudinal direction and stay away from the tunnel in the lateral direction, causing the soil at the midpoint of the connection between the two tunnels to be compressed, thus offsetting some of the subsidence of the soil. As a result, the subsidence of the soil above the tunnels was distributed in an “M” shape with the distance from the centerline, as shown in Figure 12. The displacement of the soil around the tunnel caused the tunnel to be compressed by the soil, resulting in an elliptical shape of the segments, as shown in Figure 14. The maximum subsidence value of 7.19 mm, the maximum bulge value of 3.34 mm, and the maximum lateral displacement of 4.27 mm were located at the vault, upset, and waist of the segment, respectively.
As shown in Figure 36, due to the gravity effect of the upper building and the squeezing effect of the soil, and the subsidence of the soil above the tunnel is greater than the uplift of the soil below the tunnel, the tunnel generated a certain degree of contraction along the excavation direction and a certain degree of expansion along the horizontal direction. As shown in Figure 15 and Figure 16, this effect caused pressure to be applied to the segments in all longitudinal directions, and the segments at the top and bottom of the tunnel arch were subjected to positive bending moments, while the segments at the arch waists on both sides are subjected to negative bending moments.
As shown in Figure 22, shield tunneling caused uneven subsidence of the building, resulting in lateral displacement of the pile. In addition, shield tunneling excavation caused the lateral displacement of the soil around the tunnel. Due to the interaction between piles and soil, the pile can also experience lateral displacement. Building subsidence increased with the increase of shield tunneling distance, and the building subsidence increased from 0.09 mm at the beginning to 7.22 mm at the end of the excavation. The lateral displacement of the pile increased from 0.09 mm at the beginning to 3.82 mm during the excavation of the right tunnel.

8.2. Discussion on the Effect of Grouting Pressure on Mechanical Behaviors of Soil, Segment, and Building

As shown in Figure 24, the maximum subsidence of soil reduced linearly with the increase of grouting pressure. For the grouting pressures of 50 kPa and 550 kPa, the corresponding maximum subsidence of soil were 23.93 mm and 6.37 mm, with a reduction of 73.38%. According to the calculation, the maximum subsidence value of the soil mass would decrease by 3.512 mm when the grouting pressure increased by 100 kPa. This is because an increase in grouting pressure would increase the support effect on the soil around the tunnel, resulting in a decrease in the subsidence of the soil above the tunnel.
Figure 26 shows the relationship curves between the maximum longitudinal and transverse stresses of the segment and the grouting pressure. From Figure 26, it can be found that when the grouting pressures were in the range of 50~250 kPa, the maximum longitudinal and transverse stresses reduced linearly with the increase of grouting pressure. When the grouting pressures were in the range of 250~550 kPa, The maximum longitudinal and transverse stresses increased linearly with the increase of grouting pressure. This was because when the grouting pressure increased appropriately, it reduced the subsidence of the soil above the tunnel, thereby reducing the compression effect of the soil on the tunnel, resulting in a decrease in the longitudinal and transverse stresses of the segment. When the grouting pressure increased to a certain value, the greater the grouting pressure, the greater the compression effect of the grouting body on the segment, resulting in an increase in the longitudinal and transverse stresses of the segment.
From Section 5.3, the successive excavation of the double shield tunnels had an obvious nonlinear effect on the subsidence of the building and the lateral displacement of the pile along the excavation direction. Figure 37 shows the variation of maximum subsidence of the building and maximum lateral displacement of piles with grouting pressure. As shown in Figure 37, the subsidence of the building and the lateral displacement of piles decreased linearly with the increase of grouting pressure. According to the calculation, for every increase in grouting pressure of 100 kPa, the subsidence of the building decreased by approximately 2.138 mm, and the longitudinal displacement of the pile decreased by approximately 0.548 mm. This was because the increase in grouting pressure reduced soil subsidence, thereby increasing the support effect on the building, resulting in a decrease in building subsidence and pile lateral displacement.

8.3. Discussion on the Impact of Deep Hole Grouting Reinforcement Technology on Building and Pile

Compared with no grouting reinforcement measures, the use of grouting reinforcement measures for deep holes in the tunnel can effectively reduce the subsidence of the building and the lateral displacement of the pile. Reasonable selection of appropriate grouting reinforcement radius and grouting reinforcement range can more effectively reduce building subsidence and pile lateral displacement. Based on the actual situation of the project in this article, the radius of radial grouting reinforcement can be set to 2 m or 3 m, and the reinforcement range before and after the buildings can be set as approximately two to six rings.
This was because the engineering example used in this article is a small clear, distance double shield tunnel, which meant the center distance of the two tunnels was relatively close. Using an excessively large grouting reinforcement radius would cause the soil in the middle of the two tunnels to be completely grouted and reinforced, causing the soil in the middle to be crushed, which would further reduce the stability of the building. Therefore, setting the grouting reinforcement radius to 2~3 m is appropriate. Moreover, due to the distance between the two ends of the model and the building, grouting reinforcement at a distance from the building had little impact on the stability of the building. Therefore, setting the grouting reinforcement range to approximately two to six rings can maximize the stability of the building.

9. Conclusions

Taking the double shield tunnels of Changsha Metro Line 6 as an engineering background, this paper considered the building with a double basement and pile foundations and established the model for the shield tunnel to penetrate the existing building. Using the established model, the effects of the successive excavation, the parameter of grouting pressure, and the grouting reinforcement technology of shield tunnel on the mechanical behaviors of soil, segment, and building were researched. The conclusions were as follows.
(1)
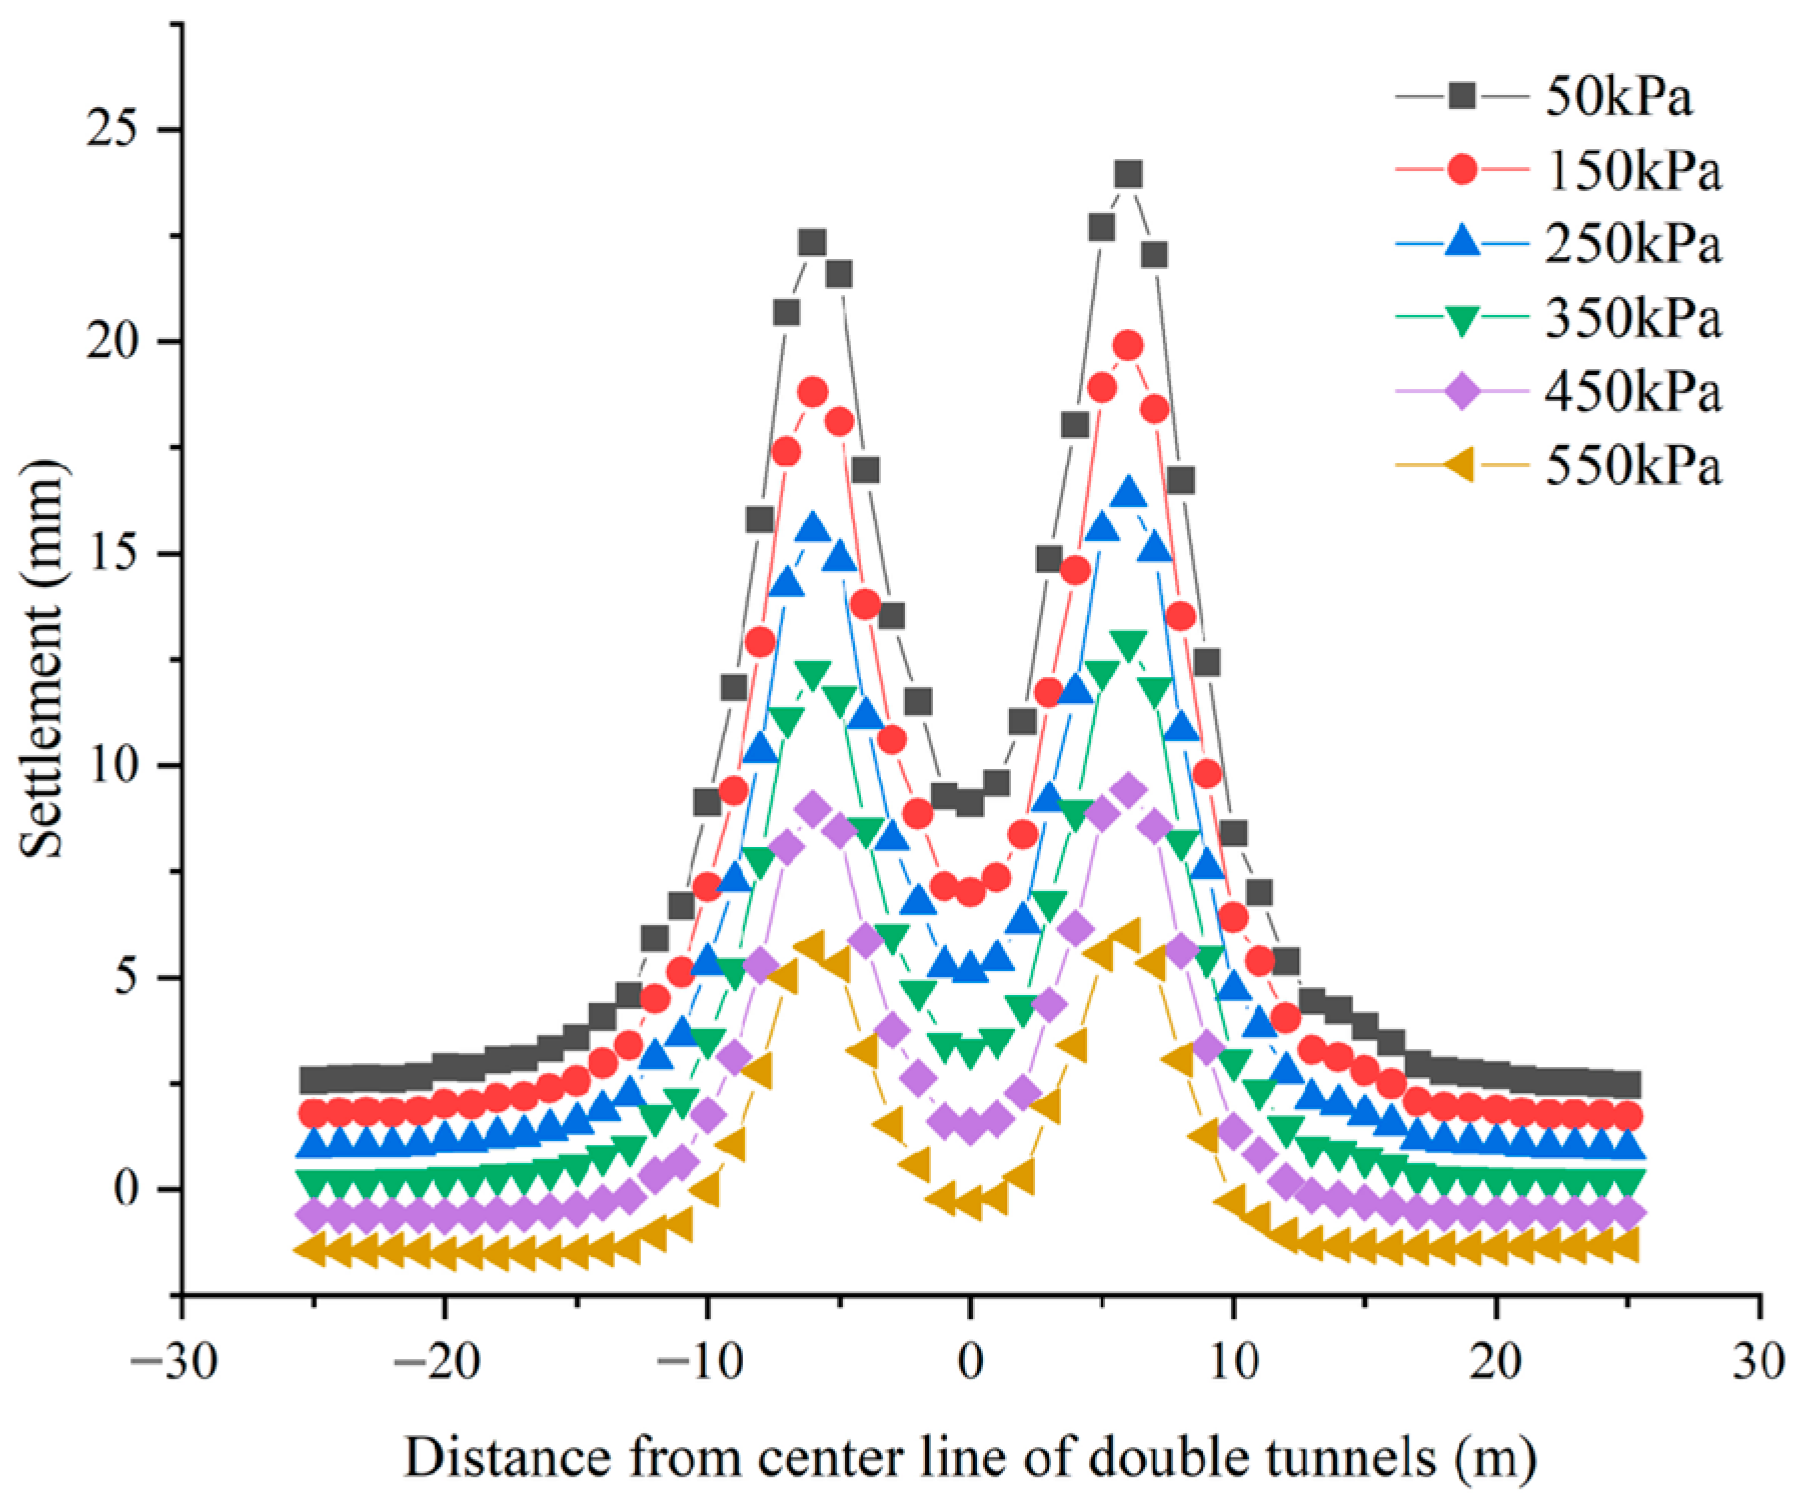
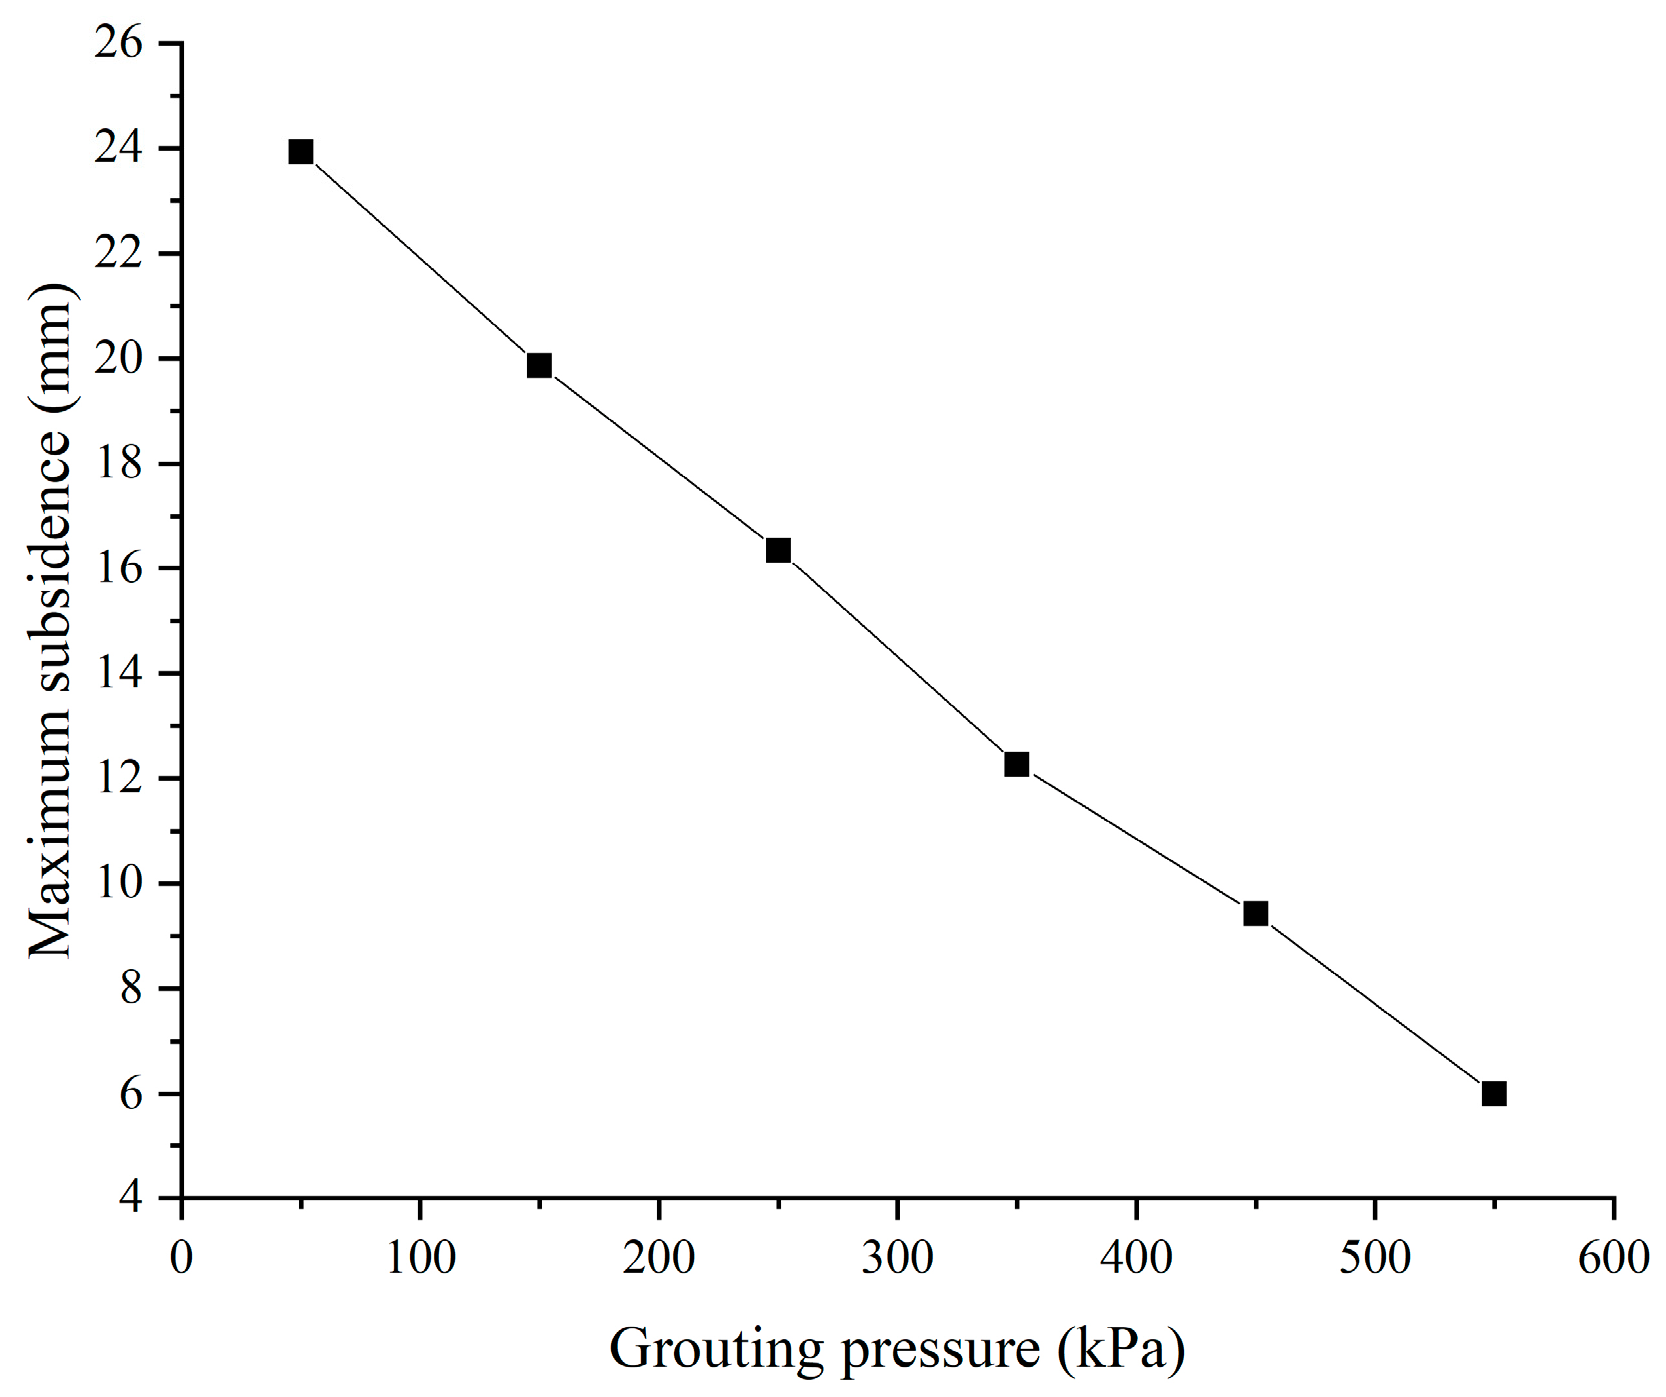
The successive excavation of double shield tunnels led to the subsidence and uplift of the soils above and below the excavation face, respectively, and the outward lateral displacements of the soil on both sides. Grouting pressure had a significant impact on soil displacement. According to the calculation, the maximum subsidence value of the soil mass would decrease by 3.512 mm when the grouting pressure increased by 100 kPa. The subsidence of the soil above the tunnels was distributed in an “M” shape with the distance from the centerline because the soil at the midpoint of the connection between the two tunnels was compressed.
(2)
Due to the gravity effect of the upper building and the squeezing effect of the soil, the successive excavation of double shield tunnels caused the elliptical deformation of segments, and the maximum subsidence value of 7.19 mm, the maximum bulge value of 3.34 mm, and the maximum lateral displacement of 4.27 mm the segment were located at the vault, upset and waist, respectively. The subsidence of the segment of double shield tunnels was the most significant after the completion of the successive excavation, and the subsidence of arch segments should be monitored in real-time during excavation.
(3)
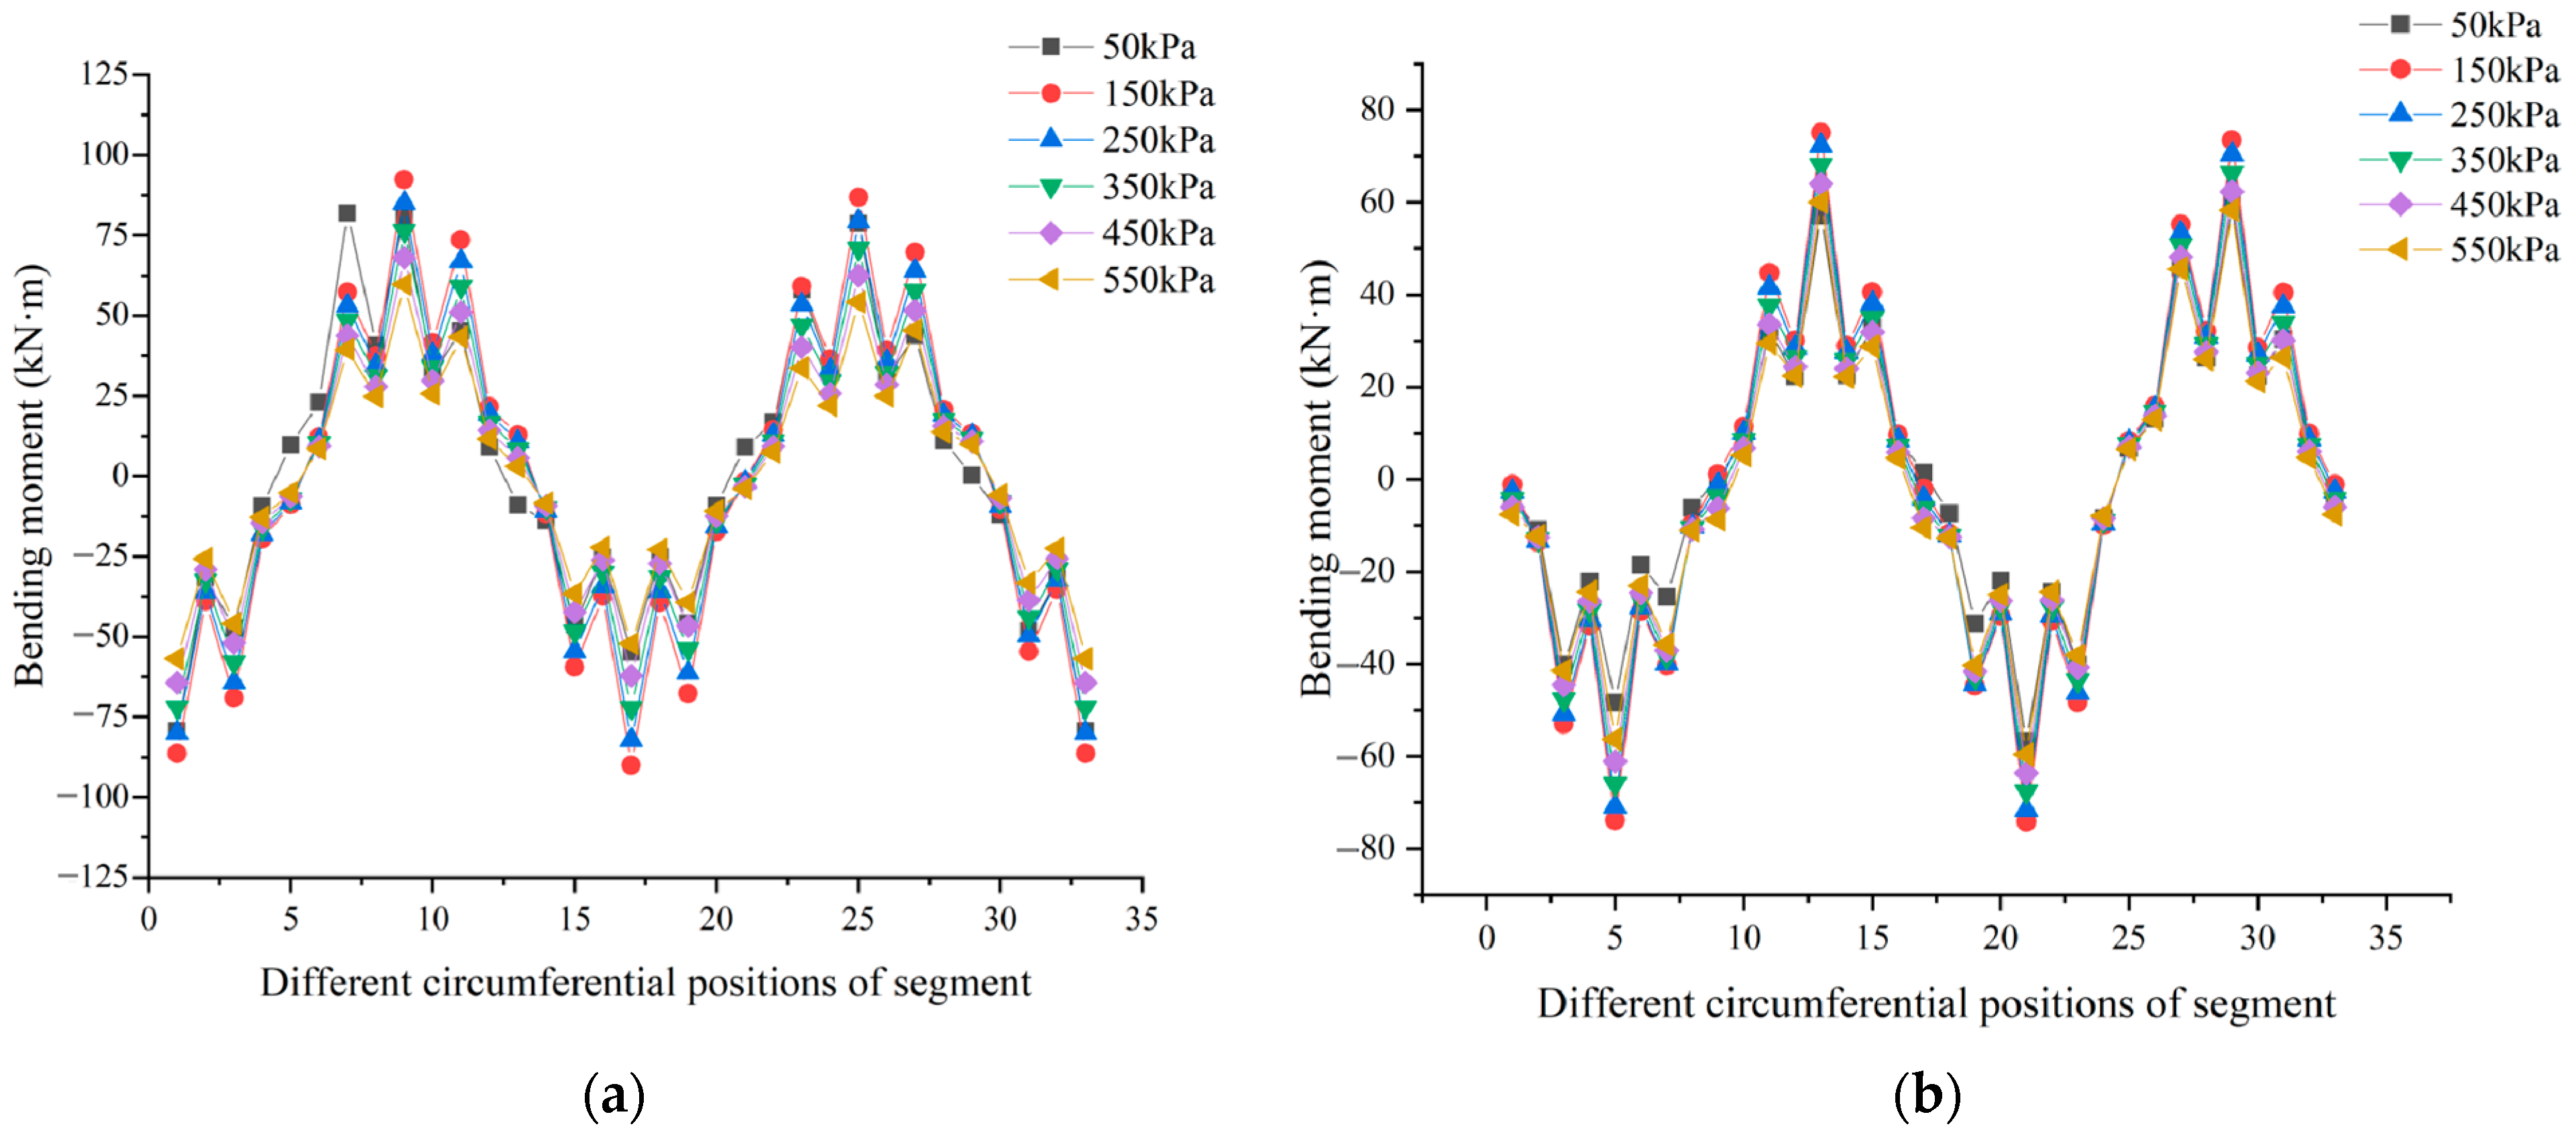
The grouting pressure had a nonlinear relationship with the segment bending moment and the segment circumferential axial force. The maximum positive bending moment and the maximum negative bending moment of the segments were located near the tunnel arch crown and arch bottom, respectively, and the maximum axial force and the minimum axial force of the segments were located near the arch waist and arch crown, respectively. When the grouting pressure was in the range of 50~250 kPa, the maximum longitudinal and transverse stress basically increased linearly with the increase of grouting pressure. The maximum longitudinal and transverse stress increased linearly with the change of grouting pressure when the grouting pressure was in the range of 250~550 kPa.
(4)
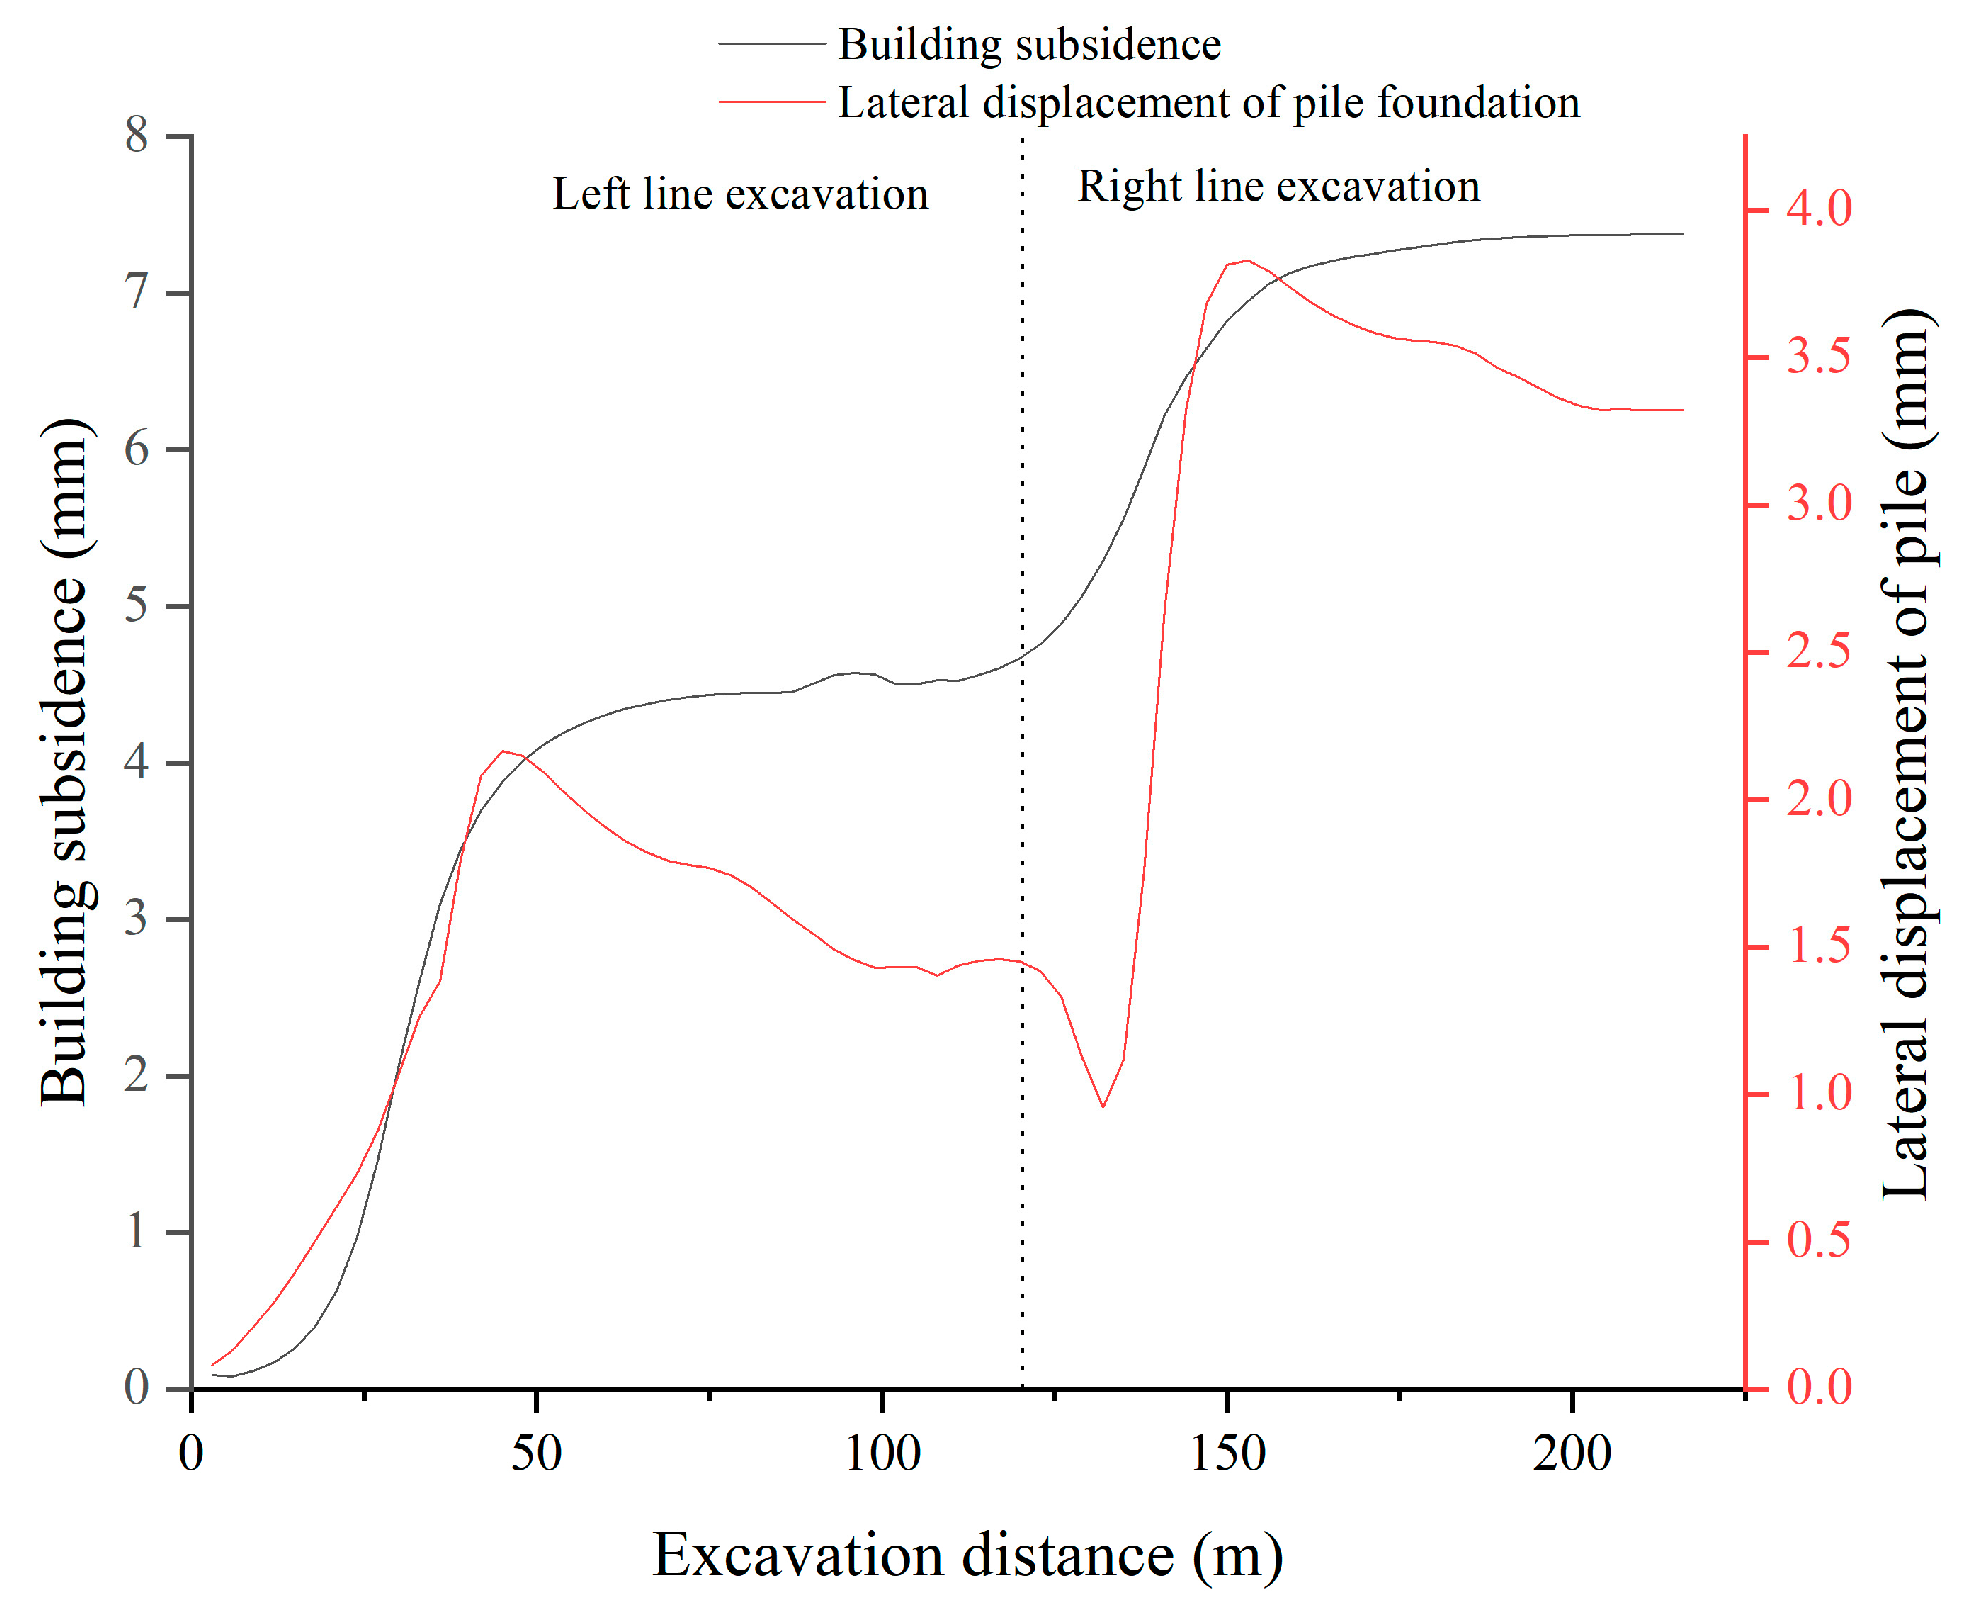
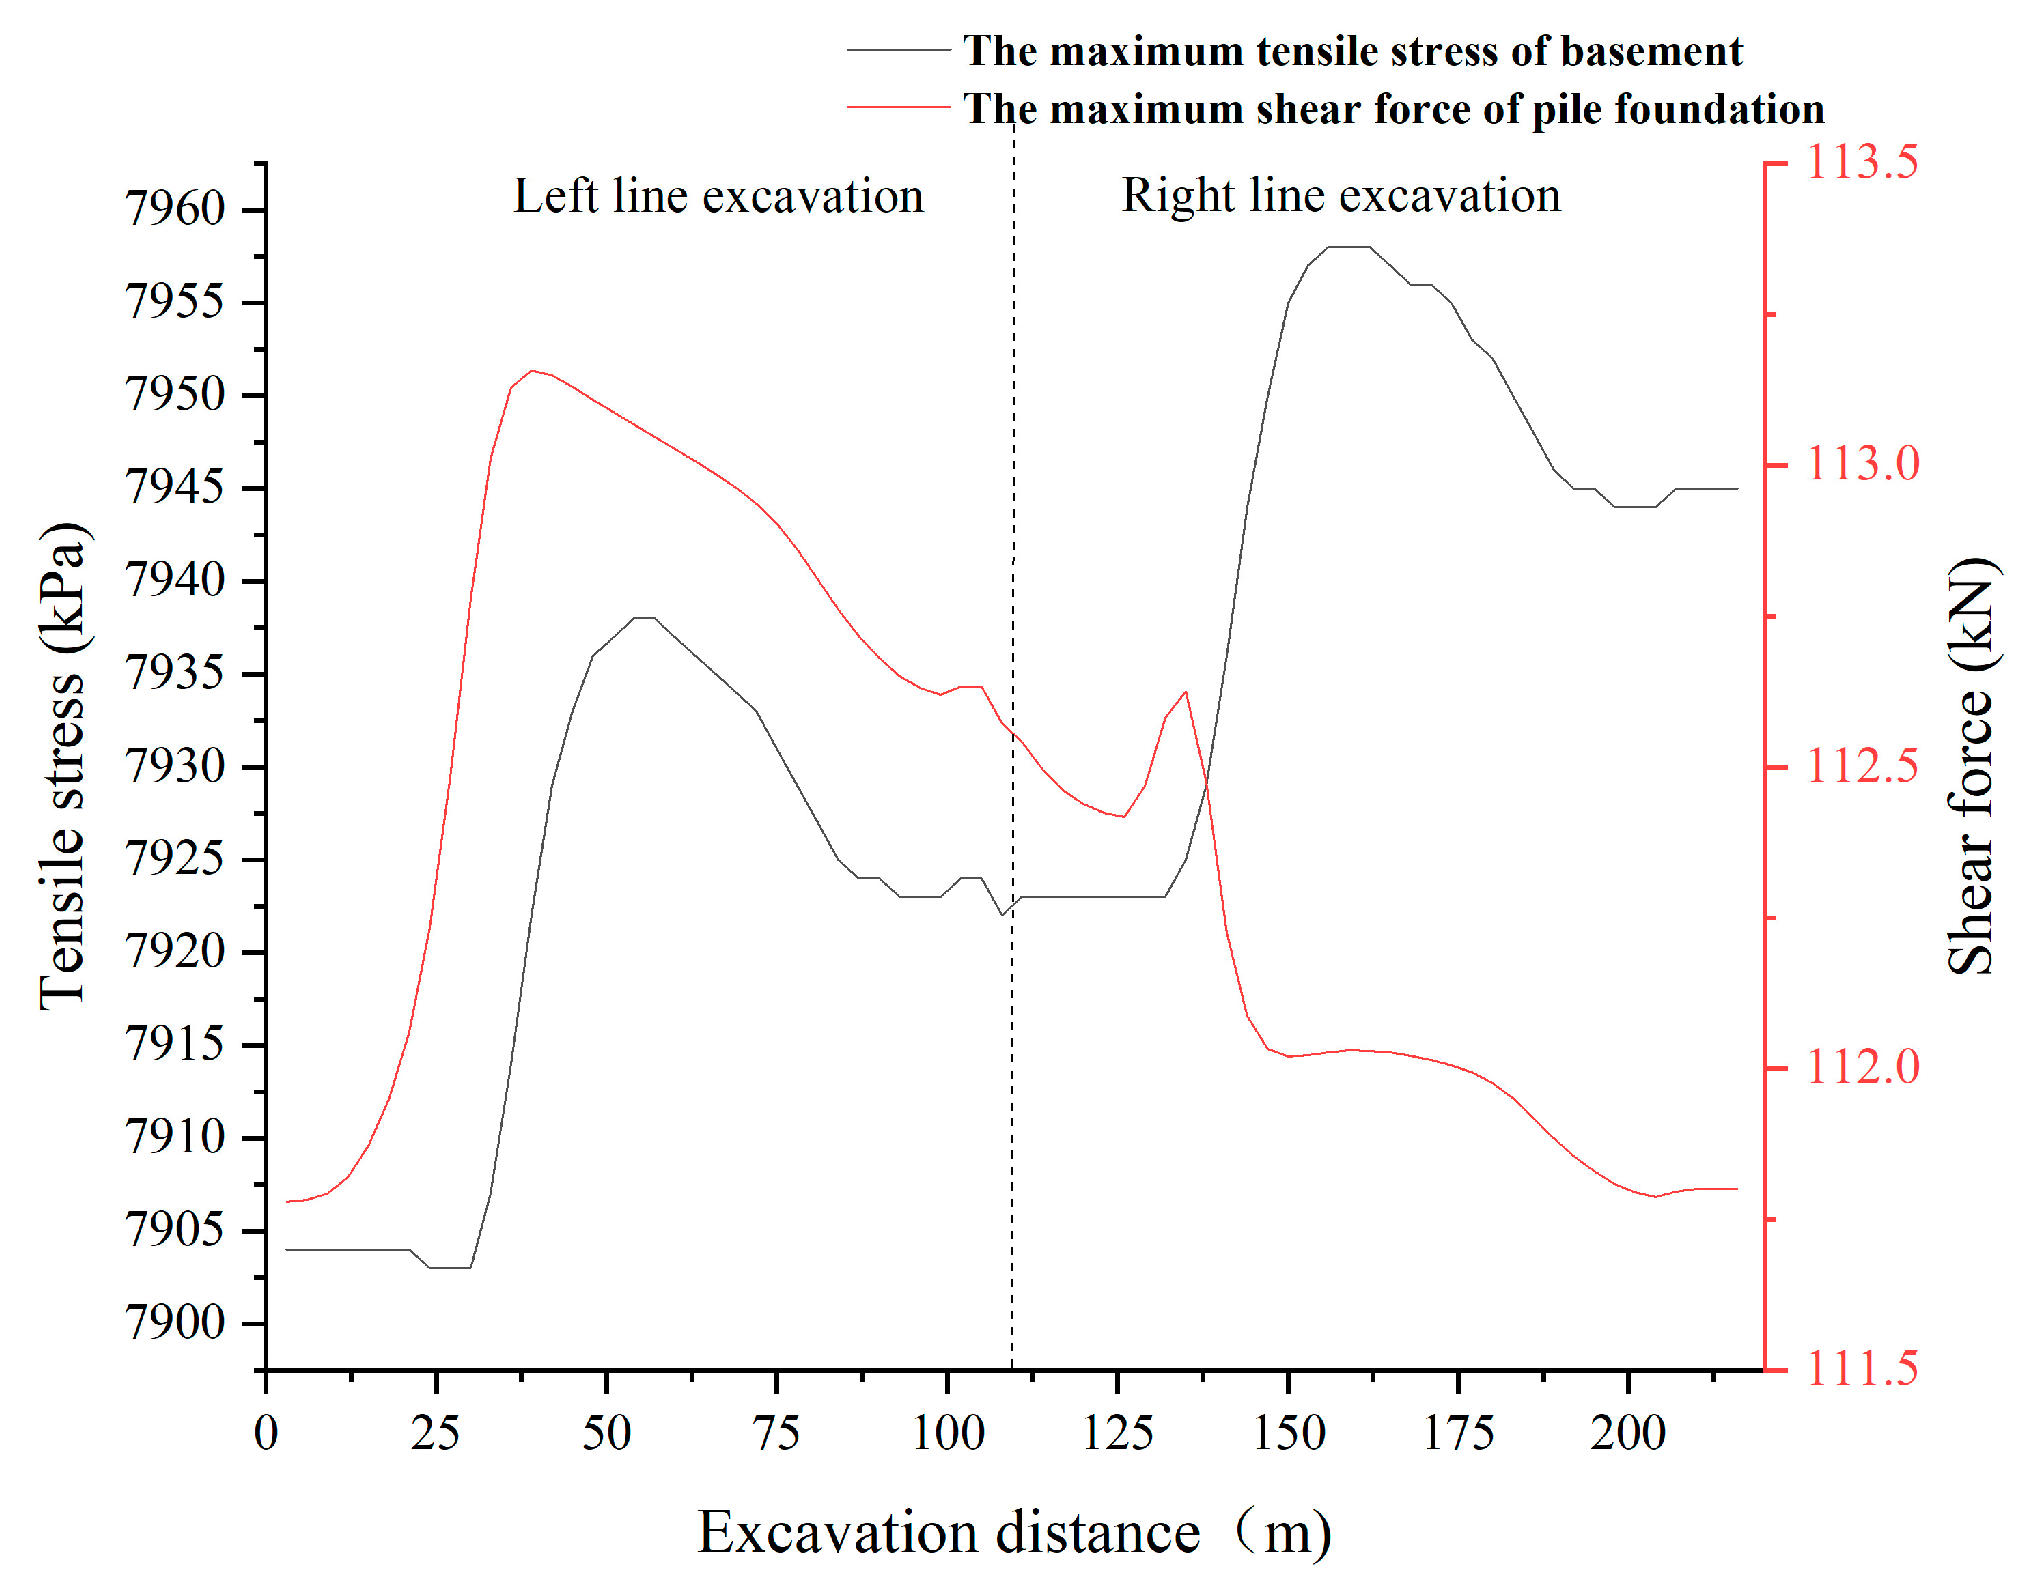
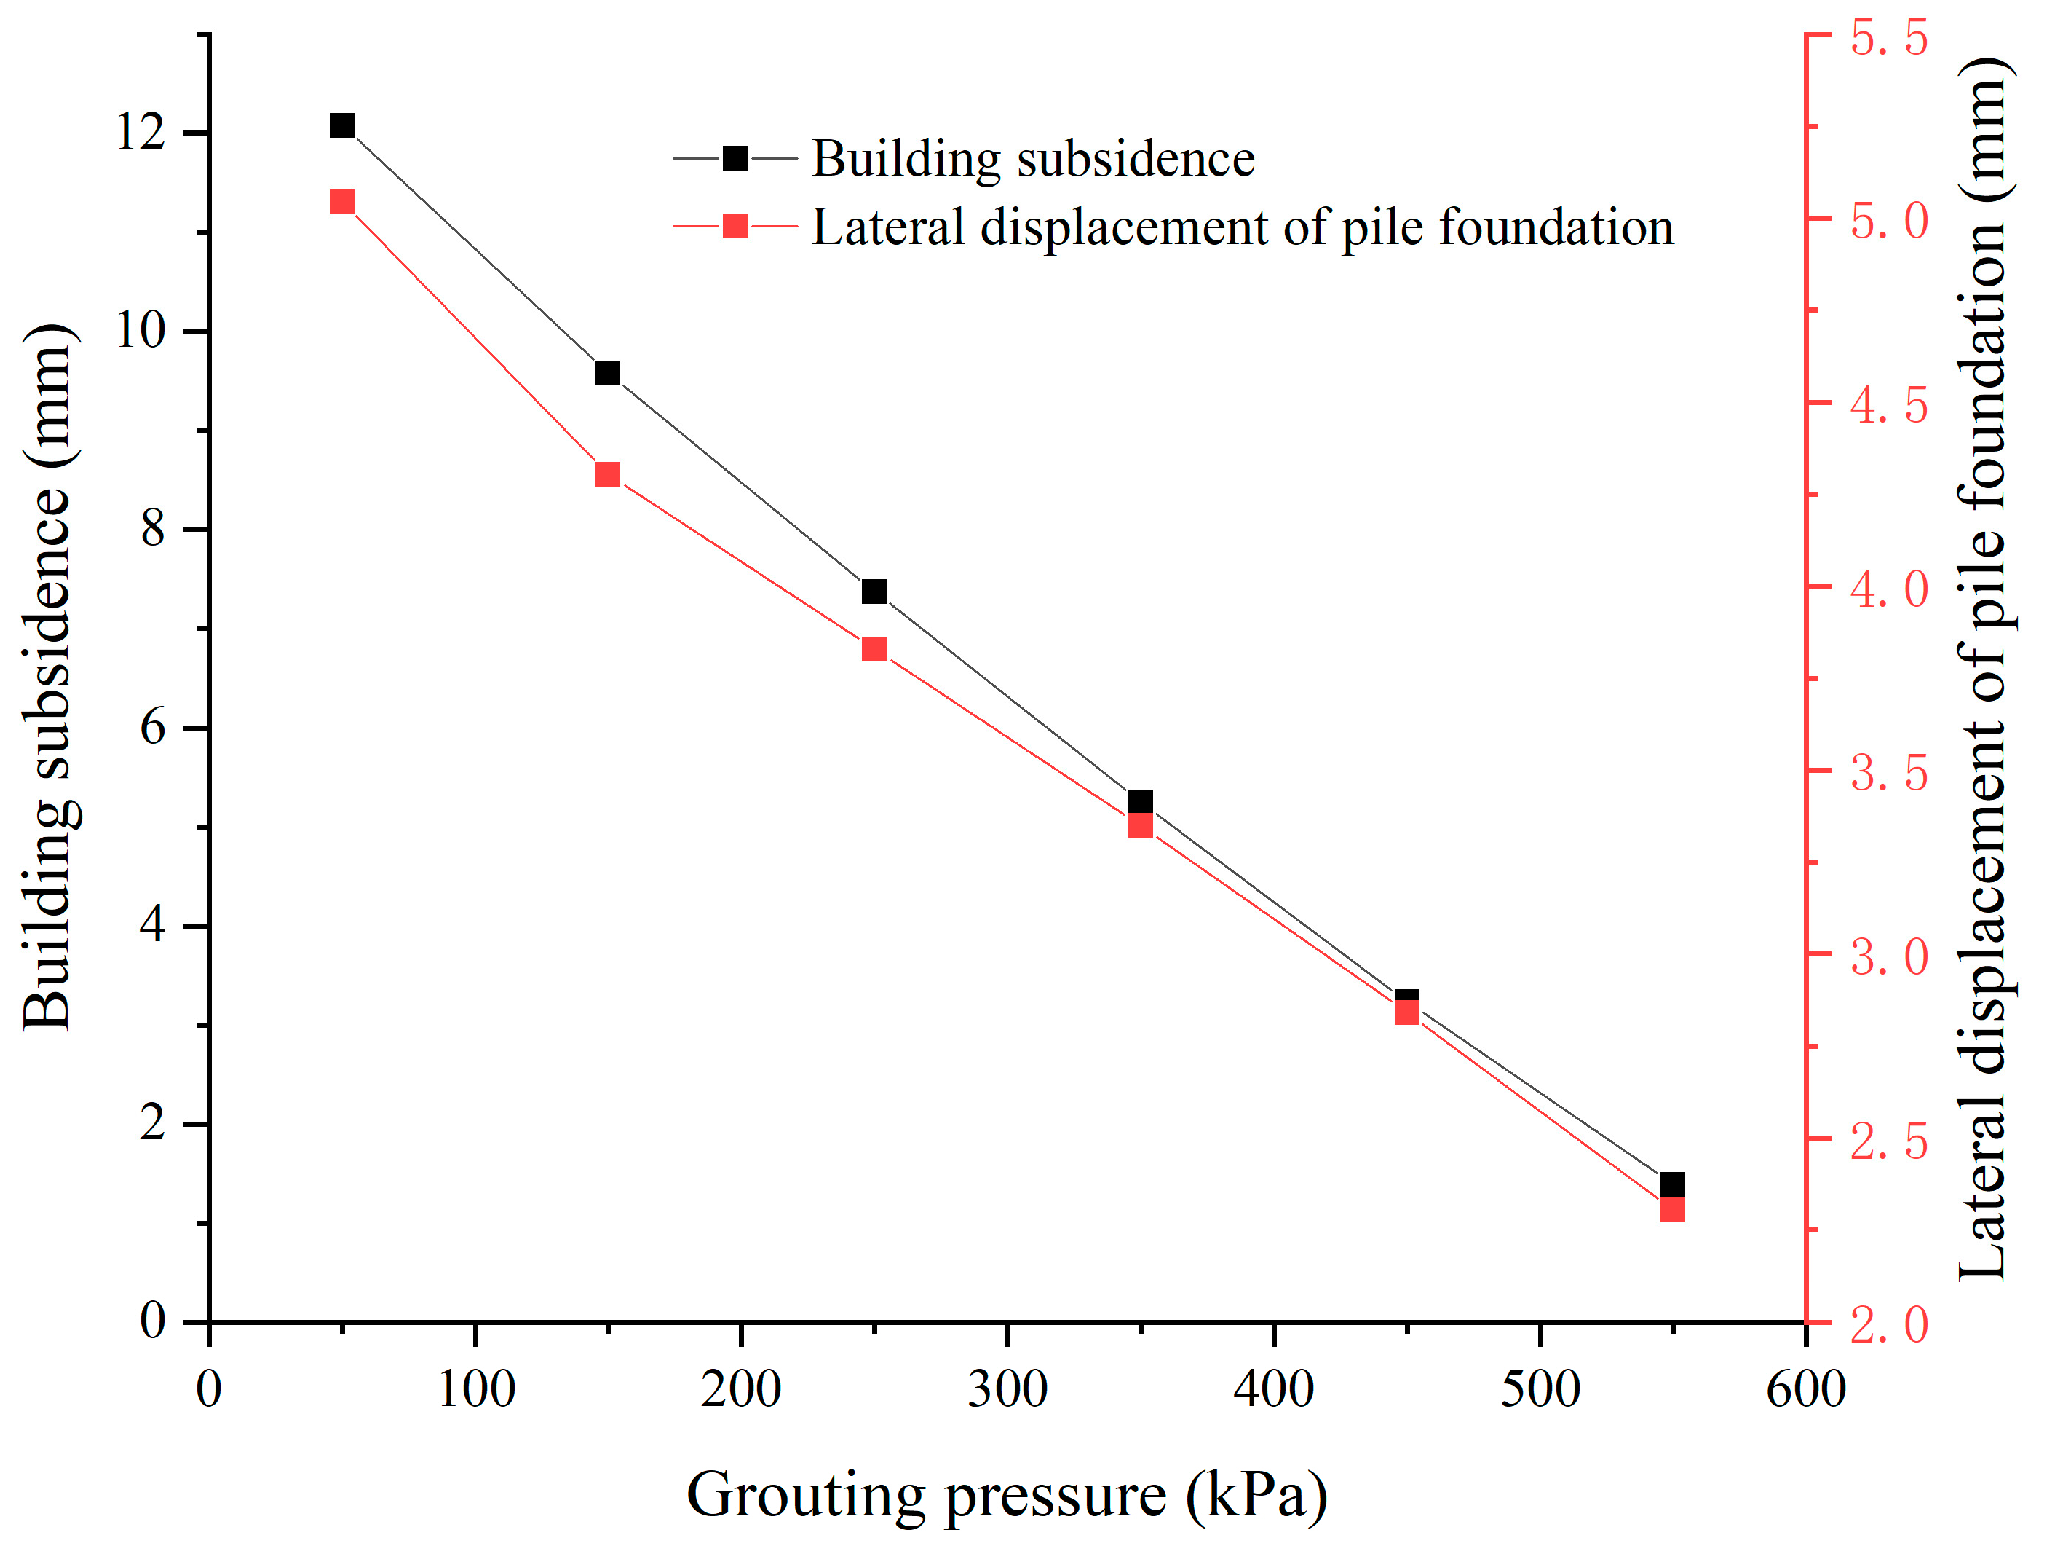
When the double shield tunnels passed through the building, tunnel excavation had a significant nonlinear impact on the lateral displacement of the pile along the excavation direction and the subsidence of the building but little impact on the tensile stress of the basement and the shear force of the pile. The increase of the grouting pressure can effectively reduce building subsidence and the lateral displacement of the pile. For every increase in grouting pressure of 100 kPa, the subsidence of the building decreased by approximately 2.138 mm, and the longitudinal displacement of the pile decreased by approximately 0.548 mm.
(5)
Increasing the radius of radial reinforcement within a certain range and adjusting the range of reinforcement before and after the building can effectively reduce the lateral displacement of the pile and the subsidence of the building. In this project, if the deep hole grouting reinforcement measures were taken to reduce the impact of shield tunnel construction and excavation on the building and piles, the radius of radial grouting reinforcement can be set as 2~3 m, and the reinforcement range before and after the buildings can be set as approximately two to six rings.
Nowadays, with the rapid development of subway transportation, more and more subway tunnels are penetrating existing buildings. According to the research in this article, shield tunnel excavation can have a significant impact on soil displacement, segment internal force and displacement, pile foundation displacement, and building subsidence. During shield tunnel excavation, reasonable grouting pressure should be selected, grouting reinforcement measures can be adopted if necessary, and optimal grouting reinforcement parameters can be set to better reduce pile foundation displacement and building subsidence. The research results of this paper can provide the theoretical basis for shield tunnel excavation in cities.
However, the research in this article also had certain limitations, such as the modeling of a building not being specific enough and using equivalent layers to simulate the grouting layer. In the future, we will continue to improve our research, conduct relevant experiments to ensure the accuracy of parameters, and use 3D solid elements to simulate the building so as to comprehensively study the impact of shield tunnel excavation on the superstructure.

Author Contributions

Conceptualization, methodology, supervision, review, and editing: P.L.; software, validation, and original draft preparation: W.H.; software and original draft preparation: X.H. All authors have read and agreed to the published version of the manuscript.

Funding

This work was supported by the Key Project of Science and Technology Plan in Yuhua District, Changsha City (YHKJ2019-ZG-O2).

Institutional Review Board Statement

Not applicable.

Informed Consent Statement

Not applicable.

Data Availability Statement

The data used to support this study are available from the corresponding author upon request.

Acknowledgments

Many thanks to Shide Lu, Hongbo Xiao, and Zhengang Zhang for the collection, analysis, and interpretation of data.

Conflicts of Interest

The authors declare no conflict of interest.

References

  1. Wang, X. Fault tree analysis of urban traffic congestion causes. J. Transp. Inf. Saf. 2012, 34, 139–145. [Google Scholar]
  2. Li, W.; Feng, W.; Yuan, H.Z. Multimode traffic travel behavior characteristics analysis and congestion governance research. J. Adv. Transp. 2020, 2020, 6678158. [Google Scholar] [CrossRef]
  3. Kim, H.C.; Shin, D.R. OSGi based subway management system. In Proceedings of the 2008 Fourth International Conference on Networked Computing and Advanced Information Management, Gyeongju, Republic of Korea, 2–4 September 2008; IEEE: Piscataway, NJ, USA, 2008; Volume 1, pp. 564–566. [Google Scholar]
  4. Guerola-Navarro, V.; Gil-Gomez, H.; Oltra-Badenes, R.; Soto-Acosta, P. Customer relationship management and its impact on entrepreneurial marketing: A literature review. Int. Entrep. Manag. J. 2022, 1–41. [Google Scholar] [CrossRef]
  5. Jin, H.; Yu, K.; Gong, Q.; Zhou, S. Load-carrying capability of shield tunnel damaged by shield shell squeezing action during construction. Thin-Walled Struct. 2018, 132, 69–78. [Google Scholar] [CrossRef]
  6. Zhang, J.; Ye, L.; Yan, C.; Yan, B.; Wei, P.; Feng, J. Study on construction Effect of shield tunnel of urban rail transit on large-section mining tunnel. Adv. Civ. Eng. 2020, 2020, 6836492. [Google Scholar]
  7. Dong, L.; Yang, Z.; Wang, Z.; Ding, Y.; Qi, W. Study on internal force of tunnel segment by considering the effect of joints. Adv. Mater. Sci. Eng. 2020, 2020, 1020732. [Google Scholar]
  8. Dai, X.; Guo, W.; Cheng, X. Field measurement and numerical analysis for evaluating longitudinal settlement induced by shield tunneling parallel to building. Rock Soil Mech. 2021, 42, 233–244. [Google Scholar]
  9. Katebi, H.; Rezaei, A.H.; HajialilueBonab, M.; Tarifard, A. Assessment the Effect of ground stratification, tunnel and surface buildings specifications on shield tunnel lining loads (by FEM). Tunn. Undergr. Space Technol. 2015, 49, 67–78. [Google Scholar] [CrossRef]
  10. Liu, C.; Cui, J.; Zhang, Z.; Liu, H.; Huang, X.; Zhang, C. The role of TBM asymmetric tail-grouting on surface settlement in coarse-grained soils of urban area: Field tests and FEA modelling. Tunn. Undergr. Space Technol. 2021, 111, 103857. [Google Scholar] [CrossRef]
  11. Liu, J.; Yang, Y.; Yang, C. Analysis and prediction of long-term settlement of metro shield tunnel in saturated sand. Geotech. Geol. Eng. 2021, 39, 5241–5252. [Google Scholar] [CrossRef]
  12. Lou, P.; Li, Y.; Lu, S.; Xiao, H.; Zhang, Z. Deformation and mechanical characteristics of existing foundation pit and tunnel itself caused by shield tunnel undercrossing. Symmetry 2022, 14, 263. [Google Scholar] [CrossRef]
  13. Lou, P.; Li, Y.; Tang, X.; Lu, S.; Xiao, H.; Zhang, Z. Influence of double-line large-slope shield tunneling on settlement of ground surface and mechanical properties of surrounding rock and segment. Alex. Eng. J. 2023, 63, 645–659. [Google Scholar] [CrossRef]
  14. Lou, P.; Li, Y.; Xiao, H.; Zhang, Z.; Lu, S. Influence of small radius curve shield tunneling on settlement of ground surface and mechanical properties of surrounding rock and segment. Appl. Sci. 2022, 12, 9119. [Google Scholar] [CrossRef]
  15. Zhang, D.M.; Ma, L.X.; Huang, H.W.; Zhang, J. Predicting leakage-induced settlement of shield tunnels in saturated clay. Comput. Model. Eng. Sci. (CMES) 2012, 89, 163–188. [Google Scholar]
  16. Hou, G.; Xu, Z.; Liu, X.; Jin, C. Improved particle swarm optimization for selection of shield tunneling parameter values. Comput. Model. Eng. Sci. 2019, 118, 317–337. [Google Scholar] [CrossRef]
  17. Islam, M.S.; Iskander, M. Twin tunnelling induced ground settlements: A review. Tunn. Undergr. Space Technol. 2021, 110, 103614. [Google Scholar] [CrossRef]
  18. Lv, J.; Li, X.; Li, Z.; Fu, H. Numerical simulations of construction of shield tunnel with small clearance to adjacent tunnel without and with isolation pile reinforcement. KSCE J. Civ. Eng. 2020, 24, 295–309. [Google Scholar] [CrossRef]
  19. Lin, T.; Gong, J. Research on tunnel ground settlement characteristics by shield method and pipe-jacking method based on numerical simulation. In IOP Conference Series: Earth and Environmental Science; IOP Publishing: Bristol, UK, 2020; Volume 531, p. 012040. [Google Scholar]
  20. Zhou, B.; Xie, X.Y.; Yang, Y.B.; Jiang, J.C. A novel vibration-based structure health monitoring approach for the shallow buried tunnel. Comput. Model. Eng. Sci. 2012, 86, 321. [Google Scholar]
  21. Do, N.A.; Dias, D.; Vu, T.T.; Dang, V.K. Impact of the shield machine’s performance parameters on the tunnel lining behaviour and settlements. Environ. Earth Sci. 2021, 80, 1–13. [Google Scholar] [CrossRef]
  22. Kang, C.; Mei, G.X.; Liang, R.Z.; Wu, W.B.; Fang, Y.X.; Ke, Z.B. Analysis of the longitudinal deformation of existing shield tunnel induced by temporary surface surcharge. Rock Soil Mech. 2018, 39, 4605–4616. [Google Scholar]
  23. Gan, X.; Yu, J.; Gong, X.; Liu, N.; Zheng, D. Behaviours of existing shield tunnels due to tunnelling underneath considering asymmetric ground settlements. Undergr. Space 2022, 7, 882–897. [Google Scholar] [CrossRef]
  24. Liu, B.; Yu, Z.; Zhang, R.; Han, Y.; Wang, Z.; Wang, S. Effects of undercrossing tunneling on existing shield tunnels. Int. J. Geomech. 2021, 21, 04021131. [Google Scholar] [CrossRef]
  25. Lu, Y.; Leong, E.C.; Zeng, L.; Xu, C.; Li, B. Suitability charts to select stabilizer for excavated soils and rocks (ESR). Int. J. Geotech. Eng. 2023, 1–16. [Google Scholar] [CrossRef]
  26. Xie, S.; Lin, H.; Chen, Y.; Wang, Y.X. A new nonlinear empirical strength criterion for rocks under conventional triaxial compression. J. Cent. South Univ. 2021, 28, 1448–1458. [Google Scholar] [CrossRef]
  27. Liu, B.; Lin, H.; Chen, Y.; Liu, J.; Guo, C. Deformation stability response of adjacent subway tunnels considering excavation and support of foundation pit. Lithosphere 2022, 2022, 7227330. [Google Scholar] [CrossRef]
  28. Zhong, Z.; Li, C.; Liu, X.; Fan, Y.; Liang, N. Analysis of ground surface settlement induced by the construction of mechanized twin tunnels in soil-rock mass mixed ground. Tunn. Undergr. Space Technol. 2021, 110, 103746. [Google Scholar] [CrossRef]
  29. Tan, Z.; Li, Z.; Tang, W.; Chen, X.; Duan, J. Research on stress characteristics of segment structure during the construction of the large-diameter shield tunnel and cross-passage. Symmetry 2020, 12, 1246. [Google Scholar] [CrossRef]
  30. Xu, M.L.; Zhao, D.S. Analysis of Soil Disturbance by Shield Tunneling. In Advanced Materials Research; Trans Tech Publications Ltd.: Zurich, Switzerland, 2013; Volume 734, pp. 502–506. [Google Scholar]
  31. Wei, G.; Chen, D.; Hong, J. Effect analysis of double-O-tube shield Tunnel crossing frame structure building with 30 degrees. Disaster Adv. 2012, 5, 447–451. [Google Scholar]
  32. Liu, J.; Song, J.; Zhang, Z.; Hu, N. Effect of the ground displacement and deformation of soil around a tunnel caused by shield backfilled grouting during construction. J. Perform. Constr. Facil. 2017, 31, 04016117. [Google Scholar] [CrossRef]
  33. Liang, Y.; Chen, X.; Yang, J.; Zhang, J.; Huang, L. Analysis of ground collapse caused by shield tunnelling and the evaluation of the reinforcement effect on a sand stratum. Eng. Fail. Anal. 2020, 115, 104616. [Google Scholar] [CrossRef]
  34. Cao, R.; Peng, L.; Zhao, Y. Control of strata deformation in subway interval tunnels crossing a high-speed rail shield tunnel at a Short Distance. Arab. J. Sci. Eng. 2021, 46, 5013–5022. [Google Scholar] [CrossRef]
  35. Shuai-shuai, W.; Bo, G.; Kai-Xiang, F. Damping mechanism of shallow cylindrical parallel tunnel with grouting reinforcement zone. Rock Soil Mech. 2018, 39, 683–690. [Google Scholar]
Figure 1. Reality view of double shield tunnels undercrossing an existing building.
Applsci 13 05729 g001
Figure 2. The cross-section of bearing and retaining piles, double tunnels, and stratum.
Applsci 13 05729 g002
Figure 3. Flow chart of modeling steps of the model.
Applsci 13 05729 g003
Figure 4. The application method of excavation pressure.
Applsci 13 05729 g004
Figure 5. The application method of jacking force.
Applsci 13 05729 g005
Figure 6. The application method of grouting pressure.
Applsci 13 05729 g006
Figure 7. Mathematical model.
Applsci 13 05729 g007
Figure 8. Location relationship of basement, pile, and tunnel.
Applsci 13 05729 g008
Figure 9. Layout plan of monitoring points.
Applsci 13 05729 g009
Figure 10. Comparison of mathematical simulation and measured values of ground subsidence.
Applsci 13 05729 g010
Figure 11. Nephogram of soil displacements after the completion of double shield tunnel excavation: (a) vertical displacement of soil during excavation of double shield tunnels; (b) lateral displacement of soil during excavation of double shield tunnels.
Applsci 13 05729 g011
Figure 12. Curve of the subsidence of soil layer directly above double shield tunnels for successive excavation.
Applsci 13 05729 g012
Figure 13. The vertical and lateral displacements of the segment after the completion of the excavation of double shield tunnels: (a) vertical displacement of segment; (b) lateral displacement of segment.
Applsci 13 05729 g013aApplsci 13 05729 g013b
Figure 14. Elliptical shape of segment after completion of the excavation of double shield tunnels.
Applsci 13 05729 g014
Figure 15. Bending moment nephogram of segment.
Applsci 13 05729 g015
Figure 16. Axial force nephogram of segment.
Applsci 13 05729 g016
Figure 17. The numbers at different circumferential positions of segment.
Applsci 13 05729 g017
Figure 18. Bending moments at different circumferential positions of segments of left and right tunnels.
Applsci 13 05729 g018
Figure 19. Axial forces at different circumferential positions of segments of left and right tunnels.
Applsci 13 05729 g019
Figure 20. Variations of building subsidence and lateral displacement of pile with excavation distance.
Applsci 13 05729 g020
Figure 21. Variations of tensile stress of basement and shear force of pile with excavation distance.
Applsci 13 05729 g021
Figure 22. Nephogram of uneven subsidence of building.
Applsci 13 05729 g022
Figure 23. Subsidence of soil at cross-section in the middle of the model with different grouting pressures.
Applsci 13 05729 g023
Figure 24. Variation of the maximum subsidence of soil with grouting pressure.
Applsci 13 05729 g024
Figure 25. Relationship between bending moment of segments and grouting pressure: (a) segment of left tunnel (first tunnel); (b) segment of right tunnel (second tunnel).
Applsci 13 05729 g025
Figure 26. Relationship between axial force of segments and grouting pressure: (a) segment of left tunnel (first tunnel); (b) segment of right tunnel (second tunnel).
Applsci 13 05729 g026
Figure 27. Relationship between the maximum longitudinal and transverse stresses of segment and grouting pressure.
Applsci 13 05729 g027
Figure 28. Relation between the subsidence of building and grouting pressures.
Applsci 13 05729 g028
Figure 29. Relation between the lateral displacement of pile and grouting pressures.
Applsci 13 05729 g029
Figure 30. Relation between the subsidence of building and the radius of grouting reinforcement.
Applsci 13 05729 g030
Figure 31. Relation between the lateral displacement of pile and the radius of grouting reinforcement.
Applsci 13 05729 g031
Figure 32. Maximum subsidence of building and maximum lateral displacement of pile under different reinforcement radii.
Applsci 13 05729 g032
Figure 33. Relation between the subsidence of building and reinforcement range before and after the building.
Applsci 13 05729 g033
Figure 34. Relation between the lateral displacement of pile and reinforcement range before and after building.
Applsci 13 05729 g034
Figure 35. Maximum subsidence of building and lateral displacement of pile under different reinforcement ranges.
Applsci 13 05729 g035
Figure 36. Tunnel under compression and tension: (a) Tunnel contraction along the longitudinal direction; (b) Tunnel expansion along the lateral direction.
Applsci 13 05729 g036
Figure 37. Variation of maximum subsidence of building and maximum lateral displacement of piles with grouting pressure.
Applsci 13 05729 g037
Table 1. Calculation parameters of soil (rock) layer and material.
Soil (Rock) Layers and MaterialsSevere/
(kN·m−3)
Cohesive Force/
(kN·m−2)
Friction Angle/
(°)
Modulus of Elasticity/
(kN·m−2)
Poisson’s Ratio
Plain filled soil19161140000.28
Silty clay1915860000.31
Fully weathered slate20153585000.23
Strongly weathered slate23.35029120,0000.2
segment253.45 × 1070.2
Grouting layer211000 (soft)0.2
10,000 (hard)
Pile25 2 × 1060.3
Shield shell78.5 2.1 × 10100.2
Table 2. Comparison of simulation and measured results.
Monitoring PointsMeasured Results (mm)Simulation Results (mm)Deviation (mm)Deviation Percentage
1−1.892.060.178.99%
2−6.28−6.590.314.94%
3−6.71−6.970.263.87%
4−6.75−6.880.131.93%
5−7.05−6.930.121.70%
6−6.87−7.110.243.49%
7−6.51−6.220.294.45%
8−2.27−2.080.198.37%
Table 3. Comparison of parameters of reinforced soil and undisturbed soil.
Soil Elastic Modulus/MPaPoisson’s RatioSevere/(kN·m−3)Cohesion/kPaInternal Friction Angle/(°)
Strongly weathered slate1200.223.35029
Reinforce soil 5000.2213043
Disclaimer/Publisher’s Note: The statements, opinions and data contained in all publications are solely those of the individual author(s) and contributor(s) and not of MDPI and/or the editor(s). MDPI and/or the editor(s) disclaim responsibility for any injury to people or property resulting from any ideas, methods, instructions or products referred to in the content.

