Article

Wave-Shaped Microstructure Cancer Detection Sensor in Terahertz Band: Design and Analysis

by
Md Rezaul Hoque Khan
1,*,†,
Atiqul Alam Chowdhury
1,†,
Mohammad Rakibul Islam
1,†,
Md Sanowar Hosen
1,2,†,
Mhamud Hasan Mim
1,† and
Mirza Muntasir Nishat
1,†
1
Department of Electrical and Electronic Engineering, Islamic University of Technology, Gazipur 1704, Dhaka, Bangladesh
2
Faculty of Engineering, Daffodil International University, Daffodil Smart City (DSC), Birulia, Savar 1216, Dhaka, Bangladesh
*
Author to whom correspondence should be addressed.
These authors contributed equally to this work.
Appl. Sci. 2023, 13(9), 5784; https://doi.org/10.3390/app13095784
Submission received: 25 March 2023 / Revised: 30 April 2023 / Accepted: 6 May 2023 / Published: 8 May 2023
(This article belongs to the Special Issue New Insight in Biomedicine: Optics, Ultrasound and Imaging)

Abstract

:
For the quick identification of diverse types of cancer/malignant cells in the human body, a new hollow-core optical waveguide based on Photonic Crystal Fiber (PCF) is proposed and numerically studied. The refractive index (RI) differs between normal and cancerous cells, and it is through this distinction that the other crucial optical parameters are assessed. The proposed cancer cell biosensor’s guiding characteristics are examined in the COMSOL Multiphysics v5.5 environment. The Finite Element Method (FEM) framework is used to quantify the display of the suggested fiber biosensor. Extremely fine mesh elements are additionally added to guarantee the highest simulation accuracy. The simulation results on the suggested sensor model achieve a very high relative sensitivity of 99.9277%, 99.9243%, 99.9302%, 99.9314%, 99.9257% and 99.9169%, a low effective material loss of 8.55 × 10 5 cm 1 , 8.96 × 10 5 cm 1 , 8.24 × 10 5 cm 1 , 8.09 × 10 5 cm 1 , 8.79 × 10 5 cm 1 , and 9.88 × 10 5 cm 1 for adrenal gland cancer, blood cancer, breast cancer type-1, breast cancer type-2, cervical cancer, and skin cancer, respectively, at a 3.0 THz frequency regime. A very low confinement loss of 6.1 × 10 10 dB/cm is also indicated by the simulation findings for all of the cancer cases that were mentioned. The straightforward PCF structure of the proposed biosensor offers a high likelihood of implementation when used in conjunction with these conventional performance indexes. So, it appears that this biosensor will create new opportunities for the identification and diagnosis of various cancer cells.

1. Introduction

Photonic Crystal Fiber (PCF) has emerged as the most sought-after technology for improving performance and lowering the cost of producing optical fibers because of its huge promise in sensing applications. PCF is incredibly flexible in its design. The core and cladding of this low-loss microstructure fiber are made of a photonic crystal material. It is possible to improve the optical and guiding qualities by changing the size, shape, and placement of air holes. Academics have recently paid a lot of attention to PCF’s ability to detect chemical and biological components due to its exceptional features, such as light transmission with low dispersion preservation [1] and confinement loss (CL) with high nonlinearity preservation [2]. The effective area, relative sensitivity, and CL are important guiding characteristics in detection. A lower effective area value provides a larger numerical aperture. PCFs with higher sensitivity and numerical aperture are highly desirable for sensing applications [3,4]. In Solid Core PCF (SC-PCF), the core is made of robust silicon, while the cladding section is made up of various air rings. The hollow core PCF is arguably the most intriguing type due to its distinct light guide characteristics. The PCF is known as a Hollow-Core PCF if it has a number of small-scaled silicate tubes running along its longitude that is optically guided by the hollow core in its center (HC-PCF) [5]. As a hollow-core PCF structure was taken into consideration for our design, the HC-PCF contains more analytical volumes than the porous core inside the core region, which improves the contact between light and the materials. A polarization mechanism is also used by the HC-PCF. Both adding stress to the core [6,7] and producing birefringence due to a strong anisotropy in the hole’s structure [8] have been used to demonstrate this. Furthermore, the photonic fiber’s background materials (PCF) Topas, Teflon, and Zeonex are used successfully [9,10,11,12].
Cancer is an uncontrolled cell proliferation (often created from one defective cell) [13]. The cancer cells may infect nearby tissues, spread across the body, enter remote areas of the body, and promote the growth of new blood vessels that will feed them. This is due to the loss of the cancer cells’ usual growth and spread-controlling systems. Any tissue in the body can give rise to cancerous (malignant) cells. The second leading cause of death today is cancer. The World Health Organization estimates that cancer will be responsible for roughly 10 million deaths in 2020 [14]. Blood cancer, skin cancer, cervical cancer, breast cancer, and adrenal gland cancer are the five basic forms of cancer that typically affect humans. Stages I, II, and III are used to classify malignant cells. In stage I, patients may be cured. Stage II patients may also get treatment; however, stage III patients are always incurable [15]. So, early cancer cell detection is essential for more effective treatment. For the most part, multiple blood tests such as complete blood counts, blood protein analyses, tumor marker analyses, and urine examinations are carried out to detect cancer, but the results are often unable to pinpoint the organ that has been impacted [16]. Taking samples of suspect cells for examination during a biopsy is the only reliable method for determining which cells are malignant [17]. Additional popular diagnostic techniques for finding tumors include positron emission tomography (PET), ultrasound tests, magnetic resonance imaging (MRI), and computed tomography (CT) scans [18,19,20]. The lengthy nature of these procedures, which can take anything from two minutes to two or three days, may have negative impacts on cancer patients, for whom a prompt diagnosis is essential. Researchers in opto-electronics are working to create quick cancer cell detectors as a result. RI vary between normal and malignant cells, and as a result, when exposed to the same light source, they will propagate light differently. So, by examining the signal that was received, cell characteristics can be determined. There have been many PCF-based chemical and biological sensors developed thus far. As far as we know, Clark et al. are the ones who first developed a biosensor that can identify glucose in blood [21]. Numerous techniques for biosensor applications improved as a result of this study. Researchers are now using photonics for cancer detection thanks to recent technological advances in the field. A unique spectroscopic optical sensor for cancer cell identification in diverse human body sections was proposed by Parvin Textit et al. in 2021 (i.e., adrenal gland, blood, breast, cervical, and skin) [22]. It had the highest relative sensitivity of 95.51% for breast cancer at X-polarization. Habib et al. (2021) proposed a new hollow core PCF to quickly identify various types of cancerous cells in the human body [23]. According to the simulation experiments, the recommended sensor operating at 2.5 THz has an astonishingly high relative sensitivity of over 98 percent with little loss (0.025 dB/cm). Eid et al. presented a Mono Rectangular Core Photonic Crystal Fiber (MRC-PCF) for the efficient detection of skin and blood cancer, which had the highest sensitivity of 96.74% for blood cancer at 2 THz [24]. Another Hollow core PCF was designed by Bulbul et al. (2022) to detect four types of cancer cells, namely, Jurkat (blood), HeLa (cervical), MCF-7 (breast cancer type-2), and Basal (skin) [25]. The relative sensitivity varied from 88.12% to 89.65% for the four cancer cells in this designed hollow-core PCF (HC-PCF). In 2022, a study by Yadav et al. [26] introduced a THz sensor utilizing HC-PCF to detect breast cancer cells. The sensor exhibited a relative sensitivity of 65.53% along the x-axis and 53.63% along the y-axis, while also possessing a high birefringence (0.0020), lower CL ( 17.33 × 10 9 cm 1 ), and effective area ( 3.04 × 10 20 m 2 ).
In order to further improve the sensitivity and other performances, we propose in this article a straightforward, highly sensitive HC-PCF for cancer cell detection. The central air hole of the HC-PCF is penetrated by a variety of cancer cells, including those from the adrenal gland, blood, breast cancer types 1 and 2, the cervical cavity, and the skin, and a numerical investigation of the comprehensive sensitivity is carried out with the aid of the FEM. These cancer cell samples have been monitored using the developed PCF geometry, which has a sensitivity of over 99.9% at 3 THz. The comparison of the different fundamental features also reveals extraordinarily high sensing capabilities, low CL, flattening dispersion, and low birefringence, which are superior to earlier prototypes [22,23,24,25].

2. Numerical Analysis

The proposed biosensor has been designed and analyzed using the FEM, which is the primary approach employed in this study. The steps involved in biosensor design and performance evaluation are illustrated in Figure 1. Initially, the Global Variables (GVs) and Structure Variables (SVs) were declared in COMSOL Multiphysics 5.5 software, followed by the design of the probable PCF sensor structure. Materials were then assigned to different parts of the sensor, including Zeonex to PML and Strut of the fiber sensor, air holes in the cladding, and six cell type analytes (in both normal and cancerous forms) in the core for analysis purposes. Boundary and initial conditions were applied, and the designed fiber was meshed and solved using partial differential equations. The optical parameter data were then collected and transferred to MATLAB for further analysis. Different results were analyzed, and the relationship between the operating frequency and various optical parameters was observed. If the results were not satisfactory, the GVs and SVs were adjusted, and the entire process was repeated until the desired results were achieved.
A list of different optical properties, such as relative sensitivity, effective area, numerical aperture, CL, effective material loss (EML), etc., seems necessary to check the biosensor’s functionality. These parameters, i.e., performance indices, will be investigated through simulation using the software while injecting an analyte into the core of the proposed sensor using a capillary injection strategy. In actuality, though, this function will be fulfilled by an optical spectrum analyzer. For each analyte, the full procedure will be repeated.
The FEM with a Perfectly Matched Layer (PML) boundary condition is a commonly used framework for solving problems numerically. For investigating optical properties and removing leaks, a PML is utilized. A meshing technique is used to partition the proposed PCF into homogeneous triangular sub-spaces. Modal analysis and frequency transmission through the Z-direction of fiber can be used to determine the performance of waveforms spanning 1.5–3 THz in an x-y cross-section. The following equation can be obtained using the Maxwell equations [27]:
Δ × s 1 × E k 0 2 n 2 s E = 0
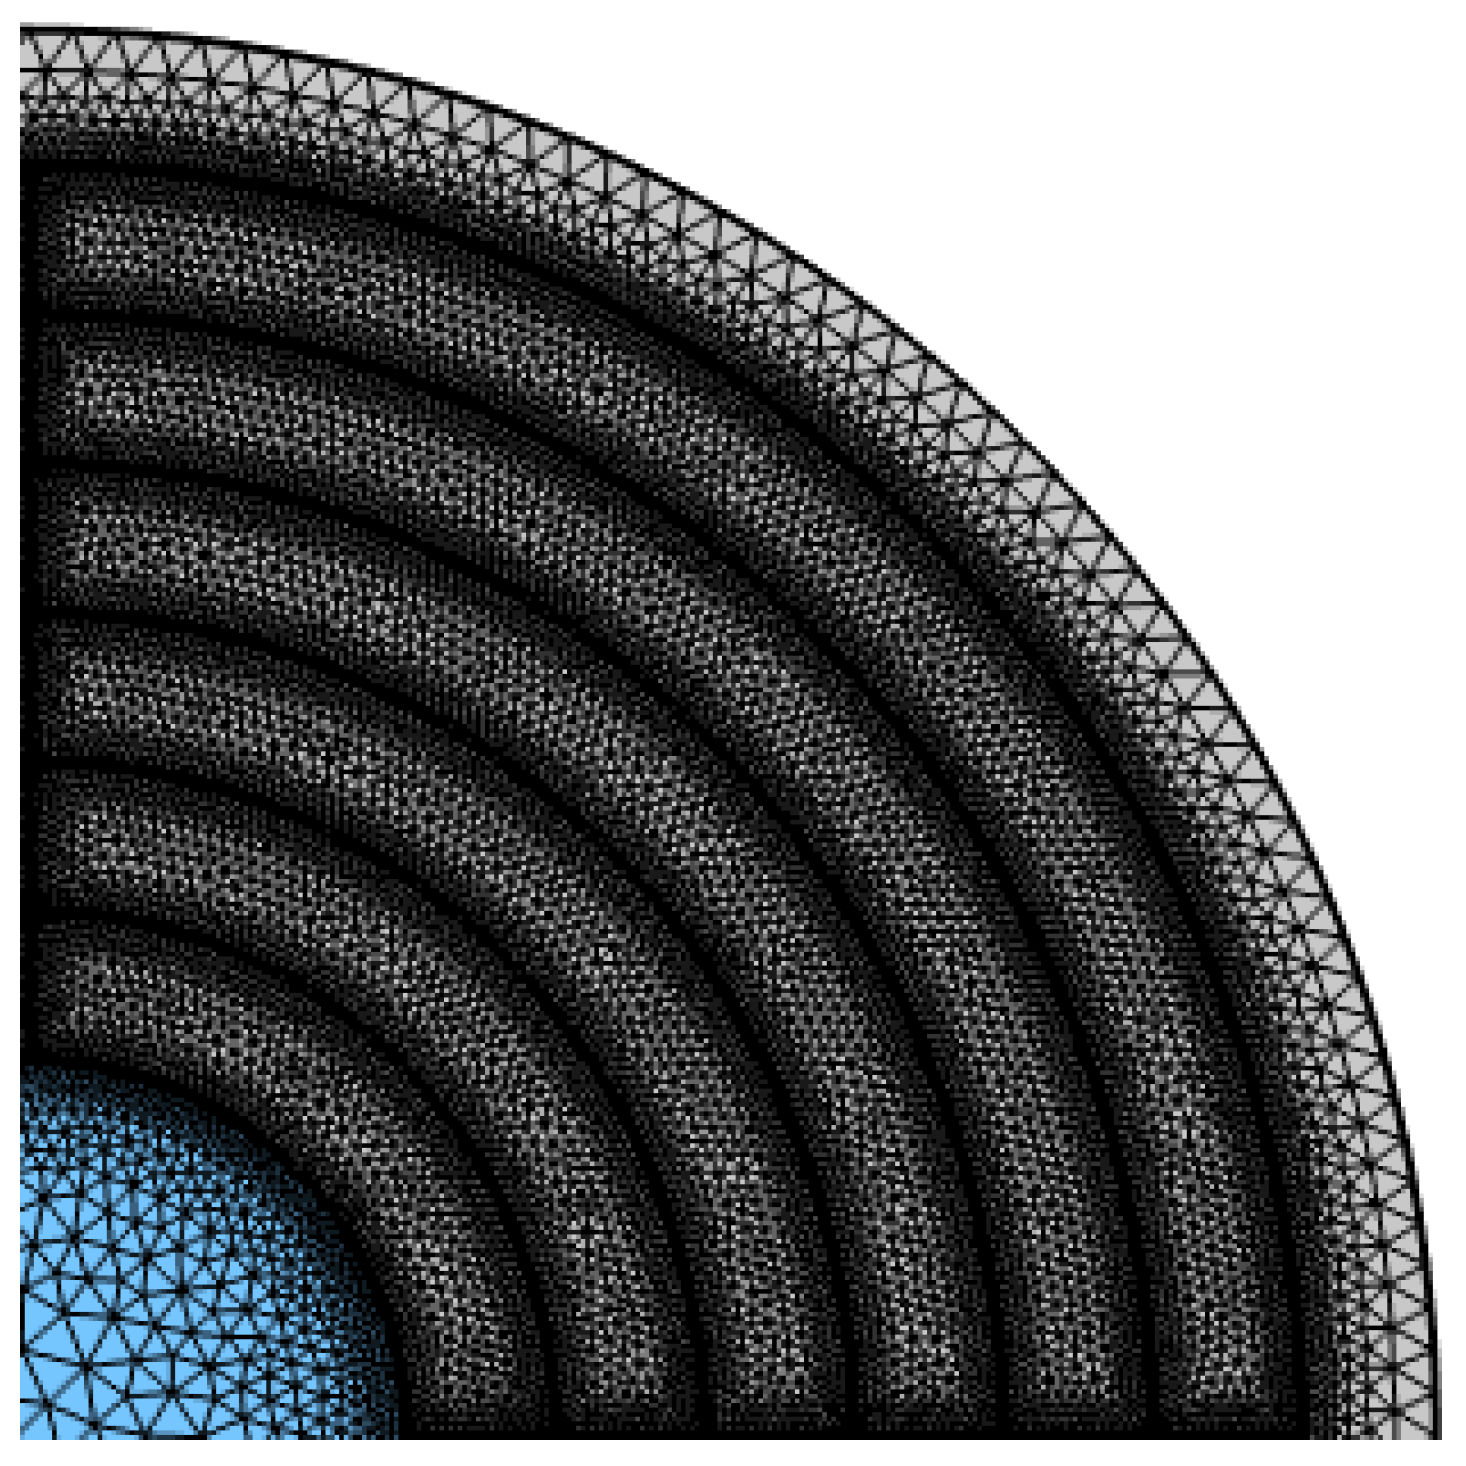
In this context, s represents the PML matrix of 3 × 3 and s 1 is the inverse of s. Electric field vector E, domain refractive index n, free-space wave number K 0 , and operational wavelength λ are all represented by the symbol. In this simulation, the fiber is split into 2,920,397 triangular segments. One-fourth of the PML layer computation window is used to display Figure 2 for the recommended PCF structure.
How sensitive a terahertz PCF is to an analyte depends on how much light interacts with matter. This is dependent on a particular coefficient of frequency absorption. The Beer–Lambert law can be used to explain it [8],
I ( f ) = I 0 ( f ) e [ r α m l c ]
where the symbols for the optical intensity in the presence and absence of the desired material are I ( f ) and I 0 ( f ) , respectively. In this case, the channel range is l c , the relative sensitivity is r, the optical frequency is f, and the absorption factor is α m . The formula for the absorbance (A) is
A = log I I 0 = r α m l c
Now, relative sensitivity depicts the amount of light that interacts with the analyte. The sensitivity of the PCF must be measured in order to examine its sensing efficiency, which can be achieved using [8],
r = n r n eff × Y
where the RI (real) of the analyte to be detected is n r , and the RI (effective) of the guided mode is n eff (ERI). Additionally, Y represents the light interaction with the material and is computed using [8],
Y = analyte sample R e ( E x H y E y H x ) d x d y total R e ( E x H y E y H x ) d x d y
Here, the electric components of x and y are E x and E y , respectively, and the magnetic components of x and y are H x and H y . By performing integration in the numerators and denominators of the aforementioned equation, one can determine the percentage of light in the fiber’s middle, i.e., in the injected analyte, and the total amount of light present throughout the fiber cross-section. Only the PCF should receive light in the core region. Any optical power that crosses to the cladding air slot as a result of optical power escaping is treated as a light power loss and is expressed as follows:
α dB / cm = 8.686 × k o Im [ n eff ] × 10 4
where, Im [ n eff ] is the imaginary segment of the effective mode index.
When light pulses propagate through the Utilizing EML, α eff , these PCF characteristics are studied and can be expressed as
α eff = 1 2 ε 0 μ 0 E 2 α mat η d A 2 All S z d A
where a mat is the absorption loss of fiber material and n m is the RI for background material Zeonex. S z stands for the z-component of the Poynting vector, where ε 0 is the permittivity of free space and μ 0 is the permeability into free space.
The physical phenomenon known as birefringence occurs when a substance’s RI is determined by the direction or polarization of the distribution of light. The material’s apparent birefringence will be broken by the fiber’s cylindrical symmetry, and it may also acquire birefringence, resulting in regular power exchanges between the two components. Here is how birefringence is expressed mathematically:
B = n x n y
where n x stands for the effective RI of the basic constituents, and n y is frequently expressed as the largest possible difference in RI.
The term “Effective Area” refers to the region of the core where light and matter interact [28]. This area is important in both numerical aperture and bending loss but also plays a key role in the calculation of THz PCF properties. These characteristics also serve as a representation of the light beams’ efficiency. The effective area’s mathematical expression, A eff , is written as:
A eff = S E 2 d x d y 2 S E 4 d x d y
where S refers to the entire cross-segment of the fiber and E refers to the field vector.
Minimizing dispersion is a crucial component of applications for multi-channel connection. Please take note that over the entire range of 1.5–3.0 THz, Zeonex’s material dispersion for the PCF was found to be negligible. Thus, only the waveguide dispersion is taken into account. The waveguide’s ERI variance is the only factor that affects the waveguide’s dispersion. The following equation can be used to measure it [8]:
β 2 = 2 c d n eff d w + w c d 2 n eff d w 2
where, respectively, w stands for the angular frequency and c for the free-space propagation speed.
The capacity of a PCF core to aggregate light is calculated by the numerical aperture (NA). As a result, the index of refraction’s variation can be calculated as follows [8]:
N A = 1 ( 1 + π f 2 A eff c 2 )
where the effective area of the guided mode is indicated by A eff .
The effective area of the fiber is closely related to nonlinearity γ , also known as the nonlinear coefficient. It is a metric that indicates how well a fiber can contain intense light and is defined as
γ = 2 π f c n 2 A eff
where, f is the operating frequency and n 2 is the nonlinear RI.
To modify the fiber modes, the uniform frequency parameter is referred to as a V-parameter. There are two regions to the guide mode. One is a single mode, and the other has several modes. Use the following expression to find the V parameter [27]
V eff = 2 π r f c n core 2 n cladding 2 2.405
where, the core and cladding regions’ respective effective RIs are n core and n cladding . The physical constants r, f, and c, respectively, stand in for the core radius, frequency, and light speed. We are aware that the fiber will operate as a single-mode fiber if the V parameter is less than or equal to 2.405 ( V 2.405 ) . However, when the V parameter is higher than 2.405, the fiber still supports multiple modes and remains a multimode.
The spot size of an optical fiber plays a significant role in determining the performance of optical communication systems. It affects bending loss, nonlinearity, and beam divergence. The amount of light entering the cladding is low, while the amount of light in the core area is confined, as can be seen when considering optimal design characteristics. Now, we use a Marcuse formula to determine the spot size, which is as follows: [29]
W eff = r × 0.65 + 1.619 V 3 / 2 + 2.879 V 6
where, the core radius is r, and V stands for the standardized value V. The size of the spot affects the beam divergence.
A laser beam’s divergence is significantly influenced by its working frequency. The beam divergence factor is a measure of the quality of light beams in optical fibers. This factor is crucial for sensing and focusing power. The degree to which a proposed PCF’s beam divergence factor can be calculated from the Gaussian-beam theorem depends on the quality of the beam: [30]
θ degree = tan 1 180 × c f π 2 W eff
where, f is the operating frequency, c is the speed of light, and W eff is determined by Equation (14).

3. Detail Design of the Proposed HC-PCF

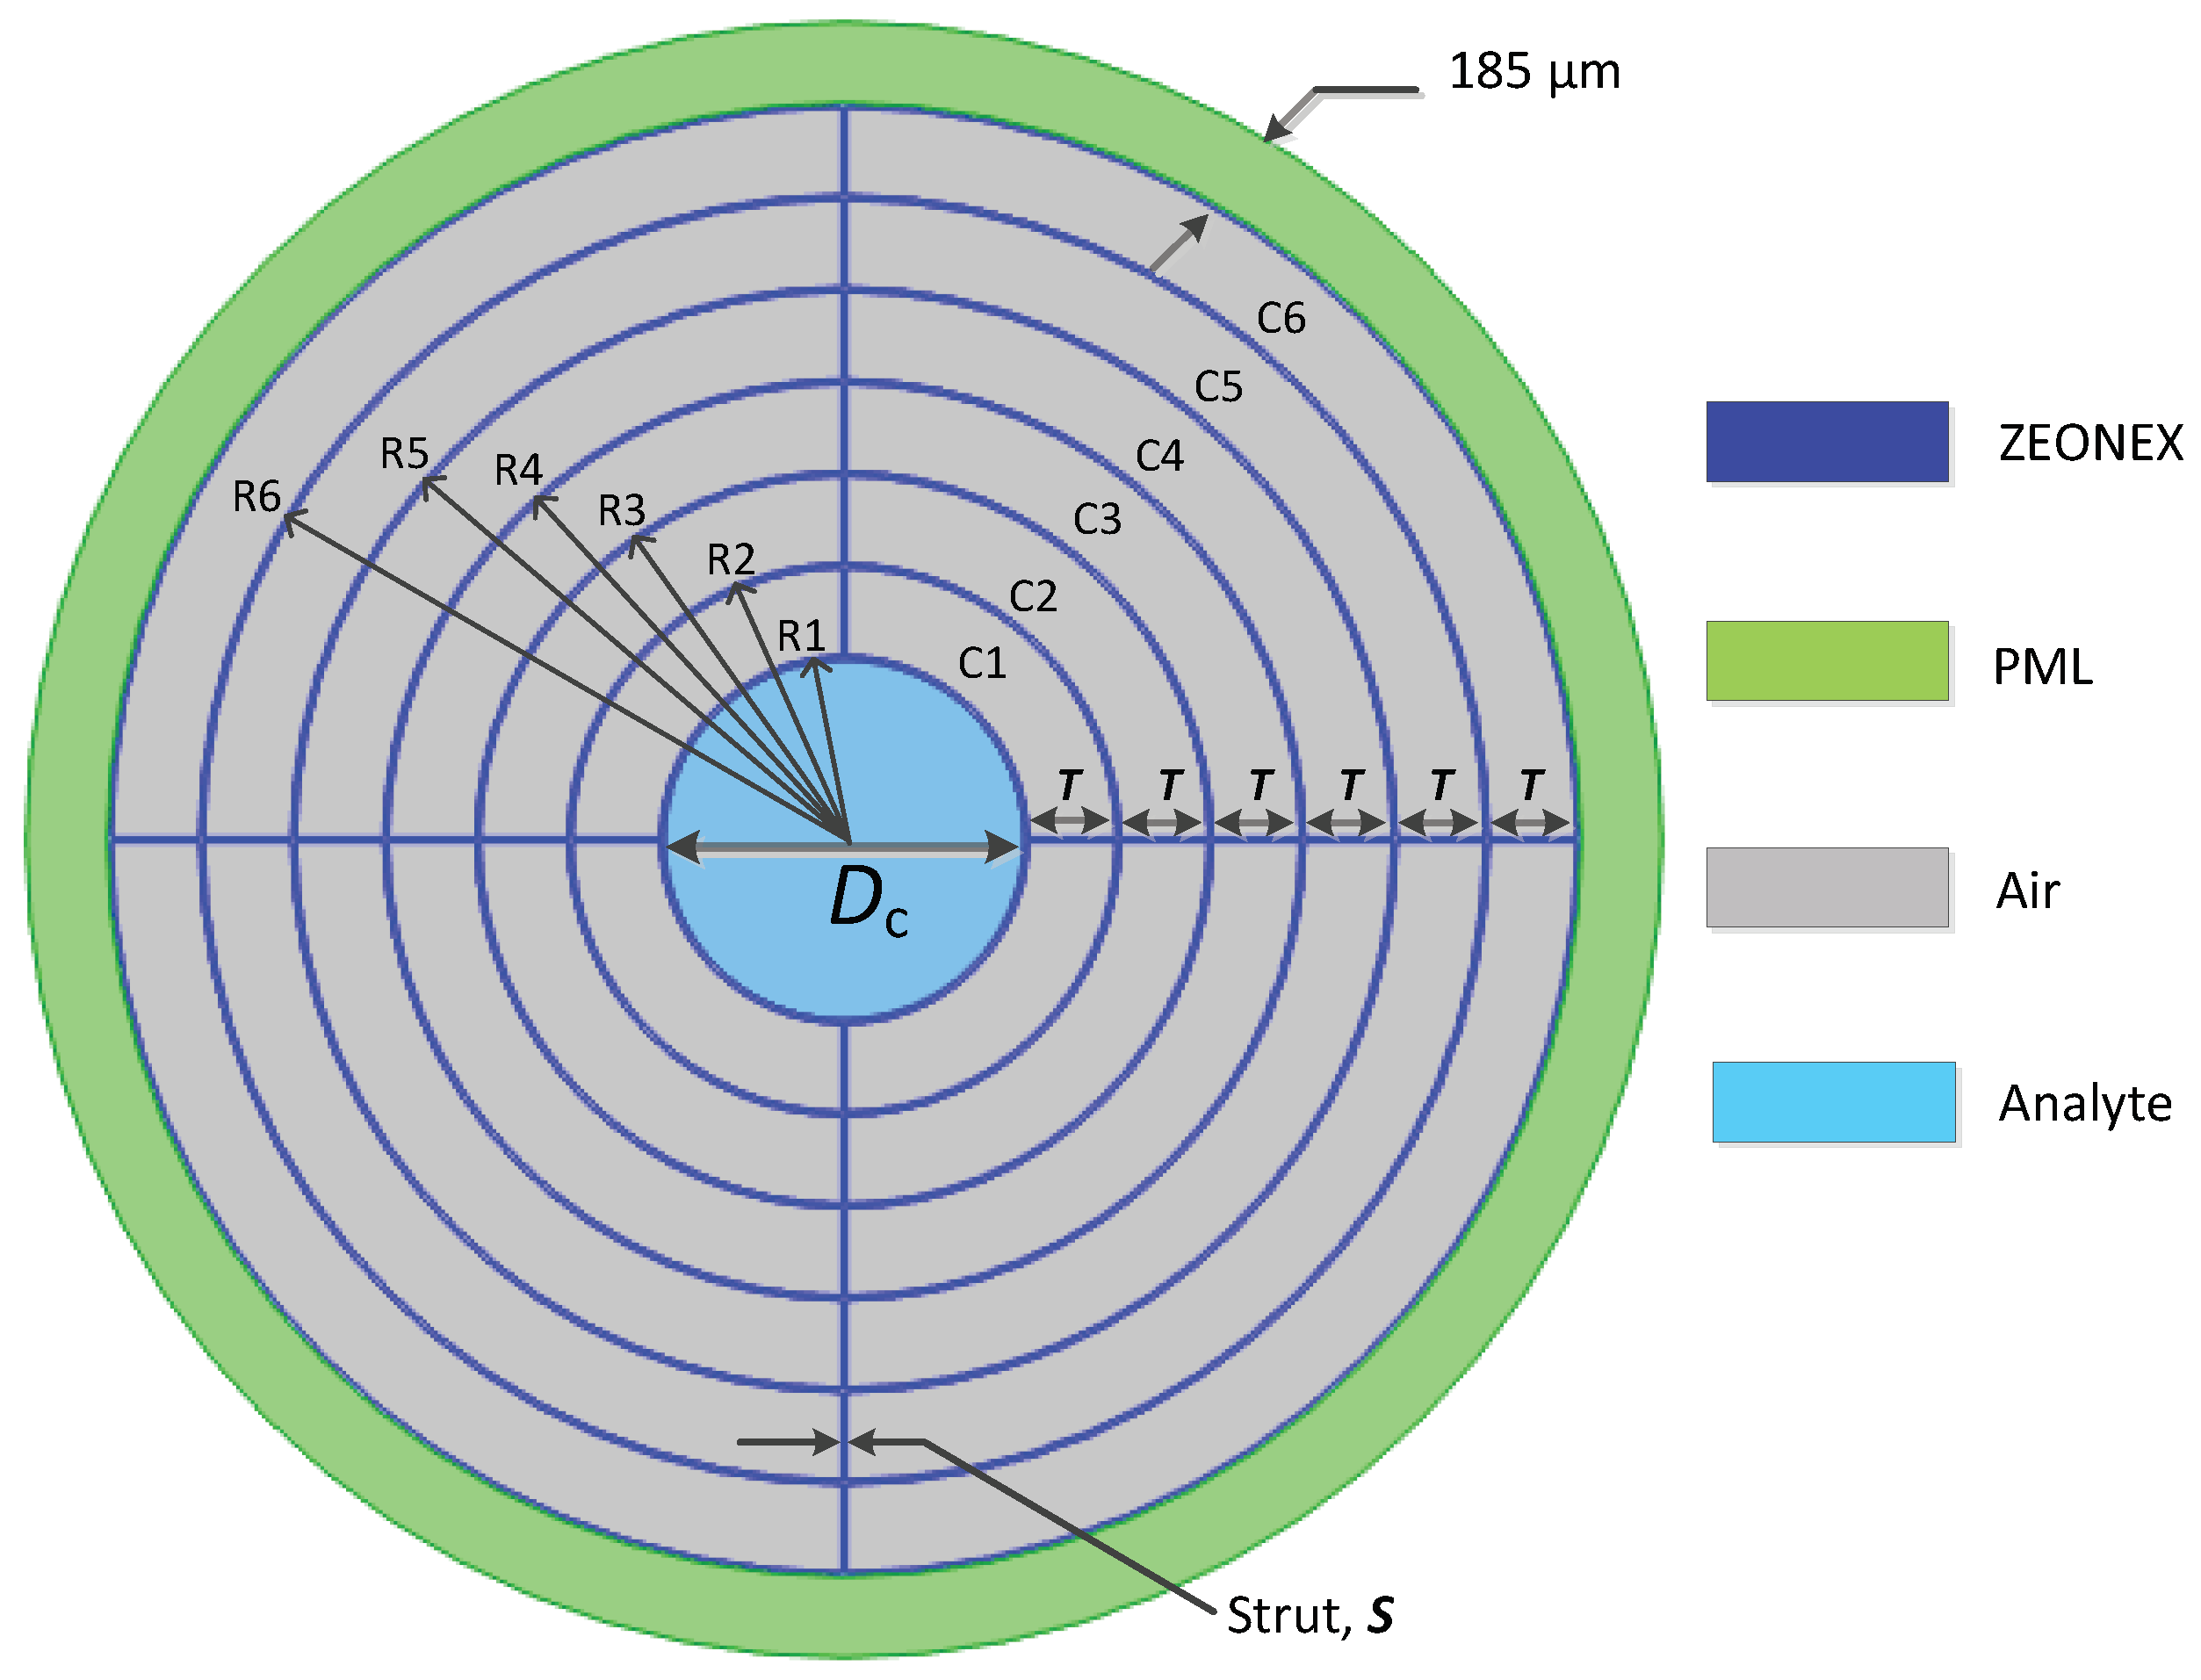
A HC-PCF has tremendous potential to increase sensitivity thanks to its greater volume in the core area. Additionally, a hollow core significantly minimizes the amount of background material used during manufacture, which in turn lowers material absorption loss. We chose to design our proposed sensor in the Terahertz band because of its high sensing characteristics in this regime [31,32] and the Electromagnetic Interference [33] is very low at the Terahertz band. The Terahertz band also offers low attenuation loss according to the fiber loss curve. The suggested HC-PCF’s inter-section is shown in Figure 3. This article uses the FEM as a computational tool to investigate mode propagation characteristics. The simulations were run using the program COMSOL Multiphysics 5.5.
The wave pattern cladding consists of six-layer ring-shaped air holes labeled as C1, C2, C3, C4, C5, and C6, having radii of R1, R2, R3, R4, R5, and R6, respectively, with an equal width of T. The diameter of the core air holes is labeled as D c . The structural parameters for the proposed PCF are R 1 = 510 μ m, R 2 = 710 μ m, R 3 = 910 μ m, R 4 = 1110 μ m, R 5 = 1310 μ m, R 6 = 1510 μ m, T = 190 μ m, and D c = 1000 μ m. The thickness of the solid cladding layers is called the strut. An optimal strut thickness is retained to prevent manufacturing difficulty during the whole process. A variety of strut widths, S, of 10 μ m and 20 μ m are considered, In current manufacturing methods, a 6.5 μ m strut width is bearable [27,34,35]. The PML has a radius of 1710 μ m with a thickness of 185 μ m. Any change in the form or dimensions of the cladding might affect CL but have absolutely no effect on the core analyte.
As an anti-reflective layer to block incoming PCF waves, a PML is positioned at the cladding’s edge, according to [8]. The breadth of PML is significant because of its superior impact on numerical analysis. As a consequence of this test, it was discovered that the best results were obtained when the PML was thicker than 10 percent of the whole diameter. It should be pointed out that the RI of various cancer cells and their corresponding normal cell, such as the breast, blood, skin, cervical, and adrenal glands are shown in Table 1.

4. Simulation Results and Discussions

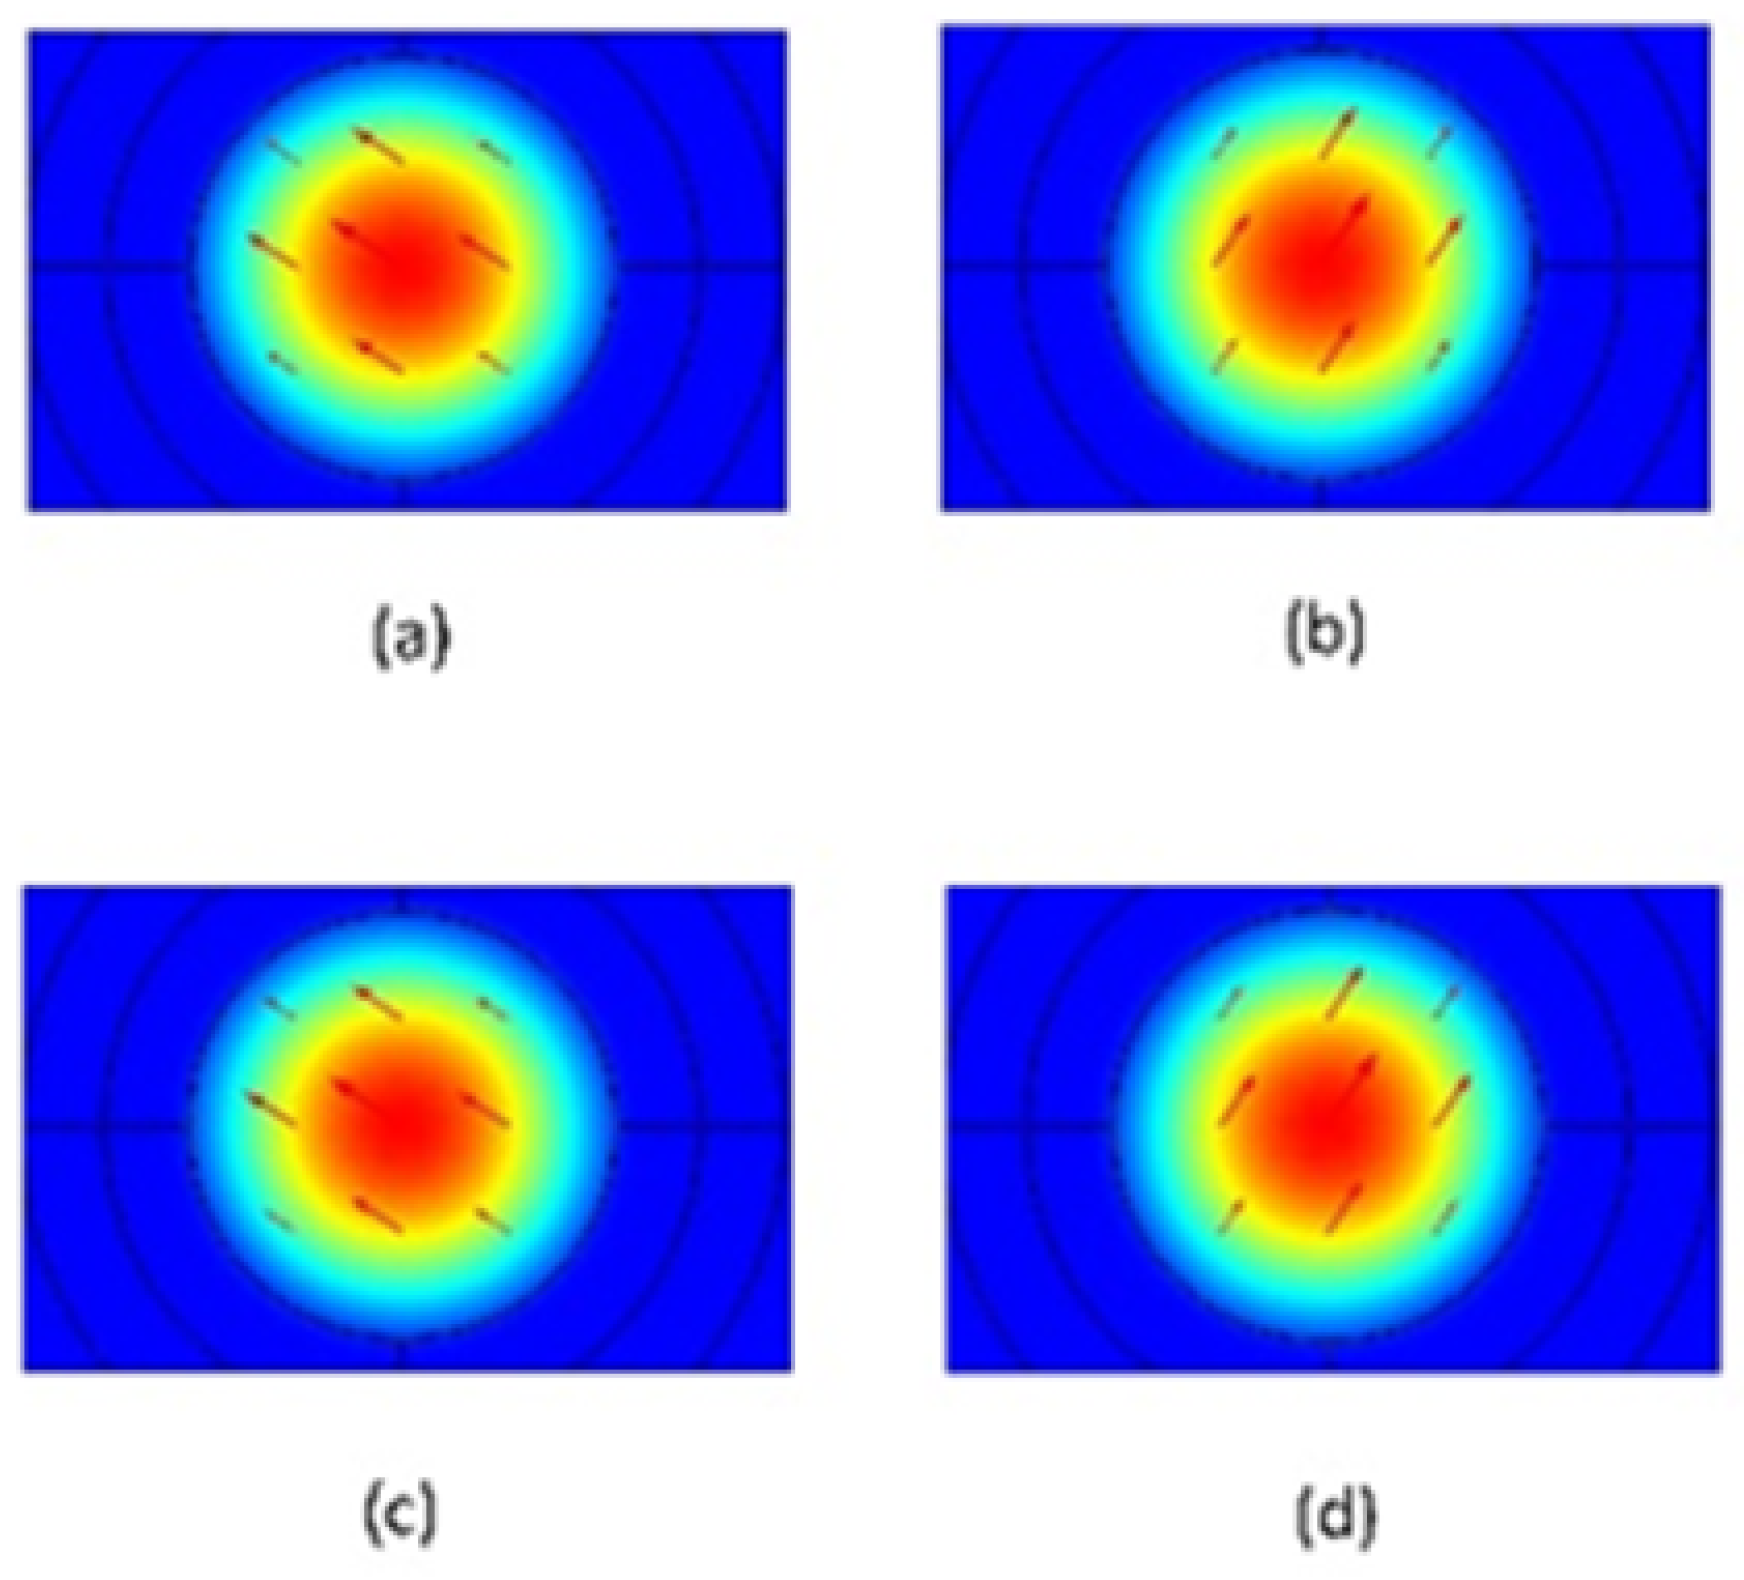
An optical field is depicted in Figure 4 in the presence of adrenal gland cancer and blood cancer. The other four types of cancer show similar field distributions. The field exhibits two polarization modes that are well guided (x-pol and y-pol). Each color in the figures corresponds to a specific cell type (red represents adrenal gland cell, blue represents blood cell, black represents breast cell type-1, violet represents breast cell type-2, cyan represents cervical cell and green represents skin cell), while the dashed lines (- - -) indicate the “Normal State” and the solid lines (-) indicate the “Cancerous State”.
For core diameters of 1000 microns and strut widths of 10 microns and 20 microns, Figure 5 illustrates the link between the relative sensitivity and corresponding frequency of breast cells, blood cells, skin cells, cervical cells, and adrenal gland cells in both normal state and cancerous state. Figures clearly show that all analytes would have better sensitivity with a narrower strut width. So, a strut width of 10 μ m is considered optimum for our proposed model. It has also been demonstrated that the relative sensitivity increases up to a particular frequency before essentially flattening off. This is expressed as follows: as the frequency rises, the core power fraction rises as well, improving the effective RI. According to Equation (4), the relative sensitivity is directly correlated with the RI of the analyte and is inversely correlated with the RI of the effective analyte. From the figure, the relative sensitivity of six cell types in normal form was found to be 99.9177% for adrenal gland cells, 99.9136% for blood cells, 99.9207% for breast cell type-1, 99.9222% for breast cell type-2, 99.9064% for cervical cells and 99.8983% for skin cells at a frequency of 3 THz in x-pol. In their cancerous state, the relative sensitivity of all analytes increased to 99.9277% for adrenal gland cells, 99.9243% for blood cells, 99.9302% for breast cell type-1, 99.9314% for breast cell type-2, 99.9257% for cervical cells, and 99.9169% for skin cells at a frequency of 3 THz in x-pol.
The effective analyte detection of a Terahertz sensor is constrained by a small number of limiting parameters, including EML, CL, bending, and scattering losses. Please note that the scattering loss property is not taken into consideration because it is explicitly stated in Figure 4 that light is well confined in the core and that light contact with the cladding is minimal. Furthermore, it is better to avoid characterizing the bending loss due to the length consideration. Because of the background material utilized, EML is the main contributor to optical power loss in the proposed PCF. EML is the sum of the light energy absorbed by the core material. EML can be minimized by using air spaces in the core area. Utilizing a hollow core also has the advantage of significantly reducing background material thickness from the core, which lowers EML.
Figure 6a,b shows the EML characteristics in relation to frequency with variations in analytes. As shown, EML reduces in response to the frequency at optimal geometrical variables, ultimately fulfilling the theoretical state of the EML calculation [32,37]. Figure 6 also shows that EML is as low as 8.55 × 10 5 cm 1 for adrenal gland cancer, 8.96 × 10 5 cm 1 for blood cancer, 8.24 × 10 5 cm 1 for breast cancer type-1, 8.09 × 10 5 cm 1 for breast cancer type-2, 8.79 × 10 5 cm 1 for cervical cancer, and 9.88 × 10 5 cm 1 for skin cancer cells at a frequency of 3 THz, respectively.
Figure 6c demonstrates the relationship between the frequency of various analytes and CL. It is important to reduce CL because it causes light to leak from the core region to the cladding. All six analytes’ CL decreased as a result of the hollow core area’s mode fields being confined more tightly with increasing frequency. As a result, CL is reduced as 6.1 × 10 10 dB/cm for adrenal gland cancer, 6.1 × 10 10 dB/cm for blood cancer, 6.1 × 10 10 dB/cm for breast cancer type-1, 6.1 × 10 10 dB/cm for breast cancer type-2, 6.1 × 10 10 dB/cm for cervical cancer, and 6.0 × 10 10 dB/cm for skin cancer cells at a frequency of 3 THz.
The analytes’ birefringence property is shown in Figure 6d. Birefringence is officially defined as the double refraction of light in a transparent, molecularly ordered substance, which is exhibited by the existence of orientation-dependent differences in RI. The birefringence decreases with decreasing ERI as the frequency ultimately rises in both x- and y-polarity. Adrenal gland cancer’s obtained birefringence at a frequency of 3 THz is 1 × 10 9 ; for other cancer kinds (such as blood cancer, breast cancer type-1, breast cancer type-2, cervical cancer, and skin cancer), these values are below 1 × 10 9 . Please be aware that theoretically, reducing the core size might raise the birefringence considerably more, but the relative sensitivity would be significantly reduced.
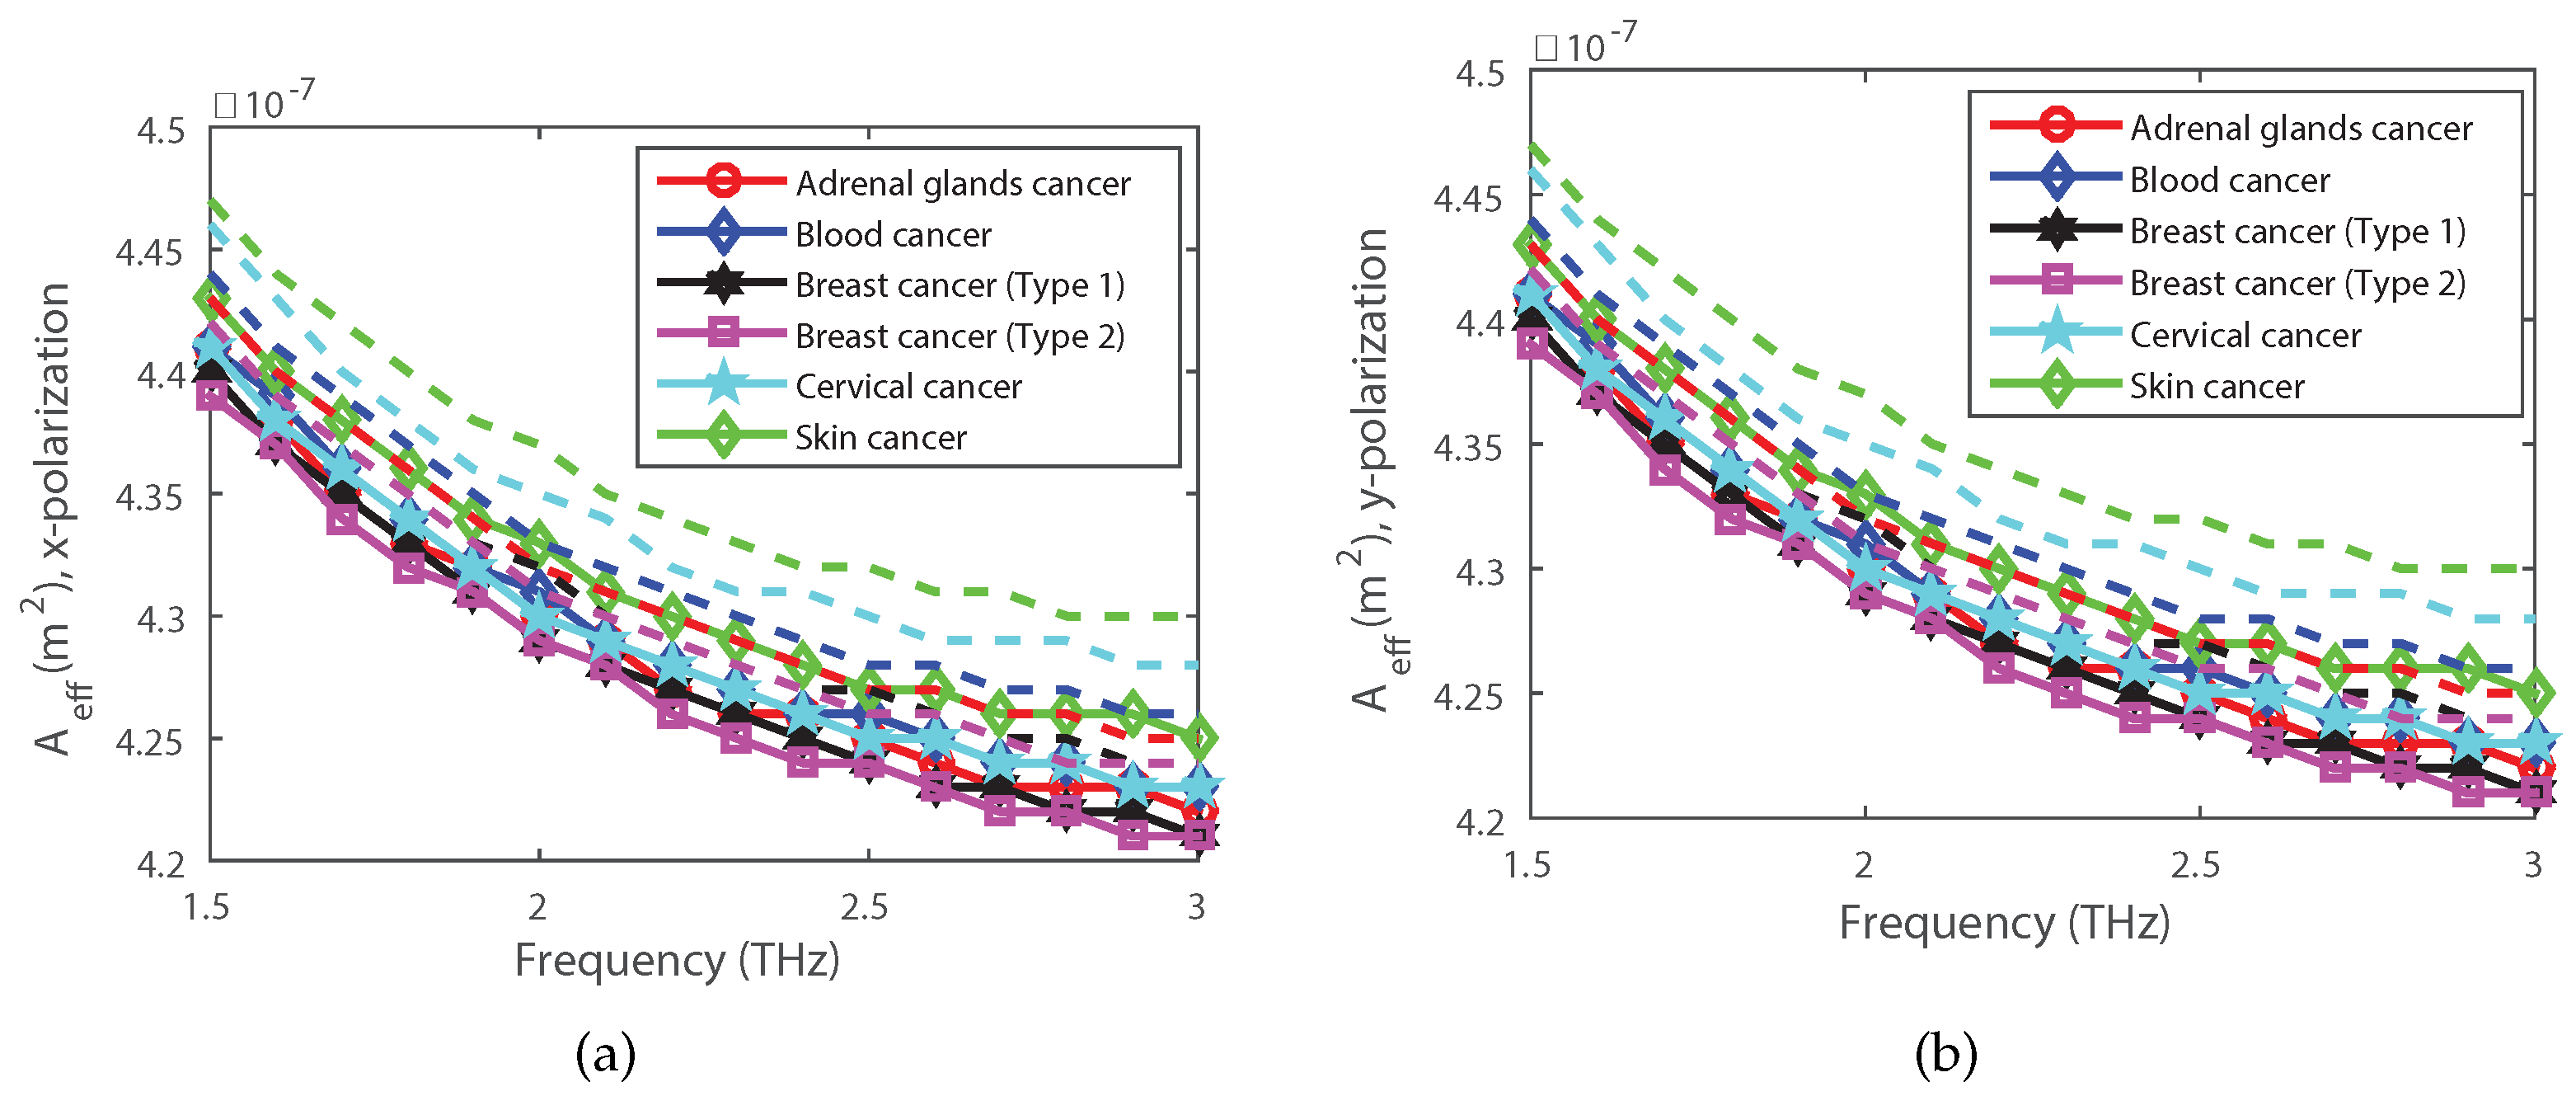
The area that a waveguide or fiber mode actually covers in the transverse dimensions is quantified as the effective mode area. In applications where nonlinear effects can significantly impede system performance, the effective area is a better representation of the light-carrying region in fibers used in those applications. The frequency dependency of the effective area for several analytes is shown in Figure 7. The graphic representations of this figure show that the effective mode area decreases with increasing frequency. The mode field is tightly constrained and the effective area is reduced at higher frequencies in the core portion. The effective area value of the planned PCF was 4.22 × 10 7 m 2 for adrenal gland cancer, 4.23 × 10 7 m 2 for blood cancer, 4.21 × 10 7 m 2 for breast cancer type-1, 4.21 × 10 7 m 2 for breast cancer type-2, 4.23 × 10 7 m 2 for cervical cancer, and 4.25 × 10 7 m 2 for skin cancer at a frequency of 3 THz. Figure 6c illustrates how CL decreases as frequency rises, showing the physical result of this phenomenon.
The spreading out of a light pulse in time as it travels down the fiber is known as dispersion. Figure 8 shows the dispersion relation for each analyte applied to a PCF. As the frequency increases, so does the dispersion of the solution.
An optical fiber’s NA measures its ability to gather light. Figure 9 shows the NA for various cancer cells in relation to frequency. The graph depicts how NA behaves, acting downward with gradually increasing frequency.
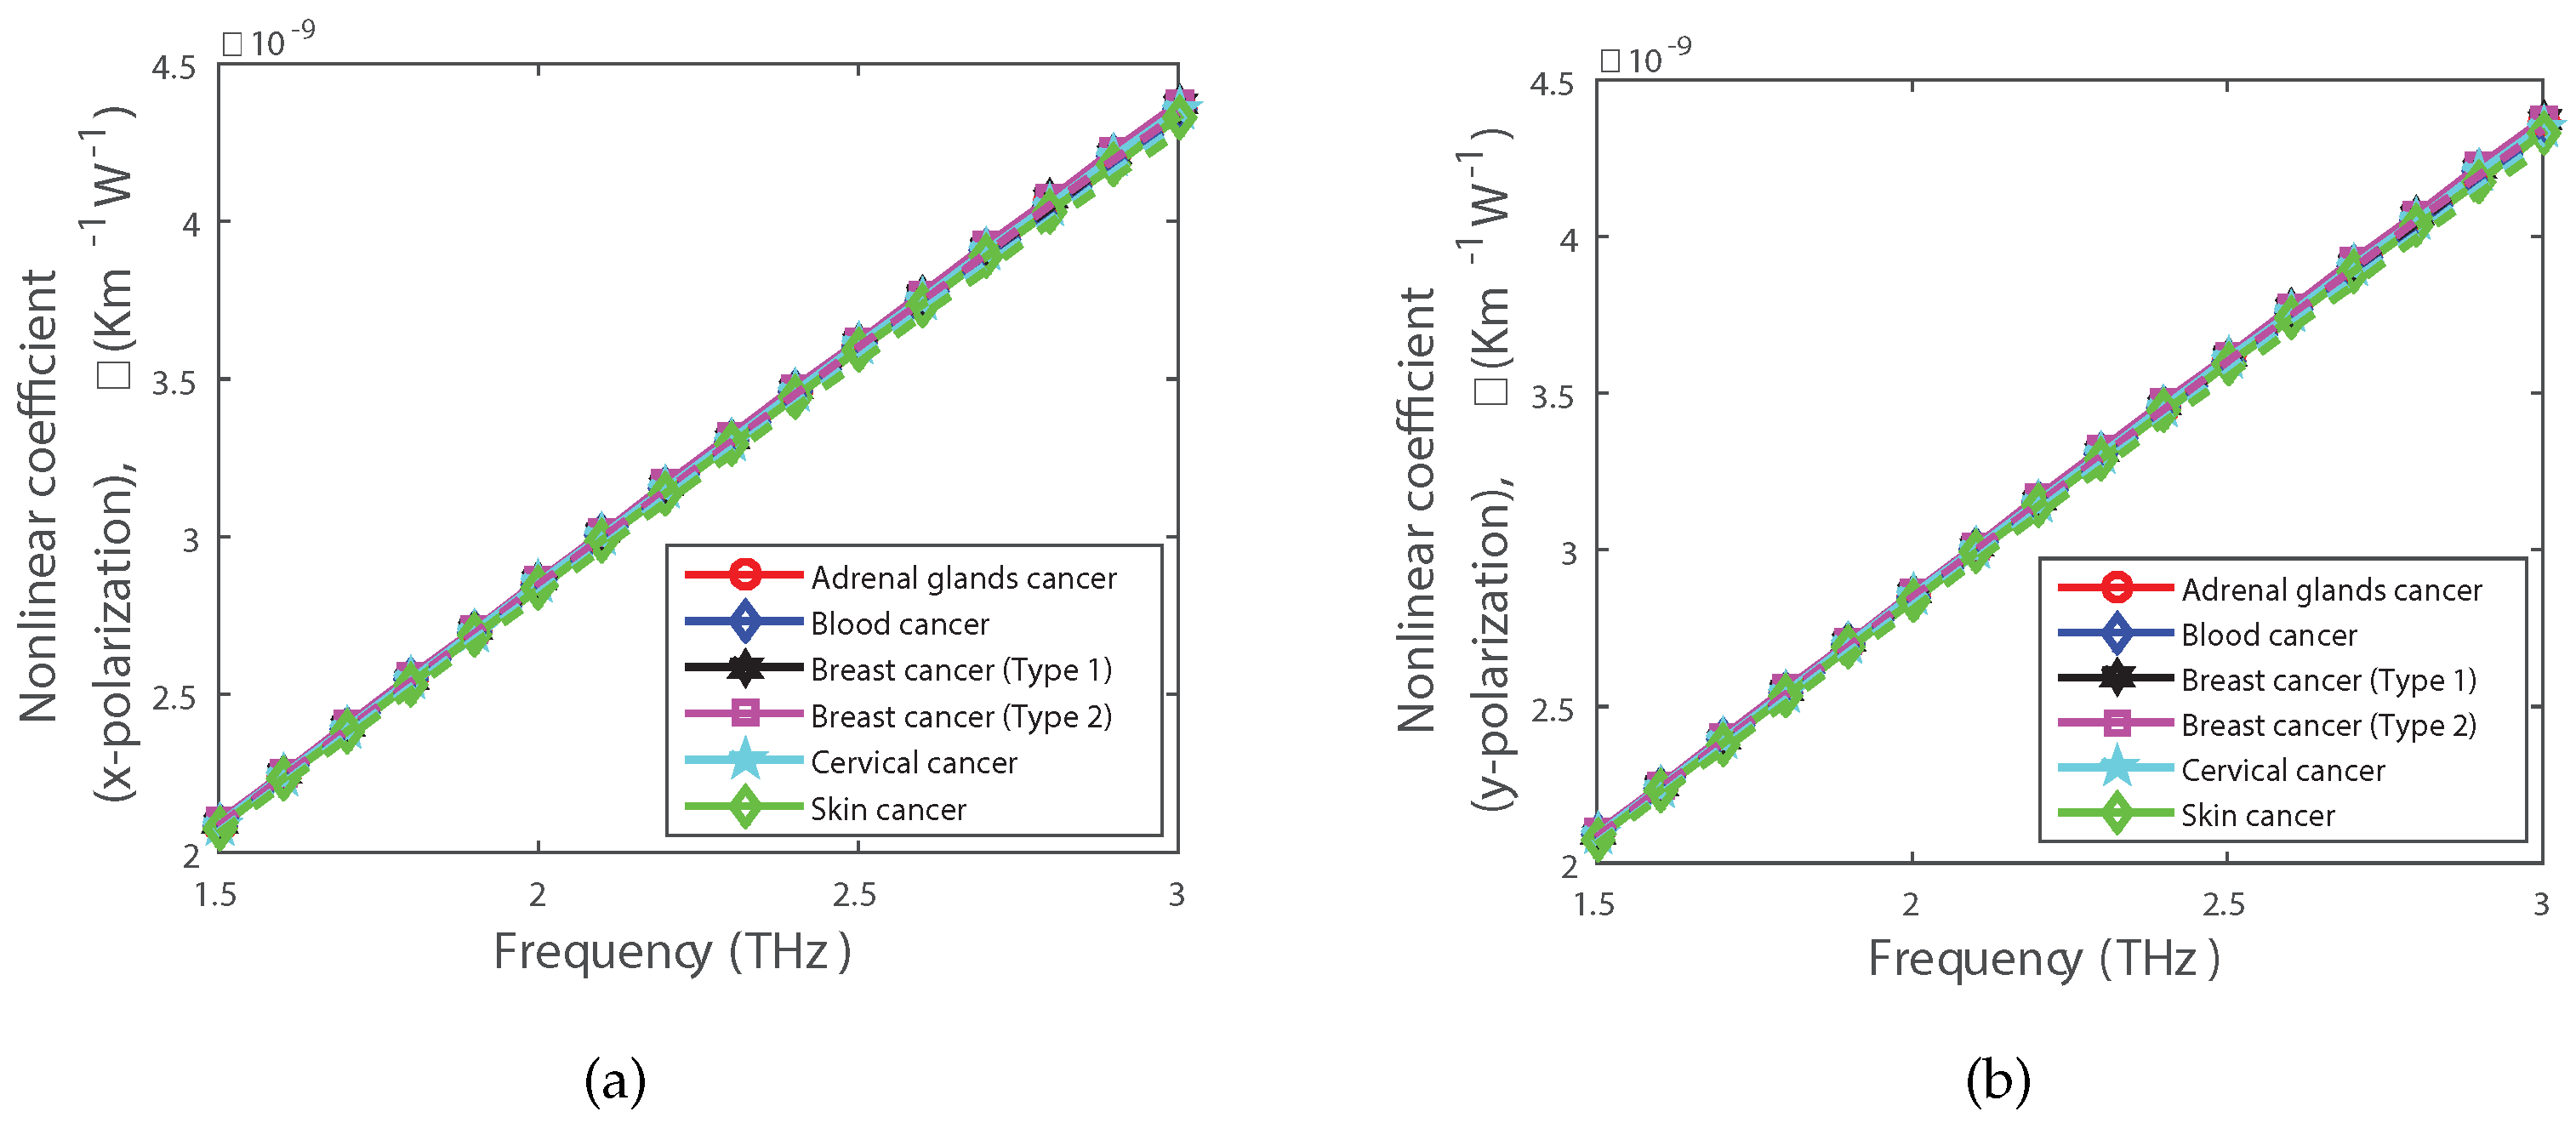
Figure 10 depicts the relationship between the nonlinear coefficient of cancer cells and frequency. The nonlinear coefficient grows along with the operating frequency. Figure 7 and Figure 10 depict the expected opposing actions. So, the relationship between nonlinearity and effective area is inverse. Nonlinearity coefficients is 4.362 × 10 9 for adrenal gland cancer, 4.352 × 10 9 for blood cancer, 4.373 × 10 9 for breast cancer type-1, 4.373 × 10 9 for breast cancer type-2, 4.352 × 10 9 for cervical cancer, and 4.332 × 10 9 for skin cancer cells at a frequency of 3 THz, respectively.
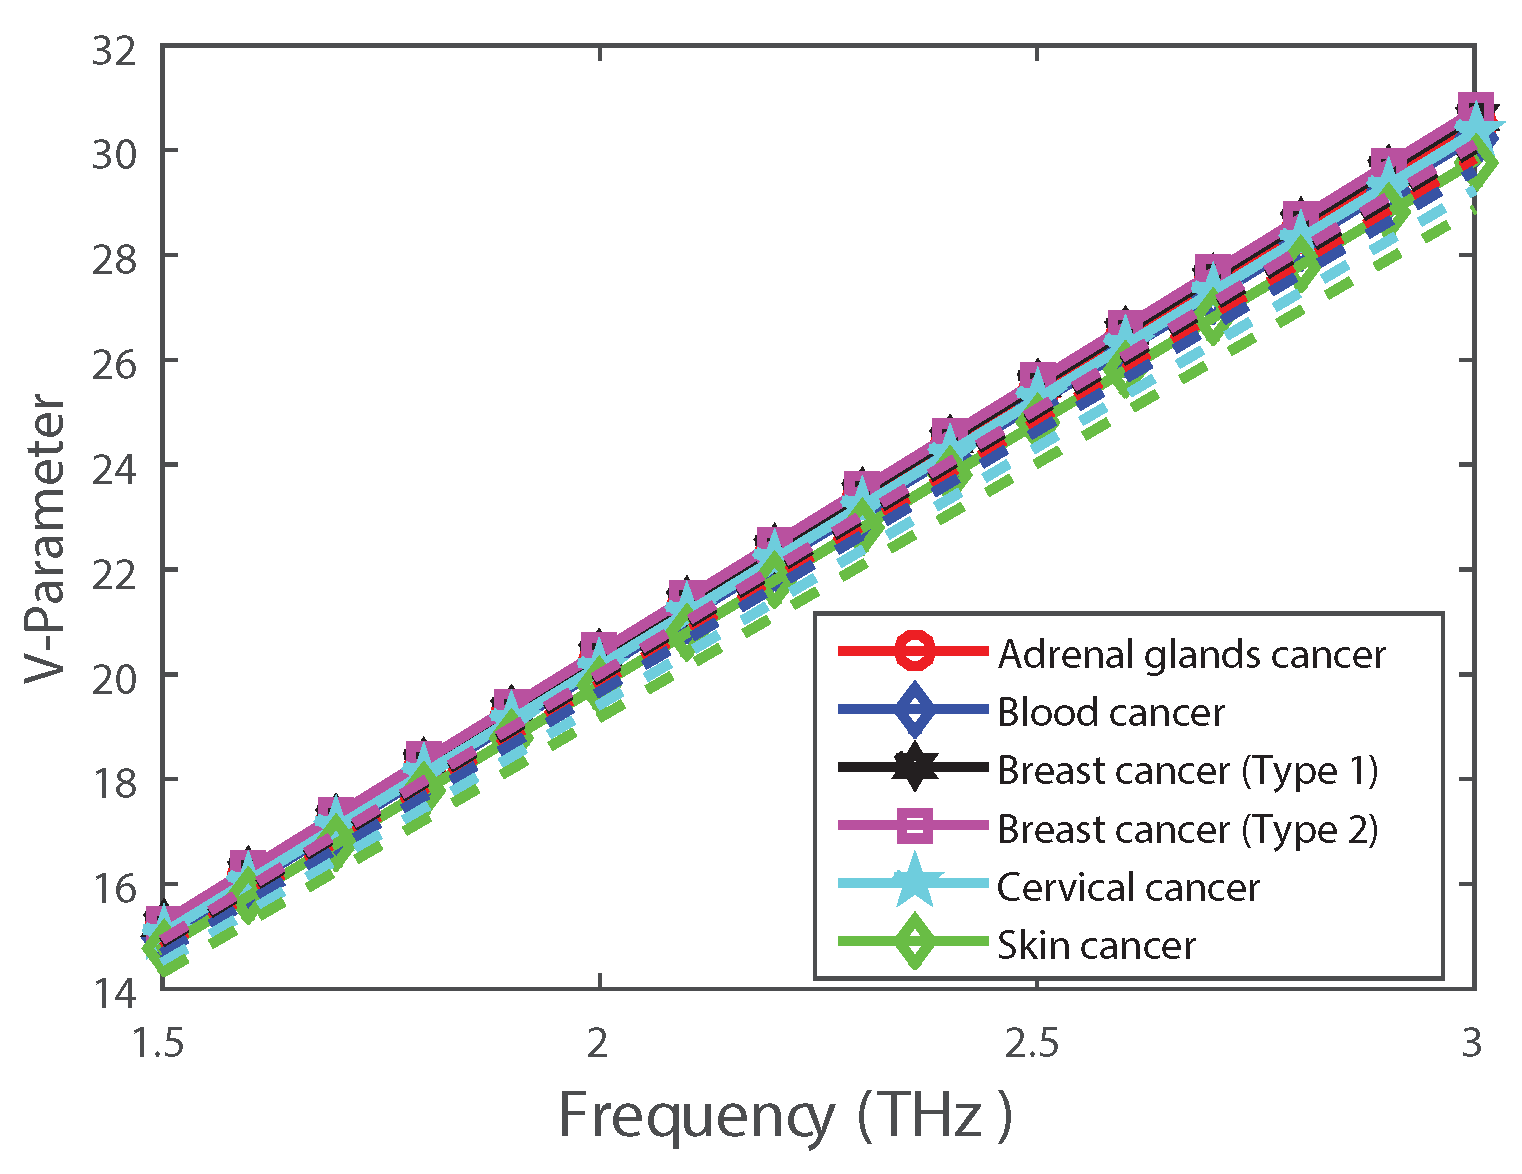
Figure 11 shows the variance of the V parameter with frequency. The fiber maintains its multi-mode nature with all cancer cell samples at a frequency of 3 THz.
The link between spot size and frequency in the THz spectrum is defined in Figure 12 using different cancer cells. Spot size is nothing more than the beam’s own radius. Figure 12 shows that spot size decreases when the frequency is increasing.
Figure 13 shows the beam divergence in x-polarization toward frequency for various cancer cells. The derivative of the beam radius with respect to the axial position in the far field, or at a distance from the beam waist that is much farther than the Rayleigh length, is the beam divergence. For the cancer cell sample, a fiber-beam divergence of 5.5 degrees was predicted; however, this was decreased with an ideal geometry frequency of 3 THz and rising frequency. The beam divergence decreases as frequency increases, according to the graph. Because of the low beam divergence, the suggested sensor has a higher sensitivity at 3 THz.
Based on a variety of performance criteria, Table 2 compares the suggested PCF model with previously published PCF and outperforms the earlier design in terms of sensitivity.
In spite of the development of numerous manufacturing techniques, including boiling techniques, capillary packing, multiple thinning, casting, and the sol-gel and stacking and drawing method [38,39,40,41,42,43,44,45,46]—all of which have been used to create hollow-shaped processes—3D printing was utilized for creating a number of hollow-shaped core processes [46].

5. Fabrication of the Proposed HC-PCF

Another significant issue is the manufacturing of PCF-based devices. In spite of the development of numerous manufacturing techniques, including boiling techniques, capillary packing, multiple thinning, casting, and the sol-gel and stacking and drawing method [38,39,40,41,42,43,44,45,46]—all of which have been used to create hollow-shaped processes—3D printing was utilized for creating a number of hollow-shaped core processes [46]. Several PCF structures have been created by D. Pysz et al. using the stack and draw technique [45]. Additionally, Z. Lui et al. [43] presented various stack and draw techniques for fabricating suspended microstructure fibers. Recently, it was reported that a hollow core PCF was developed using the stack-and-draw method, which involves stacking several layers of extruded material on top of each other and then drawing the whole structure into its final shape and was based on sodium-calcium-silicate glass [47]. The HC-PCF-based sensor can be rendered using normal stack-and-drawing technology and includes circle-formed air holes both in the center and cladding [48,49]. By leaving out some capillaries, it is possible to create a hollow air core and claddings. In light of current fabrication methods and their shortcomings, we proposed an HC-PCF biosensor that could be produced in any extrusion or 3D printing manufacturing environment.
Figure 14 shows the basic structure for detecting cancer cells using the proposed biosensor. In the figure, light is incident upon the core of the biosensor, which is filled with analyte. The light passes through the analyte in the biosensor and goes into the spectrometer. The spectrometer is used to analyze spectral properties of the fiber, which can provide information about the refractive index of the surrounding medium and any analytes present. The spectrometer can also be used to monitor changes in the transmission spectra of the fiber over time, which can be used for real-time sensing applications. All these data are transferred to a PC for further analysis and comparison.

6. Application Possibilities of the Proposed HC-PCF

The sensor was demonstrated to have extremely high sensitivity (supposedly surpassing 99%) for analytes with a 1.3–1.4 RI range while operating at peak efficiency. The suggested sensor could be used as a biosensor for blood component detection in the medical field [50]. Red blood cells have a RI of 1.40, while hemoglobin has a RI of 1.38, white blood cells have a RI of 1.36, plasma has a RI of 1.35, and water has a RI of 1.33 [51]. Moreover, the suggested sensor can differentiate between different types of alcohol (i.e., ethanol, benzene, methanol) [27]. So, it is evident that the suggested sensor can identify cancer cells and other substances in a variety of industries. Moreover, given the large detecting range, it is evident that the proposed sensor model may detect bio-chemicals or other compounds in a variety of sectors.

7. Conclusions

This article introduces a high-sensitivity biosensor for cancer cell detection. The suggested sensor model is sufficiently versatile for detecting and categorizing different cancer cells. Table 3 displays the optical specifications for the HC-PCF sensor that is suggested for the detection of cancer cells at 3 THz. Our theoretical research suggests that excellent sensitivity for a variety of cancer cells can be achieved with minimal CL. Additionally, as shown in Table 2, modeling results demonstrate that our proposed PCF structure performs better overall than the previous PCF structure for cancer cell detection. The key PCF design parameters have been significantly improved as a result of this study to maximize production efficiency. Our study has several limitations to consider. Our goal was to achieve high sensitivity with low losses, which required us to think beyond common shapes and develop a slightly complex model. As a result, the design we proposed may be challenging to fabricate using methods other than 3D printing technology. Hence, we recommend using 3D printing technology for the fabrication process. It is also important to note that environmental factors such as temperature, humidity, and pH may affect the performance of the biosensor we proposed.
The proposed biosensor has a lot of potential in implementing other bio applications such as the Microfluidic Invasion Chemotaxis Platform for 3D Neurovascular Co-Culture [52], 3D-Printed Microneedles (MNs) [53], etc., to increase the overall performance and improve the user experience. Microfluidic Invasion Chemotaxis Platform for 3D Neurovascular Co-Culture can be used to study tissue and organ models and model human diseases to check the performance of our biosensor for detection in systems that include more than one cell. Additionally, we can implement 3D-printed MNs for collecting analytes from the human body for our proposed sensor as they are user-friendly and minimally invasive, offering less pain and lower tissue damage than conventional needles. So, by incorporating these technologies with our proposed biosensor, the overall performance and user experience can enhance greatly. The proposed biosensor has a great deal of potential for quickly identifying different cancer cells because it has improved sensitivity and sophisticated packaging to protect the detecting head. The authors firmly believe that the suggested PCF structures can be made, thanks to recent developments in 3D nano-fabrication methods.

Author Contributions

Software, M.H.M.; Validation, A.A.C.; Investigation, M.M.N.; Resources, M.R.I.; Data curation, M.S.H.; Supervision, M.R.H.K. All authors have read and agreed to the published version of the manuscript.

Funding

This research was funded by the Islamic University of Technology, Gazipur 1704, Dhaka, Bangladesh under the title “IUT Seed Grant”, grant number REASP/IUT-RSG/2022/OL/07/009.

Institutional Review Board Statement

Not applicable.

Informed Consent Statement

Not applicable.

Data Availability Statement

Not applicable.

Conflicts of Interest

The authors declare no conflict of interest.

References

  1. Kumar, P.; Kumar, V.; Roy, J.S. Design of quad core photonic crystal fibers with flattened zero dispersion. AEU Int. J. Electron. Commun. 2019, 98, 265–272. [Google Scholar] [CrossRef]
  2. Kumar, C.S.; Anbazhagan, R. Investigation on chalcogenide and silica based photonic crystal fibers with circular and octagonal core. AEU Int. J. Electron. Commun. 2017, 72, 40–45. [Google Scholar] [CrossRef]
  3. Saitoh, K.; Koshiba, M. Single-polarization single-mode photonic crystal fibers. IEEE Photonics Technol. Lett. 2003, 15, 1384–1386. [Google Scholar] [CrossRef]
  4. Buczynski, R. Photonic crystal fibers. Acta Phys. Pol. Ser. A 2004, 106, 141–168. [Google Scholar] [CrossRef]
  5. Russell, P.S.J. Photonic-crystal fibers. J. Light. Technol. 2006, 24, 4729–4749. [Google Scholar] [CrossRef]
  6. Folkenberg, J.R.; Nielsen, M.D.; Mortensen, N.; Jakobsen, C.; Simonsen, H.R. Polarization maintaining large mode area photonic crystal fiber. Opt. Express 2004, 12, 956–960. [Google Scholar] [CrossRef]
  7. Chen, M.Y. Polarization-maintaining large-mode-area photonic crystal fibres with solid microstructured cores. J. Opt. Pure Appl. Opt. 2007, 9, 868. [Google Scholar] [CrossRef]
  8. Sultana, J.; Islam, M.S.; Faisal, M.; Islam, M.R.; Ng, B.W.H.; Ebendorff-Heidepriem, H.; Abbott, D. Highly birefringent elliptical core photonic crystal fiber for terahertz application. Opt. Commun. 2018, 407, 92–96. [Google Scholar] [CrossRef]
  9. Sultana, J.; Islam, M.R.; Faisal, M.; Talha, K.M.A.; Islam, M.S. Design and analysis of a Zeonex based diamond-shaped core kagome lattice photonic crystal fiber for T-ray wave transmission. Opt. Fiber Technol. 2019, 47, 55–60. [Google Scholar] [CrossRef]
  10. Paul, B.K.; Ahmed, K. Highly birefringent TOPAS based single mode photonic crystal fiber with ultra-low material loss for Terahertz applications. Opt. Fiber Technol. 2019, 53, 102031. [Google Scholar] [CrossRef]
  11. Goto, M.; Quema, A.; Takahashi, H.; Ono, S.; Sarukura, N. Teflon photonic crystal fiber as terahertz waveguide. Jpn. J. Appl. Phys. 2004, 43, L317. [Google Scholar] [CrossRef]
  12. Hossain, S.; Mollah, A.; Hosain, K.; Ankan, I.M. THz spectroscopic sensing of liquid chemicals using hollow-core anti-resonant fiber. OSA Contin. 2021, 4, 621–632. [Google Scholar] [CrossRef]
  13. Lanza, R.; Gearhart, J.; Hogan, B.; Melton, D.; Pedersen, R.; Thomas, E.D.; Thomson, J.A. Essentials of Stem Cell Biology; Elsevier: Amsterdam, The Netherlands, 2005. [Google Scholar]
  14. Sung, H.; Ferlay, J.; Siegel, R.L.; Laversanne, M.; Soerjomataram, I.; Jemal, A.; Bray, F. Global cancer statistics 2020: GLOBOCAN estimates of incidence and mortality worldwide for 36 cancers in 185 countries. CA Cancer J. Clin. 2021, 71, 209–249. [Google Scholar] [CrossRef]
  15. Einhorn, L.H. Testicular cancer as a model for a curable neoplasm: The Richard and Hinda Rosenthal Foundation Award Lecture. Cancer Res. 1981, 41, 3275–3280. [Google Scholar] [PubMed]
  16. Cuzick, J.; Powles, T.; Veronesi, U.; Forbes, J.; Edwards, R.; Ashley, S.; Boyle, P. Overview of the main outcomes in breast-cancer prevention trials. Lancet 2003, 361, 296–300. [Google Scholar] [CrossRef] [PubMed]
  17. Dressing, G.E.; Thomas, P. Identification of membrane progestin receptors in human breast cancer cell lines and biopsies and their potential involvement in breast cancer. Steroids 2007, 72, 111–116. [Google Scholar] [CrossRef]
  18. Tajima, K.; Obata, Y.; Tamaki, H.; Yoshida, M.; Chen, Y.T.; Scanlan, M.J.; Old, L.J.; Kuwano, H.; Takahashi, T.; Takahashi, T.; et al. Expression of cancer/testis (CT) antigens in lung cancer. Lung Cancer 2003, 42, 23–33. [Google Scholar] [CrossRef]
  19. Glunde, K.; Bhujwalla, Z.M. Metabolic tumor imaging using magnetic resonance spectroscopy. Semin. Oncol. 2011, 38, 26–41. [Google Scholar] [CrossRef]
  20. Furusawa, Y.; Fujiwara, Y.; Campbell, P.; Zhao, Q.L.; Ogawa, R.; Ali Hassan, M.; Tabuchi, Y.; Takasaki, I.; Takahashi, A.; Kondo, T. DNA double-strand breaks induced by cavitational mechanical effects of ultrasound in cancer cell lines. PLoS ONE 2012, 7, e29012. [Google Scholar] [CrossRef]
  21. Clark, L.C., Jr.; Lyons, C. Electrode systems for continuous monitoring in cardiovascular surgery. Ann. N. Y. Acad. Sci. 1962, 102, 29–45. [Google Scholar] [CrossRef]
  22. Parvin, T.; Ahmed, K.; Alatwi, A.M.; Rashed, A.N.Z. Differential optical absorption spectroscopy-based refractive index sensor for cancer cell detection. Opt. Rev. 2021, 28, 134–143. [Google Scholar] [CrossRef]
  23. Habib, A.; Rashed, A.N.Z.; El-Hageen, H.M.; Alatwi, A.M. Extremely Sensitive Photonic Crystal Fiber–Based Cancer Cell Detector in the Terahertz Regime. Plasmonics 2021, 16, 1297–1306. [Google Scholar] [CrossRef]
  24. Eid, M.; Rashed, A.N.Z.; Bulbul, A.A.M.; Podder, E. Mono-rectangular core photonic crystal fiber (MRC-PCF) for skin and blood cancer detection. Plasmonics 2021, 16, 717–727. [Google Scholar] [CrossRef]
  25. Bulbul, A.A.M.; Rahaman, H.; Podder, E. Design and quantitative analysis of low loss and extremely sensitive PCF-based biosensor for cancerous cell detection. Opt. Quantum Electron. 2022, 54, 1–16. [Google Scholar] [CrossRef]
  26. Yadav, S.; Singh, S.; Lohia, D.; Umar, P.; Dwivedi, D.K. Computational Study of a Photonic Crystal Fiber-Based Biosensor for Detection of Breast Cancer Cells in the THz Regime. SSRN Electron. J. 2022, 33, 34. [Google Scholar] [CrossRef]
  27. Khan, M.R.H.; Ali, F.A.M.; Islam, M.R. THz sensing of CoViD-19 disinfecting products using photonic crystal fiber. Sens. Bio Sens. Res. 2021, 33, 100447. [Google Scholar] [CrossRef]
  28. Sultana, J.; Islam, M.S.; Ahmed, K.; Dinovitser, A.; Ng, B.W.H.; Abbott, D. Terahertz detection of alcohol using a photonic crystal fiber sensor. Appl. Opt. 2018, 57, 2426–2433. [Google Scholar] [CrossRef]
  29. Islam, M.S.; Paul, B.K.; Ahmed, K.; Asaduzzaman, S.; Islam, M.I.; Chowdhury, S.; Sen, S.; Bahar, A.N. Liquid-infiltrated photonic crystal fiber for sensing purpose: Design and analysis. Alex. Eng. J. 2018, 57, 1459–1466. [Google Scholar] [CrossRef]
  30. Arumugam, R.; Babu, P.R.; Senthilnathan, K. Designing a dual steering wheel microstructured blood components sensor in terahertz wave band. Opt. Eng. 2020, 59, 047104. [Google Scholar]
  31. Fischer, B.; Hoffmann, M.; Helm, H.; Modjesch, G.; Jepsen, P.U. Chemical recognition in terahertz time-domain spectroscopy and imaging. Semicond. Sci. Technol. 2005, 20, S246. [Google Scholar] [CrossRef]
  32. Islam, M.S.; Sultana, J.; Rifat, A.A.; Dinovitser, A.; Ng, B.W.H.; Abbott, D. Terahertz sensing in a hollow core photonic crystal fiber. IEEE Sens. J. 2018, 18, 4073–4080. [Google Scholar] [CrossRef]
  33. Sabri, N.; Aljunid, S.; Salim, M.; Ahmad, R.B.; Kamaruddin, R. Toward optical sensors: Review and applications. J. Physics Conf. Ser. 2013, 423, 012064. [Google Scholar] [CrossRef]
  34. Rahman, M.M.; Mou, F.A.; Bhuiyan, M.I.H.; Mahmud, M.A.A.; Islam, M.R. Design and characterization of a photonic crystal fiber for improved THz wave propagation and analytes sensing. Opt. Quantum Electron. 2022, 54, 669. [Google Scholar] [CrossRef]
  35. Bise, R.T.; Trevor, D.J. Sol-gel derived microstructured fiber: Fabrication and characterization. In Proceedings of the Optical Fiber Communication Conference, Anaheim, CA, USA, 6–11 March 2005; p. OWL6. [Google Scholar]
  36. Jabin, M.A.; Ahmed, K.; Rana, M.J.; Paul, B.K.; Islam, M.; Vigneswaran, D.; Uddin, M.S. Surface plasmon resonance based titanium coated biosensor for cancer cell detection. IEEE Photonics J. 2019, 11, 1–10. [Google Scholar] [CrossRef]
  37. Asaduzzaman, S.; Ahmed, K.; Bhuiyan, T.; Farah, T. Hybrid photonic crystal fiber in chemical sensing. SpringerPlus 2016, 5, 1–11. [Google Scholar] [CrossRef] [PubMed]
  38. El Hamzaoui, H.; Ouerdane, Y.; Bigot, L.; Bouwmans, G.; Capoen, B.; Boukenter, A.; Girard, S.; Bouazaoui, M. Sol-gel derived ionic copper-doped microstructured optical fiber: A potential selective ultraviolet radiation dosimeter. Opt. Express 2012, 20, 29751–29760. [Google Scholar] [CrossRef]
  39. Dabas, B.; Sinha, R. Dispersion characteristic of hexagonal and square lattice chalcogenide As2Se3 glass photonic crystal fiber. Opt. Commun. 2010, 283, 1331–1337. [Google Scholar] [CrossRef]
  40. Kumar, V.R.K.; George, A.; Reeves, W.; Knight, J.; Russell, P.S.J.; Omenetto, F.; Taylor, A. Extruded soft glass photonic crystal fiber for ultrabroad supercontinuum generation. Opt. Express 2002, 10, 1520–1525. [Google Scholar] [CrossRef]
  41. El-Amraoui, M.; Gadret, G.; Jules, J.; Fatome, J.; Fortier, C.; Désévédavy, F.; Skripatchev, I.; Messaddeq, Y.; Troles, J.; Brilland, L.; et al. Microstructured chalcogenide optical fibers from As 2 S 3 glass: Towards new IR broadband sources. Opt. Express 2010, 18, 26655–26665. [Google Scholar] [CrossRef]
  42. Talataisong, W.; Ismaeel, R.; Sandoghchi, S.R.; Rutirawut, T.; Topley, G.; Beresna, M.; Brambilla, G. Novel method for manufacturing optical fiber: Extrusion and drawing of microstructured polymer optical fibers from a 3D printer. Opt. Express 2018, 26, 32007–32013. [Google Scholar] [CrossRef]
  43. Atakaramians, S.; Afshar, S.; Ebendorff-Heidepriem, H.; Nagel, M.; Fischer, B.M.; Abbott, D.; Monro, T.M. THz porous fibers: Design, fabrication and experimental characterization. Opt. Express 2009, 17, 14053–14062. [Google Scholar] [CrossRef] [PubMed]
  44. Liu, Z.; Tam, H.Y. Fabrication and sensing applications of special microstructured optical fibers. In Selected Topics on Optical Fiber Technologies and Applications; Xu, F., Mou, C., Eds.; Intechopen: London, UK, 2017; pp. 1–20. [Google Scholar]
  45. Pysz, D.; Kujawa, I.; Stępień, R.; Klimczak, M.; Filipkowski, A.; Franczyk, M.; Kociszewski, L.; Buźniak, J.; Haraśny, K.; Buczyński, R. Stack and draw fabrication of soft glass microstructured fiber optics. Bull. Pol. Acad. Sci. Tech. Sci. 2014, 62, 667–682. [Google Scholar] [CrossRef]
  46. Cruz, A.L.; Cordeiro, C.; Franco, M.A. 3D printed hollow-core terahertz fibers. Fibers 2018, 6, 43. [Google Scholar] [CrossRef]
  47. Pysz, D.; Stepien, R.; Kujawa, I.; Kasztelanic, R.; Martynkien, T.; Berghmans, F.; Thienpont, H.; Buczynski, R. Development of silicate hollow core photonic crystal fiber. Photonics Lett. Pol. 2010, 2, 7–9. [Google Scholar]
  48. Mitrofanov, A.V.; Linik, Y.M.; Buczynski, R.; Pysz, D.; Lorenc, D.; Bugar, I.; Ivanov, A.A.; Alfimov, M.V.; Fedotov, A.B.; Zheltikov, A.M. Highly birefringent silicate glass photonic-crystal fiber with polarization-controlled frequency-shifted output: A promising fiber light source for nonlinear Raman microspectroscopy. Opt. Express 2006, 14, 10645–10651. [Google Scholar] [CrossRef] [PubMed]
  49. Russell, P. Photonic Crystal Fibers. Science 2003, 299, 358–362. [Google Scholar] [CrossRef]
  50. Islam, M.R.; Iftekher, A.; Noor, F.; Khan, M.R.H.; Reza, M.; Nishat, M.M. AZO-coated plasmonic PCF nanosensor for blood constituent detection in near-infrared and visible spectrum. Appl. Phys. A 2022, 128, 1–13. [Google Scholar] [CrossRef]
  51. Hossain, M.B.; Podder, E. Design and investigation of PCF-based blood components sensor in terahertz regime. Appl. Phys. A 2019, 125, 1–8. [Google Scholar] [CrossRef]
  52. Sokullu, E.; Cücük, Z.L.; Sarabi, M.R.; Birtek, M.T.; Bagheri, H.S.; Tasoglu, S. Microfluidic invasion chemotaxis platform for 3D neurovascular Co-culture. Fluids 2022, 7, 238. [Google Scholar] [CrossRef]
  53. Rezapour Sarabi, M.; Nakhjavani, S.A.; Tasoglu, S. 3D-Printed microneedles for point-of-care biosensing applications. Micromachines 2022, 13, 1099. [Google Scholar] [CrossRef]
Figure 1. The step-by-step process involved in designing and analyzing the model in this study.
Applsci 13 05784 g001
Figure 2. Meshing output with boundary condition for one-fourth of the PML layer computation window for the recommended PCF structure.
Applsci 13 05784 g002
Figure 3. Cross-section of the proposed wave-shaped hollow core PCF (HC-PCF). ( R 1 = 510 μ m, R 2 = 710 μ m, R 3 = 910 μ m, R 4 = 1110 μ m, R 5 = 1310 μ m, R 6 = 1510 μ m, T = 190 μ m, and D c = 1000 μ m.
Applsci 13 05784 g003
Figure 4. Inside the core of the envisioned HC-PCF, there is a field distribution of different cancer cell types. (a,b) adrenal gland cancer; x-pol, y-pol, (c,d) blood cancer; x-pol, y-pol.
Applsci 13 05784 g004
Figure 5. Frequency dependent relative sensitivity of adrenal glands cells, blood cells, breast cells type-1, breast cells type-2, cervical cells, and skin cells for strut width (a) S = 10 μ m (b) S = 20 μ m. (Dashed Lines (- - -) represent Normal State, Solid Lines (-) represent Cancerous State).
Applsci 13 05784 g005
Figure 6. The relation of EML, CL and birefringence with frequency for different cell types in both normal state and cancerous state (adrenal glands, blood, breast type 1, breast type 2, cervical, skin). (a) EML vs. frequency in x-polarization, (b) EML vs. frequency in y-polarization, (c) CL vs. frequency, and (d) birefringence vs. frequency. (Dashed Lines (- - -) represent Normal State, Solid Lines (-) represent Cancerous State).
Applsci 13 05784 g006
Figure 7. The frequency dependent effective area for different cell types in both normal state and cancerous state (adrenal glands, blood, breast type-1, breast type-2, cervical, skin) in (a) x-polarization, (b) y-polarization. (Dashed Lines (- - -) represent Normal State, Solid Lines (-) represent Cancerous State).
Applsci 13 05784 g007
Figure 8. Frequency corresponding dispersion for different cell types in both normal state and cancerous state (adrenal glands, blood, breast type-1, breast type-2, cervical, skin) (Dashed Lines (- - -) represent Normal State, Solid Lines (-) represent Cancerous State).
Applsci 13 05784 g008
Figure 9. The relation of numerical aperture with frequency for different cell types in both normal state and cancerous state (adrenal glands, blood, breast type-1, breast type-2, cervical, skin) in (a) x-polarization, (b) y-polarization. (Dashed Lines (- - -) represent Normal State, Solid Lines (-) represent Cancerous State).
Applsci 13 05784 g009
Figure 10. Nonlinear coefficient for different cell types in both normal state and cancerous state (adrenal glands, blood, breast type-1, breast type-2, cervical, skin) in (a) x-polarization, (b) y-polarization. (Dashed Lines (- - -) represent Normal State, Solid Lines (-) represent Cancerous State).
Applsci 13 05784 g010
Figure 11. The V-parameter variance with frequency for different cell types in both normal state and cancerous state (Adrenal Glands, Blood, Breast Type-1, Brest Type-2, Cervical, Skin) (Dashed Lines (- - -) represent Normal State, Solid Lines (-) represent Cancerous State).
Applsci 13 05784 g011
Figure 12. Spot size for different cell types in both normal state and cancerous state (adrenal glands, blood, breast type-1, breast type-2, cervical, skin) (Dashed Lines (- - -) represent Normal State, Solid Lines (-) represent Cancerous State).
Applsci 13 05784 g012
Figure 13. Beam divergence for different cell types in both normal state and cancerous state (adrenal glands, blood, breast type-1, breast type-2, cervical, skin) (Dashed Lines (- - -) represent Normal State, Solid Lines (-) represent Cancerous State).
Applsci 13 05784 g013
Figure 14. Schematic Diagram of this work for Cancer Cell Detection.
Applsci 13 05784 g014
Table 1. RI and concentration level of various cancer cell (breast, blood, skin, cervical, and adrenal glands) and corresponding normal cell [36].
Cancer TypeCell TypeRI of Normal Cell (Concentration Range 30–70%)RI of Cancerous Cell (Concentration Range 80%)
Breast (type 1)MBA-MD-2311.3851.399
Breast (type 2)MCF-71.3871.401
BloodJurkat1.3761.39
SkinBasal1.361.38
CervicalHeLA1.3681.392
Adrenal glandsPC-121.3811.395
Table 2. Table comparing the HC-PCF fiber we recommended with the previously described PCF.
Ref.Cancer CellFrequency /WavelengthRS (%)CL (dB/cm)EML (cm 1 )EA (m 2 )B
[22]Blood2.5 THz94.84 2 × 10 06 ---
Adrenal Gland2.5 THz95.15 2 × 10 06 ---
Breast Cancer Type-12.5 THz95.40 2 × 10 06 ---
Breast Cancer Type-22.5 THz95.51 2 × 10 06 ---
Cervical2.5 THz94.96 2 × 10 06 ---
Skin2.5 THz94.13 2 × 10 06 ---
[23]Blood2.5 THz98.40approximately 10 10 5.5 × 10 3 --
Adrenal Gland2.5 THz98.21approximately 10 10 5.5 × 10 3 --
Breast Cancer Type-12.5 THz98.34approximately 10 10 5.5 × 10 3 --
Breast Cancer Type-22.5 THz98.40approximately 10 10 5.5 × 10 3 --
Cervical2.5 THz98.12approximately 10 10 5.5 × 10 3 --
Skin2.5 THz97.95approximately 10 10 5.5 × 10 3 --
[24]Blood2 THz96.74 2.41 × 10 14 1.131 × 10 2 2.6 × 10 7 0.0006
Skin2.0 THz96.61 1.58 × 10 15 0.01131 2.61 × 10 7 0.0006
[25]Blood1.3 μ m89.15 7.26 × 10 12 2.33 × 10 7 6.0954 × 10 12 -
Breast Cancer Type-21.3 μ m89.53 2.06 × 10 11 2.37 × 10 7 6.0608 × 10 12 -
Cervical1.3 μ m89.22 5.88 × 10 12 2.34 × 10 7 6.089 × 10 12 -
Skin1.3 μ m88.78 1.16 × 10 11 2.29 × 10 7 6.1276 × 10 12 -
Proposed HC-PCFBlood3 THz99.92 6.1 × 10 10 8.96 × 10 5 4.23 × 10 7 > 1 × 10 9
Adrenal Gland2.5 THz99.92 6.1 × 10 10 8.55 × 10 5 4.22 × 10 7 1 × 10 9
Breast Cancer Type-12.5 THz99.93 6.1 × 10 10 8.24 × 10 5 4.21 × 10 7 > 1 × 10 9
Breast Cancer Type-22.5 THz99.93 6.1 × 10 10 8.09 × 10 5 4.21 × 10 7 > 1 × 10 9
Cervical2.5 THz99.92 6.1 × 10 10 8.79 × 10 5 4.23 × 10 7 > 1 × 10 9
Skin2.5 THz99.91 6.0 × 10 10 9.88 × 10 5 4.25 × 10 7 > 1 × 10 9
Table 3. The proposed HC-PCF sensor’s optical parameters for cancer cell detection at 3.0 THz.
AnalyteRS (%)CL (dB/cm)EML (cm 1 )EA (m 2 )B β NA
Adrenal Gland Cancer99.9277 6.1 × 10 10 8.55 × 10 5 4.22 × 10 7 1 × 10 9 0.01520.0865
Blood Cancer99.9243 6.1 × 10 10 8.96 × 10 5 4.23 × 10 7 > 1 × 10 9 0.01520.0864
Breast Cancer Type-199.9302 6.1 × 10 10 8.24 × 10 5 4.21 × 10 7 > 1 × 10 9 0.01520.0866
Breast Cancer Type-299.9314 6.1 × 10 10 8.09 × 10 5 4.21 × 10 7 > 1 × 10 9 0.01520.0866
Cervical Cancer99.9257 6.1 × 10 10 8.79 × 10 5 4.23 × 10 7 > 1 × 10 9 0.01520.0864
Skin Cancer99.9169 6.0 × 10 10 9.88 × 10 5 4.25 × 10 7 > 1 × 10 9 0.01530.0862
Disclaimer/Publisher’s Note: The statements, opinions and data contained in all publications are solely those of the individual author(s) and contributor(s) and not of MDPI and/or the editor(s). MDPI and/or the editor(s) disclaim responsibility for any injury to people or property resulting from any ideas, methods, instructions or products referred to in the content.