

Pushover Analysis in Seismic Engineering: A Detailed Chronology and Review of Techniques for Structural Assessment


Abstract
:1. Introduction
- Section 2: an examination of widely adopted nonlinear static analysis techniques.This section represents a comprehensive review of the most utilized nonlinear static analysis procedures, tracing their development and application in seismic studies.
- Section 3: an exploration of pushover analysis methods using first modal inertial/invariant single load vectors.This section represents an in-depth examination of pushover analysis methods that employ first modal inertial or invariant single load vectors, detailing their methodology and significance.
- Section 4: a study of pushover analysis with invariant multi-mode vectors.This section investigates the intricacies of pushover analysis techniques that utilize invariant multi-mode vectors, highlighting their unique features and applications.
- Section 5: an examination of adaptive load vector techniques.This section explores adaptive load vector methods, examining their adaptability and how they differ from traditional techniques.
- Section 6: an overview of research efforts assessing various pushover analysis approaches.This section is a summary of the extensive research initiatives undertaken to evaluate the effectiveness and applicability of different pushover analysis techniques.
- Section 6.1: a comparison between nonlinear static pushover analysis and nonlinear dynamic analysis techniques.This section details a comparative study highlighting the differences and similarities between nonlinear static pushover analysis methods and their dynamic counterparts.
- Section 7: an analytical discussion.This section engages in a critical discussion, exploring the methodologies, their strengths, potential limitations, and the implications of their findings within the broader context of seismic analysis.
- Section 8: final remarks and takeaways.
2. A Review of Commonly Used Nonlinear Static Analysis Procedures
- First modal inertia/invariant single load vectors (FEMA 356) pushover analysis:
- Distribution according to the fundamental mode shape:
- Inverted triangle distribution:
- The value of is given by:
- Load distribution as stipulated in FEMA 356 [8]:
- Uniform distribution of load pattern:
- 2.
- Invariant multi-mode vectors pushover analysis: In this procedure, different modes are combined [29]. Appropriate modes are identified and included in the analysis in a manner that aligns with the analysis undertaken. The following expression is generally applied in determining the distribution of the loads:
- 3.
- Adaptive load vectors: This is a method where the load pattern is not constant but changes and updates instantaneously during the analysis, based on the evolving response of the structure. The following expression is generally applied in determining the distribution of the loads.
3. The First Modal Inertial/Invariant Single Load Vectors Pushover Analysis Methods
3.1. The Capacity Spectrum Method (CSM) ATC 40 [5]
- Pushover analysis and conversion: execute a pushover analysis to chart the structure’s capacity curve, showcasing base shear, Vb, against the building’s roof displacement, Dt. Adapt this curve into acceleration-displacement (AD) metrics using the equivalent single degree of freedom (ESDOF) model. Utilize the first mode participation factor, C0, and the modal mass for the conversion: D* = D/C0 and A = Vb/M.
- Graphical representation: superimpose the derived capacity curve with the 5%-damped elastic response spectrum, ensuring both are in AD format.
- Deformation demand and pseudo-acceleration: opt for an initial peak deformation demand ‘dt’ and pinpoint its linked pseudo-acceleration A from the capacity curve, starting with a damping ratio ζ = 5.
- Ductility and damping calculation: Measure ductility using m = D*/uy and compute the hysteretic damping with ζh = 2(m − 1)/pm. Determine the equivalent damping ratio with ζeq = ζel + kζh, where k is a factor adjusting for the system’s hysteretic behavior. Refine the ‘dt’ estimate using the elastic demand curve for ζeq.
- Convergence check: Monitor the displacement ‘dt’ for stabilization. Once consistent, the target displacement for the multi-degree-of-freedom (MDOF) system is set as ‘dt = C0dt’.
- The equivalent linearization process necessitates an understanding of the displacement ductility ratio. The ATC-40 document outlines three iterative methods: procedures A, B, and C. While procedures A and B are clear and easily programmable, procedure C is a visual method not apt for coding. Specifics of these methods can be found in the ATC-40 [5] document and are omitted here for conciseness. The procedures are clearly defined in the [5] document. In his work [39], he also applied this methodology.
3.2. The Improved Capacity Spectrum Method
3.3. The N2 Method, Eurocode 8
- Pushover Analysis: perform the analysis to obtain the capacity curve represented in Vb–D terms.
- Conversion and approximation: Convert the pushover curve of the MDOF system into the capacity diagram of an ESDOF system. Approximate this curve with an idealized elastic-perfect plastic relationship to determine the period Te of the ESDOF.
- Target displacement calculation: the target displacement is computed as follows:
3.4. The Displacement Coefficient Method FEMA 356 [8], FEMA 440 [40], FEMA 273 [45] and ASCE 41 [7]
- Carry out a pushover analysis of the multi-degree-of-freedom system (MDOF) similar to 3.1(1). At this step, the eigenvalue analysis of the system is conducted to establish the modal properties of the system.
- The following relationship is then used to determine the target displacement.
3.5. The Improved Coefficient Method
3.6. The Energy-Based Pushover Analysis Method
- Model selection: choose a structural model based on the building’s characteristics and identify the dominant mode shape (ϕ) through modal analysis.
- Force application: apply lateral forces (Fk) according to the mode shape and mass (mi) distribution.
- Incremental loading: incrementally apply loads and measure displacements (djk) at each step.
- Equivalent SDOF system: calculate both the equivalent mass (m* = Σmi) and the base shear (F* = ΣFi).
- Displacement calculation: sum incremental displacements to find total equivalent displacement (δ* = Σ(Δδ)).
- Capacity curve construction: plot the capacity curve as base shear (F*) versus total equivalent displacement (δ*).
- Energy analysis: calculate the ductility ratio (μ* = δ*max/δ*y) and compute the energy term (Πx = 1/2F*yδ*y(2μ* − 1)).
- Assessment of limitations: review the obtained results, being aware of potential constraints, particularly when dealing with braced structures. The cumulative equivalent displacement, denoted as δ*, is determined by summing up all the incremental values of Δδ*. Figure 5 depicts the overall concept of this method
3.7. The N1 Method
3.8. The Mass Proportional Pushover Analysis
- Perform single nonlinear pushover analysis: carry out a single nonlinear pushover analysis of the structure with the lateral force distribution given by [m]g{1} = [w]{1}.
- Determine MDOF base shear force vs. roof displacement relationship: establish the relationship between the MDOF base shear force Vb and the roof displacement, ur, from the pushover analysis of the structure.
- Determine equivalent SDOF pseudo-acceleration vs. displacement relationship: calculate the equivalent SDOF pseudo-acceleration A versus displacement D relationship using the following relationships:
- Find maximum SDOF displacement Dmax: solve the equation with Fs/L = A to find the maximum SDOF displacement Dmax.
- Calculate maximum MDOF roof and floor lateral displacements: compute the maximum MDOF roof and floor lateral displacements of the structure using the following relationship:
3.9. The Modified First-Mode-Based Pushover Analysis
- Definition of the structure’s nonlinear model.
- Conducting an eigenvalue analysis on the structural model to determine the period and normalized mode shape.
- Apply the following relationship to determine the load pattern for the MFPA:
- 4.
- Conduct a static pushover analysis to get the Vb–Ur, which is later transferred to the idealized capacity curve.
- 5.
- Determine the target displacement value from the idealized pushover curve.
- 6.
- Establish the building’s performance estimate at the Maximum Considered Earthquake.
4. Invariant Multi-Mode Vectors Pushover Analysis
4.1. The Modal Pushover Analysis
- Compute the natural frequencies and modes of the building for linear elastic vibration.
- Perform nonlinear static analysis to develop the base shear-roof displacement pushover curve for each mode.
- Idealize the pushover curve as a bilinear curve, considering any negative post-yielding stiffness.
- Convert the pushover curve to the force-displacement relationship for the n-th mode inelastic SDF system.
- Calculate the peak deformation of the n-th mode SDF system using the force–deformation relationship and damping ratio, using the following second order differential equation.
- 6.
- Determine the peak roof displacement associated with the n-th mode SDF system. The following relationship applies:
- 7.
- Extract the desired responses from the pushover database at the roof displacement equal to the peak displacement.
- 8.
- Repeat Steps 3–7 for all modes.
- 9.
- Compute the dynamic response due to each mode by subtracting the contribution of gravity loads alone.
- 10.
- Combine the gravity response and peak modal responses using the complete quadratic combination (CQC) rule to obtain the total response. The following relationship applies:
4.2. Multi-Mode Pushover for Deformation Demand Estimates of Steel Moment-Resisting Frames
- Modal analysis: Perform a modal analysis to determine the natural frequencies, mode shapes, and modal participation factors of the structure. This can be done using a general-purpose nonlinear static analysis tool.
- Response spectrum: Obtain the response spectrum for the design earthquake. This spectrum represents the maximum response of the structure at different periods.
- Mode combination: Combine the modal responses to obtain the total response of the structure. The modal responses are combined using a modal combination rule, such as the complete quadratic combination (CQC) rule or the square root of the sum of squares (SRSS) rule.
- Target interstory drift: Estimate the target interstory drift, which is the maximum interstory drift that the structure is expected to experience during the earthquake. This can be done using one of three procedures: the modal pushover procedure (MPP), the adaptive capacity spectrum method (ACSM), or the multi-mode pushover procedure (MP3).
- Generalized force vectors: Calculate a set of generalized force vectors using the modal analysis results. These force vectors represent the instantaneous force distribution acting on the structure when the interstory drift at one story reaches its maximum value during dynamic response to the seismic excitation.
- Maximum response: determine the maximum value of each response parameter by taking the envelope of the results obtained from the generalized force vectors.
4.3. Improved Modal Pushover Analysis
- Initiate with first mode MPA: Begin with the initial steps (1–3) of the MPA method for the primary ‘mode’. The initial load pattern is determined by the lateral force distribution, represented as S1* = mϕ1.
- Determine displacement at yield: from the pushover analysis in the first step, ascertain the structure’s displacement vector, ψ1y, at its yielding point.
- Progress with an updated load pattern: From the point of structural yielding, extend the pushover analysis using a new load distribution S1y∗ = mϕ1y. This is the second-phase lateral load pattern. Utilize this updated curve and the subsequent Steps 4–7 of the MPA method to assess the structure’s behavior.
- Compute overall response (IMPA): Merge the primary ‘mode’ response from Step 3 with the responses of higher modes derived from the conventional MPA method. Combine using methods like the square root of the sum of squares (SRSS) or complete quadratic combination (CQC).
4.4. The Modified Modal Pushover Analysis
- Modal pushover analysis application: implement Steps 1–4 like those outlined in the standard modal pushover analysis.
- Determine peak deformation D1: For the primary mode’s inelastic single degree of freedom (SDF) system, compute D1 using parameters T1 and ζ1 [20]. This can be achieved via nonlinear response history analysis (RHA), an inelastic design spectrum, or specific empirical formulas.
- Ascertain peak roof displacement ur1: using the equation ur1 = Γ1ϕr1D1, calculate ur1 linked to the primary mode’s inelastic SDF system.
- Retrieve relevant responses: from the pushover data (from Step 2), extract response values r1 + g for the combined effects of gravity and lateral forces at a displacement of ur1 + urg.
- Calculate primary mode dynamic response r1: determine r1 using the relation r1 = r1 + g − rg, where rg represents the contribution from gravity loads.
- Evaluate higher-mode dynamic responses: For modes beyond the first, assume the system retains its elasticity and compute the dynamic responses. This mirrors the traditional modal analysis for a linear multi-degree-of-freedom (MDF) system, eliminating the need for extra pushover analyses and thus saving computational time. The number of modes to consider for accurate results varies based on the building’s height.
- Compute overall response (demand): integrate the gravity response with the peak ‘modal’ responses using the square root of the sum of squares (SRSS) rule: r≈max[rg ± Σnrn2], where r1 is derived from Step 5 and rn(n > 1) from Step 6.
4.5. The Generalized Pushover Analysis (GPA)
- Eigenvalue analysis: calculate natural frequencies ωn, modal vectors un, and modal participation factors Γn from eigenvalue analysis.
- Response spectrum analysis: obtain modal spectral amplitudes An, Dn from the corresponding linear elastic spectra.
- Calculate modal interstory drift ratios at the j-th story, Δj,max, and the maximum interstory drift ratio at the j-th story, Δj,max, from RSA.
- Generalized force vectors. Compute generalized force vectors fj that produce the maximum response Δj, as calculated from the expression below:
- 5.
- Generalized pushover analysis (GPA): Conduct N GPAs. In the j-th GPA (j = 1 − N), incrementally push the structure in the lateral direction with a force distribution proportional to fj.
4.6. The Consecutive Modal Pushover Analysis (CMP)
- Frequency and mode shape analysis: Conduct an eigen analysis on the linear elastic structure, focusing on the initial three modes. Ensure mode shapes are normalized such that the roof component, denoted as ϕn, is set to one.
- Determine lateral force distribution: calculate Sn∗ = mϕn, where Sn∗ represents the distribution of incremental lateral forces throughout the structure’s height for the nth stage.
- Total roof displacement calculation: ascertain the structure’s total target roof displacement, represented as δt.
- CMP analysis steps:
- For medium-rise structures, execute a single-stage pushover analysis using an inverted triangular load pattern. For taller structures, use a uniform force distribution. Continue until the roof’s control node reaches the predefined δt.
- Implement a two-stage pushover analysis, where the second stage starts from the end state of the first stage.
- For structures with a fundamental period of 2.2 s or more, conduct a three-stage pushover analysis. Each stage begins from the end state of the preceding stage.
- Determine the peak responses: From the earlier pushover analyses, calculate the peak values for targeted responses, such as displacements, drifts, and hinge rotations. Represent these peak values from the one-, two-, and three-stage analyses as r2, and r3 respectively.
- Calculate the overall peak responses:
- If T < 2.2 s, then r = max{r1,r2}.
- If T ≥ 2.2 s, then r = max{r1,r2,r3}.
- Sequential modal analysis note: The structure’s nonlinear behavior is intertwined with its response and is influenced by the loading path. In the CMP approach, modal pushover analyses should be sequentially executed, starting with the primary mode, and advancing to the subsequent ones, as detailed in [60].
4.7. Modified Consecutive Modal Pushover Analysis
- Carry out the initial steps, 1 and 2, as per the procedure explained in Section 4.6 above.
- Determine the total target displacement and increment. Calculate the values for the total target displacement and target displacement increment using the following relationships:
- 3.
- Apply gravity loads. Consider gravity loads as an initial condition for each pushover analysis.
- 4.
- Conduct a single-stage pushover analysis. Perform a pushover study employing a uniform lateral load distribution until the target displacement at the roof is reached.
- 5.
- Conduct a multi-stage pushover analysis. Determine the number of analysis stages, ns, using the following relationship:
- For the first stage, apply the initial distribution φ1s1* = mφ1 to the building to reach the displacement increment ur1 = β1δt.
- Continue the excitation with the incremental forces φ2, until the displacement increments at the roof equals ur2 = β2δ2 in the second stage.
- Perform the pushover analysis until the number of stages equals Ns and the displacement at the roof reaches the total target displacement δt.
- At each stage of the multi-stage analysis, the initial condition is the same as the state at the end of the previous stage.
- 6.
- Ascertain the peak values of seismic reactions. For both single-stage and multi-stage pushover analyses, determine the peak values of seismic reactions, such as displacements, story drifts, rotations of plastic hinges, and axial force of the braces.
- 7.
- Determine peak responses’ envelope. Calculate the envelope of peak responses, r, as follows:
4.8. Upper-Bound (UBPA) Pushover Analysis
- Build the selection and elastic properties. Select a building and determine its elastic structural properties, including natural frequencies and mode shapes. Normalize mode shape Φn such that the roof degree of freedom ϕrn = 1 for all modes.
- Calculate the upper-bound contribution of the second mode. Use the elastic response spectrum of the selected earthquake to determine the upper-bound of the contribution of the second mode (q2/q1)UB, as given by:
- 3.
- Determine the lateral load distribution vector. Compute the distribution vector of the lateral loads over the height of the building using:
- 4.
- Compute the target roof displacement Ur. Determine the target roof displacement Ur as per the expression:
- 5.
- Perform a pushover analysis. Conduct a pushover analysis using the lateral load calculated in Step 3 until the target displacement computed in Step 4 is reached (single-run analysis).
- 6.
- Extract the seismic responses. Determine the desired seismic responses (e.g., story drifts, element internal forces, etc.) at the step corresponding to the target displacement obtained from the single run in the previous step.
4.9. Modified and Extended Upper-Bound (MUB) Pushover Analysis
- Initial calculations: perform calculations as outlined in Steps 1 to 4 of Section 4.8 above.
- Pushover analyses: After applying gravity loads, conduct both the upper-bound pushover and conventional pushover analyses. Continue these analyses until the control node, located at the roof’s center of mass, reaches the target displacement determined in the previous step.
- For medium-rise unsymmetric-plan buildings, perform a conventional pushover analysis using an inverted triangular load pattern, and use a uniform force distribution for high-rise buildings until the target displacement is reached. For torsionally flexible systems, perform the conventional pushover analysis using the lateral force fs1, which is derived from Equation (30).
- Perform the upper-bound pushover analysis using the upper-bound lateral forces fsi derived from Equation (30) until the target displacement at the roof is reached.
- Determine the peak seismic demands. Calculate the peak values of the seismic demands individually for the upper-bound pushover and conventional pushover analyses. Denote the peak values obtained from these analyses by rfsi and r1, respectively.
- Determine the envelope of results. Calculate the envelope (r) of the results computed in the previous step as follows:
4.10. The Improved Upper-Bound (IUB) Pushover Analysis
- Initial calculations: perform Steps 1 to 3 in a similar way as outlined in Section 4.8 above.
- Define the lateral load distribution vector. Use the following relationship to define the distribution vector of the lateral forces over the height of the structural system:
- 3.
- Evaluate the target lateral displacement at roof. Evaluate the roof’s target lateral displacement, Ur, by applying the following relationship:
- 4.
- Perform pushover analysis. Use the lateral load determined in Step 2 to perform a pushover analysis of the structure until the target displacement, determined in Step 3, is reached (single-run analysis).
- 5.
- Identify seismic responses. Determine the relevant seismic responses at the step corresponding to the target displacement from the single run in the preceding phase. This includes parameters such as story drifts, element internal forces, etc.
4.11. The Extension of the Improved Upper-Bound Pushover Analysis Procedure (EIUB)
- Conduct an eigenvalue analysis. Conduct an eigenvalue analysis to compute the natural frequencies of the structure, ωn, and the mode shapes, ϕn, such that the lateral component of ϕn at the roof equals unity.
- Determine the upper-bound of mode contributions. Using the elastic response spectrum of the specified earthquake data, determine the upper-bound of the contribution of the 2nd and 3rd modes qi/q1, as described by the following relationship:
- 3.
- Calculate the lateral load distribution vector. Calculate the lateral load distribution vector throughout the building’s height using the following relationship:
- 4.
- Calculate the target roof displacement. Calculate the desired roof displacement Ur by applying either one of the following relationships:
- 5.
- Perform a pushover analysis. Perform a pushover analysis using the lateral load estimated in Step 3 until the target displacement calculated in Step 4 is reached (single-run analysis).
- 6.
- Determine the seismic responses. Determine the maximum values of the seismic responses from the single-run analysis conducted in step 5.
4.12. The Extended N2 Method
- Perform an elastic modal analysis of the building using a 3D mathematical model [66]. This analysis considers all relevant modes of vibration in each horizontal direction. The results of the modal analysis are normalized so that the roof displacement at the center of mass (CM) is equal to the target displacement obtained from the pushover analysis.
- Determine the seismic demand by applying correction factors to the results of the pushover analysis. Two sets of correction factors are used: one for displacements in plan and the other for story drifts along the elevation. The correction factors are determined separately for each horizontal direction and depend on the location in plan.
4.13. The Spectrum-Based Pushover Analysis (SPA) Method
- Modelling of the building and applying the seismic gravity loads.
- Eigenvalue analysis of the structure to compute the (ωn), Ti, (αi, βi, λi), values.
- Compute the force vector of different modes: calculate sn∗ = mϕn, where sn∗ represents the distribution of incremental lateral forces over the height of the structure for the nth stage of the multi-stage pushover analysis.
- Obtain the design spectrum and compute the target displacements. Obtain the design spectrum for the sites of interest or the mean spectrum of a series of ground motion data. Compute the target roof displacements of the structure for different modes uir0, the total roof displacement ur0, and contributions using Equations (26) and (27):
- 5.
- The spectrum-based pushover analysis procedure (SPA):
- 6.
- In the first stage, perform a nonlinear static pushover analysis using incremental lateral forces S1* = mϕ1 until the roof displacement reaches u1r = α1ur0. Obtain the peak response for this stage, noted by r1. In the second stage, apply incremental lateral forces S2* = mϕ2 until the roof displacement equals u2r = α2ur0. Note that the initial condition in this stage is the same as the state at the last step of analysis in the last stage. Obtain the peak response r2 for this stage. Repeat Step 5.2 for the remaining modes considered. For each ith step, the target displacement is uir = αiur0, and the initial condition remains consistent with the state at the end of the previous stage.
- 7.
- Envelop the peak response for each step: determine the maximum response from all stages using:
5. Adaptive Load Vectors
5.1. The Adaptive Pushover Analysis Method
- Eigenvalue analysis: perform an eigenvalue analysis using the stiffness matrix at the previous step.
- Displacement calculation: calculate the displacement profile for the current step based on the modal response. The following relationship is applied:
- 3.
- Displacement normalization: normalize the displacements obtained in the previous step to keep the top displacement proportional to the load factor by applying the following formula:
- 4.
- Load factor (λ) update: update the load factor and calculate the displacement vector based on the updated load factor.
- 5.
- Displacement application: apply the updated displacement to the structure and solve the system of equations.
- 6.
- Stiffness matrix update: calculate the updated stiffness matrix after the loading is applied.
- 7.
- Loop: return to the first step of the loop to proceed with the next step.
- 8.
- The flow chart in Figure 6 illustrates this procedure.
5.2. The Adaptive Modal Pushover Analysis (AMPA)
- Create a mathematical model: develop a comprehensive mathematical model of the structure.
- Define nonlinear relationships: establish the nonlinear force-deformation relationships of the structural components. This includes the initial stiffness, yield moment, and post-yield stiffness, or an encompassing force-deformation envelope.
- Compute the damped elastic spectrum: calculate the damped elastic response spectrum for site-specific ground motions, considering appropriate damping constants, such as 5% for reinforced concrete structures.
- Perform an eigenvalue analysis: Conduct an eigenvalue analysis to determine periods and eigenvalues. Compute the modal participation factors using:
- 5.
- Calculate the story forces for modes: compute the forces at each story level for each mode using:
- 6.
- Compute and combine the base shears: calculate the modal base shears Vj and combine them using the SRSS method to compute the building base shear V:
- 7.
- Scale story forces: uniformly scale the story forces by a scale factor Sn, expressed as:
- 8.
- Perform a static analysis for each mode: Conduct a static analysis using scaled incremental story forces for each mode independently. Ensure a bidirectional analysis for modes other than the fundamental mode.
- 9.
- Compute element responses: calculate the element forces, displacements, story drifts, and member rotations using the SRSS combination, updating the results of the previous step accordingly.
- 10.
- Check and update for yielding: At the end of each step, compare the member forces. If yielding is detected, recompute the member and global stiffness matrices and return to Step 4.
- 11.
- Iterative analysis: repeat the process until the maximum base shear or global drift exceeds a predetermined limit.
5.3. The Adaptive Modal Combination Method
- Modal property assessment: analyze the structure to determine its natural frequencies, mode shapes, and the modal participation factors based on its current state.
- Adaptive lateral load pattern construction: for each mode, devise an adaptive lateral load pattern using:
- 3.
- Energy-based incremental evaluation: determine the next step of the capacity curve for each ESDOF system using:
- 4.
- Inelastic response assessment: If the system exhibits inelastic behavior, approximate the global system ductility and post-yield stiffness ratio. A preliminary pushover analysis might be required to establish these parameters.
- 5.
- Generate capacity spectra: for the specific ground motion under consideration, produce capacity spectra in an acceleration-displacement response spectrum (ADRS) format.
- 6.
- Overlay the modal capacity curve with demand spectra: Plot the modal capacity curve alongside inelastic demand spectra. The intersection point represents the dynamic target for the pushover analysis, given by:
- 7.
- Extract the response parameters: at the step where the dynamic target point is achieved, retrieve the desired response parameters, such as displacements or member rotations.
- 8.
- Repeat the above steps for the necessary number of modes, typically the first few, for low to medium-rise buildings. Finally, combine the peak modal responses using an appropriate scheme, such as the square root of the sum of squares (SRSS), to determine the total response:
5.4. Adaptive Upper-Bound (AUB) Pushover Analysis
- Initialization: Begin with the model. Set the step to k = 0. Initialize the load factor Δλ and conduct an eigenvalue analysis. The upper-bound (UB) load vector is determined using the given Equation (54):
- 2.
- Target displacement calculation: using Equation (55), compute the predefined target displacement:
- 3.
- Load vector application: implement the newly determined load vector.
- 4.
- Displacement check: Examine if the roof displacement has reached the predefined target. If it has, the procedure ends; if not, proceed to the next step.
- 5.
- Frequency update: Check if there is a need to update the frequency due to yielding. If required, apply the UB lateral load pattern as per Equation (54).
- 6.
- Eigenvalue analysis: conduct an eigenvalue analysis using the updated stiffness (K) and mass (M) matrices.
- 7.
- Inelastic response spectrum construction: construct the inelastic response spectrum considering the current ductility ratio using Equation (56):
- 8.
- Determine values: Identify the values of Sd1k and Sd2k. Then, calculate the (q2/q1) (k) ratio using Equation (57):
- 9.
- Lateral load pattern calculation: determine the new lateral load pattern using Equation (58):
- 10.
- AUB lateral load pattern application: apply the AUB lateral load pattern as per Equation (59):
- 11.
- Iteration: return to Step 3 and repeat the process until the roof displacement meets the predefined target.
5.5. A Multi-Mode Adaptive Displacement-Based Pushover Analysis Procedure for Estimating the Seismic Demands of RC Moment-Resisting Frames (MADP)
- Create a structural mathematical model: develop a mathematical model of the structure that integrates the monotonic nonlinear behavior and degradation features of the structural components.
- Eigenvalue analysis and mode shapes: Conduct an eigenvalue analysis of the elastic building model to compute the natural frequencies ωn and the associated mode shapes ϕn. Normalize the mode shapes so that the roof component of ϕn equals unity (ϕnr = 1).
- Compute the lateral force distribution: calculate Sn = mϕn, where Sn represents the distribution of lateral forces across the structure’s height for the first stage of the multistage pushover analysis.
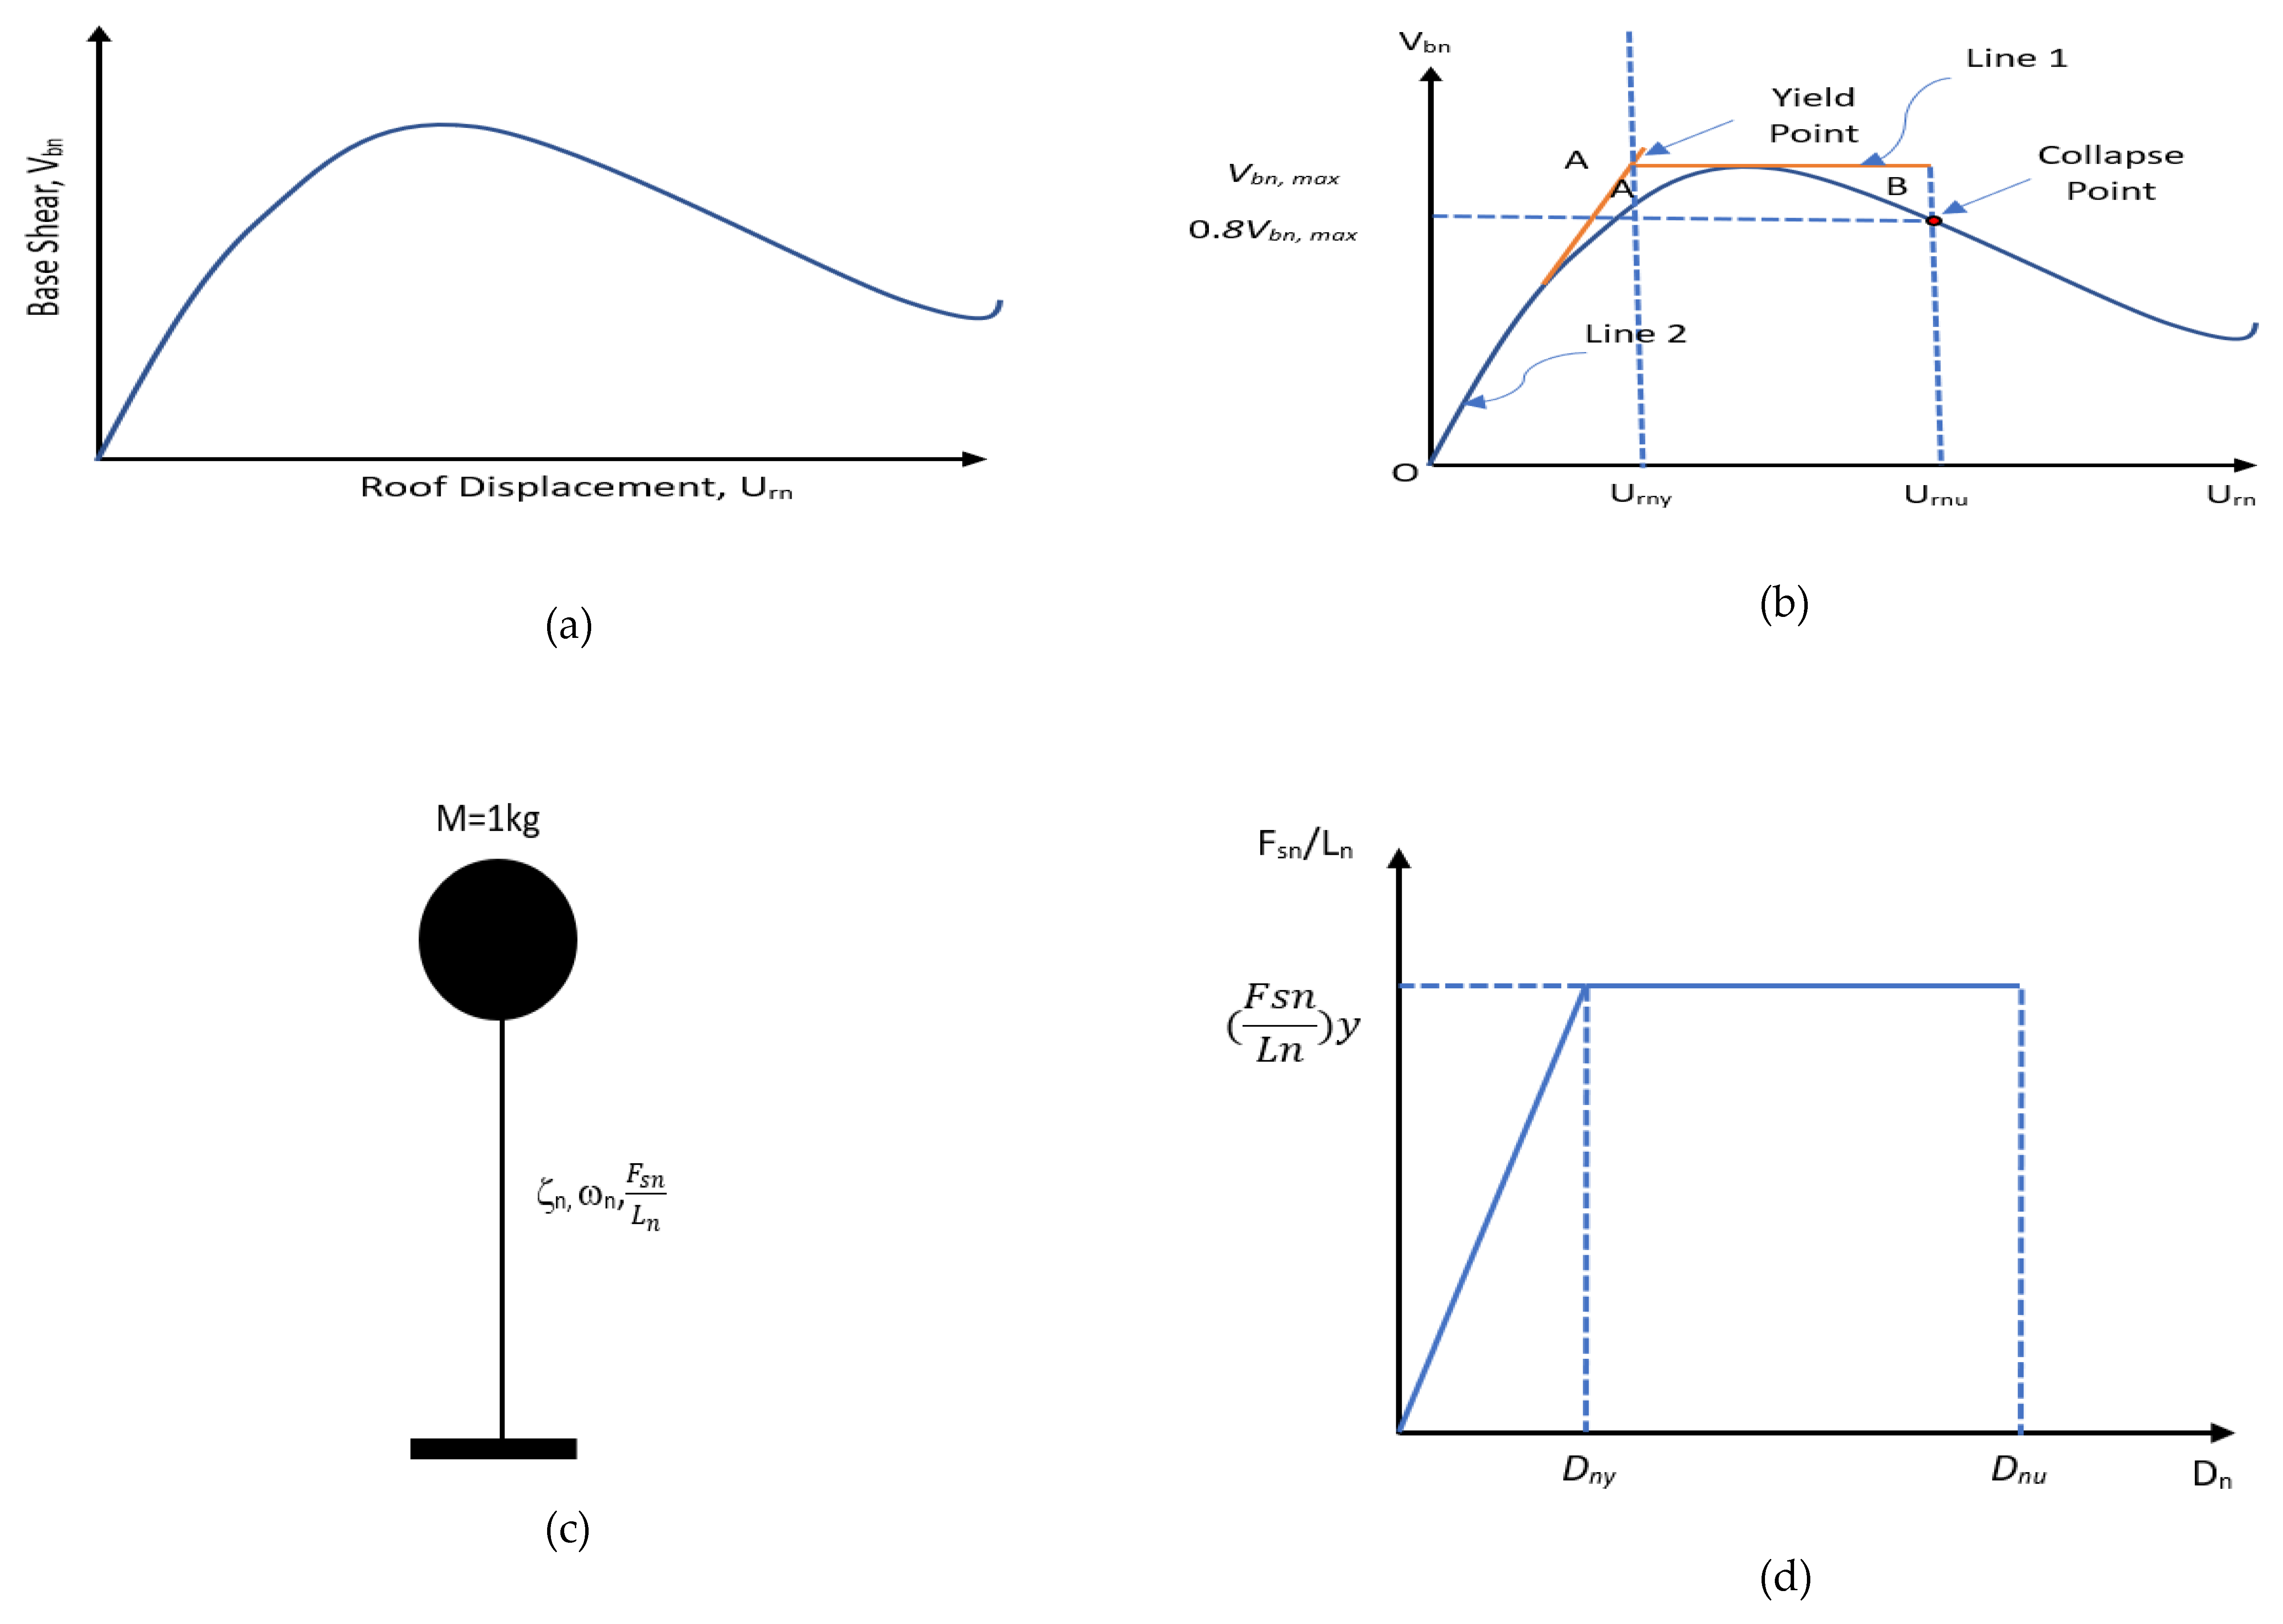
- Perform a nonlinear static analysis: Conduct a standard nonlinear static analysis using the lateral load pattern Sn = mϕn. From this analysis, determine the base shear-roof displacement (Sn − mϕUn) or pushover curve of the structure for the n-th mode. (See Figure 7a.)
- Idealize the pushover curve as bilinear: Draw a straight line (‘Line 1’ in Figure 7b) through the origin to match the elastic segment of the pushover curve. Draw a flat line (‘Line 2’ in Figure 7b) through the pushover curve at the maximum base-shear capacity, Vbn, max. The ultimate roof displacement, urnu, is assumed as a point of the pushover curve where a loss of 20% in base-shear capacity is observed (see Figure 7b).
- Determine the force–deformation relationship: calculate the force–deformation relationship (see Figure 7d) of the ‘nth-mode’ inelastic SDOF system based on the bilinear idealized pushover curve using the following relationships:
- 7.
- Construct the inelastic SDOF system: Create the ‘nth-mode’ inelastic SDOF system (see Figure 7c) with unit mass and a force-deformation relationship defined in Step 2. Assign a damping ratio equal to the value for the nth mode of the original MDOF structure (ζn).
- 8.
- Compute the peak deformation of the SDOF model:
- 9.
- Calculate the peak deformation of the SDOF model, Dn, using Equation (62), where Di is the absolute peak deformation for the ith ground motion record.
- 10.
- Calculate the target displacement for nth mode: determine the target displacement of the structure at the roof level for the nth mode, urnt, using Equation (63):
- 11.
- Perform adaptive multi-stage pushover analyses (the MADP procedure): Apply gravity loads and perform adaptive displacement–control pushover analyses. This involves multiple sub-steps, including calculating new lateral load patterns based on the formation of plastic hinges and updating the target displacement values (see Steps 10.1–10.5.4) [64].
- 12.
- Repeat for the essential modes: Repeat Steps 3–11 for as many modes as deemed necessary. Typically the first three modes of vibration are adequate for most common buildings.
- 13.
- Determine the final structural responses: combine the modal responses obtained from Step 12 using an appropriate modal combination rule, such as square root of the sum of squares (SRSS) or complete quadratic combination (CQC), as guided by references [37].
5.6. Optimal Mode Pushover Analysis
- Define the objective function. Define the objective function using specified constraints and variables.
- Compute a variant load pattern. Calculate a variant load pattern and optimally determine a representative single-DOF system (R-SDOF).
- Determine the building’s capacity curve. Establish the building’s capacity curve and calculate a story force distribution based on the building’s vibration properties. Use this distribution to push the building until a plastic hinge develops [5].
- Capacity curve degradation: As the capacity curve degrades, new vibration properties of the degraded building are determined. Each time a yield stage is reached, this is treated as a ‘new’ building [5].
- Analysis at different stages of degradation. Perform building analysis at various stages of degradation. This considers modes of vibration of the yielded building, which may have multiple yield mechanisms, in the final target displacement prediction.
- Implement an optimization algorithm. Develop an optimization algorithm to minimize the target displacement error between the pushover and nonlinear time history analyses of a few buildings for a specific ground record [8].
- Determine optimal parameters. Determine optimal capacity and demand parameters. Use these parameters to combine the individual mode shapes from each stage of yielding into a single overall response spectrum for the structure. This integrated response spectrum can then be used to assess the performance and safety of the structure under various loading conditions.
6. A Summary of Research Initiatives on Evaluating Different Pushover Analysis Techniques
6.1. A Comparison of Nonlinear Static Pushover Analysis Methods and Nonlinear Dynamic Analysis Methods
7. Discussion
7.1. The First Modal Inertial Pushover Analysis Methods
- The capacity spectrum method (CSM). It is a graphical tool in seismic analysis that visually represents the supply-demand equation, accommodating multiple limit states on a structure’s load-displacement curve. It is simpler and faster than other methods, making it efficient for evaluating a structure’s earthquake resilience. While it can enhance result accuracy by providing larger seismic demand estimates, it has drawbacks: it uses highly damped elastic spectra, which may not accurately reflect inelastic systems’ responses, and it may overestimate seismic demands in irregular, multi-story concrete buildings.
- The improved capacity spectrum method (ICSM) represents an advancement over the traditional capacity spectrum method by introducing new formulas for effective period and damping, as well as iterative procedures for determining target displacement and setting strength limitations. A notable feature of ICSM is its integration of constant-ductility inelastic design spectra, which aligns a structure’s capacity more closely with its inelastic spectrum. This method enhances the accuracy and realism in seismic performance evaluations but also adds complexity due to its iterative nature and the need for precise input parameters. While it offers a more accurate representation of seismic behavior, the increased complexity and reliance on accurate data may pose challenges in practical applications.
- The N2 method uses time-independent lateral displacement shapes and an inelastic response spectrum approximating structural and ground motion characteristics. While simple and useful for a range of buildings, including those with irregularities, it faces limitations in predicting seismic demands for structures influenced by higher modes and is less effective for torsionally flexible or high-rise buildings. The method’s reliance on idealized spectra can also lead to inaccuracies in representing real structural behavior.
- The displacement coefficient method (DCM), introduced in FEMA 273 and later incorporated into FEMA 356, is unique in nonlinear static procedures (NSPs) for its direct estimation of peak inelastic displacements using modifying factors and its approach of calculating displacement coefficients for each mode of vibration. This method enhances the accuracy in predicting inelastic behavior and determining control-node/target displacements in NSPs. However, DCM faces challenges with less accuracy when applied to irregular or highly nonlinear structures and the complexity of calculating displacement coefficients for each vibration mode, which can limit its applicability in certain seismic scenarios or structural types.
- The improved coefficient method, as an advanced version of the coefficient method, uniquely estimates maximum forces and displacements in nonlinear static analysis, focusing on roof displacement to assess structural response. ICM offers more precise estimates of frame roof displacement and base shear than other methods, with a user-friendly approach that enhances design and evaluation processes and enables easy parametric studies. However, its accuracy declines for local response measures like story drifts, and it may introduce errors due to partial plastic mechanisms. Additionally, its reliance on highly damped elastic spectra for seismic demand estimation might not accurately represent the dynamic response of inelastic systems.
- The energy-based pushover analysis enhances nonlinear static analysis by integrating inertial properties and kinetic energy, making it particularly apt for seismic scenarios. It utilizes the fundamental mode shape, effective damping, and a velocity profile to represent a structure’s dynamic behavior, offering deep insights into kinetic energy dissipation through plastic behavior. However, its effectiveness is limited for certain structural types, particularly braced structures, indicating a constraint in its applicability across different architectural designs. Despite this, the method stands out for its ability to merge dynamic aspects into static analysis, providing a more nuanced understanding of seismic impact on structures.
- The N1 method stands out for not requiring a well-defined equivalent single-degree-of-freedom (SDOF) system, facilitating its use in practical structures. It evaluates displacement demand using response spectrum analysis and adjusts for nonlinear behavior, offering accuracy comparable to the N2 method for certain load distributions. While effective for irregular or high-rise buildings by considering higher modes, the N1 method is primarily suitable for low-rise buildings and less effective for high-rise or torsionally flexible plan-asymmetric structures. A significant limitation is its inability to accurately predict seismic demands in structures heavily influenced by higher modes, owing to its limited capture of these effects.
- The mass proportional pushover (MPP) procedure, introduced by Kim and Kurama, simplifies pushover analysis for estimating peak seismic lateral displacement demands. This method stands out by removing the need for complex modal analysis or combination, even when higher-mode effects are significant. Its main advantage lies in conducting a single pushover analysis with lateral forces distributed in proportion to the seismic masses at different levels of the structure, effectively consolidating higher-mode effects into one invariant distribution. This unique approach not only streamlines the estimation of displacement demands but also enhances practicality and efficiency in seismic analysis, particularly for structures where higher-mode influences are crucial.
7.2. The Invariant Multi-Mode Vectors Pushover Analysis
- The modal pushover analysis (MPA) is distinguished by its inclusion of higher modes in estimating seismic demands, offering more accuracy than traditional pushover methods and a precision akin to nonlinear response history analysis for inelastic range responses. Particularly effective for irregular structures, MPA outperforms adaptive pushover analysis in drift profiles and capacity determination, and it accurately captures phenomena in structures with strength irregularities. While simpler than adaptive pushover methods, it is especially adept at estimating demands for unsymmetrical-plan buildings. However, MPA may fall short in accuracy compared to dynamic analysis for buildings with a strong first story or lower half and might inaccurately estimate seismic demands in vertically irregular frames. It also requires incorporating enough modes to accurately estimate story drifts in such structures, highlighting a balance between its advanced capabilities and inherent limitations.
- The multi-mode pushover procedure, designed for steel moment-resisting frames, excels in estimating deformation demands during seismic events. This method distinguishes itself by accurately predicting seismic demands through the calculation of the target interstory drift and the use of modal combinations, considering the frequency content, higher-mode effects, and the interactions between modes. Its ability to provide superior response predictions with minimal computational effort marks a significant advantage, especially in practical engineering applications where efficiency is key. The focus on a comprehensive range of seismic influences ensures more precise deformation demand predictions, enhancing the structural resilience against seismic events. While the specific limitations of this method are not detailed, general challenges could include accurately capturing complex seismic interactions in various structural forms and the need for precise parameter considerations to maintain its effectiveness in diverse seismic scenarios.
- The improved modal pushover analysis (IMPA) method advances beyond the standard modal pushover analysis (MPA) by incorporating the redistribution of inertia forces following the yielding of structures, a significant deviation from MPA’s invariant multi-mode lateral load patterns. Its primary enhancement lies in using the post-yielding structural deflection shape as an invariant lateral load pattern, offering a more accurate reflection of dynamic behavior during seismic events. To balance computational efficiency with accuracy, IMPA employs a two-phase lateral load distribution for the first mode and retains the MPA approach for higher modes. This method represents a sophisticated approach in seismic analysis, aiming to achieve a practical yet precise evaluation of structural responses under seismic loading. However, it might entail complexities in execution due to its advanced analytical requirements.
- The modified modal pushover analysis (MMPA), developed by simplifies seismic demand estimation in frame buildings, assumes that higher vibration modes remain elastic, thereby reducing computational efforts compared to traditional modal pushover analysis (MPA). MMPA often yields larger, more accurate demand estimates, particularly where MPA underestimates, but it can lead to increased conservatism if MPA already overestimates demand. Its primary limitation lies in lightly damped systems (less than 5% damping), where its linear elastic assumption for higher modes might not accurately represent inelastic behavior, potentially resulting in demand overestimation. The method’s accuracy is also notably sensitive to the specific characteristics of buildings and ground motions, making its applicability variable depending on structural details and seismic conditions.
- Generalized pushover analysis (GPA) offers a balance between simplicity and accuracy. GPA utilizes generalized force vectors target deformation demands and generates an envelope of results. It is suitable for preliminary design and design review but limited to elastic behavior and higher-mode consideration.
- The upper-bound pushover analysis method, integrating aspects of the capacity spectrum method, energy balance, and modified modal pushover analysis, uniquely considers higher-mode effects in the nonlinear seismic evaluation of planar building frames, using a single load vector combining the first and a factored second mode shape. This method excels in predicting seismic demands in high-rise buildings, where higher-mode effects are significant, and offers a simplified procedure that yields more accurate nonlinear response estimates, applicable to both new and existing medium high-rise buildings. However, it tends to underestimate nonlinear responses at lower levels while overestimating them at higher levels in medium high-rise structures. Its accuracy may falter, particularly in irregular structures, and it is unsuitable for torsional flexible plan-asymmetric irregular structures. Additionally, the method overlooks variations in inertial load patterns and dynamic responses due to degrading strength and stiffness and does not account for other energy dissipation sources such as duration effects, viscous damping, and kinetic energy.
- The modified and extended upper-bound (MUB) pushover analysis method emerges as an advanced and versatile approach to estimating seismic demands for tall buildings. It seamlessly combines the advantages of the UB pushover method (higher-mode consideration) and the conventional pushover method (accurate lower-level demands) to provide a more balanced and accurate assessment. Its adaptability to various building configurations, including symmetric and unsymmetrical plans, makes it a valuable tool for a broad spectrum of structures. However, it is important to be mindful of its simplifying assumptions and ensure adequate data availability for a comprehensive analysis.
- The improved upper-bound (IUB) pushover analysis refines the lateral load pattern, resulting in more accurate predictions of roof displacements, story drift ratios, and plastic hinge rotations for tall buildings. It is more complex to implement than conventional pushover analysis but provides more reliable results. Its effectiveness and potential for improving seismic behavior prediction have been demonstrated through testing on various steel buildings.
- The extension of the improved upper-bound pushover analysis procedure (EIUB) extends the capabilities of conventional IUB to accurately predict the seismic response of irregular structures with setbacks. It incorporates a third mode of vibration to account for the irregularity characteristic, resulting in improved predictions of roof displacements, story drift ratios, and plastic hinge rotations for irregular buildings. However, its complexity and data requirements make it more suitable for advanced engineering analyses.
- The extended N2 method stands out as a refined version of the conventional N2 method, leveraging its strengths to enhance the accuracy of seismic demand estimation. Its unique feature lies in the integration of results from both basic pushover analysis and standard elastic modal analysis, providing a more reliable assessment of seismic demand distribution throughout the structure. This approach particularly excels in predicting seismic demand at the upper part of the building and at flexible edges, where the conventional N2 method may fall short. However, its complexity and data requirements make it more suitable for advanced engineering analyses compared to the conventional N2 method.
- Spectrum-based pushover analysis (SPA) utilizes response spectra to estimate seismic demand in tall buildings. It offers a balance between simplicity and accuracy, making it suitable for preliminary design and design review purposes. SPA’s key features include response spectra integration, simplified pushover analysis, and the generation of an envelope of results. However, its simplifying assumptions, limited consideration of higher modes, and overestimation of lower-level demands limit its applicability.
7.3. Adaptive Load Vectors
- Adaptive pushover analysis allows for the application of exact force profiles calculated by modal analysis at every step, resulting in a more realistic response that is consistent with the expected system behavior under seismic loading. Adaptive pushover analysis is often more accurate than conventional methods in determining the drift profiles and capacity of irregular structures. However, it may require greater computational efforts for calculating the response at discrete times.
- Adaptive modal pushover analysis (AMPA) is an advanced pushover analysis method that enhances seismic demand estimation through iterative modal load pattern updates based on the structure’s deformed shape. This approach improves accuracy, particularly for taller buildings with complex geometries, but requires higher computational efforts and detailed structural information.
- The adaptive modal combination method (AMC) enhances the precision of seismic demand estimation by dynamically updating the target displacements using energy-based modal capacity curves and constant-ductility capacity spectra. AMC eliminates the need for pre-estimating the target displacement, a limitation of conventional pushover analysis. It accounts for instantaneous inertia force distributions during seismic events, making it more accurate for tall buildings with complex geometries and irregularities. However, its complexity and data requirements make it more suitable for advanced engineering analyses compared to conventional pushover analysis.
- Adaptive upper-bound (AUB) pushover analysis refines the accuracy of seismic demand estimation for tall buildings by considering higher-mode effects and dynamically updating the load pattern based on the structure’s deformed shape. This approach improves the accuracy of predictions, particularly for taller buildings with complex geometries, but requires more detailed structural information and computational resources compared to conventional pushover analysis.
- Multi-mode adaptive displacement-based pushover (MADP) combines the strengths of both multi-modal and adaptive pushover approaches. It considers higher-mode effects and structural changes to provide a more comprehensive and realistic assessment of seismic demand. MADP utilizes the structure’s first-mode inelastic mode shape to accurately estimate the target displacement, making it particularly useful for assessing the seismic performance of RC moment-resisting frames. However, its complexity and data requirements make it more suitable for advanced engineering analyses.
- Optimal mode pushover analysis (OMPA) is a dynamic seismic analysis method that continuously adjusts based on the building’s evolving vibration properties during a simulation. It utilizes an “optimal” vibration shape for the building in each step, forming the basis for a simplified vibration model. Lateral forces are applied until yielding events occur, and the building’s stiffness and vibration properties are recalculated after each yielding event. This iterative method provides more comprehensive and accurate seismic demand estimates, particularly for structures with complex geometries. However, OMPC’s complexity and data requirements make it more suitable for advanced engineering analyses.
8. Conclusions
- A diverse range of buildings could be examined using refined seismic assessment techniques.
- The outcomes of pre-seismic evaluations, possibly using digital tools, can be juxtaposed with post-seismic data to ascertain the accuracy of the pushover analysis methods.
- Advanced computational techniques, such as machine learning algorithms, can be integrated with post-seismic building evaluation data to rectify the limitations of traditional pushover analysis methods.
Author Contributions
Funding
Institutional Review Board Statement
Informed Consent Statement
Data Availability Statement
Conflicts of Interest
References
- Singh, R.; Awadhiya, G.P. Pushover Analysis of Multistorey Building. Master’s Thesis, Delhi College of Engineering, Delhi, India, 2008. [Google Scholar]
- Shehu, R. Implementation of Pushover Analysis for Seismic Assessment of Masonry Towers: Issues and Practical Recommendations. Buildings 2021, 11, 71. [Google Scholar] [CrossRef]
- Bektaş, N.; Kegyes-Brassai, O. Conventional RVS Methods for Seismic Risk Assessment for Estimating the Current Situation of Existing Buildings: A State-of-the-Art Review. Sustainability 2022, 14, 2583. [Google Scholar] [CrossRef]
- Zameeruddin, M.; Sangle, K.K. Performance-based Seismic Assessment of Reinforced Concrete Moment Resisting Frame. J. King Saud Univ. Eng. Sci. 2021, 33, 153–165. [Google Scholar] [CrossRef]
- Applied Technology Council. Seismic Evaluation and Retrofit of Concrete Buildings; aTe Applied Technology Council Proposition 122 Seismic Retrofit Practices Improvement Program; California Seismic Safety Commission: Redwood City, CA, USA, 1996; Volume 1, Available online: www.4downloader.ir (accessed on 14 August 2023).
- British Standards Institution. Eurocode 8: Design of Structures for Earthquake Resistance; British Standards Institution: Milton Keynes, UK, 2005. [Google Scholar]
- American Society of Civil Engineers; American Society of Civil Engineers and Structural Engineering Institute. Seismic Evaluation and Retrofit of Existing Buildings: ASCE/SEI, 41-17; American Society of Civil Engineers: Reston, VA, USA, 2017. [Google Scholar]
- Federal Emergency Management Agency. FEMA356/November 2000 Pre-Standard and Commentary for the Seismic Rehabilitation of Buildings; Federal Emergency Management Agency: Washington, DC, USA, 2000.
- Ministry of Land, Infrastructure, Transport and Tourism. White Paper on Land, Infrastructure, Transport and Tourism, Japan; Ministry of Land, Infrastructure, Transport and Tourism: Tokyo, Japan, 2019.
- Ferraioli, M.; Lavino, A. Irregularity Effects of Masonry Infills on Nonlinear Seismic Behaviour of RC Buildings. Math. Probl. Eng. 2020, 2020, 4086320. [Google Scholar] [CrossRef]
- Bisch, P.; Carvalho, E.; Degee, H.; Fajfar, P.; Fardis, M.; Franchin, P.; Kreslin, M.; Pecker, A.; Pinto, P.; Plumier, A.; et al. Eurocode 8: Seismic Design of Buildings Worked Examples Support to the Implementation, Harmonization and Further Development of the Eurocodes; Publications Office of the European Union: Luxembourg, 2012. [Google Scholar] [CrossRef]
- Gupta, A.K. Response Spectrum Method in Seismic Analysis and Design of Structures; Routledge: New York, NY, USA, 1990; pp. 1–170. [Google Scholar] [CrossRef]
- Chopra, A.K.; Goel, R.K. Evaluation of NSP to Estimate Seismic Deformation: SDF Systems. J. Struct. Eng. 2000, 126, 482–490. [Google Scholar] [CrossRef]
- Abass, H.A.; Jarallah, H.K. Comparative Study of the Seismic Assessment according to ATC-40, FEMA-356 and FEMA-440 for Existing Hospital Building Located at Baghdad City. Available online: https://www.acapublishing.com/dosyalar/baski/PACE_2021_342.pdf (accessed on 17 November 2022).
- Benavent-Climent, A.; Escolano-Margarit, D. Shaking table tests of structures with hysteretic dampers: Experimental results versus prediction using non-linear static methods. Bull. Earthq. Eng. 2012, 10, 1857–1883. [Google Scholar] [CrossRef]
- Kalkan, E.; Kunnath, S.K. Assessment of current nonlinear static procedures for seismic evaluation of buildings. Eng. Struct. 2007, 29, 305–316. [Google Scholar] [CrossRef]
- Paret, T.F.; Sasaki, K.K.; Eilbeck, D.H.; Freeman, S.A. Approximate Inelastic Procedures to Identify Failure Mechanisms From Higher Mode Effects. Paper No. 966; In Eleventh World Conference on Earthquake Engineering; Elseviser: Amsterdam, The Netherlands, 1996. [Google Scholar]
- Chopra, A.K.; Goel, R.K.; Chintanapakdee, C. Evaluation of a Modified MPA Procedure Assuming Higher Modes as Elastic to Estimate Seismic Demands. Earthq. Spectra 2004, 20, 757–778. [Google Scholar] [CrossRef]
- Jan, T.S.; Liu, M.W.; Kao, Y.C. An upper-bound pushover analysis procedure for estimating the seismic demands of high-rise buildings. Eng. Struct. 2004, 26, 117–128. [Google Scholar] [CrossRef]
- Lin, J.-L.; Tsaur, C.-C.; Tsai, K.-C. Two-degree-of-freedom modal response history analysis of buildings with specific vertical irregularities. Eng. Struct. 2019, 184, 505–523. [Google Scholar] [CrossRef]
- Jun, D.-H.; Kang, H.-G. Nonlinear Response Analysis of Multistory Buildings Subjected to Synthetic Motions Compatible with Design Spectrum. In Proceedings of the 15th World Conference on Earthquake Engineering, Lisbon, Portugal, 24–28 September 2012. [Google Scholar]
- Lima, C.; Martinelli, E.; Faella, C. Simplified Nonlinear Static Procedures for Seismic Assessment of Masonry Infilled RC Structures Confinement of Masonry Columns with FRP Materials View Project International Journal of Structural Glass and Advanced Materials Research View Project. Available online: https://www.researchgate.net/publication/320034814 (accessed on 3 July 2023).
- Jalayer, F.; Cornell, C.A. Alternative non-linear demand estimation methods for probability-based seismic assessments. Earthq. Eng. Struct. Dyn. 2009, 38, 951–972. [Google Scholar] [CrossRef]
- Gupta, B.; Kunnath, S.K. Adaptive Spectra-Based Pushover Procedure for Seismic Evaluation of Structures. Earthq. Spectra 2000, 16, 367–391. [Google Scholar] [CrossRef]
- Papanikolaou, V.K.; Elnashai, A.S.; Pareja, J.F. Evaluation of Conventional and Adaptive Pushover Analysis Ii: Comparative Results. J. Earthq. Eng. 2006, 10, 127–151. [Google Scholar] [CrossRef]
- Antoniou, S.; Pinho, R. Development and Verification of a Displacement-Based Adaptive Pushover Procedure. J. Earthq. Eng. 2004, 8, 643–661. [Google Scholar] [CrossRef]
- Deierlein, G.G.; Reinhorn, A.M.; Willford, M.R. Nonlinear Structural Analysis for Seismic Design a Guide for Practicing Engineers. Available online: www.curee.org (accessed on 22 October 2022).
- Themelis, S. Pushover Analysis for Seismic Assessment and Design of Structures. 2008. Available online: http://www.ros.hw.ac.uk/handle/10399/2170 (accessed on 22 October 2022).
- Fajfar, P. Analysis in seismic provisions for buildings: Past, present and future. The fifth Prof. Nicholas Ambraseys lecture. Bull. Earthq. Eng. 2018, 16, 2567–2608. [Google Scholar] [CrossRef]
- Bracci, J.M.; Kunnath, S.K.; Reinhorn, A.M. Seismic Performance and Retrofit Evaluation of Reinforced Concrete Structures. J. Struct. Eng. 1997, 123, 3–10. [Google Scholar] [CrossRef]
- Antoniou, S. Advanced Inelastic Static Analysis for Seismic Assessment of Structures. Ph.D. Thesis, Imperial College London, London, UK, 2002. [Google Scholar]
- Khan, M.A. Performance-Based Design and Retrofit Methods for Buildings. In Earthquake-Resistant Structures; Elsevier: Amsterdam, The Netherlands, 2013; pp. 317–351. [Google Scholar] [CrossRef]
- Bektaş, N.; Kegyes-Brassai, O. A comparative study of rapid visual screening methods to detailed seismic assessment of a reinforced concrete residential building. In Proceedings of the 3rd European Conference on Earthquake Engineering & Seismology, Bucharest, Romania, 4–9 September 2022. [Google Scholar]
- Ghobarah, A. Performance-based design in earthquake engineering: State of development. Eng. Struct. 2001, 23, 878–884. [Google Scholar] [CrossRef]
- Freeman, S.A.; Nicoletti, J.P.; Tyrell, J.V. Evaluations of existing buildings for seismic risk—a case study of Puget Sound Naval Shipyard. In Proceedings of the U.S. National Conference on Earthquake Engineering, Oakland, CA, USA, 18–20 June 1975; pp. 113–122. [Google Scholar]
- Freeman, S.A. Review of the Development of the Capacity Spectrum Method. ISET J. Earthq.Technol. 2004, 41, 1–13. [Google Scholar]
- Comartin, C.D.; Niewiarowski, R.W.; Freeman, S.A.; Turner, F.M.; Comartin, R.W.N.C.D.; Gajan, S.; Raychowdhury, P.; Hutchinson, T.C.; Kutter, B.L.; Stewart, J.P. Seismic Evaluation and Retrofit of Concrete Buildings: A Practical Overview of the ATC 40 Document. Earthq. Spectra 2000, 16, 241–261. [Google Scholar] [CrossRef]
- Aşıkoğlu, A.; Vasconcelos, G.; Lourenço, P.B. Overview on the Nonlinear Static Procedures and Performance-Based Approach on Modern Unreinforced Masonry Buildings with Structural Irregularity. Buildings 2021, 11, 147. [Google Scholar] [CrossRef]
- Kuria, K.K.; Kegyes-Brassai, O.K. Nonlinear Static Analysis for Seismic Evaluation of Existing RC Hospital Building. Appl. Sci. 2023, 13, 11626. [Google Scholar] [CrossRef]
- FEMA. Improvement of Nonlinear Static Seismic Analysis Procedures FEMA 440; Applied Technology Council: Redwood City, CA, USA, 2005. [Google Scholar]
- Goel, R.K. Evaluation of Current Nonlinear Static Procedures Using Strong Motion Records. In SMIP07 Seminar on Utilization of Strong-Motion Data; 2007; pp. 57–80. [Google Scholar]
- EN 1998-1; Eurocode 8: Design of Structures for Earthquake Resistance—Part 1: General Rules, Seismic Actions and Rules for Buildings. British Standard Institution: Milton Keynes, UK, 2004.
- Peter, F. N2-A Method for Nonlinear Seismic Analysis of Regular Buildings. In Proceedings of the Ninth World Conference on Earthquake Engineering, Tokyo, Japan, 2–9 August 1988. [Google Scholar]
- Fajfar, P. A Nonlinear Analysis Method for Performance-Based Seismic Design. Earthq. Spectra 2000, 16, 573–592. [Google Scholar] [CrossRef]
- Seminar, C.H. Nehrp Guidelines for the Seismic Rehabilitation of Buildings (FEMA 273); Federal Emergency Management Agency: Washington, DC, USA, 1997.
- Hernández-Montes, E.; Kwon, O.-S.; Aschheim, M.A. An Energy-Based Formulation for First-and Multiple-Mode Nonlinear Static (Pushover) Analyses. J. Earthq. Eng. 2004, 8, 69–88. [Google Scholar] [CrossRef]
- Mendes Pontes, A.R. The Forests of Maraca, Northern Brazilian Amazonia: Their Structure, Phenology, Fruit Assessment and an Illustrative Guide to Their Fruit; Editora da Universidade Federal de Pernambuco: Vitória de Santo Antão, Brazil, 2013. [Google Scholar]
- Kotanidis, C.; Doudoumis, I.N. Energy-Based Approach of Static Pushover Analysis. In Proceedings of the 14th World Conference on Earthquake Engineering, Beijing, China, 12–17 October 2008. [Google Scholar]
- Leelataviwat, S.; Saewon, W.; Goel, S.C. An Energy Based Method for Seismic Evaluation of Structures. In Proceedings of the 14th World Conference on Earthquake Engineering, Beijing, China, 12–17 October 2008. [Google Scholar]
- Coleman, J.; Spacone, E. Localization Issues in Force-Based Frame Elements. J. Struct. Eng. 2001, 127, 1257–1265. [Google Scholar] [CrossRef]
- Building Seismic Safety Council. NEHRP Recommended Provisions for Seismic Regulations for new Buildings and Other Structures Part 2: Commentary (FEMA 369); Building Seismic Safety Council: Washington, DC, USA, 2000. [Google Scholar]
- Kim, S.-P.; Kurama, Y.C. An alternative pushover analysis procedure to estimate seismic displacement demands. Eng. Struct. 2008, 30, 3793–3807. [Google Scholar] [CrossRef]
- Worku, A.M.; Hsiao, P.-C. An improved first-mode-based pushover analytical procedure for assessing seismic performance of special moment resisting frame building structures. Eng. Struct. 2021, 252, 113587. [Google Scholar] [CrossRef]
- Chopra, A.K.; Goel, R.K. A modal pushover analysis procedure for estimating seismic demands for buildings. Earthq. Eng. Struct. Dyn. 2001, 31, 561–582. [Google Scholar] [CrossRef]
- Ferraioli, M. Multi-mode pushover procedure for deformation demand estimates of steel moment-resisting frames. Int. J. Steel Struct. 2017, 17, 653–676. [Google Scholar] [CrossRef]
- Jalilkhani, M.; Ghasemi, S.H.; Danesh, M. A multi-mode adaptive pushover analysis procedure for estimating the seismic demands of RC moment-resisting frames. Eng. Struct. 2020, 213, 110528. [Google Scholar] [CrossRef]
- Mao, J.; Zhai, C.; Xie, L. An improved modal pushover analysis procedure for estimating seismic demands of structures. Earthq. Eng. Eng. Vib. 2008, 7, 25–31. [Google Scholar] [CrossRef]
- Sucuoğlu, H.; Günay, M.S. Generalized force vectors for multi-mode pushover analysis. Earthq. Eng. Struct. Dyn. 2011, 40, 55–74. [Google Scholar] [CrossRef]
- Poursha, M.; Khoshnoudian, F.; Moghadam, A. A consecutive modal pushover procedure for estimating the seismic demands of tall buildings. Eng. Struct. 2009, 31, 591–599. [Google Scholar] [CrossRef]
- Kim, S.; Enzo, D. Pushover Analysis Procedure in Earthquake Engineering. Earthq. Spectra 1999, 15, 417–434. [Google Scholar] [CrossRef]
- Khoshnoudian, F.; Kiani, M. Modified consecutive modal pushover procedure for seismic investigation of one-way asymmetric-plan tall buildings. Earthq. Eng. Eng. Vib. 2012, 11, 221–232. [Google Scholar] [CrossRef]
- Poursha, M.; Samarin, E.T. The modified and extended upper-bound (UB) pushover method for the multi-mode pushover analysis of unsymmetric-plan tall buildings. Soil Dyn. Earthq. Eng. 2015, 71, 114–127. [Google Scholar] [CrossRef]
- Rahmani, A.Y.; Bourahla, N.; Bento, R.; Badaoui, M. An improved upper-bound pushover procedure for seismic assessment of high-rise moment resisting steel frames. Bull. Earthq. Eng. 2018, 16, 315–339. [Google Scholar] [CrossRef]
- Rahmani, A.Y.; Badaoui, M.; Bourahla, N.; Bento, R. Extension of the improved upper-bound pushover analysis for seismic assessment of steel moment resisting frames with setbacks. Bull. Earthq. Eng. 2022, 20, 7609–7640. [Google Scholar] [CrossRef]
- Kreslin, M.; Fajfar, P. The extended N2 method considering higher mode effects in both plan and elevation. Bull. Earthq. Eng. 2012, 10, 695–715. [Google Scholar] [CrossRef]
- Chopra, A.K. Dynamics of Structures: Theory and Applications to Earthquake Engineering, 4th ed.; Prentice Hall: Haboken, NJ, USA, 2011. [Google Scholar]
- Liu, Y.; Kuang, J.S. Spectrum-based pushover analysis for estimating seismic demand of tall buildings. Bull. Earthq. Eng. 2017, 15, 4193–4214. [Google Scholar] [CrossRef]
- Rofooei, F.; Rofooei, F.R.; Attari, N.K.; Rasekh, A.; Shodja, A.H. Adaptive pushover analysis. Asian J. Civ. Eng. (Build. Hous.) 2007, 8, 343–358. [Google Scholar]
- Papanikolaou, V.K.; Elnashai, A.S. Evaluation of Conventional and Adaptive Pushover Analysis I: Methodology. J. Earthq. Eng. 2005, 9, 923–941. [Google Scholar] [CrossRef]
- Sürmeli, M.; Yüksel, E. An adaptive modal pushover analysis procedure (VMPA-A) for buildings subjected to bi-directional ground motions. Bull. Earthq. Eng. 2018, 16, 5257–5277. [Google Scholar] [CrossRef]
- Kalkan, E.; Kunnath, S.K. Adaptive Modal Combination Procedure for Nonlinear Static Analysis of Building Structures. J. Struct. Eng. 2006, 132, 1721–1731. [Google Scholar] [CrossRef]
- Rahmani, A.; Bourahla, N.; Bento, R.; Badaoui, M. Adaptive upper-bound pushover analysis for high-rise moment steel frames. Structures 2019, 20, 912–923. [Google Scholar] [CrossRef]
- Chopra, A.K.; Goel, R.K. A Modal Pushover Analysis Procedure to Estimate Seismic Demands for Buildings; Pacific Earthquake Engineering Research Center: Berkeley, CA, USA, 2001. [Google Scholar]
- Attard, T.; Fafitis, A. Modeling of higher-mode effects using an optimal multi-modal pushover analysis. WIT Trans. Built Environ. 2005, 81, 405–414. [Google Scholar]
- Barbat, A.H.; Pujades, L.G.; Lantada, N. Seismic damage evaluation in urban areas using the capacity spectrum method: Application to Barcelona. Soil Dyn. Earthq. Eng. 2008, 28, 851–865. [Google Scholar] [CrossRef]
- Gentile, R.; Galasso, C. Simplicity versus accuracy trade-off in estimating seismic fragility of existing reinforced concrete buildings. Soil Dyn. Earthq. Eng. 2021, 144, 106678. [Google Scholar] [CrossRef]
- Bosco, M.; Ghersi, A.; Marino, E.M.; Rossi, P.P. Comparison of nonlinear static methods for the assessment of asymmetric buildings. Bull. Earthq. Eng. 2013, 11, 2287–2308. [Google Scholar] [CrossRef]
- Shakeri, K.; Ghorbani, S. A pushover procedure for seismic assessment of buildings with bi-axial eccentricity under bi-directional seismic excitation. Soil Dyn. Earthq. Eng. 2015, 69, 1–15. [Google Scholar] [CrossRef]
- Panyakapo, P. Cyclic Pushover Analysis procedure to estimate seismic demands for buildings. Eng. Struct. 2014, 66, 10–23. [Google Scholar] [CrossRef]
- Zhang, J.-Z.; Jiang, J.; Li, G.-Q. An improved consecutive modal pushover procedure for estimating seismic demands of multi-storey framed buildings. Struct. Des. Tall Spéc. Build. 2017, 26, e1336. [Google Scholar] [CrossRef]
- Khoshnoud, H.R.; Marsono, K. Assessment of FEMA356 nonlinear static procedure and modal pushover analysis for seismic evaluation of buildings. Struct. Eng. Mech. 2012, 41, 243–262. [Google Scholar] [CrossRef]
- Yang, P.; Wang, Y. A Study on Improvement of Pushover Analysis. In Proceedings of the12th World Conference on Earthquake Engineering, Auckland, New Zealand, 30 January–4 February 2000. [Google Scholar]


Disclaimer/Publisher’s Note: The statements, opinions and data contained in all publications are solely those of the individual author(s) and contributor(s) and not of MDPI and/or the editor(s). MDPI and/or the editor(s) disclaim responsibility for any injury to people or property resulting from any ideas, methods, instructions or products referred to in the content. |
© 2023 by the authors. Licensee MDPI, Basel, Switzerland. This article is an open access article distributed under the terms and conditions of the Creative Commons Attribution (CC BY) license (https://creativecommons.org/licenses/by/4.0/).
Share and Cite
Kuria, K.K.; Kegyes-Brassai, O.K. Pushover Analysis in Seismic Engineering: A Detailed Chronology and Review of Techniques for Structural Assessment. Appl. Sci. 2024, 14, 151. https://doi.org/10.3390/app14010151
Kuria KK, Kegyes-Brassai OK. Pushover Analysis in Seismic Engineering: A Detailed Chronology and Review of Techniques for Structural Assessment. Applied Sciences. 2024; 14(1):151. https://doi.org/10.3390/app14010151
Chicago/Turabian StyleKuria, Kevin Karanja, and Orsolya Katalin Kegyes-Brassai. 2024. "Pushover Analysis in Seismic Engineering: A Detailed Chronology and Review of Techniques for Structural Assessment" Applied Sciences 14, no. 1: 151. https://doi.org/10.3390/app14010151