Article

Integrated Earthquake Catalog of the Ossetian Sector of the Greater Caucasus

by
Inessa A. Vorobieva
1,2,
Boris A. Dzeboev
1,3,*,
Boris V. Dzeranov
1,3,
Alexei D. Gvishiani
1,4,
Vladislav B. Zaalishvili
1,3,
Natalia A. Sergeeva
1 and
Izabella M. Nikitina
1
1
Geophysical Center of the Russian Academy of Sciences (GC RAS), 119296 Moscow, Russia
2
Institute of Earthquake Prediction Theory and Mathematical Geophysics of the Russian Academy of Sciences (IEPT RAS), 117997 Moscow, Russia
3
Geophysical Institute, Vladikavkaz Scientific Center RAS (GPI VSC RAS), 362002 Vladikavkaz, Russia
4
Schmidt Institute of Physics of the Earth of the Russian Academy of Sciences (IPE RAS), 119296 Moscow, Russia
*
Author to whom correspondence should be addressed.
Appl. Sci. 2024, 14(1), 172; https://doi.org/10.3390/app14010172
Submission received: 28 November 2023 / Revised: 14 December 2023 / Accepted: 22 December 2023 / Published: 24 December 2023
(This article belongs to the Section Earth Sciences)

Abstract

:
This article is the continuation of a study by authors to create the most complete and representative earthquake catalogs with a unified magnitude scale. The catalog created of the Ossetian sector of the Greater Caucasus (the territory of the Republic of North Ossetia–Alania and adjacent areas) was formed by the aggregation of all available data from Soviet, modern Russian, and Georgian catalogs, as well as the data from the International Seismological Centre. The integration was carried out using the author’s approach based on the modified nearest neighbor method. The integrated catalog of the Ossetian sector of the Greater Caucasus contains 16,285 events for the period 1962–2022. For all events, magnitude estimates are reduced to a unified “proxy-MW” scale. The integration of data from various sources made it possible to significantly replenish the beginning of the aftershock sequence of the Racha earthquake with MW = 7.0, which occurred on 29 April 1991. There has been a change in the level of registration over time. Thus, there is a significant lack of events for the periods 1967–1970 and 1988–1991; starting from 1995, the catalog is complete for magnitude 3.2, and since 2005 for magnitude 2.2. The integration of Soviet and modern Russian and Georgian catalogs made it possible to significantly increase the completeness and representativeness of seismic events in the studied Ossetian sector of the Greater Caucasus. This once again demonstrates both the fundamental importance of merging seismic data from global, national, and regional catalogs and the effectiveness of the author’s developed method.

1. Introduction

In this paper, the problem of creating the most complete/representative-for-today earthquake catalog with a unified magnitude scale for the Ossetian sector of the Greater Caucasus (Republic North Ossetia–Alania and adjacent territory) is carefully studied and advanced. For this purpose, the method developed by the authors under the leadership of Inessa Vorobieva is used. It was designed to sequentially merge any number of catalogs. The method is described in detail in [1]. It is based on the author’s modification of the nearest neighbor method [2,3]. It allows the identification and removal of duplicate events that occur when the catalogs are merged. Previously, the integrated catalog was elaborated for the Arctic zone of the Russian Federation [4,5,6]. It is demonstrated that merging catalogs of various global, national, and regional seismic networks makes it possible to improve the completeness and representativeness of seismic events in the studied region [7,8,9,10].
Currently, earthquakes occurring in the studied region are recorded by seismic networks of regional branches of the Geophysical Survey of the Russian Academy of Sciences (GS RAS) (North Ossetian branch, Dagestan branch, Kislovodsk Seismic Station), the Georgia’s National Seismic Center, and international seismological agencies.
The seismological observation network of the North Ossetian branch of the GS RAS (international network code—NOGSR) carries out continuous monitoring of seismic activity in the Republic of North Ossetia–Alania and adjacent territories. It covers the Central part of the North Caucasus, as well as South Ossetia and the border strip of the Republic of Georgia. Today the network includes 12 observation points, which are equipped with 10 short-period and 2 broadband seismic stations (https://sofgsras.ru, accessed on 27 November 2023). Data transmission from observation points to the processing center in Vladikavkaz is carried out in near real-time via telemetry channels [11]. The seismological observation network of the Dagestan branch of GS RAS (international network code—DAGSR) currently includes 17 seismic stations (http://dbgsras.ru, accessed on 27 November 2023), which continuously record seismic events in the territory of Dagestan and adjacent areas [12]. The Kislovodsk seismic station of GS RAS (international network code—KMGSR) includes 17 seismological observation points (http://eqru.gsras.ru/stations/index.php?inc=stalist&net=KMGSR, accessed on 27 November 2023) in the North Caucasus and Stavropol Territory [13].
Georgia’s National Seismic Center (international network code—GO, https://ies.iliauni.edu.ge, accessed on 27 November 2023) currently operates on the basis of the Institute of Earth Sciences. The network comprises 25 permanently operating short-period and broadband digital seismic stations (21 transmit data in real-time). It continuously monitors seismic events in Georgia and adjacent regions [14].
The Greater Caucasus is one of the most active segments of the Alpine–Himalayan collision belt. The Ossetian sector, considered in this paper, is characterized by a fairly high level of seismicity [15,16,17,18,19,20,21,22]. So, E.A. Rogozhin identified 11 possible earthquakes source (PES) zones [23]: 10 zones on the northern slope of the Greater Caucasus, and the Racha–Java zone on the southern slope. A significant number of the strong earthquakes in the Greater Caucasus are confined to the Racha–Java PES zone. For these zones, a general increase in the maximum magnitude potential from north to south is observed [23,24].
The strongest earthquake, both within the considered sector and in the entire Greater Caucasus, was the Racha earthquake. It occurred in the territory of the Republic of Georgia within the Racha–Java PES zone [23] on 29 April 1991 at 09:12 (UTC) with a magnitude of MW = 7.0 (GCMT—Global Centroid-Moment-Tensor). According to [25], the earthquake was followed by more than 3500 aftershocks. The strongest aftershocks are considered to be the following events: 29 April 1991 at 18:30 (UTC) with MW = 6.1 (GCMT) 15 km northeast of the epicenter of the main shock and 15 June 1991 with MW = 6.2 (GCMT) 15 km east of the village of Java. On 23 October 1992, 120 km east of the epicenter of the Racha earthquake, the Barisakho earthquake with MW = 6.4 (GCMT) occurred on the southern slope of the Greater Caucasus [26,27]. Speaking about events with M ≥ 6.0 that occurred in the considered segment of the Greater Caucasus, we have to mention the Chernogorsk earthquake with MW = 6.2 (GCMT), which occurred on 28 July 1976 in the Chernye Gory region, 17 km southwest of Grozny [28,29].

2. Materials and Methods

Figure 1 presents the region studied (42° N, 43° E; 44.5° N, 43° E; 44.5° N, 45.5° E; 42° N, 45.5° E). It includes the territory of the Republic of North Ossetia–Alania and adjacent territories (hereinafter referred to as the Ossetian sector of the Greater Caucasus). The integrated earthquake catalog with a unified magnitude scale is created for this region in the present paper.
To create the integrated earthquake catalog of the Ossetian sector of the Greater Caucasus, the following 5 input catalogs were used (Table 1):
  • The catalog of the Caucasus from the annual journal Earthquakes in the USSR 1962–1991 (hereinafter ZEMSU);
  • The catalog of the North Caucasus from the annual journals Earthquakes in Northern Eurasia 1992–2017 and Earthquakes in Russia 2018–2021 (hereinafter NC);
  • The catalog of Georgia from the annual journal Earthquakes in Northern Eurasia 1993–2004 (hereinafter GEOR04);
  • The earthquake catalog of the Caucasus from the annual journal Seismic Bulletin of the Caucasus 1971–1986 (hereinafter GEOR71), published under the scientific and methodological guidance of the Institute of Geophysics of the Academy of Sciences of the Georgian SSR (today, the M. Nodia Institute of Geophysics);
  • The catalog of the International Seismological Centre ISC 1962–2022. The ISC catalog is composite and contains data from a number of global as well as Russian agencies (Table 2).
According to the data on the nature of events in the input catalogs, there are few “non-earthquakes” in Ossetia. In the North Caucasus catalog, NC 41 events are marked as an explosion. There are 3 non-earthquakes (explosions) in the ISC catalog. These events were excluded from the input catalogs. Afterwards, a cross-check was carried out and 2 explosions were found in both catalogs, which were also removed (Table 1). No additional checks were performed after merging catalogs. Earthquakes with unknown magnitude/class were also excluded from consideration. Events were selected within the studied region.
Table 1. Input catalogs.
CatalogPeriodNumber of EventsNumber of Earthquakes with
Energy Classes and/or Magnitudes
Number of
Non-Earthquakes
ZEMSU1962–1991125812580
NC1992–202112,44212,39941 + 2 *
GEOR041993–20045725720
GEOR711971–1986241224120
ISC1962–2022392339183 + 2 **
* Explosions from the ISC catalog. ** Explosions from the NC catalog.
Table 2. Statistics of the ISC catalog.
Agency AbbreviationAgencyWith Magnitude
AFADDisaster and Emergency Management Presidency, Turkey59
ATAThe Earthquake Research Center Ataturk University, Turkey1
AZERRepublican Seismic Survey Center of Azerbaijan National Academy of Sciences, Azerbaijan22
BCISBureau Central International de Sismologie, France1
CSEMCentre Sismologique Euro-Méditerranéen (CSEM/EMSC), France190
DDAGeneral Directorate of Disaster Affairs, Turkey78
DRSDagestan Branch, Geophysical Survey, Russian Academy of Sciences, Russia130
EIDCExperimental (GSETT3) International Data Center, U.S.A.1
IDCInternational Data Centre, CTBTO, Austria9
ISCInternational Seismological Centre, United Kingdom975
ISKKandilli Observatory and Earthquake Research Institute, Turkey13
MOSGeophysical Survey of Russian Academy of Sciences, Russia1193
NEICNational Earthquake Information Center, U.S.A.3
NNCNational Nuclear Center, Kazakhstan1
NORSNorth Ossetia (Alania) Branch, Geophysical Survey, Russian Academy of Sciences, Russia340
SPITAKArmenia6
TIFInstitute of Earth Sciences/National Seismic Monitoring Center, Georgia896
TOTAL:3918
As noted above, the author’s method, used in the present study to identify duplicates that arise when earthquake catalogs are sequentially merged, is described in detail in [1] (see Supplementary Materials). The application of this method to create the most complete earthquake catalog with a unified magnitude scale for the Arctic zone of the Russian Federation is given in [4,5,6]. For this reason, a description of the method is not provided in this article. The only thing that should be noted is that it is based on the construction of a three-parameter metric R o :
R o = D T 2 σ T 2 + D X 2 σ X 2 + D Y 2 σ Y 2 ,
where σ T , σ X , σ Y are the standard deviations of time, longitude, and latitude differences between the nearest events from the two input catalogs.
Prior to merging, each of the input catalogs (Table 1) was examined for internal duplicates. Statistical analysis did not reveal any anomalous groups of close events (see Supplementary Figure S2).

3. Results

3.1. Merging Catalogs

When merging catalogs, the preference is given to earthquake records from the ISC catalog that have magnitude definitions MWGCMT and/or mbISC and/or mbNEIC [4,5,6]. As shown in Table 1, in the region considered, a large majority of seismic events are registered by GS RAS seismic networks. The quantity of earthquake records in the ISC catalog is approximately four times smaller than the total number of events in the GS RAS catalogs. Thus, to merge earthquake catalogs, the following priority sources of earthquake data were chosen:
  • Earthquakes from the ISC catalog that have magnitudes MWGCMT and/or mbISC and/or mbNEIC (ISC_CORE, 269 events);
  • Earthquakes from catalogs of GS RAS: ZEMSU (1258 events) and NC (12,399 events). These catalogs do not overlap in time;
  • Earthquakes from catalogs of Georgia (572 + 2412). These catalogs do not overlap in time;
  • Other earthquakes from ISC (ISC_OTHER, 3649).
The sequence of merging catalogs is shown in the diagram (Figure 2).
At each stage, the catalogs are merged in two steps. First, the parameters of metric (1) are determined. For this reason, the proximity function between the nearest events from the two input catalogs is calculated with standard parameters σ T = 0.05   m i n , σ X = σ Y = 15   k m . For the preliminary identification of duplicates, a threshold metric value of R o = 10 is used. It corresponds to a difference in time and space of 0.5 min/150 km. If the number of duplicates is not enough or most of the duplicates are absolute, we limit ourselves to the first step. This happened at the first stage of this study when merging the ZEMSU and GEOR71 catalogs (Figure 2): 654 duplicates were identified. However, among them, only 18 events had different epicenter definitions. Moreover, the difference in time for most events could be explained by different accuracies of data representation in the input catalogs. The distribution of the R o metric is shown in Figure 3.
If the number of predefined duplicates is sufficient, then we can move on to the second step. This was the case at stages 2, 4, and 5 of the assembly of the integrated catalog of the Ossetian sector of the Greater Caucasus. For predefined duplicates, the standard deviations σ T , σ X   , and, σ Y , of the variables DT, DX, and DY are calculated, respectively (Figure 4, Figure 6 and Figure 8). After this, the threshold value of the metric is determined and the final identification of duplicates occurs (Figure 5, Figure 7 and Figure 9).
In the third stage, the ZEMSU_GEOR and NC_GEOR catalogs are merged. These catalogs do not overlap in time, so the GSR catalog (Figure 2) is obtained by a simple merging.
The earthquake catalogs for the considered region (Figure 1) are a combination of data from a wide variety of agencies. This refers not only to the ISC catalog but also to the GSR catalogs, which combine data from regional networks of North Ossetia, Dagestan, Georgia, and the GS RAS teleseismic network. In this situation, the application of the method used in [4,5] to determine the threshold value of the metric leads to an increased probability of missing duplicates. Therefore, in the present paper the actual distribution of the metric for the nearest events from the two catalogs being merged is used instead of the multivariate normal distribution model. The effectiveness of this approach is shown in [6]. We believe that the maximum metric value for possible duplicate events is R o = 30 ; this corresponds to the difference in time and space of the order of 1.5 min and 600 km. For such events, the distribution F d u b is constructed. Red lines in Figure 5b, Figure 7b and Figure 9b show the value 1 F d u b , which is considered to be the probability of missing a duplicate (error of the I kind). The probability of a false duplicate (error of the II kind) is estimated in the same way as in [4,5]. For this reason, the values of the metric (1) R o between events inside the additional catalog are calculated: blue lines in Figure 5b, Figure 7b and Figure 9b show the fraction of events with proximity less than a given R o value. Black lines show estimates of the total probability of errors of the first and second kinds. The threshold value of the metric minimizes the total amount of errors. Figure 5c, Figure 7c and Figure 9c represent the distribution of normalized times and distances for the nearest events from the merged catalogs. The level lines of the metric correspond to the selected threshold value that provides the optimal separation of duplicates and unique events.
Numerical parameters for merging catalogs are presented in Table 3. The compiled catalog of the Ossetian sector of the Greater Caucasus contains 16,286 events.
The ISC_CORE catalog contains 45 events that are not in the GSR catalogs (GSR is the integration of Soviet, Russian, and Georgian catalogs; Figure 2). These are quite strong events for which a magnitude mbISC ≥ 3.4 was determined. These events were missing in the GSR catalogs for the following reasons. Three events occurred in 2022, for which GSR catalogs have not yet been published. Six events are in the GSR catalogs, but are located outside the studied region; these six events are included in the integrated catalog because we give preference to determinations from the ISC_CORE catalog. Another event that occurred on 4 August 1989 at 9:22:57 is in the ZEMSU catalog but has a time of 19:22:54, so it was not identified as a duplicate. Most likely this is a technical error in the ZEMSU catalog; we consider this event a duplicate and do not include the definition from ZEMSU in the final integrated catalog.
The remaining 35 unique events from the ISC_CORE catalog are aftershocks of the Racha earthquake on 29 April 1991, with Mw = 7.0. Immediately after strong earthquakes, the earthquake flow density and noise level increase by an order. Under these conditions, many events may be missed by local seismic networks. Thus, in [1], it was demonstrated that a large number of aftershocks of the 2011 Tohoku earthquake, Mw = 9.0, were missed by the local seismic network of the Japan Meteorological Agency, but were recorded by global networks. Among the missed Tohoku aftershocks were several events with a magnitude greater than 6.0. The same phenomenon was observed for the aftershock sequence of the Racha earthquake.

3.2. Magnitudes in the Integrated Catalog of the Ossetian Sector of the Greater Caucasus

The magnitude scale in the integrated catalog was unified. The integrated earthquake catalog of the Ossetian sector of the Greater Caucasus contains many magnitude definitions of different types from various agencies. The seismic moment magnitude determined by GCMT was chosen as the reference scale. The analysis of the correlation relationships between different magnitudes was carried out and conversion formulas were proposed to obtain “proxy-MW” estimates. The simplest shift-type relations M = m + a were used. An exception was made for MLAZER and MLEDIC. For them, linear relationships were used. The Ossetian sector of the Greater Caucasus considered (Figure 1) is not a large region at all. For this reason, there are not sufficient statistics for many magnitudes. Therefore, to obtain more reliable estimates, the relationships between magnitudes throughout the North Caucasus were analyzed.
The integrated catalog of the Ossetian sector of the Greater Caucasus contains 16,285 events. The MWGCMT magnitude was determined for only 10 events. Magnitudes mbISC and mbNEIC are known for 259 events. Magnitude mbISCMWGCMT (Figure 10a), which corresponds to the ISC practice of using magnitude mb as a proxy-MW for earthquakes with M < 5.0 [6,30]. Also, mbISCmbNEIC (Figure 10b). The latest ratios make it possible to significantly increase statistics and expand the magnitude range to convert other magnitudes to proxy-MW. Note that for the vast majority of events (15,872), the energy class k is determined. Thus, more than 99% of events have magnitudes MWGCMT, mbISC, NEIC, and energy class k. The relationships between these magnitudes are considered basic (Figure 10). It should be noted that the relationship between the energy class and magnitude of mbISC turned out to be different in the ZEMSU and NC catalogs (Figure 10c,d). In turn, in the Georgian catalogs GEOR71 and GEOR04, the energy class k showed approximately the same regressions with mbISC as in the ZEMSU and NC catalogs (Figure 10c,d). The energy class k was converted to magnitude Mk and the relationship between Mk and mbISC is shown in Figure 10e.
A total of 145 events in the integrated catalog have other types of magnitudes. For them, relationships were built with mbISC and/or Mk. Regressions with mbISC and Mk, where both are defined, turned out to be very close (Figure 11). This confirms the hypothesis that the relationship between different estimates is linear over a wide range of magnitudes. Only magnitude determinations MDAFAD, MDDDA, MSTIF have 24 events. The unified magnitude estimates constructed for them are considered to be unreliable. For them, the relationships are poorly defined due to low statistics (Figure 12). Thus, the unified magnitude is poorly determined for less than 0.2% of events.
All statistics, magnitude conversion formulas, and correlation coefficients are given in Table 4. The 95% confidence intervals of the obtained relationships are shown in Figure 10, Figure 11 and Figure 12. For reliably determined ratios (Figure 10 and Figure 11), the confidence interval is less than 0.1.

3.3. Statistics of the Integrated Catalog of the Ossetian Sector of the Greater Caucasus

Figure 13 shows the distribution of earthquake epicenters from the integrated catalog of the Ossetian sector of the Greater Caucasus. The catalog contains 16,285 events from 1962–2022. It has to be noted that the integrated catalog contains 837 events from the ISC and 15,717 earthquakes from the national Soviet, Russian, and Georgian catalogs.
The distribution of magnitudes in time and differential magnitude–frequency graphs in different time periods are presented in Figure 14. Before 1982, most events had integer or half-integer classes, which caused magnitude sampling in 0.5 increments. During the same period, earthquake epicenters in the original catalogs are given with an accuracy of 0.1° (see Supplementary Figure S3). The representativeness of the catalog varies significantly over time, with significant dips in registration levels from 1967 to 1970, as well as from 1988 to 1991. Registration levels improved significantly in 1995 and then in 2005.
Figure 15a presents spatial-temporal variations in the magnitude of complete registration since 1982. To determine spatial-temporal variations of the magnitude of complete registration, the multi-scale method was used [31]. It was designed by authors to analyze heterogeneous catalogs with significant variations in the registration level. Maps of spatial variations of Mc were also constructed for the periods 1995–2004 (Figure 15b) and 2005–2022 (Figure 15c) when Mc < 3.2 and Mc < 2.2, respectively. In the western part of the considered region, the level of registration is better than in the east and Mc = 3.0 in 1995–2004, and Mc = 2.0 in 2005–2022, respectively.

4. Conclusions

In this article, by the system integration of data on seismic events from Soviet, Russian, and Georgian catalogs, as well as ISC, the most complete representative earthquake catalog with a unified magnitude scale was elaborated for the Ossetian sector of the Greater Caucasus (the territory of the Republic North Ossetia–Alania and adjacent areas). The integrated catalog contains 16,285 events for the period 1962–2022. The map of the earthquake epicenters is presented in Figure 13. The earthquake catalog of the Ossetian sector of the Greater Caucasus that was compiled in the present paper is available for the public on the website of the World Data Center for Solid Earth Physics, Moscow at http://www.wdcb.ru/sep/seismology/Ossetia/Ossetia.html (accessed on 27 November 2023).
Based on the results obtained in the present study, the authors consider it possible to draw the following conclusions:
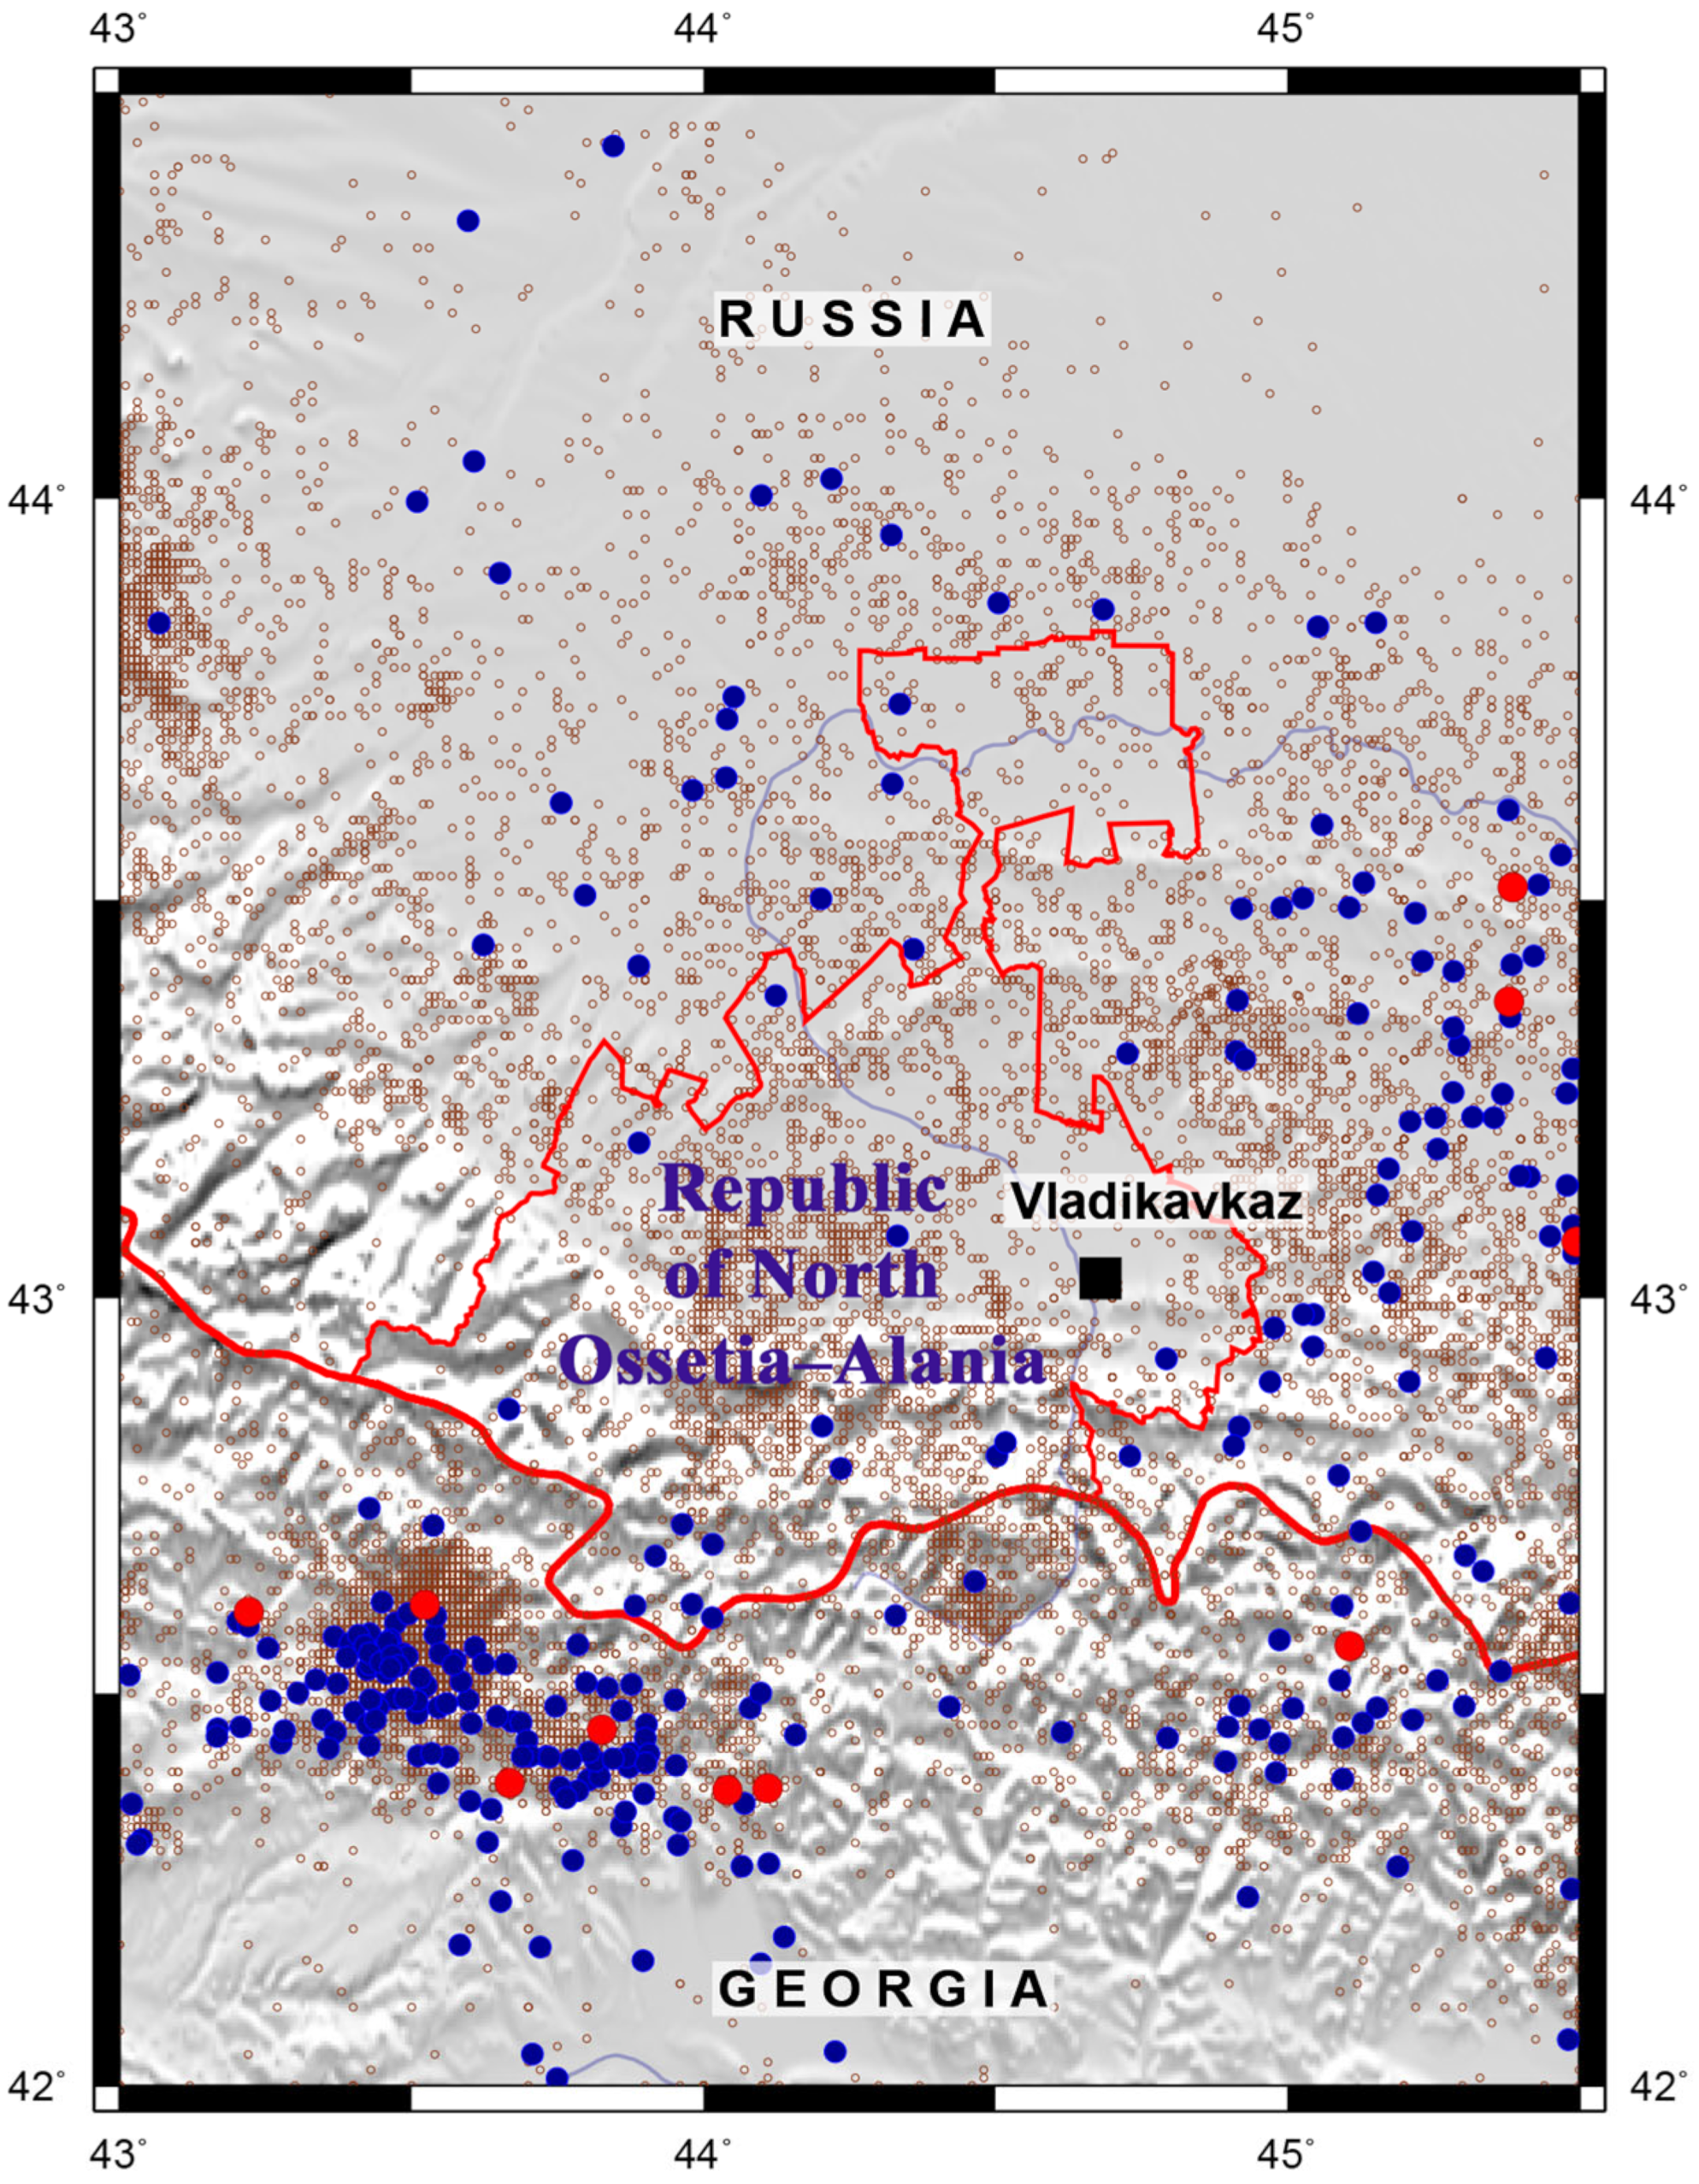
  • The territory of the considered region of the Central Caucasus (Figure 1) is quite well-represented in Soviet, Russian, and Georgian catalogs (in particular in the catalogs of the GS RAS). The share of events from ISC in the integrated catalog is about 5%. At the same time, the beginning of the aftershock sequence of the Racha earthquake was significantly replenished. The estimated number of errors in identifying duplicates is about 1%;
  • The integration of Soviet and modern Russian and Georgian catalogs made it possible to significantly increase the completeness and representativeness of seismic events in the studied Ossetian sector of the Greater Caucasus. Thus, for the period 1971–1986, the integrated catalog contains 71.8% from the GEOR71 catalog and 26.4% from ZEMSU, i.e., a significant number of events were found in the catalog of the regional seismological center for these years;
  • The large majority of events in the integrated catalog have magnitudes MWGCMT, mbISC,NEIS and/or energy class, and less than 1% have other types of magnitude. The correlation relationships between MWGCMT, mbISC,NEIS, and energy class k are well established. Based on this, the obtained unified magnitude scale is considered reliable;
  • In the studied Ossetian sector of the Greater Caucasus, the level of registration varies greatly over time. There is a significant lack of events in the periods 1967–1970 and 1988–1991. Since 1995, the catalog is complete for magnitude 3.2, and since 2005 for magnitude 2.2;
  • The created integrated earthquake catalog with a unified magnitude scale can be used by a wide range of researchers studying the seismic regime and seismic hazard of the Central Caucasus [32,33,34,35,36]. The results of the present paper are important for studying the seismic regime and regional assessments of seismic hazard.
  • The magnitude–frequency graphs for the integrated catalog with a unified “proxy-MW” magnitude and the GS RAS catalog of the North Caucasus for 2005–2021 were constructed and compared (Figure 16). For the events from the GS RAS catalog, the magnitude Ms is used if known or the magnitude recalculated from the energy class k using T.G. Rautian ratio M = (k − 4)/1.8 [37]. The magnitude–frequency graphs and estimates for the parameters of the Gutenberg–Richter law differ significantly, which may affect the seismic hazard assessment results.
  • The results of this study once again demonstrate the fundamental importance of merging seismic data from global, national, and regional catalogs and the effectiveness of the author’s developed method.

Supplementary Materials

The following supporting information can be downloaded at: https://zenodo.org/records/10376769 (accessed on 27 November 2023), Figure S1: Modification of the nearest neighbor method for identifying duplicates in earthquake catalogs. Blue and gray circles are events of the main and additional catalogs, respectively, and identified pairs are shown by red arrows on the Step II panel; Figure S2: Distribution of the metric for events within the source earthquake catalogs (Table 1). The catalog name is indicated on the histogram; Figure S3: Distribution of earthquake magnitudes in space and time.

Author Contributions

Conceptualization, I.A.V., B.A.D., B.V.D. and A.D.G.; Data curation, B.A.D., B.V.D., V.B.Z., N.A.S. and I.M.N.; Formal analysis, I.A.V., B.A.D., B.V.D. and V.B.Z.; Funding acquisition, B.A.D. and A.D.G.; Investigation, I.A.V., B.A.D., B.V.D., A.D.G., V.B.Z., N.A.S. and I.M.N.; Methodology, I.A.V.; Project administration, B.A.D. and A.D.G.; Resources, B.A.D., B.V.D. and A.D.G.; Software, I.A.V.; Supervision, B.A.D. and A.D.G.; Validation, I.A.V., B.A.D., B.V.D. and A.D.G.; Visualization, I.A.V. and B.V.D.; Writing—original draft, I.A.V., B.A.D., B.V.D., A.D.G., V.B.Z., N.A.S. and I.M.N.; Writing—review and editing, I.A.V., B.A.D., B.V.D., A.D.G., V.B.Z., N.A.S. and I.M.N. All authors have read and agreed to the published version of the manuscript.

Funding

The reported study was funded by the Russian Science Foundation, project number 23-17-00176, “System Seismic Hazard Assessment of the Central Part of the Greater Caucasus (Ossetian sector)”.

Institutional Review Board Statement

Not applicable.

Informed Consent Statement

Not applicable.

Data Availability Statement

Data are contained within the article and Supplementary Materials.

Acknowledgments

The authors are grateful to the head of the Laboratory for Regional Seismicity Research of GS RAS Gabsatarova I.P. for providing updated earthquake catalogs of the North Caucasus for certain periods. This work employed data provided by the Shared Research Facility Analytical Geomagnetic Data Center of the Geophysical Center of RAS (http://ckp.gcras.ru/ accessed on 27 November 2023). This work employed data provided by the International Seismological Centre (2023), Seismological Dataset Repository, https://doi.org/10.31905/6TJZECEY (accessed on 27 November 2023).

Conflicts of Interest

The authors declare no conflicts of interest.

References

  1. Vorobieva, I.A.; Gvishiani, A.D.; Dzeboev, B.A.; Dzeranov, B.V.; Barykina, Y.V.; Antipova, A.O. Nearest Neighbor Method for Discriminating Aftershocks and Duplicates When Merging Earthquake Catalogs. Front. Earth Sci. 2022, 10, 820277. [Google Scholar] [CrossRef]
  2. Zaliapin, I.; Ben-Zion, Y. A global classification and characterization of earthquake clusters. Geophys. J. Int. 2016, 207, 608–634. [Google Scholar] [CrossRef]
  3. Zaliapin, I.; Ben-Zion, Y. Earthquake clusters in southern California. I: Identification and stability. J. Geophys. Res. Solid Earth 2013, 118, 2847–2864. [Google Scholar] [CrossRef]
  4. Gvishiani, A.; Vorobieva, I.; Shebalin, P.; Dzeboev, B.; Dzeranov, B.; Skorkina, A. Integrated Earthquake Catalog of the Eastern Sector of Russian Arctic. Appl. Sci. 2022, 12, 5010. [Google Scholar] [CrossRef]
  5. Vorobieva, I.A.; Gvishiani, A.D.; Shebalin, P.N.; Dzeboev, B.A.; Dzeranov, B.V.; Skorkina, A.A.; Sergeeva, N.A.; Fomenko, N.A. Integrated Earthquake Catalog II: The Western Sector of the Russian Arctic. Appl. Sci. 2023, 13, 7084. [Google Scholar] [CrossRef]
  6. Vorobieva, I.A.; Gvishiani, A.D.; Shebalin, P.N.; Dzeboev, B.A.; Dzeranov, B.V.; Sergeeva, N.A.; Kedrov, E.O.; Barykina, Y.V. Integrated Earthquake Catalog III: Gakkel Ridge, Knipovich Ridge and Svalbard Archipelago. Appl. Sci. 2023, 13, 12422. [Google Scholar] [CrossRef]
  7. Markušić, S.; Gülerce, Z.; Kuka, N.; Duni, L.; Ivančić, I.; Radovanović, S.; Glavatović, B.; Milutinović, Z.; Akkar, S.; Kovačević, S.; et al. An updated and unified earthquake catalogue for the Western Balkan Region. Bull. Earthq. Eng. 2016, 14, 321–343. [Google Scholar] [CrossRef]
  8. Sawires, R.; Santoyo, M.A.; Peláez, J.A.; Fernández, R.D.C. An updated and unified earthquake catalog from 1787 to 2018 for seismic hazard assessment studies in Mexico. Sci. Data 2019, 6, 241. [Google Scholar] [CrossRef]
  9. Braclawska, A.; Idziak, A.F. Unification of data from various seismic catalogues to study seismic activity in the Carpathians Mountain arc. Open Geosci. 2019, 11, 837–842. [Google Scholar] [CrossRef]
  10. Long, F.; Jiang, C.; Qi, Y.; Liu, Z.; Fu, Y. A joint probabilistic approach for merging earthquake catalogs of two neighboring seismic networks: An example of the 2014 Ludian sequence catalog. Acta Geophys. Sin. 2018, 61, 2815–2827. [Google Scholar] [CrossRef]
  11. Sayapina, A.A.; Bagaeva, S.S.; Dmitrieva, I.Y.; Gorozhantsev, S.V. Results of seismological observations on the territory of the Republic of North Ossetia–Alania and in adjacent areas in 2020. Russ. Seismol. J. 2021, 3, 86–95. [Google Scholar] [CrossRef]
  12. Magomedov, K.D.; Taymazov, D.G.; Adilov, Z.A.; Magomed-Kasumov, M.G.; Asmanov, O.A.; Mirzaliev, M.M.; Gadzhiev, A.M. Regional network of seismological observations on the territory of Dagestan: Status and development prospects. Russ. Seismol. J. 2022, 4, 79–96. [Google Scholar] [CrossRef]
  13. Gabsatarova, I.P.; Mekhryushev, D.Y.; Koroletsky, L.N.; Adilov, A.Z.; Magomedov, K.D.; Sayapina, A.A.; Bagaeva, S.S.; Pokhodenko, V.P.; Ivanova, L.E. Northern Caucasus. In Earthquakes in Russia in 2020; Annual Report; GS RAS: Obninsk, Russia, 2022; pp. 17–24. (In Russian) [Google Scholar]
  14. Tsereteli, N.; Danciu, L.; Varazanashvili, O.; Sesetyan, K.; Qajaia, L.; Sharia, T.; Svanadze, D.; Khvedelidze, I. The 2020 National Seismic Hazard Model for Georgia (Sakartvelo). In Building Knowledge for Geohazard Assessment and Management in the Caucasus and other Orogenic Regions; Bonali, F.L., Pasquaré Mariotto, F., Tsereteli, N., Eds.; NATO Science for Peace and Security Series C: Environmental Security; Springer: Dordrecht, The Netherlands, 2021. [Google Scholar] [CrossRef]
  15. Tan, O.; Taymaz, T. Active tectonics of the Caucasus: Earthquake source mechanisms and rupture histories obtained from inversion of teleseismic body waveforms. In Postcollisional Tectonics and Magmatism in the Mediterranean Region and Asia: Geological Society of America Special Paper 409; Dilek, Y., Pavlides, S., Eds.; Geological Society of America: Boulder, CO, USA, 2006; pp. 531–578. [Google Scholar] [CrossRef]
  16. Soloviev, A.A.; Novikova, O.V.; Gorshkov, A.I.; Piotrovskaya, E.P. Recognition of potential sources of strong earthquakes in the Caucasus region using GIS technologies. Dokl. Earth Sci. 2013, 450, 658–660. [Google Scholar] [CrossRef]
  17. Lukk, A.A.; Shevchenko, V.I. Seismicity, Tectonics, and GPS Geodynamics of the Caucasus. Izv. Phys. Solid Earth. 2019, 55, 626–648. [Google Scholar] [CrossRef]
  18. Mumladze, T.; Forte, A.M.; Cowgill, E.S.; Trexler, C.C.; Niemi, N.A.; Yıkılmaz, M.B.; Kellogg, L.H. Subducted, detached, and torn slabs beneath the Greater Caucasus. GeoResJ 2015, 5, 36–46. [Google Scholar] [CrossRef]
  19. Karapetyan, J.K.; Gasparyan, A.S.; Shakhparonyan, S.R.; Karapetyan, R.K. Registration and spectral analysis of waveforms of 10.24.2019 earthquake in the Caucasus using the new IGES-006 seismic sensor. Russ. J. Earth Sci. 2020, 20, ES6002. [Google Scholar] [CrossRef]
  20. Pavlenko, O.V. Regional characteristics of radiation and propagation of seismic waves in the North-Eastern Caucasus. Russ. J. Earth Sci. 2020, 20, ES5006. [Google Scholar] [CrossRef]
  21. Milyukov, V.K.; Mironov, A.P.; Ovsyuchenko, A.N.; Rogozhin, E.A.; Gorbatikov, A.V.; Drobyshev, V.N.; Khubaev, K.M.; Nikolaev, A.V. Velocities of Present-Day Horizontal Movements in the Central Sector of the Greater Caucasus according to GPS Observations and Their Relation to Tectonics and the Deep Structure of the Earth’s crust. Dokl. Earth Sci. 2018, 481, 879–882. [Google Scholar] [CrossRef]
  22. Abrehdari, S.H.; Karapetyan, J.; Rahimi, H.; Geodakyan, E. The Caucasus territory hot-cold spots determination and description using 2d surface waves tomography. Russ. J. Earth Sci. 2022, 22, ES5004. [Google Scholar] [CrossRef]
  23. Rogozhin, E.A. Seismotectonics of the central sector of the Greater Caucasus as a basis for seismic hazard. Bull. Vladikavkaz Sci. Cent. 2009, 9, 16–22. (In Russian) [Google Scholar]
  24. Zaalishvili, V.B.; Rogozhin, E.A. Assessment of seismic hazard of territory on basis of modern methods of detailed zoning and seismic microzonation. Open Constr. Build. Technol. J. 2011, 5, 30–40. [Google Scholar] [CrossRef]
  25. Arefiev, S.S.; Rogozhin, E.A.; Bykova, V.V.; Dorbath, C. Deep structure of the Racha Earthquake source zone from seismic tomography data. Izv. Phys. Solid Earth. 2006, 42, 27–40. [Google Scholar] [CrossRef]
  26. Gomez, J.M.; Bukchin, B.; Madariaga, R.; Rogozhin, E.A. A study of the Barisakho, Georgia, earthquake of 1992 October 23 from broad-band surface and body waves. Geophys. J. Int. 1997, 129, 613–623. [Google Scholar] [CrossRef]
  27. Ovsyuchenko, A.N.; Larkov, A.S.; Andreeva, N.V.; Lukashova, R.N. Seismotectonics of strong earthquake sources in the Caucasus: Results of research by Evgeniy Aleksandrovich Rogozhin. Russ. Seismol. J. 2023, 5, 28–44. [Google Scholar] [CrossRef]
  28. Kerimov, I.A.; Gaisumov, M.Y.; Badaev, S.V. Strong earthquakes in the territory of Chechnya and Ingushetia in the 18th–20th centuries. Grozny Nat. Sci. Bull. 2017, 5, 41–54. (In Russian) [Google Scholar]
  29. Mammadli, T.Y.; Rogozhin, E.A. Transverse Faults of the Eastern Caucasus and Their Manifestations in Seismicity. Seism. Instr. 2019, 55, 220–228. [Google Scholar] [CrossRef]
  30. Di Giacomo, D.; Bondár, I.; Storchak, D.A.; Engdahl, E.R.; Bormann, P.; Harris, J. ISC-GEM: Global Instrumental Earthquake Catalogue (1900–2009), III. Re-computed MS and mb, proxy MW, final magnitude composition and completeness assessment. Phys. Earth Planet. Inter. 2015, 239, 33–47. [Google Scholar] [CrossRef]
  31. Vorobieva, I.; Shebalin, P.; Narteau, C.; Beauducel, F.; Nercessian, A.; Clouard, V.; Bouin, M.-P. Multiscale mapping of completeness magnitude of earthquake catalogs. Bull. Seism. Soc. Am. 2013, 103, 2188–2202. [Google Scholar] [CrossRef]
  32. Balassanian, S.; Ashirov, T.; Chelidze, T.; Gassanov, A.; Kondorskaya, N.; Molchan, G.; Pustovitenko, B.; Trifonov, V.; Ulomov, V.; Giardini, D. Seismic hazard assessment for the Caucasus test area. Ann. Geophys. 1999, 42, 3775. [Google Scholar] [CrossRef]
  33. Akimov, V.A.; Zaitsev, V.A.; Larkov, A.S.; Lutikov, A.I.; Ovsyuchenko, A.N.; Panina, L.V.; Rogozhin, E.A.; Rodina, S.N.; Sysolin, A.I. Seismic Hazard Maps of the Northwest and Central Caucasus on a Detailed Scale. Seism. Instr. 2020, 56, 584–598. [Google Scholar] [CrossRef]
  34. Gorshkov, A.; Novikova, O. Estimating the validity of the recognition results of earthquake-prone areas using the ArcMap. Acta Geophys. 2018, 66, 843–853. [Google Scholar] [CrossRef]
  35. Ulomov, V.I.; Danilova, T.I.; Medvedeva, N.S.; Polyakova, T.P.; Shumilina, L.S. Assessment of seismic hazard in the North Caucasus. Izv. Phys. Solid Earth. 2007, 43, 559–572. [Google Scholar] [CrossRef]
  36. Dzeboev, B.A.; Gvishiani, A.D.; Agayan, S.M.; Belov, I.O.; Karapetyan, J.K.; Dzeranov, B.V.; Barykina, Y.V. System-Analytical Method of Earthquake-Prone Areas Recognition. Appl. Sci. 2021, 11, 7972. [Google Scholar] [CrossRef]
  37. Rautian, T.G. Determination of the Energy of Earthquakes at a Distance of up to 3000 km. Exp. Seism. 1964, 199, 88–93. (In Russian) [Google Scholar]
Figure 1. The studied region—the Ossetian sector of the Greater Caucasus. Earthquakes from the GS RAS catalogs are marked in brown, events from the ISC catalog with magnitude definitions mbISC and mbNEIC are marked in blue, and events with magnitude definitions MWGCMT are marked in red. The solid red line is the state border of the Russian Federation. The thin red line is the border of the Republic North Ossetia–Alania.
Applsci 14 00172 g001
Figure 2. The diagram for the assembly of the integrated catalog of the Ossetian sector of the Greater Caucasus. The main catalog is indicated with a bold frame at each stage. The numbers of stages are given in ellipses corresponding to Table 3.
Applsci 14 00172 g002
Figure 3. Stage 1: Merging of catalogs ZEMSU and GEOR71. Comparison of the metric distribution ZEMSU/GEOR71 pairs (blue histogram) and the same metric for GEOR71/GEOR71 earthquakes (red histogram). The dashed line represents the standard threshold value R o = 10 .
Applsci 14 00172 g003
Figure 4. Stage 2: Determination of numerical parameters of the metric (1) for merging the NC and GER04 catalogs. Distributions of variables DT, DX, DY, and the dependence of dispersion and mean values on the time and magnitude of events.
Applsci 14 00172 g004
Figure 5. Stage 2: Merging of catalogs NC and GEOR04. (a) Comparison of the metric distribution NC/GEOR04 pairs (blue histogram) and the same metric for GEOR04/GEOR04 earthquakes (red histogram). (b) Threshold optimization: the red line shows the probability of missing a duplicate, the blue line shows the probability of a false duplicate, and the black line shows the total probability of first and second kind errors. The threshold value Ro = 9, which minimizes the total number of errors, approximately 1.1%, is shown by a dashed line. (c) Distribution of normalized DT and DR, and contour line of metric (1). Colored dots represent NC/GEOR04 pairs (pink dots are duplicates, blue dots are unique events), and black dots are distances between GEOR04/GEOR04 events in metric (1). The values of the metric for earthquakes in the GEOR04 catalog are significantly larger than for NC/GEOR04 duplicates (pink dots). The contour line of metric (1), R o = 9 , provides close-to-optimal separation of duplicates and naturally grouped events. Absolute duplicates are not shown.
Applsci 14 00172 g005
Figure 6. Stage 4: Determination of numerical parameters of the metric (1) for merging the GSR and ISC_OTHER catalogs. Distributions of variables DT, DX, DY, and the dependence of dispersion and mean values on the time and magnitude of events.
Applsci 14 00172 g006
Figure 7. Stage 4: Merge of catalogs GSR and ISC_OTHER. (a) Comparison of the metric distribution GSR/ISC_OTHER pairs (blue histogram) and the same metric for ISC_OTHER/ISC_OTHER earthquakes (red histogram). (b) Threshold optimization: the red line shows the probability of missing a duplicate, the blue line shows the probability of a false duplicate, and the black line shows the total probability of first and second kind errors. The threshold value Ro = 9, which minimizes the total number of errors, approximately 1.1%, is shown by a dashed line. (c) Distribution of normalized DT and DR, and contour line of metric (1). Colored dots represent GSR/ISC_OTHER pairs (pink dots are duplicates, blue dots are unique events), and black dots are distances between ISC_OTHER/ISC_OTHER events in metric (1). The values of the metric for earthquakes in the ISC_OTHER catalog are significantly larger than for GSR/ISC_OTHER duplicates (pink dots). The contour line of metric (1), R o = 9 , provides close-to-optimal separation of duplicates and naturally grouped events. Absolute duplicates are not shown.
Applsci 14 00172 g007
Figure 8. Stage 5: Determination of numerical parameters of metric (1) for merging the ISC_CORE and GSR_OTHER catalogs. Distributions of variables DT, DX, DY, and the dependence of dispersion and mean values on the time and magnitude of events.
Applsci 14 00172 g008
Figure 9. Stage 5: Merging of catalogs ISC_CORE and GSR_OTHER. (a) Comparison of the metric distribution ISC_CORE/GSR_OTHER pairs (blue histogram) and the same metric for GSR_OTHER/GSR_OTHER earthquakes (red histogram). (b) Threshold optimization: the red line shows the probability of missing a duplicate, the blue line shows the probability of a false duplicate, and the black line shows the total probability of first and second kind errors. The threshold value Ro = 9, which minimizes the total number of errors, approximately 1.1%, is shown by a dashed line. (c) Distribution of normalized DT and DR, and contour line of metric (1). Colored dots represent ISC_CORE/GSR_OTHER pairs (pink dots are duplicates, blue dots are unique events), and black dots are distances between GSR_OTHER/GSR_OTHER events in metric (1). The values of the metric for earthquakes in the GSR_OTHER catalog are significantly larger than for ISC_CORE/GSR_OTHER duplicates (pink dots). The contour line of metric (1), R o = 9 , provides close-to-optimal separation of duplicates and naturally grouped events. Absolute duplicates are not shown.
Applsci 14 00172 g009
Figure 10. Basic shift-type correlation ratios for magnitudes MWGCMT, mbISC,NEIC, and energy class k. Gray dots in (c,d) are earthquakes from catalogs ZEMSU and NC, and black dots are from catalogs GEOR71 and GEOR04. Dashed lines show 95% confidence intervals.
Applsci 14 00172 g010
Figure 11. Correlation ratios for different magnitudes with mbISC (black) and Mk (red). Dashed lines show 95% confidence intervals.
Applsci 14 00172 g011aApplsci 14 00172 g011b
Figure 12. Unreliable shift-type correlation ratios for different magnitudes with mbISC. Dashed lines show 95% confidence intervals.
Applsci 14 00172 g012
Figure 13. Map of earthquake epicenters M ≥ 2.0 of the integrated catalog of the Ossetian sector of the Greater Caucasus, 1962–2022. GSR is the integration of Soviet, Russian, and Georgian catalogs (Figure 2). The solid black line is the state border of the Russian Federation; the thin line is the border of the Republic North Ossetia–Alania.
Applsci 14 00172 g013
Figure 14. Distribution of magnitudes in the integrated catalog of the Ossetian sector of the Greater Caucasus 1962–2022 in time and differential magnitude–frequency graphs in different time periods.
Applsci 14 00172 g014
Figure 15. The magnitude of complete registration Mc: (a) spatial–temporal variations; (b) spatial variations 1995–2004; (c) spatial variations 2005–2022. Mc level lines: dark red Mc = 2.0, yellow Mc = 2.2, blue Mc = 3.0, green Mc = 3.1. The solid black line is the state border of the Russian Federation; the thin line is the border of the Republic North Ossetia–Alania.
Applsci 14 00172 g015
Figure 16. The magnitude–frequency graphs and the parameters of the Gutenberg–Richter law: red—the integrated catalog with a unified “proxy-MW” magnitude, blue—the catalog of the North Caucasus with GS RAS magnitudes.
Applsci 14 00172 g016
Table 3. Scheme and compilation parameters of the integrated catalog.
StageMain CatalogAdditional Catalog Metric   Parameters   σ T   min ,
σ X   km ,   σ Y km
Threshold Value
of the Metric
Estimation of the Number of ErrorsNumber of DuplicatesMerged
Catalog
1ZEMSU
1258 events
GEOR71
2412 events
0.05;
15;
15.
10654ZEMSU_GEOR
3016 events
2NC
12,399 events
GEOR04
572 events
0.034;
18.0;
17.6.
91.1%317NC_GEOR
12,654 events
3ZEMSU_GEOR
3016 events
NC_GEOR
12,654
Catalogs do not overlap in time0%0GSR
15,670 events
4GSR
15,670 events
OTHER
3649 events
0.037;
14.5;
14.1.
10.50.7%3079GSR_OTHER
16,240 events
5GSR_OTHER
16,240 events
CORE
269 events
0.033;
9.8;
14.6.
5.60.8%224 + 1 *OSETIA
16,285
* Additional duplicate is a result of a technical error in the ZEMSU catalog; see the text of the article for details.
Table 4. Magnitudes in the integrated catalog.
AgencyType of MagnitudePriorityNumber
of Events
Magnitude
in the Integrated Catalog
FigureMmin–
Mmax. Initial Magnitude Scale
Correlation Coefficient.
Note
GCMTMW110M = MWGCMT5.1–7.0
ISCmb2246M = mbISC10a3.1–5.70.719
NEIC,
NEIS
mb213M = mbNEIC10b3.5–4.50.798
ZEMSU,
GEOR71
Mk32917M = Mk = k/2 – 1.110c,e 0.563
NC,
GEOR04,
ISC
Mk312,954M = Mk = k/2 – 1.410d,e 0.628
ZEMSUMPV42M = MPVZEMSU – 0.411a4.7–5.00.596
MOSmb448M = mbMOS – 0.311b3.5–4.80.755
EIDCmb41M = mbEIDCS + 0.111c3.60.763
AFADML415M = MLAFAF + 0.111d1.3–3.00.602
AZERML46M = 0.75MLAZER + 0.9411e1.4–1.80.835
CSEMML432M = 0.54MLCSEM + 1.2711f0.3–2.80.831
MOSMU44M = MUMOS + 0.411g1.8–3.20.891
NORSMU413M = MUNORS + 0.411h0.1–1.80.932
AFADMD513M = MDAFAD + 0.212a2.7–3.20.126
Unreliable few data
DDAMD59M = MDDDA + 0.212b2.4–3.30.581
Unreliable few data
TIFMS52M = MSTIF + 0.412c3.00.649
Unreliable few data
Total 16,285
Disclaimer/Publisher’s Note: The statements, opinions and data contained in all publications are solely those of the individual author(s) and contributor(s) and not of MDPI and/or the editor(s). MDPI and/or the editor(s) disclaim responsibility for any injury to people or property resulting from any ideas, methods, instructions or products referred to in the content.

