Article

Research on Underwater Wireless Optical Communication Channel Model and Its Application

1
State Key Laboratory of Robotics, Shenyang Institute of Automation, Chinese Academy of Sciences, Shenyang 110016, China
2
Institutes for Robotics and Intelligent Manufacturing, Chinese Academy of Sciences, Shenyang 110016, China
3
University of Chinese Academy of Sciences, Beijing 100049, China
*
Author to whom correspondence should be addressed.
Appl. Sci. 2024, 14(1), 206; https://doi.org/10.3390/app14010206
Submission received: 5 December 2023 / Revised: 18 December 2023 / Accepted: 21 December 2023 / Published: 26 December 2023
(This article belongs to the Section Marine Science and Engineering)

Abstract

:
Underwater wireless optical communication (UWOC) is an emerging technology with wide-ranging applications in marine exploration, offshore industries, environmental monitoring, and underwater robotics. In order to investigate the application of UWOC in environments of different water quality, this study establishes a model of an optical communication channel and analyzes the impact of water quality on communication range. Our experimental design is employed to validate the effectiveness of the model and analyze the sources of model errors. Furthermore, this research introduces the concept of an “effective communication space” for underwater optical wireless communication and constructs an experimental platform to test the effective communication space under various water quality conditions. In addition, the application methods and workflow of wireless optical communication on underwater mobile platforms are discussed, and field tests are conducted in a practical lake environment to verify the application value of the effective communication space. This research offers valuable guidance for advancing the study and engineering applications of UWOC technology.

1. Introduction

Underwater wireless communication is an advancing field with applications in marine exploration, offshore industries, environmental monitoring, and underwater robotics. Traditional methods, such as underwater acoustic communication using sound waves, face several limitations. These include low data rates, restricted bandwidth, noise susceptibility, and signal attenuation. Researchers have turned to UWOC as a solution, utilizing light waves for data transmission. UWOC offers advantages including higher data rates, wider bandwidth, lower latency, and immunity to electromagnetic interference [1]. This emerging technology holds promise for enhancing underwater operations and research. UWOC as an emerging technology has shown significant advancements in recent years. Chao Fei et al. [2] increased the rate to 16.6 Gbps over 5 m, 13.2 Gbps over 35 m, and 6.6 Gbps over 55 m. Li Zhang et al. [3] established a high-speed underwater wireless optical communication system based on non-orthogonal multiple access (NOMA) with polarization multiplexing. The system provides eight users with a record sum rate of 18.75 Gbps. However, while optical communication excels in terms of transmission rates, it faces significant constraints when it comes to the range between the optical transmitter and the receiver due to the issue of underwater optical signal attenuation. Seawater utilized as a transmission medium for light in underwater environments significantly impacts key technical parameters, including transmission velocity and range. HAO et al. [4] investigated the impact of water quality on the transmission properties of wireless optical communication channels. Their findings indicate that the transmission characteristics of light in seawater primarily manifest as attenuation characteristics. The attenuation coefficient serves as a crucial metric for quantifying the light absorption capability of water. Consequently, the correspondence between the attenuation coefficient and transmission range is a crucial under-researched topic in the study of the underwater environments, especially for the application of UWOC technology [5,6,7,8].
In the evaluation of UWOC technology’s communicative reach, contemporary research predominantly centers on the parameter of optical transmission distance. In the practical engineering application of underwater intelligent devices such as autonomous underwater vehicles (AUVs), most communication systems expand their communication emission angle and receiving field of view to rapidly establish underwater transmission links for inter-cluster communication [9,10,11]. This expansion increases geometric loss and reduces communication distance. Consequently, reliance solely on the metric of communication distance offers an incomplete portrayal of a system’s spatial coverage. In UWOC deployments, the dynamic nature of the communication range and angle gives rise to continuously evolving communication channels. The communication range and angle are interdependent parameters in optical communication systems. It is essential to establish effective coupling between these indicators within a designated operational range to ensure efficient and reliable optical communication. In response to this issue, the current study, in conjunction with engineering applications, proposes the method of using the “effective communication space” to evaluate the effective spatial coverage of communication systems.
Considering the application of optical wireless communication on mobile platforms like AUVs, it is evident that both water quality and effectively coupled space significantly impact the efficacy of communication. Importantly, these coupled effective spaces cannot be directly ascertained by optical communication devices alone. This research thus involved a comprehensive analysis of a model, experimental testing on an UWOC channel, and the exploration of optical wireless communication methods and workflows for underwater mobile platforms. Specifically, the paper is structured as follows. Section 2 provides an analysis of the factors influencing the UOWC channel and the determination of the effective communication space. A detailed description of the experimental setup and the analysis of the results are presented in Section 3. Section 4 presents the practical application process of wireless optical communication on a mobile AUV in water. Our conclusions are drawn in Section 5.

2. Modeling of the Communication Channel of UWOC

2.1. Analysis of Communication Range in UWOC

The early development of UWOC technology was quite slow due to the strong attenuation of visible light by water. Light travels through water in the UWOC system, starting from the emitting terminal where it is emitted. It then passes through the optical device at the light source terminal and the transmission channels in the water, eventually reaching the optical device at the receiving terminal. Throughout this process, light is subject to interference from various constituents, including the water itself, inorganic salts, yellow substances, phytoplankton (chlorophyll), and suspended particulates. These constituents cause absorption or scattering of the light, leading to signal degradation. Additionally, the emission angle of the optical communication device and geometric losses affect the received optical power at the receiving end, thereby limiting the communication range.

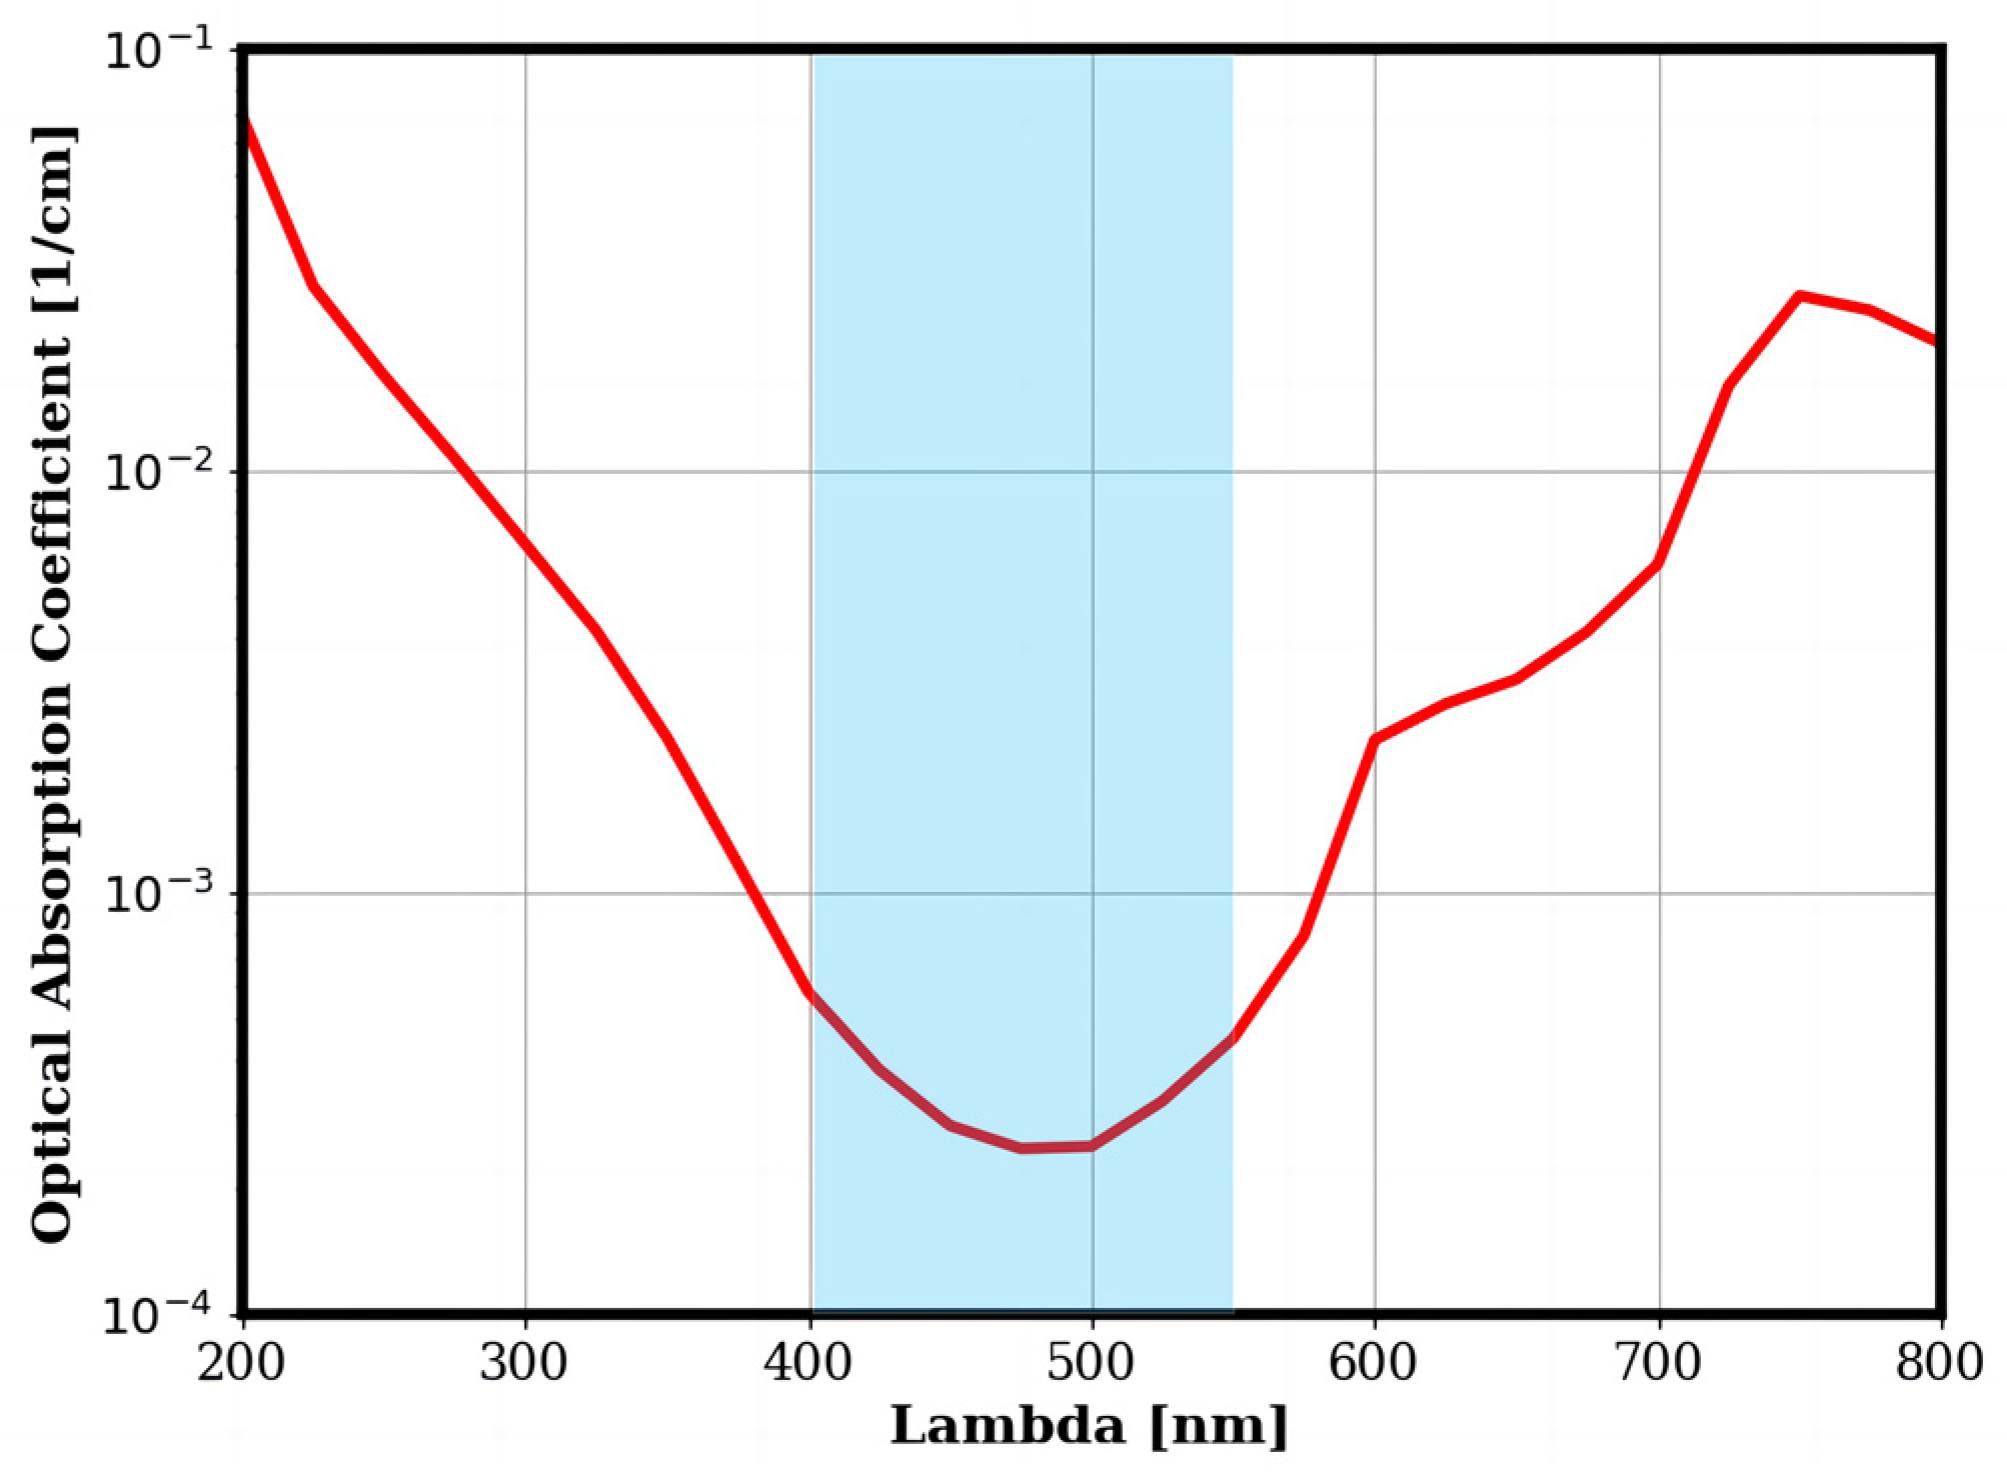
2.1.1. Absorption Model

The absorption of light by water is an inevitable loss in optical communication. Absorption can be conceptualized as the absorption occurring over a specific distance, as denoted by the absorption coefficient, a ( λ ) . This coefficient encompasses two components: the absorption attributed to pure seawater and the absorption attributed to the dissolved constituents. The relationship between the absorption coefficient a and the wavelength is stated as
a ( λ ) = a w ( λ ) + a g ( λ ) + a d ( λ )
In the equation above, a w represents the absorption coefficient of pure seawater, which contains pure water and ‰35 dissolved inorganic salts. a g is the absorption coefficient of yellow substances, and a d denotes the absorption coefficient of suspended particles. Using the absorption coefficient at 440 nm as a reference and the model a g , the absorption coefficient of yellow substances is modeled with the following equation [12]:
a g ( λ ) = a g ( 440 ) e S g ( λ 440 )
where a g ( λ ) refers to the absorption coefficient when the reference wavelength is λ . At a wavelength of 440 nm, the absorption coefficient ( a g ) is determined to be 0.243 m−1. The parameter S g represents the spectral slope of light absorption by yellow substances, exhibiting variation corresponding to different wavelengths of light. Specifically, when the wavelength is set to 440 nm, the value of S g is measured to be 0.014 nm−1. Other suspended particles have a similar absorption coefficient curve to yellow substances, and the absorption coefficient is independent of their concentrations and solely dependent on their distribution characteristics within seawater. Studies have shown that other suspended particles are generally found in relatively turbid seawater, and their absorption coefficient can be expressed as [13]:
a d ( λ ) = a d ( 440 ) e S g ( λ 440 )
where a d ( λ ) shows the absorption coefficient of other suspended particles, and a d ( 440 ) = 0.2   m −1. S d refers to the absorption slope of different wavelengths caused by other suspended particles, which is taken as 0.01 nm−1 here. Duntley S Q found that blue-green light with a wave band of 400–550 nm was much less attenuated in water than light with other wave bands when they were studying the transmission characteristics of light waves in seawater, which proves that there is a “seawater transmission window”, similar to the “atmospheric window” [14]. The underwater absorption spectrum is shown in Figure 1, according to which blue light of 450 nm was selected for the experiments in this paper for underwater wireless optical communication.

2.1.2. Scattering Model

The scattering of light waves in seawater primarily arises from the interaction between pure seawater and suspended particles, with the contribution of phytoplankton being disregarded. The relationship between the scattering coefficient and wavelength in transmission channels of seawater can be given by
b ( λ ) = b w ( λ ) + b d ( λ )
where the scattering coefficient of pure seawater is denoted as b w , and b d is the scattering coefficient of other suspended particles. The scattering of light waves in seawater can be categorized into Rayleigh scattering and Mie scattering based on the particle size present in the water. Scattering caused by particles with diameters shorter than the wavelength of the light wave is called Rayleigh scattering, while Mie scattering occurs when particle diameters are comparable to the wavelength. Pure seawater molecules have sizes significantly smaller than the wavelength of light, making them subject to Rayleigh scattering. According to the test data in the literature [15], the scattering coefficient of pure seawater is lower than 0.01 for light wavelengths above 400 nm, which means the influence is minimal. The scattering coefficient of other suspended particles can be given as
b d ( λ ) = 550 λ × b d ( 550 )
In the above equation, b d ( 550 ) represents the scattering coefficient at a reference wavelength of 550 nm. Here, b d ( 550 ) is equal to 0.125 D, and D means the concentration of other suspended particles in seawater, which is taken as 0.5 mg/m3, 1 mg/m3, and 2 mg/m3 in different scenarios [16]. When the wavelength of light remains constant, an increase in the concentration of other suspended particles results in a higher scattering coefficient. Conversely, for suspended particles of identical concentration, as the wavelength of light increases, the scattering coefficient decreases.

2.1.3. Communication Range Model of UWOC

The entire process of light transmission underwater can be described as a cumulative loss process where multiple factors contribute to the overall attenuation of the emitting power from the UWOC transmitter. The received signal power at the receiver is directly related to the maximum communication range in optical communication. Considering the optical-to-electrical conversion efficiency of the transmitter and receiver, as well as geometric losses, the optical power equation, assuming alignment between the transmitter and receiver, can be represented as
P R = P T × η t × η r × η d × e K ( λ ) × d
where:
  • P T is the initial transmitting power at the transmitting terminal;
  • P R is the optical power received by the light-sensitive component at the receiving terminal;
  • η t , as explained above, is the electrical-to-optical conversion loss of the transmitter;
  • η r reflects the efficiency of the receiver in converting incoming optical signals back into electrical signals;
  • η d is geometry loss, which is inversely proportional to the square of the communication range [17];
  • K ( λ ) is the attenuation coefficient of the transmission channels of seawater, which can be expressed as the sum of the absorption and scattering effects, yielding the equation,
    K ( λ ) = a ( λ ) + b ( λ )
    where d is the range between the transmitter and the receiver of optical communication. Upon analyzing the aforementioned equation, it is evident that the range between the transmitter and receiver, as well as the water quality, significantly impacts the received signal power. As the range and water quality attenuation coefficient increase, the power received at the receiving end decreases, affecting the quality of UWOC.

2.2. Analysis of “Effective Communication Space” in UWOC

The application of optical wireless communication in an underwater environment has its own peculiarities, where there is strong interference in the water. In particular, seawater’s disturbance often renders optical communication unstable and difficult to control. For example, when an AUV is equipped with an optical wireless communication device conducting data exchange, the navigational trajectory of the AUV is always changing as the vehicle moves. The continued change in the trajectory means that the relative position between different terminals of optical communication devices keeps changing, including the alignment angle and range. In practical optical communications, while the detected power decreases with increasing distance, the data rate typically remains constant over a certain range. However, beyond a specific range threshold, the weakening of the detected signal can lead to an increased error rate, necessitating a reduction in data rate or the use of more sophisticated error correction techniques to maintain communication integrity. On top of that, entering the buffer space with instability from the stable space is very limited. Consequently, accurately knowing where the “effective communication space” is and avoiding leaving the space when using optical communication are significant for keeping communications stable and continuous.
The term “effective communication space” refers to the specific space within which the same type of optical wireless device can achieve reliable communication under varying water quality conditions. The optical communication equipment itself does not give an indicator of the “effective communication space”, but determining this space is crucial for the successful implementation of optical wireless communication in underwater equipment like AUVs. Therefore, this paper establishes a model of the communication space, which is expected to contribute to the practical application of UWOC technology. By obtaining a communicable space, underwater vehicles can plan and control their navigation trajectory and target area ranges more effectively, ensuring underwater optical communications are always in a valid state. When determining the effective communication space, the position of the receiver in relation to the transmitter needs to be taken into account. In practical scenarios, the receiver and transmitter may not be perfectly aligned but have an angular shift or deviation, requiring a re-analysis of the received optical signal, as shown in Figure 2. Φ is the diffusion angle (full angle) of the transmitter’s emitted beam, and θ is the angle between the transmitter and receiver lens center line and the transmitter pointing vector. The variable d corresponds to the projected length of the transmitter–receiver spacing about the transmitter pointing vector, which indicates the range between the transmitter plane and the receiver plane.
The underwater wireless optical communication link loss during this process is investigated as follows:
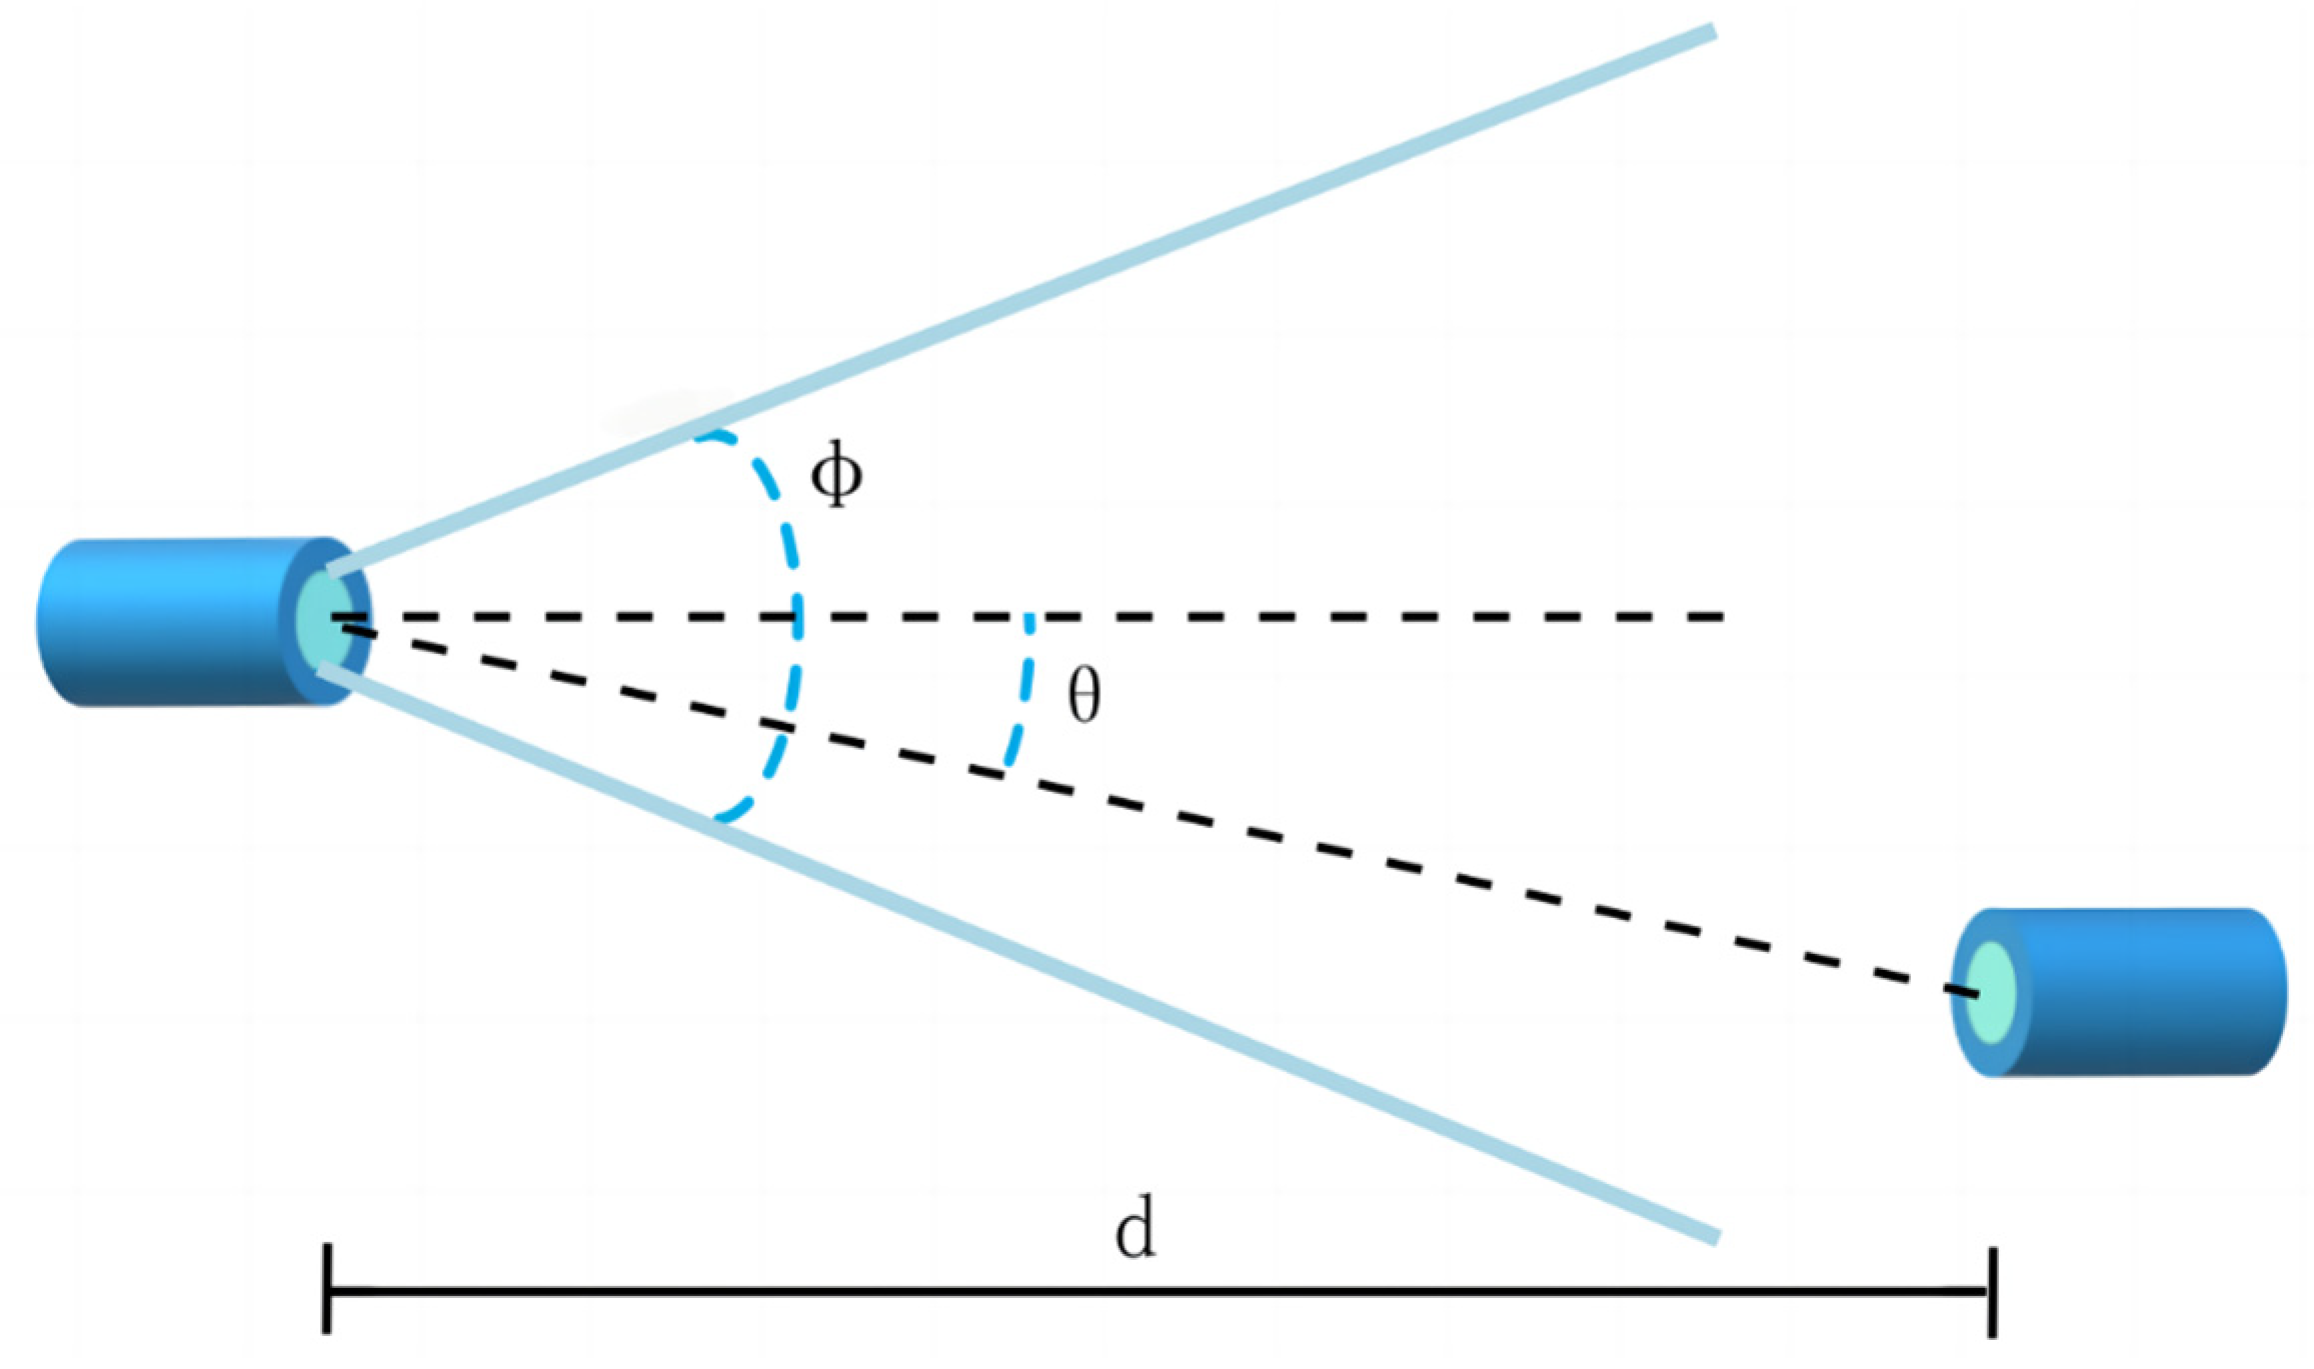
  • Geometrical loss: Owing to the effects of diffraction, not all incident beams necessarily reach the receiving plane. Furthermore, even among the beams capable of reaching the receiving plane, some may fail to enter the photodetector due to the consideration of the receiving aperture’s dimensions. Thus, when exclusively accounting for beam divergence, the optical power received at the receiver’s end is the product of the optical power emitted at the transmitter’s end and the ratio of the receiving aperture area to the area of optical intensity in the receiver’s range. Consequently, this ratio represents the geometric loss caused by system geometric factors.
  • Multipath Effect: When light is emitted from a transmitter and travels towards a receiver, a portion of the light follows the direct path (the minimum-distance path). However, varying amounts of energy are reflected from objects such as the water surface, seabed, and fish. These reflections cover longer ranges to reach the receiver, resulting in a delay phenomenon. Specifically, we aim to identify the most detrimental light path in terms of delay. The propagation velocity of light in a body of water is 2.25 × 10⁸ m/s. When transmitting an optical signal in water at a frequency of 10 MHz, which corresponds to a symbol duration of 100 ns, the multipath effect of the preceding signal extends up to a range of 22.5 m before two adjacent pulses completely overlap at the receiver. Beyond this transmission range, the optical signal is significantly attenuated and does not cause significant interference. Hence, we opt to disregard the multipath effect for communication speeds below 10 Mb/s [18].
Overall, the power of the optical signal received by the receiver at the specific position indicated in the figure can be determined using Equation (8) [19].
P R = P T × η t × η r × e K ( λ ) × d cos θ × A × cos θ 2 π d 2 × [ 1 cos ( Φ / 2 ) ]
In the above equation, P R , P T , η t , η r , K ( λ ) , d have the same meaning as in Equation (6) and denote the aperture area of the receiver. This equation takes into account not only the energy loss caused by the absorption scattering effect, but also the energy change caused by the source having a diffusion angle and the misalignment of the transceiver. However, the formula is simple in structure and can only describe the received power in the case of uniform beam energy distribution from the transmitter. In reality, the energy distribution of the UWOC beam is not uniform, resulting in the receiver receiving a smaller light signal than the calculated value of the equation for larger angles, and a larger light signal than the calculated value for smaller angles. In Equation (9), to join the consideration of the light distribution, f ( θ ) is a function of the light source distribution.
P R = P T × η t × η r × e K ( λ ) × d cos θ × A × cos θ 2 π d 2 × [ 1 cos ( Φ / 2 ) ] × f ( θ )
The model expressed by Equation (9) allows for the determination of the optical signal power received at specific locations. By utilizing the sensitivity value of the receiver, representing the minimum power, one can outline the contours of the minimum power across different positions. This graphical representation facilitates the calculation of the effective communication space. The model takes into account crucial parameters, including the transmission distance, representing the distance covered by the optical signal in water. It also considers the beam diffusion angle, reflecting the spread of the emitted light beam from the transmitter. Additionally, the relative position of the transmitter and receiver, which includes spatial relationships and angular deviations, is a crucial factor. Moreover, the model incorporates water quality characteristics, encompassing the impact of absorption and scattering on the transmission of optical signals. By comprehensively considering these parameters, the model provides a robust framework for understanding the spatial dynamics of optical wireless communication. It enables the determination of the effective communication space, essential for planning and optimizing underwater communication systems.

3. Underwater Optical Wireless Communication Experiment

In order to verify the validity of this model, a series of trials are conducted in different water conditions, such as a pond, an inland lake, and near-shore areas, using trial equipment, like optical communication devices and a water quality attenuation tester. A dedicated test fixture was designed to provide the capability to position two modems underwater in arbitrary configurations relative to each other. The fixture- facilitates the precise translation of the transmitter with respect to the receiver at arbitrary ranges. The trial process commenced with the measurement of the attenuation coefficient of water. Subsequently, underwater optical communication trials were performed using the same optical communication devices to collect data on the effective communication space. These comprehensive trials served the purpose of verifying the accuracy and reliability of the model in predicting the behavior of underwater optical communication in real-world scenarios.

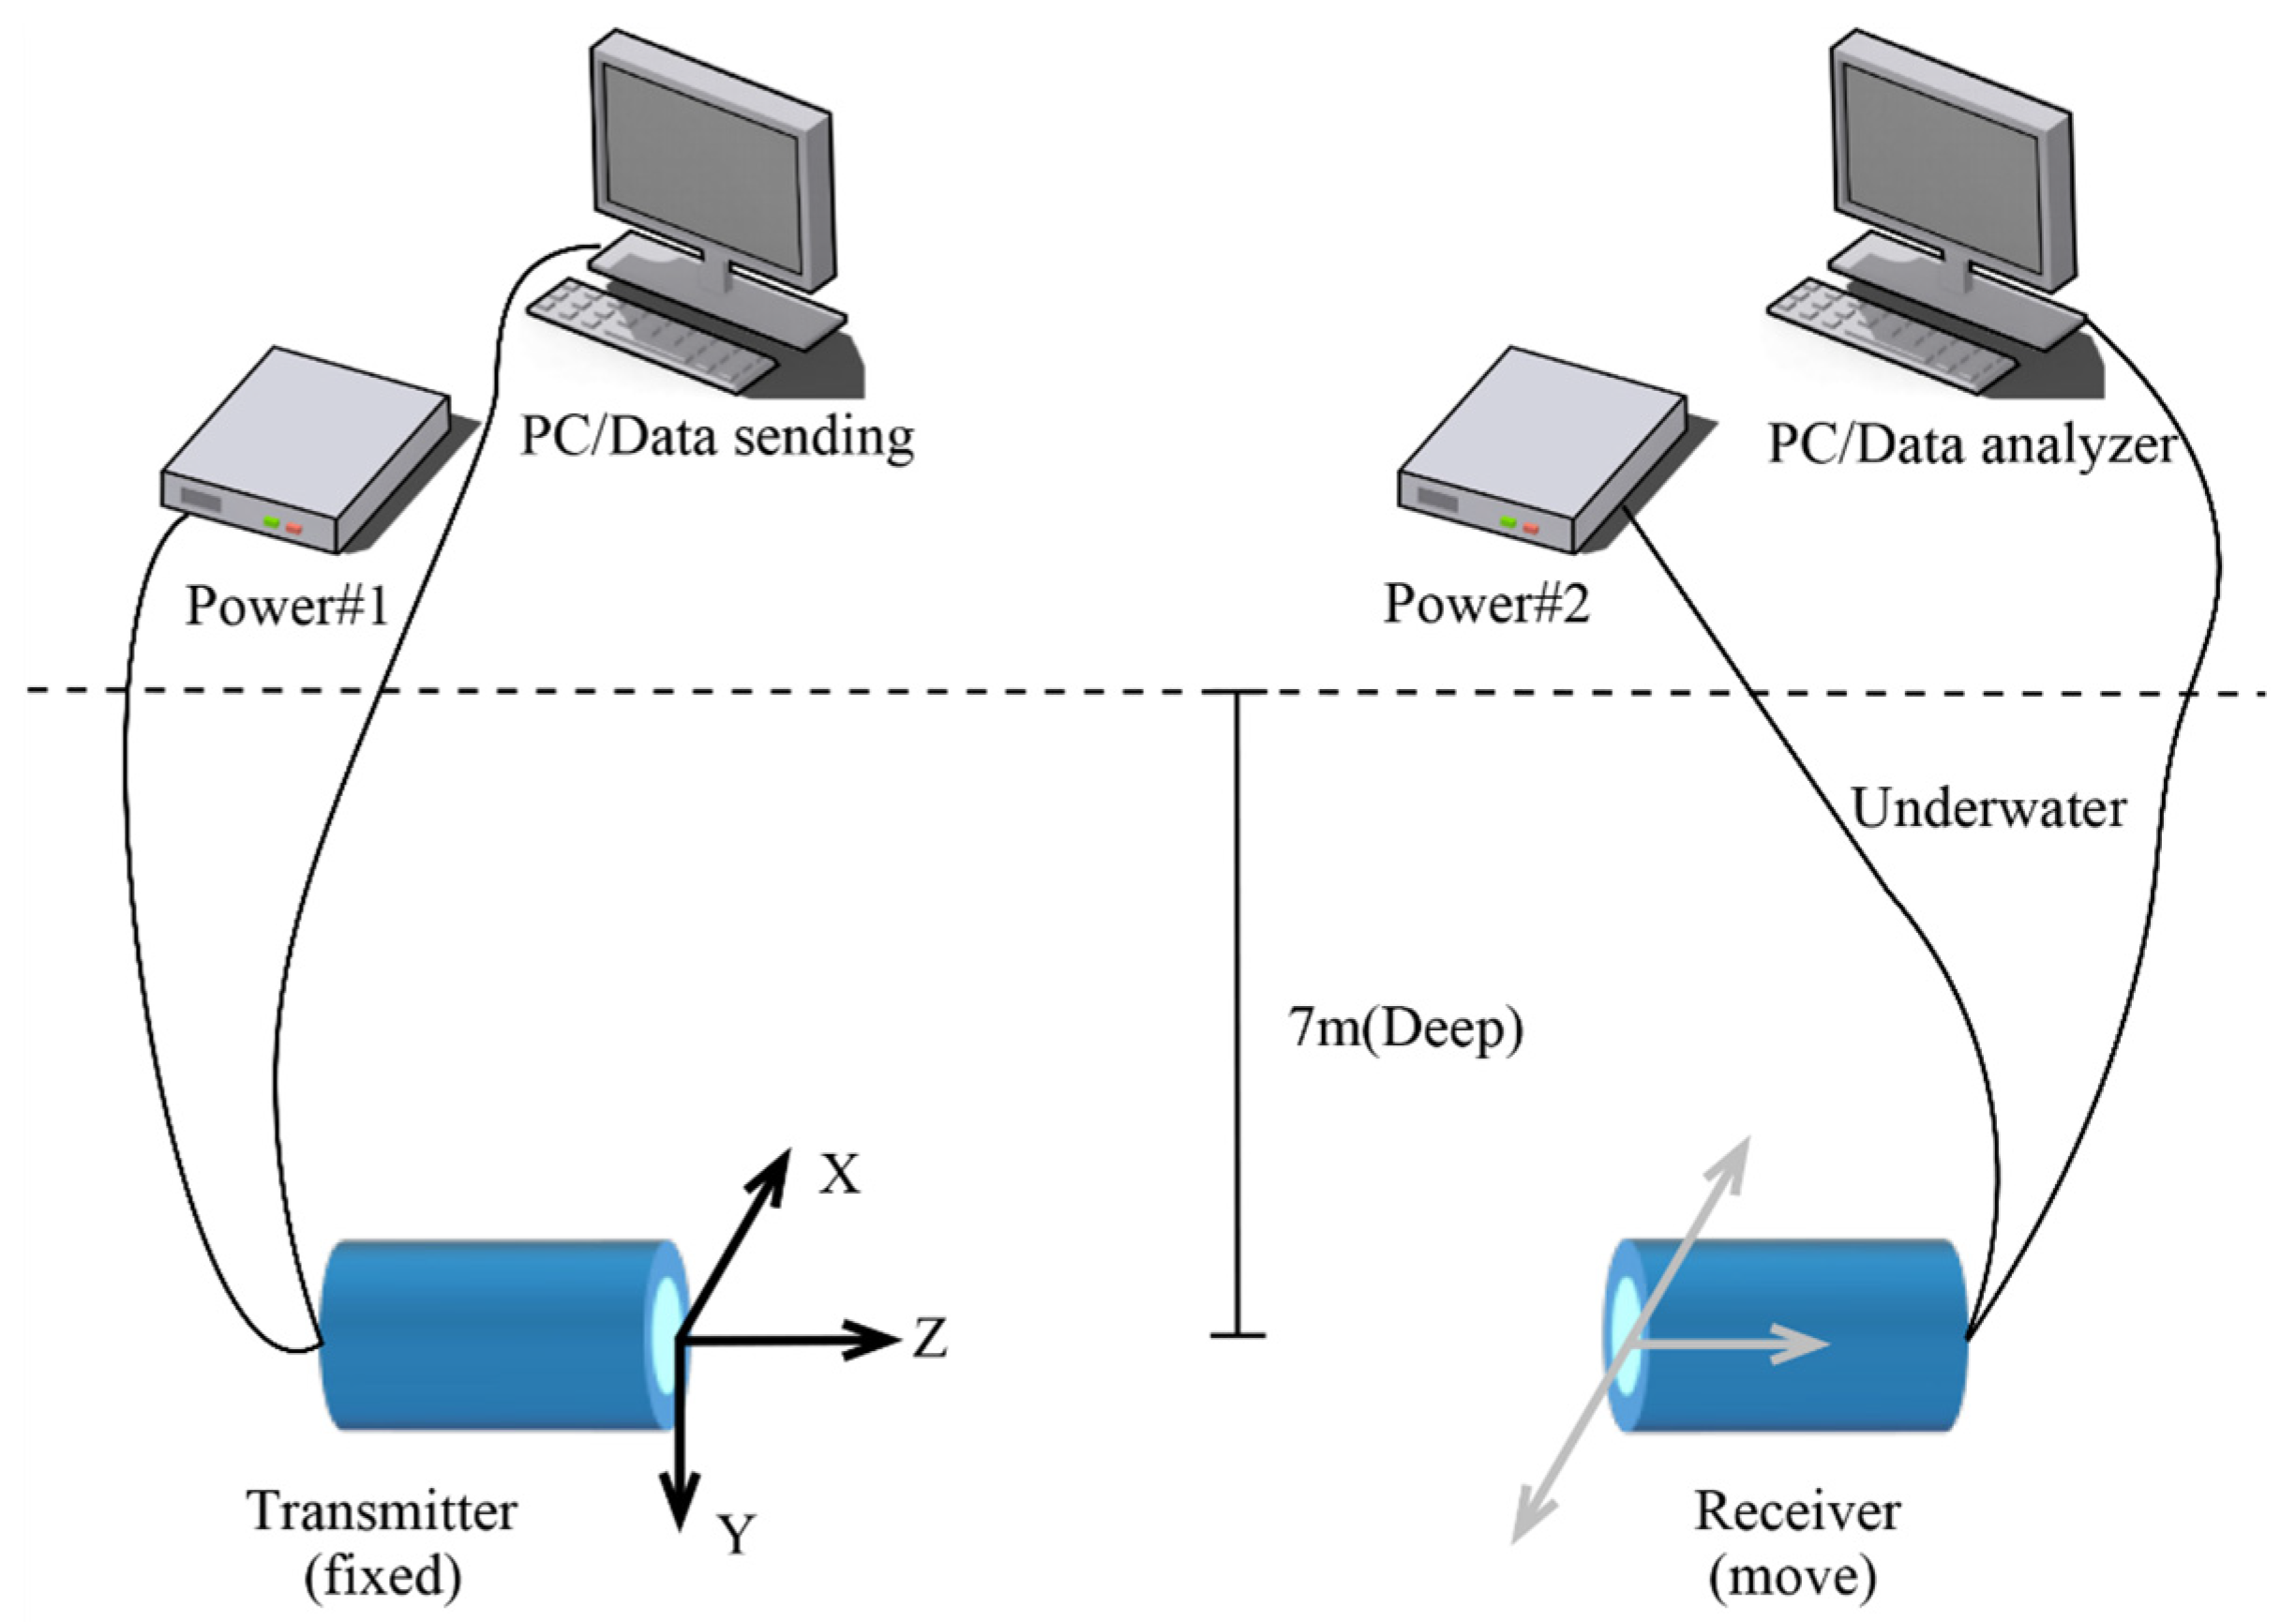
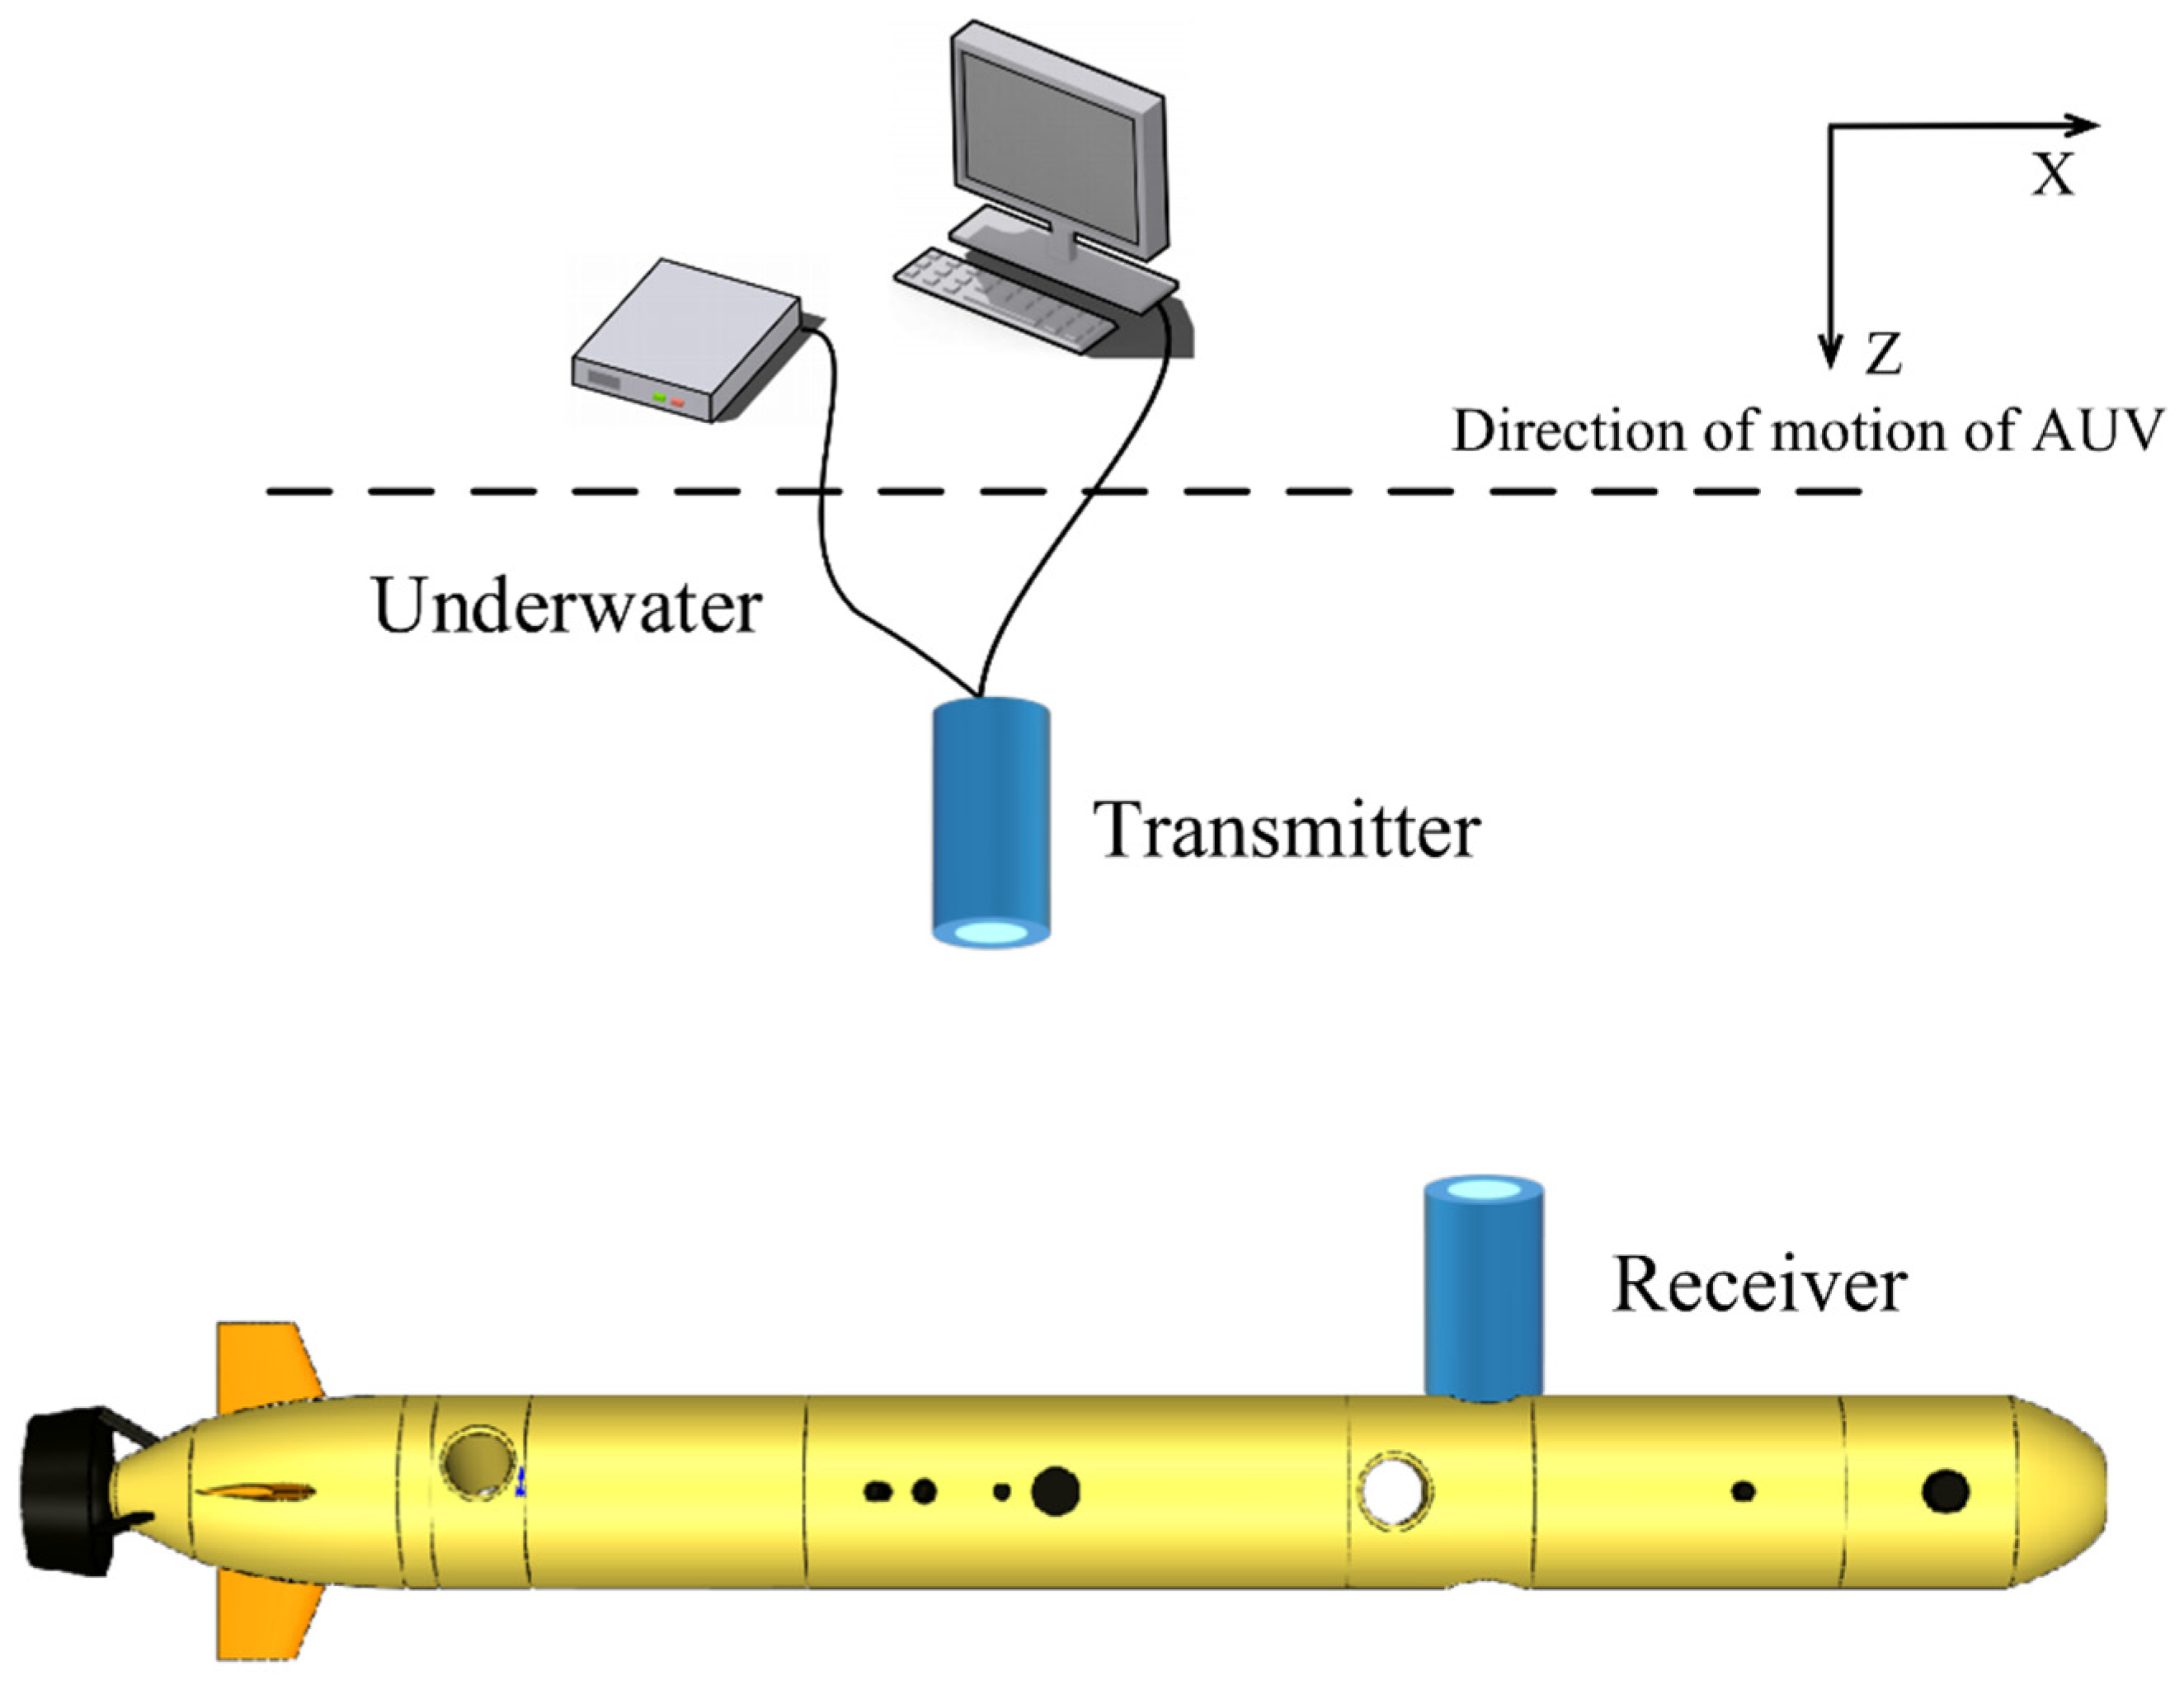
3.1. Experimental Setup

The water quality attenuation tester utilized in the trials employs an LED light source that allows for the measurement of the attenuation coefficient of light in water across a wide range of wavelengths, specifically, from 360 nm to 720 nm. The measurement accuracy of the tester is less than 0.2%, and this ensures precise and reliable measurements of the attenuation coefficient. The specific measurement range is provided in Table 1. This device offers optical path lengths of 10 mm, 50 mm, 100 mm, 150 mm, and 250 mm, allowing for accurate attenuation measurements across diverse water quality scenarios and application contexts. The term “Range (1/m) @400 nm” refers to the range of attenuation coefficients that can be measured for light with a 400 nm wavelength. These values represent the attenuation experienced by the light as it travels through a 1 m thick water sample.
The experimental parameters of the optical communication devices used in the trials are provided in Table 2. In our study, we opted for LEDs as the light source for underwater optical communication because of their practical advantages. LEDs are cost-effective and consume less power compared to lasers, making them a more efficient choice for this application. Additionally, LEDs are less alignment-sensitive, offering advantages in dynamic underwater environments where maintaining precise transmitter–receiver alignment is challenging due to factors like water currents and vehicle movements. Their wider beam spread compensated for alignment variability, aligning with our goal of robust, efficient communication in such settings. The communication signal was in the On–Off Keying (OOK) format, which typically represents a voltage signal. In OOK modulation, high and low signal levels correspond to logic ‘1’ and ‘0’, respectively. In the context of underwater communication, the light intensity of an LED is contingent on its drive current, and therefore, high and low levels correspond to the presence and absence of light output, respectively. OOK modulation was employed due to its effective channel adaptation underwater and its extensive utilization in previous trials [20].
As presented in Table 2, an LEDs were employed as the light source, and its radiation intensity distribution was assessed using an angular photometer. Due to the three-dimensional nature of the light field, half-angle intensities were recorded at 0 degrees/180 degrees, 45 degrees/225 degrees, 90 degrees/270 degrees, and 135 degrees/315 degrees in the cross-section to illustrate its light intensity distribution. In Figure 3, the dotted line represents the relative radiant intensity distribution of the light emitted by the optical communication device. Observations of the measured data revealed that the radiation pattern of the LEDs used in our system is more concentrated and less diffuse than that described by the Lambertian model. While the Lambertian model is a good general representation for many optical sources, it assumes a perfectly diffusive emitting surface, which was not the case for our specific LED setup. Consequently, to accurately represent the light intensity distribution of the LEDs, we adopted a Gaussian function for fitting the measured data. This approach provided a superior fit, capturing the nuances of the LEDs’ emission characteristics more effectively. The results of this Gaussian fitting are illustrated by the black line in Figure 3. The Gaussian function is represented by Equation (10), which describes the relationship between the divergence angle (X-axis) in degrees and the relative intensity (Y-axis) as a percentage. The close alignment between the curves suggests a significant resemblance between the observed radiation intensity distribution and a centrally symmetric Gaussian distribution. Consequently, in model (9), Equation (10) is utilized to calculate the function f ( θ ) .
f ( θ ) = e ( θ μ ) 2 2 σ 2 , ( μ = 0 , σ = 14.53 )
A measurement platform was specifically designed for the test site. This platform served the purpose of fixing the underwater wireless optical communicator transmitter. The receiver was connected to the measurement slider, which could move freely in the X-Z plane on a rail. The rail was fixed with a scale and the pointer was on the slider. The measurement platform was 15 m long in the Z direction, 7 m long in the Y direction, and 6.3 m long in the X direction. This ensured sufficient space for conducting experiments and positioning the transmitter and receiver at the desired depths underwater. The entire experimental system, as shown in Figure 4, comprised several components. These included the transmitter, receiver, signal-transmitting PC, signal-receiving PC, underwater cable, and two power supplies. Both the transmitter and receiver were located 7 m underwater and were connected to the power supply and test equipment ashore via underwater cables. This setup enabled the transmission and reception of signals between the underwater devices and the shore-based equipment, facilitating the measurement and analysis of the optical communication performance.
By varying the position of the receiver of the optical communication device along the X and Z axes in specific increments, changes in communication status were observed to determine the maximum communication range and the effective communication space. To measure the maximum communication range, the transmitter was kept parallel and aligned with the receiver. The transmitter was fixed at coordinates (0,0,0) and the receiver was translated in a straight line at X = 0 and Y = 7. Initially, the receiver was moved along the Z-axis at a spacing of 1 m until the results of the two measurements before and after were successful and unsuccessful, at which point the slider was moved at intervals of 0.1 m instead, and the maximum Z value of the receiver that could complete the communication was recorded. For measuring the effective communication space, the transmitter and receiver were still kept parallel, but they were no longer aligned. The transmitter remained fixed, while the receiver was moved at different Z-axis distances for the X-axis movement. The process began with initial displacement to a distance of 1 m for approximate measurements. Subsequently, the receiver was adjusted at intervals of 0.2 m to facilitate precise measurements. This systematic approach enabled the accurate determination of the final effective communication space.

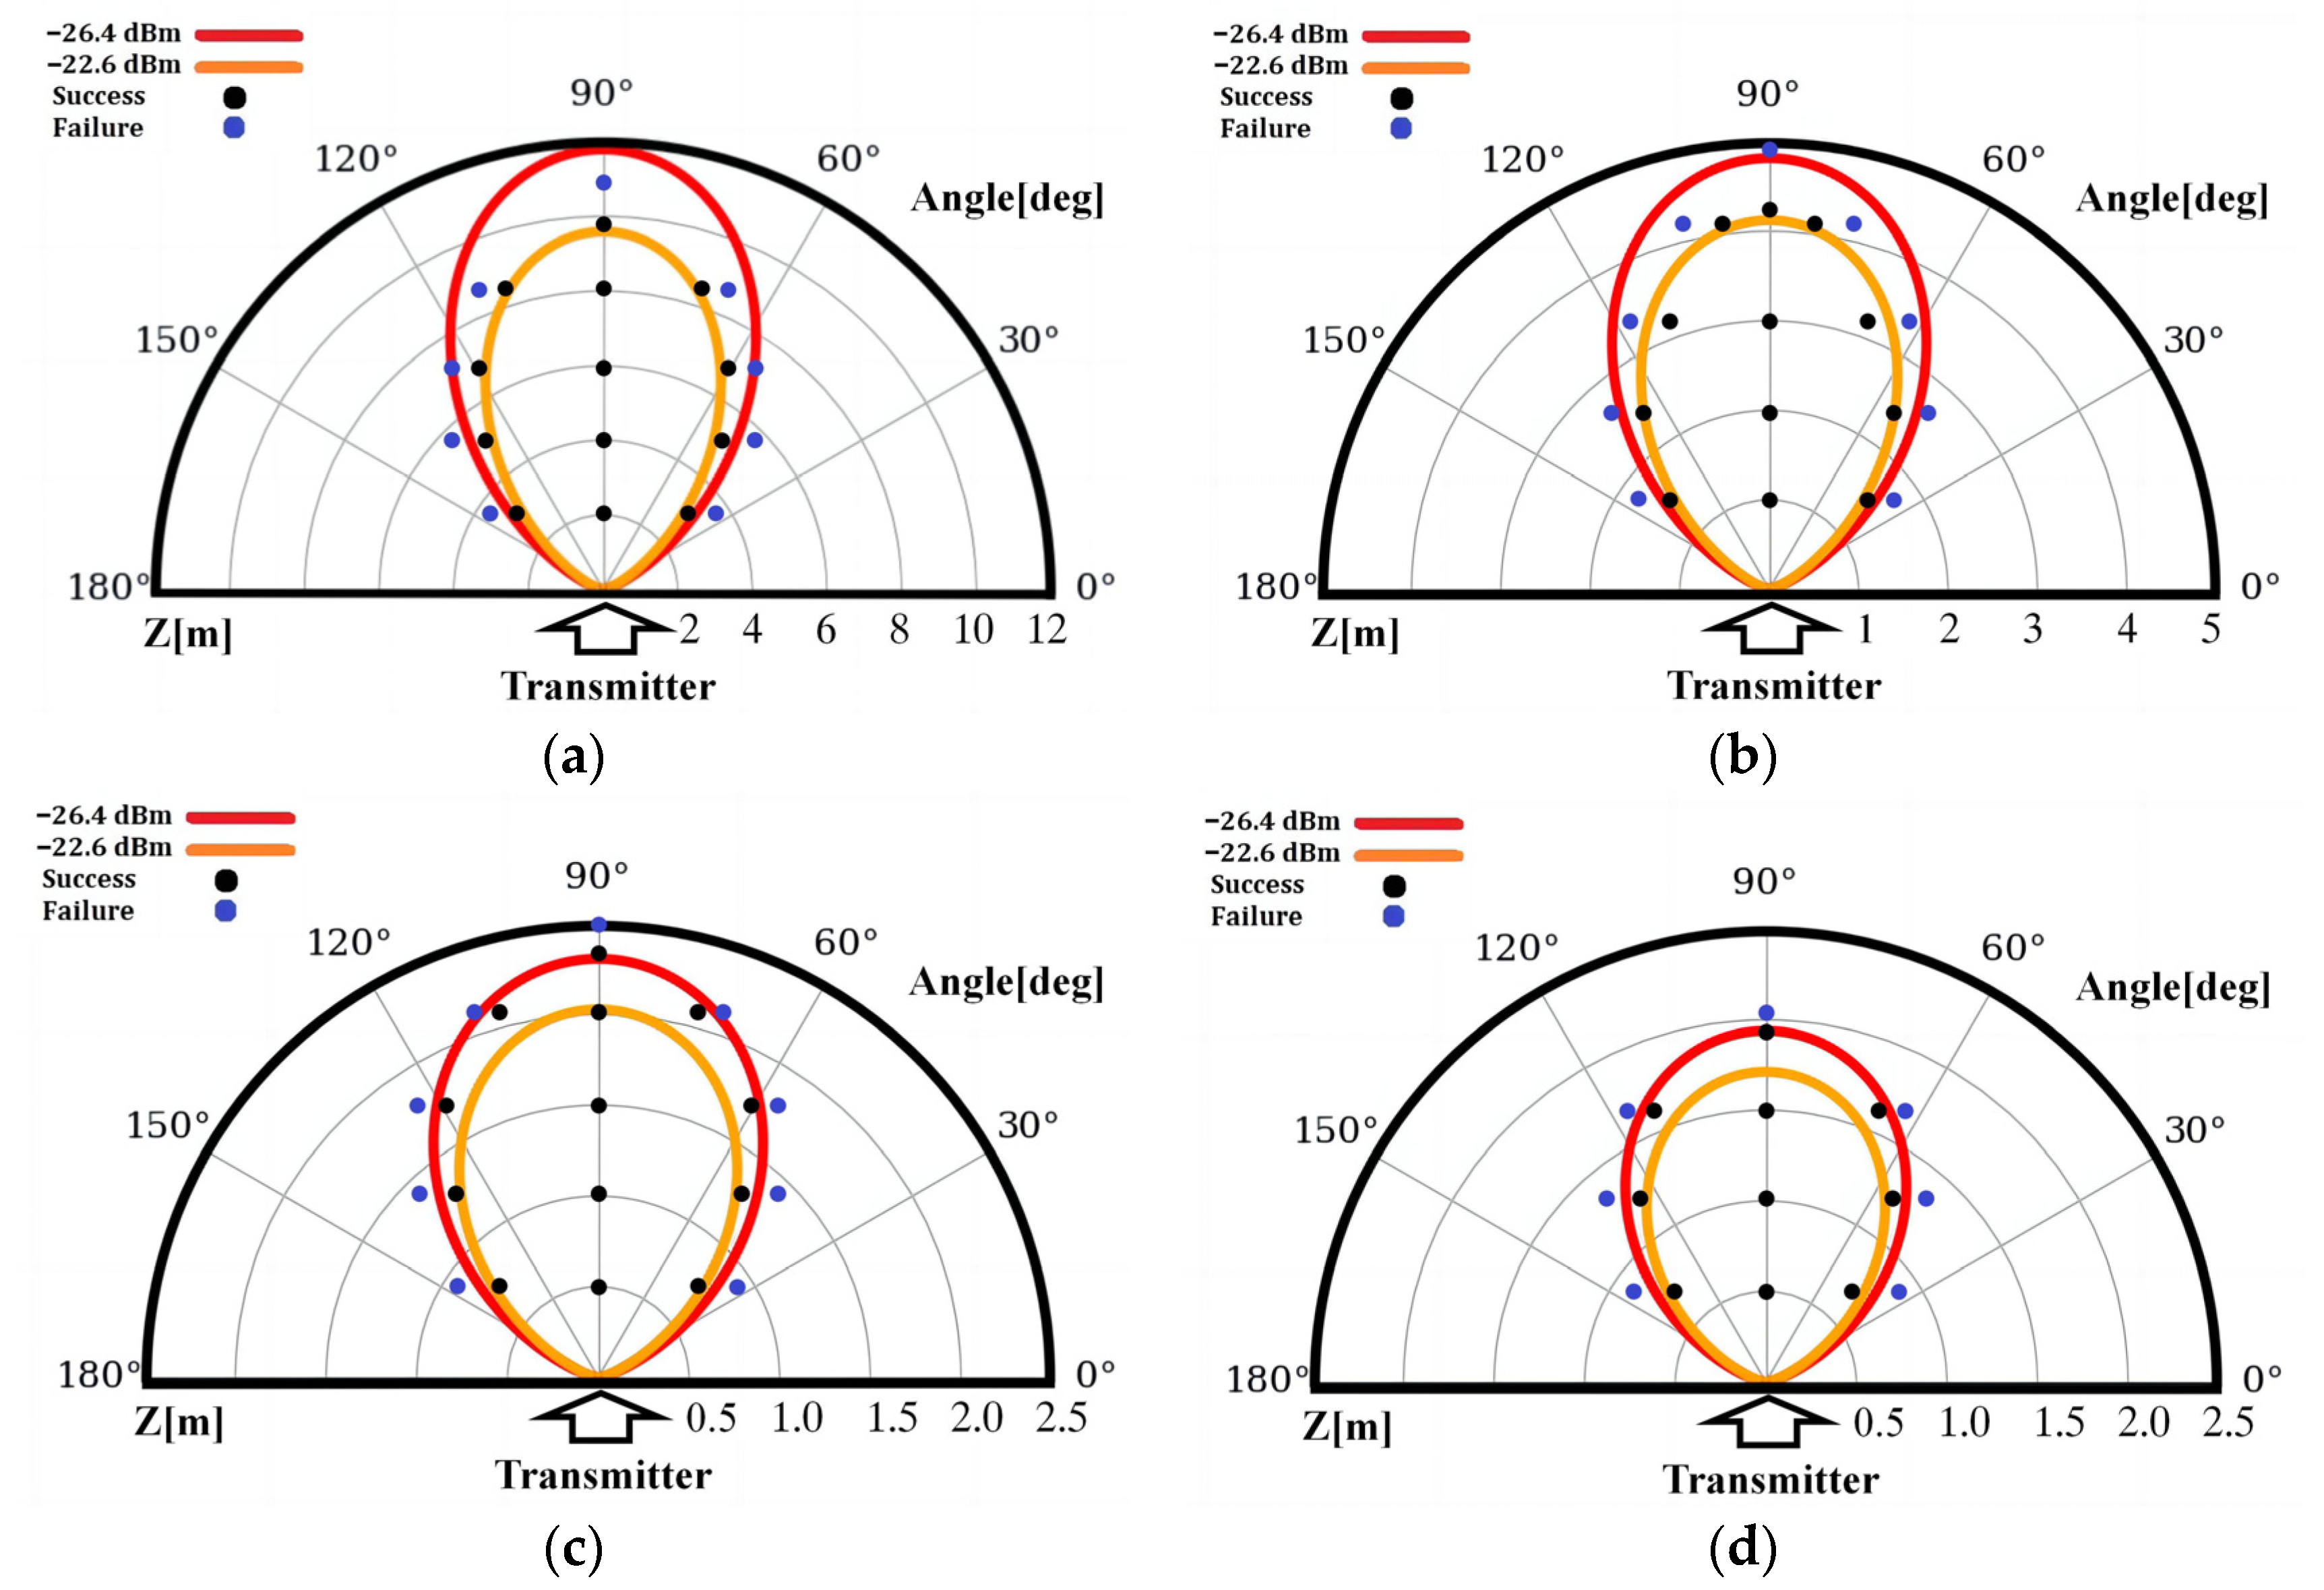
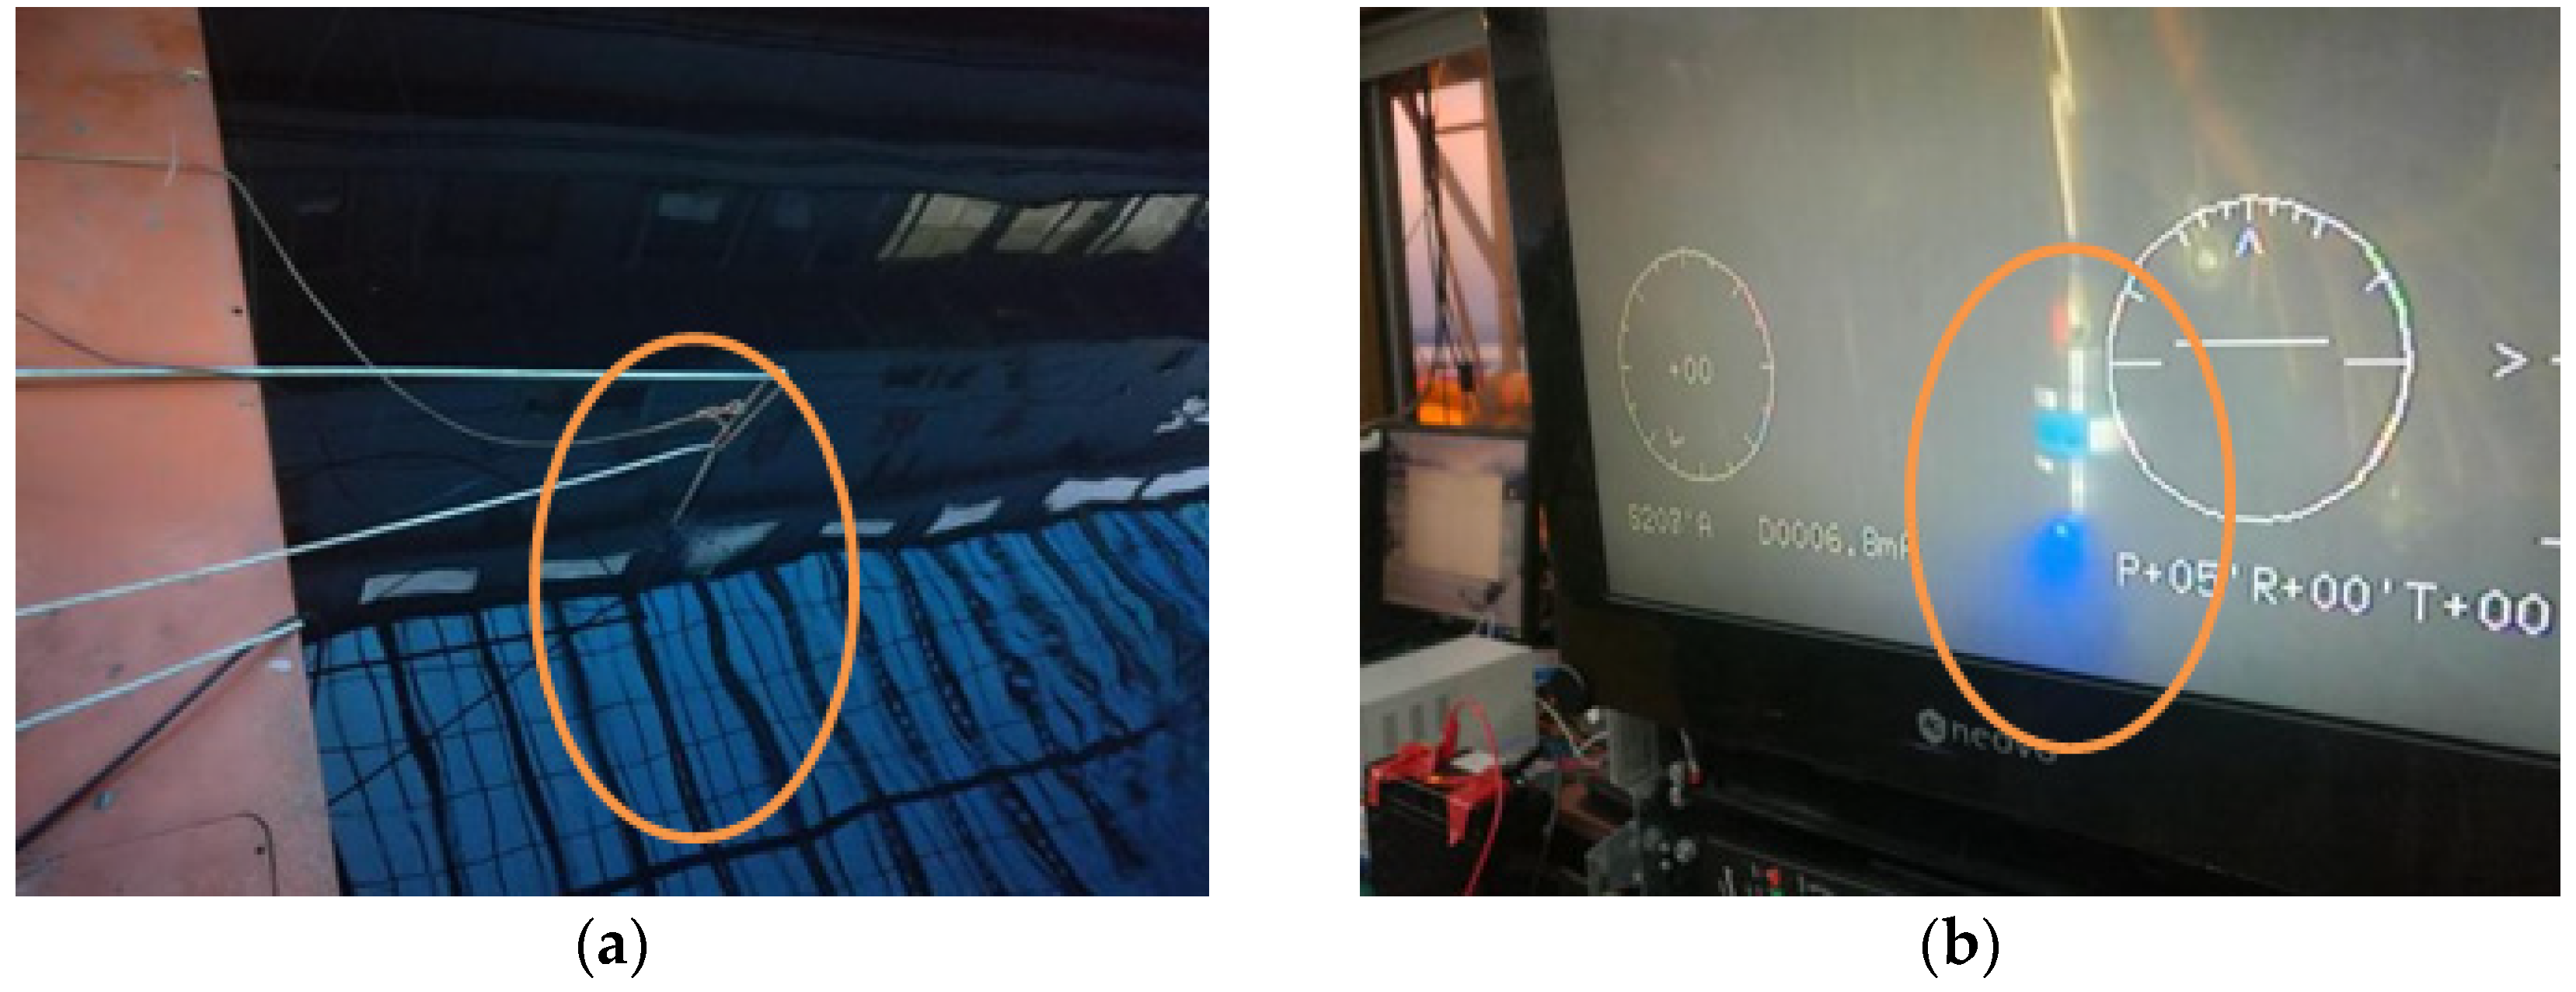
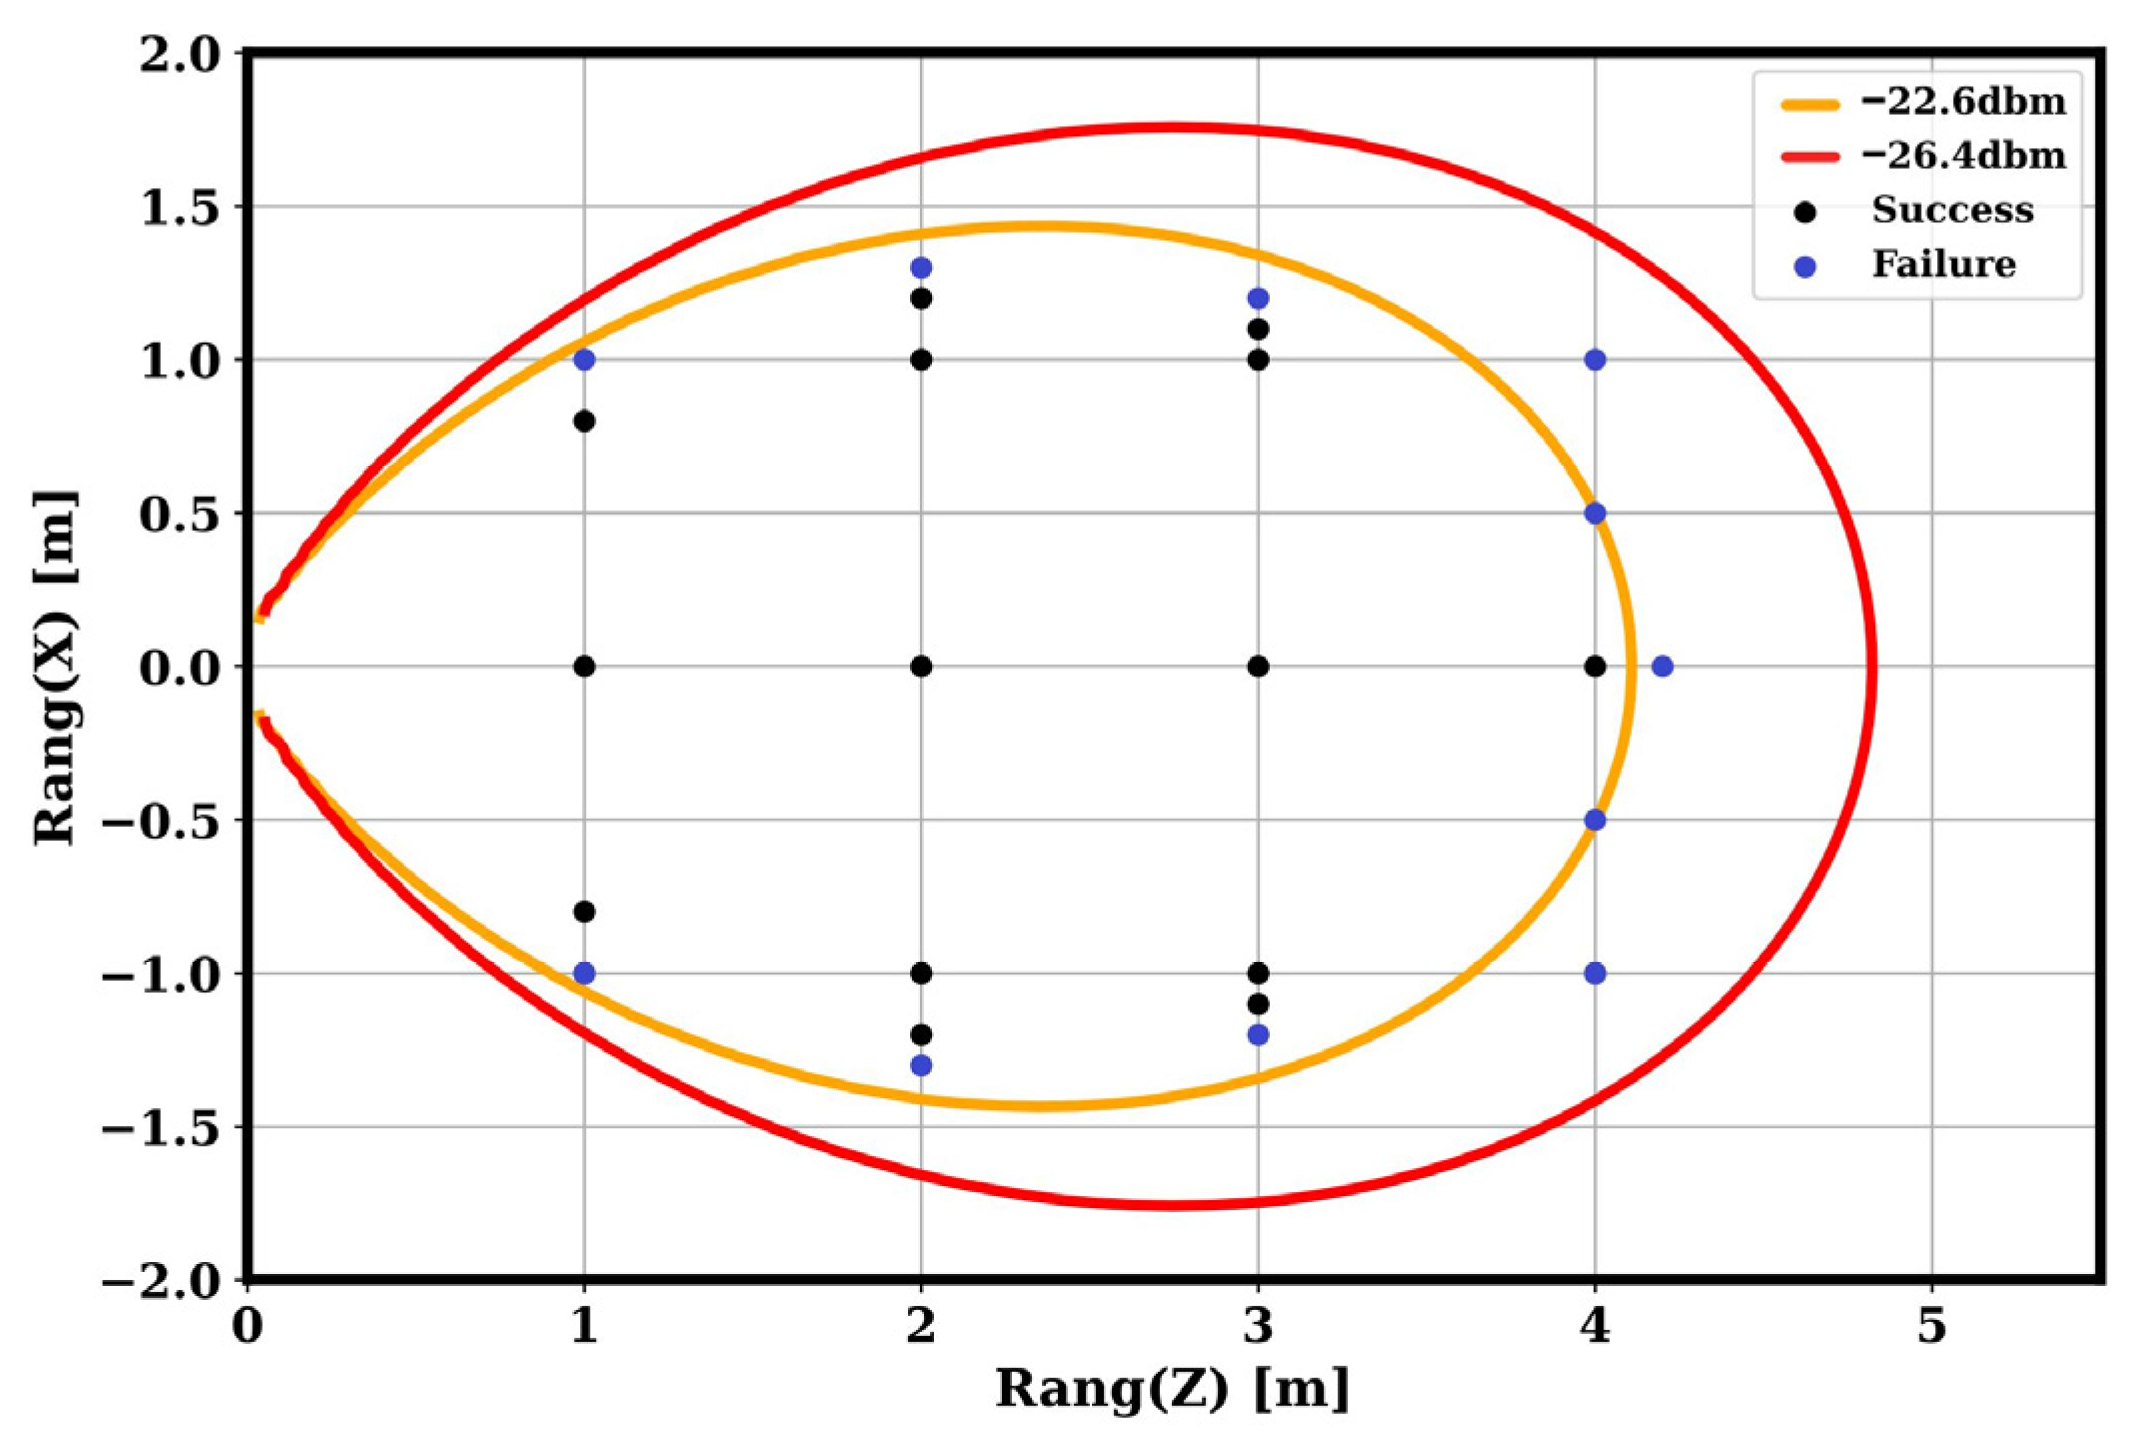
3.2. Experimental Results and Discussion

In this study, wireless optical communication experiments were conducted at four distinct locations with varying water qualities, namely a pond, The Qipan Mountain, The Guanshan Lake, and Benxi. Table 3 lists the attenuation coefficients for different water qualities, along with the corresponding maximum optical communication ranges and associated bit error rates (BERs).
Figure 5 presents the relationship between water quality (attenuation coefficient) and the maximum communication range, assuming a constant optical-electrical loss in model (6), with the consideration that the received power has an accuracy range of ±10%. The data points represent the experimental results, while the solid line represents the model prediction.
From Figure 5, it is evident that the experimental data and the model demonstrate good agreement at a medium range but exhibit centimeter-level discrepancies at both short and long ranges. The model’s error is dependent on the range, and we speculate that this discrepancy can be attributed to the effects of multipath and environmental light. At longer communication ranges, the channel experiences more interference, causing the actual transmission range to be lower than the model predictions. Conversely, at shorter communication ranges, the impact of interference on optical communication is minimal, resulting in the actual transmission range being higher than the model predictions.
Figure 6 illustrates the effective communication space for different spatial configurations of the transmitter and receiver under various water qualities, as simulated using model (9). These simulations take into account received power with an accuracy range of ±10%. The transmitter is positioned at the origin along the Z-axis, while the X-axis and Z-axis represent the relative position of the receiver, oriented parallel to the transmitter but not aligned with it. The red and orange curves in the graphs represent received sensitivities of −26.4 dBm and −22.4 dBm, respectively. The black and blue dots in the graphs represent actual data points collected during the experiments, with black indicating successful communication and blue indicating failures. To simplify the plot, only the most critical data points are displayed. During experiments conducted in the pond, the receiver was moved at 2 m intervals along the Z-axis to account for long range. However, in the lake environment, the receiver was moved at 1 m intervals to ensure a more accurate analysis. This change in the interval between the pond and lake experiments allows for a more comprehensive assessment of communication performance and behavior in different scenarios.
The experimental data indicate that the error between the measured values and the model predictions is small for the medium communication range in the lake water, with differences in the communication range being maintained within approximately 10 cm. Similarly, for long-range communication in the pond with higher interference, the differences in the communication range are also maintained around 1 m for angles θ < 3 0 . However, at θ = 4 5 , the error reaches a magnitude of meters, and the actual effective communication space is smaller than the value predicted by the model. In cases of communication with poor water quality and shorter ranges, the experimental data tend to align more closely with the results of the model using higher sensitivity (−26.4 dBm). Conversely, in scenarios with better water quality and longer ranges, the experimental data tend to align more closely with the results of the model using lower sensitivity (−22.4 dBm). As a result, in practical applications, higher sensitivity coefficients may be employed to predict the effective communication space for shorter ranges, while lower sensitivity coefficients may be more suitable for modeling longer ranges. The experimental data reveal that the effective communication space measured is narrower in shape compared to the space predicted by the model. We attribute this discrepancy to the omission of the optical characteristics of the waterproof casing of the optical communication device during the modeling process. The waterproof casing has an impact on the scattering characteristics of the light source and causes light reflection phenomena at the receiver, resulting in a reduction in the received energy. Additionally, when the transmitter and receiver are misaligned with a large deviation, it poses a greater challenge to the receiver’s sensitivity at different angles. The greater the angular deviation, the weaker the signal received by the receiver, resulting in a smaller effective communication space.

4. Application of Underwater Optical Wireless Communication

In this study, a trial conducted in a lake environment is designed to validate the effective communication space of UWOC for the application of AUVs in automatically collecting data from fixed underwater nodes. The primary aim of this trial is to assess the practical value of employing UWOC in real-world scenarios involving AUVs and fixed underwater nodes. A schematic diagram illustrating the setup of the trial is presented in Figure 7.
The experimental setup involved pre-configured communication parameters for the optical communication equipment, which was powered on and ready to operate. One of the optical communication devices was positioned at a fixed node, immersed in the lake at a depth of 7 m. The other optical communication device was carried by an AUV, as illustrated in Figure 8. The AUV followed autonomous navigation guidelines to enter the optical communication space and automatically transmitted data to the optical communication device at the fixed node. Throughout the experimental process, the AUV maintained a constant depth using a hovering control method and documented the optical communication status at different locations, as depicted in Figure 9. Upon receiving the command to cease communication, the AUV automatically withdrew from the optical communication zone, completing the necessary operations. The experimental results indicated that the AUV’s actual effective communication space was largely consistent with the established communication space model, although a minor deviation was observed. This deviation amounted to approximately 90% of the predicted range of the model. It is surmised that this variation may be attributed to the impact of water waves caused by the AUV’s movement, which led to diminished communication performance. Additionally, when the AUV exceeded the predetermined spatial range, noticeable attenuation of the communication signal was observed, validating the utility of the optical communication space model in real-life scenarios and providing valuable insights for the practical application of optical communication systems in underwater environments.

5. Conclusions

In this research, we addressed the application of underwater wireless optical communication at different water quality conditions. A simplified model of the optical communication channel was developed, allowing us to analyze the relationship between water quality and communication range. The validity of the model was verified through the design and implementation of precise measurement experiments, and the causes of model errors were analyzed. Furthermore, the concept of “effective communication space” was introduced for UWOC in our study. This concept aims to address the limitation of using communication distance as the sole metric for assessing the spatial coverage of communication systems. By incorporating this concept, we provide a more comprehensive and multi-dimensional approach to evaluating the extent of communication reach, transcending the traditional reliance on linear distance measurements. Building upon the range model, we developed a model to analyze the effective communication space and conducted tests to determine the effective communication space of optical wireless communication devices under different water quality conditions. Additionally, we designed experiments for wireless optical communication on an AUV underwater mobile platform and conducted tests in a lake. The results demonstrated the applicability and value of the effective communication space model, providing a basis for future engineering applications. In conclusion, our future research endeavors will focus on expanding the current knowledge on UWOC. These efforts will involve enhancing the accuracy of the communication channel model, exploring different modulation techniques, analyzing the impact of environmental factors on communication performance, and investigating new applications for underwater equipment. In particular, conducting experiments in marine environments will be the next focal point of our research. This step is crucial to validating and refining the adaptability of our theoretical models to more challenging ocean conditions. Through these endeavors, our goal is to advance our comprehension and capabilities in the field of underwater optical wireless communication, with the ultimate aim of contributing to the development of practical engineering solutions in this domain.

Author Contributions

Conceptualization, K.S.; methodology, K.S. and Y.L.; validation, Z.H.; formal analysis, Y.L.; investigation, all authors; writing—original draft preparation, Y.L.; writing—review and editing, all authors; visualization, K.S.; supervision, K.S. All authors have read and agreed to the published version of the manuscript.

Funding

This research was funded by the State Key Laboratory of Robotics foundation (no. 2017-Z05).

Institutional Review Board Statement

Not applicable.

Informed Consent Statement

Not applicable.

Data Availability Statement

The data presented in this study are available in the article.

Conflicts of Interest

The authors declare no conflicts of interest.

References

  1. Zeng, Z.; Fu, S.; Zhang, H.; Dong, Y.; Cheng, J. A Survey of Underwater Optical Wireless Communications. IEEE Commun. Surv. Tutorials 2017, 19, 204–238. [Google Scholar] [CrossRef]
  2. Fei, C.; Hong, X.; Zhang, G.; Du, J.; Gong, Y.; Evans, J.; He, S. 166 Gbps data rate for underwater wireless optical transmission with single laser diode achieved with discrete multi-tone and post nonlinear equalization. Opt. Express 2018, 26, 34060–34069. [Google Scholar] [CrossRef] [PubMed]
  3. Zhang, L.; Wang, Z.; Wei, Z.; Chen, C.; Wei, G.; Fu, H.Y.; Dong, Y. Towards a 20 Gbps multi-user bubble turbulent NOMA UOWC system with green and blue polarization multiplexing. Opt. Express 2020, 28, 31796–31807. [Google Scholar] [CrossRef] [PubMed]
  4. Hao, D.; Li, B.; Yang, Y.; He, F. Research on Transmission Characteristics of Underwater Wireless Optical Communication Channels. Autom. Instrum. 2021, 9, 21–24. [Google Scholar]
  5. Jaruwatanadilok, S. Underwater Wireless Optical Communication Channel Modeling and Performance Evaluation using Vector Radiative Transfer Theory. IEEE J. Sel. Areas Commun. 2008, 26, 1620–1627. [Google Scholar] [CrossRef]
  6. Gabriel, C.; Khalighi, M.-A.; Bourennane, S.; Léon, P.; Rigaud, V. Monte-Carlo-based channel characterization for underwater optical communication systems. J. Opt. Commun. Netw. 2013, 5, 1–12. [Google Scholar] [CrossRef]
  7. Tang, S.; Dong, Y.; Zhang, X. Impulse Response Modeling for Underwater Wireless Optical Communication Links. IEEE Trans. Commun. 2014, 62, 226–234. [Google Scholar] [CrossRef]
  8. Chen, J.; Zhao, L.; Jiang, M.; Wu, Z. Sherman-Morrison Formula Aided Adaptive Channel Estimation for Underwater Visible Light Communication with Fractionally-Sampled OFDM. IEEE Trans. Signal Process. 2020, 68, 2784–2798. [Google Scholar] [CrossRef]
  9. N’doye, I.; Zhang, D.; Alouini, M.S.; Laleg-Kirati, T.M. Laleg-Kirati. Establishing and Maintaining a Reliable Optical Wireless Communication in Underwater Environment. IEEE Access 2021, 9, 62519–62531. [Google Scholar] [CrossRef]
  10. Pal, A.; Campagnaro, F.; Ashraf, K.; Rahman, M.R.; Ashok, A.; Guo, H. Communication for Underwater Sensor Networks: A Comprehensive Summary. ACM Trans. Sen. Netw. 2023, 19, 1–44. [Google Scholar] [CrossRef]
  11. Weng, Y.; Matsuda, T.; Sekimori, Y.; Pajarinen, J.; Peters, J.; Maki, T. Establishment of line-of-sight optical links between autonomous underwater vehicles: Field experiment and performance validation. Appl. Ocean Res. 2022, 129, 103385. [Google Scholar] [CrossRef]
  12. Zhang, X.; Zhang, S. Research Development Concerning Yellow Substances in Seawater. J. Oceanogr. Huang Hai Bo Hai Seas 2008, 18, 89–92. [Google Scholar]
  13. Hansell, D.A.; Carlson, C.A. Biogeochemistry of Marine Dissolved Organic Matter; Academic Press: Amsterdam, The Netherlands, 2014. [Google Scholar]
  14. Duntley, S.Q. Light in the Sea. JOSA 1963, 53, 214–233. [Google Scholar] [CrossRef]
  15. Smith, R.C.; Baker, K.S. Optical Properties of the Clearest Natural Waters (200–800 nm). Appl. Opt. 1981, 20, 177–184. [Google Scholar] [CrossRef] [PubMed]
  16. Ma, Y.; Lin, H.; Ai, Q.; Liang, M. Marine Red Tide Monitoring based on Biological Optical Algorithm. Acta Opt. Sin. 2009, 28, 7–11. [Google Scholar] [CrossRef]
  17. Han, B.; Yang, J.; Sun, K.; Sun, Y. Experimental demonstration of a transmitter with a 50° divergence angle, 50 Mbps rate, and 476 mW optical power for underwater wireless optical communication based on an engineered diffuser. Appl. Opt. 2022, 61, 3598–3603. [Google Scholar] [CrossRef] [PubMed]
  18. Doniec, M.; Angermann, M.; Rus, D. An End-to-End Signal Strength Model for Underwater Optical Communications. IEEE J. Ocean Eng. 2013, 38, 743–757. [Google Scholar] [CrossRef]
  19. Liu, A.; Zhang, R.; Lin, B.; Yin, H. Multi-Degree-of-Freedom for Underwater Optical Wireless Communication with Improved Transmission Performance. J. Mar. Sci. Eng. 2023, 11, 48. [Google Scholar] [CrossRef]
  20. Cox, W.C.; Simpson, J.A.; Domizioli, C.P.; Muth, J.F.; Hughes, B.L. An underwater optical communication system implementing Reed-Solomon channel coding. In Proceedings of the Oceans Conference 2008, Kobe, Japan, 8–11 April 2008. [Google Scholar] [CrossRef]
Figure 1. Optical absorption coefficient of water.
Applsci 14 00206 g001
Figure 2. Link geometry relationship of UWOC.
Applsci 14 00206 g002
Figure 3. Relative radiation intensity distribution of the light source.
Applsci 14 00206 g003
Figure 4. Schematic diagram of measuring platform.
Applsci 14 00206 g004
Figure 5. Effective communication ranges for different water quality conditions (with different attenuation coefficients).
Applsci 14 00206 g005
Figure 6. Communicable space under different water quality conditions. (a) Pond, (b) Guanshan Lake, (c) Benxi, (d) Qipan mountain (25 m from the shore).
Applsci 14 00206 g006
Figure 7. Schematic diagram of the trial method.
Applsci 14 00206 g007
Figure 8. Placement of optical communication equipment. (a) Transmitter and (b) receiver.
Applsci 14 00206 g008
Figure 9. Effective communication space for the AUV optical communication experiment.
Applsci 14 00206 g009
Table 1. Parameters of water quality attenuation tester.
Optical Distance (mm)Range (1/m) @400 nmRange (1/m) @550 nmRange (1/m) @700 nm
500.2–460.2–500.2–50
1000.1–230.1–250.1–25
1500.07–150.07–170.07–17
2500.04–9.20.04–100.04–10
Table 2. Parameters of optical communication.
ParametersValues
Light sourceLED
Optical transmit power6 W (radiometric)
Optical wavelength450 nm (royal blue)
Emitter beam shape45° (half angle)
Receive beam shape45° (half angle)
Dimensions (length × diameter)264 × 128 mm
Receiver detectorPhotomultiplier tube (PMT)
Receiving sensitivity−24 dBm
Data rate1–5 Mbps
Table 3. The parameters of optical communication.
NumberPlaceAttenuation
Coefficient
Measured Max Communication Range (m)Calculated Max Communication Range (m)BER (Max
Communication Range)
1Pond0.24~0.829.8>203.05 × 10⁻⁵
2The Guanshan Lake2.2–2.84.24.02~5.003.12 × 10−5
3Benxi5.1–5.72.41.82~2.433.02 × 10−5
4The Qipan mountain (25 m from the shore)6.8–7.31.91.45~1.883.11 × 10−5
5The Qipan mountain (near the shore)10.2~10.61.70.94~1.123.20 × 10−5
Disclaimer/Publisher’s Note: The statements, opinions and data contained in all publications are solely those of the individual author(s) and contributor(s) and not of MDPI and/or the editor(s). MDPI and/or the editor(s) disclaim responsibility for any injury to people or property resulting from any ideas, methods, instructions or products referred to in the content.

