
The Law and Mechanism of the Effect of Surface Roughness on Microwave-Assisted Rock Breaking

Abstract
:1. Introduction
2. Effect of Roughness on the P-Wave Velocity and Crack Propagation of the Specimen
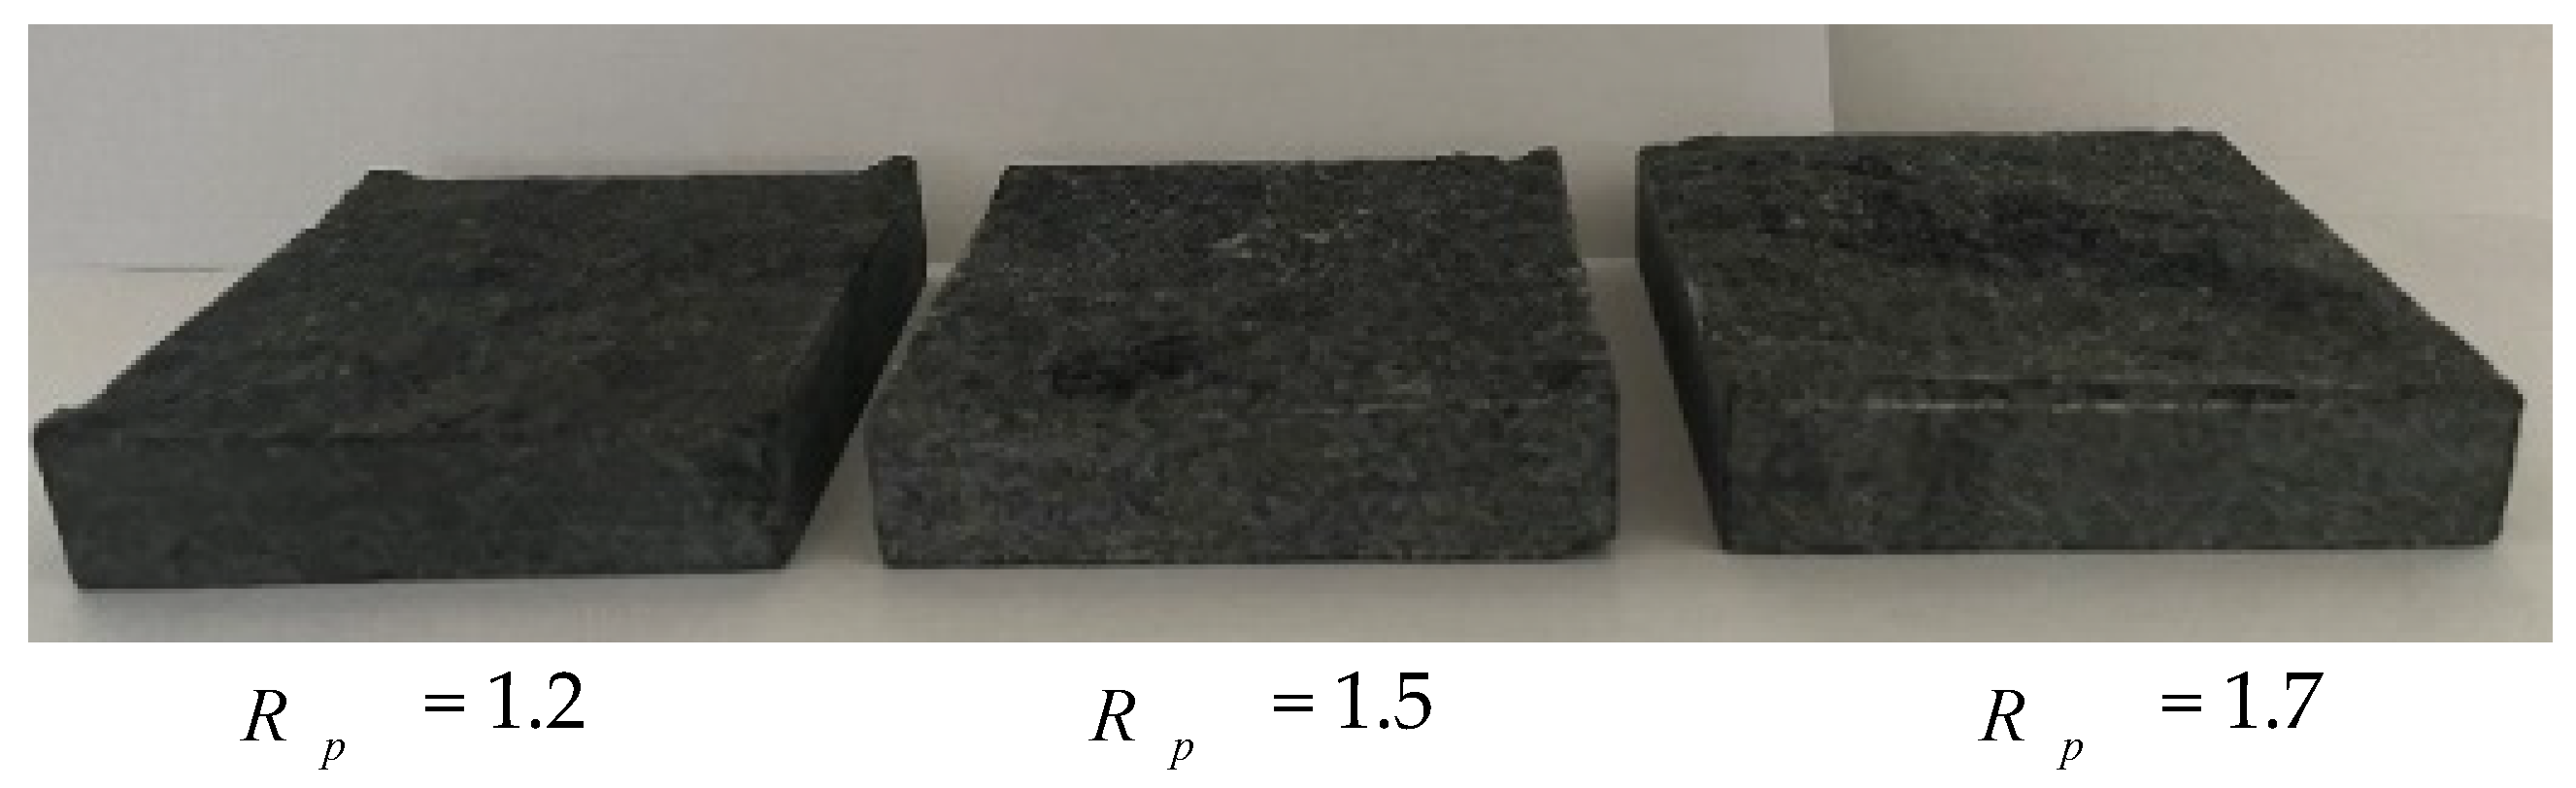
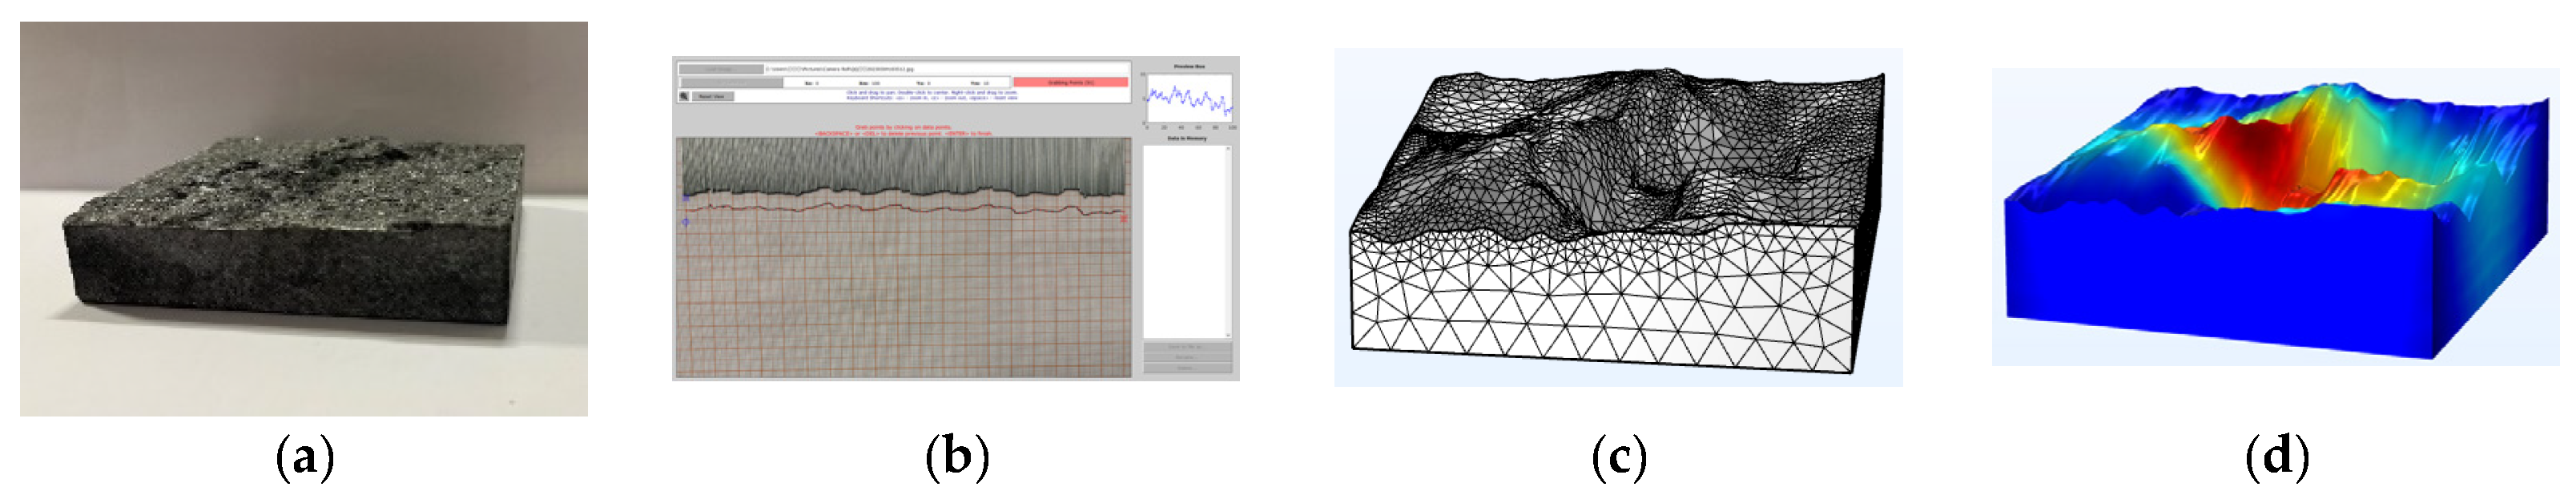
2.1. Characterization of Rock Surface Roughness
2.2. Test Specimen
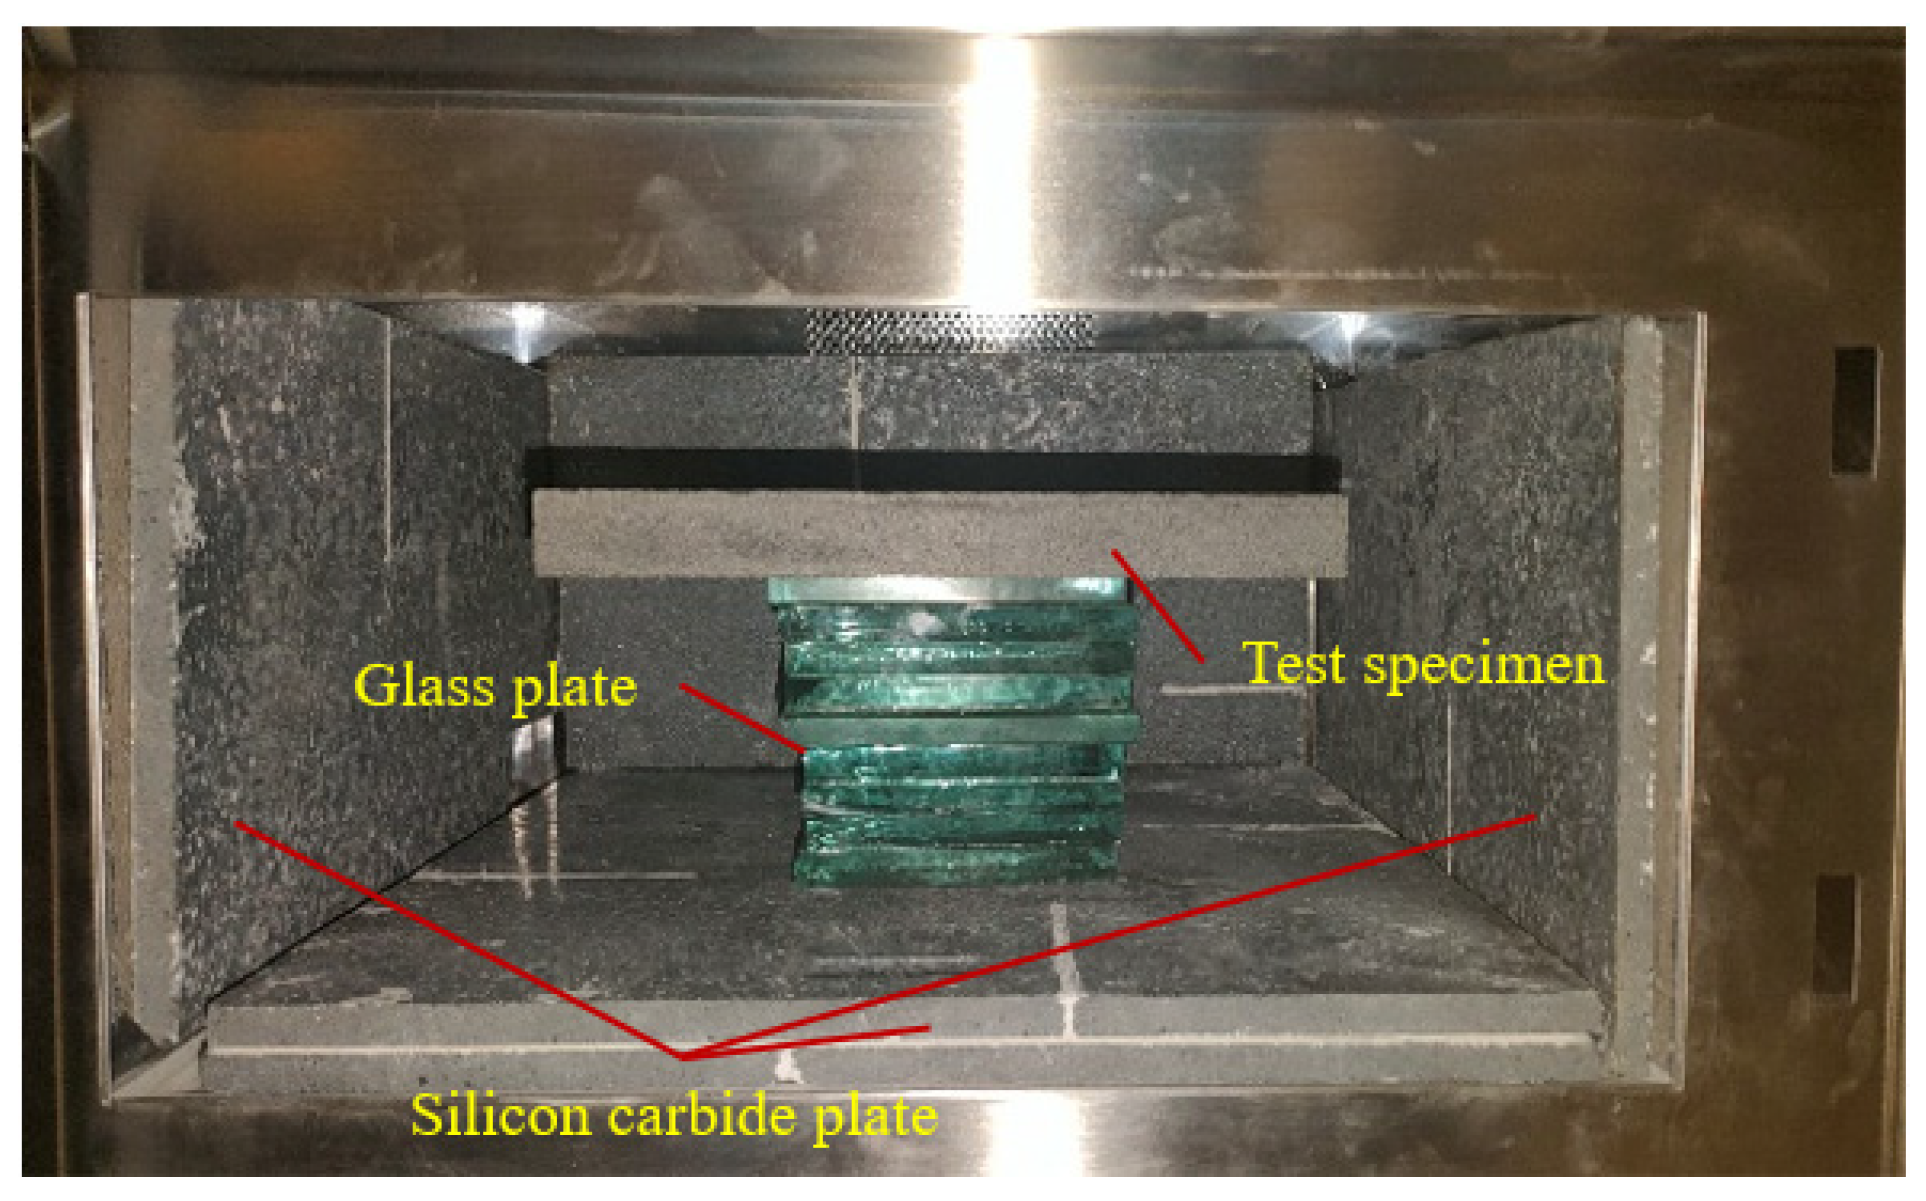
2.3. Test Equipment
2.4. Scheme and Process
2.5. Results
2.5.1. Temperature Distribution
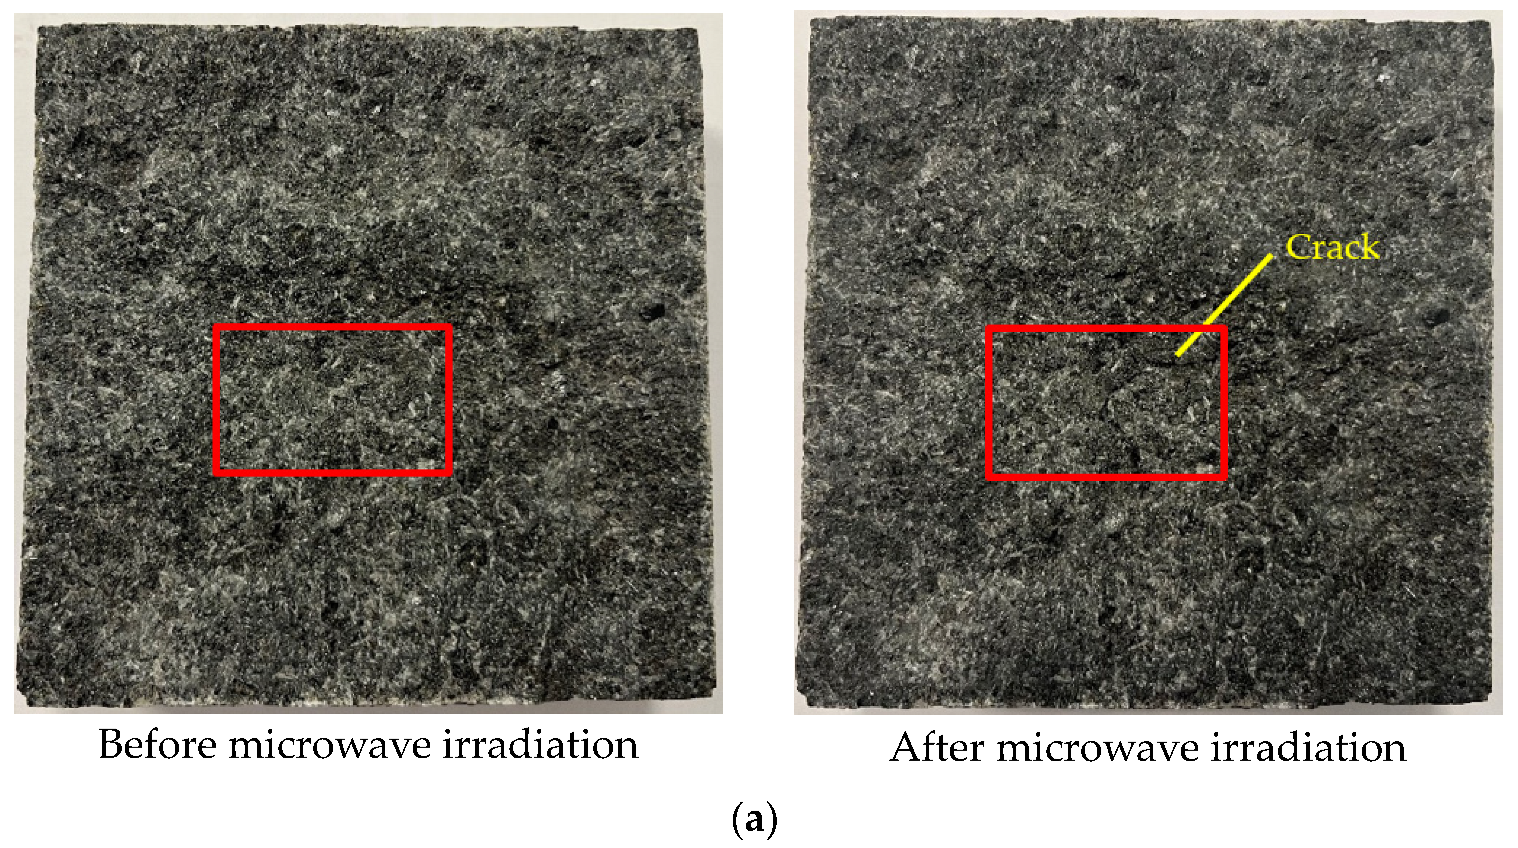
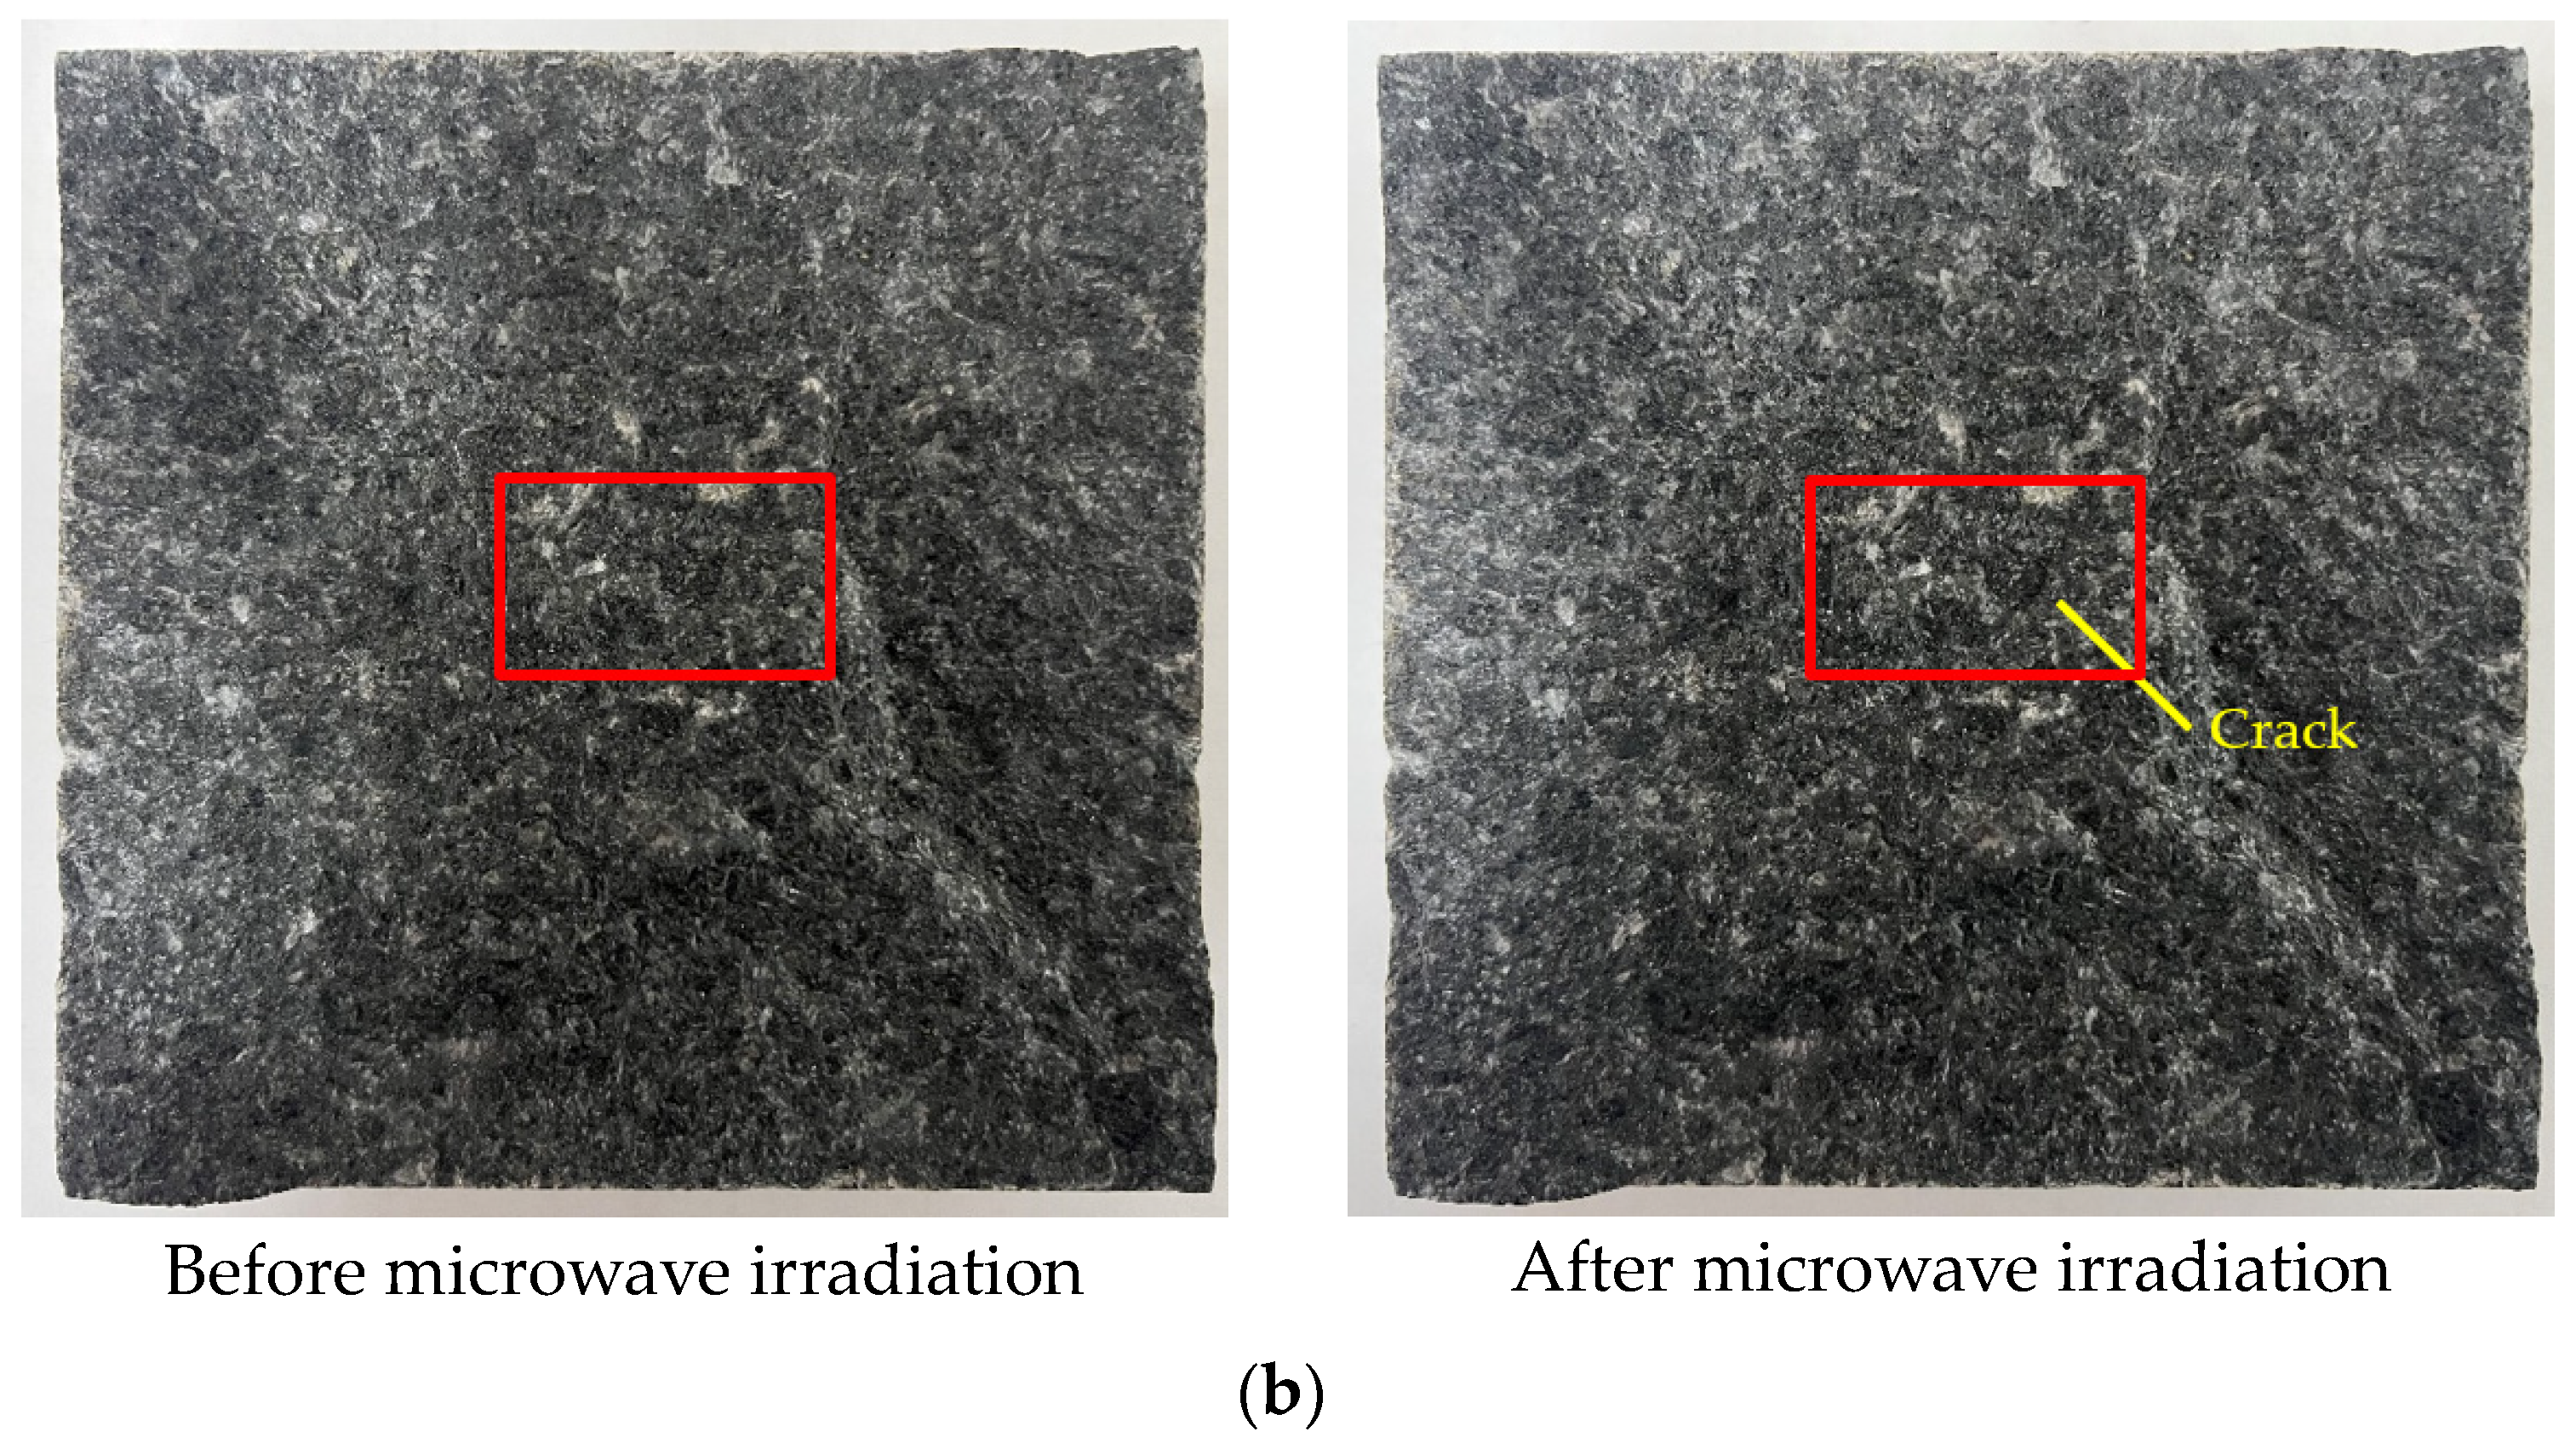
2.5.2. Crack Growth
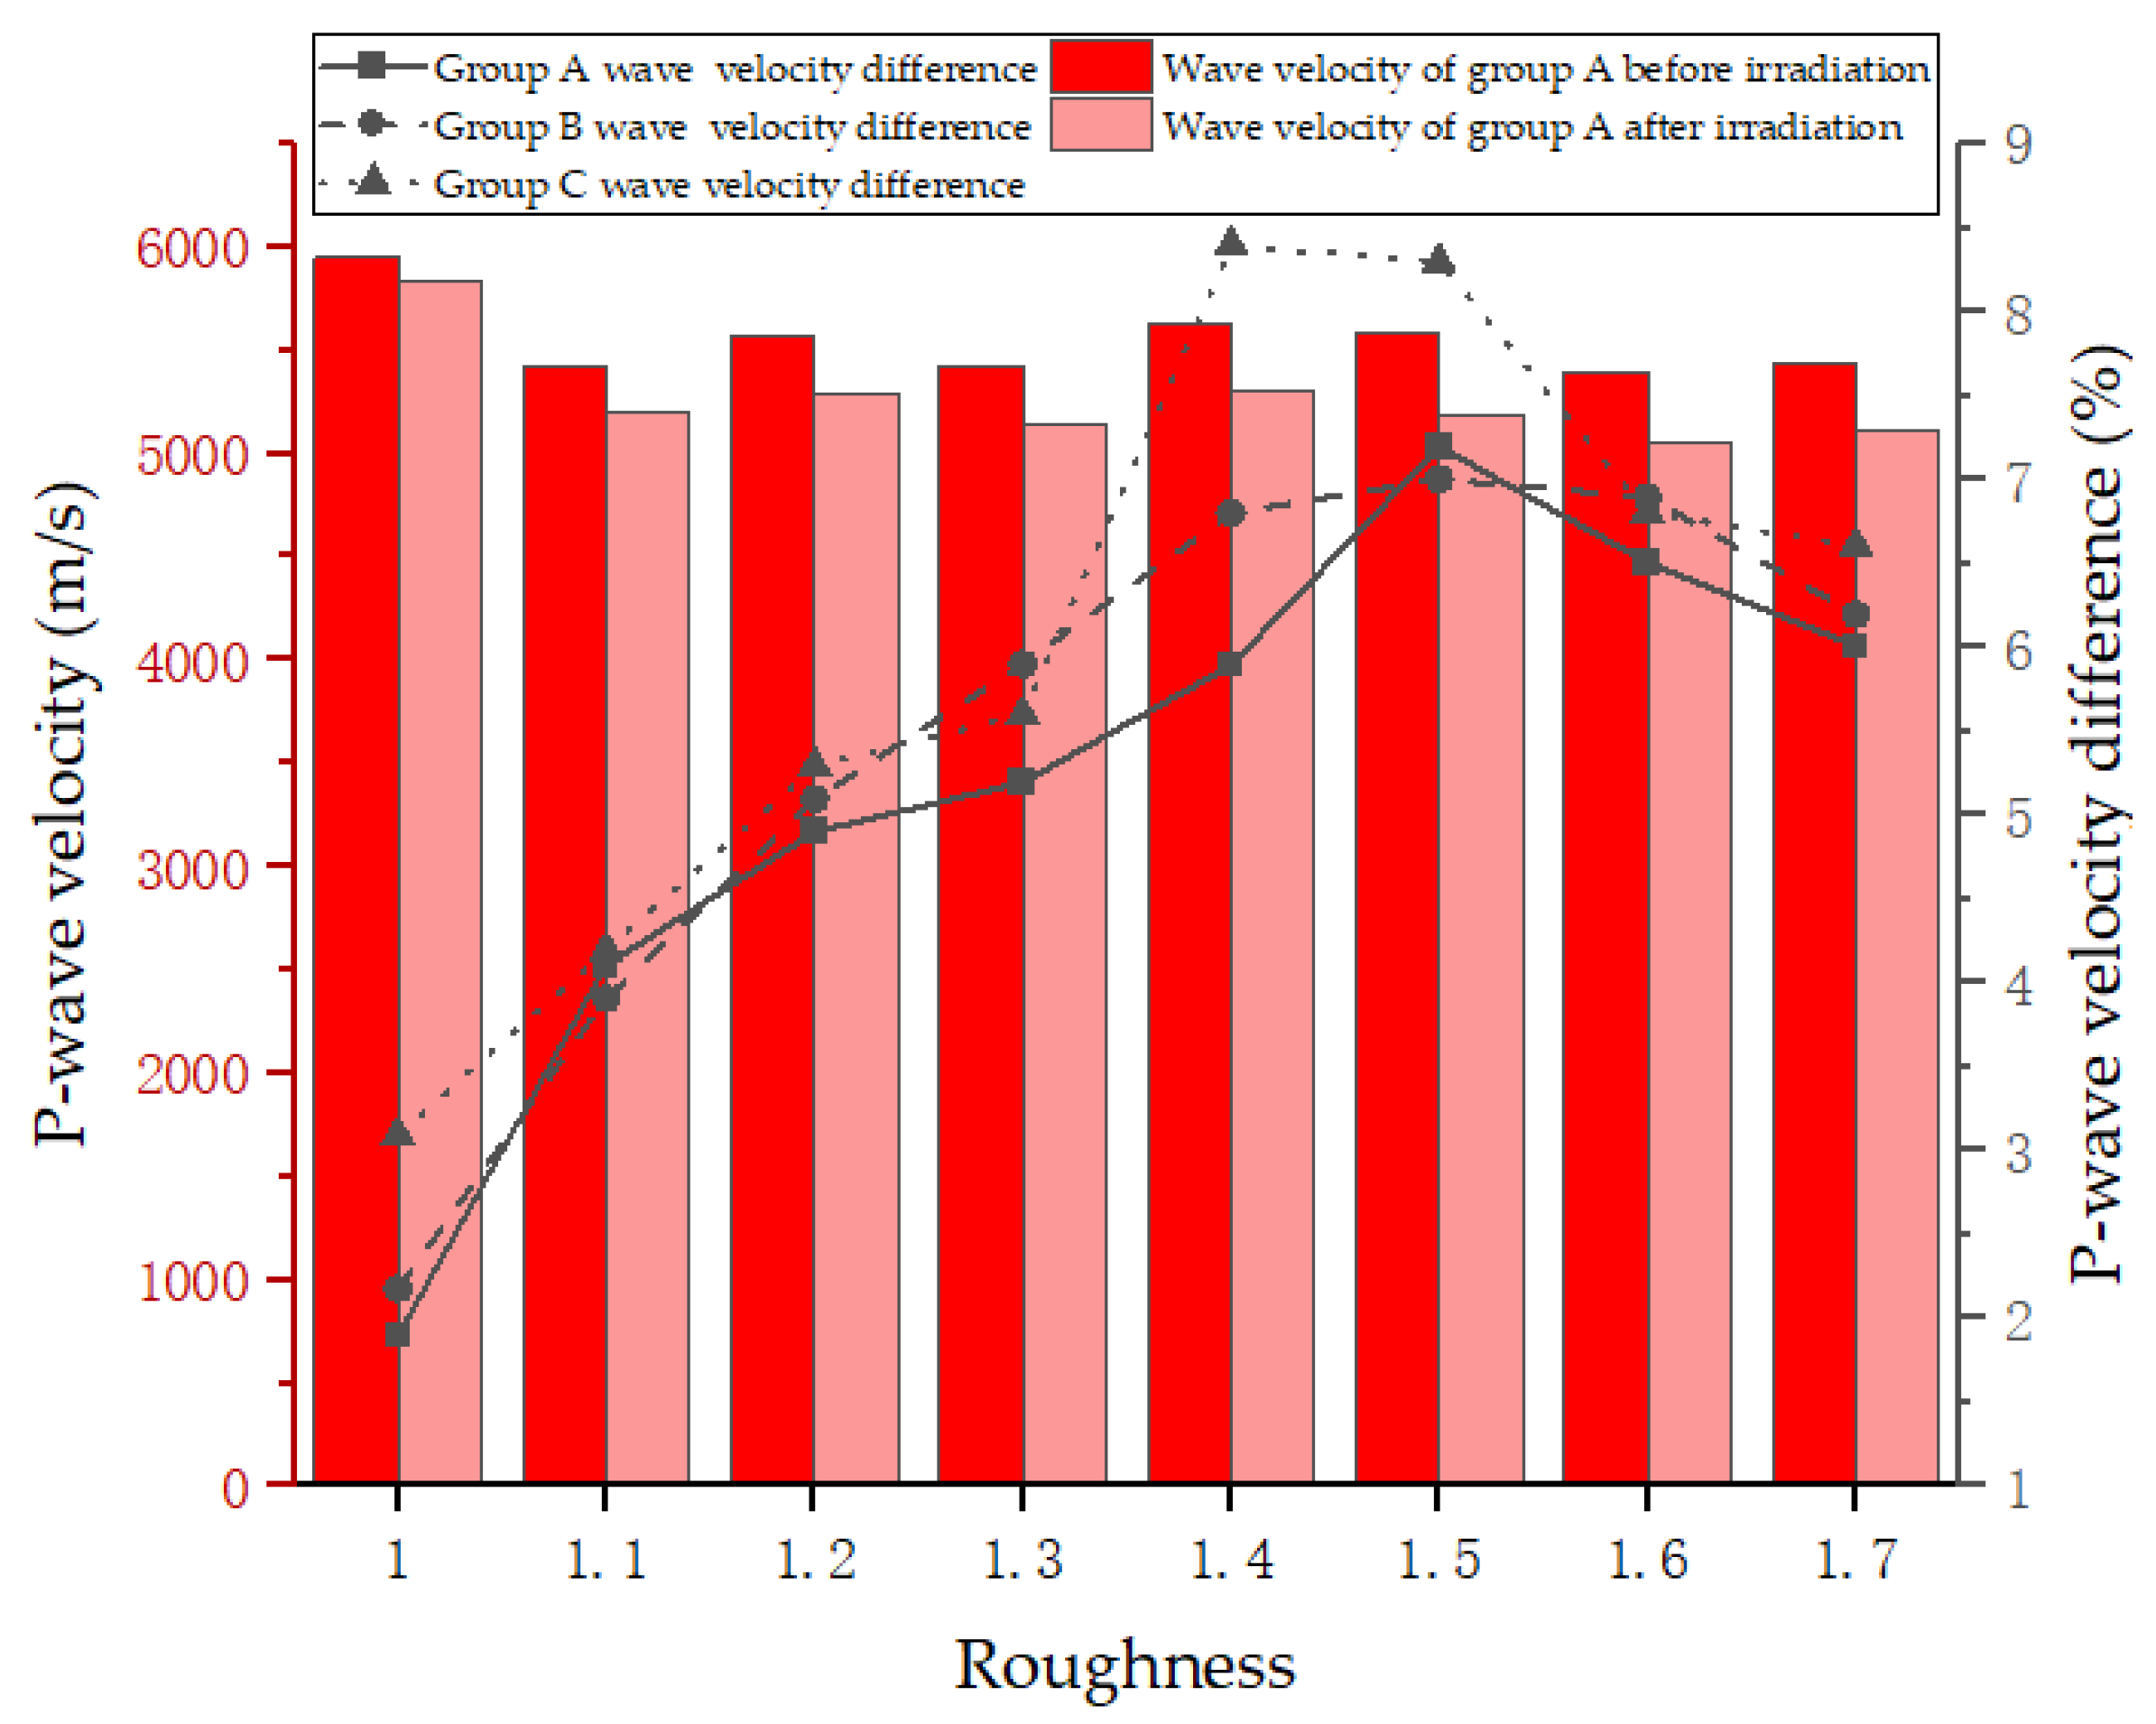
2.5.3. P-Wave Velocity
3. Numerical Experiment
3.1. Modelling
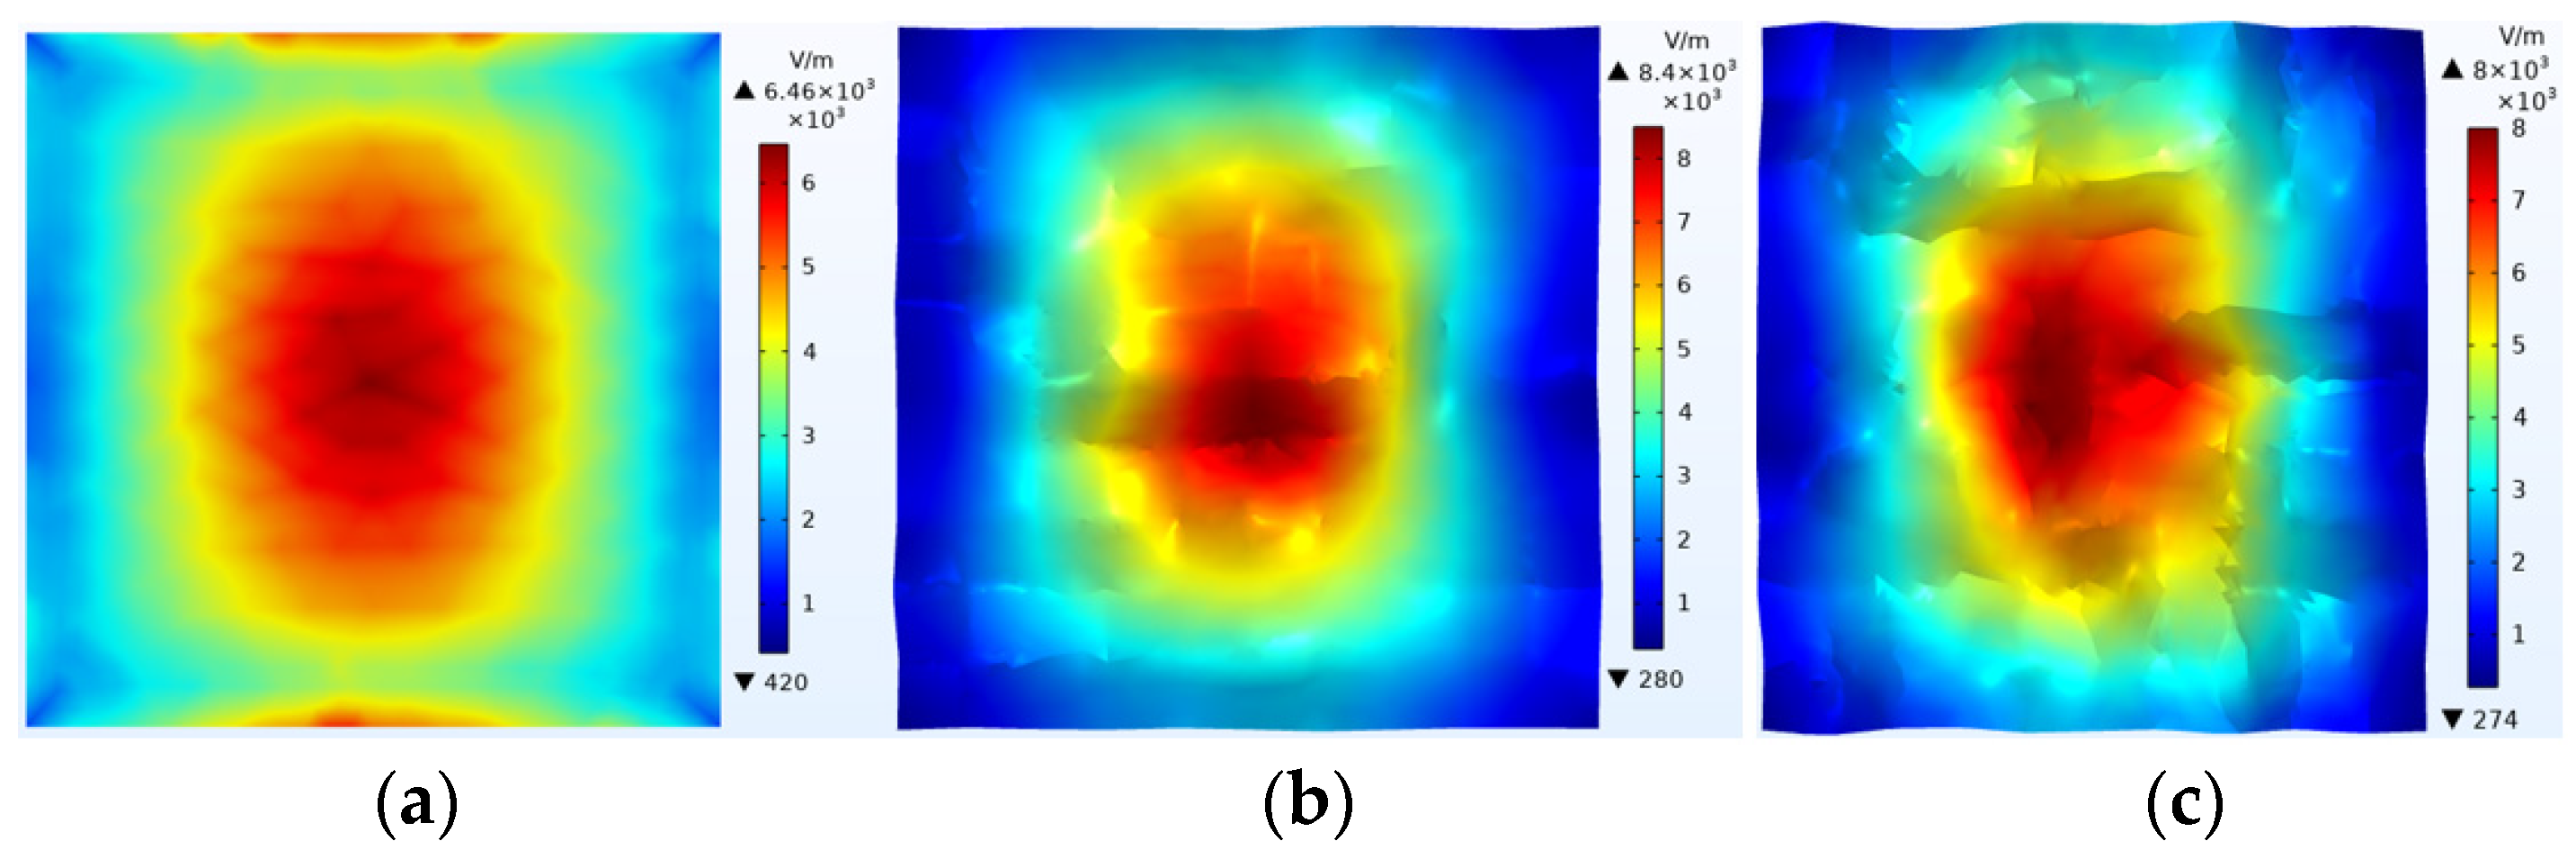
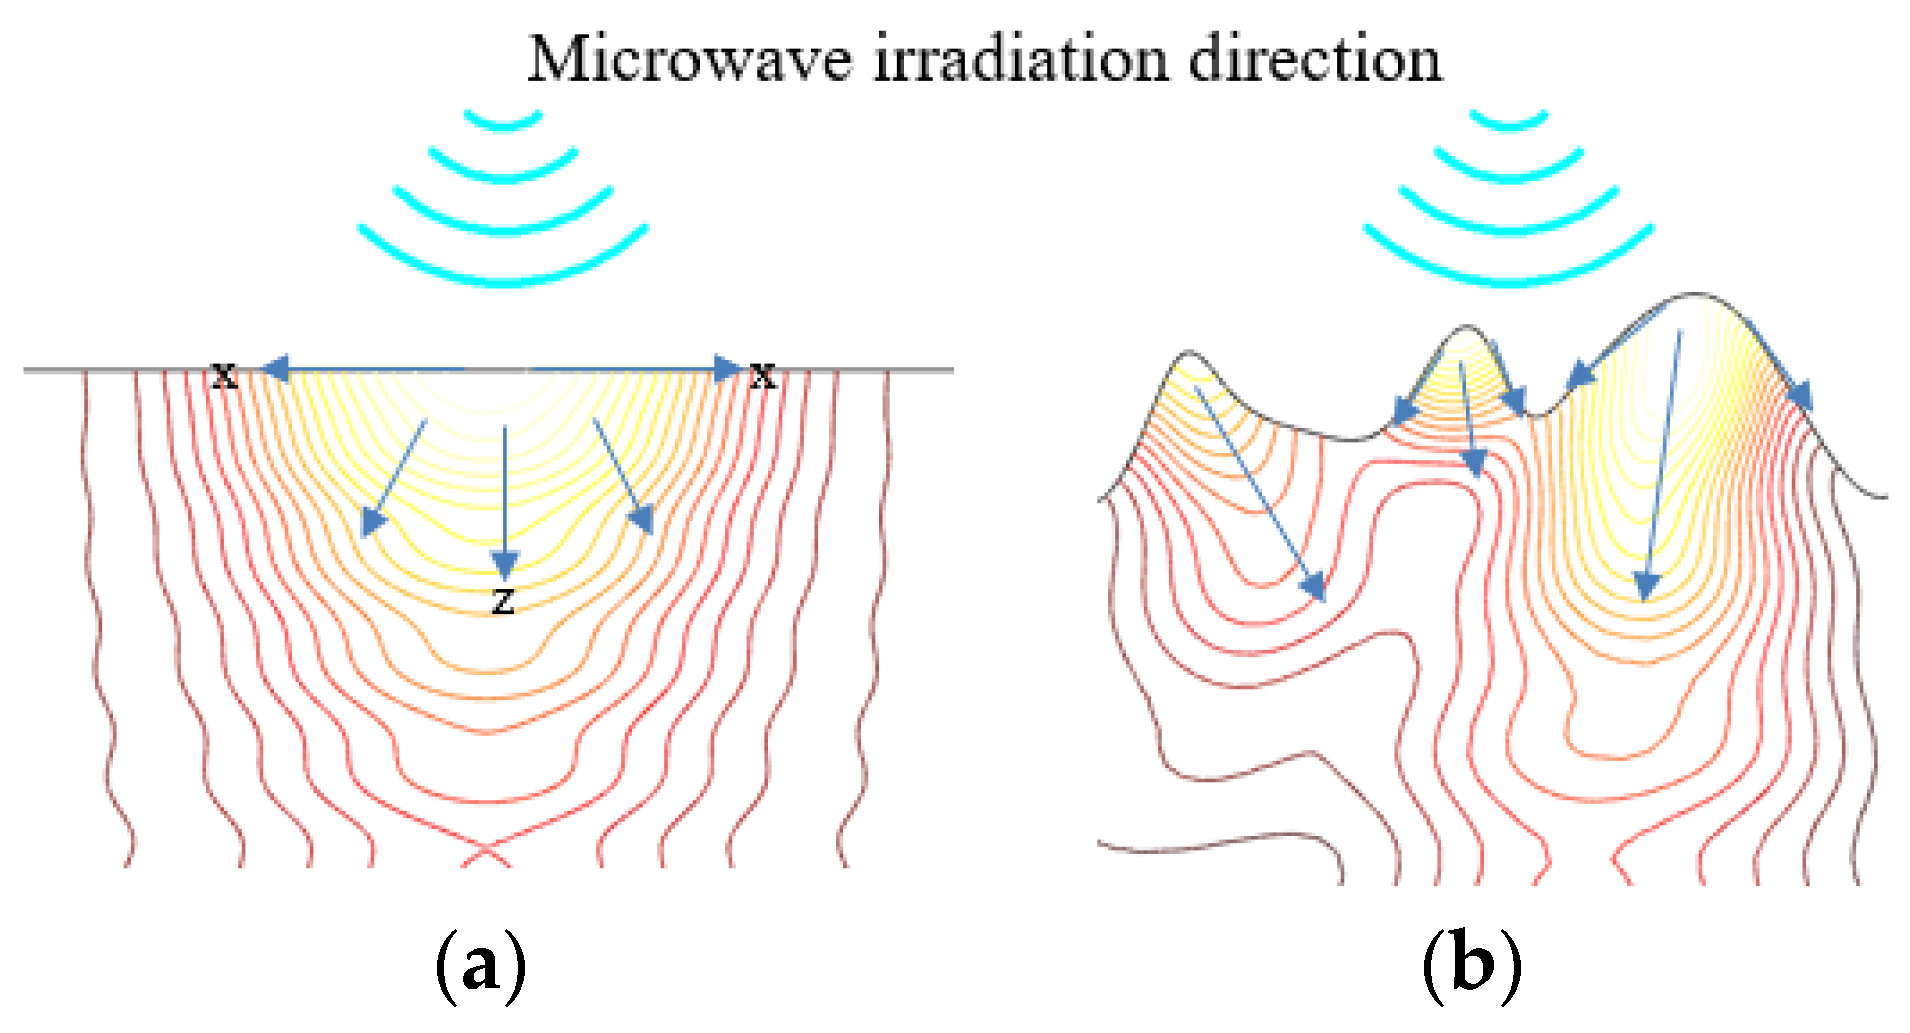
3.2. Electromagnetic Field Characteristics
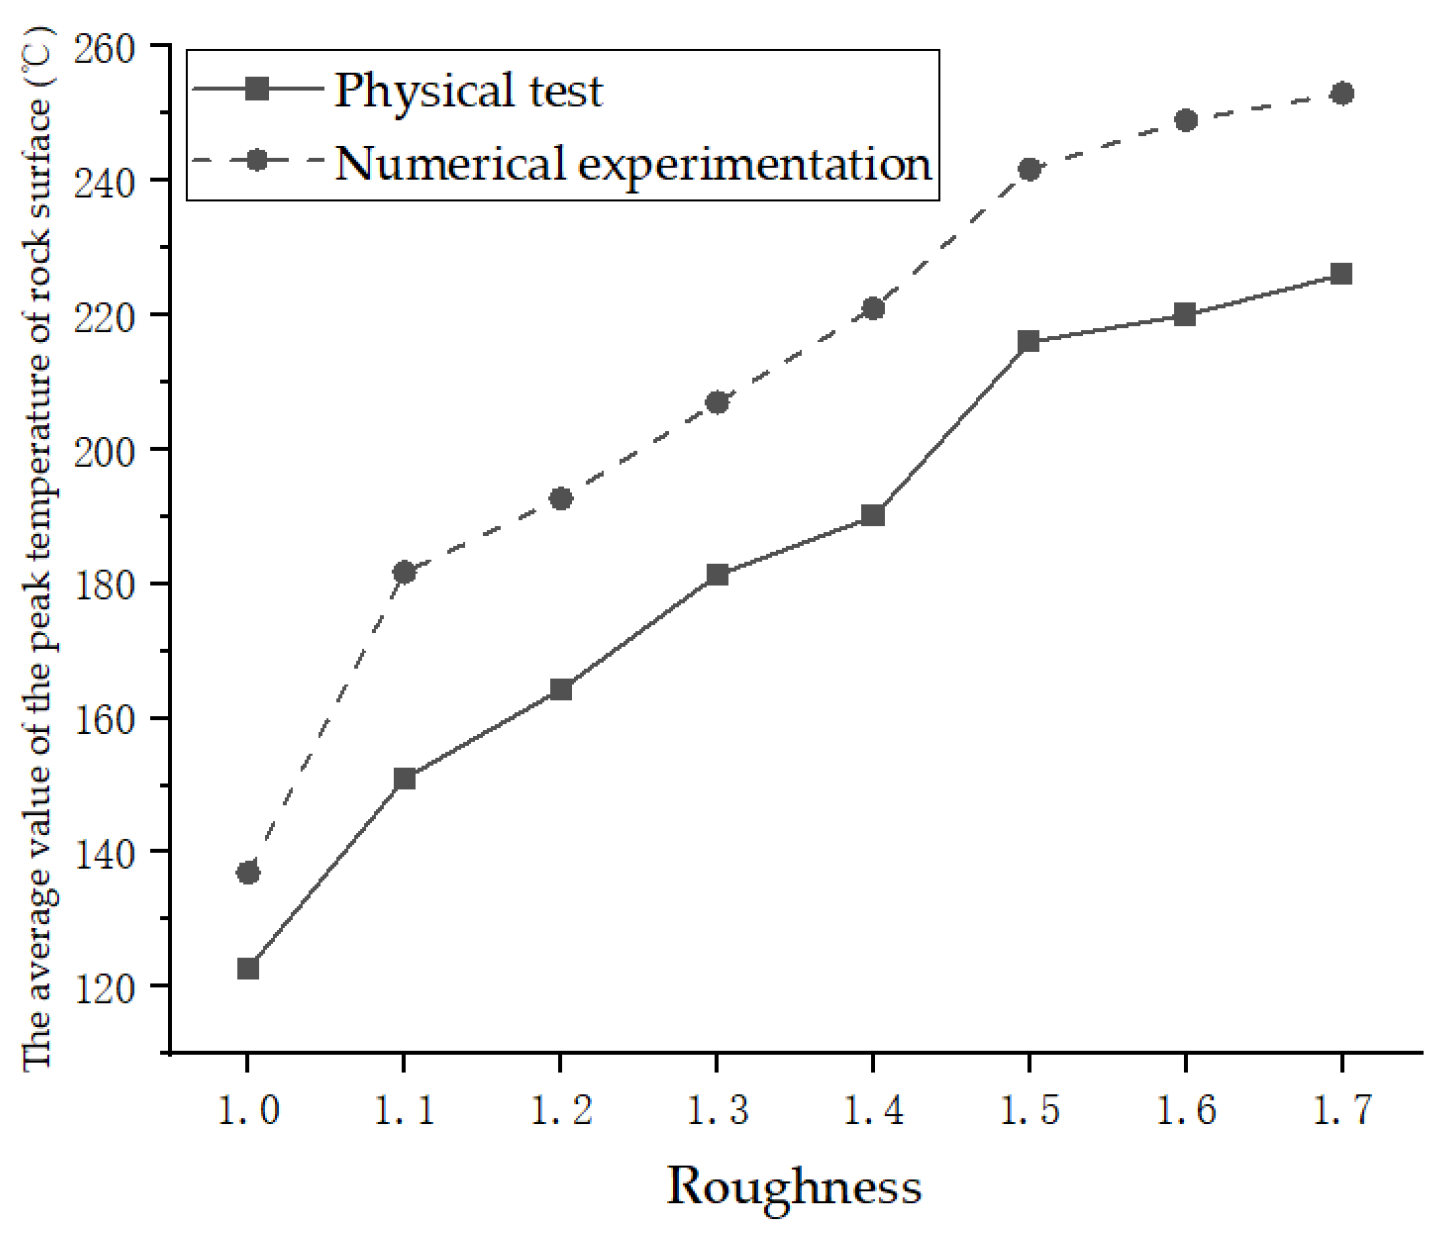
3.3. Temperature Distribution Characteristics
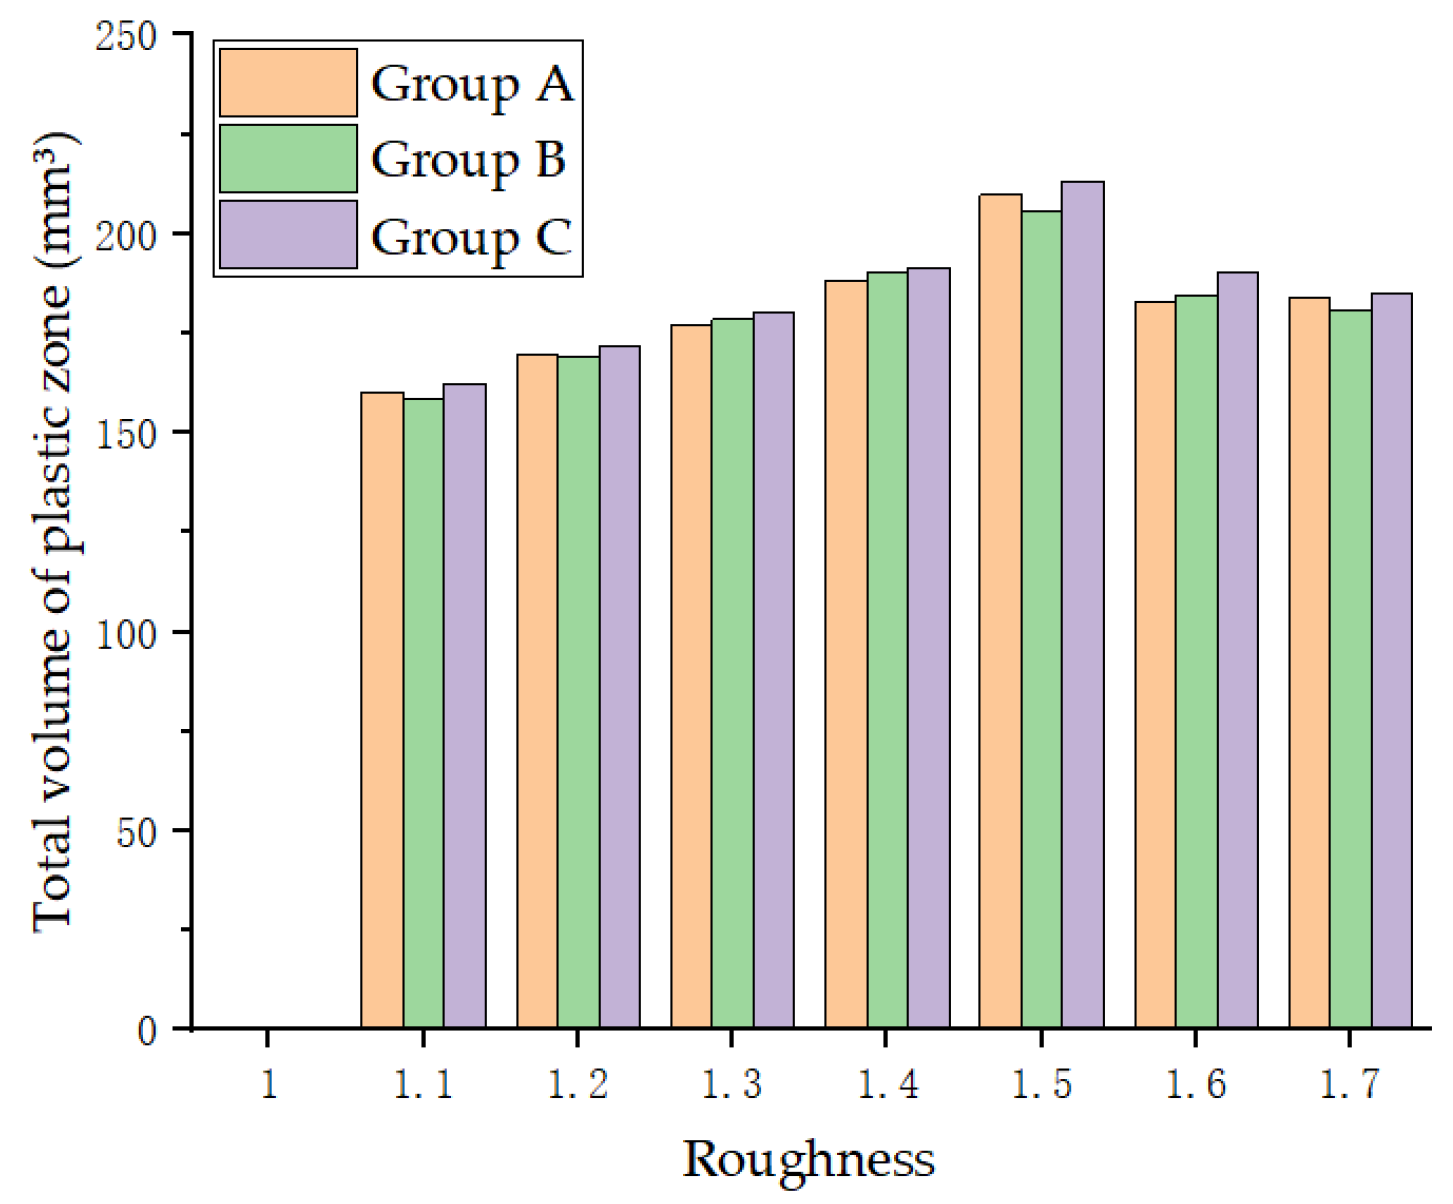
3.4. Plastic Zone
4. Analysis and Discussion
5. Conclusions
- (1)
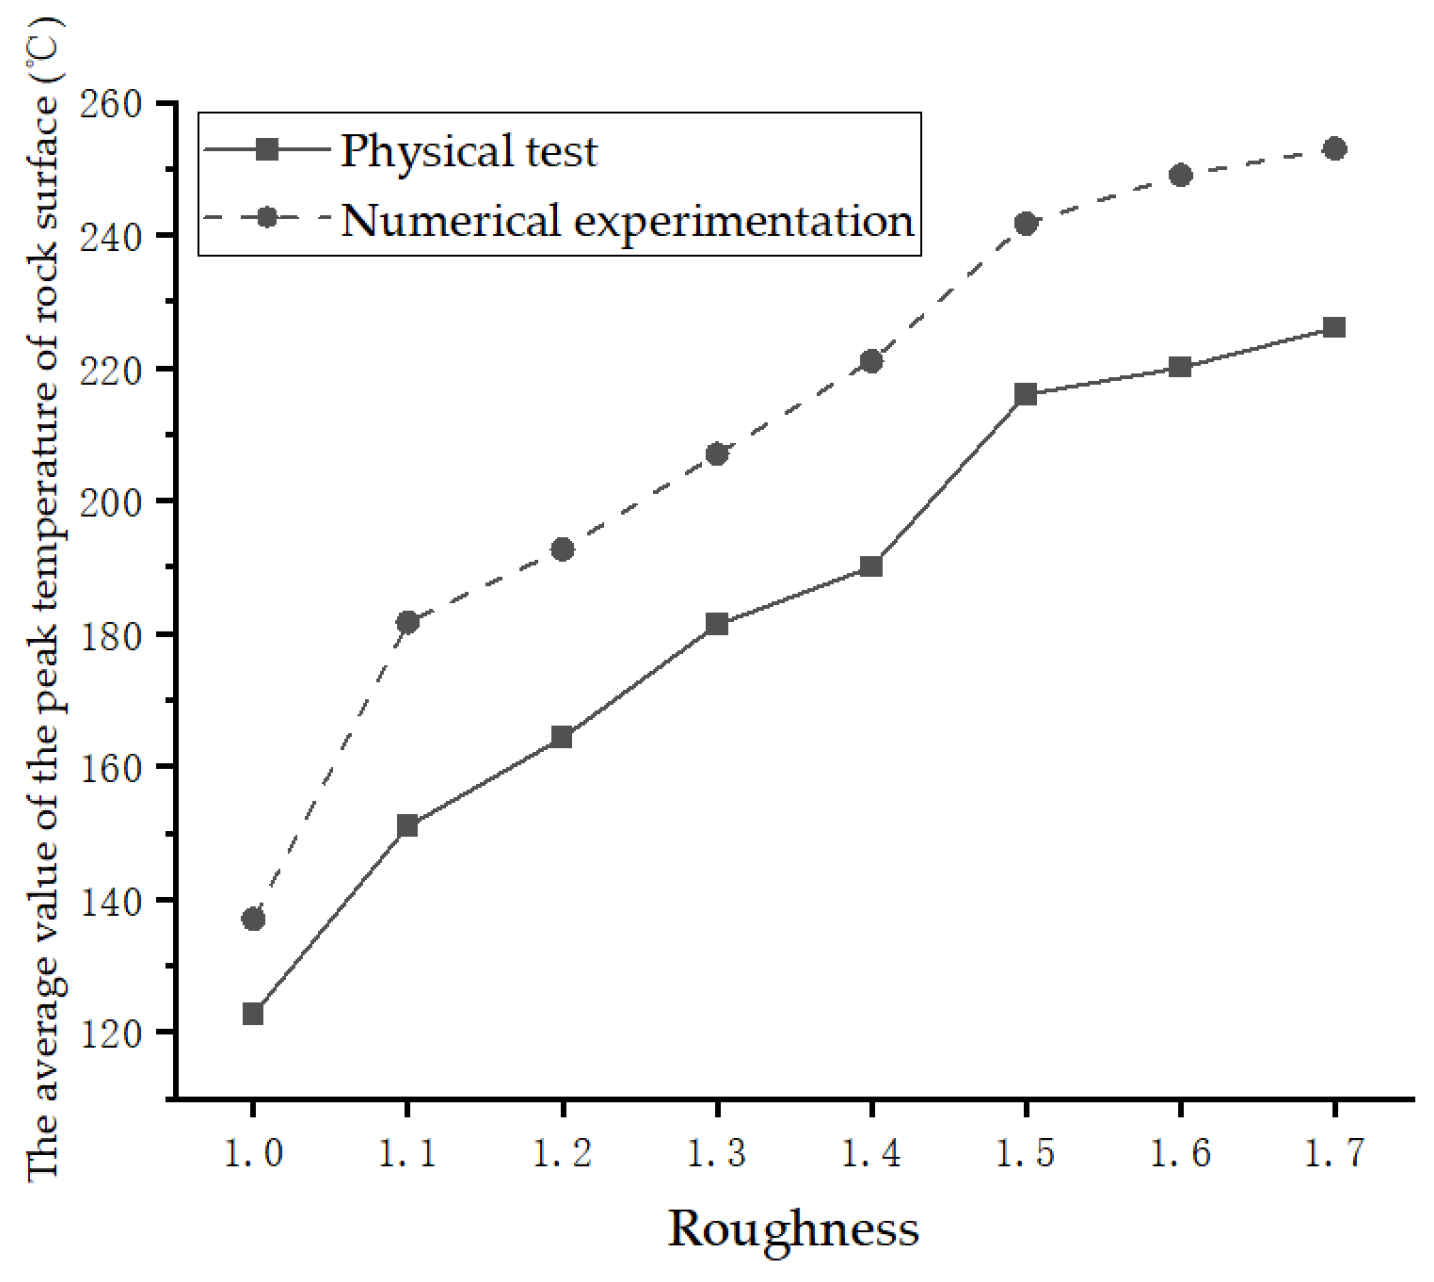
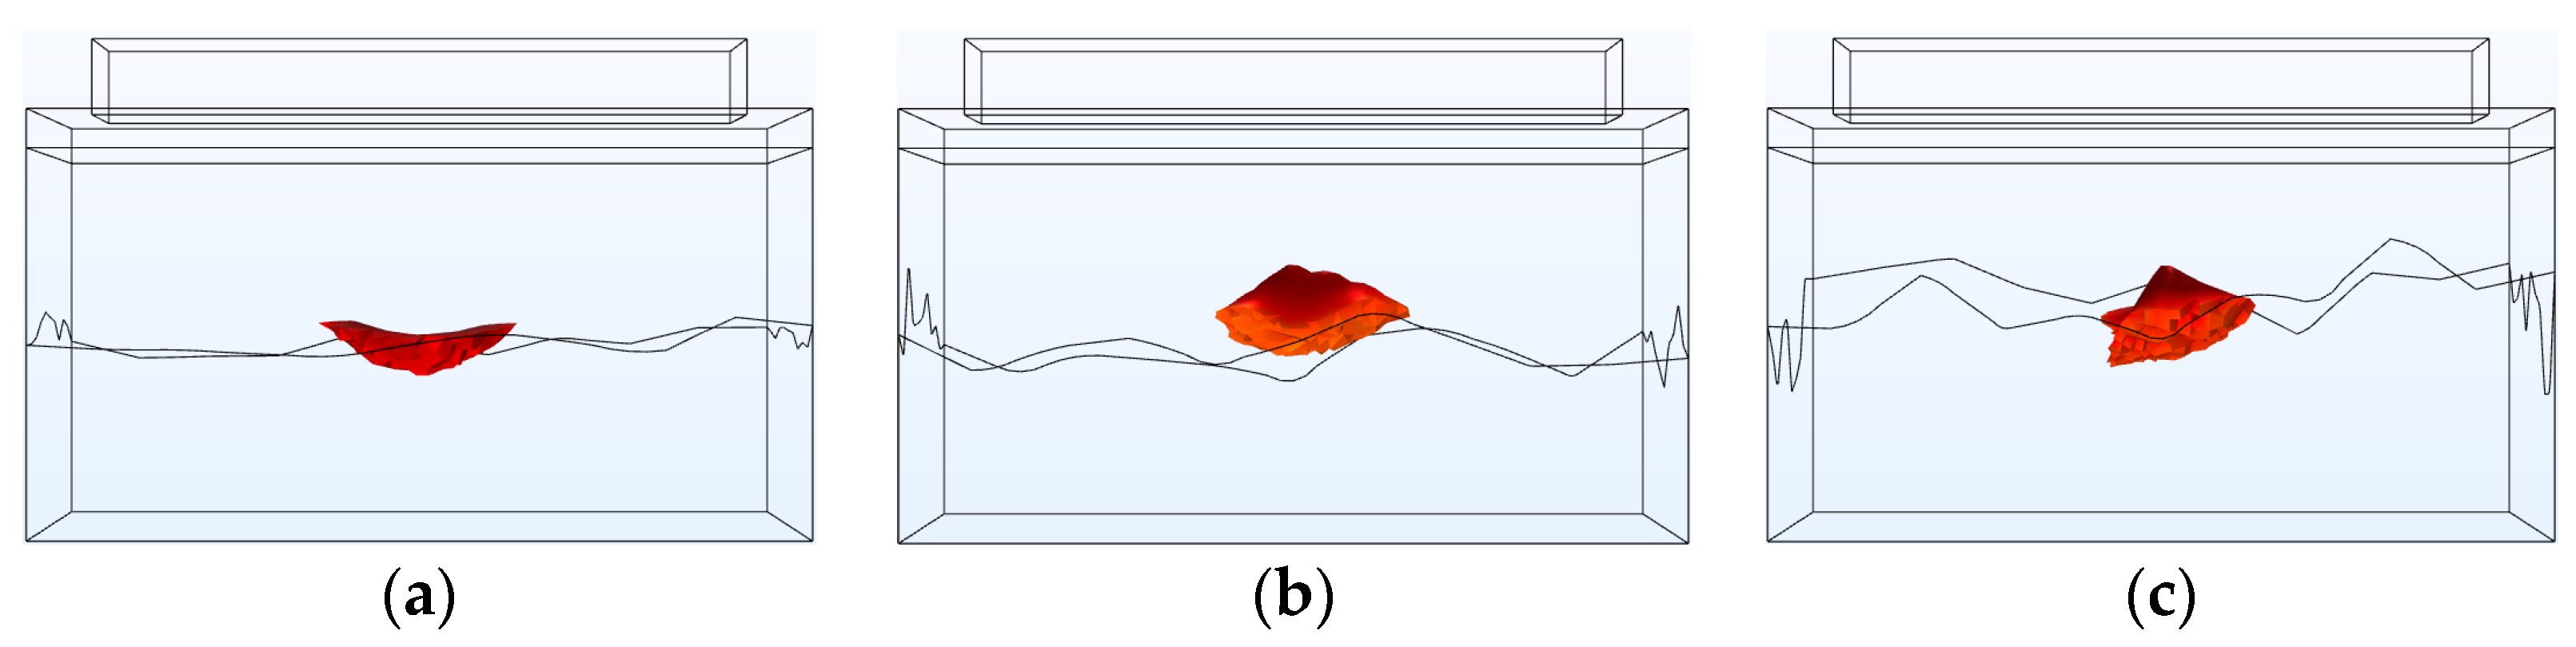
- After microwave irradiation, the distribution of the high-temperature region of the flat surface sample is mainly concentrated in the central area, whereas the high-temperature area of the rough surface sample is unevenly distributed with the main high-temperature region appearing in the convex surface area. The temperature peaks of all rough rock surfaces were much larger than those of flat surfaces; the temperature peak increased with the increase in roughness.
- (2)
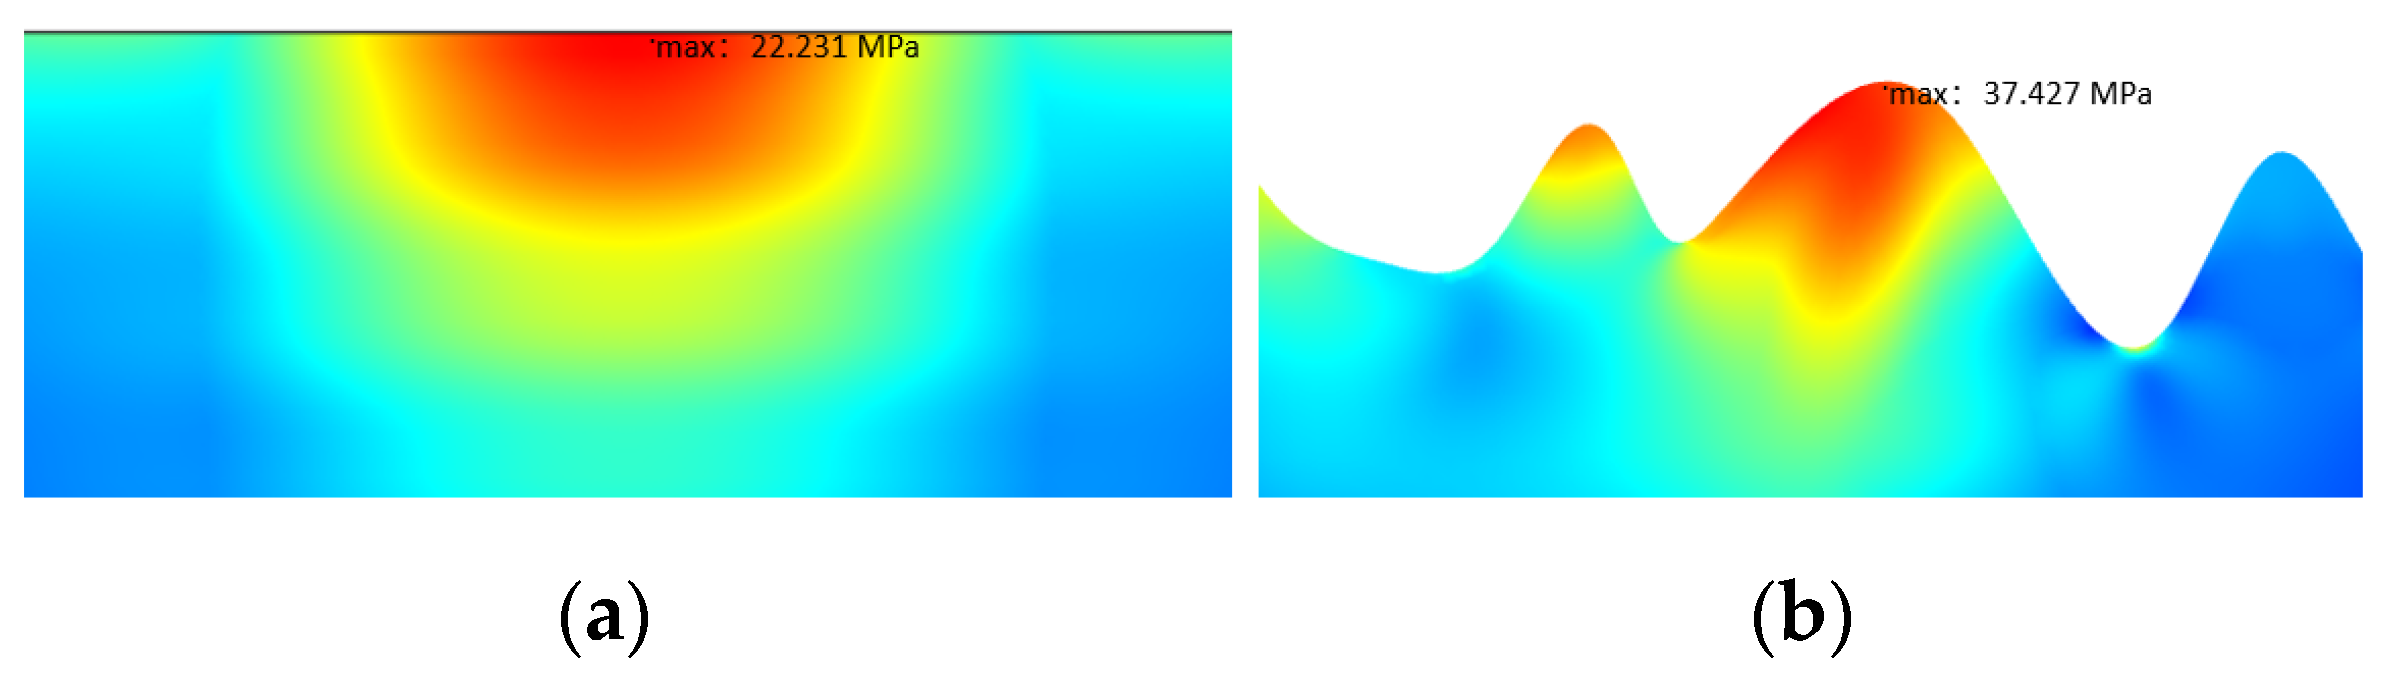
- When microwaves irradiate rocks, thermal stress is generated, and when the stress is greater than the strength of the rock, the rock is damaged. After microwave irradiation, no macroscopic cracks were observed on the flat surface, whereas crack propagation on the rough surface was obvious: New cracks were generated on the surface, and existing cracks continued to propagate. The P-wave velocities of the rough surface specimens were significantly reduced.
- (3)
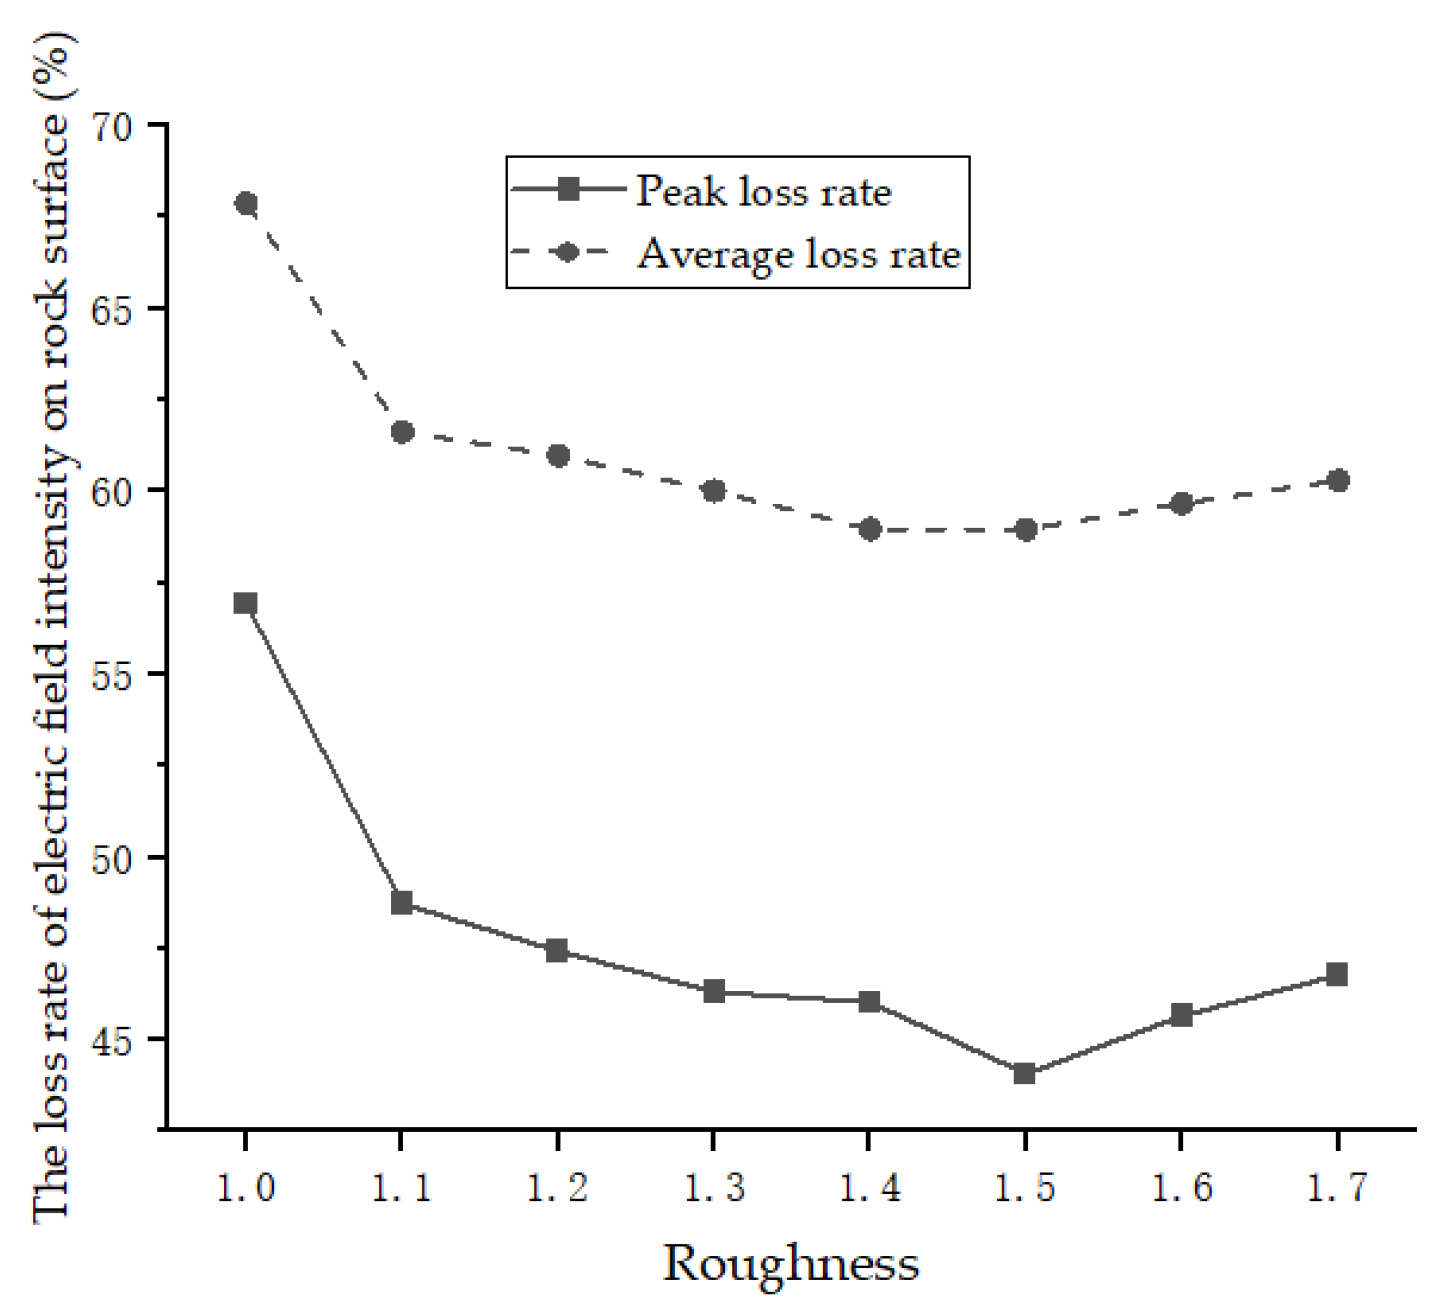
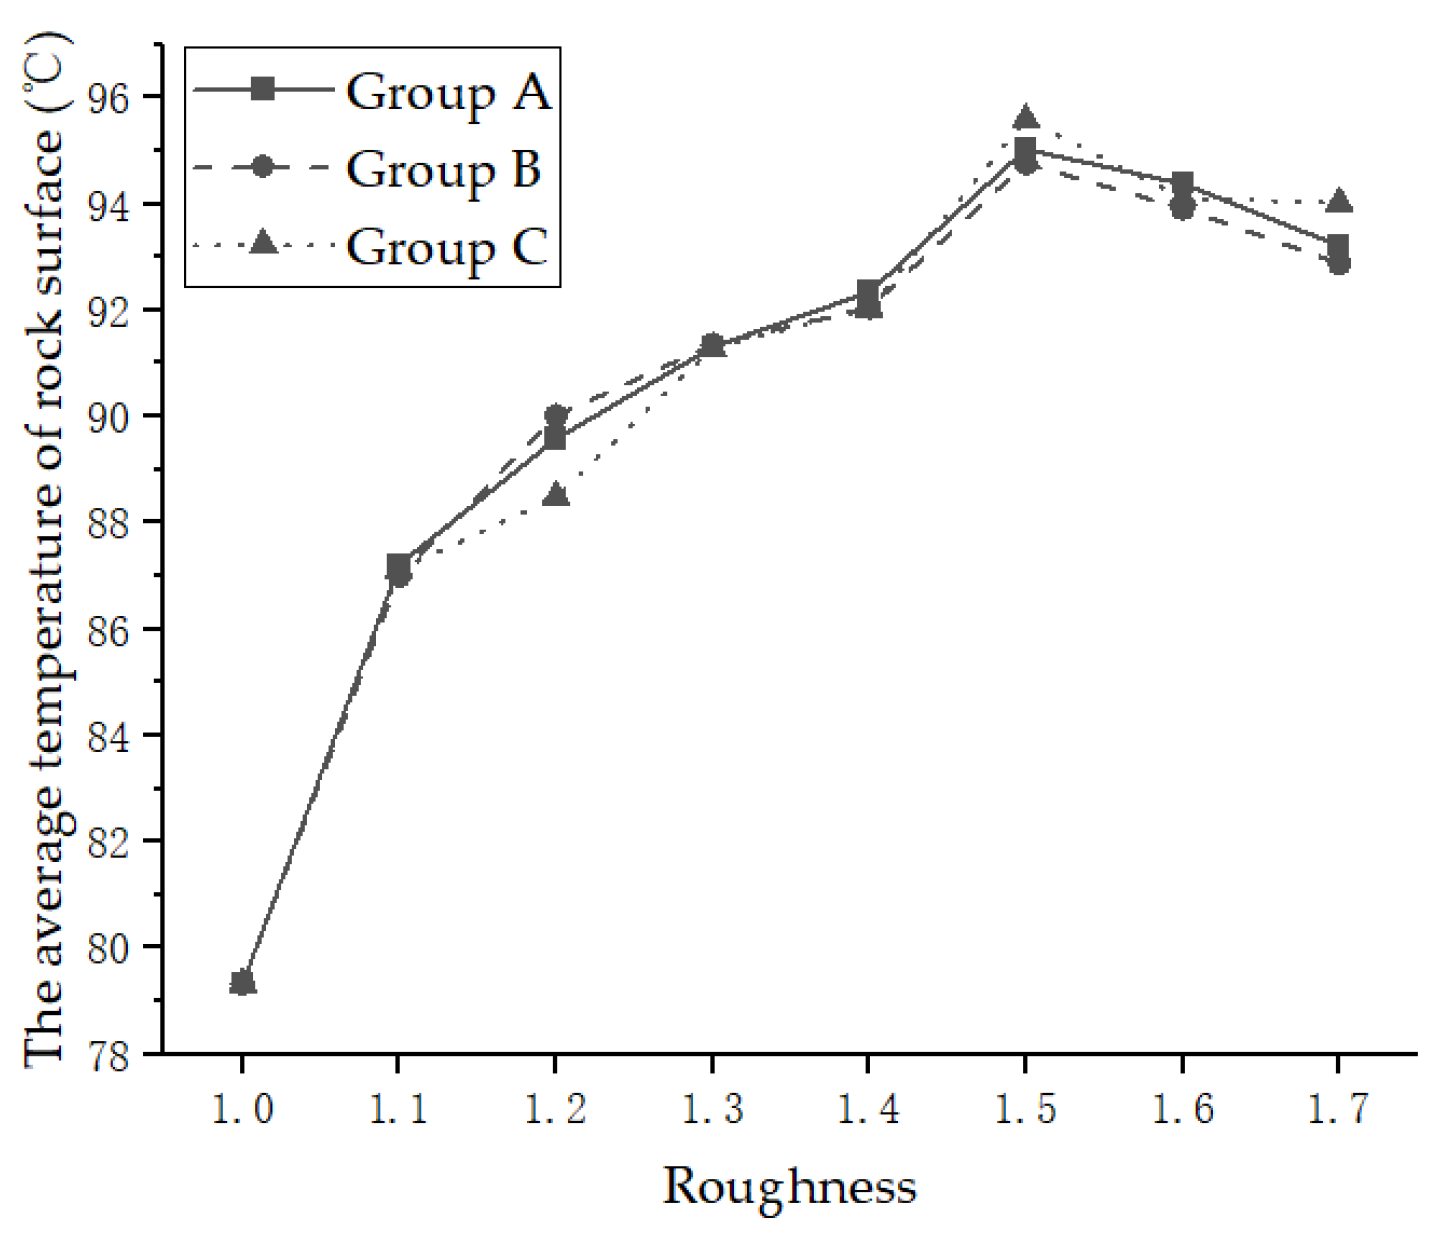
- Through numerical simulation, it was determined that the average surface electric field strength and average surface temperature of the rough surface samples were greater than those of the specimen with the flat surface. The distribution of the plastic zone is related to the distribution of the electromagnetic field and temperature; the total volume of the plastic zone increased first and then decreased with the increase in roughness.
- (4)
- The comprehensive experimental and theoretical analysis shows that the influencing factors of rough rock surfaces on the effect of microwave irradiation are mainly the refraction and reflection of electromagnetic waves on the rock surface, heat conduction, and stress concentration.
Author Contributions
Funding
Institutional Review Board Statement
Informed Consent Statement
Data Availability Statement
Acknowledgments
Conflicts of Interest
References
- Xu, X.H. Discussion on a New Subject of Mining Engineering-Rock Crushing Science. Nonferrous Met 1980, 39–42. Available online: https://kns.cnki.net/kcms2/article/abstract?v=ipUboLYjcOU_cYKEuLpXcboCssuyDEIfEI9Gok9zTW3sGmp1Vd2VjprVAma-B_sVBO4_mT0M-gtabtesh69rkUOtuX0ZcnXdYGKDFOmasUcQArYR_71NGdwhjiz18ya9lP-UQd5WkrY=&uniplatform=NZKPT&language=CHS (accessed on 29 November 2023).
- Rostami, J. Performance prediction of hard rock Tunnel Boring Machines (TBMs) in difficult ground. Tunn. Undergr. Space Technol. 2016, 57, 173–182. [Google Scholar] [CrossRef]
- Li, X.B.; Zhou, Z.L.; Wang, W.H. Development Status and Prospect of Rock Crushing Engineering. 2009–2010 Dev. Rep. Rock Mech. Rock Eng. 2010. Available online: https://kns.cnki.net/kcms2/article/abstract?v=ipUboLYjcOW1yGO2crL-_xalfuuCKhniTeZMl_-QqDREEVhXfGX0qGTiv7ZodghYnEPoNM2x_NNp4aQBVbRPqmklqZUMKWcxVbyi3KodyVaFXoae5fAeVU5k3jGrGUW096zq6u7x8NXrINk41Qwybg==&uniplatform=NZKPT&language=CHS (accessed on 29 November 2023).
- Lu, G.M.; Li, Y.H.; Hassani, F. Review of theoretical and experimental studies on mechanical rock fragmentation using microwave-assisted approach. J. Geotech. Eng. 2016, 38, 1497–1506. [Google Scholar]
- Hassani, F.; Nekoovaght, P.M.; Gharib, N. The influence of microwave irradiation on rocks for microwave-assisted underground excavation. J. Rock Mech. Geotech. Eng. 2016, 8, 1–15. [Google Scholar] [CrossRef]
- Bai, G.G.; Sun, Q.; Jia, H.L. Mechanical responses of igneous rocks to microwave irradiation: A review. Acta Geophys. 2022, 70, 1183–1192. [Google Scholar] [CrossRef]
- Gao, M.Z.; Yang, B.G.; Xie, J. The mechanism of microwave rock breaking and its potential application to rock-breaking technology in drilling. Petrol. Sci. 2022, 19, 1110–1124. [Google Scholar] [CrossRef]
- Kahraman, S.; Sarbangholi, F.S.; Balci, C. The effect of mineralogy on the microwave assisted cutting of igneous rocks. Bull. Eng. Geol. Environ. 2022, 81, 62–81. [Google Scholar] [CrossRef]
- Hu, G.Z.; Zhu, J.Q.; Zhu, J. Fracturing effect and damage behaviors for microstructure in shale under microwave irradiation. J. China Coal Sci. 2020, 45, 3471–3479. [Google Scholar]
- Liu, Z.Y.; Gan, D.Q.; Gan, Z. Experimental research on the dynamic mechanical properties and breakage behaviors of magnetite caused by microwave irradiation. Chin. Rock Mech. Rock Eng. 2021, 40, 126–136. [Google Scholar]
- Lu, G.M.; Ding, C.; Zhou, J.J.; Liu, H.N.; Liu, C.Y. Influences of Microwave Irradiation on Rock-Breaking Efficiency of a Reduced-Scale TBM Cutter. Appl. Sci. 2023, 13, 4713. [Google Scholar] [CrossRef]
- Chen, F.F.; Wang, C.; Zhang, Z.Q. Study of the effect of microwave irradiation path on the effectiveness of assisting rock breaking. J. Xi’an Univ. Technol. 2022, 38, 1–9. [Google Scholar] [CrossRef]
- Li, Y.H.; Lu, G.M.; Feng, X.T.; Zhang, X.W. The influence of heating path on the effect of hard rock fragmentation using microwave assisted method. Chin. J. Rock Mech. Eng. 2017, 36, 1460–1468. [Google Scholar]
- Lu, G.M.; Li, H.; Liu, C.; Wu, M.; Feng, A.N.; Xie, Y.Z. Influence of moisture on wave velocity and strength of rocks under microwave irradiation. Chin. Sci. Pap. 2019, 14, 1015–1021. [Google Scholar]
- Wei, W.; Shao, Z.S.; Zhang, Y.Y. Fundamentals and applications of microwave energy in rock and concrete processing—A review. Appl. Therm. Eng. 2019, 157, 113751. [Google Scholar] [CrossRef]
- Liu, J.; Xie, J.; Yang, B.; Li, F.; Deng, H.; Yang, Z.; Gao, M. Experimental Study on the Damage Characteristics and Acoustic Properties of Red Sandstone with Different Water Contents under Microwave Radiation. Materials 2023, 16, 979. [Google Scholar] [CrossRef]
- Hu, G.Z.; Yang, N.; Zhu, J.; Qin, W.; Huang, J.X. Evolution characteristics of microwave irradiation on pore-permeability and surface cracks of coal with water: An experimental study. J. China Coal Sci. 2020, 45, 813–822. [Google Scholar]
- Zhang, J.Y.; Feng, X.T.; Yang, C.X. The characteristics and mechanism of microwave-induced borehole fracturing of hard rock under true triaxial stress. Eng. Geol. 2022, 306, 106768. [Google Scholar] [CrossRef]
- Lu, G.M.; Feng, X.T.; Li, Y.H. Influence of microwave treatment on mechanical behavior of compact-basalts under different confining pressures. J. Rock Mech. Geotech. Eng. 2020, 12, 213–222. [Google Scholar] [CrossRef]
- Zhu, J.; Hu, G.Z.; Yang, N. Influence of microwave irradiation on the permeability of coal with different bedding dip angles. Gas Sci. Eng. 2022, 103, 104613. [Google Scholar] [CrossRef]
- Chen, F.F.; Wu, Z.Q.; Zhang, Z.Q. Effect of Waveguide Aperture and Distance on Microwave Treatment Performance in Rock Excavation. Sensors 2023, 23, 1929. [Google Scholar] [CrossRef]
- Khashayar, T.; Richard, C. Multiphysics study of microwave irradiation effects on rock breakage system. Int. J. Rock Mech. Min. 2021, 140, 104586. [Google Scholar]
- Martina, P.; Jari, J.J.; Timo, S. Numerical Modelling of Microwave Heating Assisted Rock Fracture. Rock Mech. Rock Eng. 2022, 55, 481–503. [Google Scholar]
- Ali, M.P.; Mahdi, M. Surface Roughness Assessment of Natural Rock Joints Based on an Unsupervised Pattern Recognition Technique Using 2D Profiles. Min. Geol. Petrol. Eng. Bull 2023, 38, 185–198. [Google Scholar]
- Ivana, D.; Petar, H.; Dražen, N. Development of a model for the estimation of shear strength of discontinuity in massive and karstified limestone. Min Geol Petrol Eng Bull 2021, 36, 43–57. [Google Scholar]
- EI-Soudani, S.M. Profilometric analysis of fractures. Metallography 1978, 11, 247–336. [Google Scholar] [CrossRef]
- Zhao, S.X.; Xu, F.Q.; Shi, S.Z. Microwave heating of silicon carbide. N.A. Ceram. 1996, 1, 29–31. [Google Scholar]
- Wang, Z.H.; Bai, E.L.; Liu, J.L.; Huang, H. Microwave heating efficiency and frost resistance of silicon carbide concrete. Sci. Technol. Eng. 2022, 22, 8821–8827. [Google Scholar]
- Amin, S.; Adel, A.; Mahdi, R. Numerical and experimental analysis of fully coupled electromagnetic and thermal phenomena in microwave heating of rocks. Miner. Eng. 2022, 178, 107406. [Google Scholar]
- Adel, A.; Amin, S.; Mahdi, R. Computational study of microwave heating for rock fragmentation; model development and validation. Int. J. Therm. Sci. 2022, 181, 107746. [Google Scholar]


| P-Wave Velocity (m·s−1) | Density (g·cm−3) | Compressive Strength (MPa) |
|---|---|---|
| 5556~5952 | 2.95 | 245 |
| Roughness | Average Incident Angle (°) | Reflection Coefficient, R | Reflection Loss Rate (%) |
|---|---|---|---|
| 1 | 0 | 0.250 | 50.0 |
| 1.1 | 25 | 0.227 | 47.6 |
| 1.2 | 34 | 0.209 | 45.7 |
| 1.3 | 40 | 0.196 | 44.2 |
| 1.4 | 44 | 0.187 | 43.2 |
| 1.5 | 48 | 0.179 | 42.3 |
| 1.6 | 51 | 0.175 | 41.8 |
| 1.7 | 54 | 0.172 | 41.4 |
Disclaimer/Publisher’s Note: The statements, opinions and data contained in all publications are solely those of the individual author(s) and contributor(s) and not of MDPI and/or the editor(s). MDPI and/or the editor(s) disclaim responsibility for any injury to people or property resulting from any ideas, methods, instructions or products referred to in the content. |
© 2023 by the authors. Licensee MDPI, Basel, Switzerland. This article is an open access article distributed under the terms and conditions of the Creative Commons Attribution (CC BY) license (https://creativecommons.org/licenses/by/4.0/).
Share and Cite
Chen, F.; Li, G.; Zhang, Z.; Wu, Z. The Law and Mechanism of the Effect of Surface Roughness on Microwave-Assisted Rock Breaking. Appl. Sci. 2024, 14, 207. https://doi.org/10.3390/app14010207
Chen F, Li G, Zhang Z, Wu Z. The Law and Mechanism of the Effect of Surface Roughness on Microwave-Assisted Rock Breaking. Applied Sciences. 2024; 14(1):207. https://doi.org/10.3390/app14010207
Chicago/Turabian StyleChen, Fangfang, Guoqing Li, Zhiqiang Zhang, and Zhanqiang Wu. 2024. "The Law and Mechanism of the Effect of Surface Roughness on Microwave-Assisted Rock Breaking" Applied Sciences 14, no. 1: 207. https://doi.org/10.3390/app14010207
APA StyleChen, F., Li, G., Zhang, Z., & Wu, Z. (2024). The Law and Mechanism of the Effect of Surface Roughness on Microwave-Assisted Rock Breaking. Applied Sciences, 14(1), 207. https://doi.org/10.3390/app14010207