Article

Local Stiffness Assessment of Geogrid-Stabilized Unbound Aggregates in a Large-Scale Testbed

1
Department of Civil Engineering, University of St. Thomas, 2115 Summit Ave., St. Paul, MN 55105, USA
2
Department of Civil and Environmental Engineering, University of Illinois Urbana-Champaign, 205 N. Mathews Ave., Urbana, IL 61801, USA
3
U.S. Army Engineer Research and Development Center, Vicksburg, MS 39180, USA
*
Author to whom correspondence should be addressed.
Appl. Sci. 2024, 14(1), 352; https://doi.org/10.3390/app14010352
Submission received: 31 October 2023 / Revised: 5 December 2023 / Accepted: 25 December 2023 / Published: 30 December 2023

Abstract

:
This paper integrates and extends an earlier article presented at the 20th International Conference on Soil Mechanics and Geotechnical Engineering. The generation of a stiffened zone in the proximity of a geogrid is one of the primary mechanisms of mechanical stabilization of pavement unbound aggregate layers using geogrids. This paper focuses on the quantification of the stiffened zone through a local stiffness assessment using bender element (BE) sensors. Unbound aggregate base layers were constructed in a large-scale laboratory testbed. Geogrid-stabilized layers had geogrids with different-sized triangular apertures contributing to the geogrid-stiffened zone. Shear wave velocities were measured at three different heights using BE sensors, and the vertical stiffness profiles of the mechanically stabilized aggregate layers were evaluated. In addition, the conversion method between small-strain stiffness and large-strain stiffness was established from the repeated load triaxial tests with BE pairs to transform the vertical stiffness profile into that of the resilient modulus. Furthermore, dynamic cone penetration (DCP) and light-weight deflectometer (LWD) tests were performed at multiple locations into the stabilized and unstabilized unbound aggregates. From the large-scale experimental study, the local stiffness improvement owing to the geogrid enhancement was up to 16.2% in the vicinity of the geogrid location, and the extent of the local stiffened zone evaluated through various test methods was between 15.2 cm (6 in.) and 25.4 cm (10 in.) above the geogrid.

1. Introduction

Geogrids have been widely used in flexible pavements and unpaved roads for an increased confinement by immobilizing unbound aggregates, increasing the bearing capacity of the layered system, and preventing excessive rutting. A geogrid, a form of geosynthetics, is typically a sheet featuring apertures of various shapes and is usually constructed from, or incorporates, polymeric materials [1]. When used in pavement unbound layers, geogrids could improve serviceability and extend service life.
The geogrid functions performed on roads include reinforcement and stabilization. Geogrid reinforcement increases the strength and/or reduces the deformation of a material by carrying tensile forces that the material alone would not carry [2]. The effect of geogrid reinforcement on roads, embankments, or slopes has been extensively studied for the design of geogrid-reinforced earth structures [3,4,5]. The geogrid-stabilization function is mobilized by forming a geosynthetic/soil composite material, e.g., a geogrid-aggregate system that is less deformable than the soil [2]. By installing geogrids in unbound aggregate base/subbase layers, aggregate particles are laterally restrained under wheel loading. This is often referred to as a geogrid-aggregate “interlock” mechanism. Such mechanical stabilization creates a stiffened zone in the geogrid’s vicinity. Previous research consistently exhibited reduced pavement surface deformations when geogrids were used to stabilize aggregate layers [6,7,8,9,10,11]. Various research efforts have evaluated the stiffening effect brought by the geogrid-aggregate interlock. Dynamic cone penetrometer (DCP) tests have demonstrated the stabilization function of the geogrid as more blows are required to reach a certain depth when the granular material is stabilized with a geogrid [12]. Pullout tests have also been conducted to study the load-transfer mechanism and the pullout strength of the geogrid [13,14,15,16,17]. In addition, the stiffness of the soil–geosynthetic composite was evaluated through geosynthetic composite stiffness test using a large-scale pullout test device [18,19]. Several research efforts have also utilized falling-weight deflectometer (FWD) and light-weight deflectometer (LWD) tests to examine the influence of geogrids, but the findings were generally inconsistent and dependable on the experimental conditions [8,20,21]. However, numerical studies using discrete and finite element methods (DEM and FEM, respectively) indicated that there is a stiffened zone in the vicinity of the geogrid [22,23,24,25,26]. Further, large-scale field and laboratory test section studies were commonly conducted to demonstrate the benefits of geogrids, which require significant research investments [8,11,21].
In addition to the evaluation techniques mentioned above, a direct quantification of the increase in modulus or stiffening effect, and the extent of the influence zone around a geogrid, are of immense interest to effectively design pavements with geogrids. A recent approach used at the University of Illinois has utilized shear wave transducers to quantify the stiffness enhancement brought by the geogrid and the influence zone. Shear wave transducers, in the form of bender elements (BE), have been widely used in laboratory settings to evaluate the stiffness characteristics of geomaterials, such as soils and aggregates, due to the good coupling between the sensor and the geomaterial [27]. Recent studies have proven that BE sensors can successfully quantify the local enhancement due to the geogrid-aggregate interlocking mechanism, both in laboratory and field settings [28,29,30,31].
The objective of this paper is to quantify the stiffening effect and the extent of the stiffened zone due to mechanical stabilization by geogrids installed in unbound aggregate base courses. Laboratory characterization of the aggregate material used in this study was first conducted to evaluate the material’s resilient behavior, small-strain modulus, and Poisson’s ratio at different stress states. The same material was evaluated with different geogrid types using the BE field sensor in a large-scale testbed. In addition, DCP and LWD tests were conducted for comparison.

2. Materials

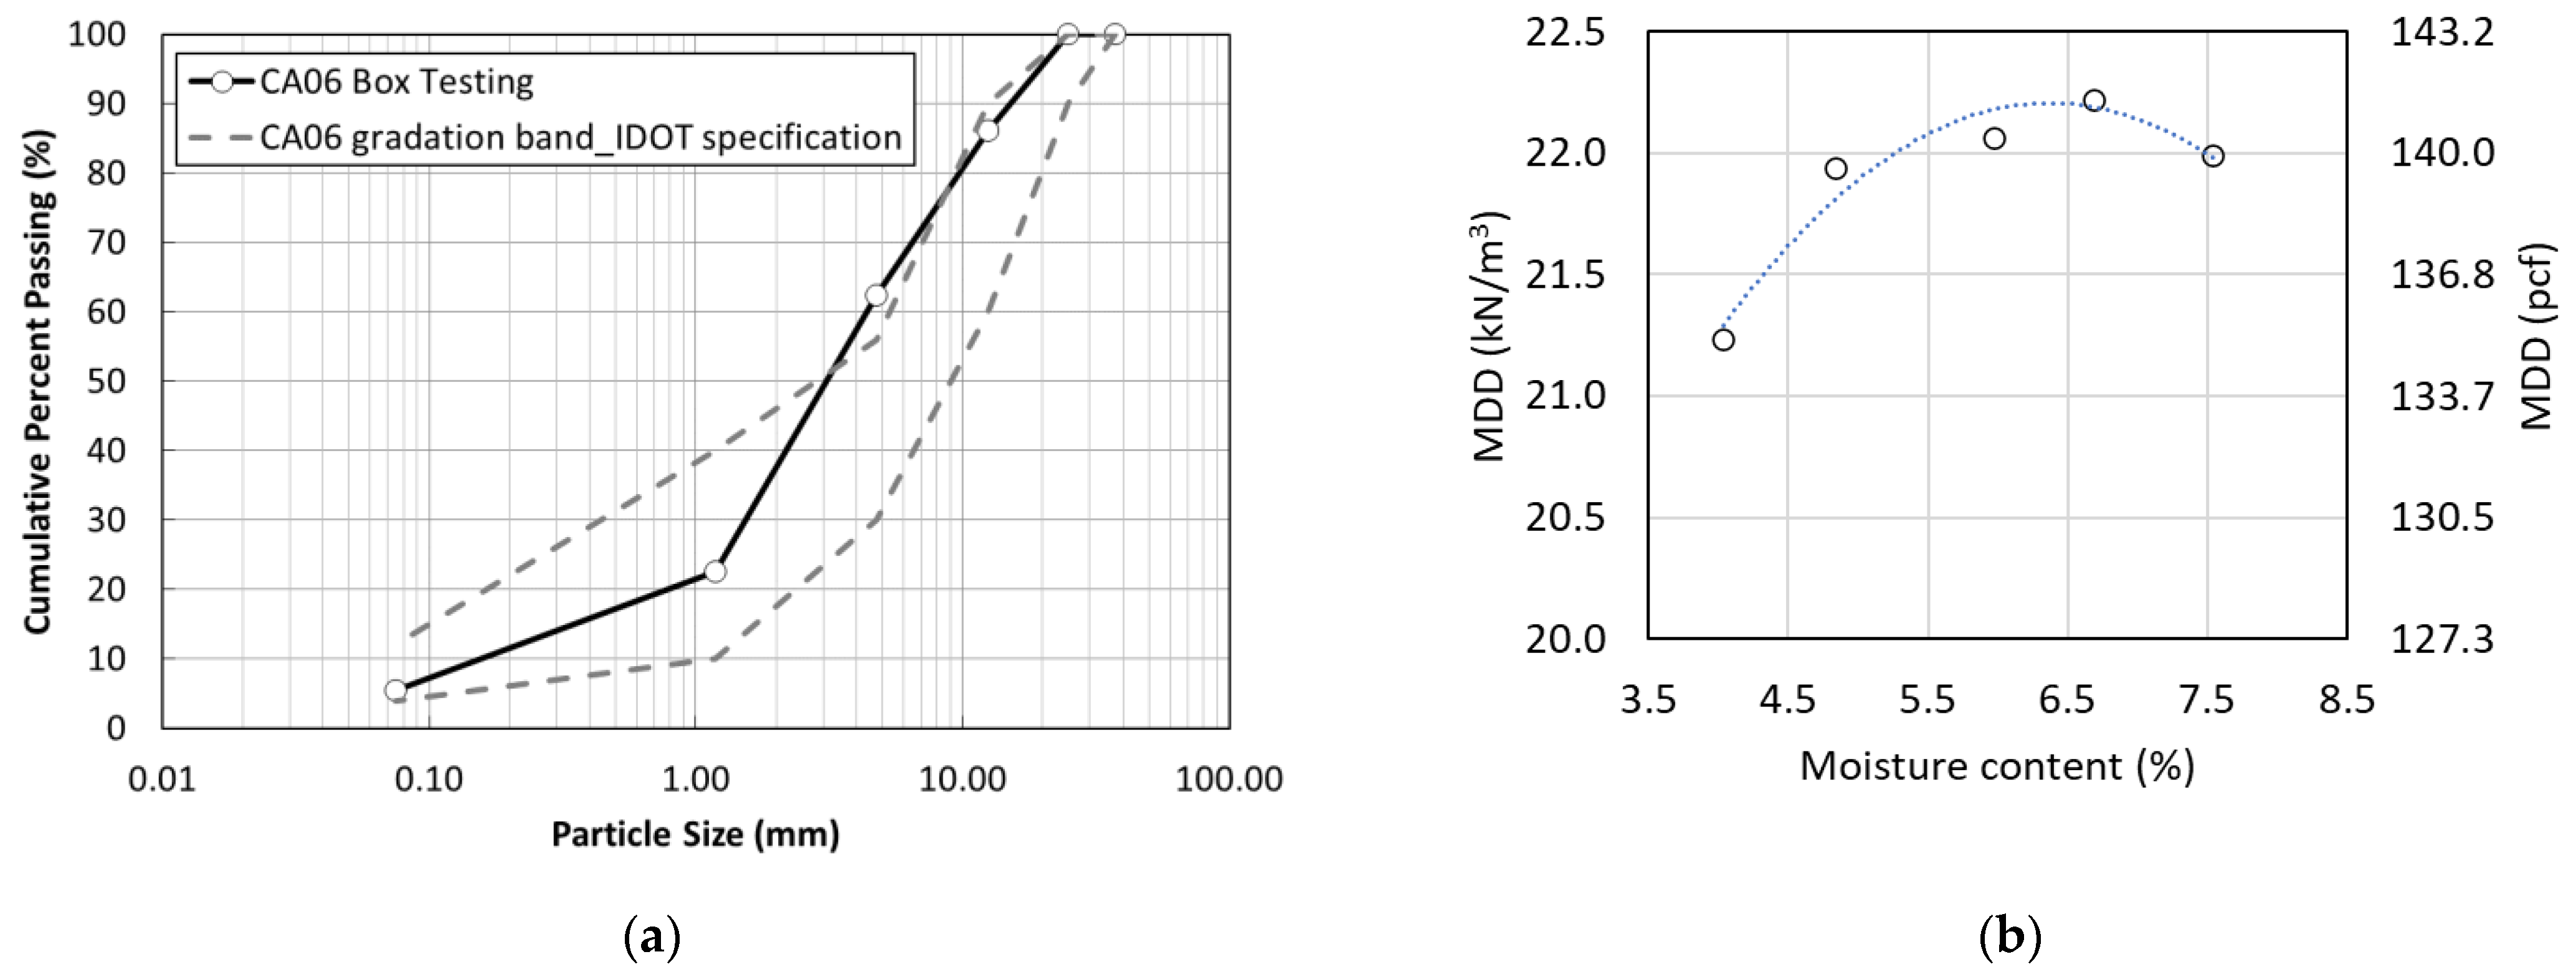
2.1. Unbound Aggregates

A crushed dolomite aggregate material from a quarry in Illinois, USA, was selected for this experiment. The crushed dolomite is classified as poorly graded sand with silt (SP–SM) based on the unified soil classification system (USCS) and as an A–1–a (stone fragments, gravel, and sand) based on AASHTO soil classification [32,33]. The grain size distribution is shown in Figure 1a obtained following ASTM C136 [34]. The material is a dense-graded aggregate material with a similar gradation as the CA 6 gradation specified by the Illinois Department of Transportation (IDOT) and presented as dashed lines in Figure 1a [35]. Table 1 summarizes the material properties, including the Nominal Maximum Aggregate Size (NMAS), the material percentage passing the No. 200 sieve (i.e., finer than 0.075-mm), D50, corresponding to the sieve size for which 50% of the material will pass, the coefficient of uniformity (Cu), the coefficient of curvature (Cc), and the gravel-to-sand ratio (G/S, ratio of gravel-sized material retained on No. 4 sieve [4.75-mm opening] to sand size material passing No. 4 sieve but retained on No. 200 sieve).
The compaction characteristics of this material were determined following the ASTM D1557 using the modified Proctor compaction effort (2700 kN-m/m3 (56,000 ft-lbf/ft3)) as presented in Figure 1b [36]. The maximum dry density (MDD) is 22.2 kN/m3 (141.4 pcf) at an optimum moisture content (OMC) of 6.5%.

2.2. Geogrids

Two punched and drawn geogrids were used in this study. The two geogrids have triangular-shaped apertures with different sizes and are referred to herein as GG1 and GG2. GG1 has a larger aperture size. The properties of the two geogrids are summarized in Table 2. The two geogrids are expected to perform differently in mechanical stabilization as the geogrid aperture size influences the stabilization effectiveness [37].

3. Experimental Setup

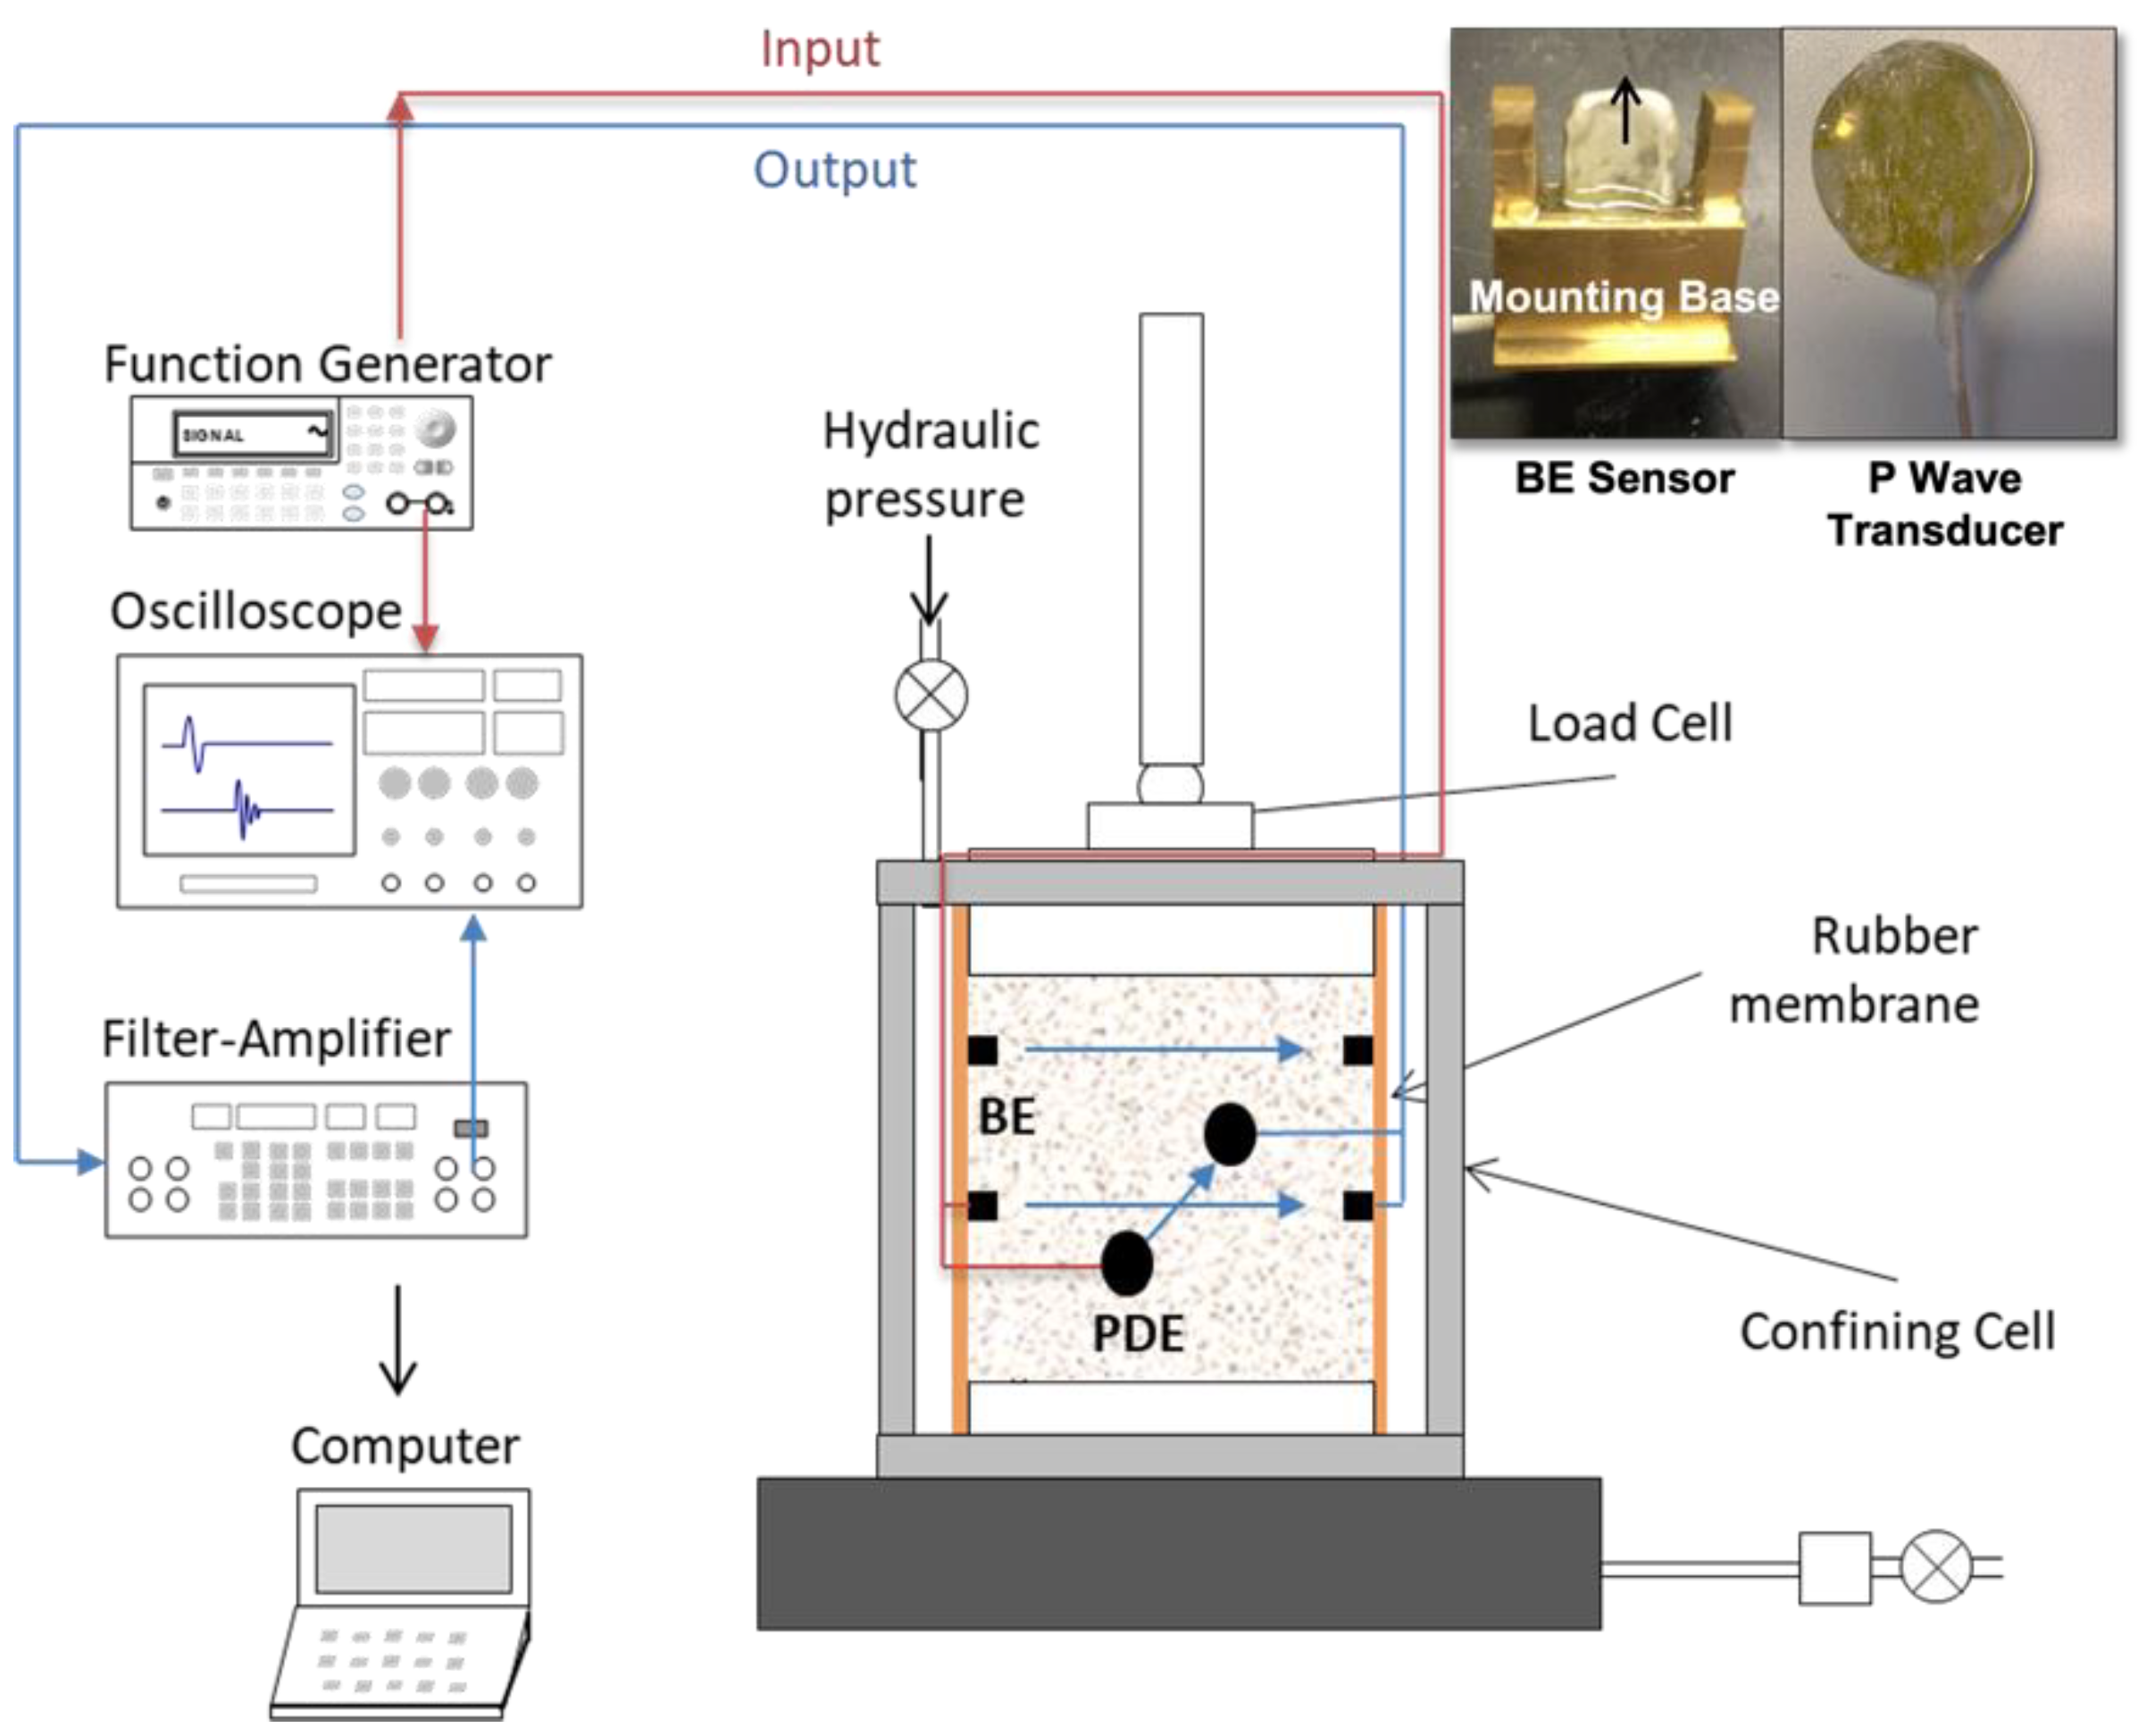
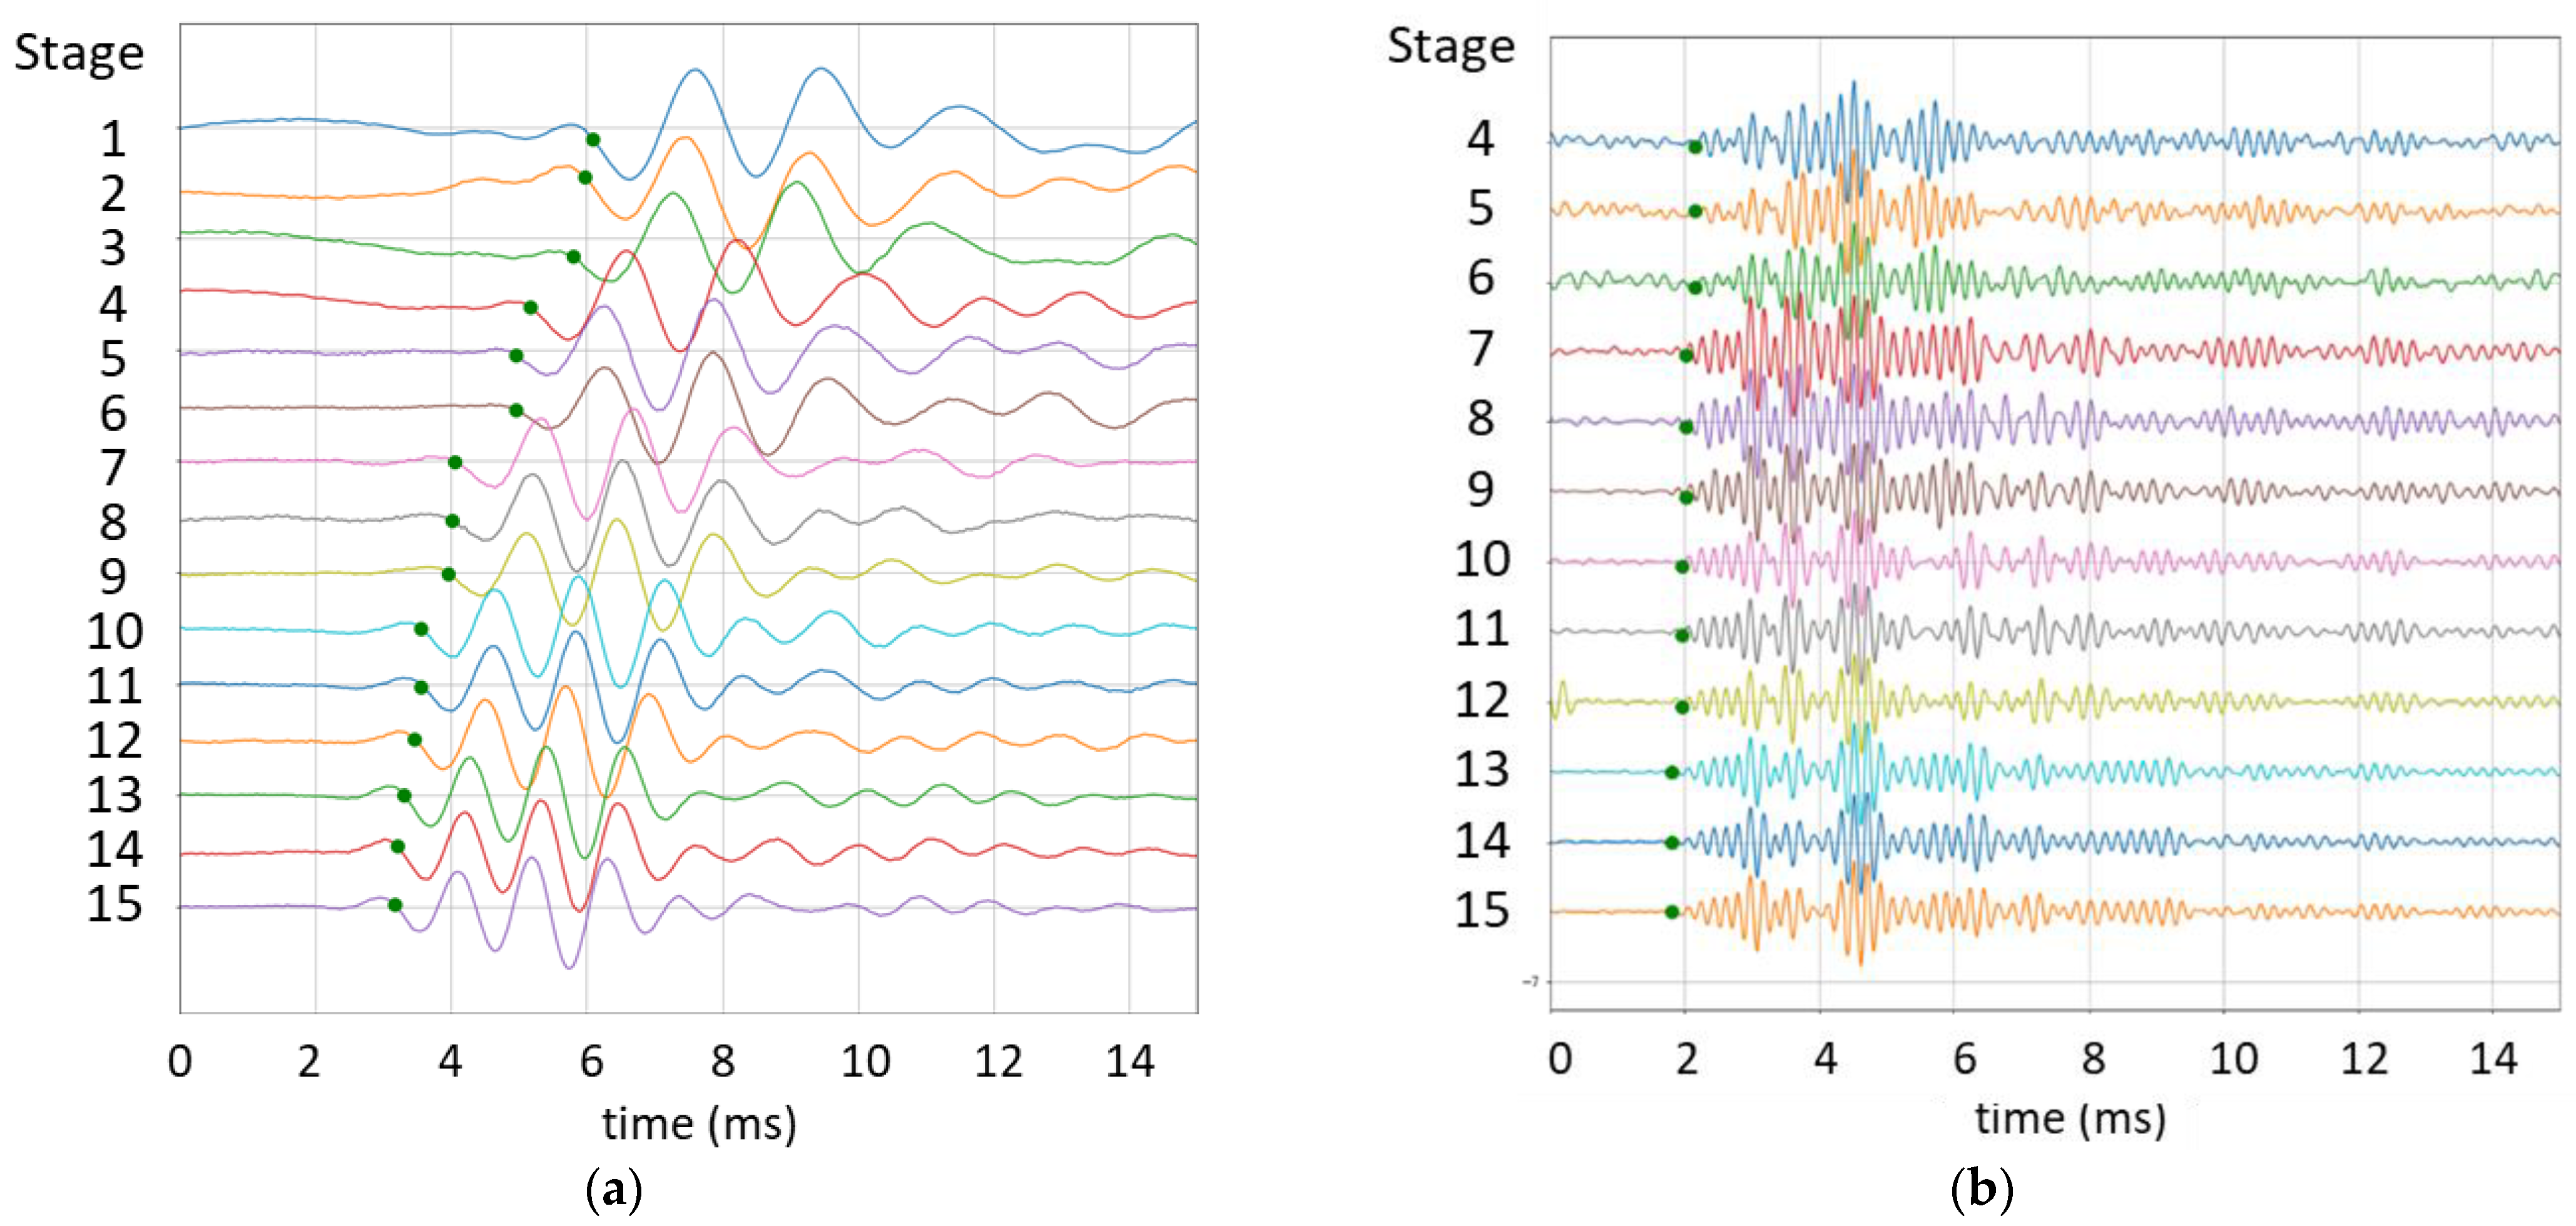
3.1. UI–FastCell Triaxial Test Setup with Elastic Wave Transducers

Repeated load laboratory tests were conducted using the UI–FastCell triaxial test setup [38]. This state-of-the-art triaxial testing equipment can characterize the anisotropic resilient properties of granular materials. The UI–FastCell can accommodate a cylindrical specimen of 150 mm (6-in.) in diameter and 150 mm (6-in.) in height. A pneumatic actuator applies the axial pressure, while the confining pressure is applied through compressing a hydraulic fluid behind a silicone membrane surrounding the specimen. The UI–FastCell has both axial and radial linear variable differential transformers (LVDTs) for displacement measurements. In this study, the laboratory BE sensors and P wave transducers were used to instrument the triaxial specimens. A schematic of the test setup using the UI–FastCell is shown in Figure 2.
Shear wave transducers, in the form of bender elements (BE), have been widely used for evaluating granular materials [27,39,40,41].A BE sensor consists of a thin metal plate sandwiched between two piezoceramic plates. An external electric voltage can vibrate the piezoceramic plates, which propagates a wave in the surrounding medium. Conversely, physical deformation of the plates will generate an electric voltage for measurement. Thus, a BE sensor can be utilized as either a source or a receiver for elastic waves. P wave transducers, in the form of the piezo disk element (PDE), on the other hand, have a similar working principle as BE sensors. The only difference is that instead of propagating a shear wave, a P wave (primary or pressure wave) is transmitted.
A schematic drawing of UI–FastCell incorporated with both BE sensors and P wave transducers is shown in Figure 2. In this laboratory setup, two pairs of BE sensors were embedded in the specimen at mid-height and at 51 mm (2-in.) above mid-height. The P wave transducers were installed 60 degrees away from the BE sensors at mid-height.
The typical measurement system for BE sensors and P wave transducers is shown in Figure 2. It consists of a signal generator, a filter amplifier, an oscilloscope, and a computer. The signal generator delivers the input signals to excite the source transducer, which is also recorded by the oscilloscope for first arrival time determination. The receiver transducer collects the elastic wave propagated through the specimen and transmits an electrical signal to the filter amplifier. The final output signal is collected by the oscilloscope after the filter amplifier’s conditioning. The signal used for the first arrival time determination is the average of 1024 stacking signals for a higher signal-to-noise ratio (SNR) over the oscilloscope. In addition, the sinusoidal wave at the resonant frequency of the specimen is usually applied as the input signal to achieve a better signal quality [39].

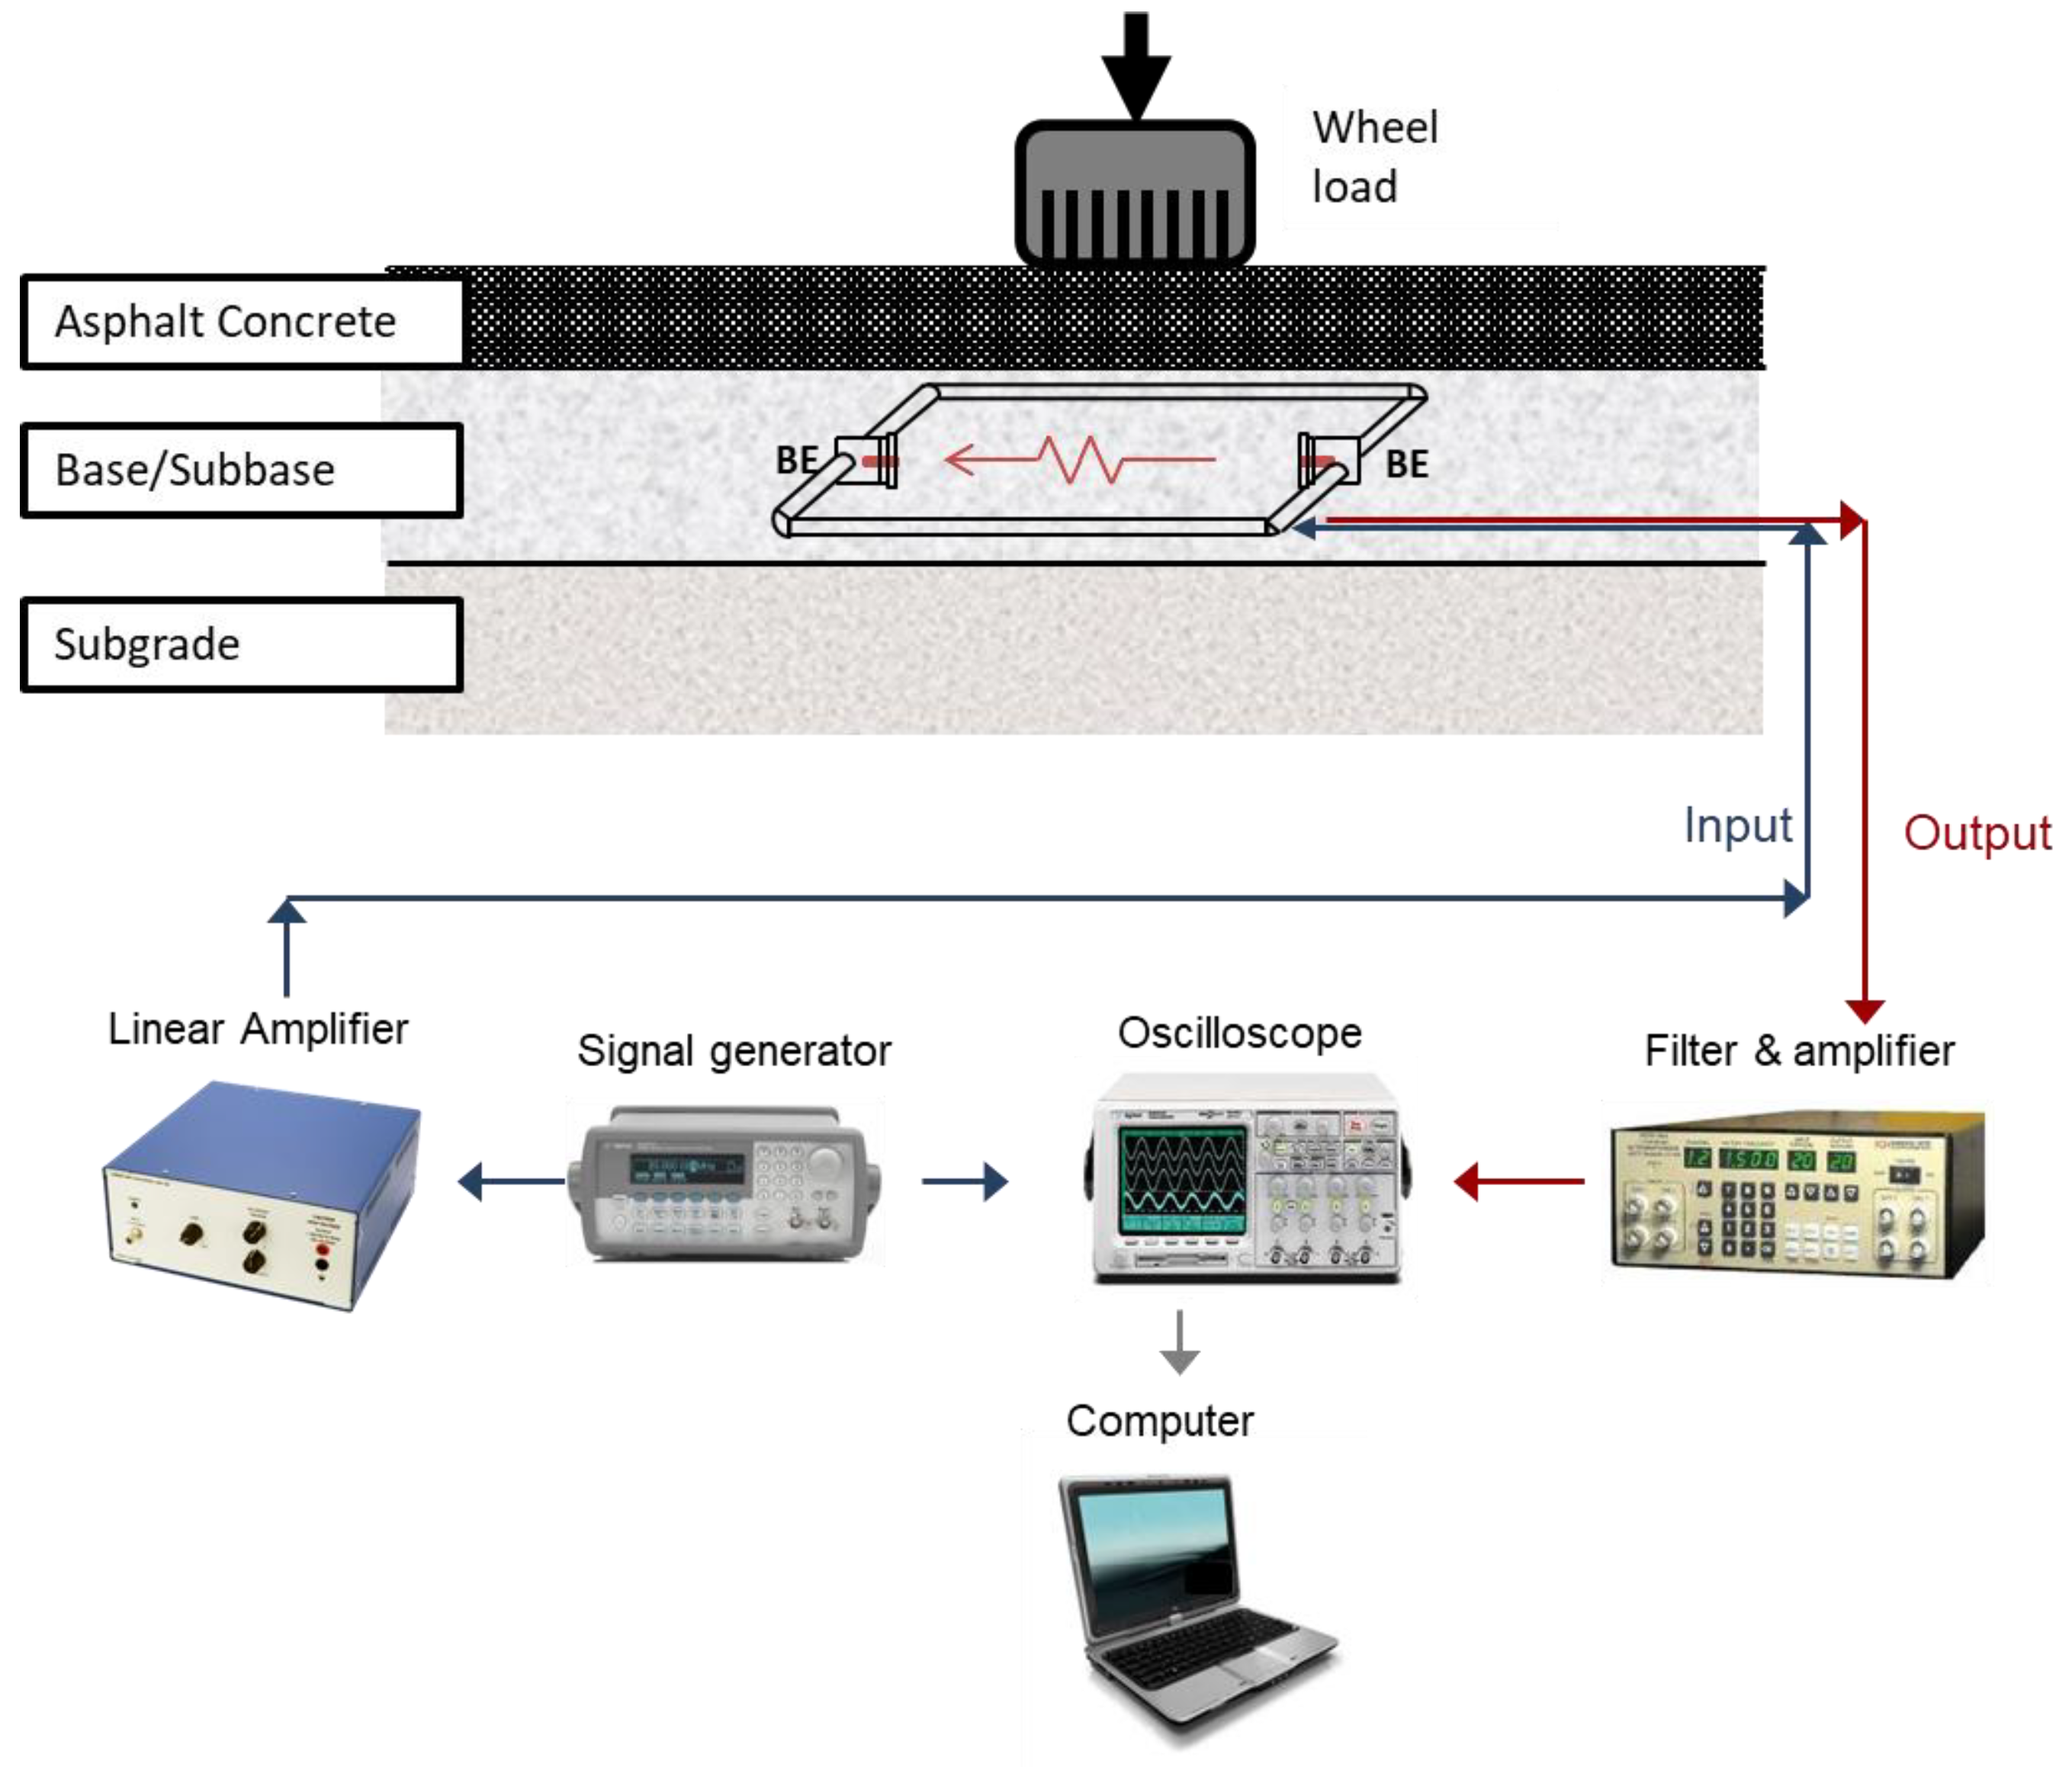
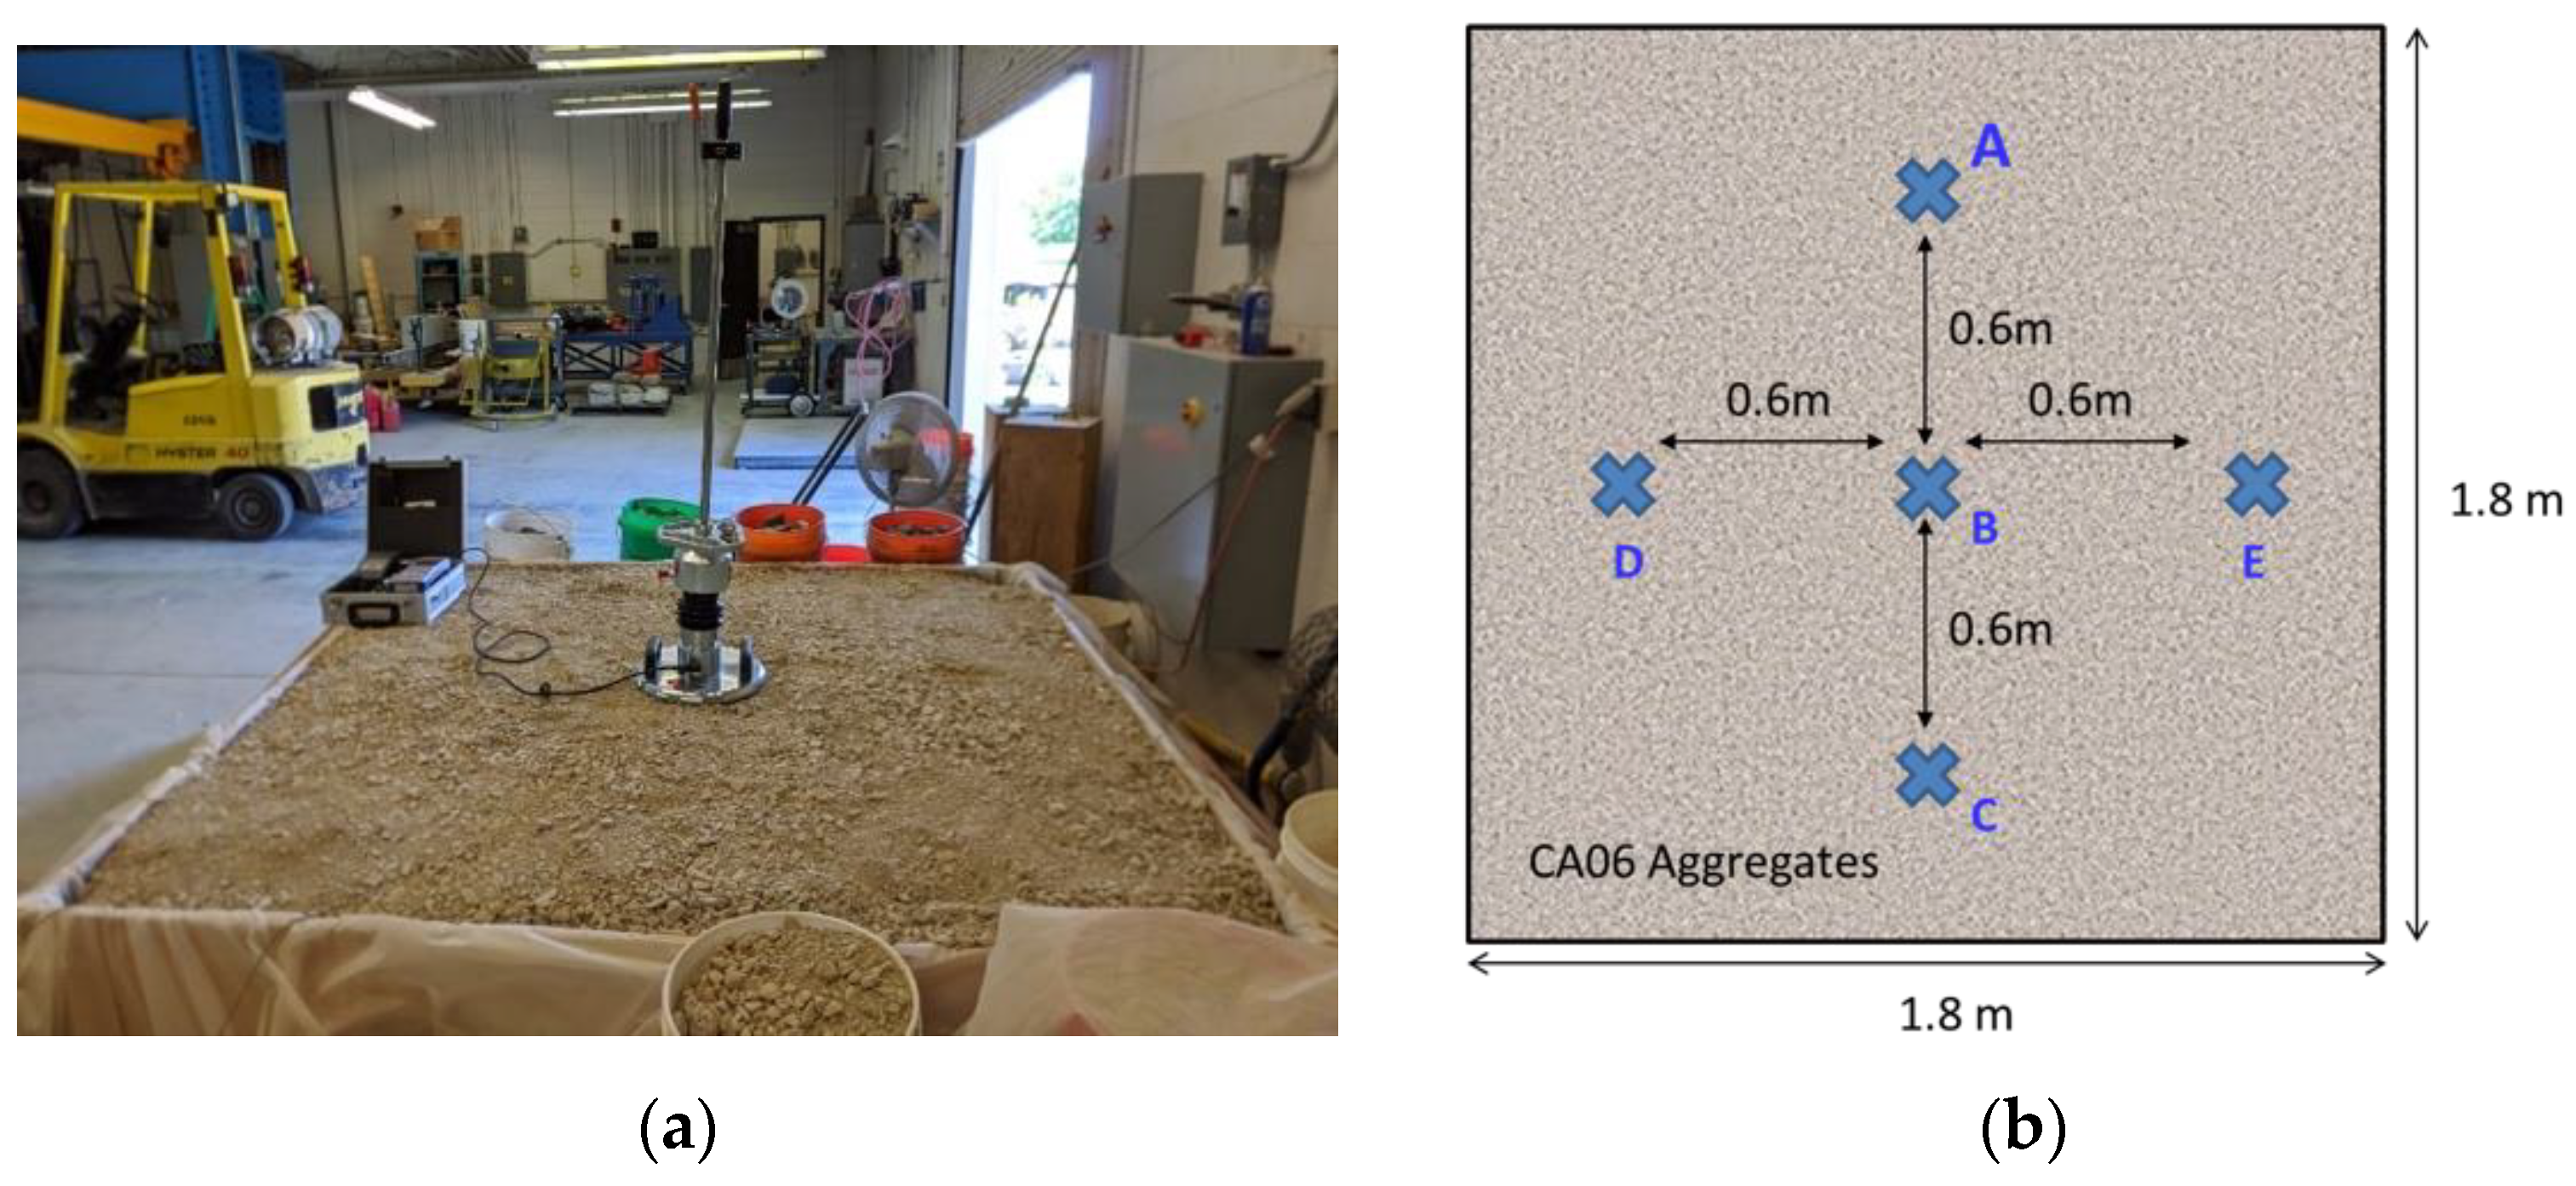
3.2. Large-Scale Testbed Equipped with BE Field Sensors

The aggregate material, stabilized with a geogrid, was evaluated in a laboratory large-scale testbed through shear wave velocity measurements using the BE field sensors. The BE field sensor consists of a pair of BEs, a BE sensor-protection module, and a metal frame. The metal frame helps to fix BE sensor locations, which will maintain the fixed distance and orientation of both source and receiver sensors. Meanwhile, they also protect the cables [30].
The same measurement system described above was used for the BE field sensor but with the addition of an amplifier, which can amplify the input signal transmitted from the signal generator into the source sensor by up to six times. The amplification is necessary for improving the signal’s quality due to the longer propagation distance and higher energy loss. A schematic drawing of the BE field sensor used in this study (dimensions included), along with the measurement system, is shown in Figure 3.
A large-scale testbed was utilized for evaluating the geogrid performance in mechanical stabilization. The testbed was built as a box with 182.9 cm (6-ft) length by 182.9 cm (6-ft) width by 61.0 cm (2-ft) height dimensions to provide sufficient space for constructing an aggregate layer. Oven-dried materials were used to maintain the material’s conditions consistent throughout this study. The achieved density of the material was around 18.61 kN/m3 (118.5 pcf), which is much lower than the MDD value owing to the dry condition. Previous studies have demonstrated that expanded polystyrene (EPS) geofoams can be used as a uniform subgrade material with relatively low strength [42,43]. Thus, a 15.2 cm (6-in.) thick EPS geofoam was placed at the bottom of the testbed to function as a soft subgrade. The equivalent California bearing ratio (CBR) for the geofoam is determined as 5%, which is similar to a low-strength fine-graded soft subgrade soil [44]. The aggregate layer was constructed above the geofoam in four lifts, and each lift is approximately 115 mm (4.5-in.) with adjustments to accommodate the BE field-sensor location. The compaction was conducted using a vibratory plate compactor with a consistent number of passes on top of each lift for uniform compaction. Further, the coarse aggregates near the BE sensor module were compacted through hand-tamping to ensure proper contact between the sensor and the aggregate material. The finished base course layer was 45.8 cm (18-in.) thick.
In this study, the text matrix consisted of seven test scenarios with different geogrid placement and different BE field-sensor locations, as shown in Figure 4 and Table 3. Geogrids (GG1 or GG2) were placed 10 cm (4-in.) above the geofoam. When GG1 was placed, the BE field sensor was only installed at the bottom location, which is 2.5 cm (1-in.) above the geogrid. When GG2 was placed, the BE field sensor was placed at the bottom, middle [15.2 cm (6-in.) above the geogrid], and top [25.4 cm (10-in.) above the geogrid] locations. Geogrids were placed in the testbed without fixing them to the side of the box, which replicates the typical roadway construction practices. For the control tests without a geogrid, the BE field sensor was also placed at the bottom, middle, and top locations for comparison. A schematic drawing of the testbed is shown in Figure 4a, and the BE field sensor placement at the bottom location over a geogrid is shown in Figure 4b. The seven test scenarios with BE field-sensor locations and geogrid placements are summarized in Table 3 with the designated test number (Test no.).

4. Test Procedures

4.1. Repeated Load Triaxial Testing

Specimens were prepared for triaxial testing in two lifts, each lift measuring 76 mm (3-in.) in height. Repeated load triaxial tests were conducted following the AASHTO T 307 test procedure to determine the material resilient properties [45]. The stress states applied include one conditioning and 15 loading sequences, as presented in Table 4. Each load cycle is a haversine pulse with 100 ms pulsing and a 900 ms rest period to simulate a wheel passing. The vertical strain was averaged from two axial LVDT measurements. Both shear and P waves were measured under the application of the confining pressure, but after the pulsed loads were completed.

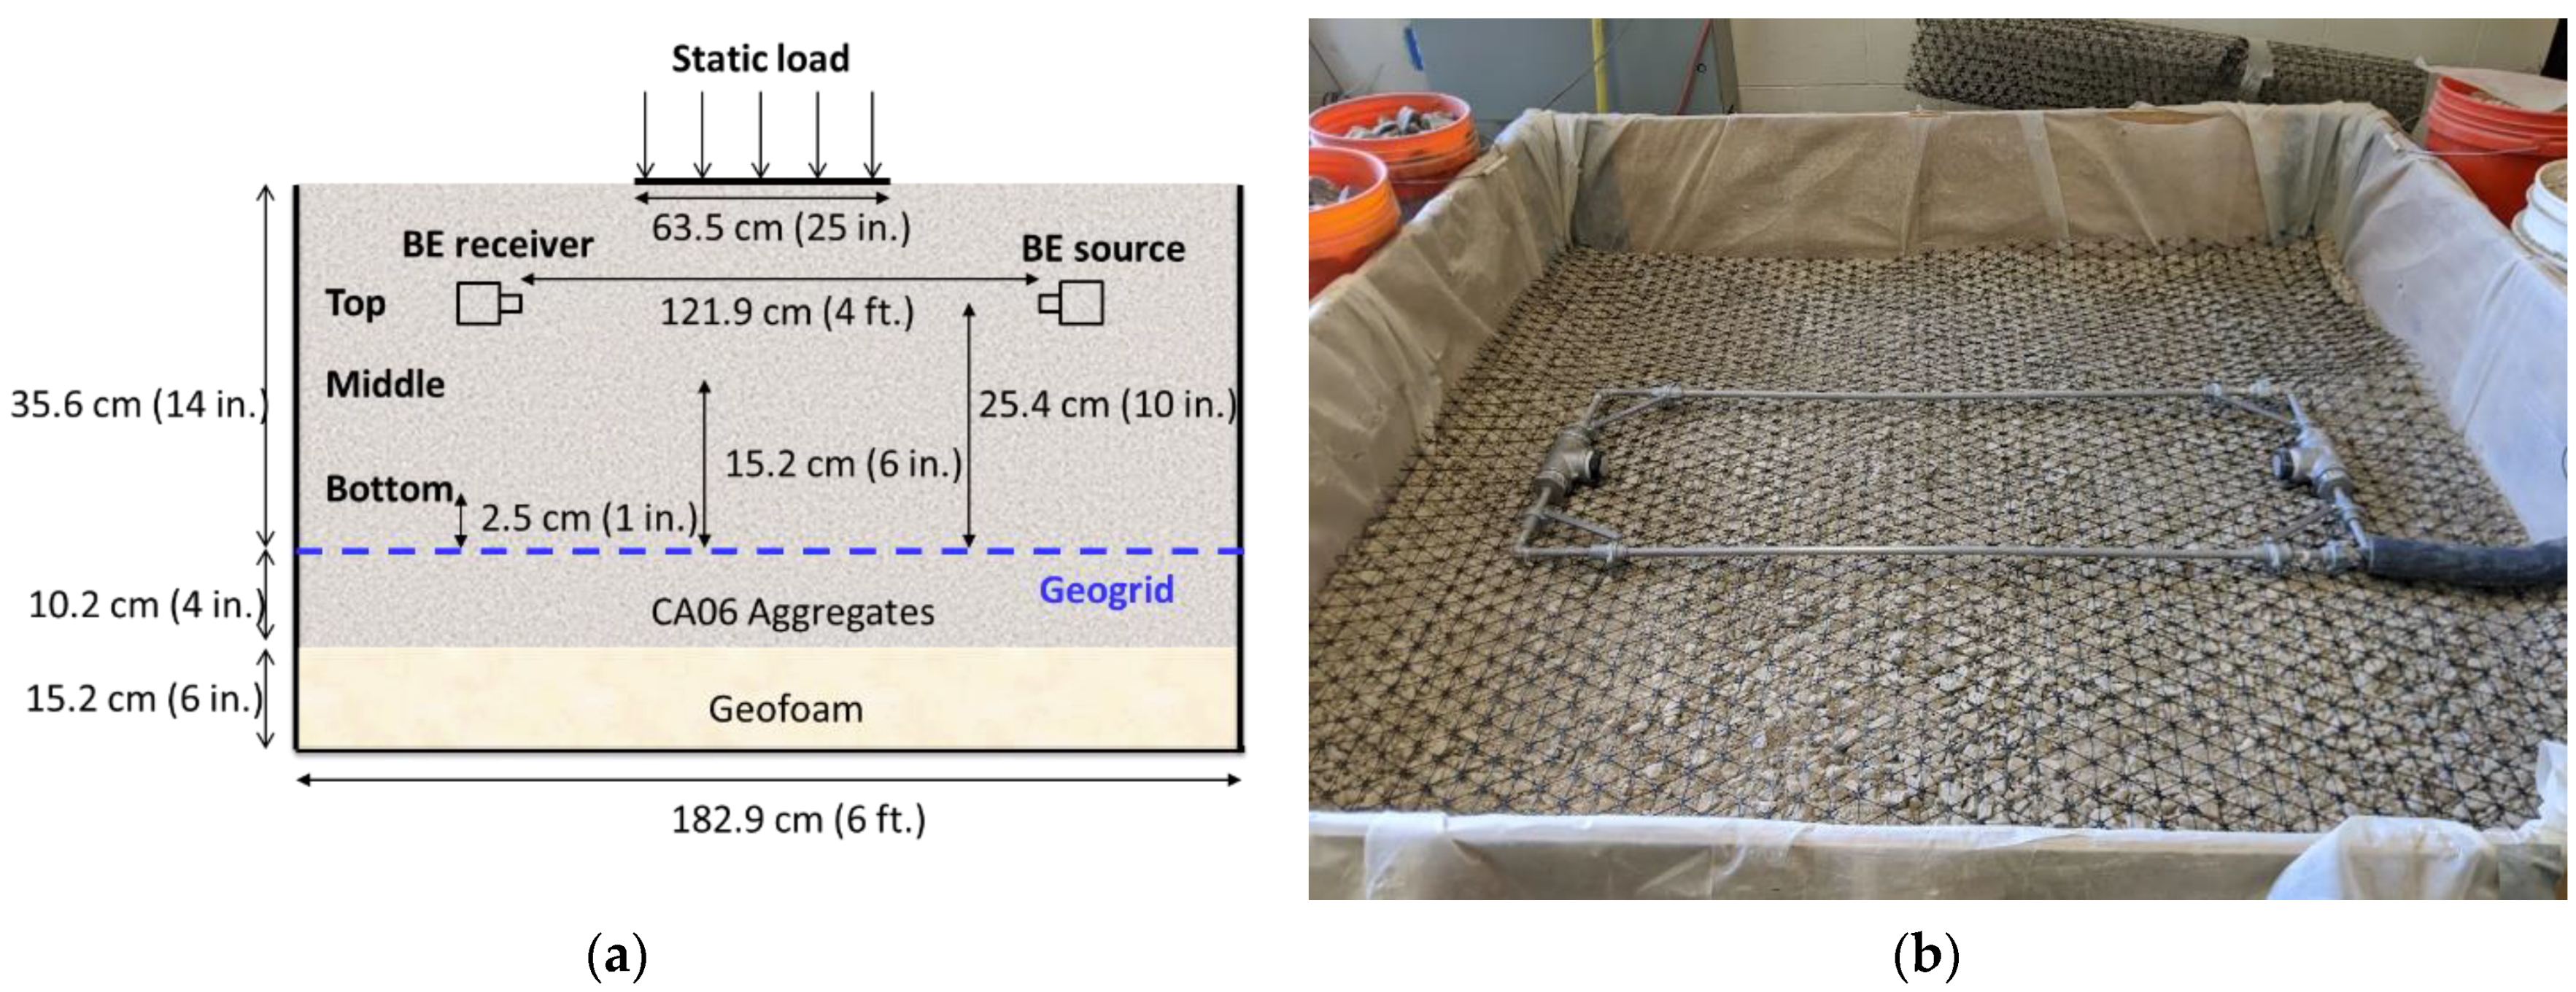
4.2. Large-Scale Testbed Experiments

As mentioned in Table 3, the BE field sensor was installed at three different heights above the geogrid to collect shear wave velocities. Shear waves were collected when five different levels of static surcharge loads were applied on the surface of the aggregate layer. The static surcharge was applied on top of a rigid rectangular plate [63.5 cm (25-in.) by 53.5 cm (21-in.)], as shown in Figure 4a. The five different levels of static surcharge were applied in sequence, as noted in Table 5, which lists the static load applied with the corresponding vertical stress. The shear wave velocities were measured after each load level was applied. Note that the maximum static load (2.85 kN) was as low as a single wheel load of a sub-compact car [46].

4.3. Dynamic Cone Penetration (DCP) and Light-Weight Deflectometer (LWD) Testing

DCP tests were conducted to measure the differences in resistance to penetrating the aggregate layer stabilized with a geogrid and no geogrid. The DCP has a metal cone driven into the aggregate layer by repeatedly striking it with a weight of 8 kg (17.6 lb.) from a drop height of 575 mm (2.26-ft). The penetration after each blow was recorded, and the results were correlated to CBR using an empirical relationship.
Meanwhile, the composite surface moduli on top of the aggregate base course were measured using an LWD. Six LWD drops, including three seating drops, were used at each measurement point. A Zorn LWD with a falling weight of 5 kg (11 lbs.) and a drop height of 0.375 m (14.8 in.) was utilized. The LWD device placed on top of the testbed is shown in Figure 5a.
The DCP tests were conducted at three measurement points in the testbed, i.e., Points A to C shown in Figure 5b, while LWD tests were conducted at five measurement points, i.e., Points A to E shown in Figure 5b. The LWD tests were conducted ahead of the DCP tests to avoid any penetration-induced disturbance to the aggregate layer.

5. Results and Discussion

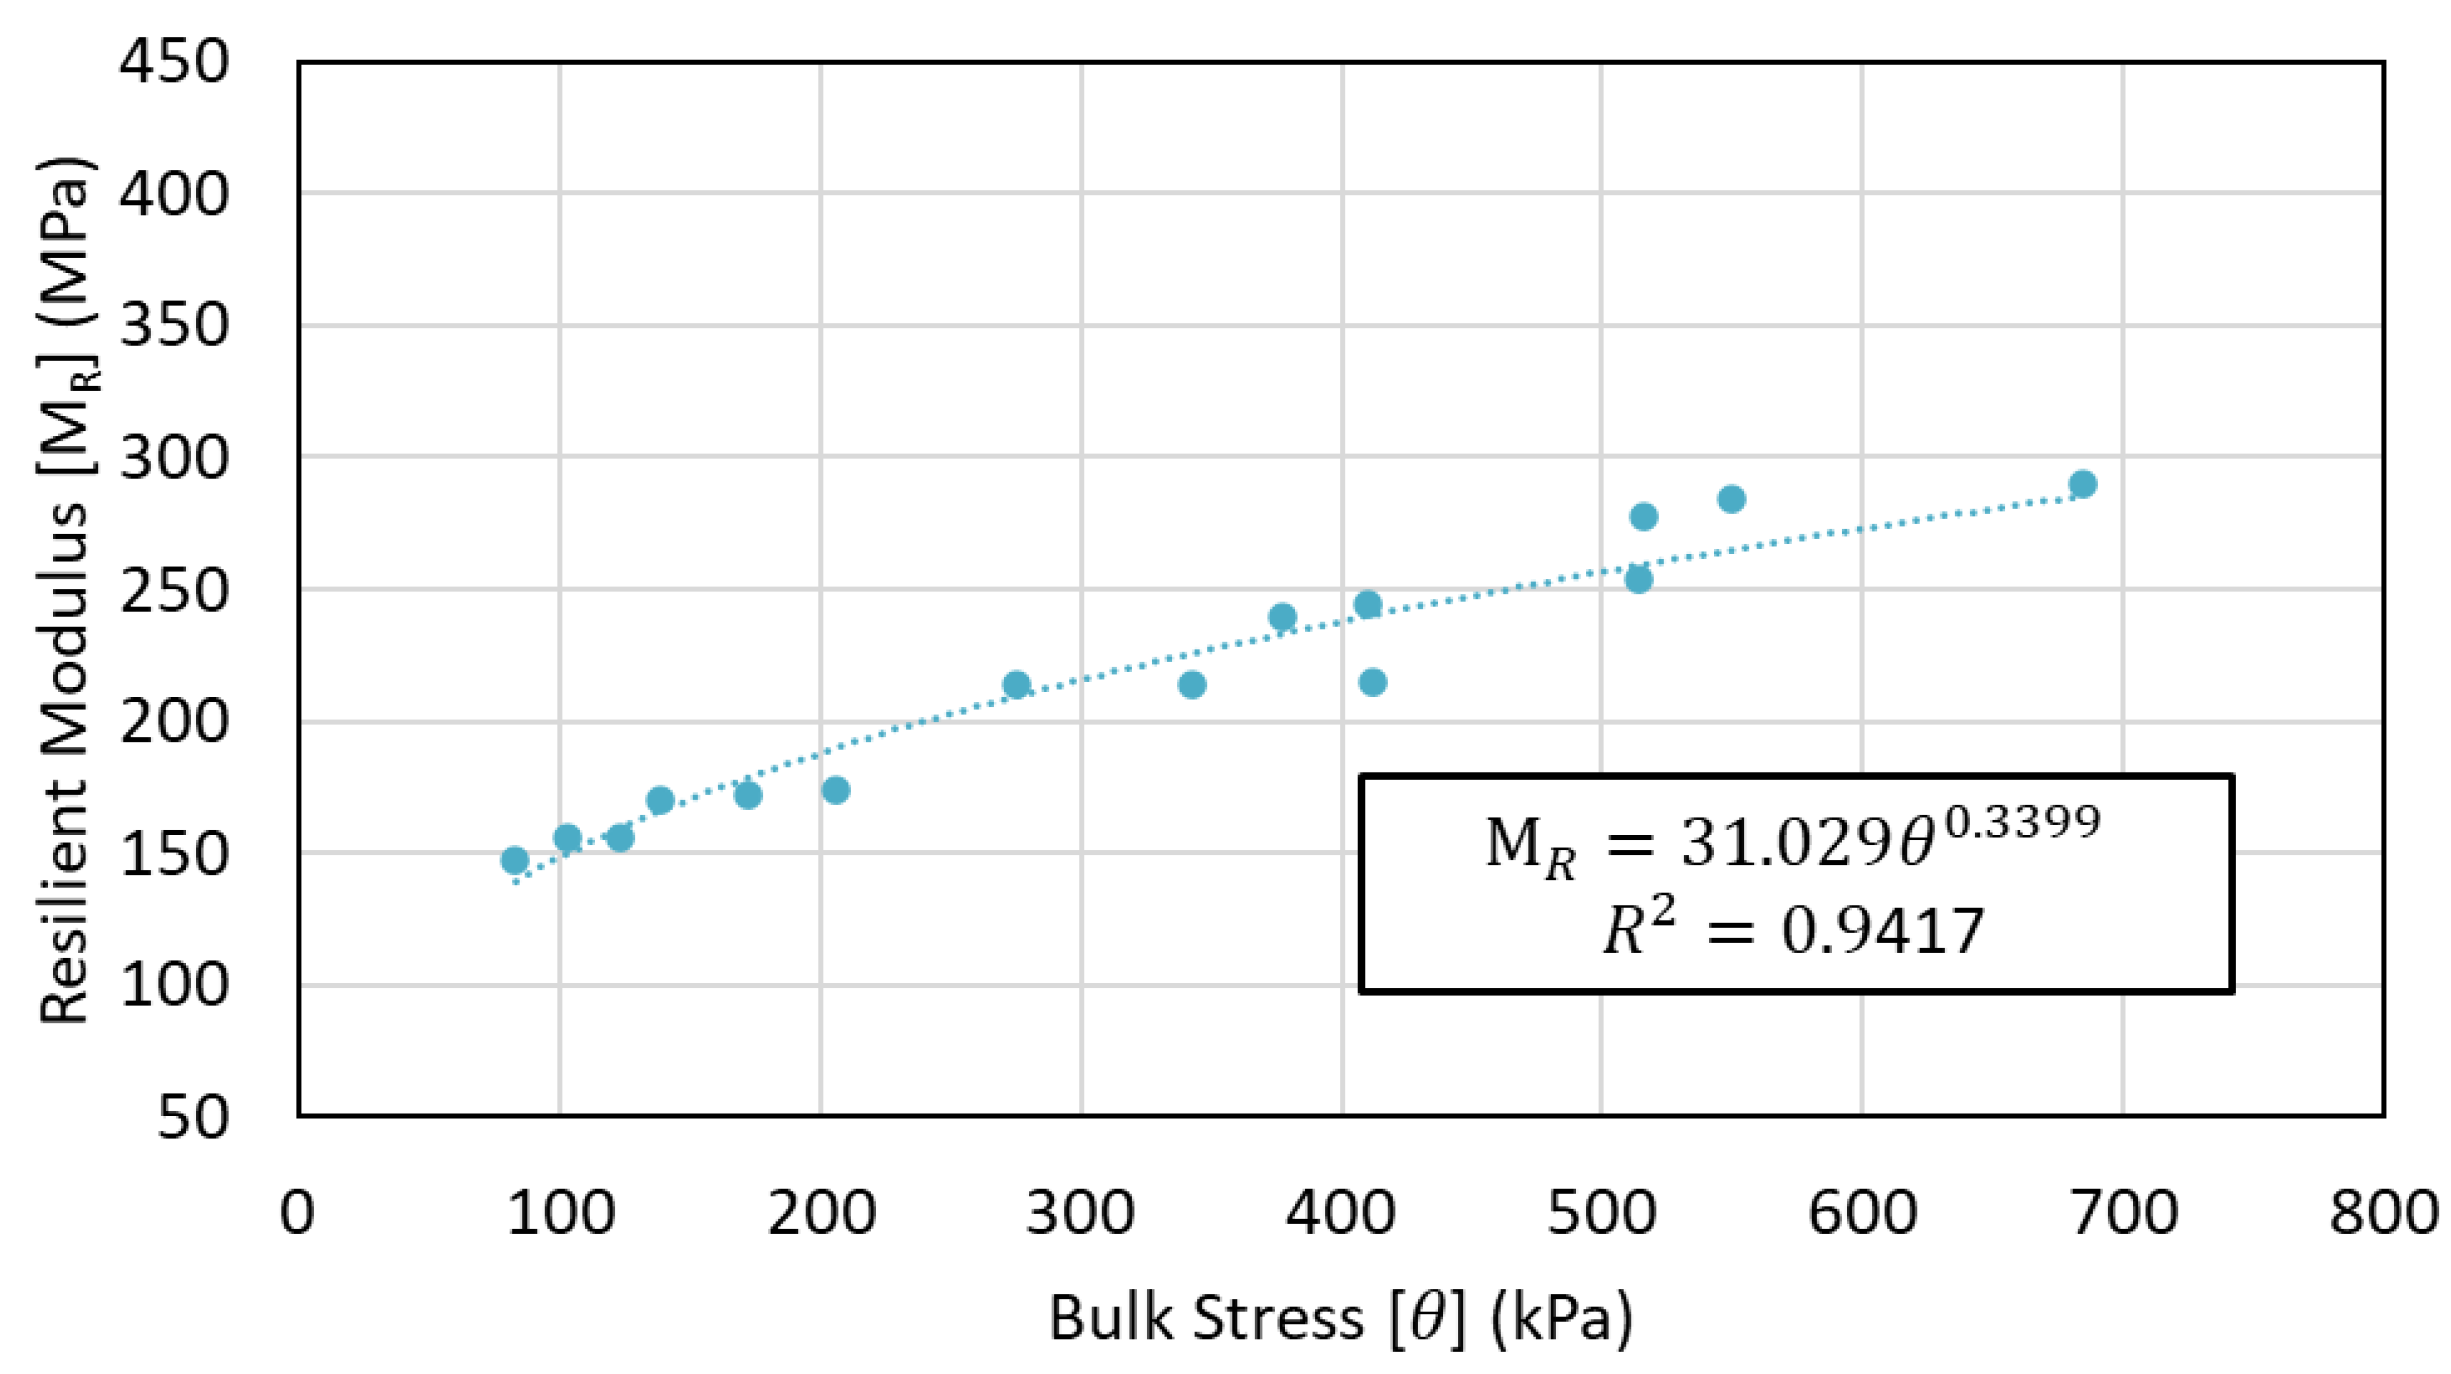
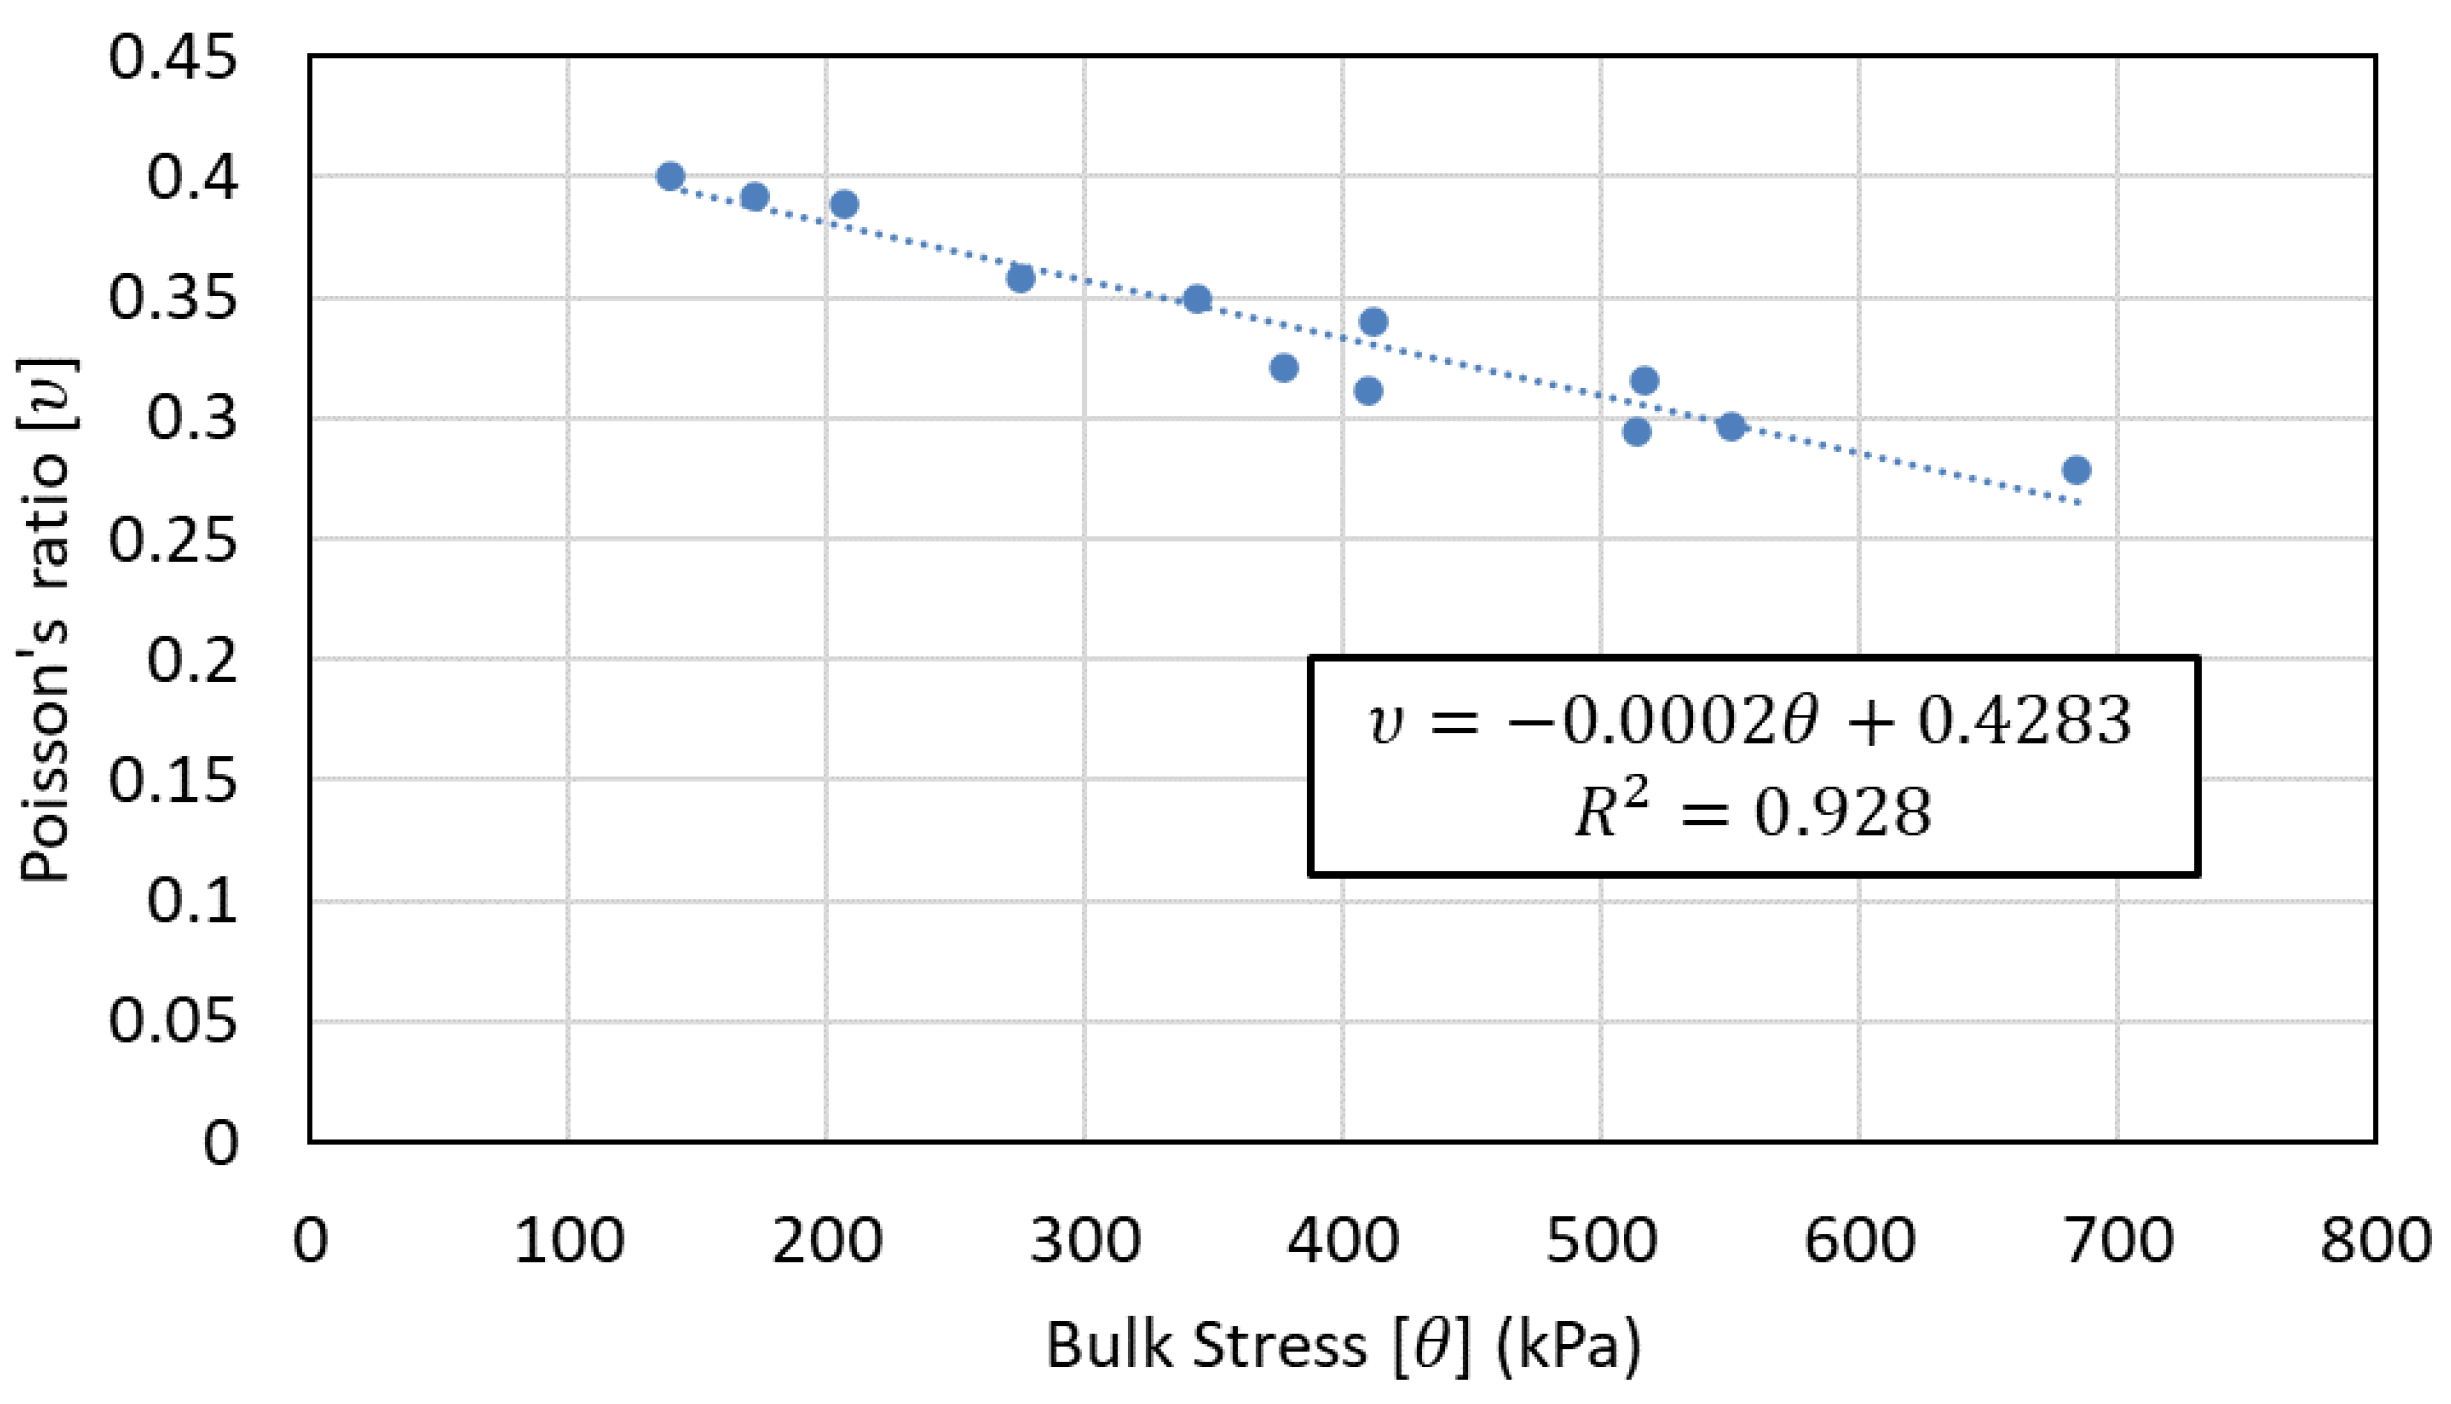
5.1. Estimation of Poisson’s Ratio, Applied Bulk Stress, and Small-Strain Elastic Modulus

During the repeated load triaxial tests, the resilient moduli (MR) were estimated by averaging the resilient strain and deviator stress values from the last five cycles out of the 100 load repetitions applied at each stress state using Equation (1):
M R = σ d ε r
where σ d is the deviator stress and ε r is the recoverable resilient strain.
The computed resilient modulus from each stress state is displayed in Figure 6, which shows the increase in resilient modulus with bulk stress and illustrates the stress-hardening characteristic of the unbound aggregate material. The stress-dependent moduli were characterized using the Hicks and Monismith (K–θ) model for MR, as expressed in Equation (2) [47]. A high coefficient of determination (0.94) was obtained.
M R = 31.029   θ 0.9417
where θ is bulk stress applied to the specimen.
Figure 7 displays the shear and compressional wave signals obtained after each test stage of the repeated load triaxial test. The compressional wave signals were only recorded from Stress States 4 to 15. At lower stress levels, the confining pressure was not sufficient to provide enough support to the P-wave sensor, which was necessary for the generation of compressional waves. The first arrival times of the elastic wave signals gradually decreased as the magnitude of the bulk stress applied to the specimen increased, up to Stage 15. The elastic wave velocities, for shear and P waves, can be calculated using Equation (3) with the known distance between the source and the receiver wave transducers.
V P   o r   V S = L t t i p t i p
where VP and VS are the compressional and shear wave velocities, respectively, t t i p t i p is the first arrival time of the elastic wave, and L is the distance between the two transducers.
While the modulus of the specimen is a function of the applied bulk stress, shear wave velocity (Vs) is a function of the small-strain shear modulus and can be expressed by Equation (4) [48]:
V S = G m a x ρ 0.5
where ρ is the density of the specimen and G m a x is the small strain shear modulus. Therefore, the shear wave velocity can be expressed in terms of the applied bulk stress. Figure 8 presents the correlation between the applied bulk stress and the shear wave velocity, which is provided in Equation (5):
V S = 48.169   θ 0.324
In reverse order, the bulk stress applied to the unbound aggregate specimen can also be estimated using the shear wave velocity as follows:
θ = 0.0208 V S 3.086
The Poisson’s ratio of an isotropic material can be calculated from its shear wave velocity and compressional wave velocity as follows:
υ = 0.5 V P V S 2 1 V P V S 2 1
Figure 9 illustrates the Poisson’s ratio of the unbound aggregate material with regards to the applied bulk stress. The Poisson’s ratio is a function of density, gradation, and applied confining pressure. The ratio decreases as the confining pressure increases [49,50,51,52,53]. Therefore, Poisson’s ratio can be expressed as a function of the bulk stress applied to the specimen as expressed in Equation (8). A high coefficient of determination (0.928) was achieved.
υ = 0.0002 θ + 0.4283
The elastic modulus in a small-strain range of an isotropic material is a function of shear modulus and Poisson’s ratio, and it can be calculated as follows:
E B E = 2 G m a x ( 1 + υ )
where E B E is the elastic modulus from the BE sensor in the small strain range, referred to herein by BE modulus, and υ is the Poisson’s ratio of the aggregate material. Therefore, the small-strain elastic modulus of the aggregate layer can be calculated from shear wave velocity measurements and the Poisson’s ratio of the material. The latter is estimated using shear and compressional wave velocities.

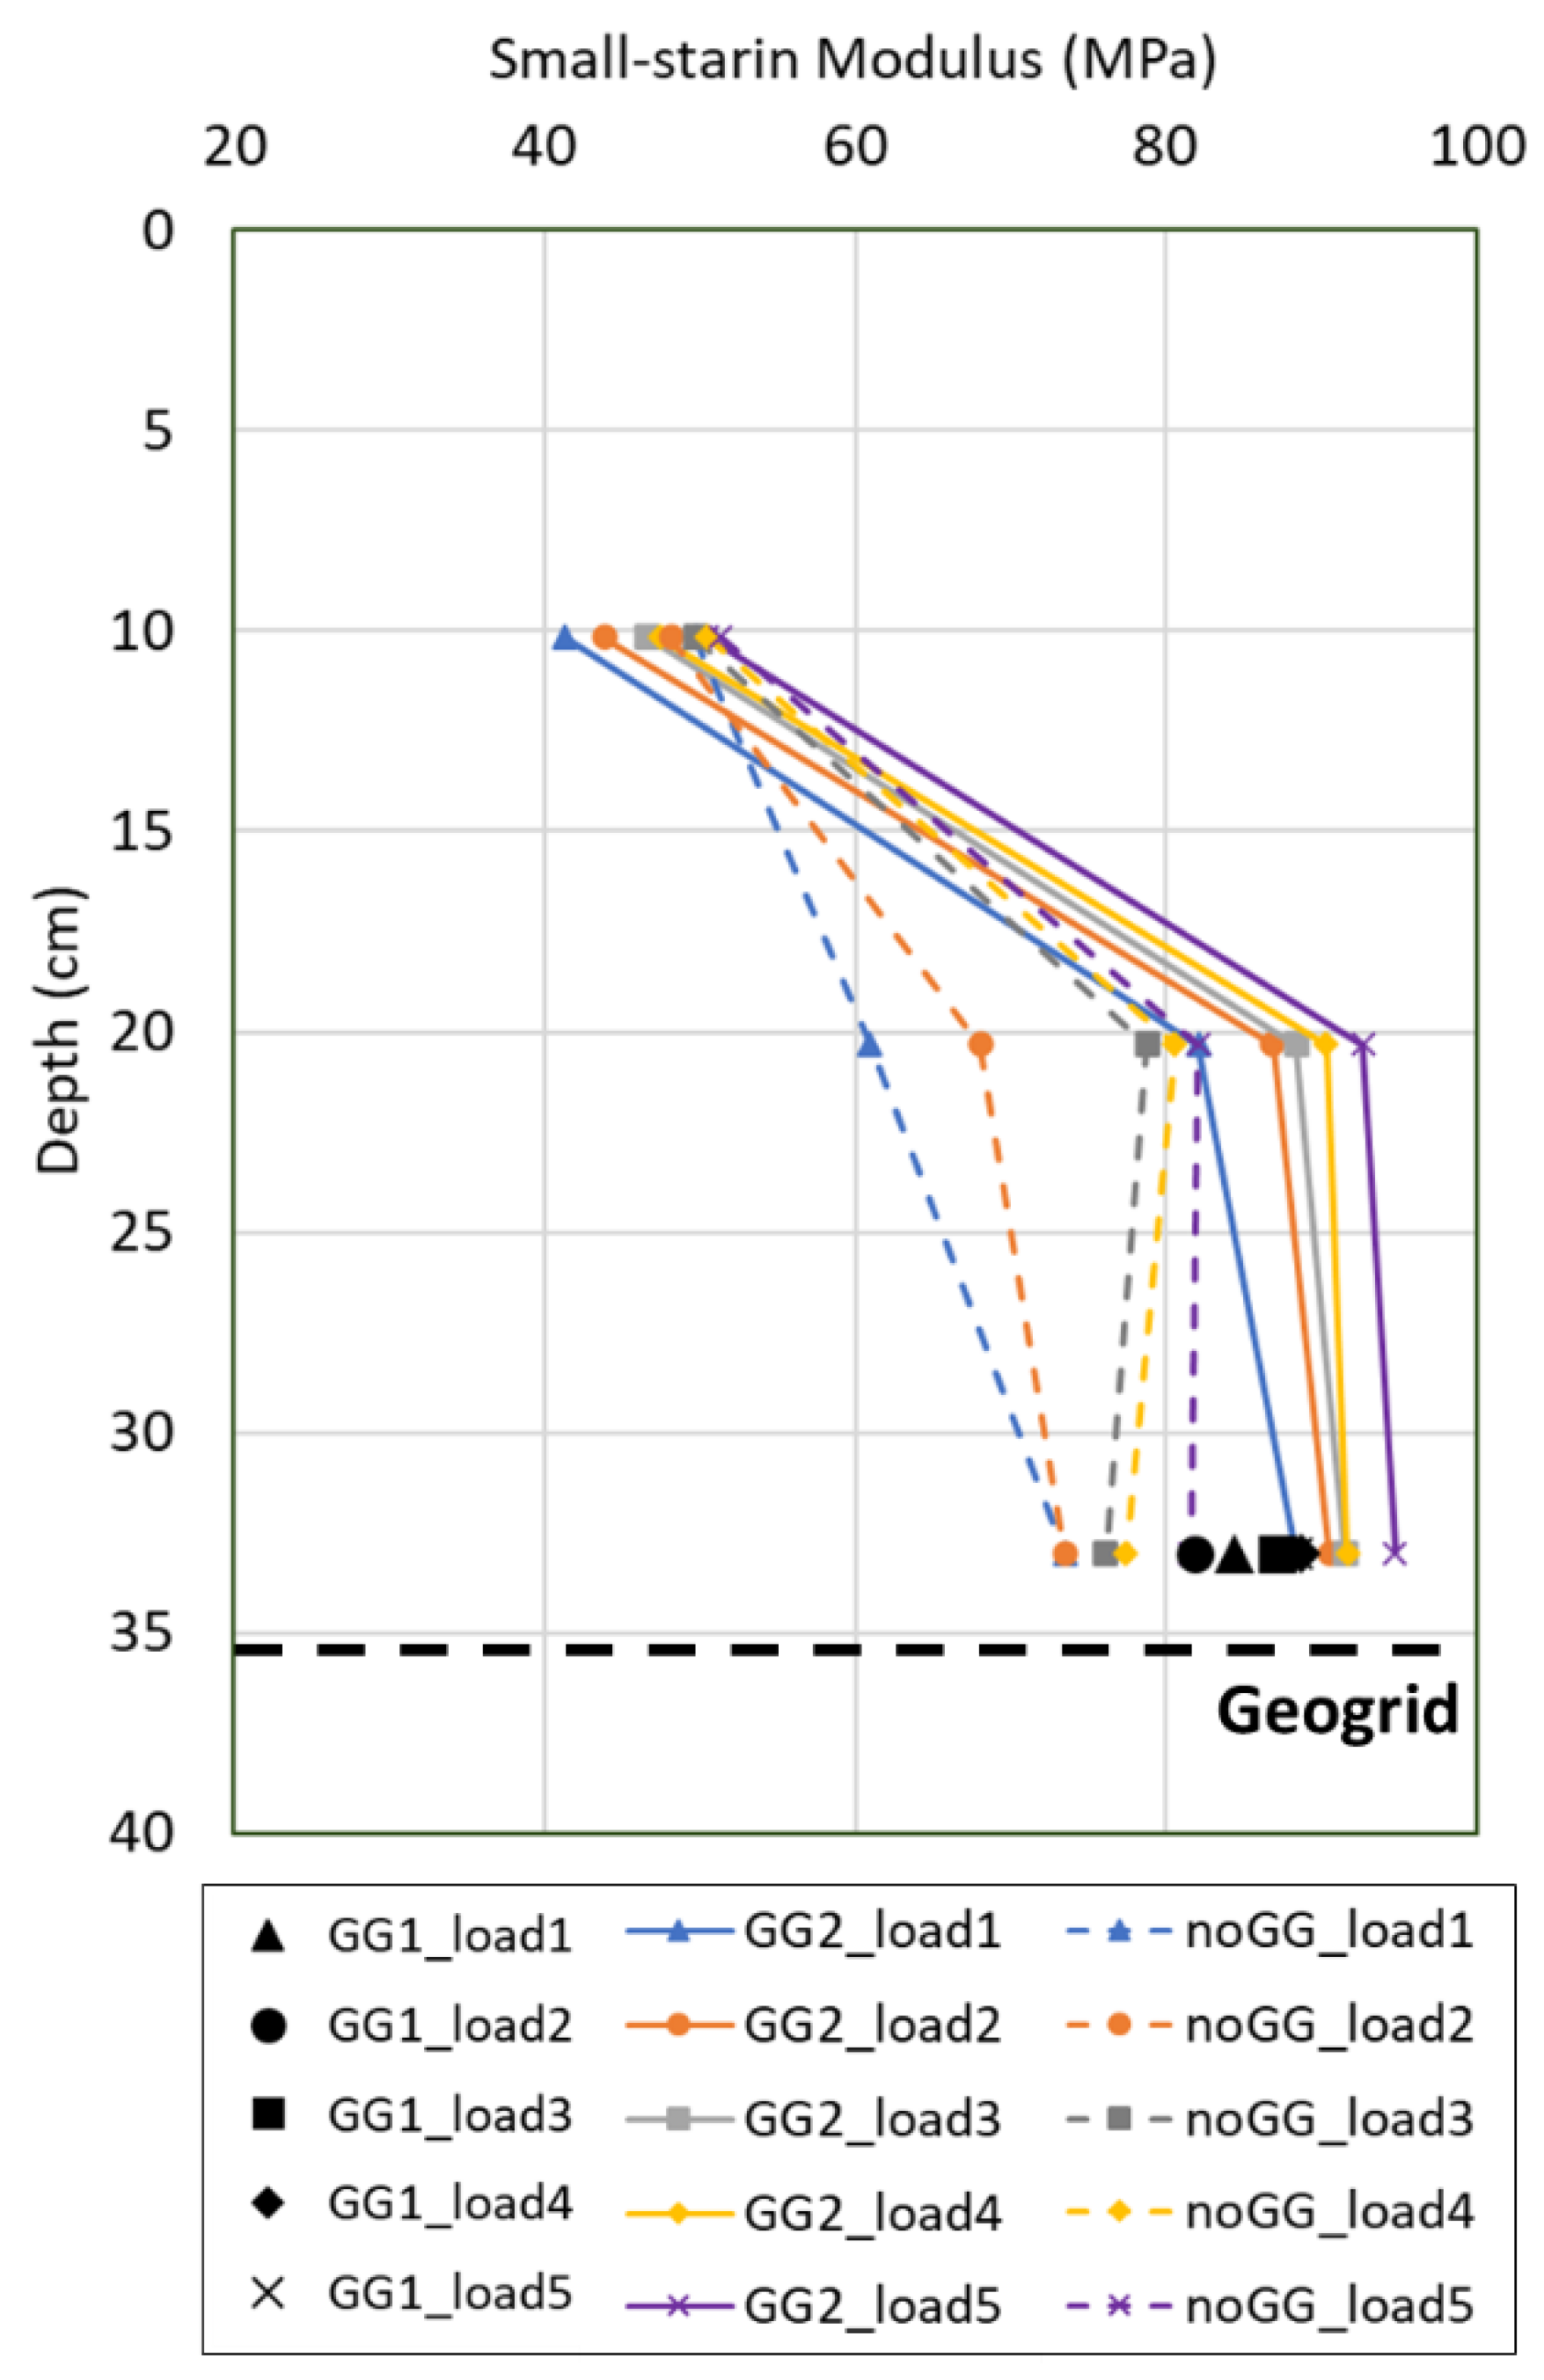
5.2. Vertical Stiffness Profile
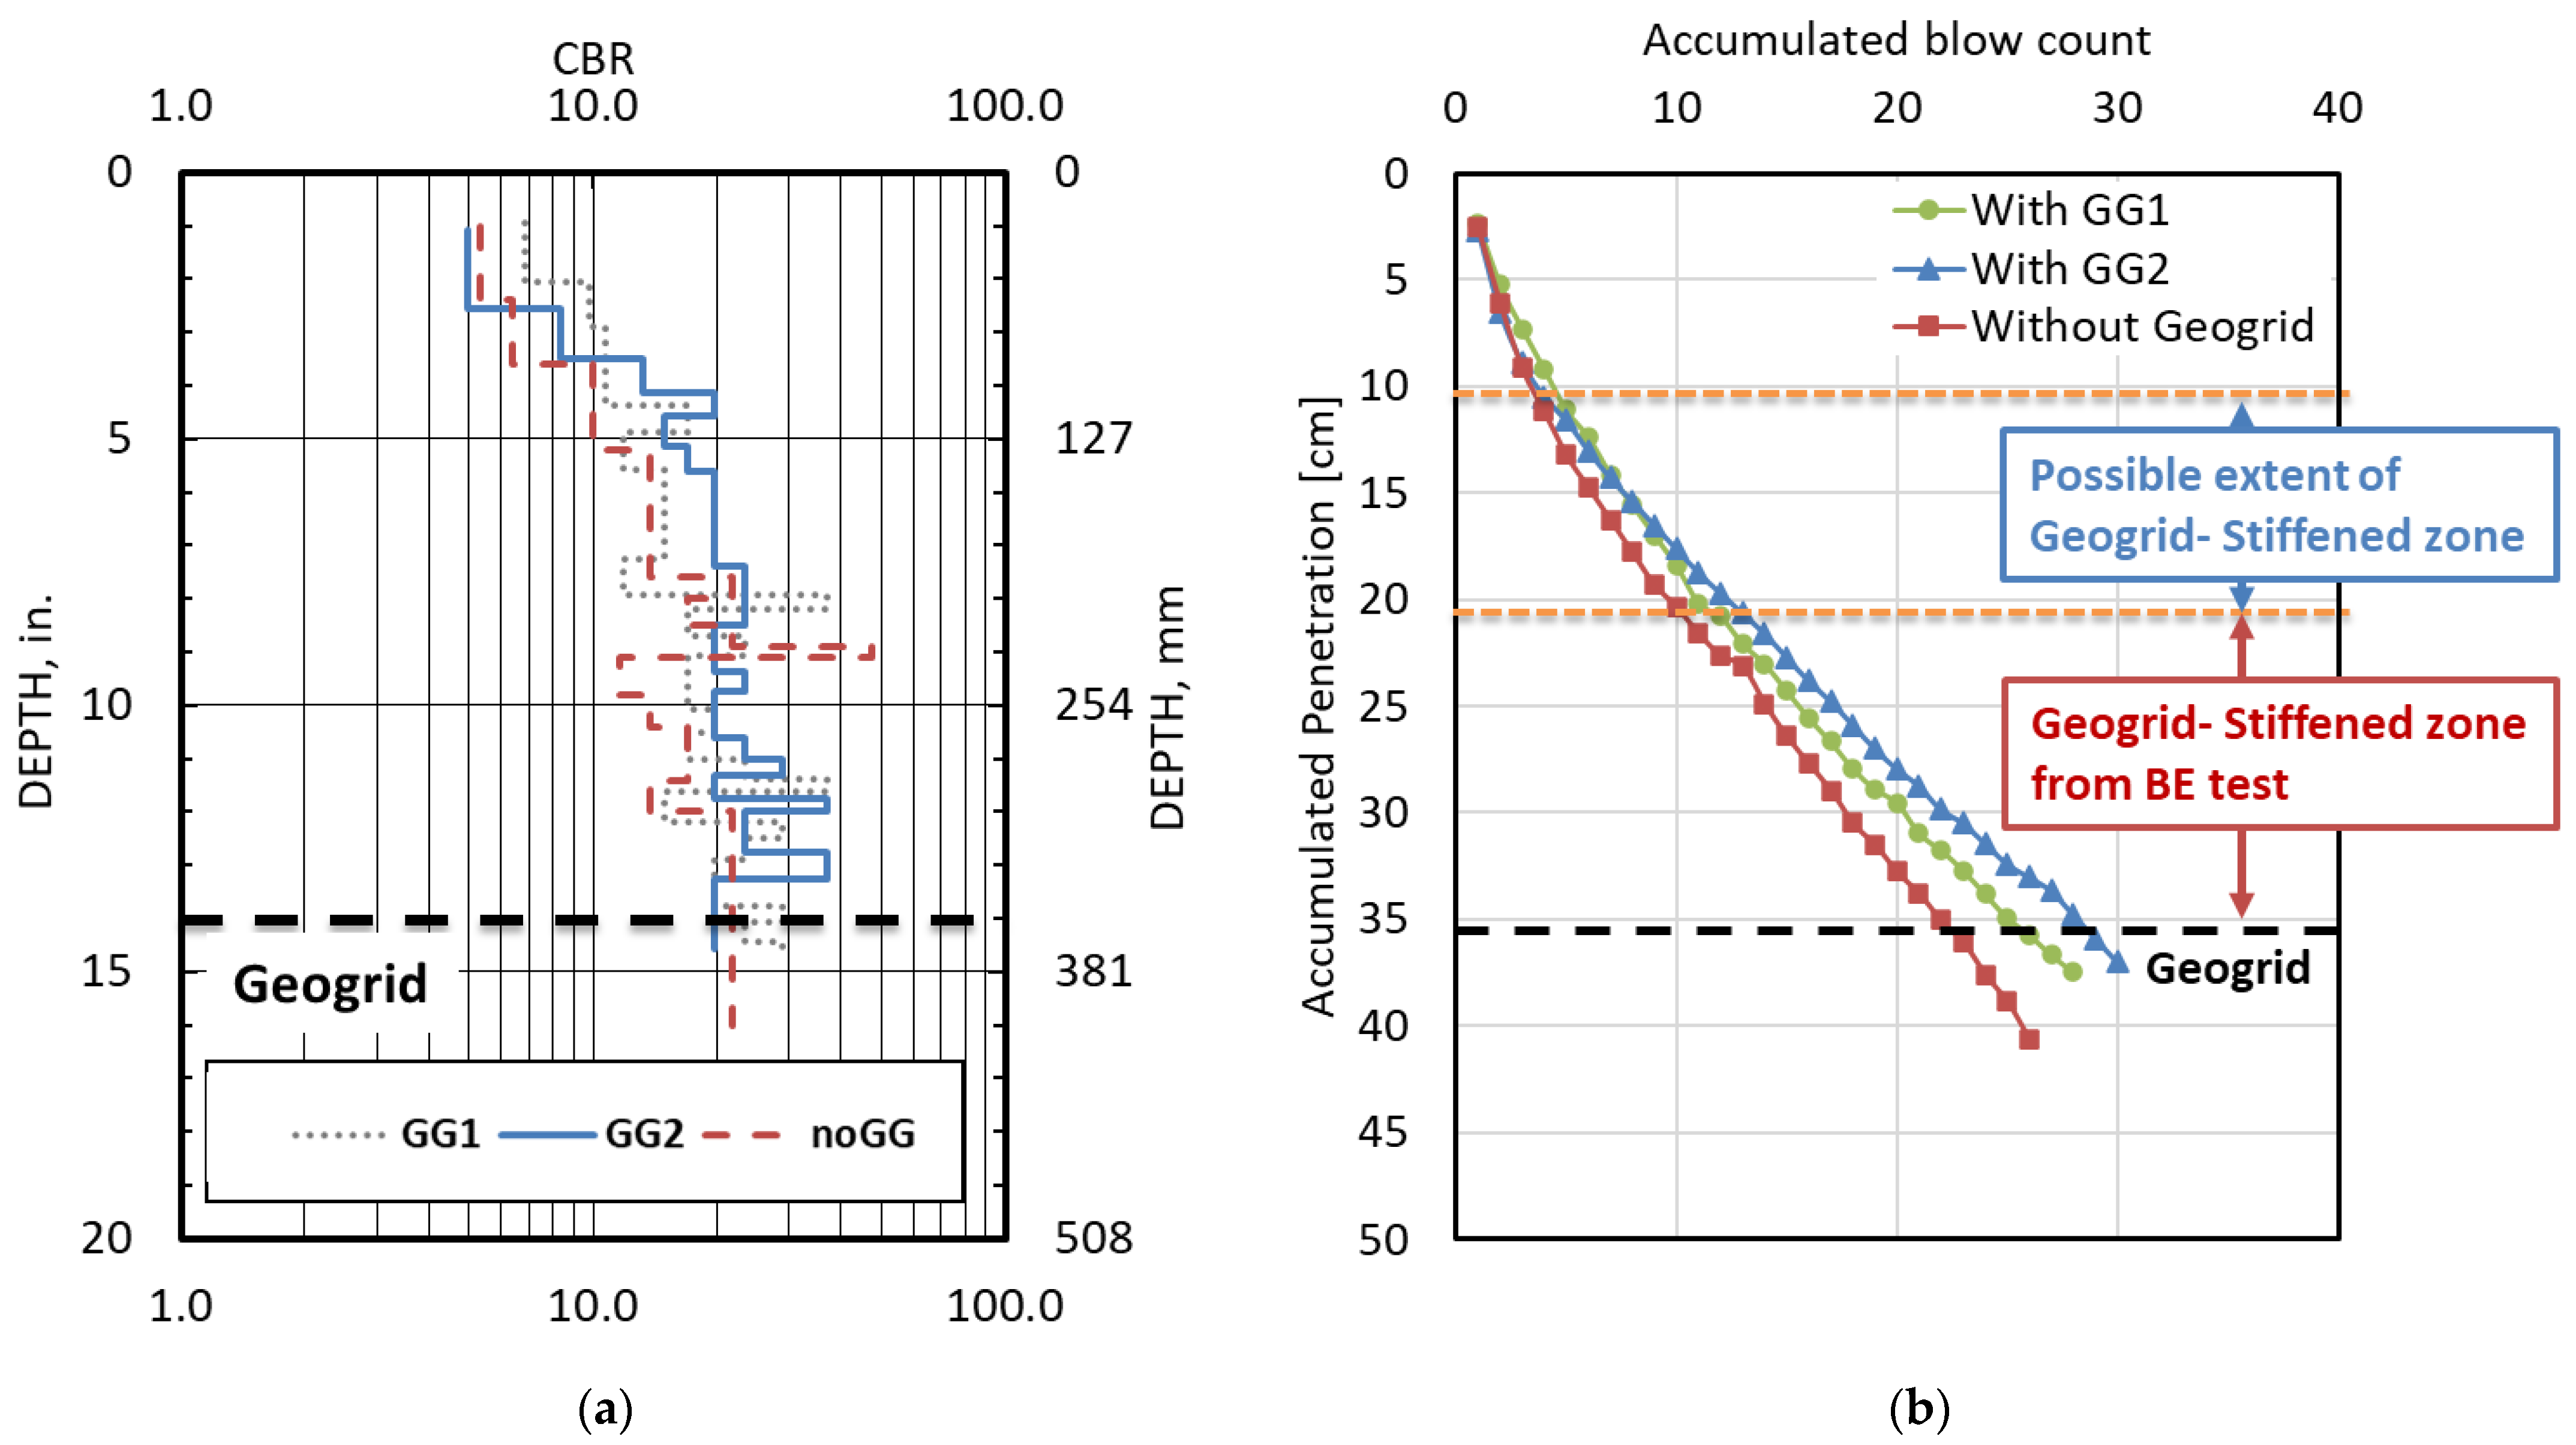
The BE modulus ( E B E ) of the unbound aggregate base material was measured at five stages of static loading. Figure 10 presents the modulus depth profiles of the specimens quantified via the BE field sensor measurements. The BE moduli with geogrid stabilization using GG2 are represented by solid lines, and BE moduli without any geogrid stabilization are shown with dashed lines. The BE moduli with geogrid stabilization using GG1 are shown as symbols only. Note that the tests with GG1 were performed with the BE sensor placed at the bottom location only.
The modulus of the unbound aggregate material is primarily influenced by the application of confining pressure [47,54]. Hence, the BE moduli for each test gradually increased with the higher magnitude of applied vertical stress, although the changes in elastic moduli with vertical stress were small, owing to the low magnitudes of the applied vertical stresses. Similarly, the BE modulus gradually increased with depth due to the higher confinement from the overburden, i.e., the weight of the upper layer.
A comparison between the BE moduli with and without geogrid stabilization clearly shows the geogrid-stiffening effect. The BE moduli measured from the BE sensors at the middle and the bottom locations with GG2 (i.e., Tests 1, 2, and 4) were higher than the moduli from the BE sensors with no geogrid (i.e., Tests 3 and 5), whereas the BE moduli of stabilized and unstabilized sections were in a similar range at the top location (i.e., Tests 6 and 7). At Load Stage 5, geogrid stabilization with GG2 resulted in 16.2% and 12.9% higher BE moduli at the bottom and middle locations, respectively. A large increase in BE modulus from the top to the middle location indicates the extent of the stiffened zone. On the other hand, there was no geogrid-stiffening effect at the top location. Thus, it can be concluded that the stiffened zone generated by geogrid stabilization extends more than 15.2 cm (6 in.) above the geogrid location, but the geogrid stabilization effect completely diminishes at a height of 25.4 cm (10 in.) above the geogrid. In terms of the geogrid aperture, the extent of the geogrid stiffened zone was between 8 and 13.3 times the geogrid’s aperture size.
The BE moduli measured from the BE sensors at the bottom location with GG1 and GG2 (i.e., tests 1 and 2) indicate that GG2 provides a higher stiffness enhancement. At Load Stage 5, the shear wave velocity measured at the bottom location increased by 16.2% with GG2 stabilization compared to the unstabilized section, whereas the velocity only increased by 8.3% with GG1 stabilization. In a previous study, Kang et al. estimated local stiffness enhancements with GG1-and GG2-stabilized aggregates from repeated load triaxial testing and concluded that GG2 stabilization led to a better geogrid-aggregate interlock, which is in accordance with the current test results [29].
Note that the percentage increase in modulus was significantly lower than the percentages achieved in previous studies, which reported modulus increases of up to 250% [28,29]. The difference in the stiffening effect can be attributed to three factors. First, the applied confining pressures and the compaction densities achieved in this study were remarkably lower (~84% of the MDD was achieved in the constructed aggregate lifts in the testbed). Further, an appropriate size ratio between the geogrid aperture and strike-through aggregate particles facilitates interlocking, thus enhancing the effectiveness of the geogrid stabilization [37,55,56,57,58,59]. The geogrid aperture size to D50 ratio (S/D50) ranging from 2 to 3 was reported to achieve the most effective modulus enhancement through interlocking [56,59]. The S/D50 ratio for GG1 and GG2 were 7.49 and 6.19, respectively, which are not in the effective range. Lastly, a gravel-to-sand (G/S) ratio of only 0.66 was reported for the aggregate material tested, while the triaxial specimens prepared for the previous studies had a G/S ratio close to 1.5, which was suggested by Xiao et al. for the densest aggregate packing [60]. These factors could have collaboratively led to the lower increase in the BE modulus compared to the previous studies.

5.3. DCP Testing

DCP tests were performed on the unbound aggregates as per the ASTM D6951 test method. Figure 11a shows the California Bearing Ratio (CBR) profiles from the surface to the geogrid location for Tests 1 to 3, estimated from the DCP tests. The DCP penetration rate was converted to CBR using the equation suggested by US Army Corps of Engineers [61]:
log C B R = 2.46 1.12 log ( D C P ( m m ) )
where DCP is the penetration rate (mm/blow). In vicinity of the geogrid at a depth of 35.6 cm (14 in.) from the surface, the CBR values of the geogrid-stabilized specimen are higher than those of the unstabilized specimens, showing consistency with the BE modulus results.
Figure 11b visualizes the number of DCP blows needed to penetrate through the unbound aggregate layer in the testbed. A higher blow count required in the geogrid-stabilized test section indicate that higher stiffnesses were achieved in the unbound aggregates of the geogrid-stabilized sections [12]. The number of DCP blows to reach the geogrid location was 29, 26, and 23 for the GG2-stabilized, GG1-stabilized, and non-stabilized sections, respectively. The higher blow count in the GG2-stabilized section indicates that the GG2 was more effective in enhancing aggregate stiffness, which is in accordance with the BE field-sensor test results. The horizontal dashed lines in Figure 11b represent the range of the potential upper bound of the geogrid-stiffened zone concluded from the BE field sensor tests, which is between the middle and the top sensor locations. Note that the slope of the accumulated blow count for the GG2-stabilized section increased in the geogrid-stiffened zone. Changes in slopes could indicate changes in strength properties. Therefore, the stiffness and strength profiles from the BE field-sensor tests and the DCP tests clearly indicate the existence of a geogrid-stiffened zone in the proximity of the geogrid, which becomes attenuated moving away from the geogrid.

5.4. LWD Testing

LWD tests were conducted on the surface of the unbound aggregate layer according to the ASTM E2835 test method after the shear wave velocity measurements. A portable LWD (ZORN ZFG 3.0), which has a 300 mm (11.8 in.)-diameter loading plate, was utilized. In addition to the center of the testbed, four additional LWD test locations were selected 61 cm (2 ft) apart from the center of the testbed to north, south, west, and east, respectively. Table 6 summarizes the average values of the resilient moduli, which were measured using the LWD device for each test. The highest and lowest moduli were observed from Test 5 and Test 3, respectively, and neither test section was geogrid stabilized. The average modulus value for the stabilized test sections and non-stabilized sections were 24.3 MPa and 24.2 MPa, respectively. Therefore, LWD test results could not detect the effects of geogrid stabilization. This could be attributed to the influence depth of LWD, which is 0.5 to 1.8 times the loading plate diameter, depending on testing conditions [62,63]. The thickness of the unbound aggregates above the geogrid was ~1.2 times the load-plate diameter, which might be thicker than the influence range of LWD. As shown in Figure 10 and Figure 11, the stiffening effect from the geogrid stabilization is a localized phenomenon in the vicinity of the geogrid. Considering the measurement of the LWD is more influenced by the layer near the surface, LWD test data do not properly reflect the local stiffness enhancement in the vicinity of the geogrid. Further, previous studies have reported no measurable benefits of geogrid stabilization observed from LWD modulus measurements [8,21].

6. Conclusions

The quantification of the local stiffness and the geogrid-stiffened zone in the vicinity of the geogrid in geogrid-stabilized aggregate systems can provide important inputs for the mechanistic–empirical designs of flexible pavements. In this study, bender element (BE) field sensors were utilized to measure the local stiffness properties of unbound aggregates near an installed geogrid through shear wave velocity measurements. The study used a large-scale laboratory testbed with dense-graded crushed aggregates placed over a geofoam layer. Five static surcharge loads were applied to provide different confinement levels. Two punched and drawn geogrids with different triangular aperture sizes were installed, one at a time, near the bottom of the aggregate layer. On the other hand, the control sections were compacted without a geogrid. At the five surcharge load levels applied on the surface, shear wave signals were collected using a BE field sensor installed at three different heights above the geogrid. In addition, lightweight deflectometer (LWD) and dynamic cone penetrometer (DCP) tests were performed on the constructed aggregate layers. Further, a repeated load triaxial test instrumented with shear and compressional wave transducers was conducted to determine the Poisson’s ratio of the aggregates for calculating the small-strain elastic modulus.
Using the BE field sensor in the large-scale testbed, researchers successfully determined the small-strain modulus and the extent of the stiffened zone in the vicinity of both geogrids. Based on the small-strain modulus profile throughout the thickness of the test section, the study found that the geogrid-stiffened zone with up to 16.2% stiffness improvement in dry dense-graded aggregates extended between 15.2 cm (6 in.) and 25.4 cm (10 in.) above the geogrid. The extent of the geogrid-stiffened zone was from 8 to 13.3 times the geogrid aperture size. The results showed that for this type of dense-graded aggregate material, the geogrid with a smaller aperture size was more effective for geogrid stabilization. This is consistent with previous research, which used triaxial testing of BE-instrumented aggregate specimens. Further, DCP test results revealed that the geogrid-stabilized sections needed up to 26% more blow counts to penetrate to the geogrid location, and the section with the smaller aperture geogrid was stiffer than the one with the larger aperture. However, the moduli obtained from LWD tests conducted on the surface were inconclusive for quantifying the effect of geogrid stabilization, showing comparable average LWD moduli for geogrid-stabilized sections and the control sections, likely due to the insufficient influence range for detecting local stiffening effect near geogrid.
In summary, this research study has shown that the BE field sensor and DCP tests are effective tools for determining the extent and magnitude of stiffening above the geogrid location, which is crucial in determining the mechanically stabilized layer profiles for mechanistic pavement analysis. The laboratory approach to quantify the geogrid stabilization effectiveness could eventually be adopted for in situ stiffness evaluation and the modulus input required for pavement design. Further investigation is recommended to evaluate the effectiveness of geogrid stabilization on different aggregate and geogrid types.

Author Contributions

Conceptualization, E.T., I.I.A.Q., J.S.T. and M.K.; methodology, E.T., I.I.A.Q., J.S.T. and M.K.; experimental investigation, M.K. and H.W.; data analysis, M.K., E.T., and I.I.A.Q.; writing—original draft preparation, M.K. and H.W.; writing—review and editing, E.T. and I.I.A.Q.; project administration, E.T.; funding acquisition, E.T. All authors have read and agreed to the published version of the manuscript.

Funding

This research was funded by the US Army Corps of Engineers under Contract No. W912HZ19P0047, entitled, “Development and Use of Bender Element and SmartRock Advanced Sensor Technologies for Field Instrumentation—ERDC SMART Runway Initiative (BAA 18-0104)”.

Institutional Review Board Statement

Not applicable.

Informed Consent Statement

Not applicable.

Data Availability Statement

The data presented in this study are available upon request to the corresponding author. The data are not publicly available due to the absence of public database established.

Acknowledgments

The authors would like to thank Greg Renshaw and Uthman Mohamed Ali, research engineers at Illinois Center for Transportation, and Marc A. Killion, research laboratory shop supervisor at the University of Illinois, for their help with laboratory testing.

Conflicts of Interest

The authors declare no conflict of interest. The funders had no role in the design of the study; in the collection, analyses, or interpretation of data; in the writing of the manuscript; or in the decision to publish the results.

References

  1. Giroud, J.P. An Assessment of the Use of Geogrids in Unpaved Roads and Unpaved Areas. In Proceedings of the Jubilee Symposium on Polymer Geogrid Reinforcement, London, UK, 8 September 2009. [Google Scholar]
  2. Giroud, J.P.; Han, J.; Tutumluer, E.; Dobie, M.J.D. The Use of Geosynthetics in Roads. Geosynth. Int. 2022, 30, 47–80. [Google Scholar] [CrossRef]
  3. Rowe, R.K.; Li, A.L. Geosynthetic-Reinforced Embankments over Soft Foundations. Geosynth. Int. 2005, 12, 50–85. [Google Scholar] [CrossRef]
  4. Zornberg, J.G.; Sitar, N.; Mitchell, J.K. Performance of Geosynthetic Reinforced Slopes at Failure. J. Geotech. Geoenviron. Eng. 1998, 124, 670–683. [Google Scholar] [CrossRef]
  5. van Eekelen, S.J.M.; Han, J. Geosynthetic-Reinforced Pile-Supported Embankments: State of the Art. Geosynth. Int. 2020, 27, 112–141. [Google Scholar] [CrossRef]
  6. Barker, W.R. Open-Graded Bases for Airfield Pavements; U.S. Army Corps of Engineers, Waterways Experiment Station: Vicksburg, MI, USA, 1987. [Google Scholar]
  7. Webster, S.L. Geogrid Reinforced Base Courses for Flexible Pavements for Light Aircraft: Test Section Construction, Behavior under Traffic, Laboratory Tests, and Design Criteria; U.S. Army Engineer Waterways Experiment Station: Vicksburg, MI, USA, 1992. [Google Scholar]
  8. Tingle, J.S.; Jersey, S.R. Full-Scale Evaluation of Geosynthetic-Reinforced Aggregate Roads. Transp. Res. Rec. 2009, 2116, 96–107. [Google Scholar] [CrossRef]
  9. Chen, Q.; Hanandeh, S.; Abu-Farsakh, M.; Mohammad, L. Performance Evaluation of Full-Scale Geosynthetic Reinforced Flexible Pavement. Geosynth. Int. 2018, 25, 26–36. [Google Scholar] [CrossRef]
  10. Norwood, G.J. Cyclic Plate Testing for Reinforced Airport Pavements—Phase I: Geogrid; U.S. Army Engineer Research and Development Center: Vicksburg, MI, USA, 2019. [Google Scholar]
  11. Cuelho, E.V.; Perkins, S.W. Geosynthetic Subgrade Stabilization—Field Testing and Design Method Calibration. Transp. Geotech. 2017, 10, 22–34. [Google Scholar] [CrossRef]
  12. Kwon, J.; Tutumluer, E. Geogrid Base Reinforcement with Aggregate Interlock and Modeling of Associated Stiffness Enhancement in Mechanistic Pavement Analysis. Transp. Res. Rec. 2009, 2116, 85–95. [Google Scholar] [CrossRef]
  13. Sugimoto, M.; Alagiyawanna, A.M.N. Pullout Behavior of Geogrid by Test and Numerical Analysis. J. Geotech. Geoenviron. Eng. 2003, 129, 361–371. [Google Scholar] [CrossRef]
  14. Moraci, N.; Recalcati, P. Factors Affecting the Pullout Behaviour of Extruded Geogrids Embedded in a Compacted Granular Soil. Geotext. Geomembr. 2006, 24, 220–242. [Google Scholar] [CrossRef]
  15. Peng, X.; Zornberg, J.G. Evaluation of Load Transfer in Geogrids for Base Stabilization Using Transparent Soil. Procedia Eng. 2017, 189, 307–314. [Google Scholar] [CrossRef]
  16. Teixeira, S.H.C.; Bueno, B.S.; Zornberg, J.G. Pullout Resistance of Individual Longitudinal and Transverse Geogrid Ribs. J. Geotech. Geoenviron. Eng. 2007, 133, 37–50. [Google Scholar] [CrossRef]
  17. Wilson-Fahmy, R.F.; Koerner, R.M.; Sansone, L.J. Experimental Behavior of Polymeric Geogrids in Pullout. J. Geotech. Eng. 1994, 120, 661–677. [Google Scholar] [CrossRef]
  18. Roodi, G.H.; Zornberg, J.G. Stiffness of Soil-Geosynthetic Composite under Small Displacements. II: Experimental Evaluation. J. Geotech. Geoenviron. Eng. 2017, 143, 04017076. [Google Scholar] [CrossRef]
  19. Zornberg, J.G.; Roodi, G.H.; Gupta, R. Stiffness of Soil–Geosynthetic Composite under Small Displacements: I. Model Development. J. Geotech. Geoenviron. Eng. 2017, 143, 04017075. [Google Scholar] [CrossRef]
  20. Kinney, T.C.; Stone, D.; Schuler, J. Using Geogrids for Base Reinforcement as Measured by Falling Weight Deflectometer in Full-Scale Laboratory Study. Transp. Res. Rec. 1998, 1611, 70–77. [Google Scholar] [CrossRef]
  21. Tang, X.; Stoffels, S.M.; Palomino, A.M. Resilient and Permanent Deformation Characteristics of Unbound Pavement Layers Modified by Geogrids. Transp. Res. Rec. 2013, 2369, 3–10. [Google Scholar] [CrossRef]
  22. Konietzky, H.; te Kamp, L.; Groeger, T.; Jenner, C. Use of DEM to Model the Interlocking Effect of Geogrids under Static and Cyclic Loading. In Numerical Modeling in Micromechanics via Particle Methods; Taylor & Francis Group: Abingdon, UK, 2004; pp. 3–12. [Google Scholar]
  23. McDowell, G.R.; Harireche, O.; Konietzky, H.; Brown, S.F.; Thom, N.H. Discrete Element Modelling of Geogrid-Reinforced Aggregates. Proc. Inst. Civ. Eng. Geotech. Eng. 2006, 159, 35–48. [Google Scholar] [CrossRef]
  24. Zhou, J.; Chen, J.-F.; Xue, J.-F.; Wang, J.-Q. Micro-Mechanism of the Interaction between Sand and Geogrid Transverse Ribs. Geosynth. Int. 2012, 19, 426–437. [Google Scholar] [CrossRef]
  25. Chen, C.; McDowell, G.R.; Thom, N.H. Investigating Geogrid-Reinforced Ballast: Experimental Pull-out Tests and Discrete Element Modelling. Soils Found. 2014, 54, 1–11. [Google Scholar] [CrossRef]
  26. Perkins, S.W.; Christopher, B.R.; Cuelho, E.L.; Eiksund, G.R.; Schwartz, C.S.; Svanø, G. A Mechanistic–Empirical Model for Base-Reinforced Flexible Pavements. Int. J. Pavement Eng. 2009, 10, 101–114. [Google Scholar] [CrossRef]
  27. Lee, J.-S.; Santamarina, J.C. Bender Elements: Performance and Signal Interpretation. J. Geotech. Geoenviron. Eng. 2005, 131, 1063–1070. [Google Scholar] [CrossRef]
  28. Byun, Y.-H.; Tutumluer, E.; Feng, B.; Kim, J.H.; Wayne, M.H. Horizontal Stiffness Evaluation of Geogrid-Stabilized Aggregate Using Shear Wave Transducers. Geotext. Geomembr. 2019, 47, 177–186. [Google Scholar] [CrossRef]
  29. Kang, M.; Kim, J.H.; Qamhia, I.I.A.; Tutumluer, E.; Wayne, M.H. Geogrid Stabilization of Unbound Aggregates Evaluated Through Bender Element Shear Wave Measurement in Repeated Load Triaxial Testing. Transp. Res. Rec. 2020, 2674, 113–125. [Google Scholar] [CrossRef]
  30. Kang, M.; Qamhia, I.I.A.; Tutumluer, E.; Hong, W.-T.; Tingle, J.S. Bender Element Field Sensor for the Measurement of Pavement Base and Subbase Stiffness Characteristics. Transp. Res. Rec. 2021, 2675, 394–407. [Google Scholar] [CrossRef]
  31. Kang, M.; Qamhia, I.I.A.; Tutumluer, E.; Garg, N.; Villafane, W. Airport Pavement Stiffness Monitoring and Assessment of Mechanical Stabilization Using Bender Element Field Sensor. Transp. Res. Rec. 2022, 2676, 542–553. [Google Scholar] [CrossRef]
  32. ASTM D2487-17; Standard Practice for Classification of Soils for Engineering Purposes (Unified Soil Classification System). ASTM: West Conshohocken, PA, USA, 2020.
  33. M145-91-UL; Standard Specification for Classification of Soils and Soil-Aggregate Mixtures for Highway Construction Purposes. AASHTO: Washington, DC, USA, 1995.
  34. ASTM C136-06; Standard Test Method for Sieve Analysis of Fine and Coarse Aggregates. ASTM: West Conshohocken, PA, USA, 2020.
  35. Illinois Department of Transportation. Standard Specifications for Road and Bridge Construction; Authority of the State of Illinois: Chicago, IL, USA, 2022. [Google Scholar]
  36. ASTM D1557-12(2021); Standard Test Methods for Laboratory Compaction Characteristics of Soil Using Modified Effort. ASTM: West Conshohocken, PA, USA,, 2021.
  37. Jewell, R.A.; Milligan, G.; Sarsby, R.W.; Dubois, D. Interaction between Soil and Geogrids. Polymer Grid Reinforcement: Proceedings of a Conference Sponsored by the Science and Engineering Research Council and Netlon Ltd. and Held in London 22–23 March 1984; The National Academies of Sciences, Engineering, and Medicine: Washington, DC, USA, 1985; ISBN 978-0-7277-0242-5. [Google Scholar]
  38. Tutumluer, E.; Seyhan, U. Laboratory Determination of Anisotropic Aggregate Resilient Moduli Using an Innovative Test Device. Transp. Res. Rec. 1999, 1687, 13–21. [Google Scholar] [CrossRef]
  39. Clayton, C.R.I. Stiffness at Small Strain: Research and Practice. Géotechnique 2011, 61, 5–37. [Google Scholar] [CrossRef]
  40. Jovičić, V.; Coop, M.R.; Simić, M. Objective Criteria for Determining Gmax from Bender Element Tests. Géotechnique 1996, 46, 357–362. [Google Scholar] [CrossRef]
  41. Viggiani, G.; Atkinson, J.H. Interpretation of Bender Element Tests. Géotechnique 1995, 45, 149–154. [Google Scholar] [CrossRef]
  42. Zou, Y.; Leo, C.J.; Small, J.C. Behaviour of EPS Geofoam as Flexible Pavement Subgrade Material in Model Tests. Geosynth. Int. 2000, 7, 1–22. [Google Scholar] [CrossRef]
  43. Siabil, S.M.A.G.; Tafreshi, S.N.M.; Dawson, A.R. Response of Pavement Foundations Incorporating Both Geocells and Expanded Polystyrene (EPS) Geofoam. Geotext. Geomembr. 2020, 48, 1–23. [Google Scholar] [CrossRef]
  44. Yoder, E.J.; Witczak, M.W. Principles of Pavement Design, 2nd ed.; Wiley: Hoboken, NJ, USA, 1991; ISBN 978-0-471-97780-3. [Google Scholar]
  45. AASHTO T 307-99; Standard Method of Test for Determining the Resilient Modulus of Soils and Aggregate Materials. AASHTO: Washington, DC, USA, 1999.
  46. Hula, A.; Maguire, A.; Bunker, A.; Rojeck, T.; Harrison, S. The 2020 EPA Automotive Trends Report: Greenhouse Gas Emissions, Fuel Economy, and Technology Since 1975; U.S. Environmental Protection Agency’s (EPA): Washington, DC, USA, 2021; p. 119. [Google Scholar]
  47. Hick, R.G.; Monismith, C.L. Factors Influencing the Resilient Response of Granular Materials. Highw. Res. Rec. 1971, 345, 15–31. [Google Scholar]
  48. Santamarina, J.C. Soils and Waves: [Particulate Materials Behavior, Characterization and Process Monitoring]; J. Wiley & Sons: Chichester, UK, 2001; ISBN 978-0-471-49058-6. [Google Scholar]
  49. Yokota, K.; Konno, M. Dynamic Poisson’s Ratio of Soil. In Proceedings of the Seventh World Conference on Earthquake Engineering, Istanbul, Turkey, 8–13 September 1980; Volume 3. [Google Scholar]
  50. Ohsaki, Y.; Iwasaki, R. On Dynamic Shear Moduli and Poisson’s Ratios of Soil Deposits. Soils Found. 1973, 13, 61–73. [Google Scholar] [CrossRef]
  51. Payan, M.; Senetakis, K.; Khoshghalb, A.; Khalili, N. Effect of Gradation and Particle Shape on Small-Strain Young’s Modulus and Poisson’s Ratio of Sands. Int. J. Geomech. 2017, 17, 04016120. [Google Scholar] [CrossRef]
  52. Payan, M.; Khoshini, M.; Jamshidi Chenari, R. Elastic Dynamic Young’s Modulus and Poisson’s Ratio of Sand–Silt Mixtures. J. Mater. Civ. Eng. 2020, 32, 04019314. [Google Scholar] [CrossRef]
  53. He, H.; Senetakis, K. A Study of Wave Velocities and Poisson Ratio of Recycled Concrete Aggregate. Soils Found. 2016, 56, 593–607. [Google Scholar] [CrossRef]
  54. Thompson, M.R.; Smith, K.L. Repeated Triaxial Characterization of Granular Bases. Transp. Res. Rec. 1990, 1278, 7–17. [Google Scholar]
  55. Brown, S.F.; Kwan, J.; Thom, N.H. Identifying the Key Parameters That Influence Geogrid Reinforcement of Railway Ballast. Geotext. Geomembr. 2007, 25, 326–335. [Google Scholar] [CrossRef]
  56. Mulabdic, M.; Minažek, K.; Kaluđer, J. Geogrids—What Is Important. In Proceedings of the International Conference on Road and Rail Infrastructure CETRA, Zadar, Croatia, 17–19 May 2018; p. 221. [Google Scholar]
  57. Holtz, R.D.; Christopher, B.R.; Berg, R.R. Geosynthetic Design and Construction Guidelines. Participant Notebook. NHI Course No. 13213 (Revised April 1998); National Highway Institute: McLean, VA, USA, 1998; p. 460. [Google Scholar]
  58. Tavakoli Mehrjardi, G.; Khazaei, M. Scale Effect on the Behaviour of Geogrid-Reinforced Soil under Repeated Loads. Geotext. Geomembr. 2017, 45, 603–615. [Google Scholar] [CrossRef]
  59. Kang, M.; Wang, H.; Qamhia, I.I.A.; Erol, T.; Wayne, M.H. Local Stiffness Enhancement by Multi-Axial Geogrid Stabilization Evaluated through Shear Wave Measurement. In Proceedings of the Geosynthetics Conference 2023, Kansas City, MO, USA, 5–8 February 2023; pp. 336–347. [Google Scholar]
  60. Xiao, Y.; Tutumluer, E.; Qian, Y.; Siekmeier, J.A. Gradation Effects Influencing Mechanical Properties of Aggregate Base–Granular Subbase Materials in Minnesota. Transp. Res. Rec. 2012, 2267, 14–26. [Google Scholar] [CrossRef]
  61. U.S. Army Corps of Engineers. UFC (Unified Facilities Criteria) Airfield Pavement Design; US Dept. of Defense: Washington, DC, USA, 2001. [Google Scholar]
  62. Mooney, M.A.; Miller, P.K. Analysis of Lightweight Deflectometer Test Based on In Situ Stress and Strain Response. J. Geotech. Geoenviron. Eng. 2009, 135, 199–208. [Google Scholar] [CrossRef]
  63. Senseney, C.T.; Mooney, M.A. Characterization of Two-Layer Soil System Using a Lightweight Deflectometer with Radial Sensors. Transp. Res. Rec. 2010, 2186, 21–28. [Google Scholar] [CrossRef]
Figure 1. Physical properties of the selected aggregate material: (a) Grain size distribution plotted with IDOT CA06 gradation band [35]; and (b) Moisture–density relationship.
Applsci 14 00352 g001
Figure 2. Schematic drawing of repeated load triaxial test setup.
Applsci 14 00352 g002
Figure 3. Schematic of a bender element field sensor embedded in the base layer, along with the shear wave measurement system.
Applsci 14 00352 g003
Figure 4. Large-scale testbed: (a) Schematic drawing of the test setup; (b) BE field sensor installed at the bottom location in the testbed.
Applsci 14 00352 g004
Figure 5. LWD and DCP tests: (a) LWD device on the testbed surface of the testbed; and (b) Locations where DCP and LWD tests were conducted.
Applsci 14 00352 g005
Figure 6. Resilient moduli determined at each of the 15 stress states illustrated along with the regression curve using the k-θ model.
Applsci 14 00352 g006
Figure 7. Recorded elastic waves: (a) Shear waves from Stages 1 to 15; and (b) Compressional waves from Stages 4 to 15.
Applsci 14 00352 g007
Figure 8. Shear wave velocity graphed with bulk stress as determined at the 15 stress states.
Applsci 14 00352 g008
Figure 9. Relationship between Poisson’s ratio and applied bulk stress.
Applsci 14 00352 g009
Figure 10. Vertical stiffness profiles of samples with and without geogrid stabilization.
Applsci 14 00352 g010
Figure 11. DCP test results: (a) CBR profiles from DCP tests; and (b) Accumulated DCP blow counts and the geogrid-stiffened zone.
Applsci 14 00352 g011
Table 1. Properties of the crushed dolomite aggregate material.
NMASD50CuCcG/S
12.5 mm (0.5 in.)3.08 mm (0.12 in.)28.363.460.66
Table 2. Properties of GG1 and GG2 geogrids.
Index PropertyGeogrid #1 (GG1)Geogrid #2 (GG2)
Long. 1Diag. 1Trans. 1Long. 1Diag. 1Trans. 1
Rib pitch (mm)4040 3333
Mid-rib depth (mm) 2 1.31.2 1.61.2
Mid-rib width (mm) 2 0.91.2 0.40.7
Diameter of largest inscribed circle (mm)23.119.1
Schematic drawing of the aperture shape and the size of inscribed circle
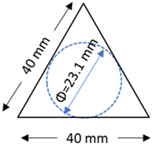
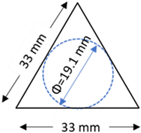
Applsci 14 00352 i001Applsci 14 00352 i002
1 Long., diag., and trans. indicate longitudinal, diagonal, and transverse direction, respectively. 2 Mid-rib depth and width indicate the depth and width of the rib at the middle point between junctions.
Table 3. Summary of sensor locations and the test variables.
Test No.Sensor LocationDistance from Geogrid (cm)Geogrid Placement
1Bottom2.5GG1
2Bottom2.5GG2
3Bottom2.5No Geogrid
4Middle15.2GG2
5Middle15.2No Geogrid
6Top25.4GG2
7Top25.4No Geogrid
Table 4. AASHTO T 307 test procedure.
No.Confining Pressure
[kPa]
Deviator Stress
[kPa]
Bulk Stress
[kPa]
No. of Load Cycles
Cond.103.4103.4413.61000
120.720.782.8100
220.741.4103.5100
320.762.1124.2100
434.534.5138100
534.568.9172.4100
634.5103.4206.9100
768.968.9275.6100
868.9137.9344.6100
968.9206.8413.5100
10103.468.9379.1100
11103.4103.4413.6100
12103.4206.8517100
13137.9103.4517.1100
14137.9137.9551.6100
15137.9275.8689.5100
Table 5. Loading sequence for the static loading and unloading tests.
Load No.Static Load, kN (lb.)Static Vertical Stress, kPa (psi)
10.00 (0)0.00 (0.00)
20.67 (151)1.97 (0.29)
31.32 (297)3.89 (0.56)
41.94 (436)5.72 (0.83)
52.85 (641)8.41 (1.22)
Table 6. Surface modulus results from LWD tests.
Test No.Surface Modulus (MPa)Geogrid Placement
226.2GG2-stabilized
318.2No geogrid
423.4GG2-stabilized
527.3No geogrid
623.3GG2-stabilized
727.1No geogrid
Disclaimer/Publisher’s Note: The statements, opinions and data contained in all publications are solely those of the individual author(s) and contributor(s) and not of MDPI and/or the editor(s). MDPI and/or the editor(s) disclaim responsibility for any injury to people or property resulting from any ideas, methods, instructions or products referred to in the content.

