Article

The Impact of Systemic Simvastatin on Bone Remodeling Following Rapid Maxillary Expansion: An In Vivo Study

by
Jhonathan Raphaell Barros Nascimento
1,
Isabela Lima
2,
Suelen Cristina Sartoretto
3,
Adriana Terezinha Neves Novellino Alves
4,
Caio Márcio Sorrentino de Freitas Farias dos Santos
5,
Ricardo Tadeu Lopes
5,
Kayvon Javid
6,
Ilia Deylami
6,
Carlos Fernando Mourão
7,8,*,
Monica Diuana Calasans-Maia
9 and
Jose de Albuquerque Calasans-Maia
10
1
Graduate Program, Dentistry School, Fluminense Federal University, Niteroi 24020-140, Rio de Janeiro, Brazil
2
Graduate Program, Dentistry School, Rio de Janeiro Federal University, Rio de Janeiro 21941-617, Brazil
3
Oral Surgery Department, Dentistry School, Fluminense Federal University, Niteroi 24020-140, Rio de Janeiro, Brazil
4
Oral Diagnosis Department, Dentistry School, Fluminense Federal University, Niteroi 24020-140, Rio de Janeiro, Brazil
5
Department of Nuclear Engineering, Rio de Janeiro Federal University, Rio de Janeiro 21941-914, Brazil
6
South Bay Dental Institute, Los Angeles, CA 90731, USA
7
Department of Periodontology, Tufts University School of Dental Medicine, Boston, MA 02111, USA
8
Post-Graduation Program, Department of Oral Maxillofacial Surgery and Periodontology, School of Dentistry of Ribeirão Preto, University São Paulo, Ribeirão Preto 14040-904, São Paulo, Brazil
9
Laboratory for Clinical Research in Dentistry, Dentistry School, Fluminense Federal University, Niteroi 24020-140, Rio de Janeiro, Brazil
10
Orthodontic Department, Dentistry School, Fluminense Federal University, Niteroi 24020-140, Rio de Janeiro, Brazil
*
Author to whom correspondence should be addressed.
Appl. Sci. 2024, 14(1), 430; https://doi.org/10.3390/app14010430
Submission received: 14 December 2023 / Revised: 30 December 2023 / Accepted: 31 December 2023 / Published: 3 January 2024

Abstract

:
A midpalatal suture contention after rapid maxillary expansion (RME) is a major orthodontic challenge. The objective of this study is to evaluate the effect of systemic simvastatin on suture bone remodeling after disjunction. For that, 15 Wistar rats were used. In 10, orthodontic appliances were installed and activated for 5 days for RME. These animals were randomly divided into two groups: control (CT, n = 5) and simvastatin (SVT, n = 5). Also, animals without intervention (HG, n = 5) were used. In the SVT and CT groups, 5 mg/kg of simvastatin and distilled water were administered by gavage, respectively, for 20 consecutive days. Then, the animals were euthanized and scanned in micro-computed tomography (µCT). The images were analyzed through pixel linear measurement at four different points (P1, P2, P3 and P4), in the intra-incisor distance (DI) and in the suture distance (SD). Microtomographic parameters, such as cortical bone area (Ct.Ar), cortical area fraction (Ct.Ar/Tt.Ar), and cortical thickness (Ct.Th), were obtained. Also, bone volume fraction (BV/TV) and empty space (EV) were extracted. Then, histological slides were prepared for descriptive and histomorphometric analysis. There was a statistically significant difference in the linear measurements, microtomographic parameters, and histomorphometric results between the experimental groups. In conclusion, simvastatin demonstrated an osteoinductive and antiresorptive effect in the palatine suture region after RME.

1. Introduction

The orthodontic technique known as rapid maxillary expansion (RME) is often used to correct transverse deficiencies in the maxilla resulting from underdevelopment during the patient’s growth period. Due to the close association between the hard palate and the nasal cavity, maxillary expansion also results in the widening of the nasal upper airways [1,2]. This technique promotes the widening of the palate, flattening of the palatal arch with inferior displacement of the maxilla and exerts influence on mandibular alignment. Therefore, this technique is the treatment of choice for correcting maxillary constriction [3]. A decisive point for a good prognosis point is achieving skeletal expansion stabilization, being the containment phase, which is as important as the activation phase [4], of which studies demonstrate the need for the palatal expanders to remain in place for at least six months [5,6]. This long period of retention, together with the lack of evidence about the treatment relapse process, led researchers to investigate and try to accelerate the bone regeneration process in the midpalatal suture after treatment.
In vivo studies of locally and systemically administered bioactive molecules have been indicated as potential accelerators of the bone regeneration process, such as melatonin [7], resveratrol [8] and simvastatin [9]. Statins, which include simvastatin, have shown antioxidant [10] and anti-inflammatory activity [11,12], acting on bone turnover when administered systemically, inhibiting the bone resorption activity of osteoclasts and stimulating osteoblasts [13].
Statins are a group of lipid-lowering drugs widely used to prevent cardiovascular events; they act on cholesterol-lowering activity and have pleiotropic effects, including bone stimulation, promotion of vasculogenesis and immunomodulation of anti-inflammatory effects [14]. Several studies have indicated that statins act on bone remodeling and the formation of bone tissue, being an osteoinductive substance [15].
Molecules important in the regulation of osteoclastogenesis, such as the Receptor Activator of Nuclear Factor Kappa B (RANK), RANK System Ligand (RANKL) and Osteoprotegerin (OPG), play an essential role in inducing bone remodeling. RANKL acts as a regulator in the formation of osteoclasts, triggering the activation of several hormones and cytokines that promote their osteoreceptive effect [16]. In osteoblastic cells and in the periodontal ligament, RANKL is expressed, exerting its effects after binding to RANK, a receptor present on the cell surface of the osteoclastic lineage, acting as a crucial differentiating factor [17]. OPG, a secreted tumor necrosis factor, functions as a receptor for the TNF factor produced by osteoblastic cells, competing with RANK for binding to RANKL [18].
Statins act by inhibiting the mevalonate pathway, a precursor for the formation of steroids and steroid isoprenoids; they also inhibit the activity of 3-hydroxy-3-methylglutaryl-coenzyme A reductase (HMG-CoA), reducing the synthesis of cholesterol, which is required for the conversion of HMG-CoA to mevalonate. Thus, by acting to reduce the synthesis of mevalonate, they interfere with the proliferation and activities of cells [15]. One study demonstrated that statins stimulate bone formation associated with increased expression of the BMP-2 gene in bone cells and that they act as markers in enhanced gene expression for vascular endothelial growth factor (VEGF) [19]. Furthermore, several studies demonstrate that during the containment process, cells of the median palatal suture express RANK, RANKL and OPG under physiological aspects and conditions of mechanical stress; thus, these factors regulate the function of osteoclasts and play an important role in the formation of bone. Thus, it was demonstrated that the osteoclastogenesis process is stimulated during the beginning of the healing periods after the REM procedure [20].
Histological description and histomorphometry are the most used methods for quantitative and qualitative analysis of studies that investigate bone structures [21,22]. However, they have been limited to two-dimensional analysis.
The micro-computed tomography (µCT), due to its high resolution, is the most reasonable choice as a non-destructive resource for bone morphology analysis when compared with conventional techniques [23]. After acquiring the images, a more refined investigation is possible through microtomographic parameters, such as the bone volume fraction (BV/TV), empty space (EV) of the suture, cortical bone area (Ct.Ar), cortical bone area fraction (Ct.Ar/Tt.Ar) and cortical thickness (Ct.Th).
Studies investigating the effect of other drugs, such as strontium ranelate, after RME have already been widely explored. However, so far, the literature regarding in vivo studies that evaluate the effect of simvastatin on bone formation after this procedure is limited. Therefore, it is important to explore this gap in the literature. Through a non-destructive technique, such as µCT, it is possible to obtain an analysis of linear measurements of the expanded suture and microtomographic parameters of cortical bone, which quantitatively and qualitatively describe this structure. In addition, a histomorphometric analysis in the region of the palatal suture is preponderant in in vivo studies.

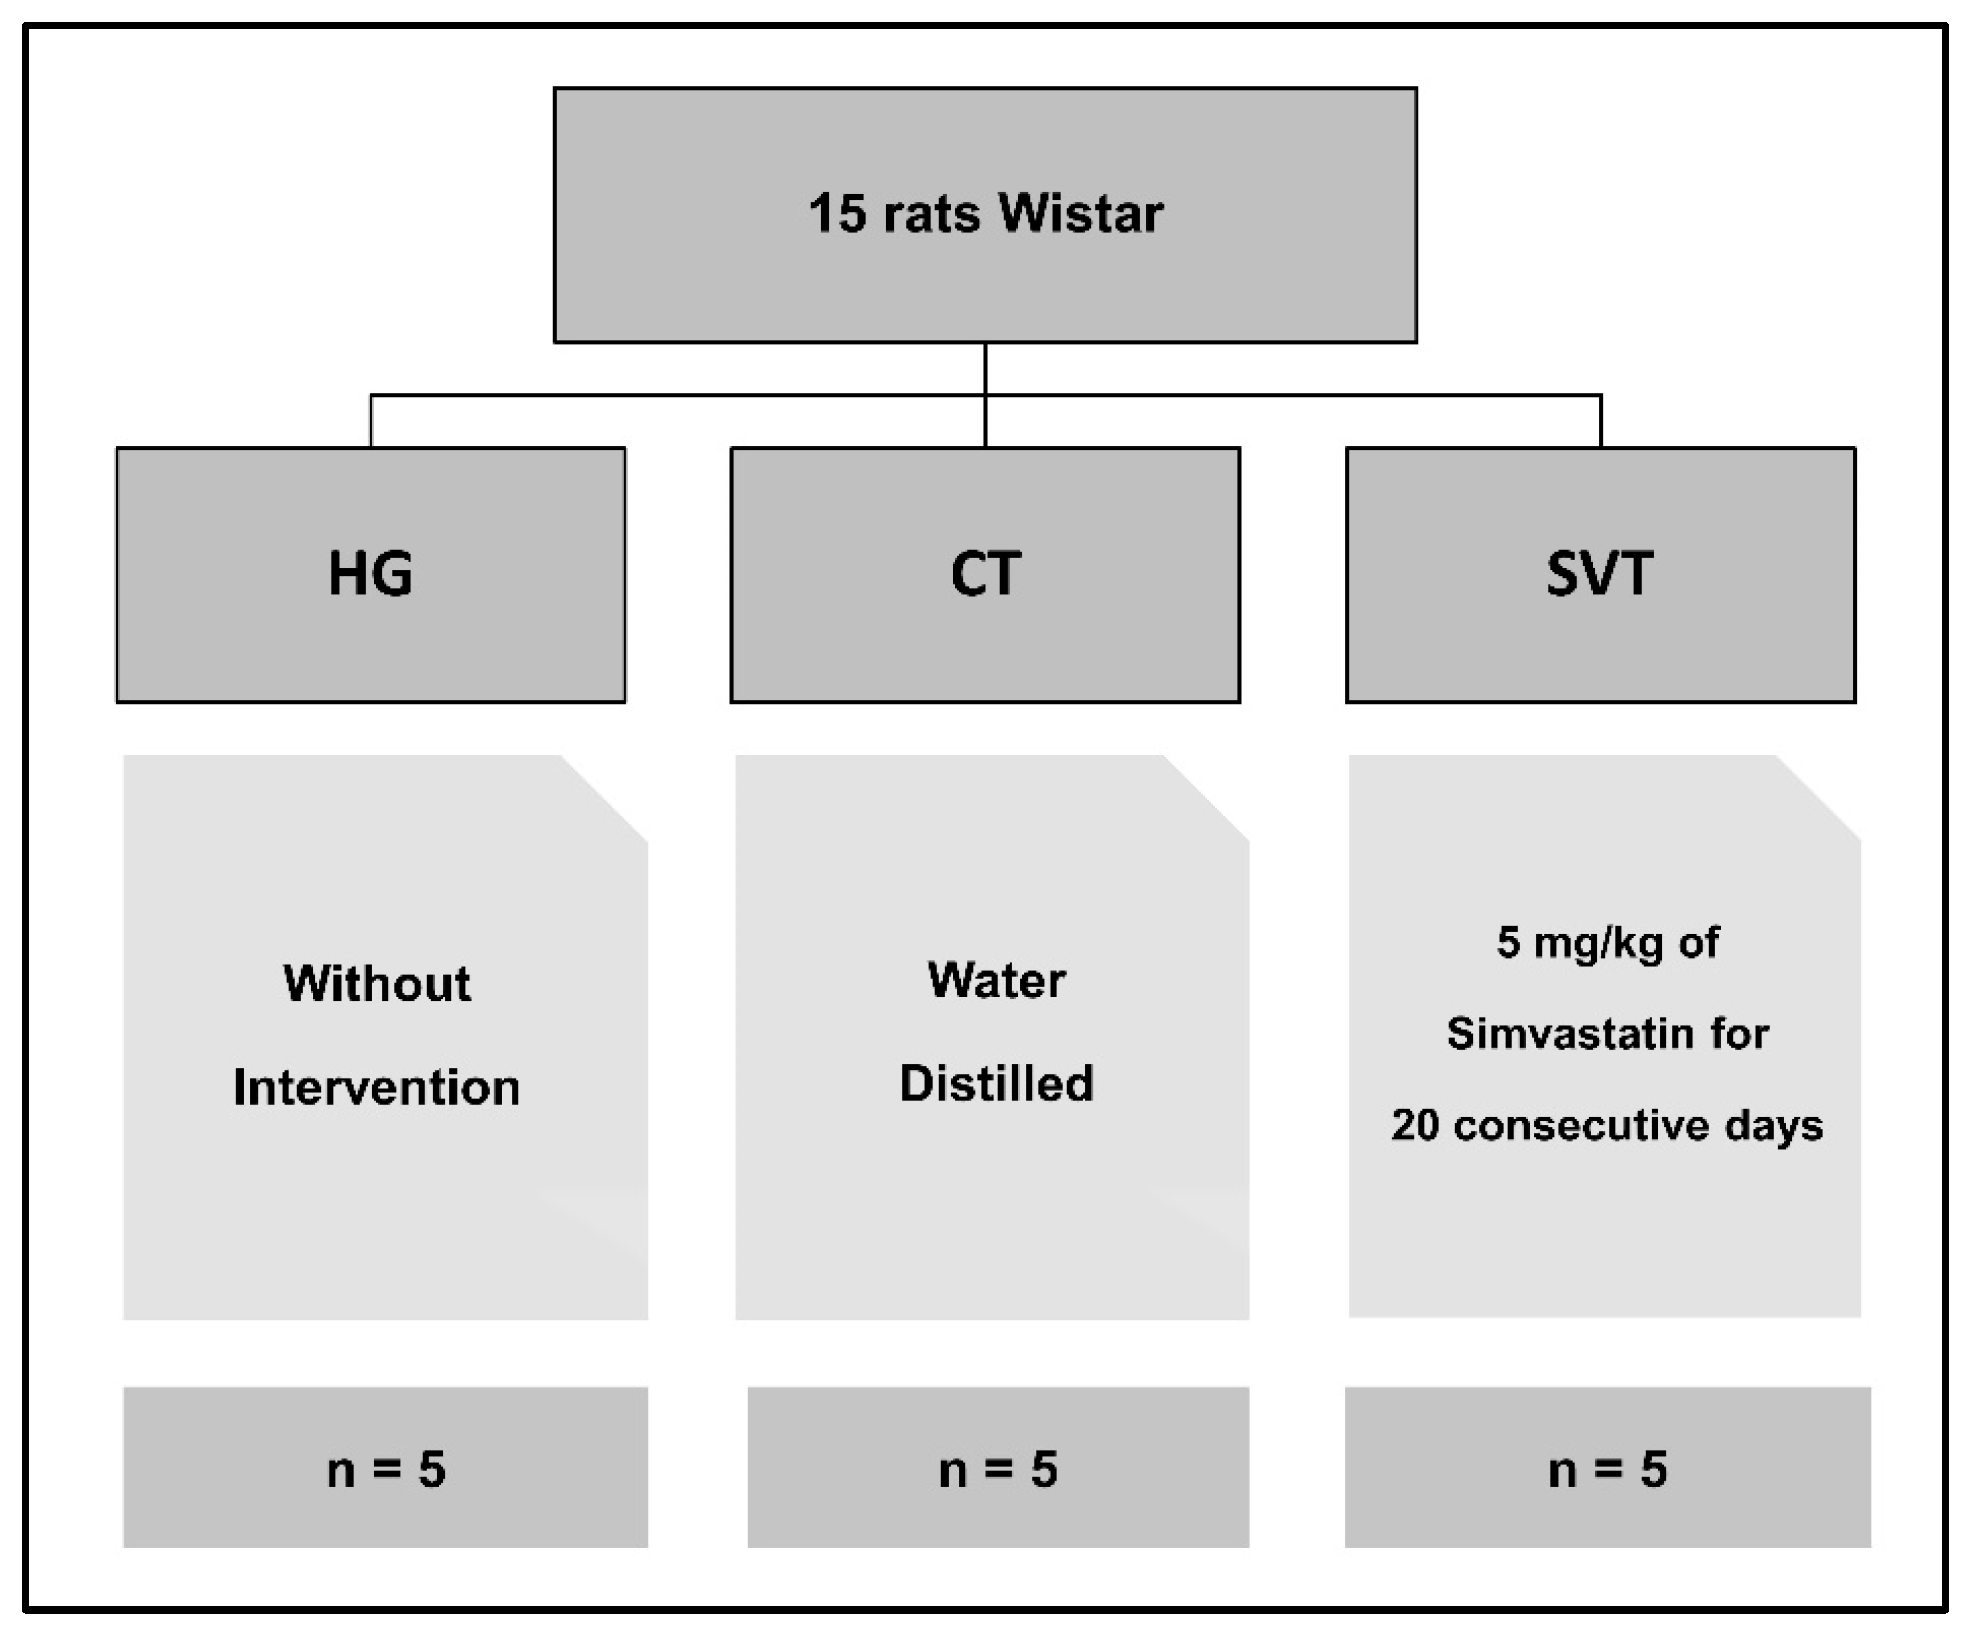
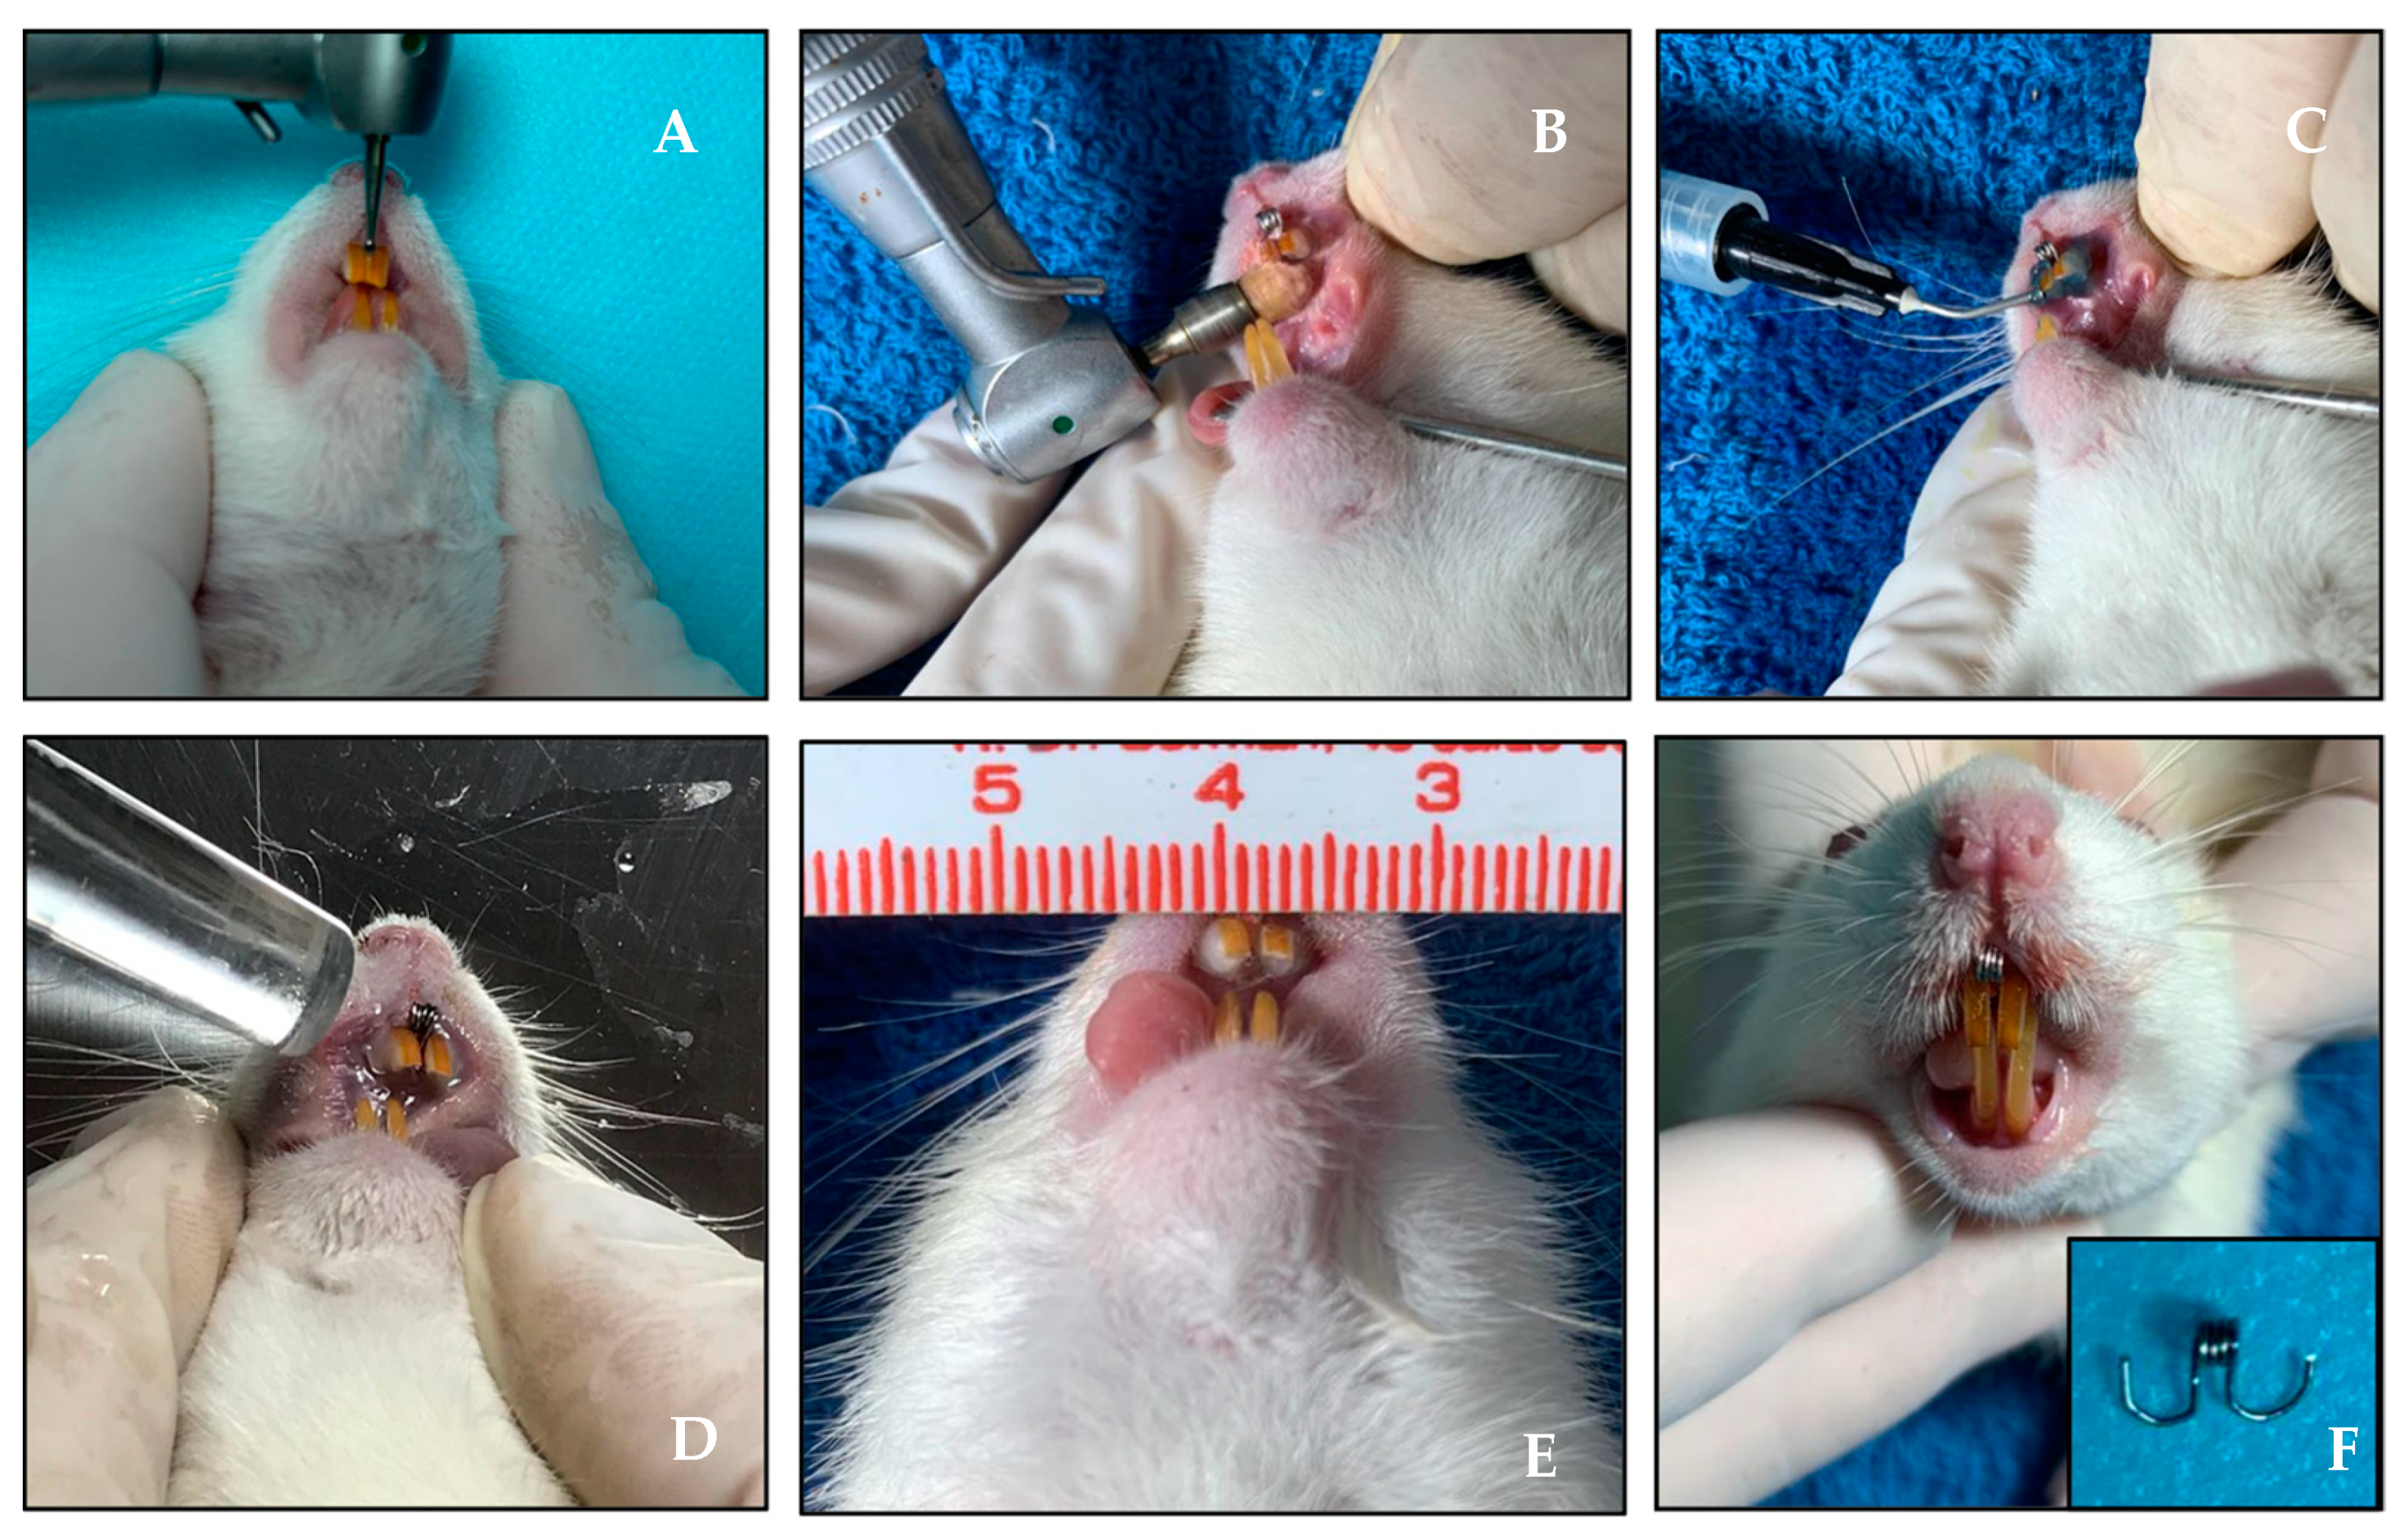
2. Materials and Methods

The research protocol for this work was approved by the Federal Fluminense University Ethics Committee on Animal Use (CEUA/UFF) under the number CEUA 5072191118. This research was carried out following the Brazilian Guideline for the Care and Use of Animals for Scientific and Didactics—DBCA and the CONCEA Euthanasia Practice Guidelines [24]. This study was conducted in accordance with the 3Rs Program guidelines (Reduction, Refinement, Replacement) and reported in accordance with the guidelines of ARRIVE (Animal Research: Reporting of In Vivo Experiments) [25] and Planning Research and Experimental Procedures on Animals: Recommendations for Excellence (PREPARE) [26] with regard to the relevant items.
In this study, 10 female Wistar rats were used that weighed from 300 to 350 g. This animal specification was available in the production and reproduction flow of the Animal Experimentation Laboratory (LEA), located at Fluminense Federal University—Niterói were used. Before and after the experimental period, the animals were kept in mini-isolators, with a maximum of two animals in each, being fed with pelleted feed and water at will. The animals were randomly distributed into two groups of five animals before the appliance installation: CT and SVT. After the orthodontic appliance installation in all animals, with an activation period of 5 days, a single dose of 5 mg/kg of simvastatin per day was administered by oral gavage for 20 consecutive days in the SVT group (n = 5). In the CT group (n = 5), distilled water was applied under the same experimental conditions, also by oral gavage. The samples from the HG group (n = 5) were used from previous studies by the author [27] and did not undergo any intervention (Figure 1). The initial simvastatin solution was obtained by dissolving 350 mg of simvastatin in 58.3 mL of distilled water and 0.5% carboxymethyl cellulose used as a vehicle. Then, with the magnetic stirrer’s help, homogenization and solubilization were completed [28].
The procedure of installing the orthodontic appliance (Figure 2) was performed on the animals under general anesthesia. The animals were deprived of food but not of water six hours before the procedure, and when the device was installed, they were weighed on a precision digital scale (Gehaba–BG 4001, Farmingdale, NY, USA). The animals received 20 mg/kg of ketamine IM (Francotar®–Virbac, St. Louis, MO, USA) and 1 mg/kg of Xylazine (Sedazine®–Fort Dodge, Fort Dodge, IA, USA) intraperitoneally as anesthetic medication. After observing the absence of pain reflexes, antisepsis was performed with chlorhexidine 0.5% in the buccal region, and then, they were positioned on the operating table for the orthodontic device installation and RME. The oral gavage procedure, performed during the 20 consecutive days, did not involve general anesthesia.
To perform tooth movement, a device made with stainless-steel orthodontic wire with a round cross-section of 0.012”, American Orthodontics, was used (Figure 2F). With the aid of a dynamometer (Dentaurum 040-711), the spring activation was 0.5 N [29]. The device was fixed to the incisors through adhesive bonding with flow-type resin.
After the experimental period, the animals were euthanized with a lethal dose of general anesthetic (overdose, 200 mg/kg of ketamine (Francotar®–Virbac, Jurubatuba, São Paulo, SP, Brazil)). Initially, the samples were scanned to obtain the µCT images and then were processed to make histological slides.

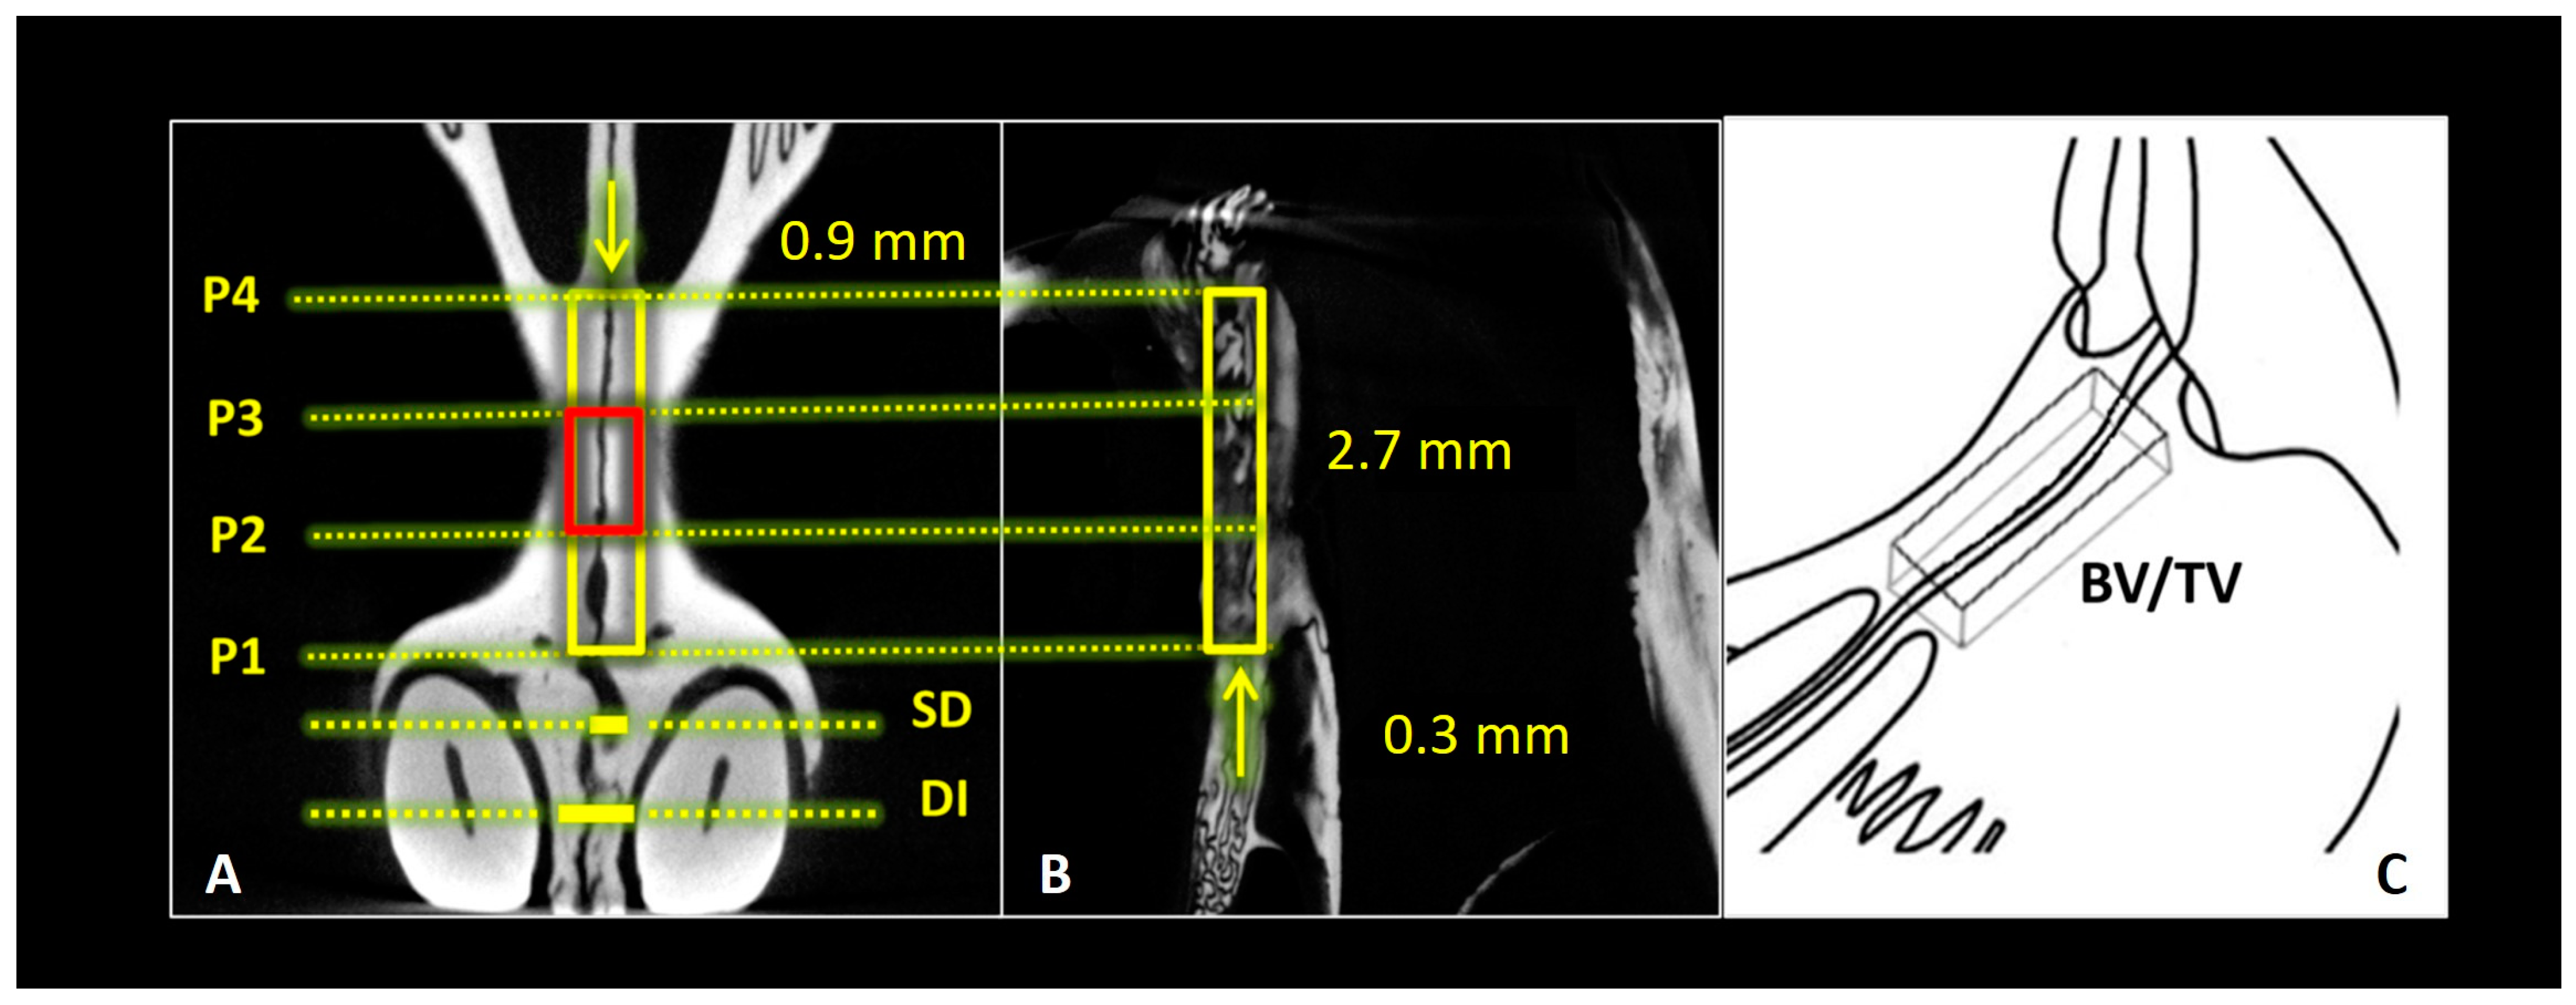
2.1. Micro-Computed Tomography

The fifteen samples were submitted to µCT scanning in the Phoenix V|tome|x M (General Electronics, Phoenix, AZ, USA) microtomograph at the Nuclear Instrumentation Laboratory—LIN/COPE-UFRJ. As pre-selected parameters, 70 kV, 114 mA, isotropic pixel size of 15 µm (0.015 mm) were used following the Guidelines for Acquisition and Evaluation of Bone Microstructure in Rodents by Mary L Bouxsein et al., 2010 [30].
To obtain the tomographic slices of interest, the images of all samples were positioned in the DataViewer software 1.5.6.2 (Bruker microCT, Allentown, PA, USA). The region of interest (ROI) was considered between the beginning of the incisive foramen, in the posterior region and up to the palatine alveolar cortical wall of the anterior incisors. Then, in the Fiji Image J software (National Institutes of Health, USA), linear measurements of the palatal suture were obtained in the axial view at four distinct and equidistant points (P1, P2, P3, and P4). In addition, the intra-incisor distance (DI) was measured at the closest approximation point of the dental elements and the suture distance (SD) in the region (Figure 3A). These measurements were performed through graphic analysis of the pixel attenuation. Then, with the aim of quantifying the bone volume fraction (BV/TV) and empty space (EV) in the suture region, an ROI of 180 pixels in height by 60 pixels in width was applied, with a depth of 20 sections; thus, a 3D ROI of 2.7 mm × 0.9 mm × 0.3 mm was formed, positioned between points P1 and P4 (Figure 3A–C). In addition, with the Slice Geometry function of the Bone J plugin on this software [31], the cortical bone microtomographic parameters of the palatine suture were extracted, such as cortical bone area (Ct.Ar), cortical bone area fraction (Ct.Ar/Tt.Ar) and cortical thickness (Ct.Th), applying an ROI of 60 × 60 pixels between P2 and P3 points, as this region showed the greatest significant difference between the experimental groups in the linear measurement. These parameters were obtained because they represent the minimum indices for the cortical bone morphometric description in µCT [30].

2.2. Histology and Histomorphometry

The samples were treated to remove soft tissue and fixed in 4% formaldehyde buffer (phosphate buffer, pH 7.4) for 48 h. Decalcification was performed with 10% buffered eth-ylenediaminetetraacetic acid (EDTA) (Allkimia®, Campinas, São Paulo, Brazil), a demineralizing solution, for two days at room temperature. The histological process for paraffin embedding was performed to obtain a 5 µm thick longitudinal section stained with hematoxylin–eosin (HE). All histological slides were coded according to experimental groups. An experienced examiner evaluated blindly.
Histomorphometry was performed through digital image analysis captured from slides stained in HE through a brightfield light microscope (OLYMPUS® BX43, Tokyo, Japan). These images were captured using a high-resolution digital camera (OLYMPUS® SC100, Tokyo, Japan), using a 40× acropla objective lens. The objective was first centered at the level of the periodontal ligament area and then centered at the palatal suture area in order to capture, with the 40× objective and 400× magnification range.
Two fields were photographed per scan in each histological section without overlapping images. The 40× objective was chosen for the capture, as it provided a good observation field and also allowed for morphological tissue detailing. All images are 1.280 × 960 pixels in size and saved in JPEG format. In the Fiji Image J software, the histological images were first imported, and the total image area was calculated. Thus, the value corresponding to 100% of the image area was considered. Then, with the polygon tool, an ROI was drawn considering the entire connective tissue area that fills the palatine suture, and this area was also calculated [22]. Thus, by decreasing the connective tissue area from the total area, it is possible to obtain the total image bone area. These values were transferred to a Microsoft Excel® (Redmond, WA, USA) spreadsheet, and these data were analyzed statistically.

2.3. Statistical Analysis

The results obtained in the linear measurements at the midpalatal suture (P1, P2, P3 and P4), SD and DI distance, bone volume (BV/TV), microtomographic parameters (Ct.Ar, Tt.Ar and Ct.Th) and histomorphometric parameters (intermediate bone around the palatine suture and connective tissue) were submitted to Shapiro–Wilk normality test prior to statistical tests in order to verify the values’ normality. Then, they were evaluated using the one-way ANOVA test and Tukey’s post hoc test (p < 0.05).

3. Results

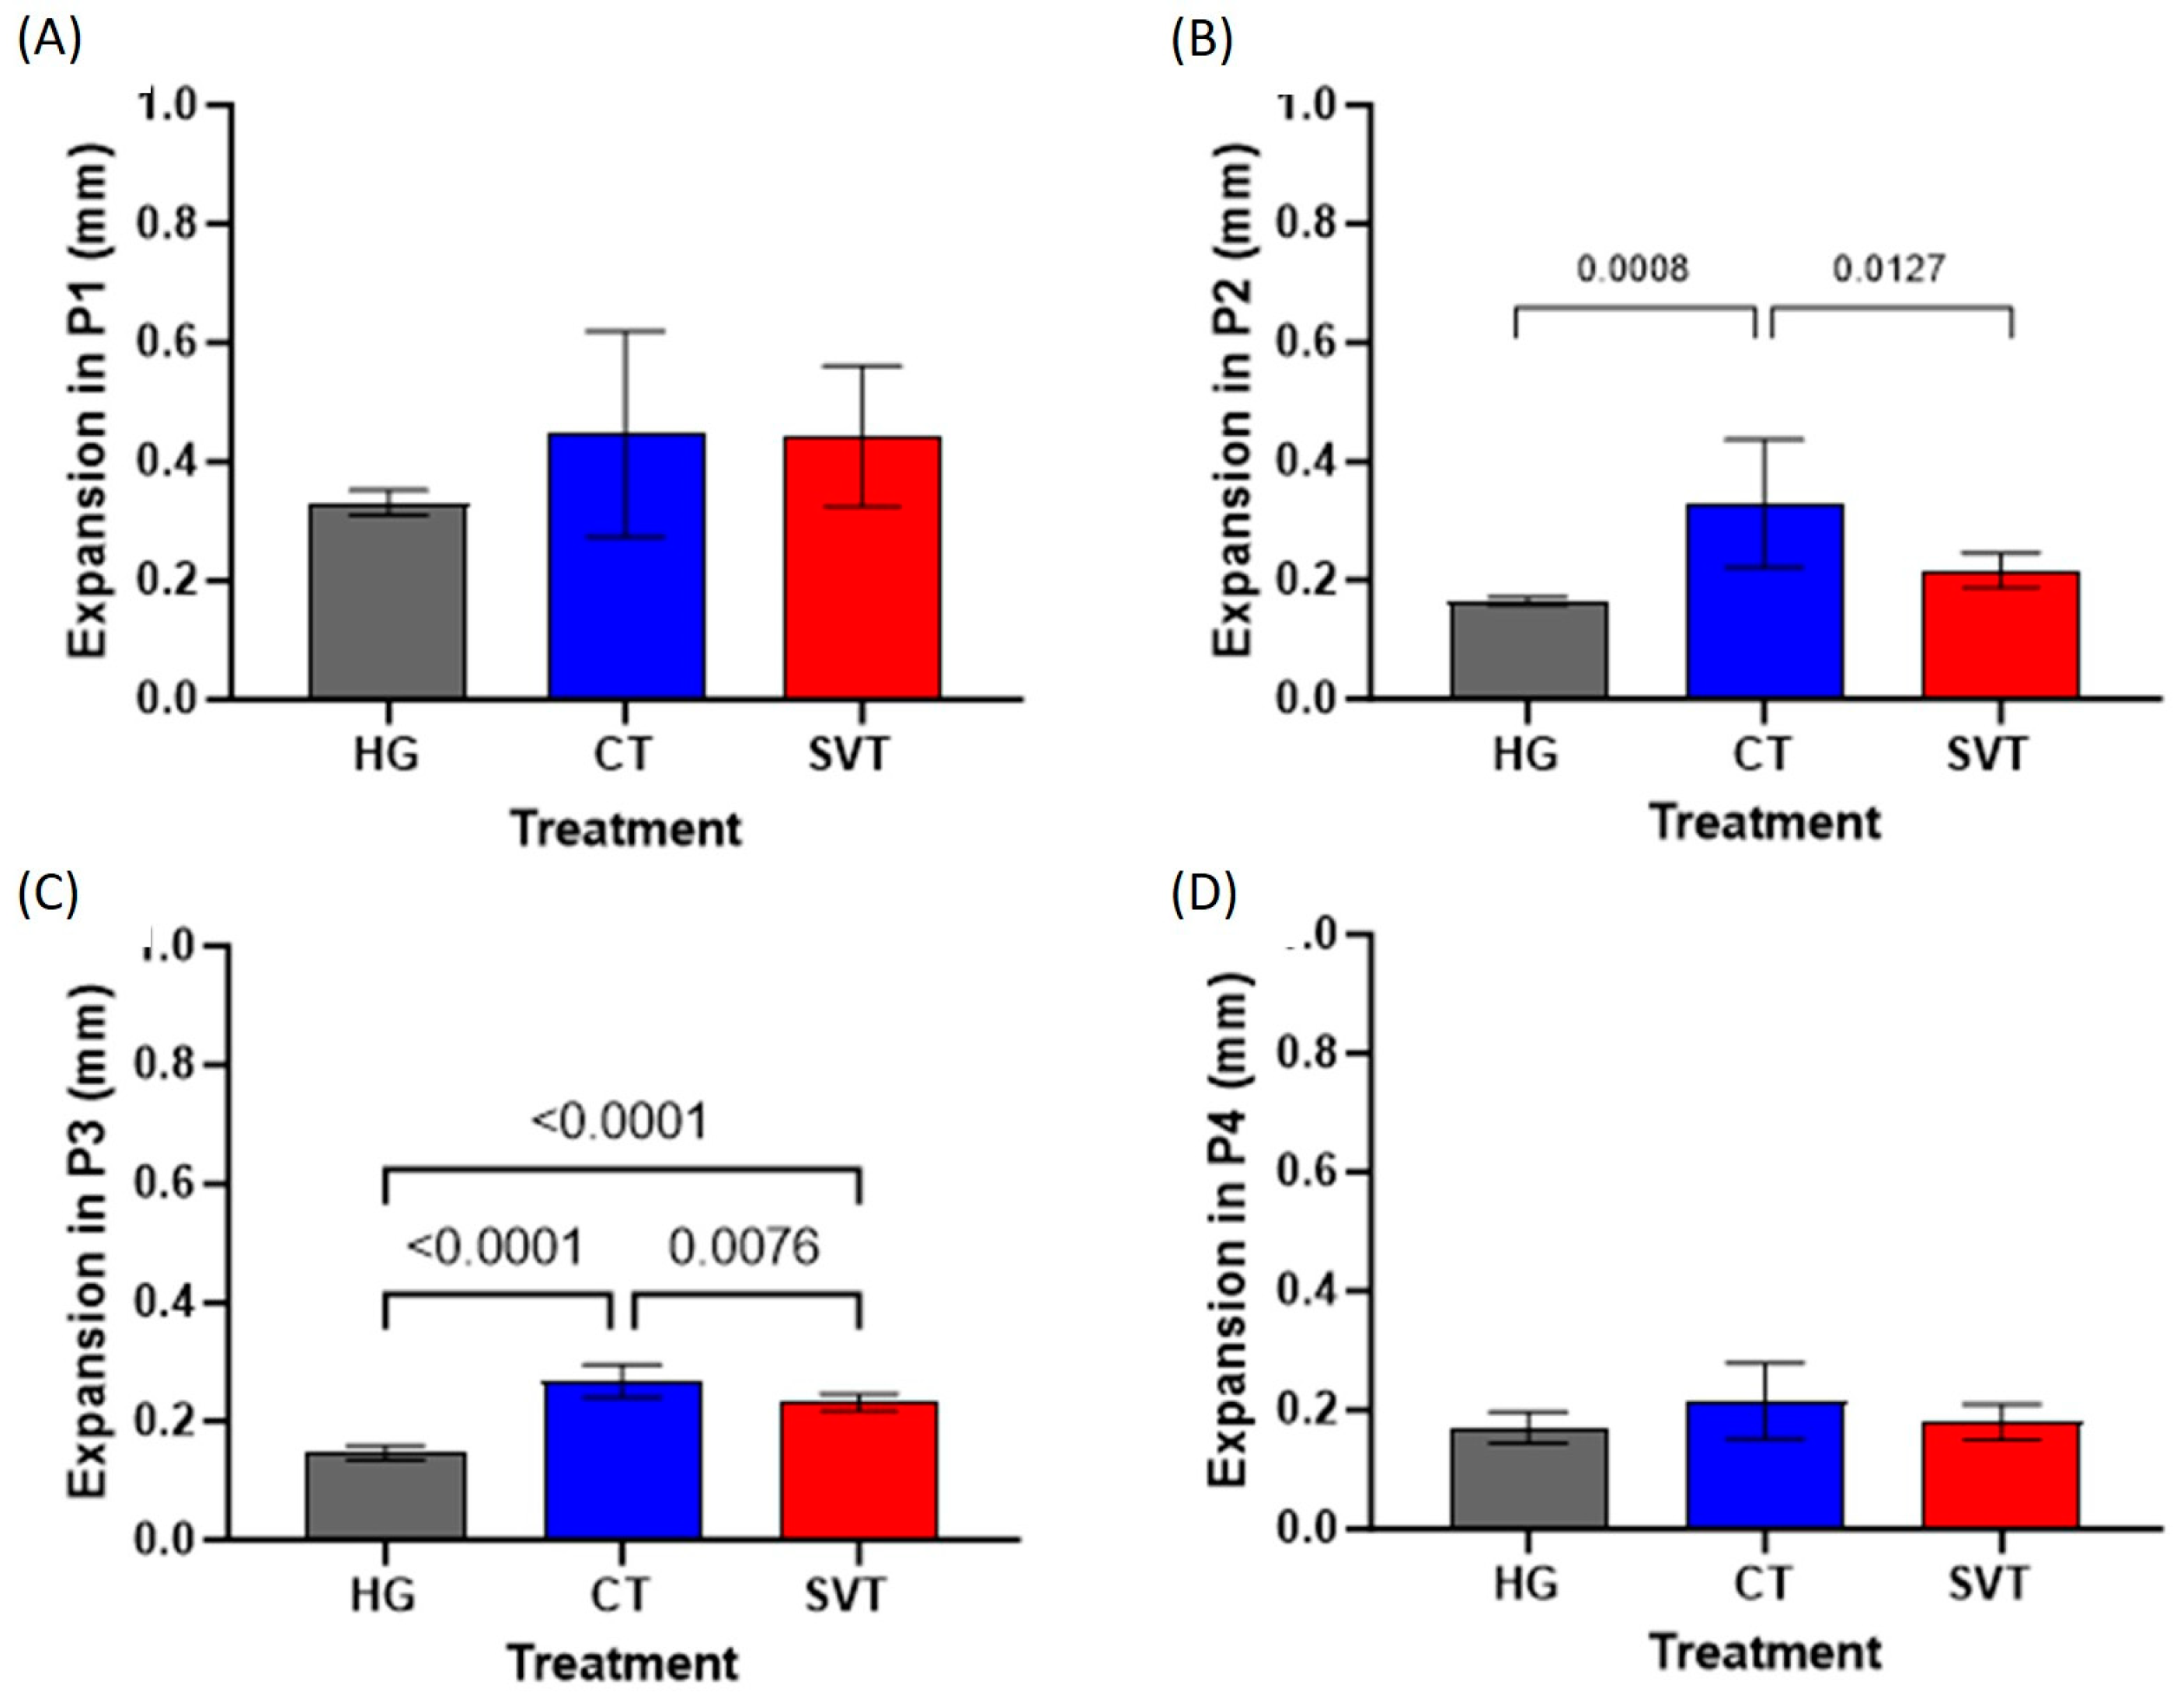
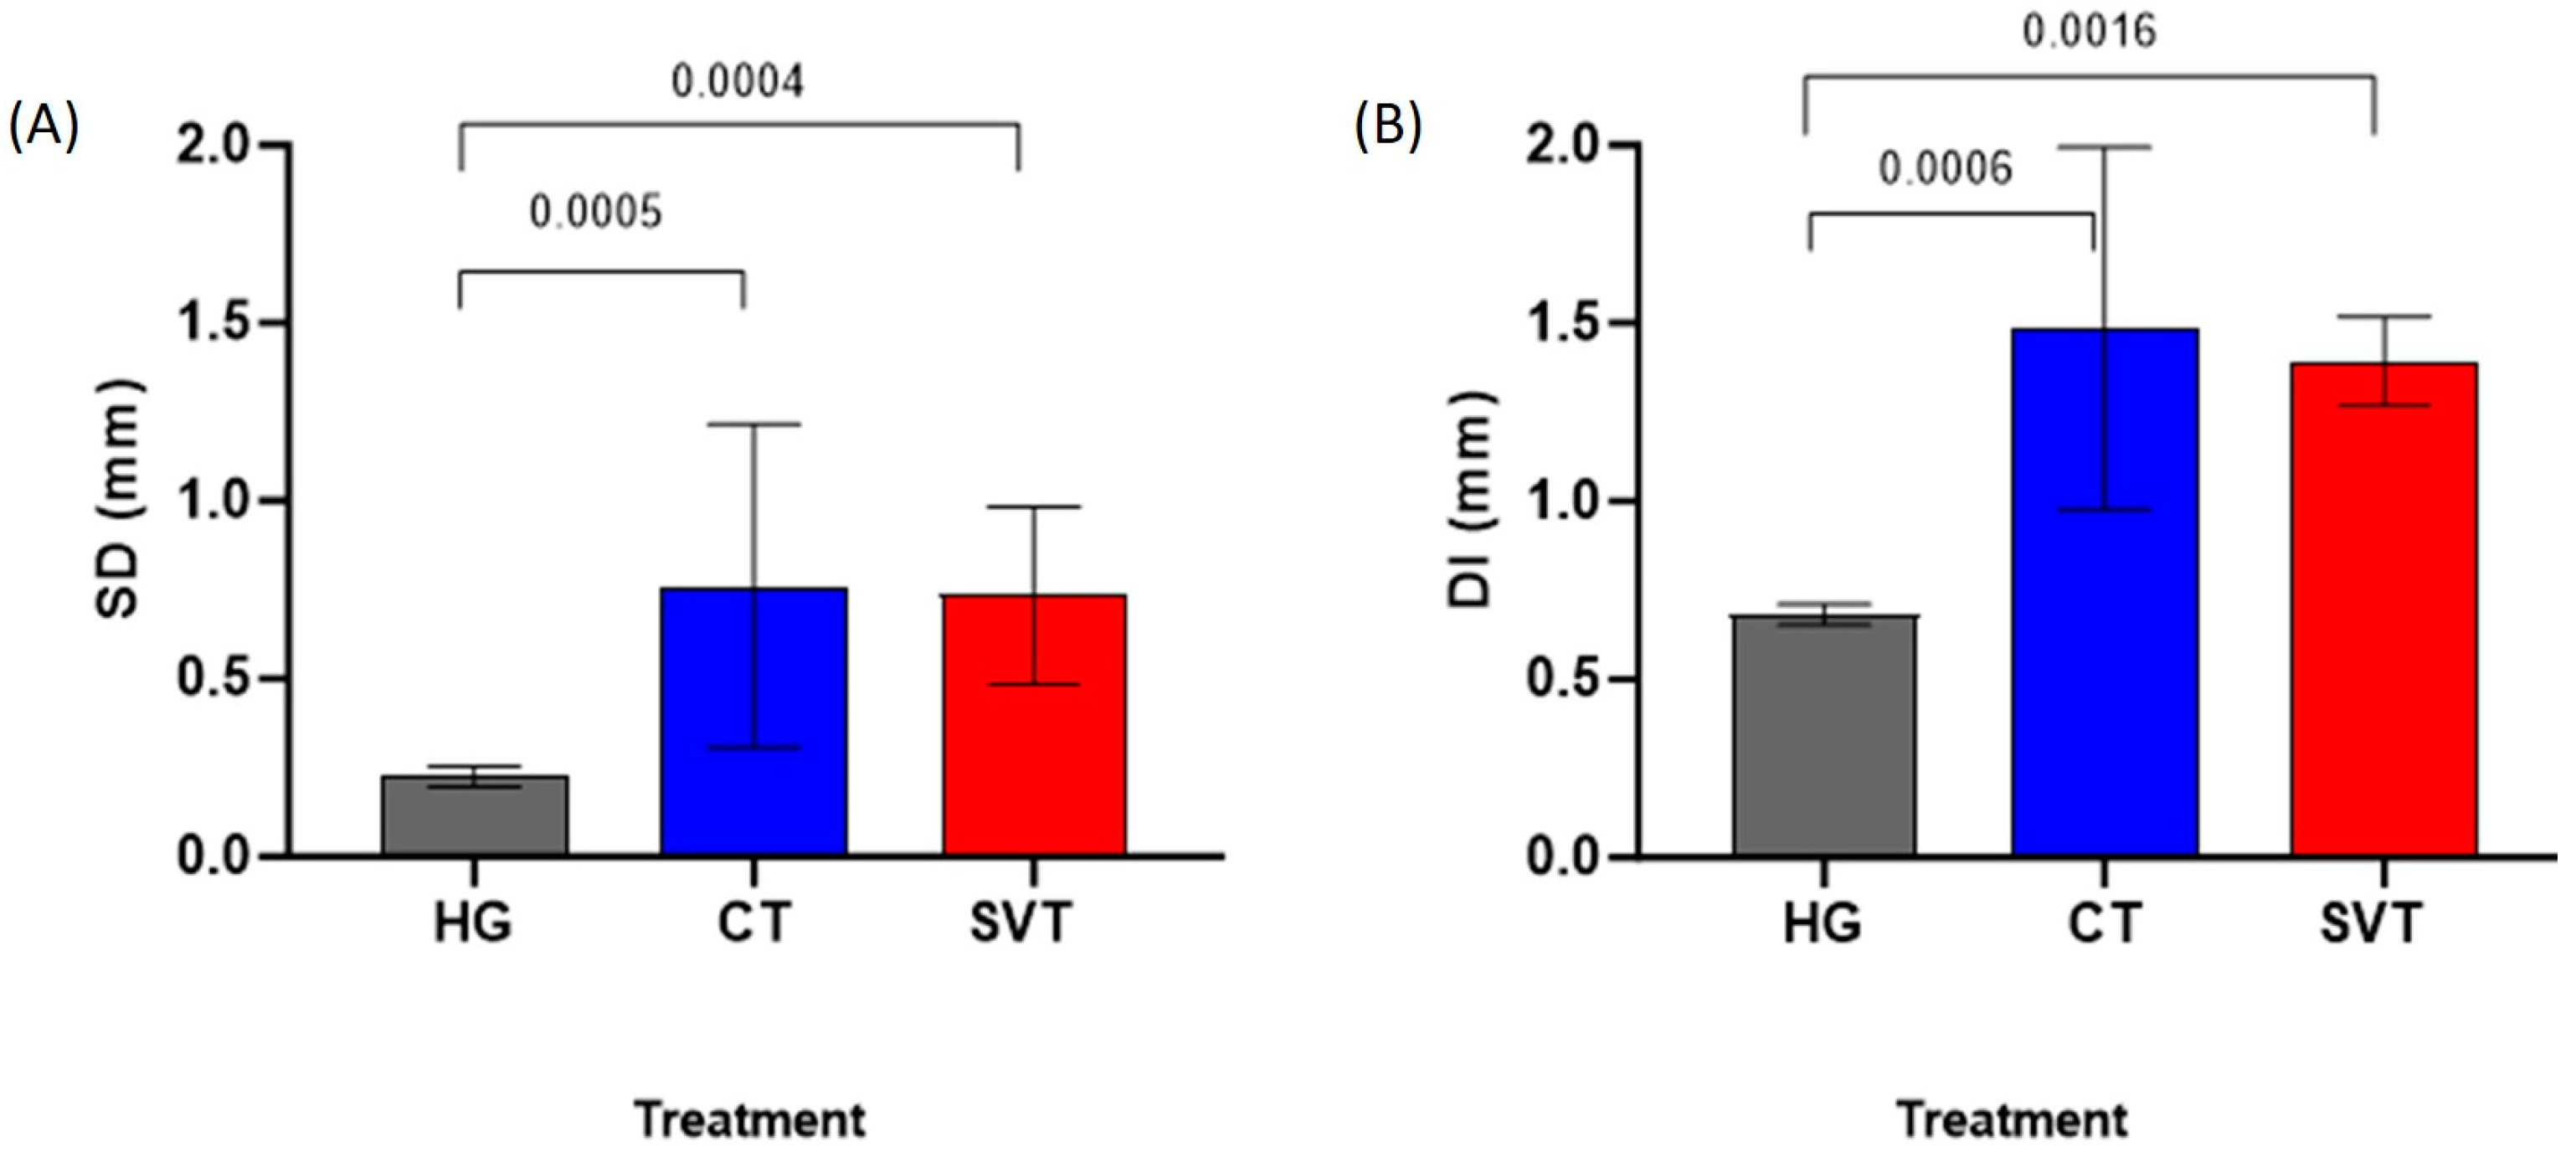
3.1. Palatine Suture Measurements

In Figure 4, the results are presented as mean and confidence intervals for the four points that are given in millimeters (mm). At P1 and P4, no statistical differences were observed between the evaluated treatments (groups HG, CT and SVT). At P2, the CT group (0.32; CI: 0.22–0.43) showed greater expansion than the HG (0.16; CI: 0.15–0.17; p = 0.0008) and SVT (0.21; CI: 0.18–0.24; p = 0.0127).
At P3, the CT group (0.26; CI: 0.24–0.29) showed greater expansion than the HG (0.14; CI: 0.13–0.15; p < 0.0001) and SVT (0.23; CI: 0.21–0.24; p = 0.0076). Furthermore, the HG group showed less expansion than the SVT group (p < 0.0001).
In the DI variable (Figure 5B), the HG group (0.68; CI: 0.65–0.71) had a shorter distance (mm) than the CT (1.48; CI 0.97–1.99; p = 0.0006) and SVT groups (1.39; CI: 1.26–1.51; p = 0.0016). The same difference between groups was observed in the SD distance: the HG group (0.22; CI: 0.19–0.25) had a smaller distance (mm) than the CT (0.75; CI: 0.30–1.22; p = 0.0005) and SVT (0.73; CI: 0.48–0.98; p = 0.0004) (Figure 5A).

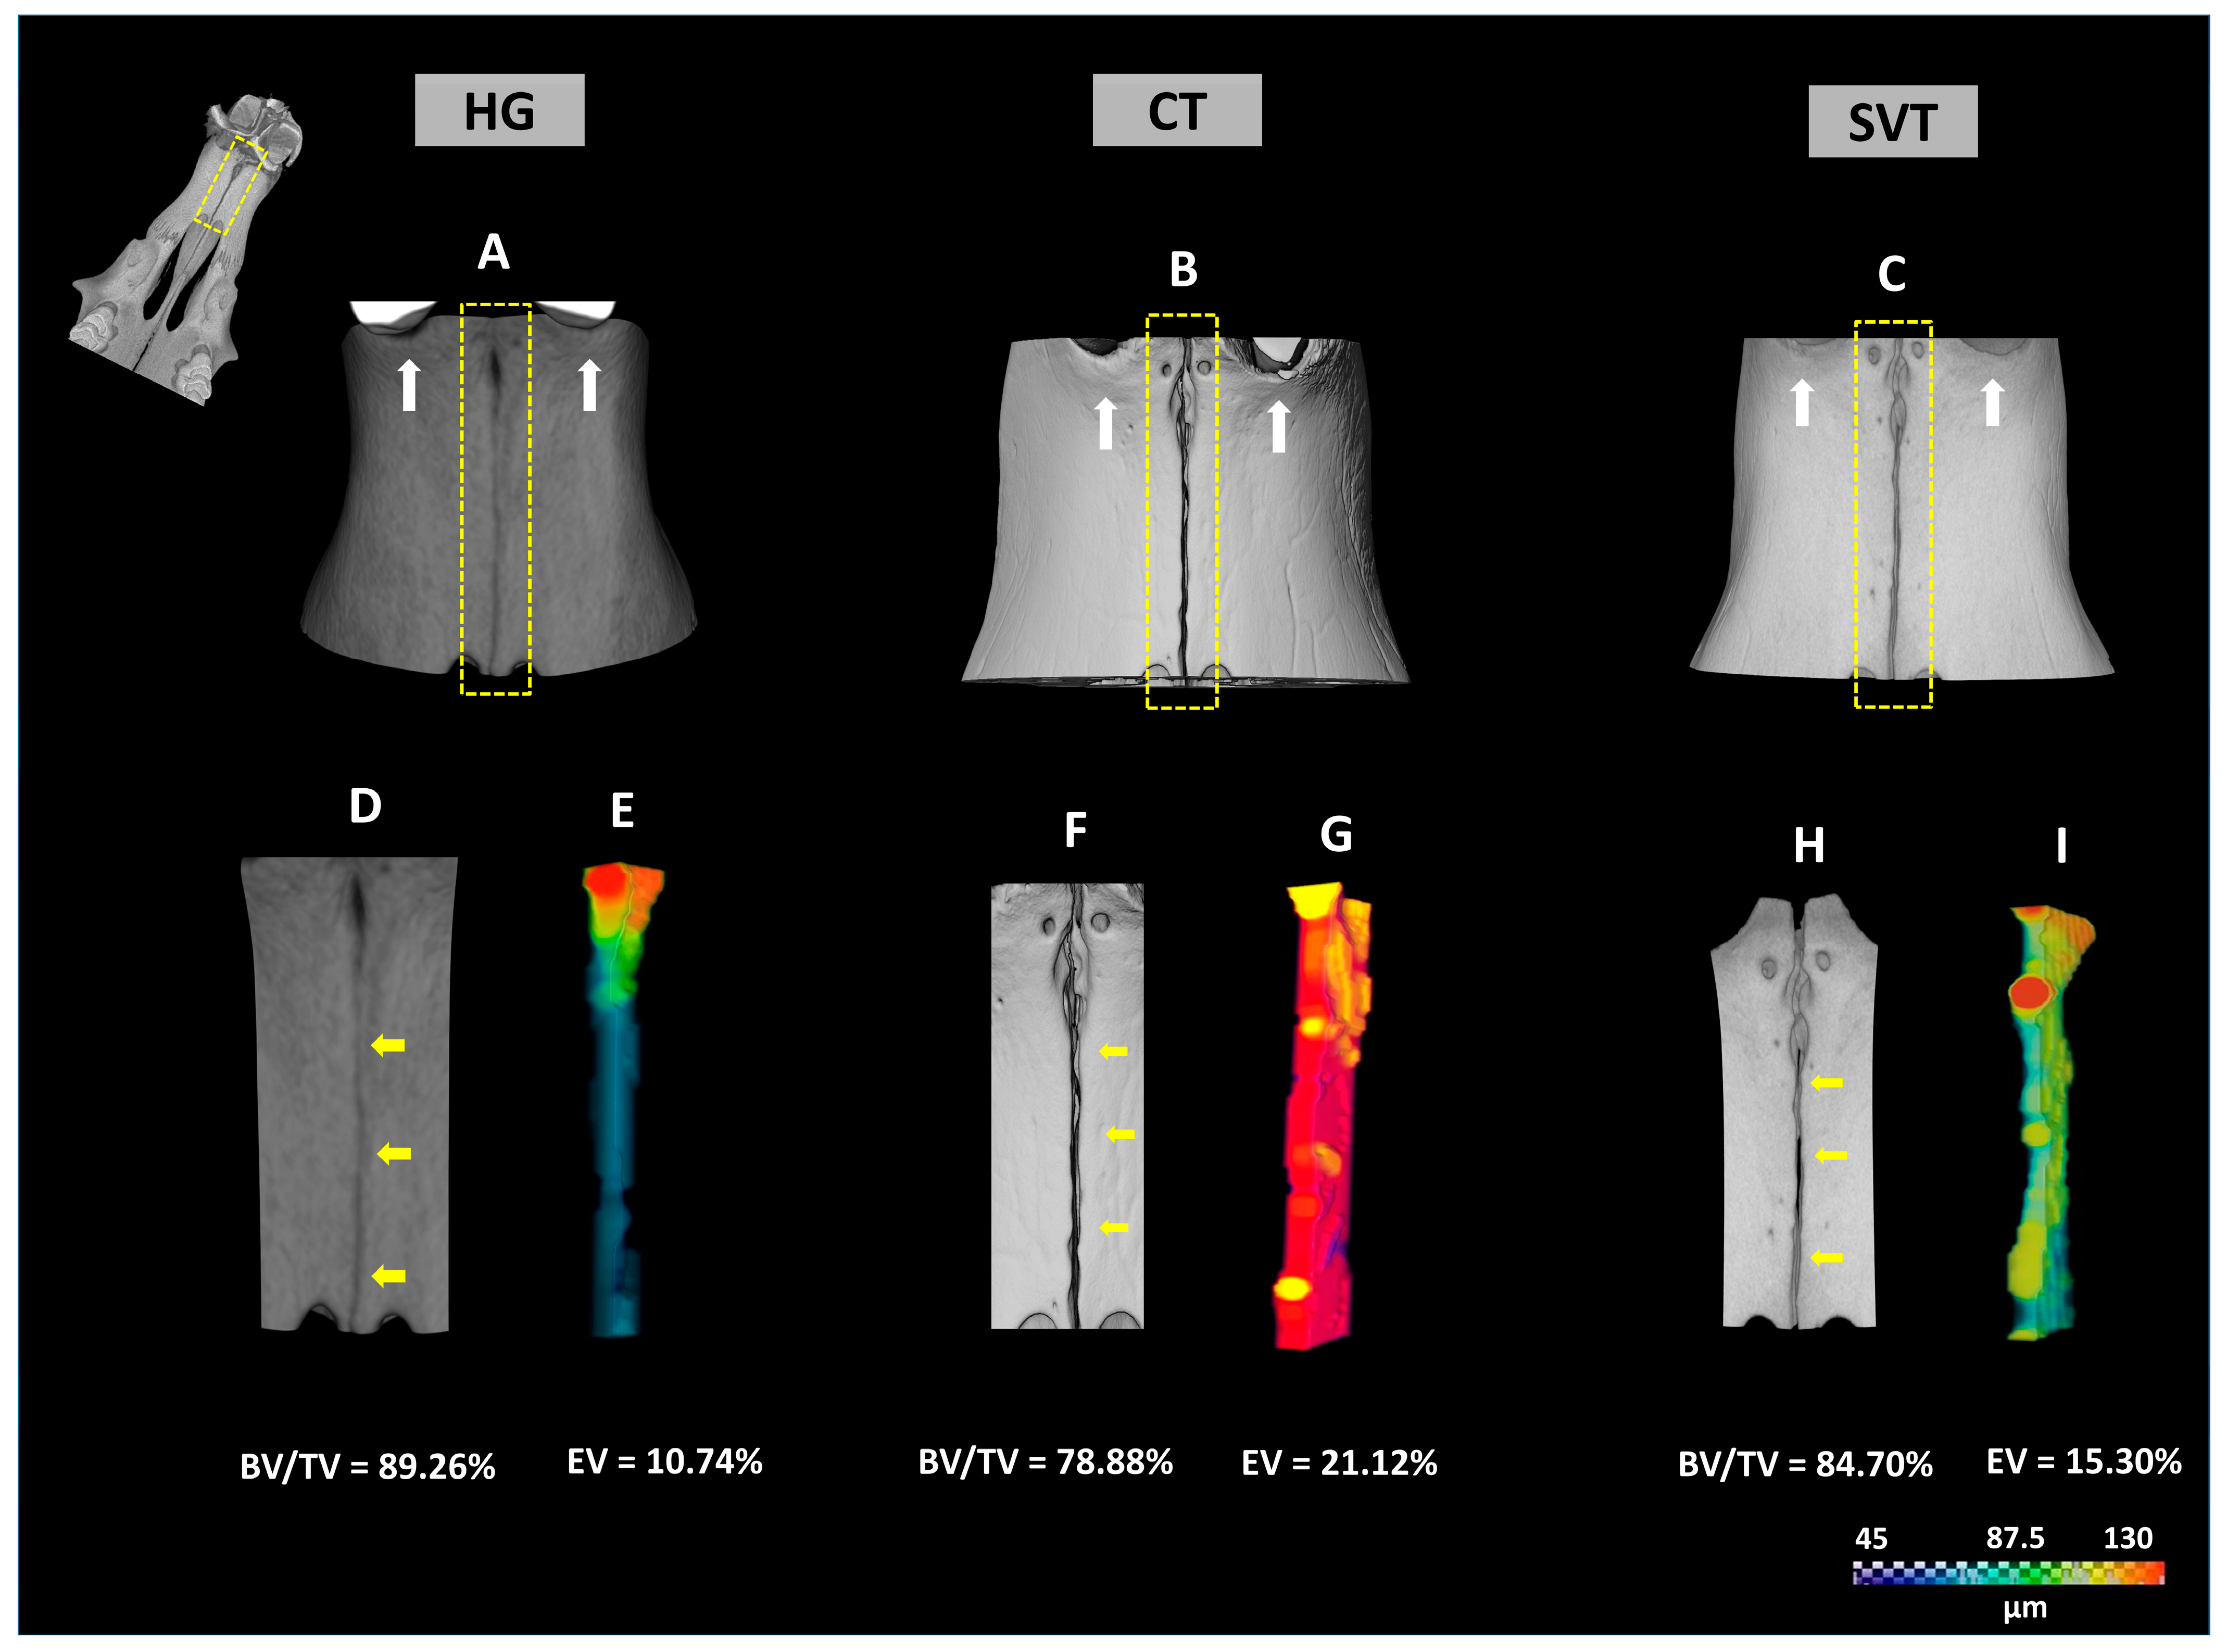
3.2. Three-Dimensional µCT Images Segmentation

After acquiring the µCT image, the image segmentation process was performed. Through the method based on each slice histogram (threshold), the gray values were mapped in the dataset, and the 3D bone volume (BV/TV) and the empty space reconstruction (EV) within the ROI were obtained. In addition, the EV thickness was analyzed and measured using a color scale in the Avizo 3D program (Thermo Fisher Scientific), thus generating a representative image for each experimental group.
Figure 6 represents the average BV/TV fraction of the experimental groups in the selected ROI. The HG group (89.26%; CI: 87.18–91.34) had a greater bone volume when compared to the CT (78.88%; CI: 76.20–81.56; p < 0.0001) and SVT group (84.70%; CI: 82.50–86.90; p = 0.0062). Furthermore, the SVT group showed a higher BV/TV when compared to the CT group (p = 0.0010). It was possible to show that the bone walls of the suture in the HG group (EV = 10.74%) had a thinner surface and were evenly distributed in terms of thickness, which was evaluated using the color scale. In the CT group, when reformatting the EV, we can observe a thicker suture (21.12%), with the wall surface having indentations and evident roughness, demonstrating a more irregular and uneven structure. In the color scale, we can observe that in this group, the thickness varied between 108.75 and 130 µm. In the SVT group, we observed a thinner EV (15.30%), that is, a narrower suture area with also irregular walls and occasional indentations. Following the color scale, the group showed thicker areas (108.75 and 130 µm) as well as less thick areas (87.5 µm).
The values presented in the table below (Table 1) are given in cubic millimeters (mm3) through the mean and standard deviation. Then, the percentage (%) is given.

3.3. Microtomographic Parameters

The cortical bone area (Ct.Ar), cortical bone area fraction (Ct.Ar/Tt.Ar) and cortical thickness (Ct.Th) values are presented in Table 2 as the mean and standard deviation of each experimental group.
The Ct.Ar/Tt.Ar fraction in the HG group (90.80%; CI: 89.84–91.76) had a larger cortical bone area fraction when compared to the CT (84.58%; CI: 81. 46–87.70; p = 0.001) and SVT group (88.04%; CI: 87.29–88.79; p = 0.0394). Furthermore, the SVT group showed a higher percentage of cortical bone (p = 0.0110) when compared to the CT group. In Ct.Ar, the HG group (0.735 mm2; CI: 0.727–0.743) had a larger cortical bone area when compared to the CT (0.686 mm2; CI: 0.658–0.715; p = 0.0005) and SVT (0.715 mm2; CI: 0.707–0.724); however, with the latter group, there was no significant difference. Furthermore, the SVT group showed a larger cortical bone area when compared to the CT group (p = 0.0306). In Ct.Th, the HG group (0.906 mm3; CI: 0.851–0.962) showed greater cortical thickness when compared to the CT (0.649 mm3; CI: 0.637–0.661; p < 0.0001) and SVT (0.818 mm3; CI: 0.736–0.900; p = 0.0275). Furthermore, the SVT group showed greater cortical thickness when compared to the CT group (p = 0.0002).

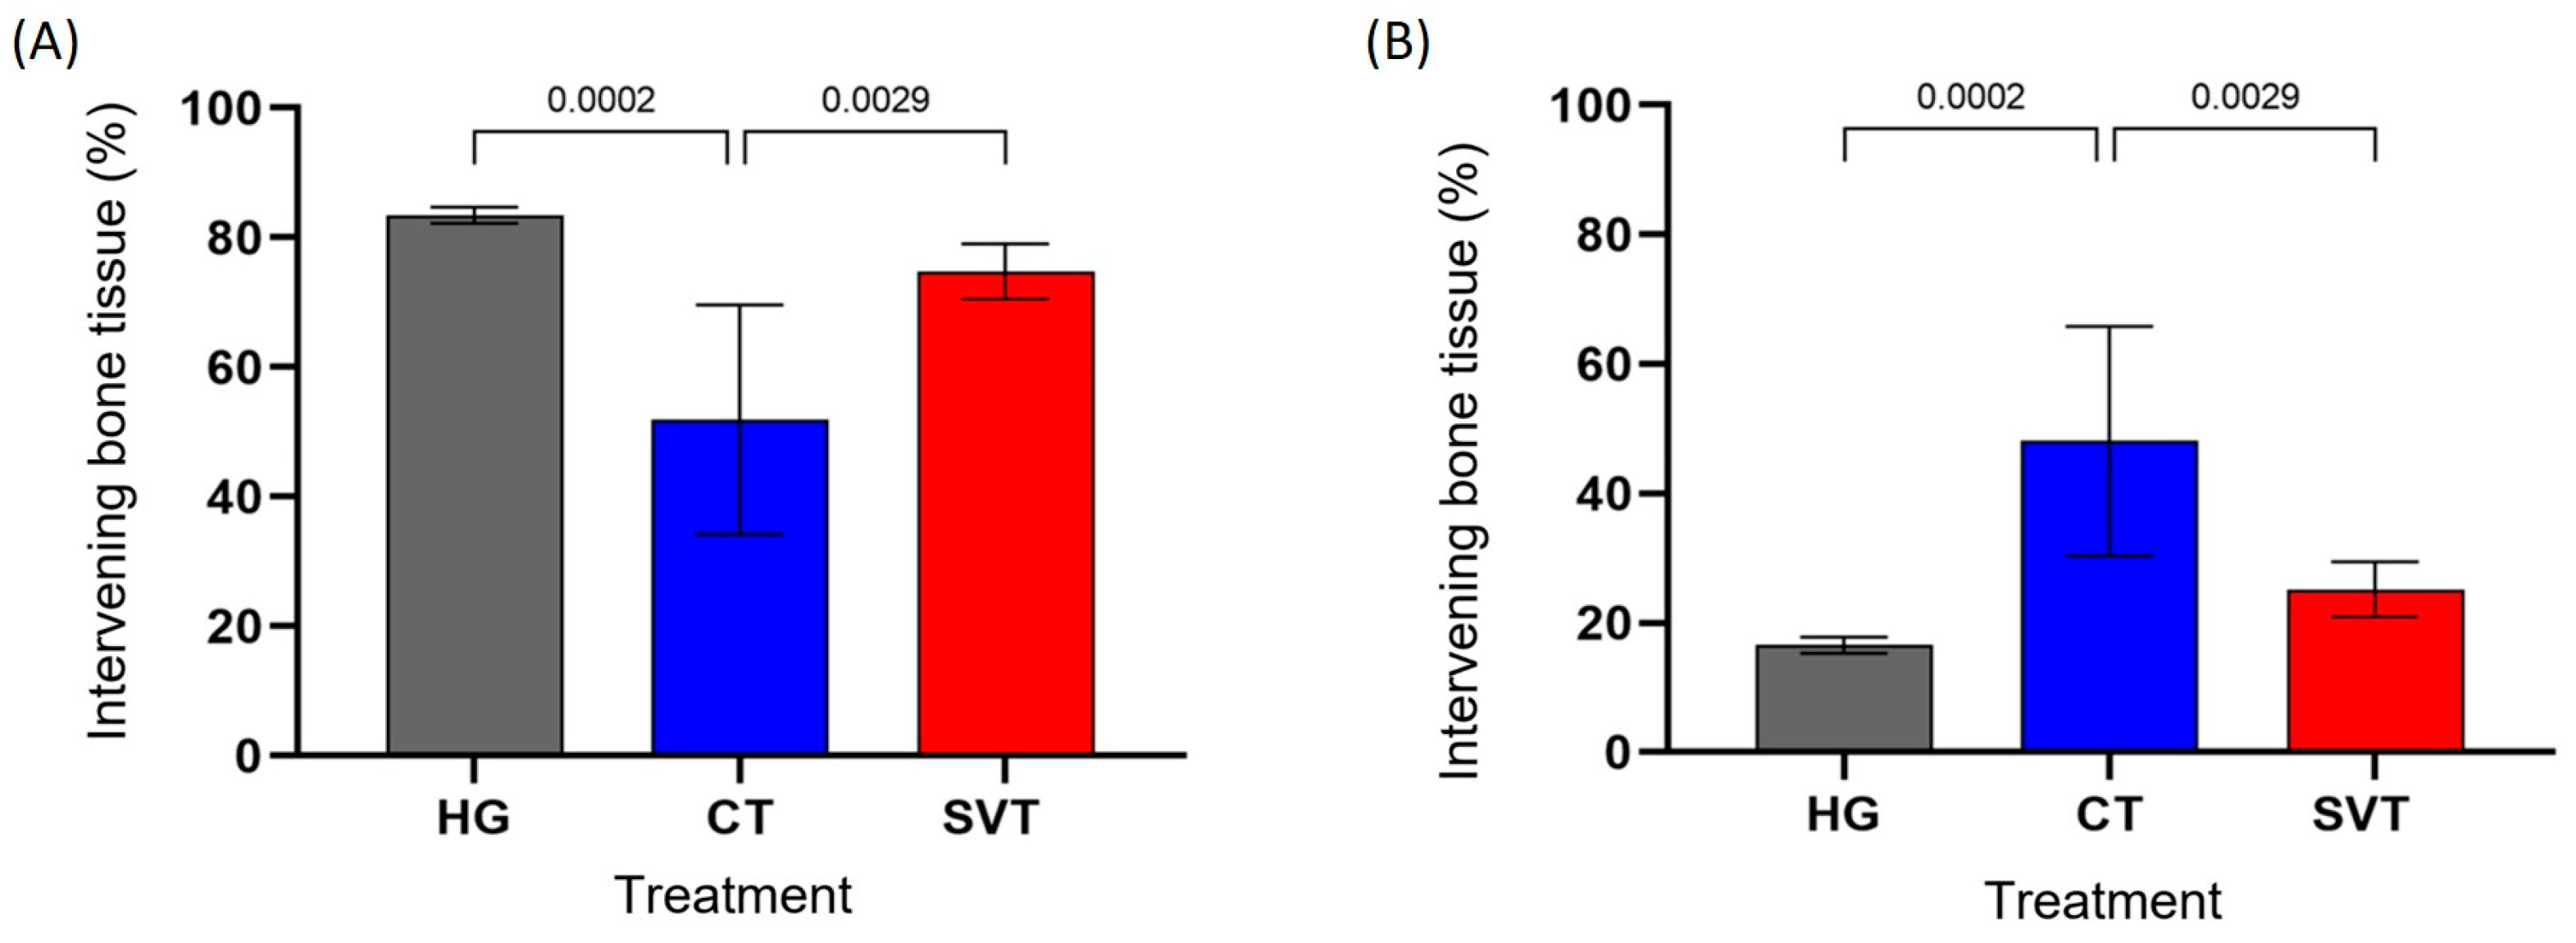
3.4. Histomorphometric Results

The CT group (51.90%; CI: 34.21–69.60) had a smaller intermingled bone tissue volume when compared to the HG (83.47%; CI: 82.20–84.75; p = 0.0002) and SVT (74.79%; CI: 70.55–79.02; p = 0.0029) groups. No difference was observed between the HG and SVT groups (p > 0.05) (Figure 7A). The same differences found in the intermingling bone tissue variable were observed in the palatal suture connective tissue volume variable. The CT group (48.10%; CI: 30.40–65.79) had a greater connective tissue volume than the HG (16.53%; CI: 15.25–17.80; p = 0.0002) and SVT (25.21%; CI: 20.98–29.45; p = 0.0029). No differences were observed between the HG and SVT groups (Figure 7B).

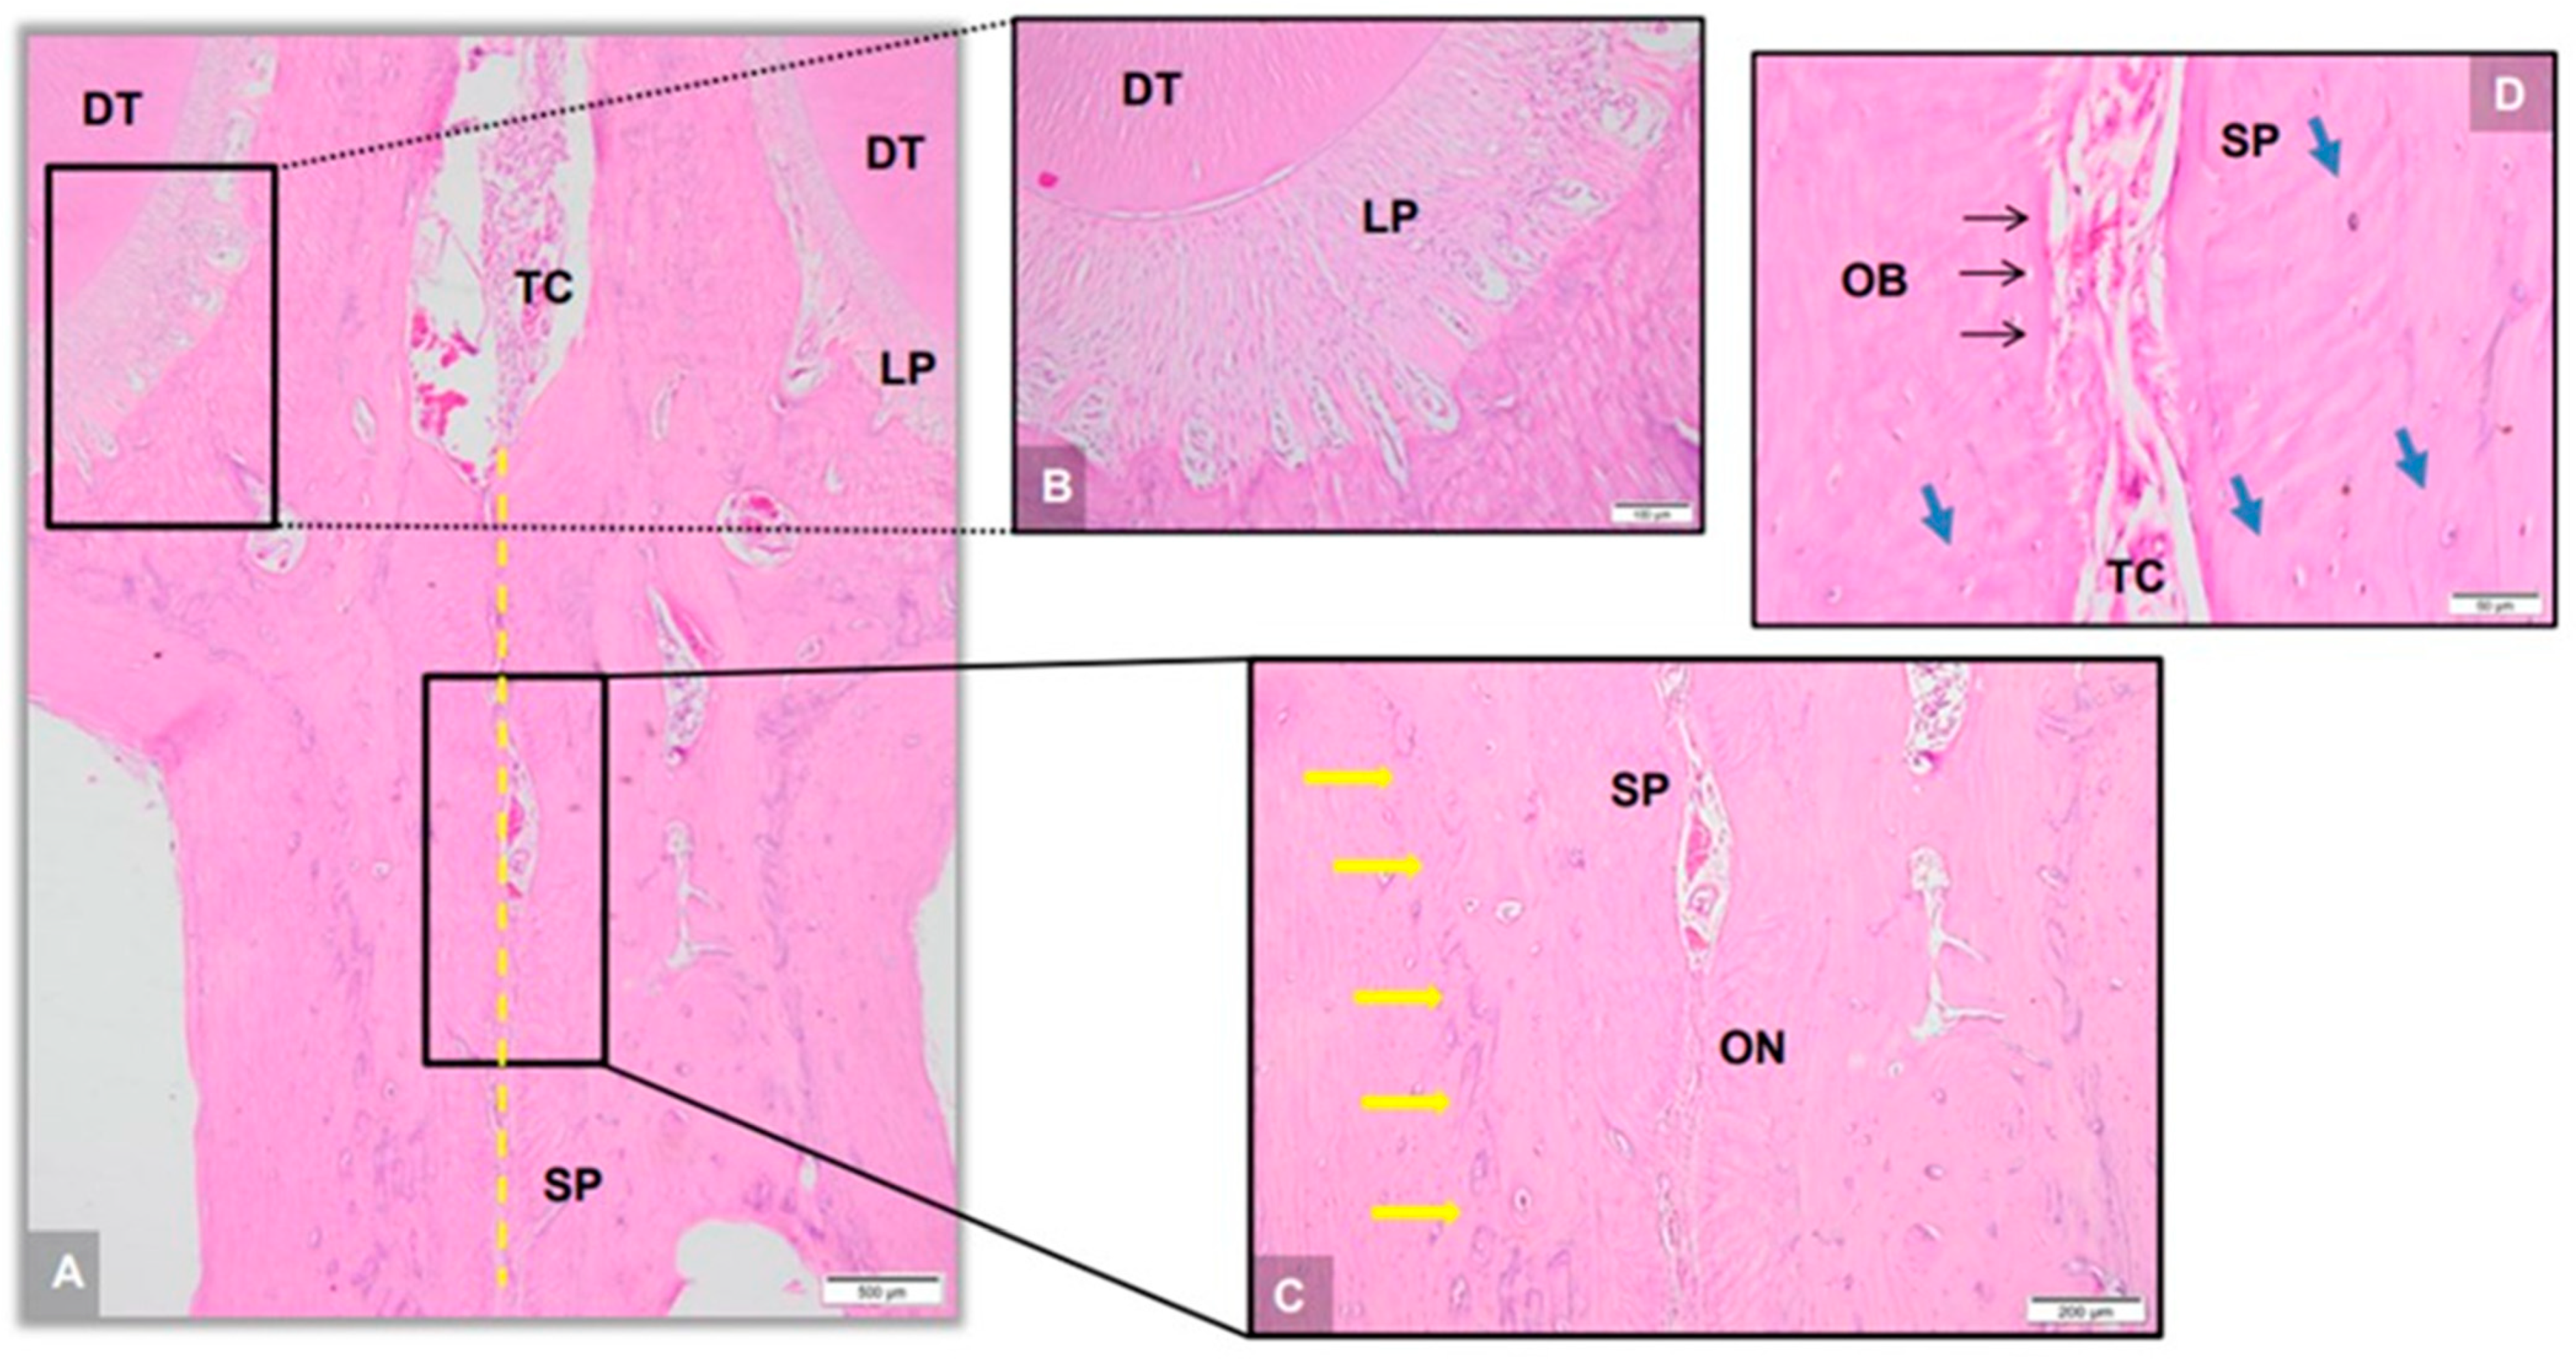
3.5. Descriptive Histology and Histomorphometry

In the HG group, at higher magnification, we observed a narrow band of connective tissue bordered by mature cortical bone and the absence of inflammatory infiltrate in the model central portion (Figure 8A,C). In the periodontal ligament area, no regions of root resorption or any change in the alveolar ridge were observed (Figure 8B). The CT group presented, in its histological analysis, fibrocellular connective tissue in abundance, absence of inflammatory infiltrate in the palatine suture center and restricted presence of newly formed bone on the margins of the suture ends (Figure 9A,B). At higher magnification (Figure 9C,D), we can observe a reversal line (yellow arrow) that delimits the presence of a new bone band formation that permeates the suture area. There is an osteoblast paving (black arrow) on the margins of both sides of the suture with the presence of osteoclasts (black arrow) and osteocytes (blue arrow), demonstrating the bone manipulation that underwent RME. In the periodontal ligament area, we can observe the massive presence of cellular activity with resorption areas and new bone formation in the alveolar ridge, which is justified by the movement exerted by the orthodontic appliance (Figure 9A). In the SVT group, fibrocellular connective tissue was observed as a potential signaling of the cells that participate in the bone deposition and apposition process, which invariably generates the mechanisms of bone resorption and neoformation (Figure 10A). Along the sutural region wall, large osteoblasts were observed to pave unicellular, round cells arranged in a cord, justifying the production of a new bone matrix that occurs adjacent to the palatine suture (Figure 10D). Thus, it is possible to notice a new bone band delimited by visible well-marked reversal lines (Figure 10C, yellow arrow) that separate the new bone from the resident bone, which presents a large number of osteocytes in gaps (blue arrow). There is also the presence of occasional osteoclasts. In the region close to the periodontal ligament, great cellular activity is observed, demonstrating that the orthodontic device expanded the suture and moved the tooth (Figure 10B).

4. Discussion

In the present study, the positive effect of simvastatin on bone apposition in the palatal suture area after RME was demonstrated. For allometric extrapolation and clinical correlation, samples aged approximately three and a half months were used, as two weeks for a mouse is equivalent to one human year [32]. Thus, it was possible to simulate a treatment at a pubertal age.
The significant increase in the diastema of all samples, confirmed by the statistical difference in SD and DI, demonstrated the planned appliance efficiency. Therefore, this finding corroborates a classic study by Storey E [33], which identified that the ideal animals for observing bone changes in the midpalatal suture under stress are rabbits and rats. However, it should be noted that on the operating table, there was difficulty in fastening the device between the animal’s incisors, which was achieved by creating a groove with a spherical drill and applying an adhesive procedure with flow-type resin. In addition, to maintain the device during the 5 days of RME, the animals were fed with pelleted feed, which consists of crushed food, so the appliance was not moved from the position of interest during feeding. Furthermore, SD and DI measurements demonstrated that the SVT group had lower measurements than the CT group, indicating that there was probably bone apposition in the suture in the group treated with the drug.
In the µCT linear analysis, the data showed significant differences in the P2 and P3 points between the groups that received RME. The SVT group had fewer dimensional variations in these points when compared to the CT group. This result can be explained by the probable bone apposition in the suture region by the simvastatin osteoinductive potential through the osteoclast inactivation, which was elucidated by the histomorphometric analysis, which showed a higher bone volume percentage in the SVT group. This data corroborate Zhao et al. [34], who investigated the width variation in the palatal suture after RME for fourteen days with oral doses of simvastatin. That work obtained a significant variation between the control and simvastatin groups after 3 days of medication. Thus, the present research realized the need for future longitudinal investigations applied to RME treated with the drug.
At 1 day, linear µCT measurements did not demonstrate a significant difference between the groups that received RME. Probably, as it is the lowest point of the suture, there was greater variation in the confidence interval (CI) because it is the point closest to the device installation, which suffered the greatest tension. These findings corroborate the study by Takenouchi et al. [35], which quantitatively and longitudinally evaluated the palatal suture after RME in µCT in vivo, with experimental periods that varied from 0 to 24 days. In the mentioned work, it was observed that the lowest analysis points also suffered greater linear variations over time. The author reports that the recovering palatal suture first undergoes bone reabsorption until the twelfth day, and then bone apposition occurs until its closure. Therefore, a significant increase in linear measurements at the lowest point is expected. Furthermore, the study discusses the need for approximately more than thirty days to restore complete bone mass in the expanded suture. Considering that the present research has a total experimental period of 25 days, it is possible to infer that in the points where no statistical differences were evidenced, bone mass was already in possible recovery.
Regarding bone volume fraction (BV/TV), the SVT group had significantly greater bone volume than the CT group. Thus, it was possible to observe that simvastatin had the ability to decrease the bone resorption process in the suture region, providing greater bone volume. These findings corroborate the work by Chalisserry et al. [36], who demonstrated, in a critical-size defect in a rabbit femoral condyle, that the bone volume was significantly greater in defects filled with local simvastatin. In studies to determine treatment efficiency, this fraction represents a quantitative osteoblast response for bone formation and osteoclasts for the bone resorption of mineralized structures [37].
The microtomographic parameter analysis showed that the cortical bone area (Ct.Ar) and the cortical area fraction (Ct.Ar/Tt.Ar) of the groups that underwent RME were significantly greater. These results, when confronted with the studies by Rocabado J.M.R. et al. [38], who applied these parameters to the femoral metaphysis in osteoporotic rats, are in agreement. Cortical bone thickness (Ct.Th) was correlated by Dietrich Von Stechow et al. [39] in a study with ovariectomized rats compared with samples treated with 10 mg/kg of simvastatin orally. Therefore, it did not demonstrate a significant difference between the experimental groups. On the contrary, the present study evidenced a significant difference between all groups; in particular, the SVT group presented higher Ct.Th than the CT group. However, any correlation must be considered with caution since, in image processing studies, the microtomographic slice size and the area of interest of each experimental design are relevant for bone structure quantification.
The histological slides study of the midpalatal suture did not demonstrate any pathological alteration, such as an exacerbated inflammatory process. In a study that investigated the local administration of simvastatin, the group treated with this drug showed a significant reduction in bone resorption activity, with alveolar bone presenting a smoother and more uniform surface [13]. Comparatively, our work presented histological slides that showed great cellular activity in the CT group to the detriment of the SVT group. A continual proliferation and bone remodeling occurred in the suture, marked by intense clastic cellular activity in the CT group. In contrast, a more discreet cellular activity was found in the group treated with simvastatin, with the presence of occasional osteoclasts. However, we emphasize the importance of further immunohistochemical studies that can better elucidate the cell signaling process that occurs in the expanded suture treated with this substance.
In immunohistochemical staining studies to assess TGF-β activity in response to RME, this signaling has been reported to occur through the connective tissue in the region of the expanded palatal suture [21]. Endothelial cells located within the blood vessels, osteoblasts in the osteogenic zone and fibroblasts in the connective tissue were found. In the present research, the mechanical force during the expansion process probably induced the migration of osteogenic cells to the suture. Therefore, there was a proliferation and continuous remodeling of the bone between the suture, marked by an intense cellular activity of clastic cells in the CT group. In contrast, a more discrete cellular activity was found in the group treated with simvastatin, with the presence of occasional osteoclasts. The bone tissue evaluated revealed that when comparing the groups that underwent RME, the CT group presented a denser form of clastic cells. However, while immunohistochemistry studies were a limitation in the present research, we emphasize the importance of this method to better elucidate the cell signaling process that occurs in the expanded suture treated with this substance.
Given the above, we can show that the data from the CT group, by presenting greater linear measurements of P2 and P3, SD and DI in the µCT images, corroborate the smaller bone volume interpretation. Therefore, it is possible to infer that when we have more space in the suture region, we have less bone volume in the region. On the contrary, considering that the CT and SVT groups were expanded with the same device design, it is observed that the measures presented for DI, SD, P2 and P3 in the SVT group were comparatively smaller; thus, it is justified that this group presents greater bone volume.

5. Conclusions

In the present study, the effect of simvastatin systemic administration after RME was evaluated using µCT images for microtomographic parameter extraction and histomorphometric analysis in cortical bone. The samples treated with this drug showed, in the descriptive analysis, greater regularity in the bone surface radiographic density when compared to the CT group. This description was corroborated by the microtomographic parameter extraction, which showed a greater intermingled bone volume (BV/TV), cortical bone area fraction (Ct.Ar/Tt.Ar) and cortical thickness (Ct. Th) in the SVT group compared to the CT group. Additionally, in the linear measurement, it was verified that the CT group had greater measurements at points P1 to P4 compared to the SVT group. Furthermore, the histomorphometric analysis showed intense cellular activity of clastic cells in the CT group and a more discreet activity in the SVT group. Therefore, the analyses carried out evidenced that the samples treated with simvastatin presented an osteoinductive potential compared to those samples from the CT group. However, we emphasize the importance of further immunohistochemical studies that can elucidate the cell signaling process that occurs in the expanded suture treated with this drug. Likewise, studies with µCT in vivo allowed for a longitudinal evaluation of the drug effect in different time frames in the same sample.

Author Contributions

Conceptualization, J.R.B.N. and J.d.A.C.-M.; methodology, J.R.B.N., I.L., S.C.S., A.T.N.N.A., C.M.S.d.F.F.d.S., C.F.M., M.D.C.-M. and J.d.A.C.-M.; software, J.R.B.N., I.L., C.M.S.d.F.F.d.S. and R.T.L.; formal analysis, J.R.B.N., S.C.S. and C.M.S.d.F.F.d.S.; investigation, J.R.B.N., S.C.S., K.J., I.D. and J.d.A.C.-M.; resources, R.T.L., K.J., I.D., C.F.M. and M.D.C.-M.; data curation, J.R.B.N. and I.L.; writing—original draft preparation, J.R.B.N.; writing—review and editing, C.F.M., M.D.C.-M. and M.D.C.-M.; visualization, J.R.B.N., S.C.S., K.J., I.D. and J.d.A.C.-M.; supervision, M.D.C.-M. and J.d.A.C.-M. All authors have read and agreed to the published version of the manuscript.

Funding

This research received no external funding.

Institutional Review Board Statement

The research protocol for this work was approved by the Federal Fluminense University Ethics Committee on Animal Use (CEUA/UFF) under the number CEUA 5072191118.

Informed Consent Statement

Not applicable.

Data Availability Statement

The data presented in this study are available on request from the corresponding author. The data are not publicly available due to ethical restrictions.

Conflicts of Interest

The authors declare no conflicts of interest.

References

  1. da Luz Baratieri, C.; Alves, M., Jr.; Mattos, C.T.; Lau, G.W.; Nojima, L.I.; de Souza, M.M. Trans verse effects on the nasomaxillary complex one year after rapid maxillary expansion as the only intervention: A controlled study. Dent. Press J. Orthod. 2014, 19, 79–87. [Google Scholar] [CrossRef] [PubMed]
  2. de Julián-López, C.; Veres, J.; Marqués-Martínez, L.; García-Miralles, E.; Arias, S.; Guinot-Barona, C. Upper airway changes after rapid maxillary expansion: Three-dimensional analyses. BMC Oral Health 2023, 23, 618. [Google Scholar] [CrossRef] [PubMed]
  3. Fastuca Ry Colaboradores. Airway compartments volumen and oxygen saturation changes after rapid maxillary expansion: A longitudinal correlation study. Angle Orthod. 2015, 6, 955–961. [Google Scholar]
  4. Lima Filho, R.M.A.; Ruellas, A.C.O. Long-term maxillary changes in patients with skeletal Class II malocclusion treated with slow and rapid palatal expansion. Am. J. Orthod. Dentofac. Orthop. 2008, 134, 383–388. [Google Scholar] [CrossRef] [PubMed]
  5. de Almeida, A.M.; Ozawa, T.O.; Alves, A.C.M.; Janson, G.; Lauris, J.R.P.; Ioshida, M.S.Y.; Gari, D.G. Slow versus rapid maxillary expansion in bilateral cleft lip and palate: A CBCT randomized clinical trial. Clin. Oral Investig. 2017, 21, 1789–1799. [Google Scholar] [CrossRef] [PubMed]
  6. Gill, D.; Naini, F.; Mcnally, M.; Jones, A. The Management of Transverse Maxillary Deficiency. Dent. Update 2004, 31, 516–523. [Google Scholar] [CrossRef] [PubMed]
  7. Golpasandhagh, L.; Samie, N.; Sabiza, S.; Rezaie, A. Histopathological evaluation of the effect of melatonin gel on bone regeneration in rat model. J. Indian Soc. Periodontol. 2023, 27, 368–373. [Google Scholar] [CrossRef]
  8. Bhattarai, G.; Poudel, S.B.; Kook, S.H.; Lee, J.C. Resveratrol prevents alveolar bone loss in an experimental rat model of periodontitis. Acta Biomater. 2016, 29, 398–408. [Google Scholar] [CrossRef]
  9. Ozec, I.; Kilic, E.; Gumus, C.; Goze, F. Effect of local simvastatin application on mandibular defects. J. Craniofac. Surg. 2007, 18, 546–550. [Google Scholar] [CrossRef]
  10. Giroux, L.M.; Davignon, J.; Naruszewicz, M. Simvastatin inhibits the oxidation of low-density lipoproteins by activated human monocyte-derived macrophages. Biochim. Biophys. Acta 1993, 1165, 335–338. [Google Scholar] [CrossRef]
  11. Davignon, J.; Laaksonen, R. Low-density lipoprotein-independent effects of statins. Curr. Opin. Lipidol. 1999, 10, 543–559. [Google Scholar] [CrossRef] [PubMed]
  12. Jain, M.K.; Ridker, P.M. Anti-inflammatory effects of statins: Clinical evidence and basic mechanisms. Nat. Rev. Drug Discov. 2005, 4, 977–987. [Google Scholar] [CrossRef] [PubMed]
  13. Han, G.; Chen, Y.; Hou, J.; Liu, C.; Chen, C.; Zhuang, J.; Meng, W. Effects of simvastatin on relapse and remodeling of periodontal tissues after tooth movement in rats. Am. J. Orthod. Dentofac. Orthop. 2010, 138, 550.e1–550.e7. [Google Scholar] [CrossRef]
  14. Mundy, G.; Garret, R.; Harris, S.; Chan, J.; Chen, D.; Rossini, G.; Boyce, B.; Zhao, M.; Gutierrez, G. Stimulation of bone formation in vitro and in rodents by statins. Science 1999, 286, 1946–1949. [Google Scholar] [CrossRef] [PubMed]
  15. Vasconcelos, J.W.; Leite, L.M.S.; Vasconcelos, G.A.; Araujo, I.M.S.M.; Ferro, L.S.G. Evaluation of simvastatin in the process of fracture consolidation in rat tibias. Rev. Bras. Ortop. 2013, 48, 191–195. [Google Scholar] [CrossRef]
  16. Yasuda, H. Discovery of the RANKL/RANK/OPG system. J. Bone Miner. Metab. 2021, 39, 2–11, Erratum in J. Bone Miner. Metab. 2021, 39, 12. [Google Scholar] [CrossRef]
  17. Udagawa, N.; Koide, M.; Nakamura, M.; Nakamichi, Y.; Yamashita, T.; Uehara, S.; Kobayashi, Y.; Furuya, Y.; Yasuda, H.; Fukuda, C.; et al. Osteoclast differentiation by RANKL and OPG signaling pathways. J. Bone Min. Metab. 2021, 39, 19–26. [Google Scholar] [CrossRef]
  18. Liu, W.; Zhang, X. Receptor activator of nuclear factor-κB ligand (RANKL)/RANK/osteoprotegerin system in bone and other tissues (review). Mol. Med. Rep. 2015, 11, 3212–3218. [Google Scholar] [CrossRef]
  19. Maeda, T.; Kawane, T.; Horiuchi, N. Statins augment vascular endothelial growth factor expression in osteoblastic cells via inhibition of protein prenylation. Endocrinology 2003, 144, 681–692. [Google Scholar] [CrossRef]
  20. Arnez, M.F.M.; Ribeiro, L.S.N.; Barreto, G.D.; Monteiro, P.M.; Ervolino, E.; Stuani, M.B.S. RANK/RANKL/OPG Expression in Rapid Maxillary Expansion. Braz. Dent. J. 2017, 28, 296–300. [Google Scholar] [CrossRef]
  21. Sawada, M.; Shimizu, N. Stimulation of bone formation in the expanding mid-palatal suture by transforming growth factor-β1 in the rat. Eur. J. A/Orthod. 1996, 18, 169–179. [Google Scholar] [CrossRef]
  22. Saito, S.; Shimizu, N. Stimulatory effects of low-power bone regeneration in midpalatal expansion in the rat. Am. J. Orthod. Dentofac. Orthop. 1997, 111, 525–532. [Google Scholar] [CrossRef] [PubMed]
  23. Sales, E.; Lima, I.; de Assis, J.T.; Gómez, W.; Pereira, W.C.; Lopes, R.T. Bone quality analysis using X-ray microtomography and microfluorescence. Appl. Radiat. Isot. 2012, 70, 1272–1276. [Google Scholar] [CrossRef] [PubMed]
  24. Andersen, M.L.; Costa, R.M.; Angelis, K.; Braga, L.M.G.M.; Souza, R.L.; Sebben, A.; Montenegro, M.M.V.; Silveira, L.F.; Nishioka, S.A.; Rodrigues, M.A.C.; et al. Normativas do CONCEA para a Produção, Manutenção ou Utilização Animal em atividades de Ensino ou Pesquisa Científica. Leis, Decretos, Portarias, Resoluções Normativas e Orientações técnicas. 3ª Edição. Brasília, 26 de Setembro de 2016. Available online: https://www.ceua.ufv.br/wp-content/uploads/2018/08/NORMATIVAS-DO-CONCEA-3%C2%AA-EDI%C3%87%C3%83O2.pdf (accessed on 15 March 2023).
  25. Kilkenny, C.; Brown, W.J.; Cuthill, I.C.; Emerson, M.; Altman, D.G. Improving bioscience research reporting: The ARRIVE guidelines for reporting animal research. Vet. Clin. Pathol. 2012, 41, 24–31. [Google Scholar] [CrossRef]
  26. Smith, A.J.; Clutton, R.E.; Lilley, E.; Hansen, K.E.A.; Brattelid, T. PREPARE: Guidelines for planning animal research and testing. Lab Anim. 2018, 52, 135–141. [Google Scholar] [CrossRef] [PubMed]
  27. Nascimento, J.R.B.; Sartoretto, S.C.; Alves, A.T.N.N.; Mourão, C.F.A.B.; Martinez-Zelaya, V.R.; Uzeda, M.J.; Granjeiro, J.M.; Montemezzi, P.; Calasans-Maia, M.D.; Calasans-Maia, J.A. In vitro In Vivo Evaluation of Nanostructured Biphasic Calcium Phosphate in Granules Putty Configurations. Int. J. Environ. Res. Public Health 2021, 18, 533. [Google Scholar] [CrossRef]
  28. Vieira, G.M.; Chaves, S.B.; Ferreira, V.M.M.; Freitas, K.M.S.; Amorim, R.F.B.V. The effect of simvastatin on relapse of tooth movement and bone mineral density in rats measured by a new method using microtomography. Acta Cirúrgica Bras. 2015, 30, 319–327. [Google Scholar] [CrossRef]
  29. Calasans-Maia, J.A.; Calasans-Maia, M.D.; Stuani, M.B.S.; Alves, A.T.N.N.; Montemezzi, P.; Mourão, C.F.A.B.; Cal-Neto, J.O.A.P.; Ruellas, A.C.O. In vivo biological evaluation of orthodontically moved incisors after replantation. Medicina 2020, 56, 421. [Google Scholar] [CrossRef]
  30. Bouxsein, M.L.; Boyd, S.K.; Christ, B.A.; Guldberg, R.E.; Jepsen, K.J.; Müller, R. Guidelines for assessment of bone microstructure in rodents using micro-computed tomography. J. Bone Miner. Res. 2010, 25, 1468–1486. [Google Scholar] [CrossRef]
  31. Doube, M.; Kłosowski, M.M.; Arganda-Carreras, I.; Cordelières, F.P.; Dougherty, R.P.; Jackson, J.S.; Schmid, B.; Hutchinson, J.R.; Shefelbine, S.J. BoneJ: Free extensible bone image analysis in ImageJ. Bone 2010, 47, 1076–1079. [Google Scholar] [CrossRef]
  32. Quinn, R.D.V.M. Comparing rat’s to human’s age: How old is my rat in people years? Editor. Opin./Nutr. 2005, 21, 775–777. [Google Scholar] [CrossRef] [PubMed]
  33. Storey, E. Tissue response to the movement of bones. Am. J. Orthod. 1973, 64, 229–247. [Google Scholar] [CrossRef] [PubMed]
  34. Zhao, S.; Yu, S.; Zhu, D.; Dai, L.; Yang, P.; Xing, X. Stimulatory effects of simvastatin on bone regeneration of the expanded suture in rats. Am. J. Transl. Res. 2020, 12, 1767–1778. [Google Scholar] [PubMed]
  35. Takenouchi, H.; Mayahara, K.; Arai, Y.; Karasawa, Y.; Shimizu, N. Longitudinal quantitative evaluation of the mid-palatal suture after rapid expansion using in vivo micro-CT. Arch. Oral Biol. 2014, 59, 414–423. [Google Scholar] [CrossRef] [PubMed]
  36. Chalisserrya, E.P.; Nama, S.Y.; Anilc, S. Simvastatin Loaded Nano Hydroxyapatite in Bone Regeneration: A Study in the Rabbit Femoral Condyle. Curr. Drug Deliv. 2019, 16, 530–537. [Google Scholar] [CrossRef]
  37. Mohamad, N.S.; Sinadinos, A.; Górecki, D.C.; Zioupos, P.; Tong, J. Impact of P2RX7 ablation on the morphological, mechanical and tissue properties of bones in a murine model of duchenne muscular dystrophy. J. Biomech. 2016, 49, 3444–3451. [Google Scholar] [CrossRef]
  38. Rocabado, J.M.R.; Kaku, M.; Nozaki, K.; Ida, K.; Kitami, M.; Aoyagi, Y.; Uoshima, K. A multi-factorial analysis of bone morphology and fracture strength of rat femur in response to ovariectomy. J. Orthop. Surg. Res. 2018, 13, 318. [Google Scholar] [CrossRef]
  39. Stechow, D.V.; Fish, S.; Yahalom, D.; Bab, I.; Chorev, M.; Müller, R.; Alexander, J.M. Does simvastatin stimulate bone formation in vivo? BMC Musculoskelet. Disord. 2003, 4, 8. [Google Scholar] [CrossRef]
Figure 1. Experimental schedule.
Applsci 14 00430 g001
Figure 2. Orthodontic device Installation. (A) Making the aperture for adaptation; (B) prophylaxis with pumice stone; (C) acid etching; (D) photoactivation; (E) diastema opening of 1.5 mm; and (F) device installed.
Applsci 14 00430 g002
Figure 3. µCT analysis. (A) Axial section. Points measurement (P1, P2, P3 and P4); (B) sagittal section. ROI: BV/TV index: 2.7 mm × 0.9 mm × 0.3 mm; (C) ROI format. ROI: region of interest.
Applsci 14 00430 g003
Figure 4. Linear measurement of points (A) P1; (B) P2; (C) P3; (D) P4. The mean palatal suture expansion (mm) at 4 points (P1, P2, P3 and P4). The results are presented as mean ± confidence interval (n = 5). The P1 and P4 values did not pass the Shapiro–Wilk Normality test and were evaluated in the Log of Y format. The horizontal bars represent statistical difference between the groups (One-Way ANOVA and Tukey post-test; p < 0.05).
Applsci 14 00430 g004
Figure 5. SD (A) and DI (B) in mm. The results are presented as mean ± confidence interval (n = 5). The SD values did not pass the Shapiro–Wilk Normality test and were evaluated in the Log of Y format. The DI values passed the normality test. Horizontal bars represent statistical differences between groups (one-way ANOVA and Tukey post hoc test; p < 0.05).
Applsci 14 00430 g005
Figure 6. Bone volume fraction (BV/TV) and empty space (EV) segmentation: (A,D) ROI showing the entire suture region of the HG group; (B,F) ROI showing the entire suture region of the CT group; (C,H) ROI showing the entire suture region of the SVT group; (E,G,I) reconstruction of the empty space. HG: healthy; CT: Control; SVT: Simvastatin; ROI: region of interest; micrometer bar in micromillimeters (µm).
Applsci 14 00430 g006
Figure 7. Intervening bone tissue percentage (A) and palatine suture connective tissue volume (B). Results are presented as mean ± confidence interval (n = 5). Values were considered normal (Shapiro–Wilk test). Statistical differences are expressed by horizontal bars (one-way ANOVA and Tukey’s post hoc test; p < 0.05).
Applsci 14 00430 g007
Figure 8. HG Group. Central portion a narrow band of connective tissue bordered by mature cortical bone. Photomicrograph: (A) 10× objective (500 µm): palatine suture; (B) 20× objective (100 µm): periodontal ligament area; (C) 40× objective (200 µm): palatine suture at higher magnification. DT: tooth; LP: periodontal ligament; SP: palatine suture; and TC: connective tissue.
Applsci 14 00430 g008
Figure 9. CT Group Photomicrograph. Presence of fibrocellular connective tissue in abundance, absence of inflammatory infiltrate in the palatine suture center and restricted presence of newly formed bone on the margins of the suture ends: (A) 10× objective (500 µm); (B) 20× objective (50 µm): Palatal suture area; (C) 40× objective (50 µm): ON Presence; (D) 40× objective (50 µm): OB Paving. DT: Tooth; LP: Periodontal ligament; SP: Palatal suture; TC: Connective tissue; OB: Osteoblasts; Osteoclast (black arrow); Osteocytes (blue arrow); OC: Cortical bone; ON: Newly formed bone; Yellow arrow: Reversal lines.
Applsci 14 00430 g009
Figure 10. SVT Group Photomicrograph. Presence of fibrocellular connective tissue as a potential signal of cells that participate in the process of bone deposition and apposition and mechanisms of bone resorption and new formation: (A) 10× objective (500 µm): Palatine suture; (B) 40× objective (50 µm): Periodontal ligament Area; (C) 20× objective (200 µm): ON Presence and OB paving; (D) 50× objective (50 µm): Palatine suture at higher magnification. DT: Tooth; LP: Periodontal ligament; SP: Palatal suture; TC: Connective tissue; OB: Osteoblasts; OC: Osteoclast; ON: Newly formed bone; Yellow arrow: Reversal lines; Black arrow: OB Paving; Blue Arrow: Osteocyte.
Applsci 14 00430 g010
Table 1. Bone volume of each experimental group.
HealthyControlSimvastatin
BV0.649 ± 0.0110.577 ± 0.0200.616 ± 0.011
TV0.7280.7280.728
BV/TV0.892 ± 0.016 *0.788 ± 0.021 **0.847 ± 0.017 ***
EV0.078 ± 0.0110.150 ± 0.0200.111 ± 0.011
%BV/TV89.26078.8884.700
* Mean difference is significant between healthy and control (p < 0.05). ** Mean difference is significant between control and simvastatin (p < 0.05). *** Mean difference is significant between healthy and simvastatin (p < 0.05).
Table 2. Microtomographic parameters of each experimental group.
HealthyControlSimvastatin
Ct.Ar (mm2)0.735 ± 0.064 *0.686 ± 0.023 **0.715 ± 0.006
Ct.Ar/Tt.Ar(%)90.800 ± 0.774 *84.580 ± 2.511 **88.040 ± 0.602 ***
Ct.Th (mm3)0.906 ± 0.044 *0.649 ± 0.009 **0.818 ± 0.066 ***
* Mean difference is significant between healthy and control (p < 0.05). ** Mean difference is significant between control and simvastatin (p < 0.05). *** Mean difference is significant between healthy and simvastatin (p < 0.05).
Disclaimer/Publisher’s Note: The statements, opinions and data contained in all publications are solely those of the individual author(s) and contributor(s) and not of MDPI and/or the editor(s). MDPI and/or the editor(s) disclaim responsibility for any injury to people or property resulting from any ideas, methods, instructions or products referred to in the content.

