Article

Moisture Sorption Behavior of Deproteinized Sunflower Meal and Patterned Food Extrudate

by
Mariya A. Dushkova
1,
Apostol T. Simitchiev
2,
Hristo R. Kalaydzhiev
3,
Petya Ivanova
4,
Nikolay D. Menkov
1,* and
Vesela I. Chalova
4
1
Department of Process Engineering, University of Food Technologies, 26 Maritsa Blvd, 4002 Plovdiv, Bulgaria
2
Department of Machines and Apparatuses for Food Industry, University of Food Technologies, 26 Maritsa Blvd, 4002 Plovdiv, Bulgaria
3
Department of Analytical Chemistry and Physical Chemistry, University of Food Technologies, 26 Maritsa Blvd, 4002 Plovdiv, Bulgaria
4
Department of Biochemistry and Molecular Biology, University of Food Technologies, 26 Maritsa Blvd, 4002 Plovdiv, Bulgaria
*
Author to whom correspondence should be addressed.
Appl. Sci. 2024, 14(1), 65; https://doi.org/10.3390/app14010065 (registering DOI)
Submission received: 27 November 2023 / Revised: 18 December 2023 / Accepted: 19 December 2023 / Published: 20 December 2023
(This article belongs to the Section Food Science and Technology)

Abstract

:
This research was undertaken to evaluate the influence of the extrusion process on the sorption behavior of deproteinized sunflower meal (DSM). A patterned food extrudate (PFE), prepared from a mixture of DSM and corn grits (1:1), was obtained, and the equilibrium isotherms of both products (DSM and PFE) were determined at three temperatures (20 °C, 30 °C, and 40 °C) by the static gravimetric method. The comparison of the sorption behavior of the products showed that extrusion decreased the equilibrium moisture content and the monolayer moisture, while the hysteresis effect was significantly raised in size and span. The experimental sorption isotherms were fitted by five modified models including the temperature effect: Chung–Pfost, Halsey, Oswin, Henderson, and GAB. The modified models of Oswin were established to be suitable to describe the equilibrium sorption isotherms in the temperature range from 20 °C to 40 °C. The net isosteric heat of sorption of DSM and PFE decreases consistently with the increase in moisture content. Extrusion reduces the bond energy between the solid matrix and the water molecules. The ranges of moisture content and relative humidities in the temperature interval studied, appropriate for long-term storage of DSM and PFE, were predicted.

1. Introduction

The increase in demand for food due to the rise of the world population has led to the production of substantial numbers of by-products [1]. The incomplete use and accumulation of these by-products have a negative economic, environmental, and social impact [2]. By-products of food processing are rich in protein, fibers, and bioactive compounds such as phenolic substances, minerals, antioxidants, and vitamins [3,4,5,6].
Sunflower meal is a by-product from oil production with higher nutritional value compared to other by-products such as cottonseed, rapeseed, and soybean meals [7]. It is rich in proteins, essential amino acids, minerals, fibers, and polyphenols such as chlorogenic acid [8]. Numerous studies exist for the production of protein isolates from meals [9]. For example, the authors in Ref. [10] used an alkaline extraction of sunflower meal and estimated that the deproteinized sunflower meal residue was rich in dietary fibers.
Extrusion is one of the potential processes used for the utilization of oilseed by-products like defatted flaxseed meal [11], cottonseed meal [12], canola meal [13], and sesame protein concentrate [14]. High-temperature–high-pressure treatment is also used to utilize the sunflower meal after mixing with starch-based grits [15,16]. According to Ref. [17], the extruded snacks produced with food by-products have positive economic sustainability and an environmental impact. The authors in Ref. [13] established that extrusion leads to a decrease in the antinutritional polyphenols of cold-press oilseed cakes, including chlorogenic acid in sunflower cakes.
The quality, stability, and physico-chemical properties of sunflower meal and its deproteinized derivatives such as DSM and extrudates are related to their moisture content and depend on the conditions of storage (temperature and relative humidity of the air) [18,19,20,21]. The equilibrium moisture content (EMC) of each product depends in a different way on the temperature and humidity conditions [22]. The net isosteric heat of sorption indicates the bond energy between water molecules and the adsorbent surface. There is a lack of experiments on the sorption behavior of DSM and the effect of extrusion on the sorption capacity of the extruded product. There are insufficient data for net isosteric heat of sorption of extruded products.
This research was carried out to evaluate the equilibrium moisture sorption behavior of DSM and a PFE at several temperatures and air equilibrium relative humidity (Rh), as well as the suitable conditions for long-term storage of both products.

2. Materials and Methods

2.1. Preparation of DSM

DSM was prepared with industrially produced sunflower meal procured from Biser Oliva AD (Stara Zagora, Bulgaria), as previously described [10]. An aqueous ethanol solution (75%) was used for washing 4 times the meal [23] followed by a protein extraction with aqueous solution of NaOH (pH 12) at 40 °C for 60 min under continuous agitation to separate the proteins [24]. The residue, obtained after filtration, was subjected to washing using distilled water (pH 7) up to a constant pH. Air drying was used for the ethanol-washed DSM followed by storage of the dried product in closed containers for the following analysis.

2.2. Preparation of PFE

2.2.1. Preliminary Investigations of Initial Mixture for Extrusion

Our preliminary investigations showed that it is not possible to perform extrusion of pure DSM because of the lack of starch and the high fiber content. The starch gelatinization is one of the main chemical transformations during extrusion. Usually, extrusion is applied for raw materials with high starch content [25]. For this reason, for obtaining PFE, we made a mixture of DSM and corn grits (80% total carbohydrates, 8.8% total proteins, 1.6% total fibers, and 1.2% total lipids), purchased by KrinaTM (Sofia, Bulgaria). The initial moisture content of the mixtures was w i n = 10 % w.b., measured by oven-drying method (24 h at 105 °C) [26]. An optimization to establish the ratio of DSM to corn grits (1:1.5, 1:1, and 1.5:1) and the moisture content of the mixture (14, 16, 18, and 20% w.b.) was made. Distilled water was added to the initial mixture to achieve the desired moisture contents (wd, % w.b.). The amount of added water (mw, g water/100 g product) was calculated by the following formula:
m w = w d w i n 100 w d · 100 ,
After 10 min of stirring, the mixtures were refrigerated at 5 °C for 12 h to equalize the moisture content. In order to prevent particle cohesion, the samples were manually homogenized for the second time. At a high level of DSM in the mixture, the expansion was unnoticeable or the extrusion was impossible, probably because of the low starch content. Thus, we established that an acceptable level of expansion (diameter expansion ratio 1.62) was obtained at a ratio of 1:1 and a moisture content of 18% w.b.
A single-screw [27] laboratory extruder (Brabender 20 DN, Duisburg, Germany) was used for the extrusion process. The extrusion parameters (working screw speed 200 min−1; feed screw speed 30 min−1; nozzle’s inner diameter 4 mm; temperatures in each of the zones in the extruder 130 °C, 150 °C, and 160 °C; screw compression ratio 3:1) were described in our previous investigation with deproteinized rapeseed meal [28]. The obtained extruded product was kept for 1 h at room temperature and packaged in polyethylene bags.

2.2.2. Sample Preparations for Adsorption and Desorption

Before the adsorption process, DSM and PFE were subjected to dehydration in a desiccator over P2O5 at an ambient temperature for 30 days before starting the experiments. Before the desorption process, samples of both products were subjected to hydration for 10 days in a desiccator over distilled water at an ambient temperature.

2.3. Determination of EMC

The equilibrium isotherms of both products were evaluated at three temperatures (20, 30, and 40 ± 0.1 °C) by adsorption and at one temperature (20 ± 0.1 °C) by desorption using the static gravimetric method applied for agri-food products [29]. For the creation of environments with defined constant relative humidities, saturated salts of analytical grade (LiCl, CH3COOK, MgCl2, K2CO3, NaBr, KI, NaCl, KCl) were chosen [30,31,32]. The preparation of the saturated salt solutions in 64 glass jars (0.58 L) was made with distilled water at 45–50 °C to reach supersaturation, followed by cooling to room temperature. The jars were kept in a temperature-controlled chamber at the above-mentioned temperature for two days before starting the experiment. Samples of 1 ± 0.2 g were weighed with analytical balance (Kern ABS 220-4N with an accuracy of 0.1 mg) in aluminum dishes in triplicate in every glass jar. Crystalline thymol was used in the glass jars to avoid microbial spoilage of the samples at high relative humidities (Rh > 0.60) [29]. The glass jars containing the samples were kept at the temperatures studied in the controlled chambers. The daily weighing of a sample was started after 30 days from the beginning of sorption experiments and continued until the achievement of a difference between two consecutive measurements that was less than 1 mg [33]. The period in which the samples achieved an equilibration was from 30 to 40 days. The oven method (105 °C for 24 h) was applied to determine the moisture content of each sample.

2.4. Data Analysis

Four three-parametric models including the effect of the temperature, as recommended by standard ASABE D245 [34], were tested with the experimental data to describe the sorption isotherms. The three-parameter GAB model recommended in the same standard describes single isotherms and does not include the influence of the temperature. A modified form of the three-parametric GAB model, developed in Ref. [35], involving the influence of the temperature was used. The advantage of the three-parametric models is that they are relatively easy to use and describe the sorption isotherms in the entire temperature interval studied. The following five modified models were applied:
Chung–Pfost:
l n ( R h ) = a t + b e x p c M ,
Halsey:
l n ( R h ) = e x p a + b t M c ,
Oswin:
M = a + b t R h 1 R h 1 c
Henderson:
l n ( 1 R h ) = a t + b M c ,
GAB:
M = a b c t R h 1 b R h 1 b R h + b c t R h
where M is the equilibrium moisture content, % d.b.; Rh is the equilibrium relative humidity, decimal; a, b, and c are coefficients; t is the temperature, °C.
A nonlinear regression program (Statistica 12.5, nonlinear estimation) was used to fit the experimental data to the isotherm models in order to determine the model parameters and the best model. The average relative error (ARE), the standard error of estimation (SEE), and the graphical analysis of the residuals (ri) were used as criteria for evaluating and comparing the models [35]:
Average relative error:
A R E = 100 N M i M ^ i M i ,
Standard error of estimation:
S E E = ( M i M ^ i ) 2 d f ,
Residuals:
r i = M i M ^ i ,
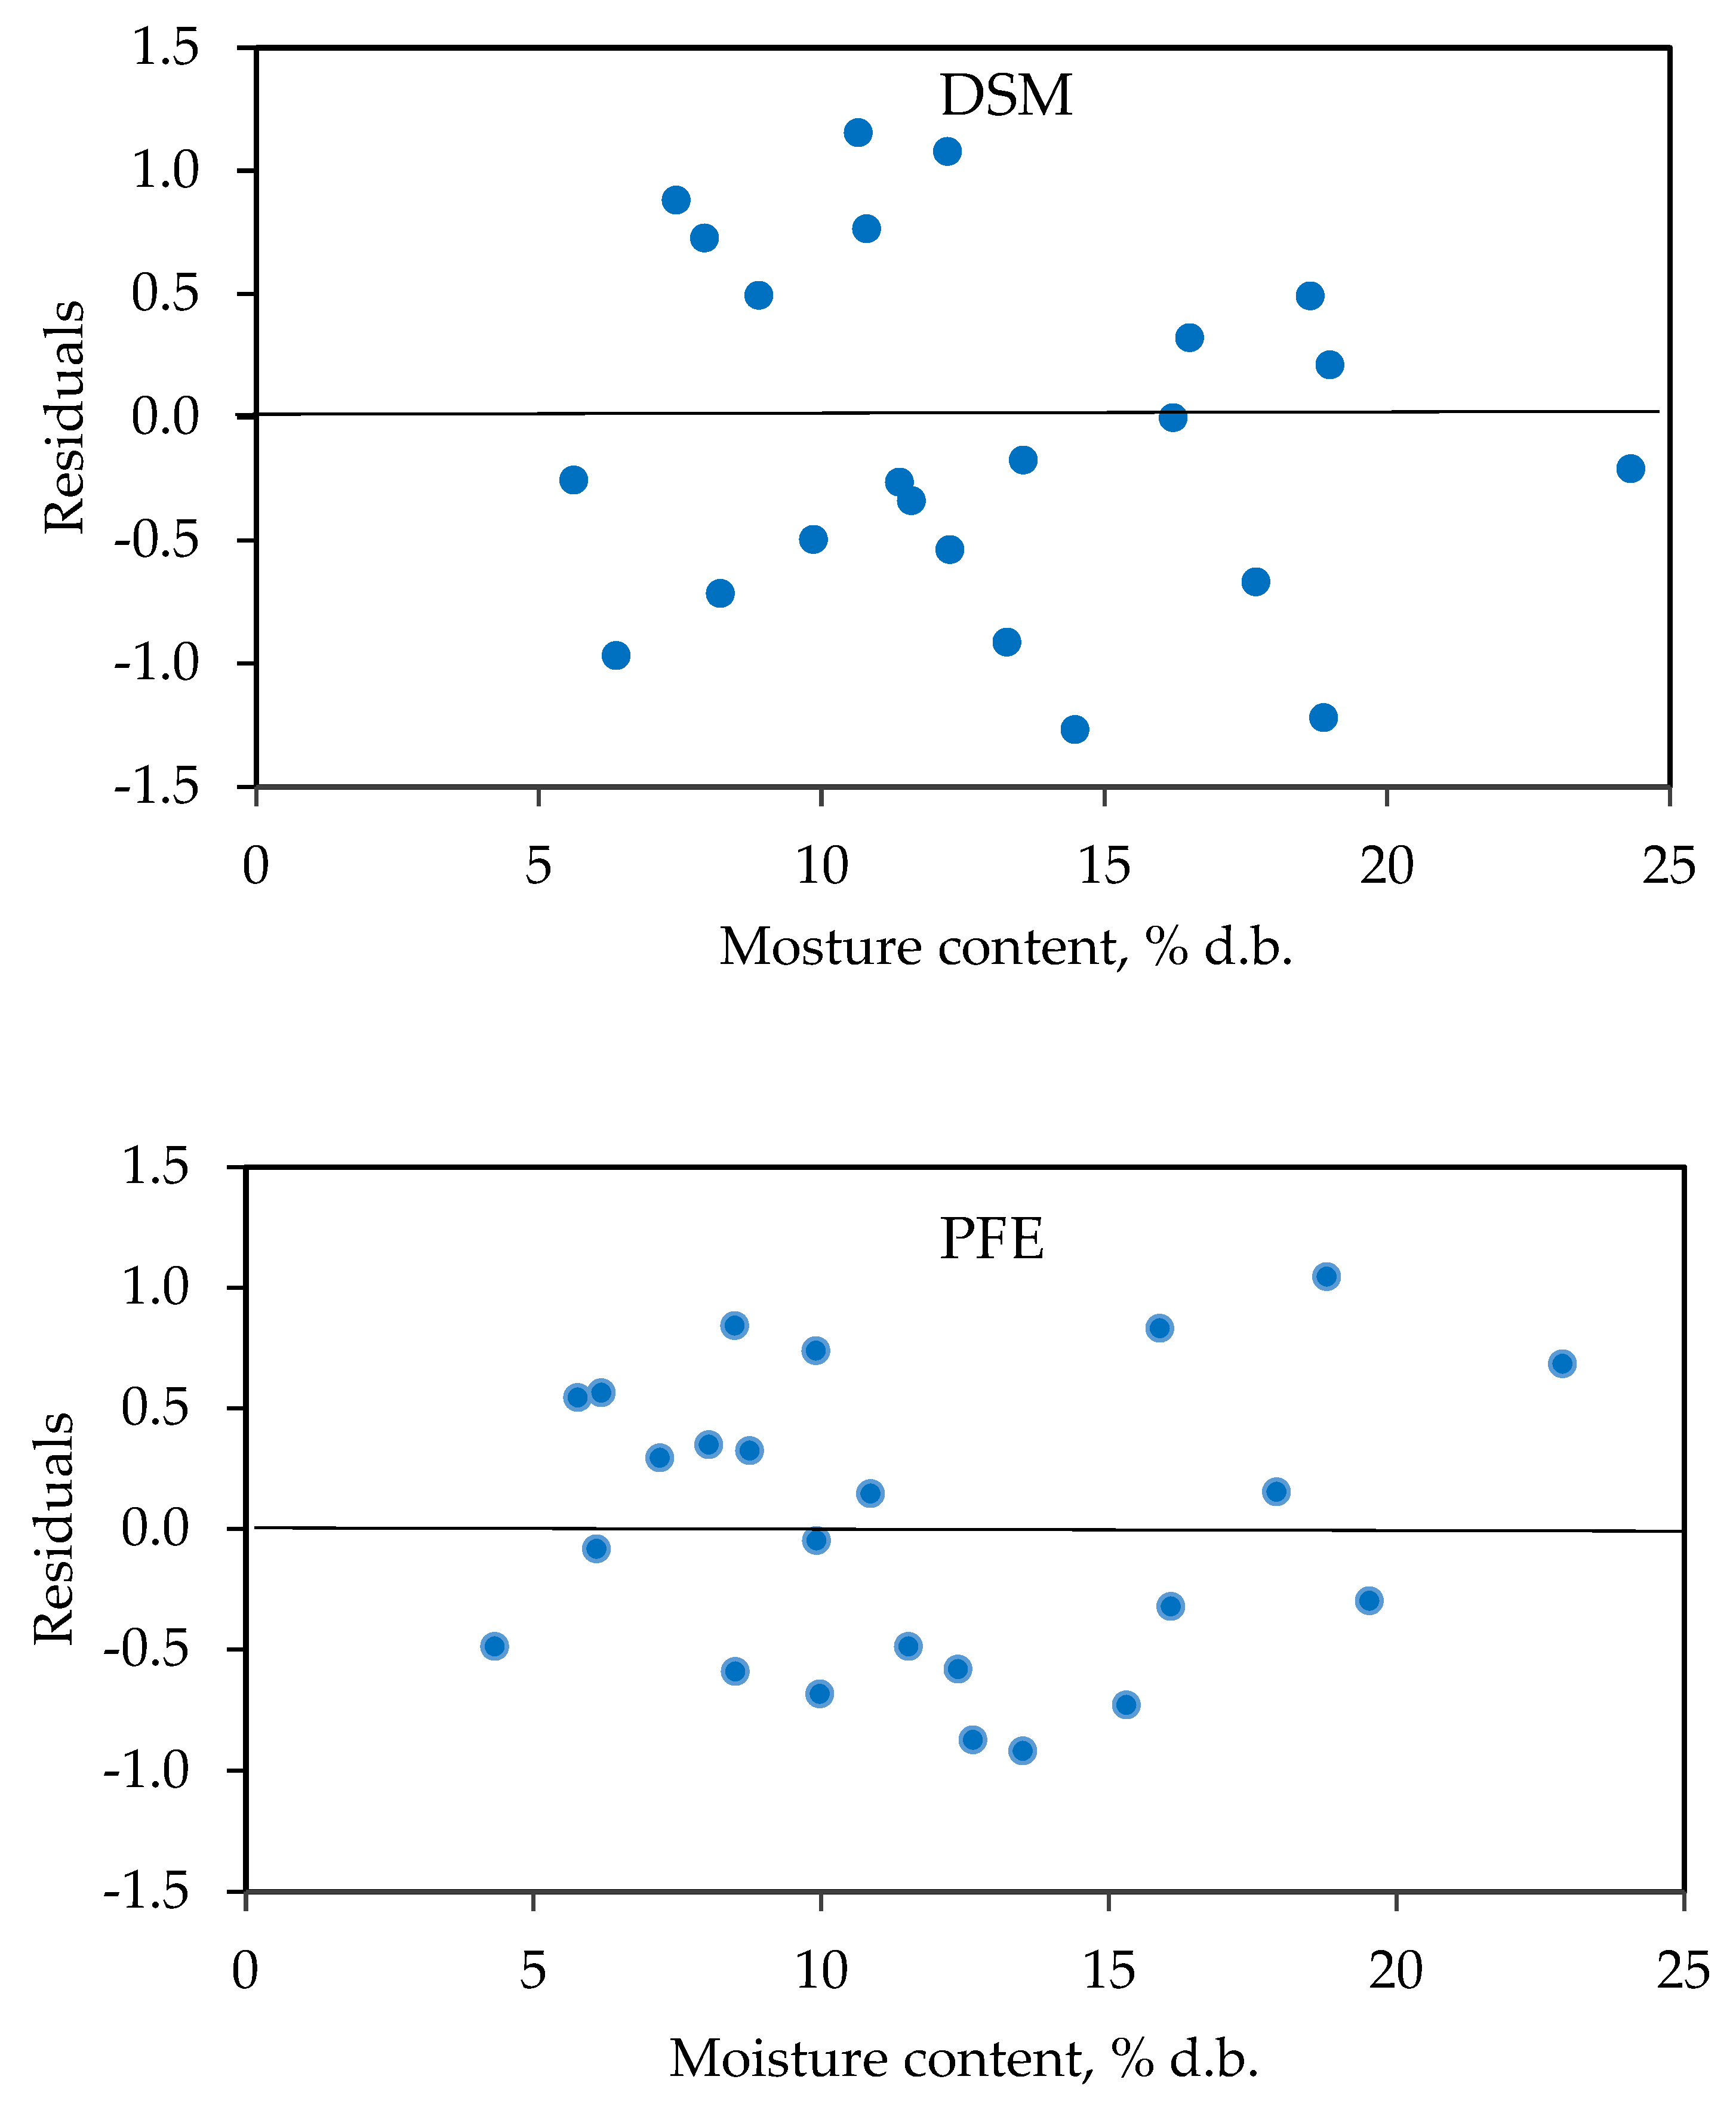
where Mi and M ^ i are, respectively, the equilibrium moisture content values experimentally observed and predicted by the model, N is the number of experimental data, and df is the degree of freedom (the difference between the number of experimental data and the number of the model’s constants). Plotting the residuals calculated for each model with its corresponding coefficients against the measured EMC allowed for a visual assessment of the distribution type (random or patterned). The models with patterned residuals were evaluated as not suitable [35].
The two-parameter BET model was applied to determine the monolayer moisture content (MMC).
BET:
M = M m c R h 1 R h 1 R h + c R h
where Mm is the MMC (% d.b.). We determined the Mm values for each temperature with the EMC values obtained for Rh < 0.45 from the BET equation according to the algorithm described in Ref. [31]. The three-parameter modified BET equation [36] was used to describe the effect of the temperature on the MMC:
Modified BET:
M = a + b t c R h 1 R h 1 R h + c R h ,
M m = a + b t ,
where a, b, and c are constants. The model coefficients were determined with experimental data up to Rh < 0.45 by the above-mentioned statistical program.

2.5. Determination of Net Isosteric Heat of Sorption

In equilibrium between the product and the surrounding air, the temperatures of the product and the air are equal. The relative humidity of the air is numerically equal to the water activity (aw) of the product (Rh = aw) because the water vapor pressures in the product and in the air are the same. The experimentally obtained equilibrium isotherms for several temperatures allowed calculation of the net heats of sorption of both products by the Clausius–Clapeyron equation [37]:
d [ l n ( a w ) ] d 1 T = q s t R ,
where T is the absolute temperature (K), qst is the net isosteric heat of sorption (kJ/mol), R is the universal gas constant (R = 8.314 J/(mol.K). Equation (13) was applied to the experimentally obtained isotherms at the working temperatures with the assumption that qst does not change with the temperature. The integration of Equation (13) leads to:
l n ( a w ) = q s t R 1 T + c o n s t ,
The natural logarithm of aw was plotted against the inverse of the corresponding absolute temperature (1/T) in order to establish the net isosteric heat of sorption, at a determined moisture content, and the regression straight line was plotted. The net isosteric heat of sorption was calculated from the slope of the straight line which equals qst/R. This procedure was followed for various moisture contents in order to determine the dependence of qst on the moisture content.

2.6. Statistical Analyses

The statistically significant differences between the EMC values of DSM and PFE, as well as between EMC values obtained by adsorption and desorption, were evaluated by Fisher’s exact test for comparison in pairs using ANOVA at a significance level of 0.05.

3. Results and Discussion

3.1. EMC for DSM and PFE

The mean values of the EMC of DSM and PFE at different relative humidities and temperatures studied during adsorption are presented in Table 1. EMC values raised with the increase in the relative humidity and the decrease in the temperature. The rise in the temperature increased the energy and mobility of water molecules [37,38]. This provoked the release of a higher number of molecules from the less active centers and thus resulted in a decrease in the EMC [39]. Similar trends for various biological materials were found in the literature [40], including for several extrudates [21,37].
The results obtained for the EMC of DSM are close to the literature data in Ref. [18] for sunflower meal from different varieties. This suggests that the deproteinization probably has little effect on the sorption behavior of the sunflower meal but it should be more closely researched experimentally for a more confirmative conclusion. The comparison of the data for the PFE and the published literature data for extrudate obtained from pure corn grits [41] showed a higher sorption ability of the PFE. This showed that the addition of DSM to the corn grits increased the sorption capacity of the extrudates.
The comparison of the EMC of both products demonstrated that the DSM had a higher sorption ability than the PFE at 20 °C and 30 °C for all relative humidities (p < 0.05). This is probably due to material degradation occurring at extrusion, where the applied heat and shear decrease the number of active sorption sites, thus provoking less water molecule adsorption. A similar effect was observed in Ref. [42] for starch–protein extrudates and in Ref. [43] for extrudates from corn meal and fruit pomaces compared to the initial grits. Furthermore, the extrusion process destroys the pathogenic microorganisms, which makes the extruded products appropriate for long-term storage [44]. The difference in the sorption behavior of the extrudate and DSM was not so clearly expressed at 40 °C, where there was no statistically significant difference for three relative humidities, namely, 0.201, 0.316, and 0.823 (p > 0.05).

3.2. Hysteresis Effect

Figure 1 presents the obtained experimental EMC after adsorption and desorption for DSM and PFE at 20 °C. All isotherms present the S-shaped character (type II according to Brunauer’s classification) typical for most foods [45] and consider the availability of multilayers at the internal surface of the product [46]. The hysteresis loop was distinctly expressed for the extruded product. A hysteresis was established in the region of relative humidities from 0.30 to 0.75, which is type III according to the classification in Ref. [47]. This type of hysteresis is characteristic of starchy foods [45,48] such as the PFE. The data demonstrated that the change of storage conditions in the range of the hysteresis of the extrudate (increase in relative humidity at a constant temperature) does not lead to a change in moisture.
A hysteresis loop was not established for the meal. No statistically significant difference was found between adsorption and desorption for six experimental points (p > 0.05). The increase in the relative humidity will lead to an increase in the moisture for the meal due to a lack of hysteresis effect.
The appearance of a hysteresis loop for the PFE is probably due to the gelatinization of starch and denaturation of proteins. During extrusion, new small pores appear in the melted structure which cannot be filled with the water molecules during adsorption [49,50].

3.3. Models Evaluation

The coefficients and the fitting criteria for the five three-parameter models are presented in Table 2 for DSM and Table 3 for PFE. For the DSM, the residual plots of modified Henderson and modified Halsey models were evaluated as patterned, which makes them unsuitable. The residual plots established for the modified models of Oswin, Chung–Pfost, and GAB showed a random distribution. The lowest values of ARE and SEE were obtained for the modified model of Oswin, which demonstrated the best fit. On the other hand, for PFE, the modified Chung–Pfost and the modified Halsey models were not found to be appropriate due to patterned residual plots. The residual plots determined for the modified models of Oswin, Henderson, and GAB showed a random distribution. The lowest values of ARE and SEE showed that the modified model of Oswin presented the best fit, which determined its further application for a description of sorption isotherms of DSM and PFE. Figure 2 shows the random residual plots of the modified Oswin model only.

3.4. Monolayer Moisture Content

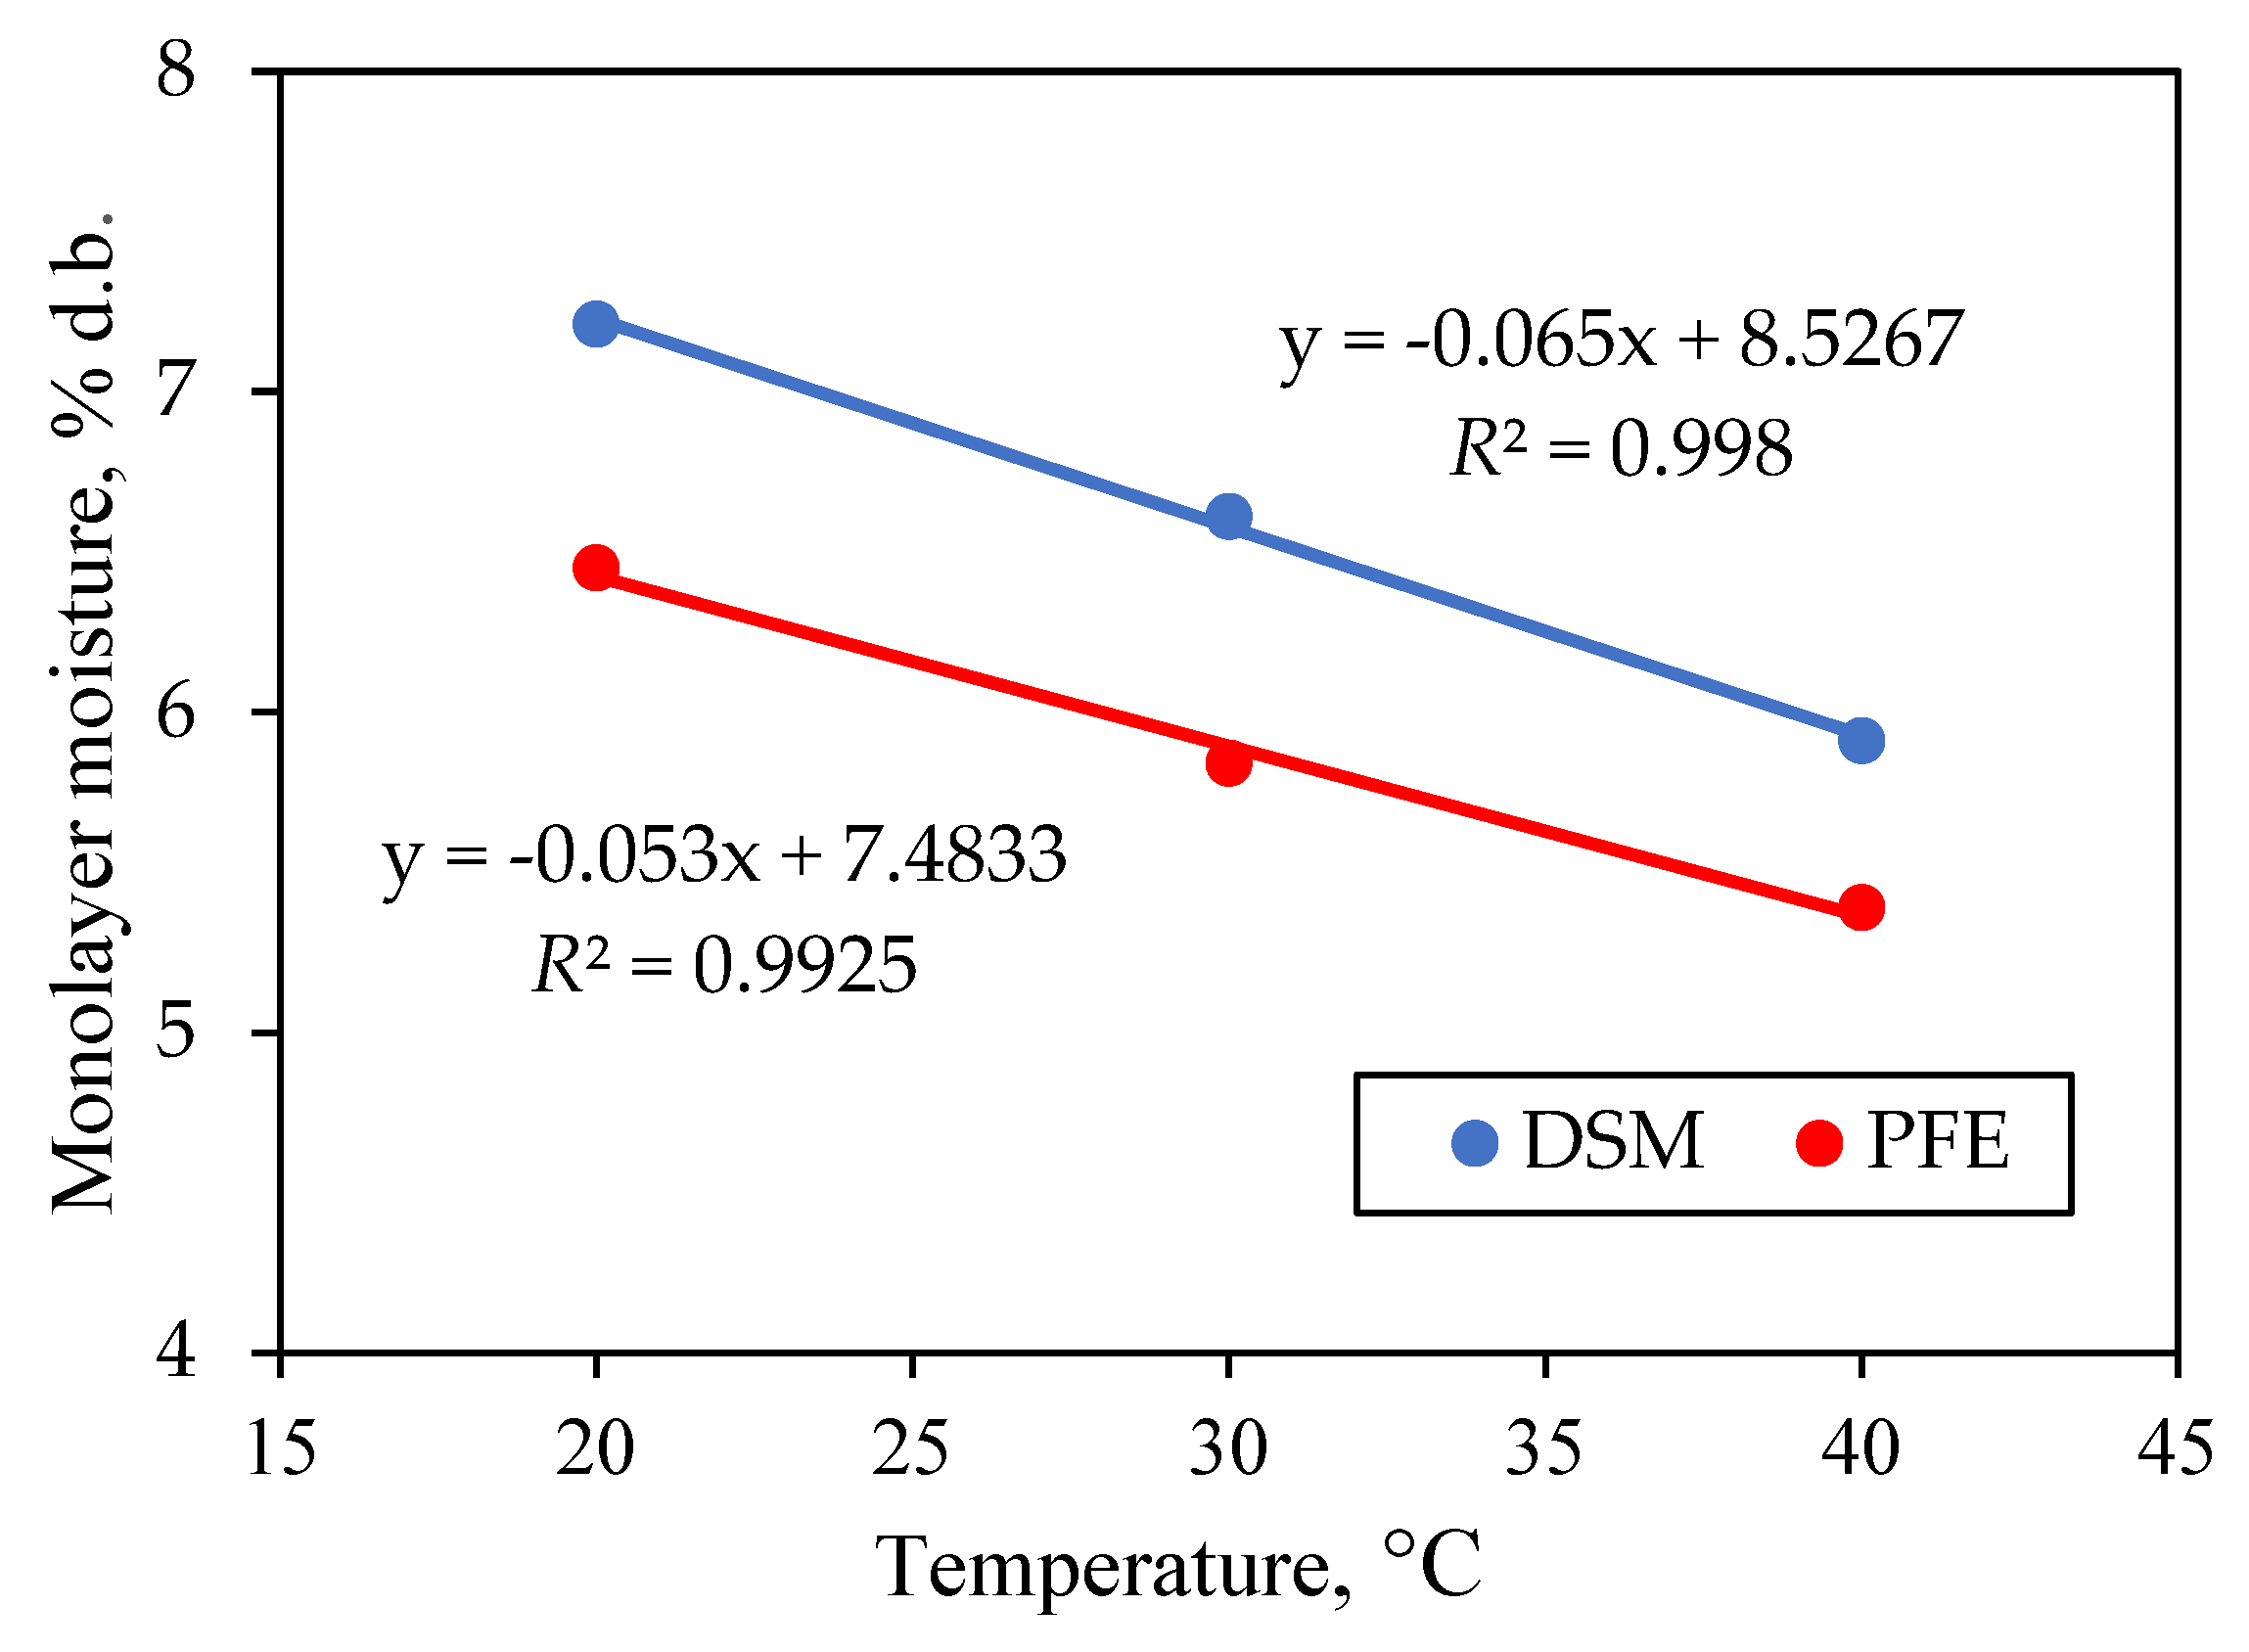
The MMC values at 20 °C for DSM were approximately close (7.21% d.b. at adsorption and 7.88% d.b. at desorption). For PFE, a higher hysteresis of MMC was observed—6.45% d.b. at adsorption and 7.40% d.b. at desorption. The MMCs of the PFE were lower than those of the DSM (Figure 3). This is probably due to the amorphous structure of the extrudate, which decreases the number of active sites. The MMC decreased with the temperature rise for both products, which is typical for most foods [51]. This probably could be explained by the fact that, when the temperature increases, the number of active centers able to keep the water molecules decreases. The linear equations described satisfactorily (R2 = 0.99) the functional dependence of monolayer moisture content on the temperature. This gave us a reason to apply the modified BET model including the linear temperature effect (Equations (11) and (12)). The modified BET model’s coefficients for DSM and PFE are shown in Table 2 and Table 3, respectively. The high values of the correlation coefficients and low values of ARE and SEE indicated that the modification of the BET model involving the temperature can be applied for the description of experimental data up to Rh < 0.45 and for the calculation of the MMC.
The substitution of Equation (12) in Equation (11) resulted in Equation (15), which was used for the calculation of the air equilibrium relative humidity (Rhm) corresponding to the MMC:
R h m = 1 1 + C ,
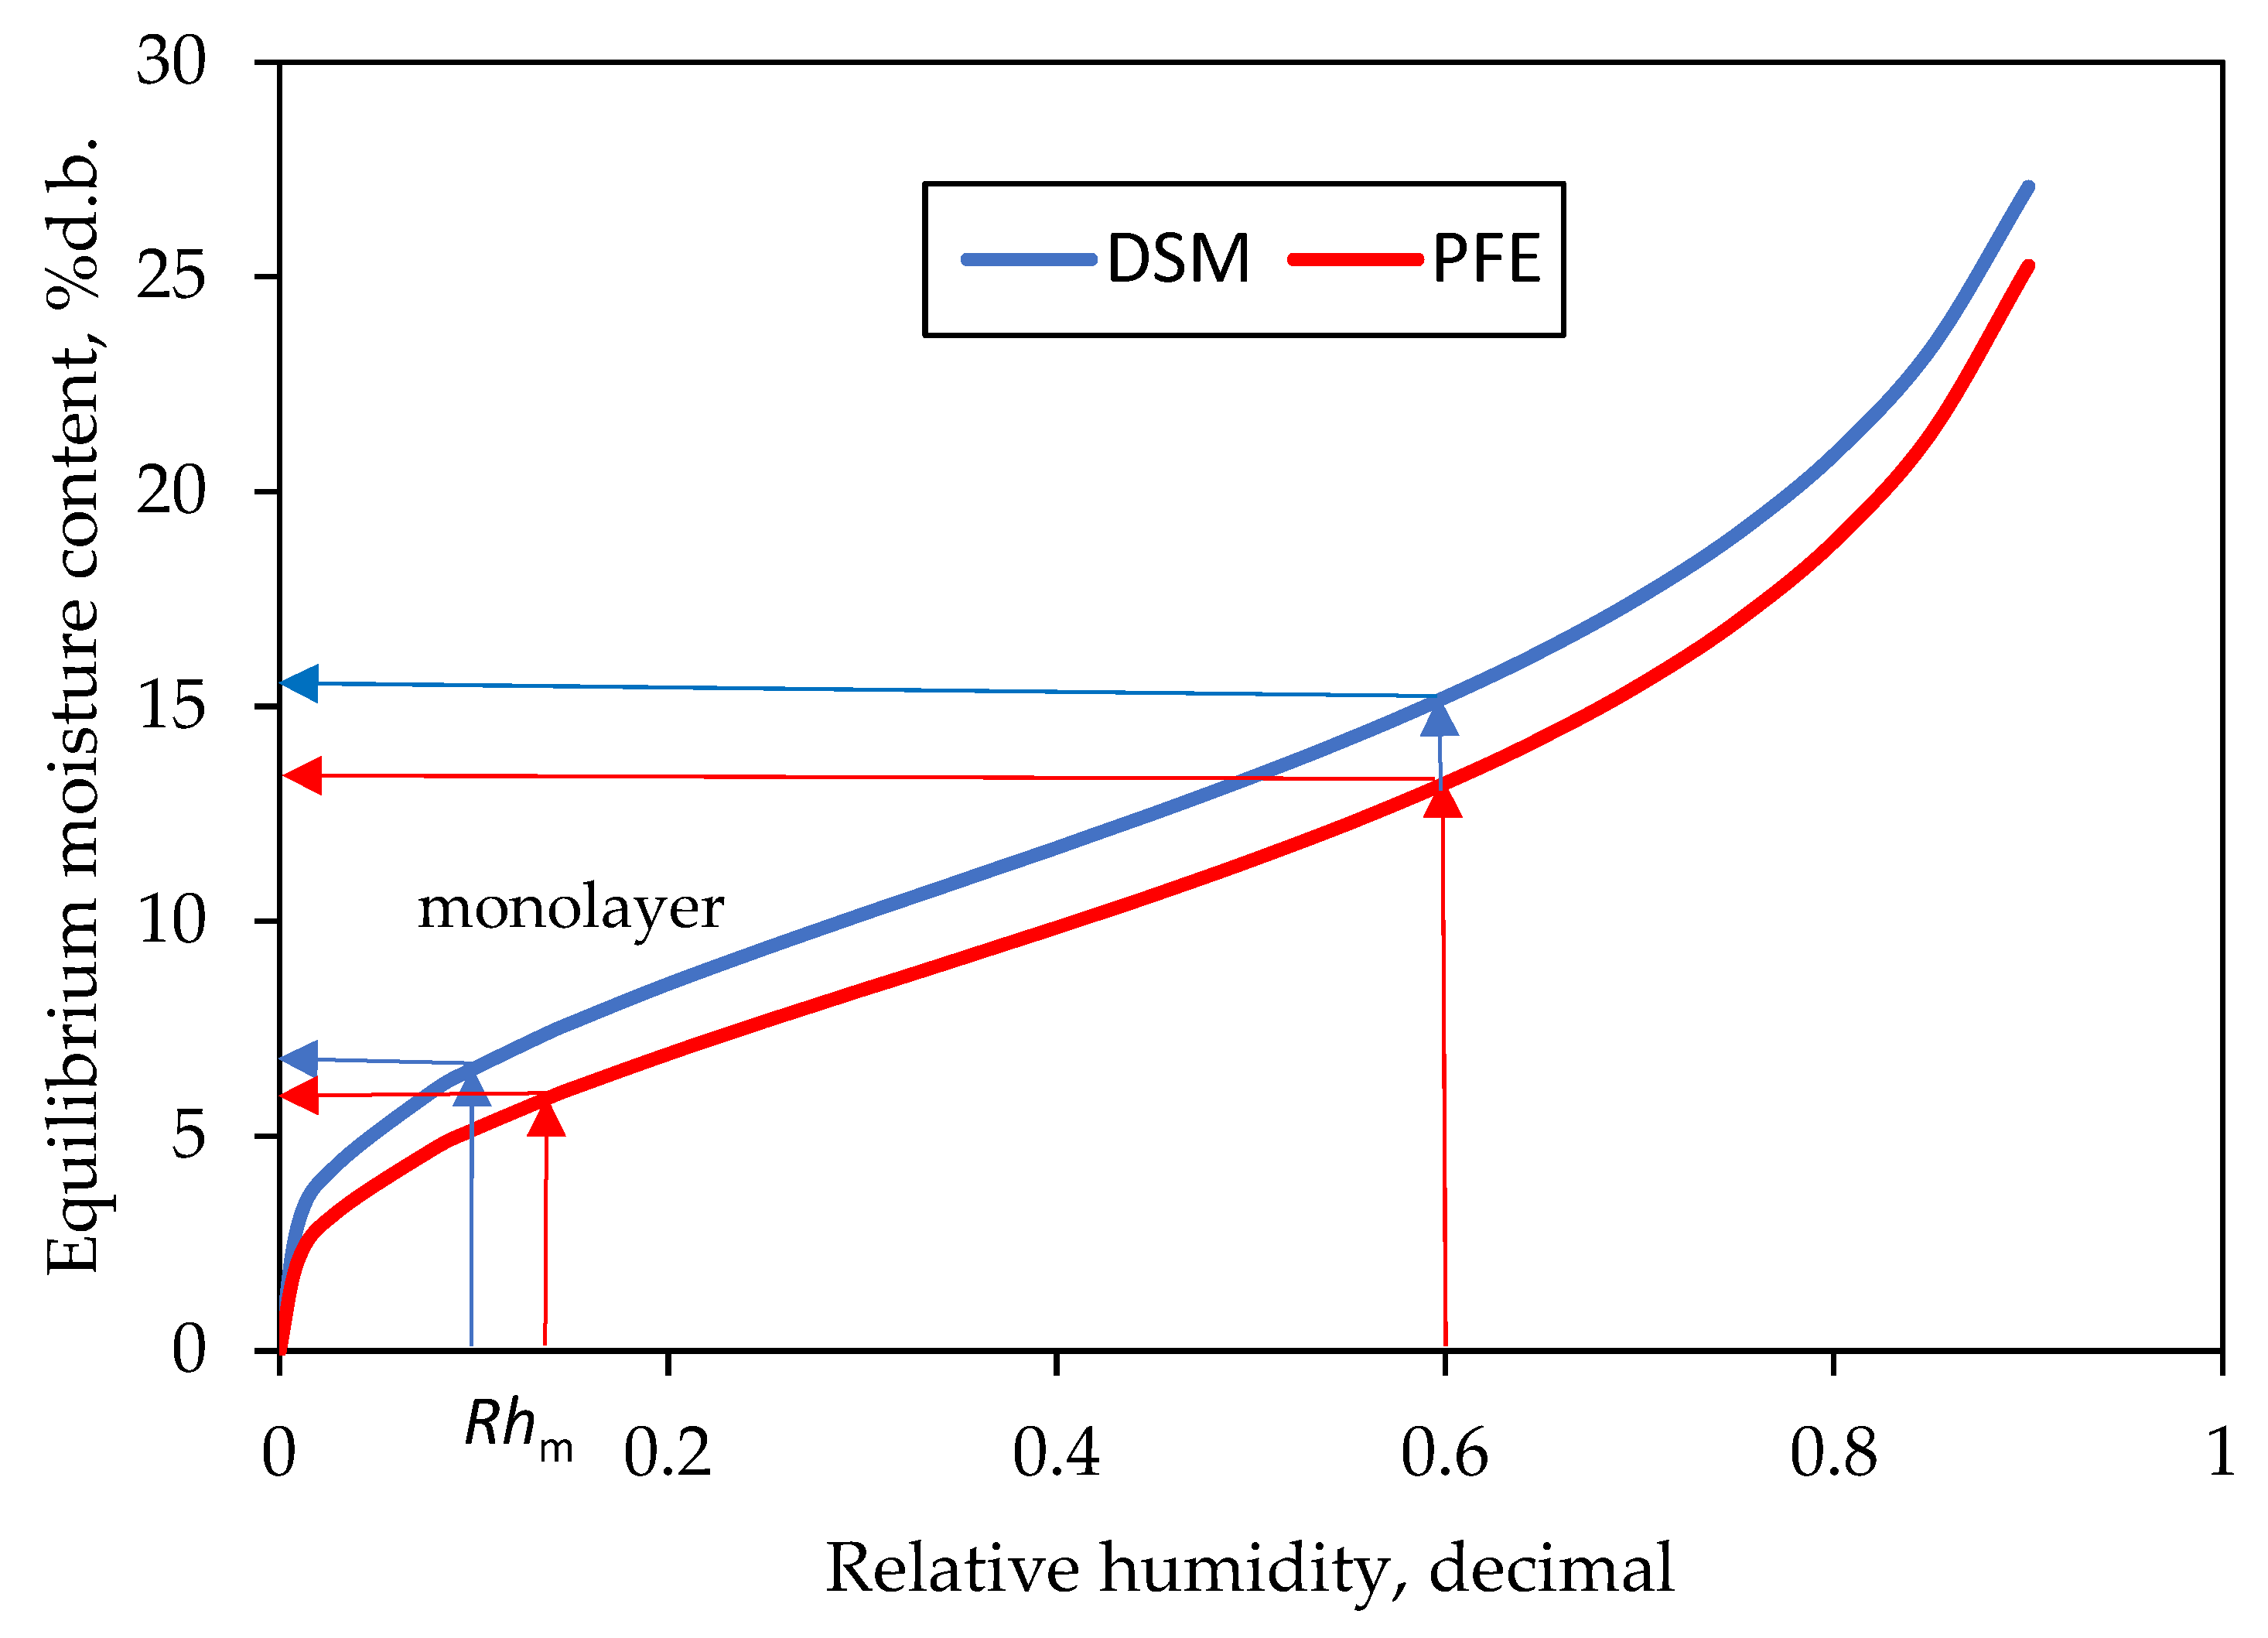
The temperature does not participate in Equation (15), which means that it does not affect the coefficient C. Therefore, for a product to be with MMC in the studied temperature range, it must be stored at R h m . The values of R h m obtained by Equation (15) were 0.099 for DSM and 0.137 for PFE. This shows that the extruded product will have monolayer moisture if it is stored in the air with higher relative humidity than the meal.

3.5. Net Isosteric Heat of Sorption

In order to create the dependence ln(aw) = f(1/T), we used the modified Oswin model, transforming it into:
a w = 1 1 + A + B t M 1 C ,
By setting different moisture contents in the range from 6 to 30% d.b. according to Equation (16), we calculated the corresponding values of the water activity for the three investigated temperatures (Table 4). The results in the table show that at equal moisture contents of both products, the water activity of PFE was significantly higher, especially at lower moisture contents.
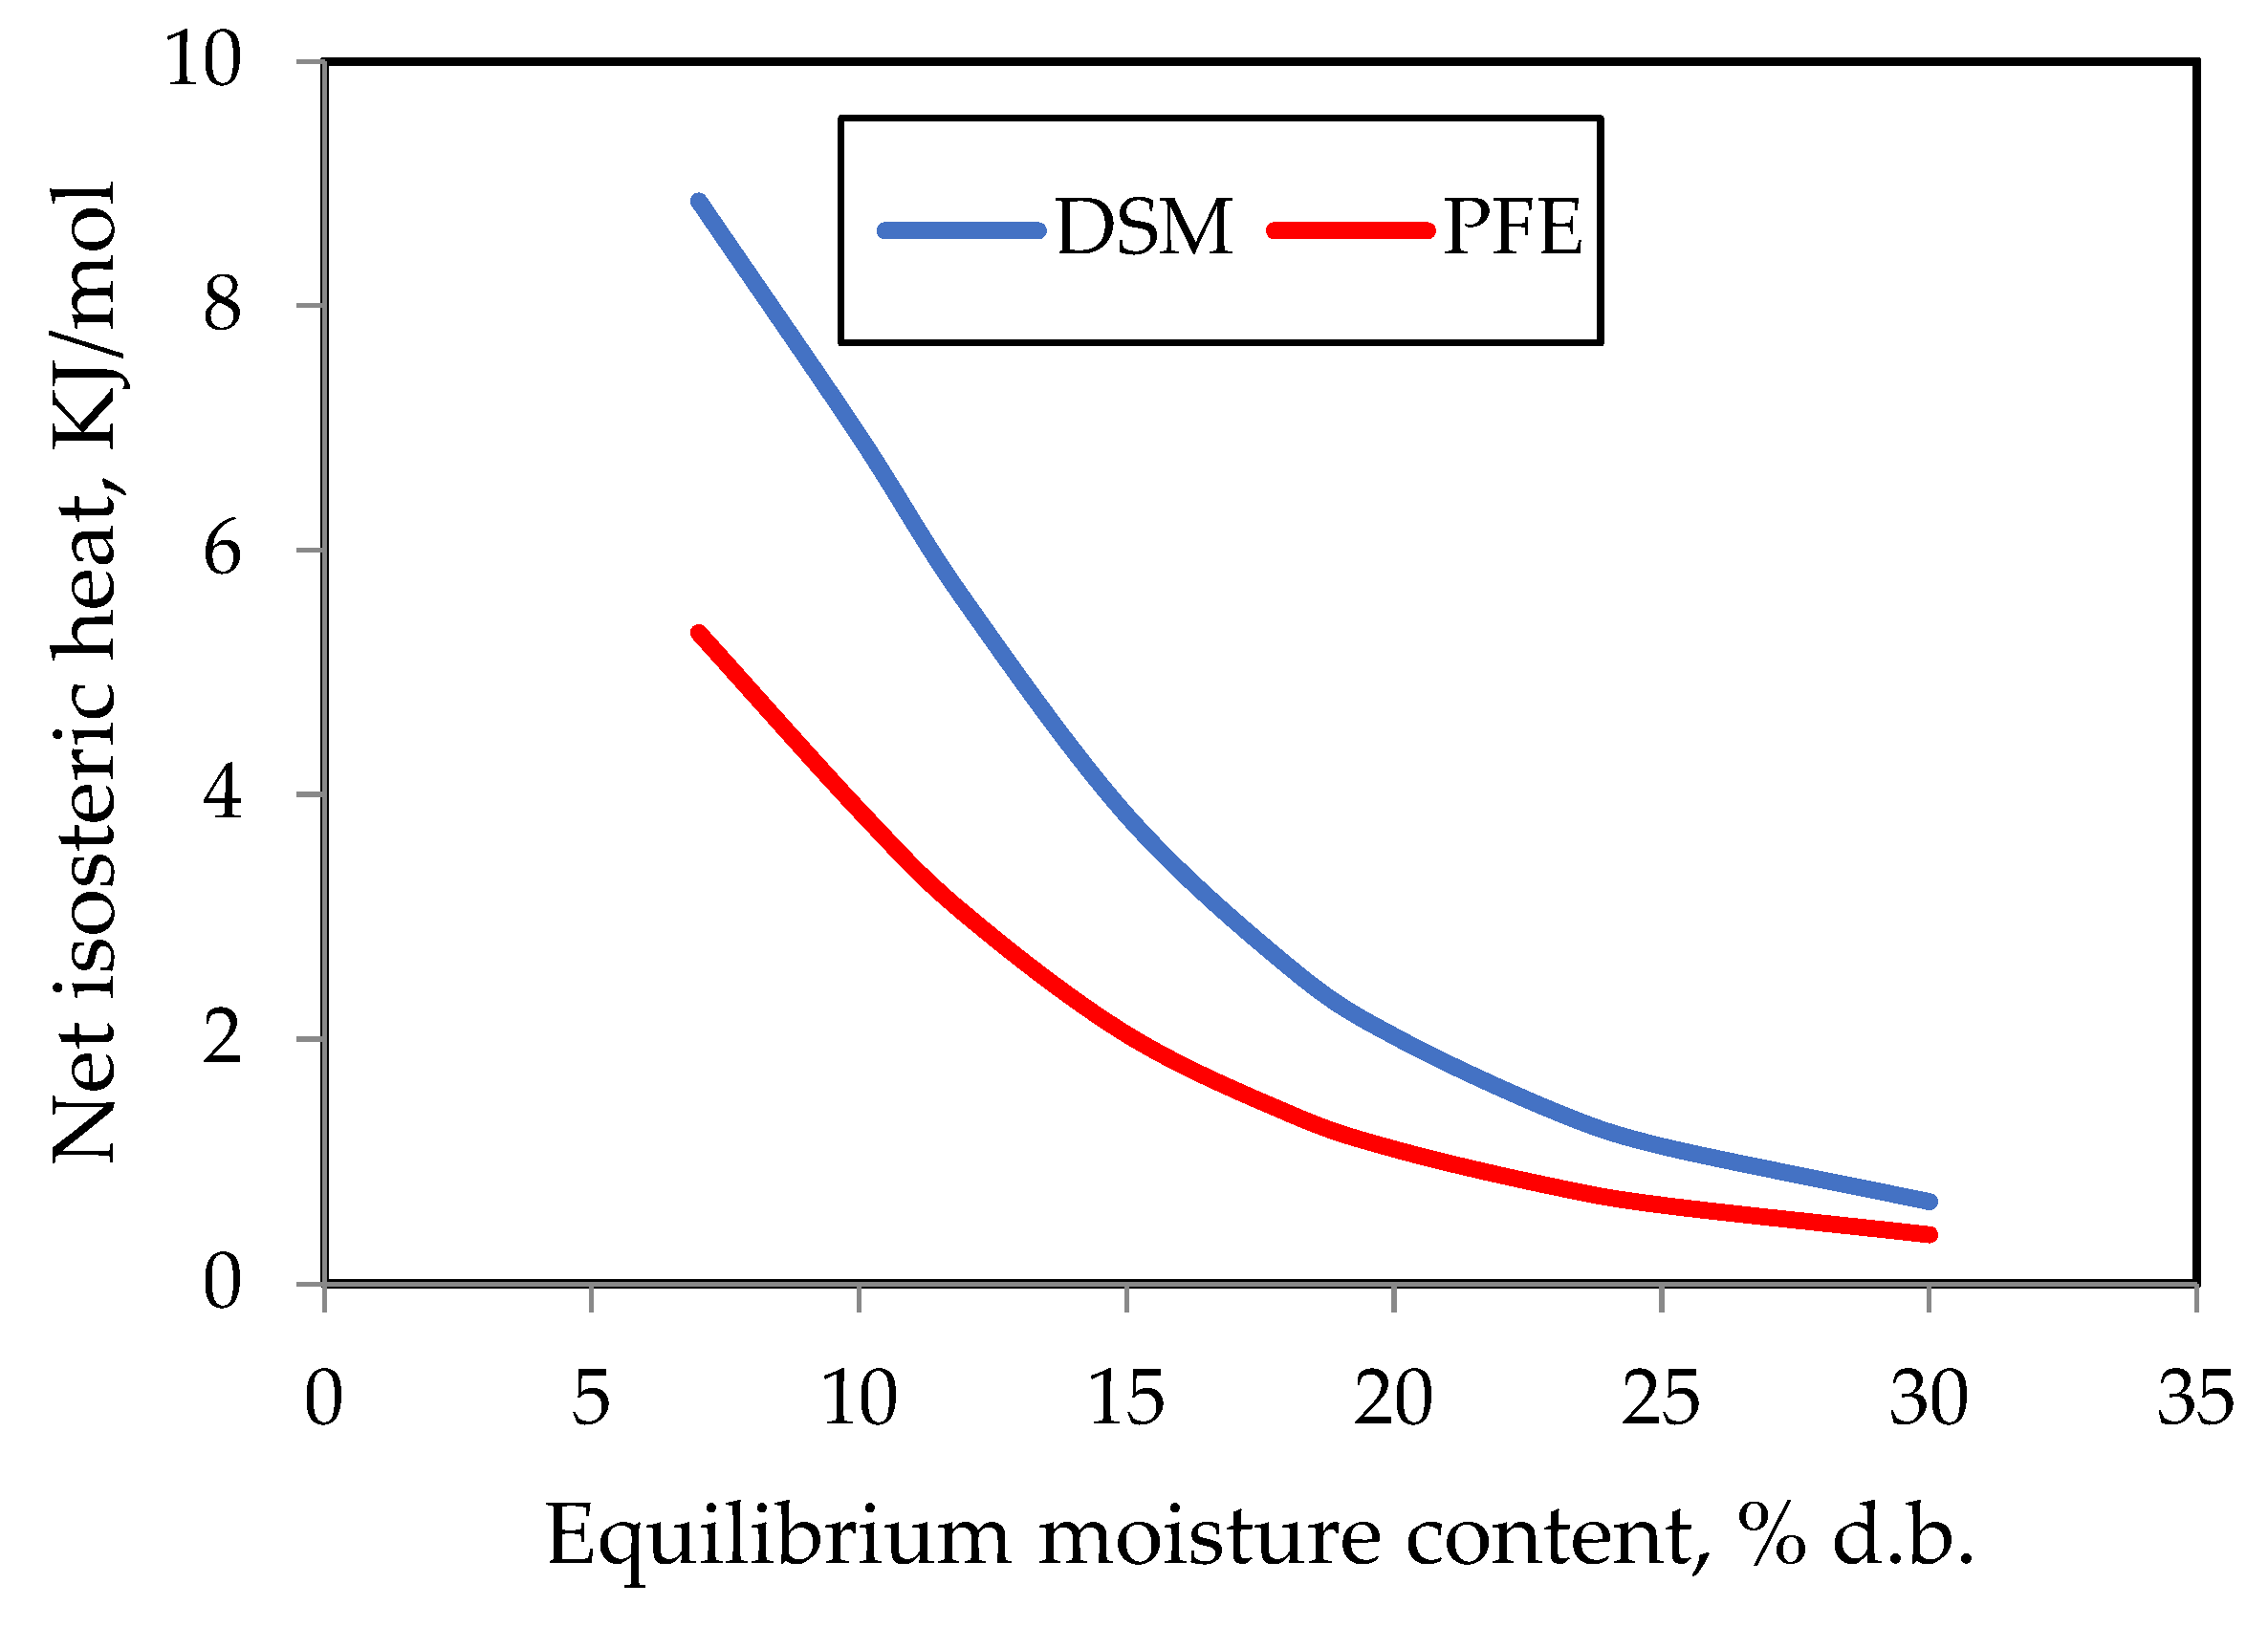
For each investigated product, we determined the slope of the straight line called isoster using the plot of lnaw versus 1/T, and we calculated the values of qst for different moisture contents. Figure 4 shows the change of the net heat of sorption with dependence on the moisture content. For both products, the isosteric heat initially decreased significantly up to 15% (d.b.) moisture content. After that point, the further decrease was slower. The sharp increase in isosteric heat of sorption at low moisture content may be explained by the fast exposure of extremely active polar sites of the product’s surface, which are encircled by water molecules that form a monolayer coat. As the active sites are occupied, sorption begins to occur in fewer active sites in the multilayer, where less energy is involved in the binding, reflected by lower values of isosteric heats of sorption [37]. The net heat of sorption of both products is significantly lower than the heat of phase transition of pure water (43.6 kJ/mol), indicating a relatively weak interaction between the water molecules and the dry solid. Similar results were obtained for the net isosteric heat of sorption of other products [52], including for extrudates [37]. The DSM had higher values of net isosteric heat than PFE in all intervals of the moisture content’s change. Obviously, extrusion reduces the bond energy between the solid matrix and the water molecules. The comparison of the results obtained for net isosteric heat of sorption of DSM with the published literature data for sunflower seeds in Ref. [53] showed that the heat was significantly higher for the DSM than for the seeds. This was probably due to the lower fat and protein contents of DSM. Simultaneously, our results for PFE were lower than those obtained for extrudates prepared from a blend composition of maize, finger millet, defatted soy, and elephant foot yam [37].

3.6. Long-Term Storage Ranges

Figure 5 presents an example of the prediction of ranges of moisture content and relative humidities for long-term storage of DSM and PFE. The sorption isotherms were built with EMC established by the modified Oswin model (Equation (4)) at 25 °C. The MMC for both products at the same temperature, 7.38% d.b. for DSM and 5.14% d.b. for PFE, was calculated after the substitution of Rh with Rhm in the modified Oswin model. The decrease in EMC below the MMC is energy inefficient and can cause higher lipid oxidation [54]. On the other hand, many investigations indicate that no growth of microorganisms is possible (yeast, molds, and bacteria) at Rh = aw < 0.6 [55,56]. The EMC values were 15.22% d.b. for DSM and 13.22% d.b. for PFE, obtained by using Equation (4) corresponding to Rh = 0.6. Figure 5 presents the ranges of EMC and relative humidities suitable for long-term storage of DSM and PFE at 25 °C. Similarly, the ranges for long-term storage for other temperatures from 20 °C to 40 °C can be defined using the modified Oswin and modified BET equations.
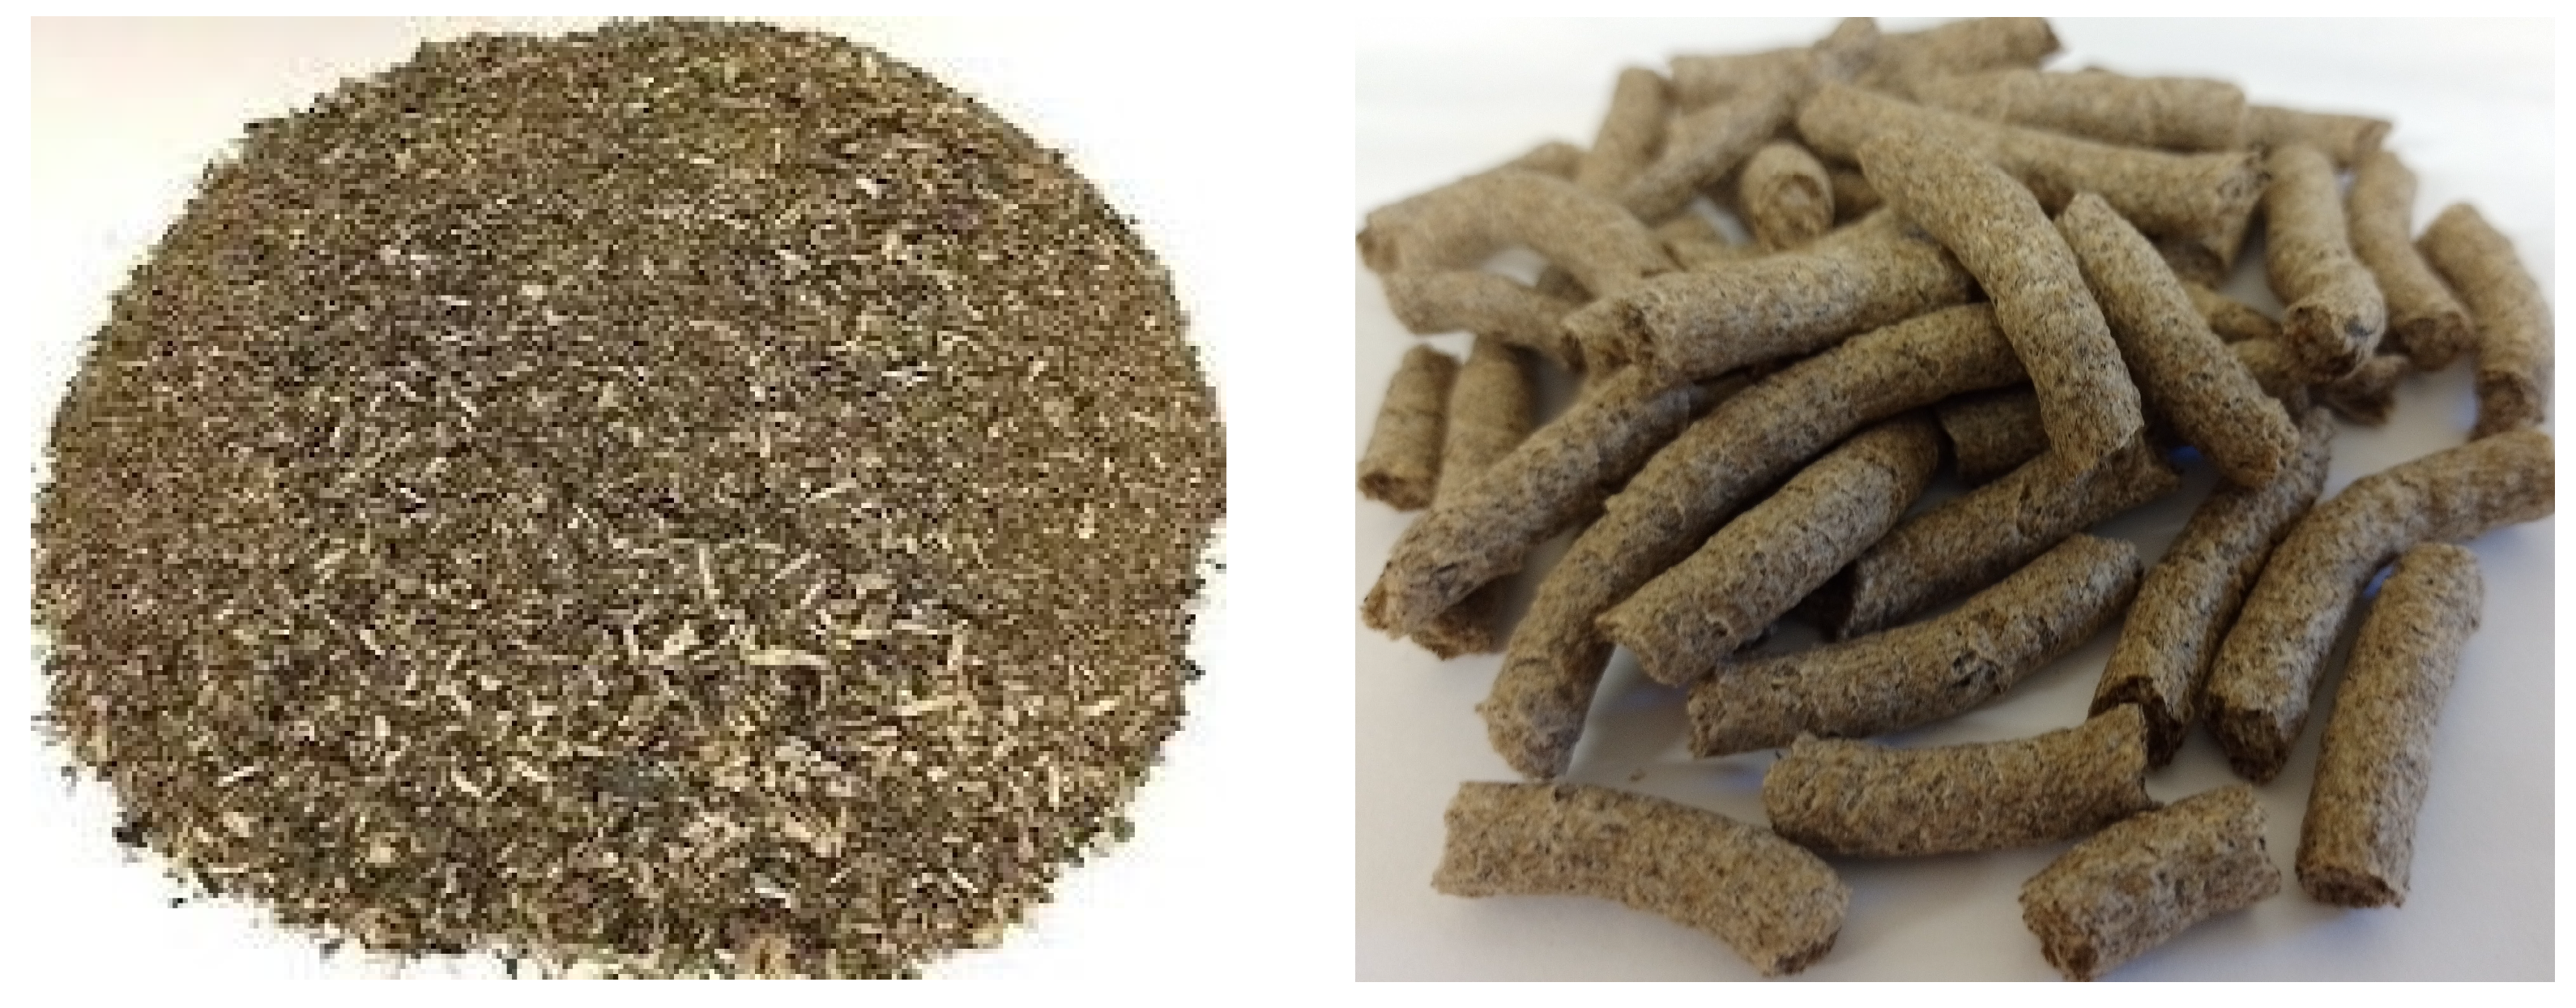
Our investigation shows the usability of the DSM for the production of PFE appropriate for long-term storage (Figure 6). The experimental data could be used for both designing/optimization of the technological and storage parameters and for the development of novel food based on the utilization of by-products.

4. Conclusions

The isotherms of DSM and PFE have an S-shaped character (type II according to Brunauer’s classification). The extrusion of a mixture of DSM and corn grits decreased the EMC and MMC compared to the DSM. The hysteresis loop was distinctly expressed for the extruded product, while it was not observed for the meal. The sorption capacity and the monolayer moisture of both products decreased when the temperature increased. The modified model of Oswin was appropriate to describe the equilibrium sorption isotherms in the temperature range from 20 °C to 40 °C. Extrusion reduced the bond energy between the solid matrix and the water molecules.

Author Contributions

Conceptualization, M.A.D., N.D.M. and V.I.C.; methodology, N.D.M.; software, M.A.D. and N.D.M.; validation, M.A.D. and N.D.M.; formal analysis, M.A.D., N.D.M. and V.I.C.; investigation, M.A.D., A.T.S., H.R.K., P.I., N.D.M. and V.I.C.; resources, N.D.M.; data curation, M.A.D. and N.D.M.; writing—original draft preparation, M.A.D., N.D.M. and V.I.C.; writing—review and editing, M.A.D., A.T.S., H.R.K., P.I., N.D.M. and V.I.C.; visualization, M.A.D. and N.D.M.; supervision, N.D.M. and V.I.C.; project administration, N.D.M. and V.I.C.; funding acquisition, V.I.C. All authors have read and agreed to the published version of the manuscript.

Funding

This research was funded by Bulgarian National Science Fund, grant number KП-06-H37/21.

Institutional Review Board Statement

Not applicable.

Informed Consent Statement

Not applicable.

Data Availability Statement

Data are contained within the article.

Conflicts of Interest

The authors declare no conflict of interest.

References

  1. Krishnan, R.; Agarwal, R.; Bajada, C.; Arshinder, K. Redesigning a food supply chain for environmental sustainability—An analysis of resource use and recovery. J. Clean. Prod. 2020, 242, 118374. [Google Scholar] [CrossRef]
  2. Dey, D.; Richter, J.K.; Ek, P.; Bon-Jae, G.; Ganjyal, G.M. Utilization of food processing by-products in extrusion processing: A review. Front. Sustain. Food Syst. 2021, 4, 603751. [Google Scholar] [CrossRef]
  3. Ravindran, R.; Jaiswal, A.K. Exploitation of food industry waste for high-value products. Trends Biotechnol. 2016, 34, 58–69. [Google Scholar] [CrossRef] [PubMed]
  4. Masli, M.D.P.; Gu, B.J.; Rasco, B.A.; Ganjyal, G.M. Fiber-rich food processing by-products enhance the expansion of cornstarch extrudates. J. Food Sci. 2018, 83, 2500–2510. [Google Scholar] [CrossRef] [PubMed]
  5. Rivera-González, G.; Amaya-Guerra, C.A.; De la Rosa-Millán, J. Physicochemical characterisation and in vitro starch digestion of avocado seed flour (Persea americana V. Hass) and its starch and fibrous fractions. Int. J. Food Sci. Technol. 2019, 54, 2447–2457. [Google Scholar] [CrossRef]
  6. Wang, S.; Kowalski, R.J.; Kang, Y.; Kiszonas, A.M.; Zhu, M.J.; Ganjyal, G.M. Impacts of the particle sizes and levels of inclusions of cherry pomace on the physical and structural properties of direct expanded corn starch. Food Bioprocess Technol. 2017, 10, 394–406. [Google Scholar] [CrossRef]
  7. De Oliveira Filho, J.G.; Egea, M.B. Sunflower seed byproduct and its fractions for food application: An attempt to improve the sustainability of the oil process. J. Food Sci. 2021, 86, 1497–1510. [Google Scholar] [CrossRef] [PubMed]
  8. Wanjari, N.; Waghmare, J. Phenolic and antioxidant potential of sunflower meal. Adv. Appl. Sci. Res. 2015, 6, 221–229. [Google Scholar]
  9. Sim, S.Y.J.; Srv, A.; Chiang, J.H.; Henry, C.J. Plant proteins for future foods: A roadmap. Foods 2021, 10, 1967. [Google Scholar] [CrossRef]
  10. Ivanova, P.; Kalaydzhiev, H.; Slavov, A.; Chalova, V. Value-added dietary fiber concentrate obtained as waste after protein isolation from ethanol-treated sunflower meal. Int. J. Food Sci. 2022, 2022, 4289059. [Google Scholar] [CrossRef]
  11. Bhise, S.; Kaur, A.; Manikantan, M.R.; Singh, B. Optimization of extrusion process for production of texturized flaxseed defatted meal by response surface methodology. Int. J. Res. Eng. Technol. 2013, 2, 302–308. [Google Scholar] [CrossRef]
  12. Reyes-Jáquez, D.; Casillas, F.; Flores, N.; Andrade-González, I.; Solís-Soto, A.; Medrano-Roldán, H.; Carrete, F.; Delgado, E. The effect of glandless cottonseed meal content and process parameters on the functional properties of snacks during extrusion cooking. Food Nutr. Sci. 2012, 3, 1716–1725. [Google Scholar] [CrossRef]
  13. Vidal, N.P.; Roman, L.; Shiva Swaraj, V.J.; Ragavan, K.V.; Simsek, S.; Rahimi, J.; Kroetsch, B.; Martinez, M.M. Enhancing the nutritional value of cold-pressed oilseed cakes through extrusion cooking. Innov. Food Sci. Emerg. Technol. 2022, 77, 102956. [Google Scholar] [CrossRef]
  14. Sisay, M.T.; Emire, S.A.; Ramaswamy, H.S.; Workneh, T.S. Effect of feed components on quality parameters of wheat–tef–sesame–tomato based extruded products. J. Food Sci. Technol. 2018, 55, 2649–2660. [Google Scholar] [CrossRef] [PubMed]
  15. Teangpook, C.; Paosangtong, U.; Temtrakool, K. Sunflower meal snack production using a village texturizer and its shelf life. Witthayasan Kasetsat 2011, 45, 900–908. [Google Scholar]
  16. Bhise, S.; Kaur, A. The effect of extrusion conditions on the functional properties of defatted cake of sunflower-maize based expanded snacks. Int. J. Res. Eng. Technol. 2015, 5, 247–252. [Google Scholar] [CrossRef]
  17. Grasso, S. Extruded snacks from industrial by-products: A review. Trends Food Sci. Technol. 2020, 99, 284–294. [Google Scholar] [CrossRef]
  18. Huffman, V.L.; Lee, C.K.; Burns, E.E. Selected functional properties of sunflower meal (Helianthus annuus). J. Food Sci. 1975, 40, 70–74. [Google Scholar] [CrossRef]
  19. White, N.D.G.; Jayas, D.S. Physical properties of canola and sunflower meal pellets. Can. Biosyst. Eng. 2001, 43, 49–53. [Google Scholar]
  20. Anjappa, R.H.; Oghbaei, M.; Nagarajaiah, S.B.; Prakash, J. Influence of water activity on physico-chemical properties of proteins from selected oilseed flours. Food Sci. Technol. Res. 2011, 17, 257–266. [Google Scholar] [CrossRef]
  21. Das, A.B.; Goud, V.V.; Das, C. Influence of extrusion cooking on phytochemical, physical and sorption isotherm properties of rice extrudate infused with microencapsulated anthocyanin. Food Sci. Biotechnol. 2021, 30, 65–76. [Google Scholar] [CrossRef] [PubMed]
  22. Rosentrater, K.A.; Verbeek, C.J.R. Water adsorption characteristics of extruded blends of corn gluten meal and distillers dried grains with solubles. Food Bioprod. Process. 2017, 101, 110–117. [Google Scholar] [CrossRef]
  23. Gandova, V.; Ivanova, P.; Kalaydzhiev, H.; Perifanova-Nemska, M.; Chalova, V.I. Dissolution and surface tension properties of ethanol-wash solute obtained from industrial sunflower meal. Biointerface Res. Appl. Chem. 2021, 11, 11284–11292. [Google Scholar] [CrossRef]
  24. Ivanova, P.; Chalova, V.; Koleva, L.; Pishtiyski, I.; Perifanova-Nemska, M. Optimization of protein extraction from sunflower meal produced in Bulgaria. Bulg. J. Agric. Sci. 2012, 18, 153–160. [Google Scholar]
  25. Khushbu, K.; Mridula, D.; Kishore, A.; Chitranayak. Extrusion processing of agri-horti and dairy products: A review. Int. J. Chem. Stud. 2020, 8, 1424–1433. [Google Scholar] [CrossRef]
  26. ISO 712:2009; Cereals and Cereal Product—Determination of Moisture Content—Reference Method. ISO: Geneva, Switzerland, 2009.
  27. Adekola, K.A. Engineering review food extrusion technology and its applications. J. Food Sci. Eng. 2016, 6, 149–168. [Google Scholar] [CrossRef]
  28. Dushkova, M.A.; Simitchiev, A.T.; Kalaydzhiev, H.R.; Ivanova, P.; Menkov, N.D.; Chalova, V.I. Comparison and modeling of moisture sorption isotherms of deproteinized rapeseed meal and model extrudate. J. Food Process. Preserv. 2022, 46, e16978. [Google Scholar] [CrossRef]
  29. Wolf, W.; Spiess, W.E.L.; Jung, G. Standardization of Isotherm Measurements (Cost-project 90 and 90 BIS). In Properties of Water in Foods, 1st ed.; Simatos, D., Multon, J.L., Eds.; Springer: London, UK, 1985; Volume 90, pp. 661–679. [Google Scholar] [CrossRef]
  30. Greenspan, L. Humidity fixed points of binary saturated aqueous solutions. J. Res. Natl. Bur. Stand. A Phys. Chem. 1977, 81, 89–96. [Google Scholar] [CrossRef]
  31. Bell, L.N.; Labuza, T.P. Moisture Sorption: Practical Aspects of Isotherm Measurement and Use, 2nd ed.; American Association of Cereal Chemists: St. Paul, MN, USA, 2000; pp. 33–36. [Google Scholar]
  32. Fontana, A.J. Appendix A: Water Activity of Saturated Salt Solutions. In Water Activity in Foods: Fundamentals and Applications, 2nd ed.; Barbosa-Cánovas, G.V., Fontana, A.I., Schmidt, S.J., Labuza, T.P., Eds.; Blackwell Publishing and the Institute of Food Technologists: Boston, MA, USA, 2007; pp. 391–393. [Google Scholar]
  33. Deshmukh, G.P.; Ravindra, M.R.; Jose, N.; Wasnik, P.G.; Dhotre, A.V. Moisture sorption behavior and thermodynamic properties of dry-crystallized Palada payasam (rice flakes milk pudding) mix determined using the dynamic vapor sorption method. J. Food Process. Preserv. 2020, 44, e14819. [Google Scholar] [CrossRef]
  34. D245.6; Moisture Relationships of Plant-Based Agricultural Products. American Society of Agricultural and Biological Engineers: St. Joseph, MI, USA, 2007.
  35. Jayas, D.S.; Mazza, G. Comparison of five three-parameter equations for the description of adsorption data of oats. Trans. ASAE 1993, 36, 119–125. [Google Scholar] [CrossRef]
  36. Menkov, N.D.; Paskalev, H.M.; Galyazkov, D.I.; Kerezieva-Rakova, M. Applying the linear equation of correlation of Brunauer-Emmet-Teller (BET)-monolayer moisture content with temperature. Food/Nahrung 1999, 43, 118–121. [Google Scholar] [CrossRef]
  37. Sahu, C.; Patel, S.; Khokhar, D. Sorption behavior and isosteric heat of maize-millet based protein enriched extruded product. Heliyon 2021, 7, e06742. [Google Scholar] [CrossRef] [PubMed]
  38. Jose, N.; Ravindra, M.R.; Deshmukh, G.P.; Rao, K.J. Sorption and thermodynamic properties of dry crystallized Palada payasam mix prepared using manual and mechanical stirring. J. Food Sci. Technol. 2022, 59, 1075–1086. [Google Scholar] [CrossRef] [PubMed]
  39. Basha, R.K.; Leong, K.Y.; Othman, S.H.; Talib, R.A.; Naim, M.N.; Hasnan, N.Z.N.; Azmi, N.S. Sorption characteristic of starch-based film. Food Res. 2021, 5, 193–200. [Google Scholar] [CrossRef]
  40. Al-Muhtaseb, A.H.; McMinn, W.A.M.; Magee, T.R.A. Moisture sorption isotherm characteristics of food products: A review. Food Bioprod. Process 2002, 80, 118–128. [Google Scholar] [CrossRef]
  41. Tanska, M.; Konopka, I.; Ruszkowska, M. Sensory, physico-chemical and water sorption properties of corn extrudates enriched with spirulina. Plant Foods Hum. Nutr. 2017, 72, 250–257. [Google Scholar] [CrossRef] [PubMed]
  42. Włodarczyk-Stasiak, M.; Jamroz, J. Analysis of sorption properties of starch–protein extrudates with the use of water vapour. J. Food Eng. 2008, 85, 580–589. [Google Scholar] [CrossRef]
  43. Witczak, T.; Stępień, A.; Zięba, T.; Gumul, D.; Witczak, M. The influence of extrusion process with a minimal addition of corn meal on selected properties of fruit pomaces. J. Food Process Eng. 2020, 43, e13382. [Google Scholar] [CrossRef]
  44. Manchuliantsau, A.; Tkacheva, A. Upcycling Solid Food Wastes and By-Products into Human Consumption Products. U.S. Patent 0223475, 25 July 2019. Available online: https://patents.google.com/patent/US20190223475A1/en (accessed on 25 July 2019).
  45. Aviara, N.A. Moisture sorption isotherms and isotherm model performance evaluation for food and agricultural products. In Sorption in 2020s, 1st ed.; Kyzas, G., Lazaridis, N., Eds.; IntechOpen: London, UK, 2020; pp. 14–18. [Google Scholar] [CrossRef]
  46. Ajala, A.S.; Ngoddy, P.O.; Olajide, J.O. Sorption isotherms and their fitted equations for dried chips of cassava roots (Manihot Esculenta Crantz; Tme-7 variety) and the resulting isosteric heats of sorption. Food Res. 2020, 4, 703–711. [Google Scholar] [CrossRef]
  47. Kapsalis, J.G. Influences of Hysteresis and Temperature on Moisture Sorption Isotherms. In Water Activity: Theory and Applications to Food, 1st ed.; Rockland, L.B., Beuchat, L.R., Eds.; Marcel Dekker Inc.: New York, NY, USA, 1987; pp. 173–213. [Google Scholar]
  48. Yeasmin, F.; Hira, N.N.; Rahman, H.; Islam, M.N. Development of powder based ginger drink: Analysis of dehydration kinetics and moisture sorption isotherm. Food Res. 2021, 5, 322–329. [Google Scholar] [CrossRef]
  49. Bryan, W.P. Thermodynamic models for water–protein sorption hysteresis. Biopolymers 1987, 26, 1705–1716. [Google Scholar] [CrossRef] [PubMed]
  50. Jamroz, J.; Sokołowska; Hajnos, M. Moisture sorption hysteresis in potato starch extrudates. Int. Agrophys. 1999, 13, 451–455. [Google Scholar]
  51. Iglesias, H.; Chirife, J. Correlation of BET monolayer moisture content in foods with temperature. J. Food Technol. 1984, 19, 503–506. [Google Scholar] [CrossRef]
  52. Echavarria, J.A.C.; Torres, A.M.R.; Montoya, J.E.Z. Sorption isotherms and thermodynamic properties of the dry silage of red tilapia viscera (Oreochromis spp.) obtained in a direct solar dryer. Heliyon 2021, 7, e06742. [Google Scholar] [CrossRef] [PubMed]
  53. Campos, R.C.; Corrêa, P.C.; Zaidan, U.R.; Zaidan, I.R.; Leite, R.A. Moisture sorption isotherms of sunflower seeds: Thermodynamic analysis. Cienc. Agrotec. 2019, 43, e011619. [Google Scholar] [CrossRef]
  54. Barden, L.; Decker, E.A. Lipid oxidation in low-moisture food: A review. Crit. Rev. Food Sci. Nutr. 2016, 56, 2467–2482. [Google Scholar] [CrossRef] [PubMed]
  55. Beuchat, L.R. Influence of water activity on growth, metabolic activities and survival of yeasts and molds. J. Food Prot. 1983, 46, 135–141. [Google Scholar] [CrossRef]
  56. Abdullaha, N.; Nawawia, A.; Othman, I. Fungal spoilage of starch-based foods in relation to its water activity (aw). J. Stored Prod. Res. 2000, 36, 47–54. [Google Scholar] [CrossRef]
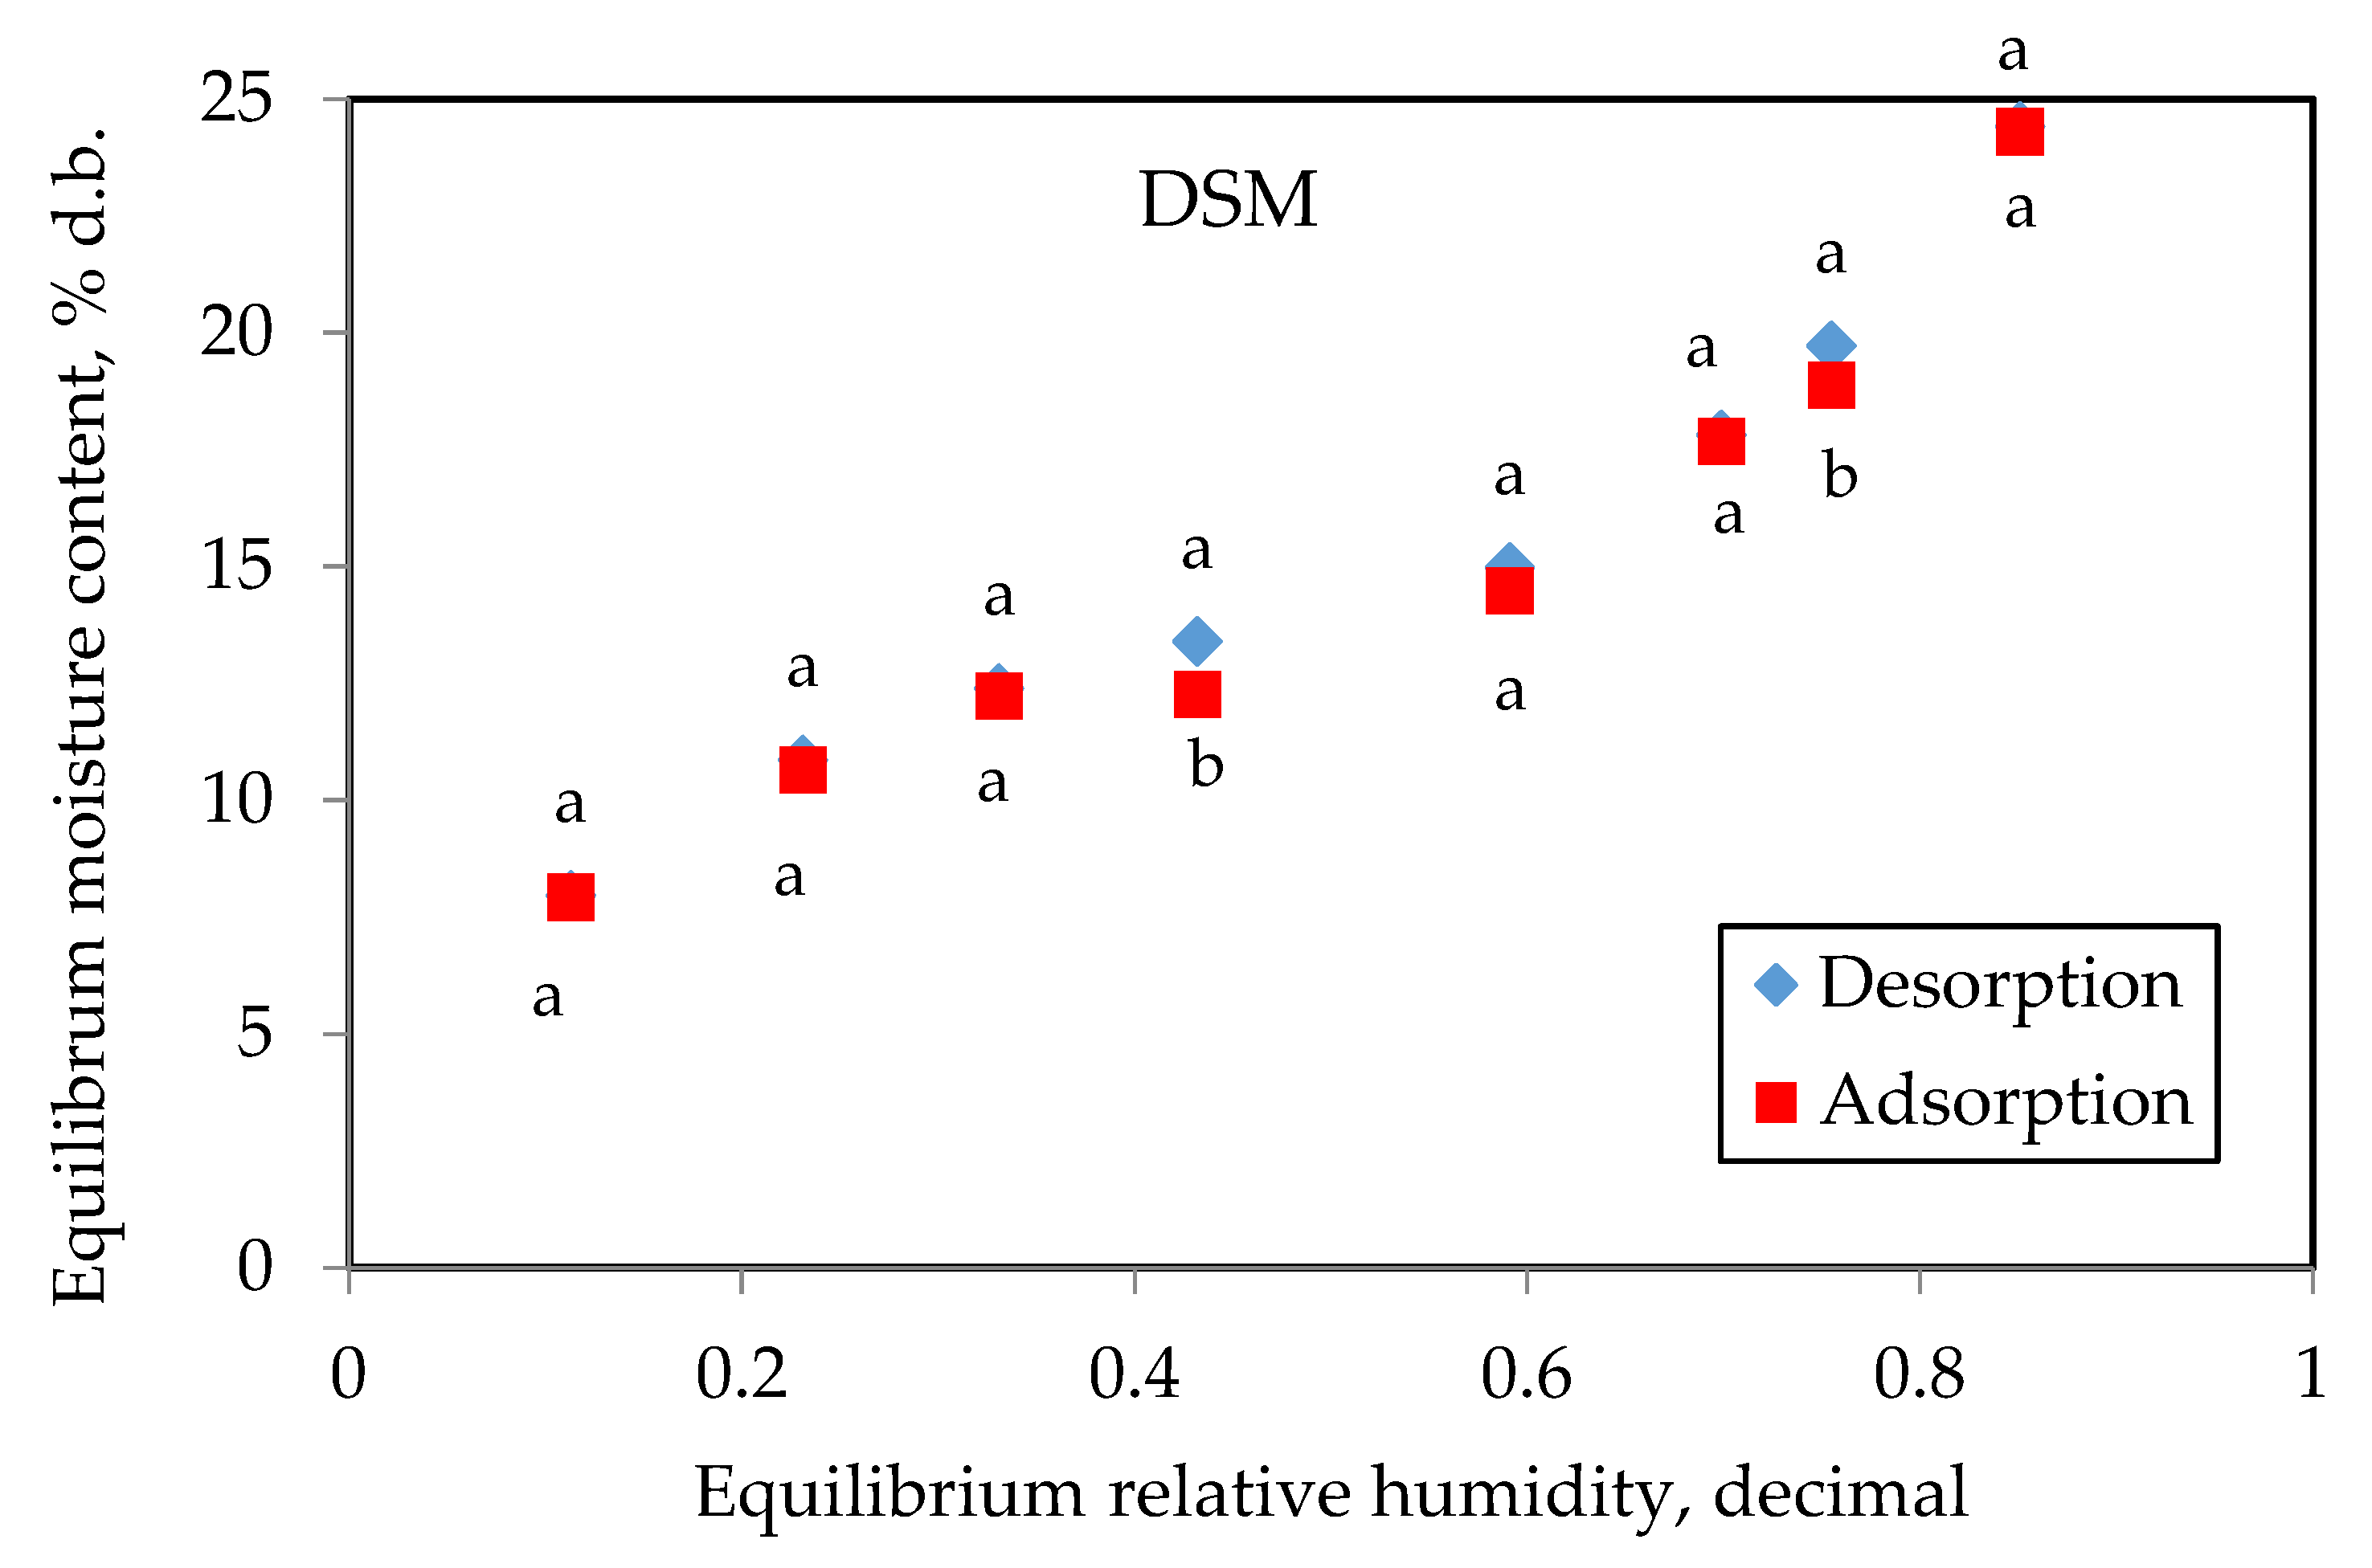
Figure 1. Hysteresis effect of DSM and PFE at 20 °C. Different letters (a and b) mean statistically significant difference.
Applsci 14 00065 g001aApplsci 14 00065 g001b
Figure 2. Residuals (blue dots) from the modified Oswin model during adsorption at several moisture contents.
Applsci 14 00065 g002
Figure 3. BET monolayer moisture of DSM and PFE at several temperatures obtained using a standard algorithm [31] at adsorption.
Applsci 14 00065 g003
Figure 4. Net heat of sorption with dependence on moisture content.
Applsci 14 00065 g004
Figure 5. Ranges of relative humidities and EMCs calculated by modified Oswin model for long-term storage of DSM and PFE at 25 °C.
Applsci 14 00065 g005
Figure 6. Deproteinized sunflower meal and patterned food extrudate.
Applsci 14 00065 g006
Table 1. Mean values of EMC with standard deviations obtained by adsorption at different relative humidities (Rh, decimal) and temperatures (°C) for DSM and PFE.
20 °C30 °C40 °C
RhDSMPFERhDSMPFERhDSMPFE
0.1137.93 ± 0.06 a6.18 ± 0.18 b0.1137.43 ± 0.28 a5.77 ± 0.26 b0.1125.62 ± 0.08 a4.33 ± 0.24 b
0.23110.65 ± 0.13 a8.50 ± 0.10 b0.2168.89 ± 0.21 a7.20 ± 0.09 b0.2016.37 ± 0.25 a6.10 ± 0.24 a
0.33112.23 ± 0.06 a9.91 ± 0.16 b0.32410.8 ± 0.10 a8.76 ± 0.09 b0.3168.21 ± 0.21 a8.05 ± 0.18 a
0.43212.27 ± 0.07 a10.86 ± 0.12 b0.43211.38 ± 0.24 a9.92 ± 0.15 b0.4239.86 ± 0.15 a8.51 ± 0.17 b
0.59114.48 ± 0.32 a12.64 ± 0.18 b0.56013.57 ± 0.27 a11.52 ± 0.18 b0.53211.59 ± 0.13 a9.98 ± 0.11 b
0.69917.68 ± 0.27 a15.31 ± 0.08 b0.67916.51 ± 0.26 a13.51 ± 0.31 b0.66113.28 ± 0.12 a12.38 ± 0.24 b
0.75518.88 ± 0.16 a17.92 ± 0.18 b0.75118.64 ± 0.27 a16.08 ± 0.21 b0.74716.22 ± 0.21 a15.89 ± 0.31 b
0.85124.31 ± 0.25 a22.89 ± 0.32 b0.83623.7 ± 0.30 a19.53 ± 0.22 b0.82318.99 ± 0.14 a18.79 ± 0.25 a
a,b Different letters within a row for a specific temperature mean statistically significant difference (p < 0.05).
Table 2. Modified model coefficients (a, b, c) fitted to EMC values of DSM, correlation coefficients (R), standard error of estimation (SEE), average relative error (ARE), and plot of residuals obtained by adsorption.
ModelCoefficientsRSEEARE, %Plot of Residuals
Chung–Pfosta = 32.76313
b = 5.88479
c = 12.07121
0.981.036.18Random
Halseya = 5.475196
b = −0.033334
c = 1.916773
0.982.308.03Patterned
Oswina = 16.52953
b = −0.12708
c = 3.10444
0.990.895.81Random
Hendersona = 0.00013
b = 34.86715
c = 1.74088
0.971.6010.85Patterned
GABa = 8.5282
b = 0.7385
c = 682.19
0.971.318.18Random
BETa = 10.03405
b = −0.10825
c = 83.45321
0.960.715.81-
Table 3. Modified model coefficients (a, b, c) fitted to the equilibrium moisture content of PFE, correlation coefficients (R), standard error of estimation (SEE), and average relative error (ARE) obtained by adsorption.
ModelCoefficientsRSEEARE, %Plot of Residuals
Chung–Pfosta = 349.2721
b = 24.3482
c = 0.2017
0.991.164.92Patterned
Halseya = 4.231838
b = −0.023758
c = 1.617364
0.982.8911.18Patterned
Oswina = 13.47429
b = −0.08232
c = 2.76633
0.990.635.08Random
Hendersona = 0.00016
b = 56.2774
c = 71.80561
0.981.2211.08Random
GABa = 6.9442
b = 0.7921
c = 672.57
0.990.8445.99Random
BETa = 8.07627
b = −0.07179
c = 39.37878
0.970.494.83-
Table 4. Water activities (aw) of DSM and PFE calculated by modified Oswin model for different values of moisture content (M, % d.b.) and in the range of the absolute temperatures of the experiment (T, K).
M DSM PFE
T293303313293303313
7aw0.1050.1360.1790.1900.2220.262
10 0.2610.3220.3970.3860.4340.488
12 0.3830.4550.5360.5100.5600.612
15 0.5540.6250.6980.6590.7020.745
18 0.6860.7460.8030.7620.7960.829
20 0.7520.8030.8490.8100.8390.866
23 0.82450.8630.8970.8630.8850.905
25 0.85890.8900.9180.8880.9060.9231
30 0.9140.9350.9520.9290.9410.952
Disclaimer/Publisher’s Note: The statements, opinions and data contained in all publications are solely those of the individual author(s) and contributor(s) and not of MDPI and/or the editor(s). MDPI and/or the editor(s) disclaim responsibility for any injury to people or property resulting from any ideas, methods, instructions or products referred to in the content.