
Mean Reattachment Length of Roof Separation Bubbles Using Proper Orthogonal Decomposition
Abstract
:1. Introduction
2. Theoretical Background of POD
3. Methodology
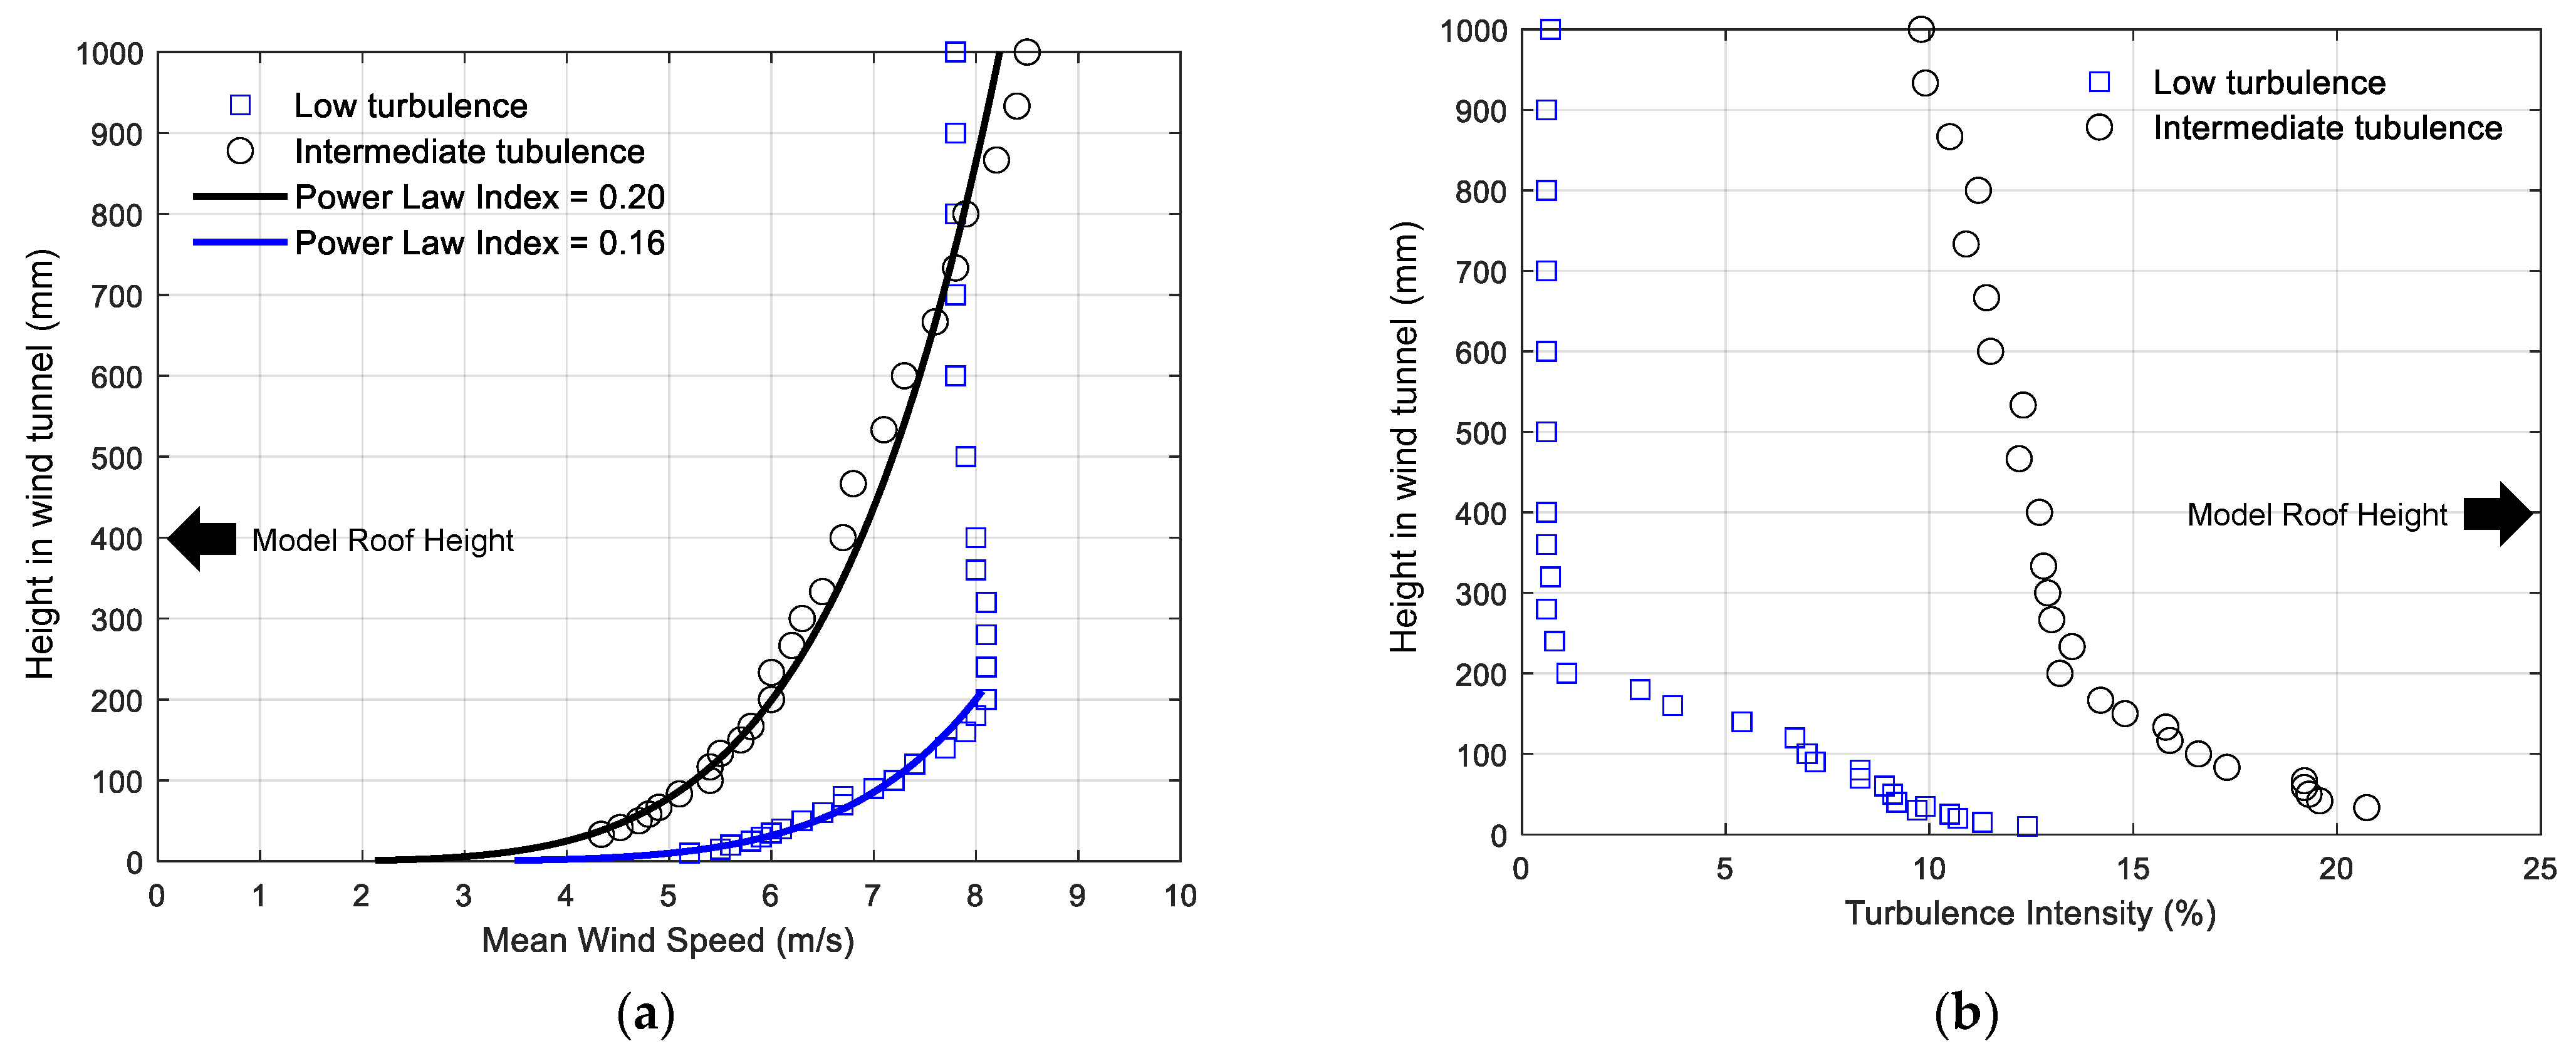
3.1. Data Collection for Roof Pressure on Low-Rise Building
3.2. Analysis of the Pressure Eigenmode Using POD
3.3. Mean Reattachment Length () Evaluation Using POD and Validation
4. Results
4.1. Pressure Fluctuation Characteristics
4.2. Interpretation of the POD Eigenmode
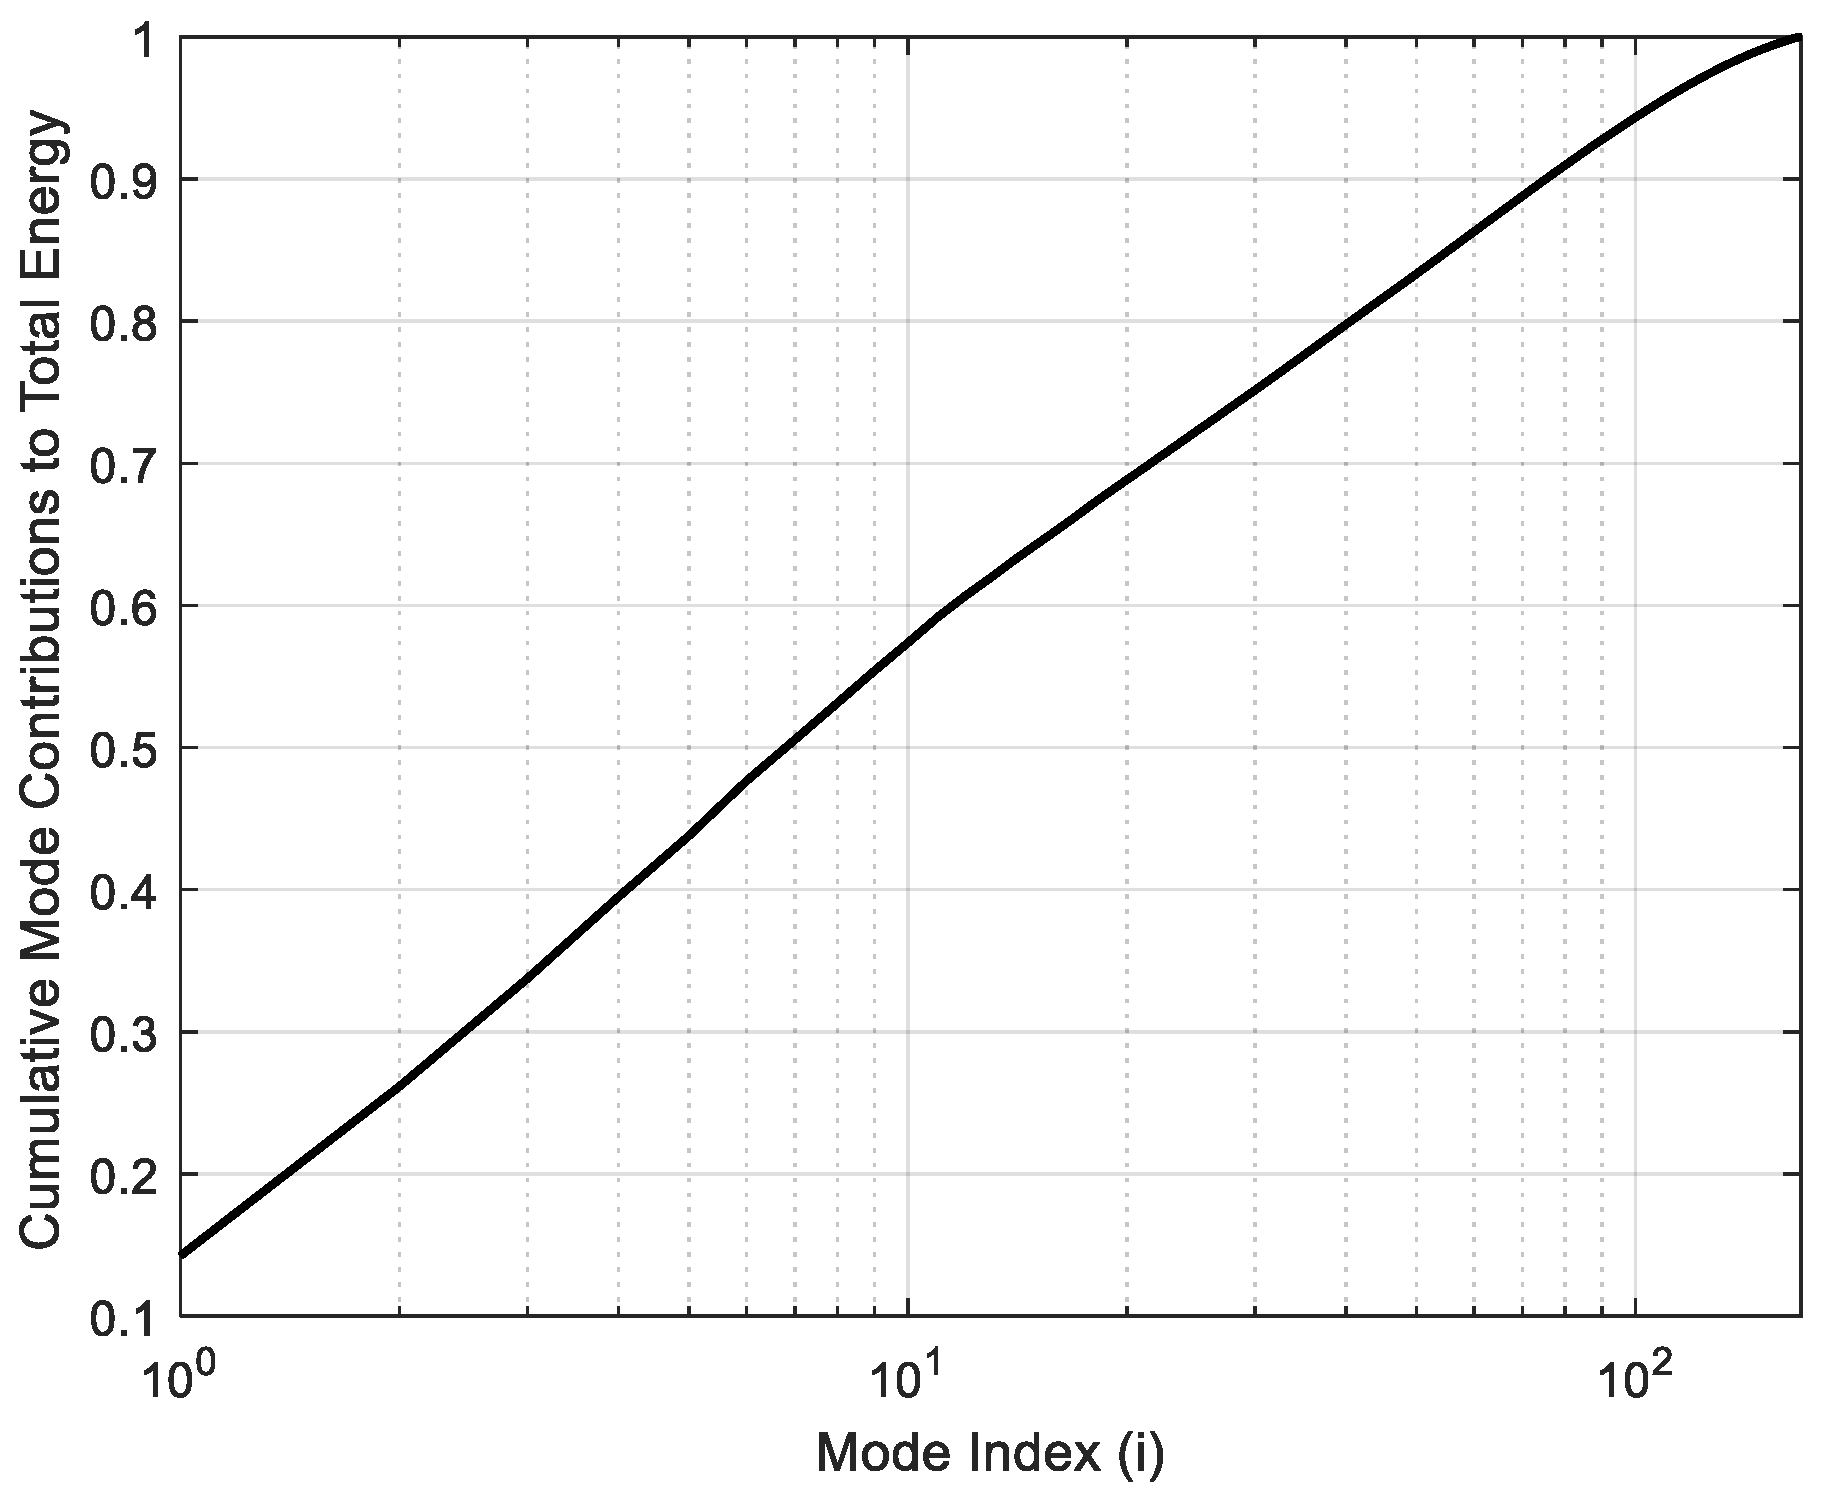
4.2.1. Eigenvalues, Wind Angles () of 0°
4.2.2. Interpretation of the POD Eigenmodes, Wind Angles () of 0°
4.2.3. Effects of Wind Direction on POD Eigenmodes, Wind Angles () of 5°
4.3. Evaluation of the Mean Attachment Length () Using the POD Eigenmode
4.4. Validation of the POD-Based Mean Reattachment Length ()
5. Conclusions
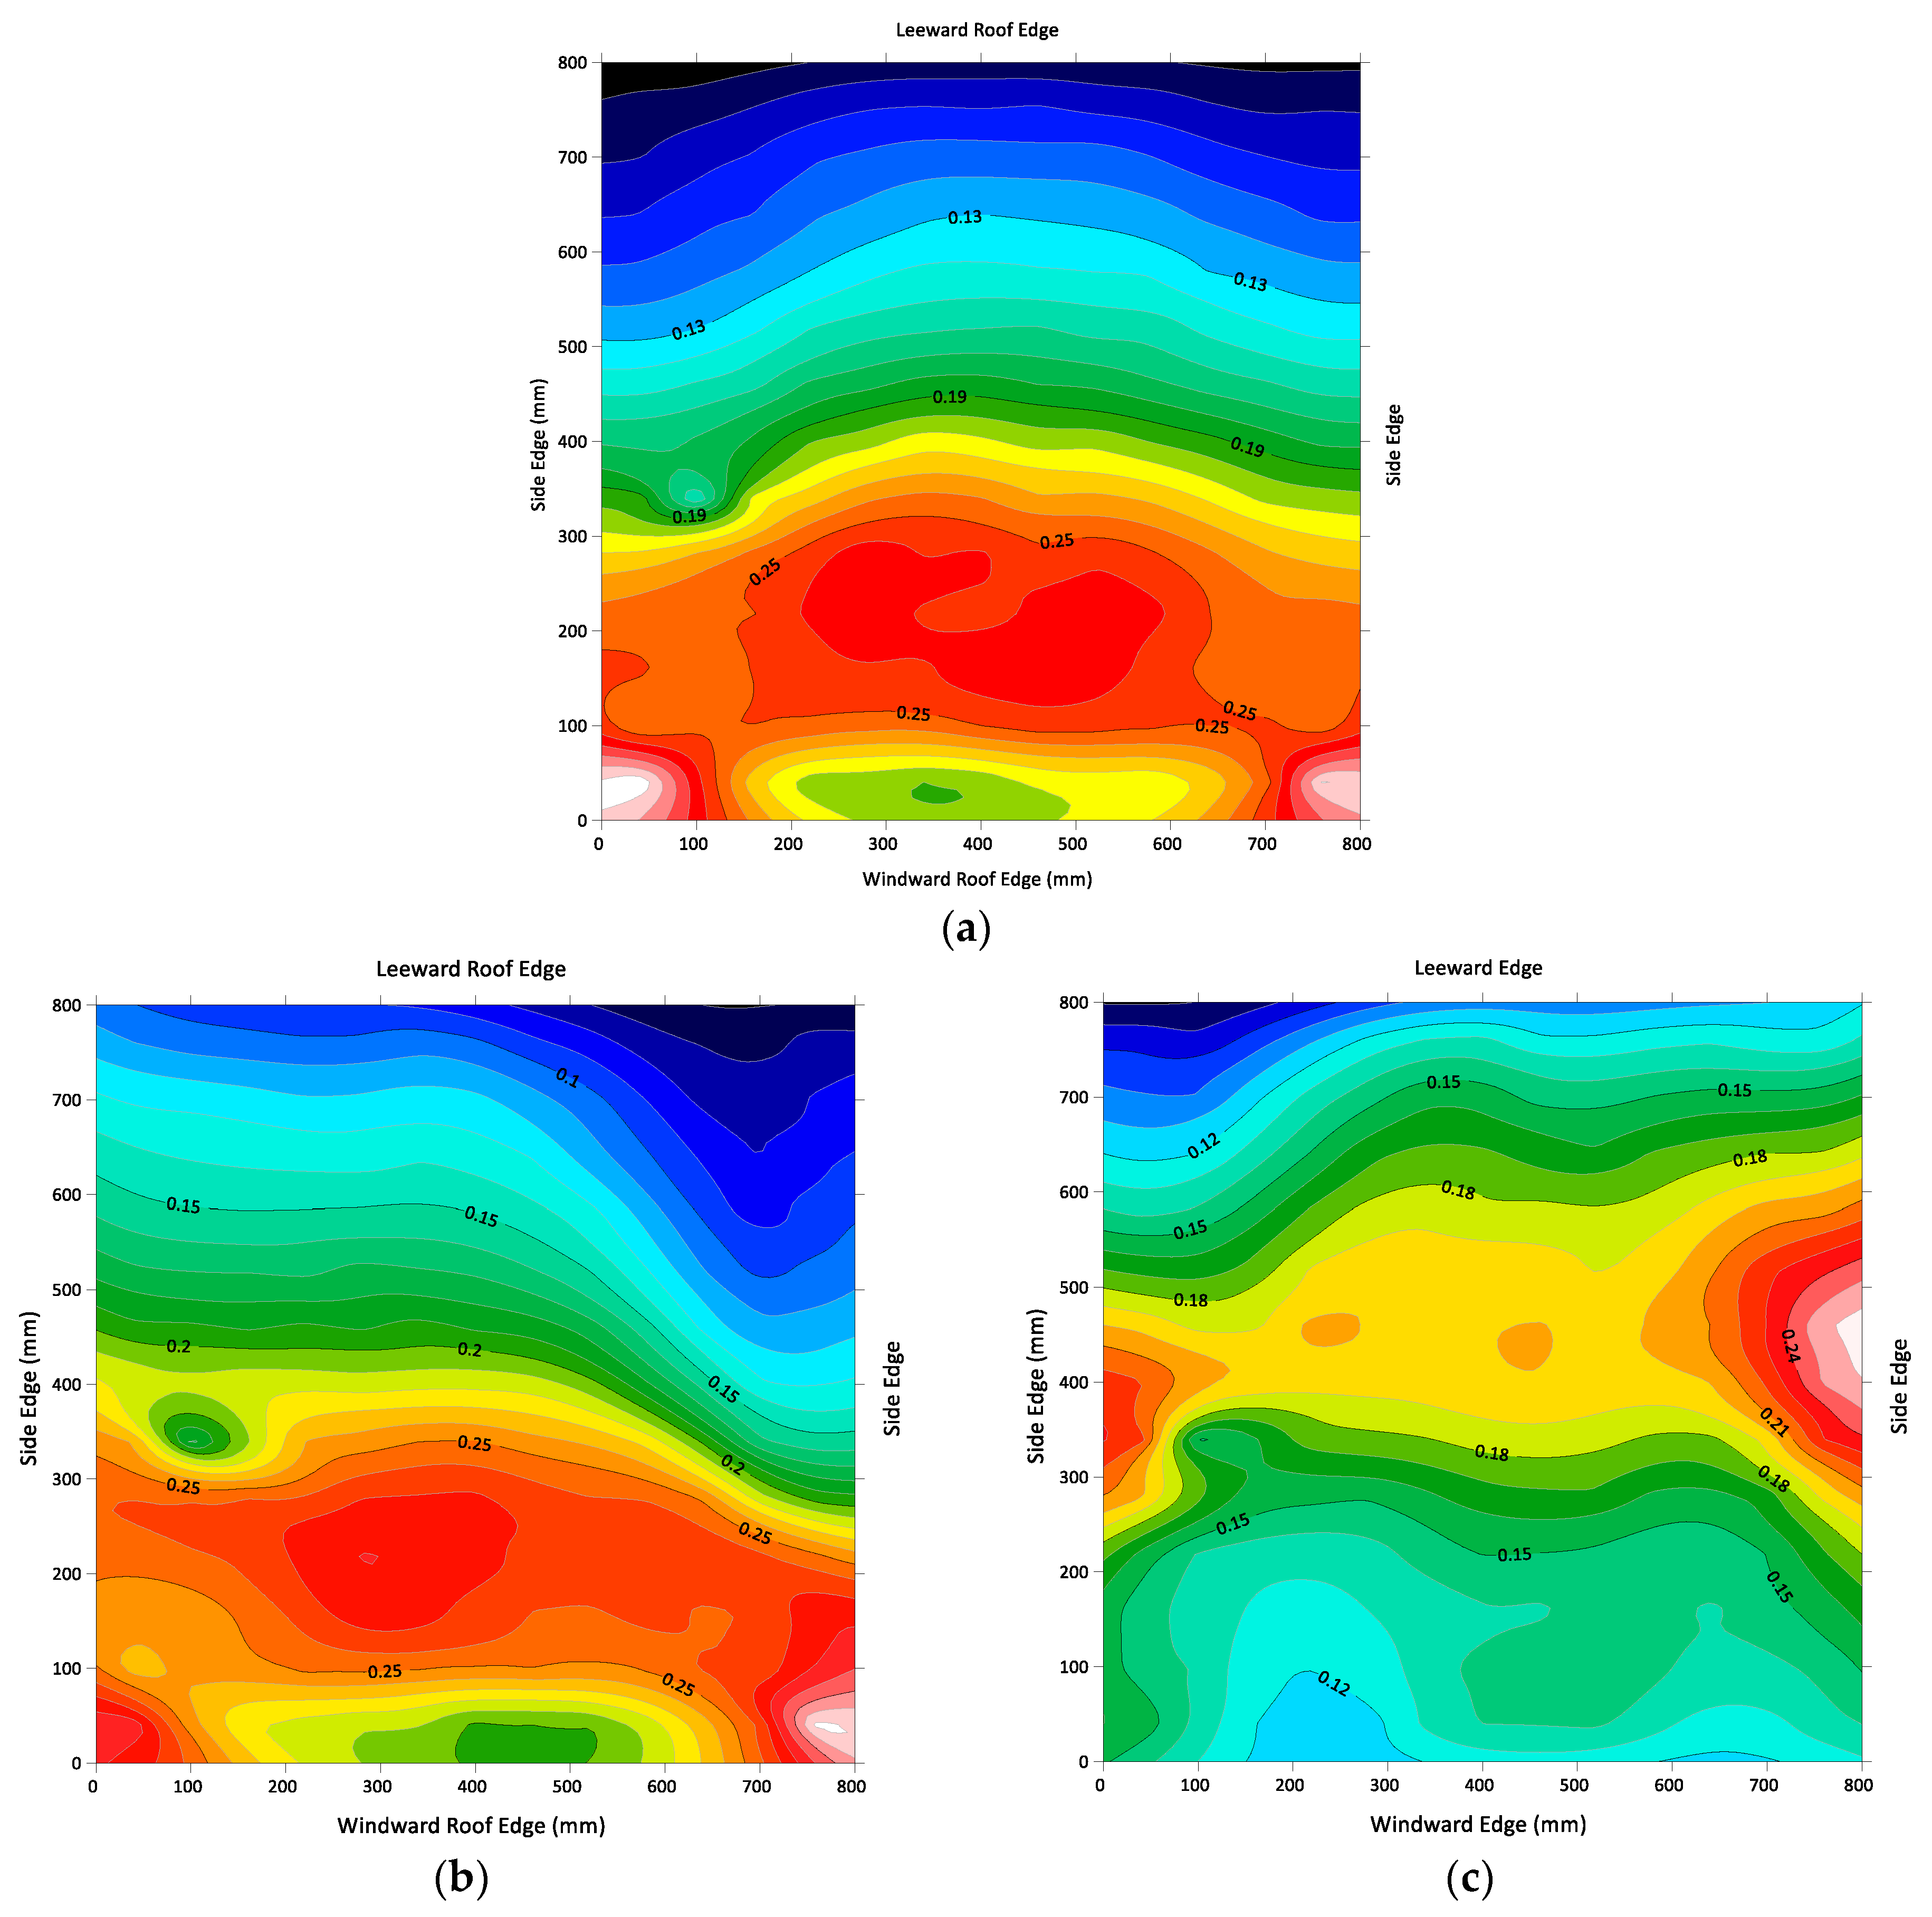
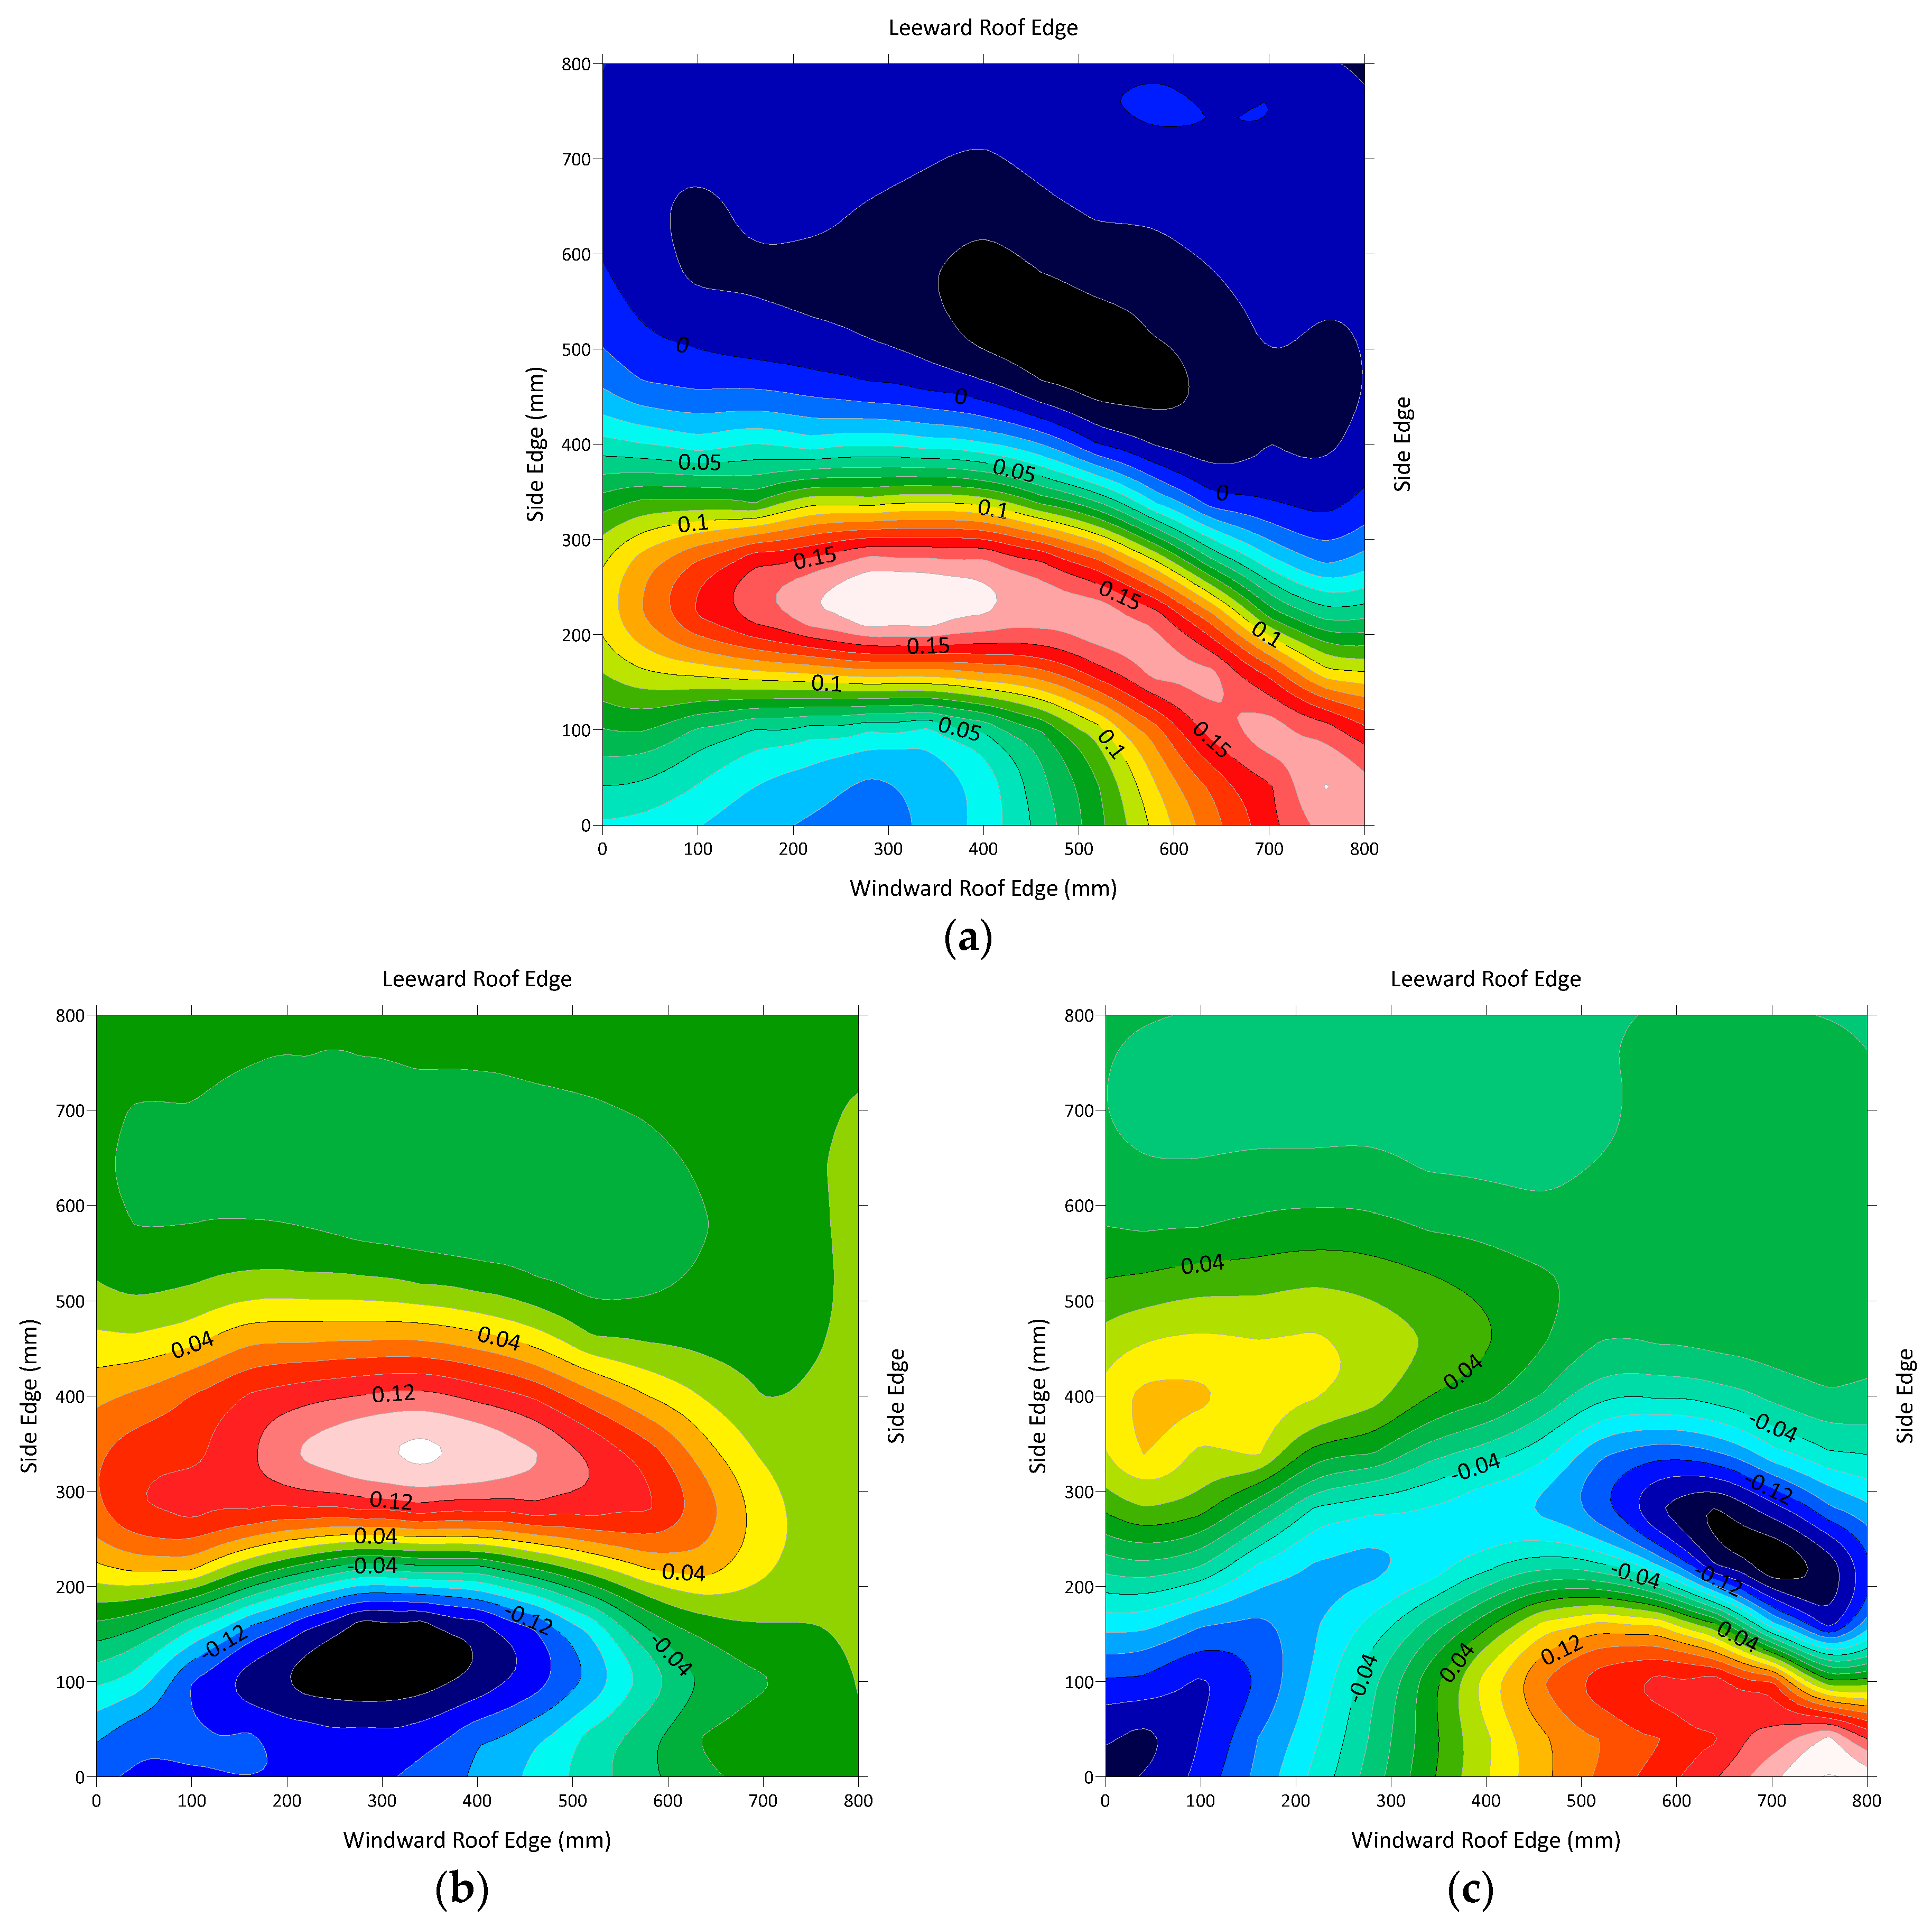
- Primary POD eigenmode: This mode effectively characterizes the major global mechanisms influencing the roof pressure field. The regions of high magnitude in the eigenmodes are closely associated with intense pressure fluctuations, reflecting the complex and variable fluid flow within the separation bubble. Conversely, areas of low magnitudes in the eigenmode are indicative of low-pressure fluctuations, characteristic of the more stable flow found in the reattachment area. Notably, these regions are distinguished by reversed signs in the eigenmode. This comprehensive characterization captures the dynamics associated with flow separation and reattachment, demonstrating the detailed nature of the pressure field’s variability in these regions.
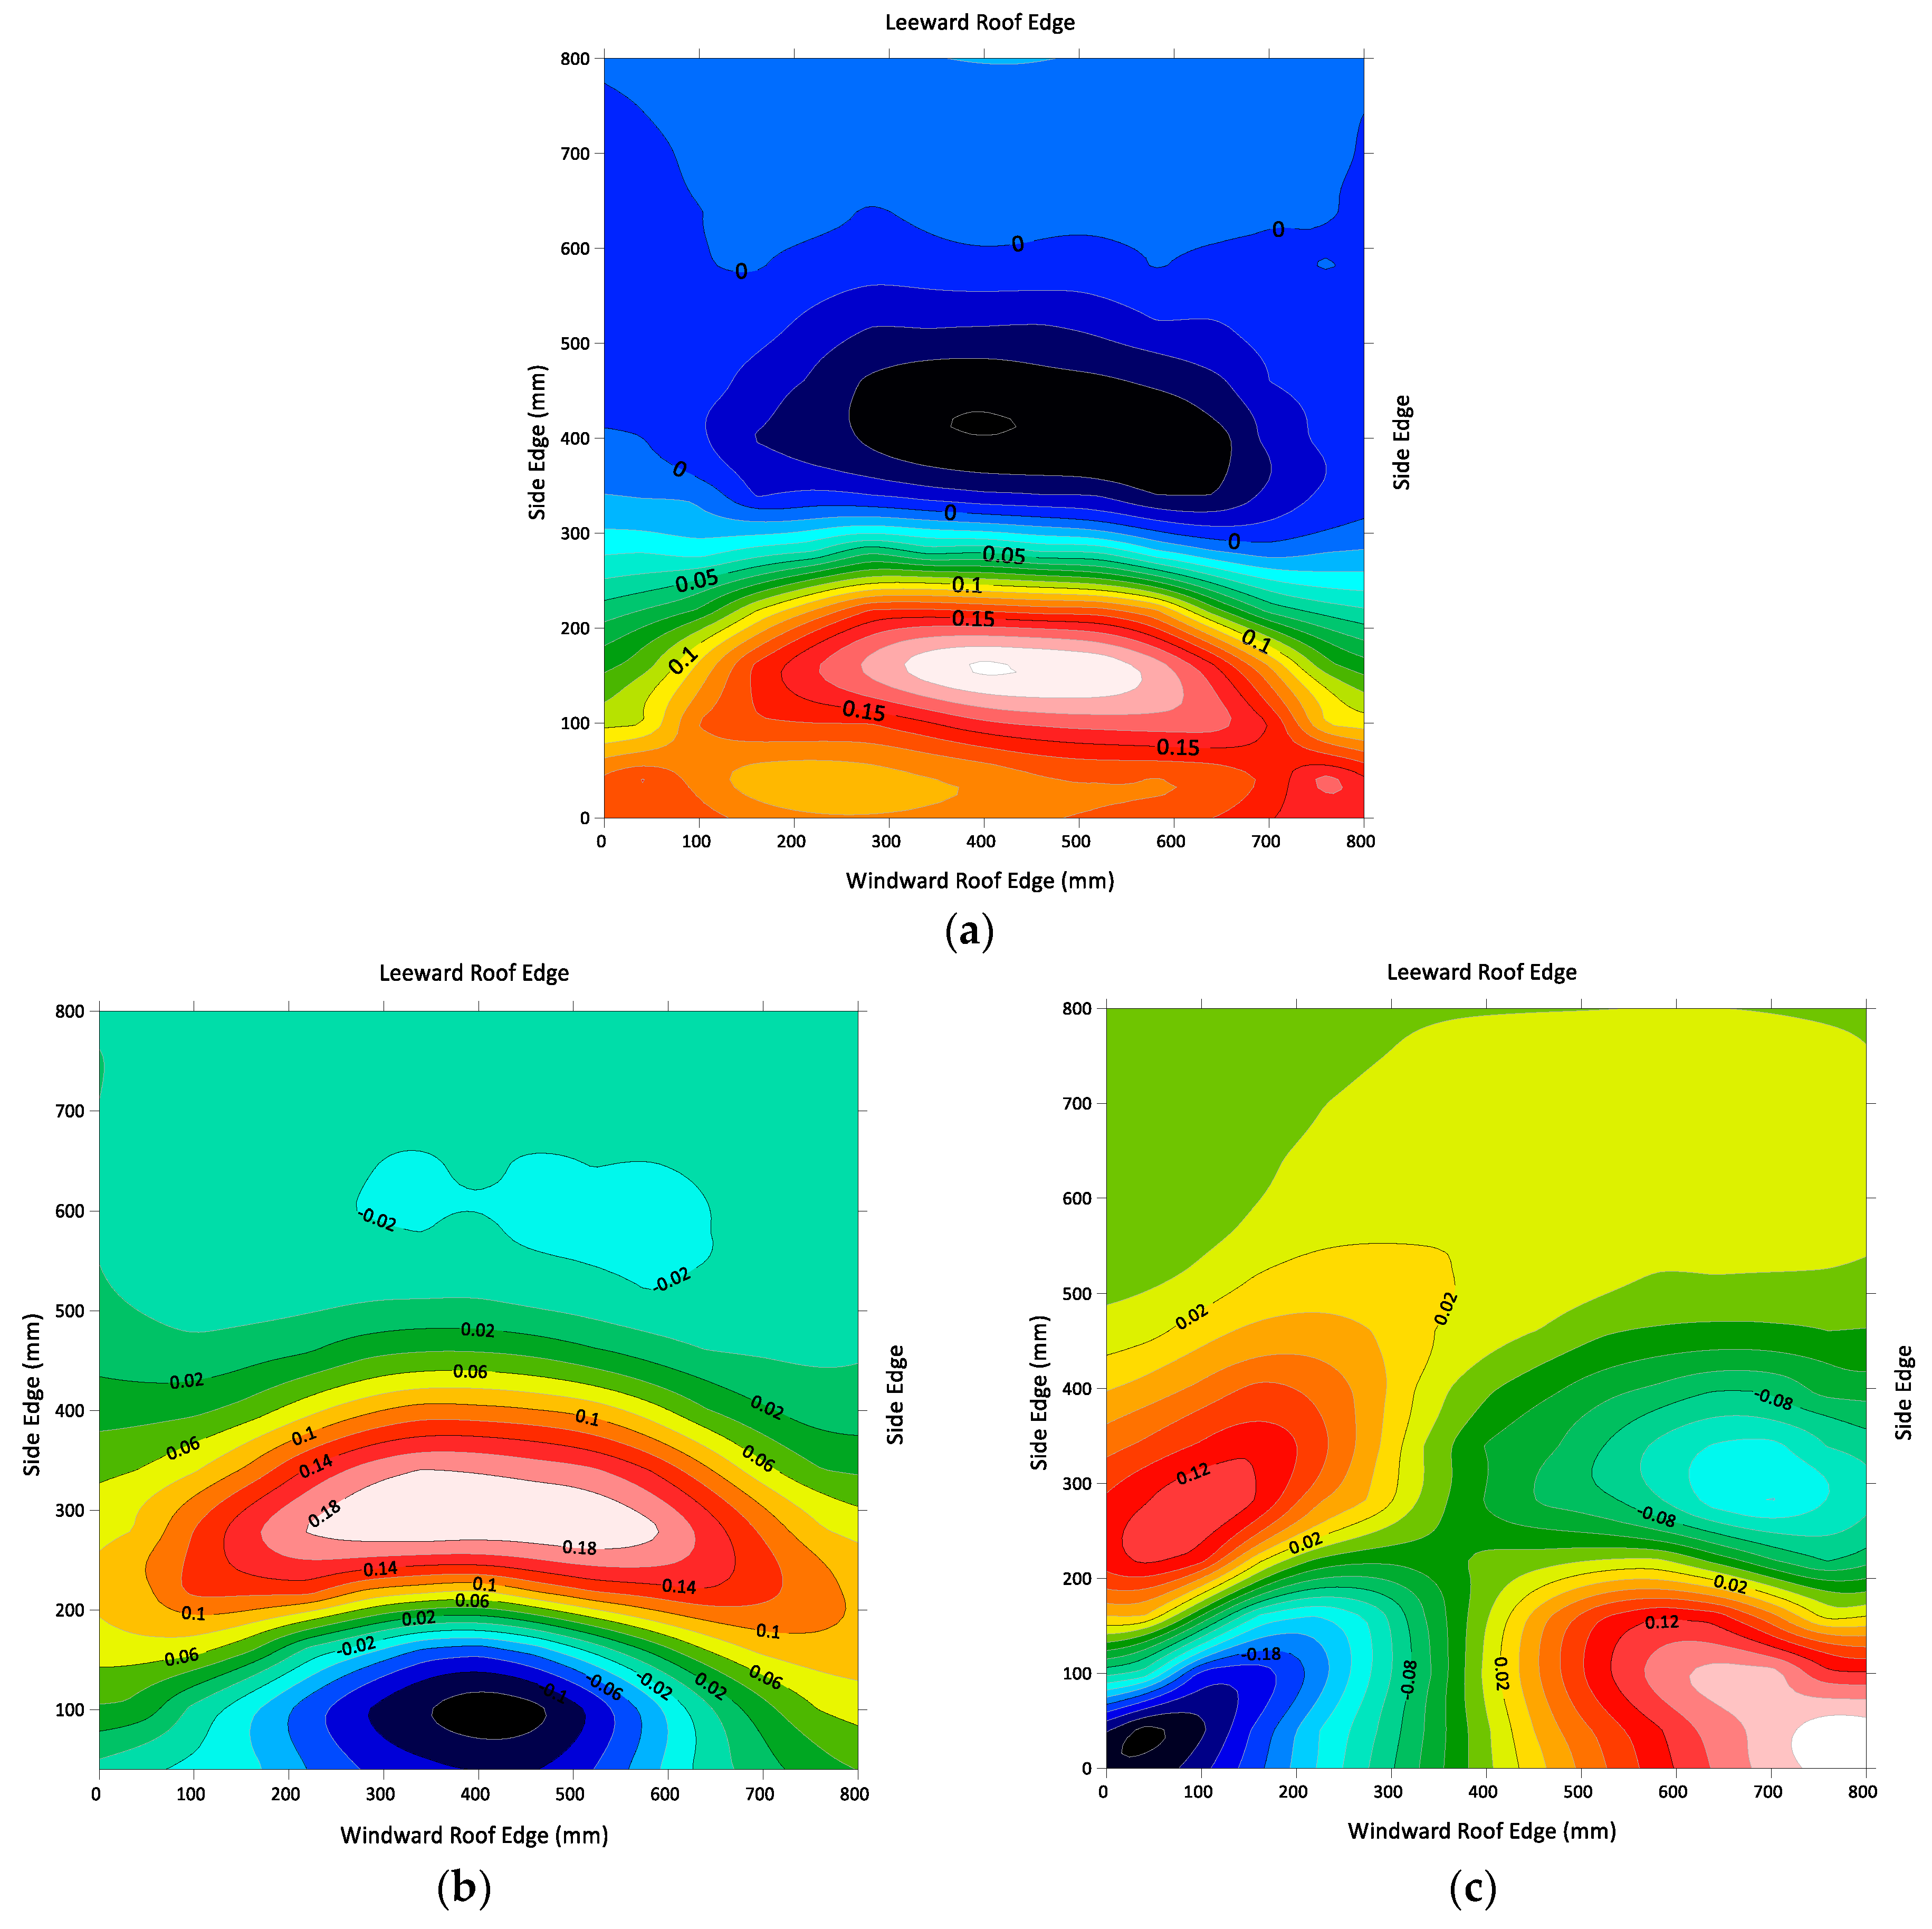
- Secondary POD eigenmode: This mode reveals the presence of vortex structures within the separation bubbles. This finding offers a deeper understanding of the complex flow behaviors and the underlying mechanics within the roof separation bubble.
- Third POD eigenmode: This mode exhibits pronounced effects at the windward front corners of the roof caused by the wind flow. The distribution of this eigenmode strongly correlates with the pressure fluctuations at these corners, indicating the impact of roof corners on flow dynamics.
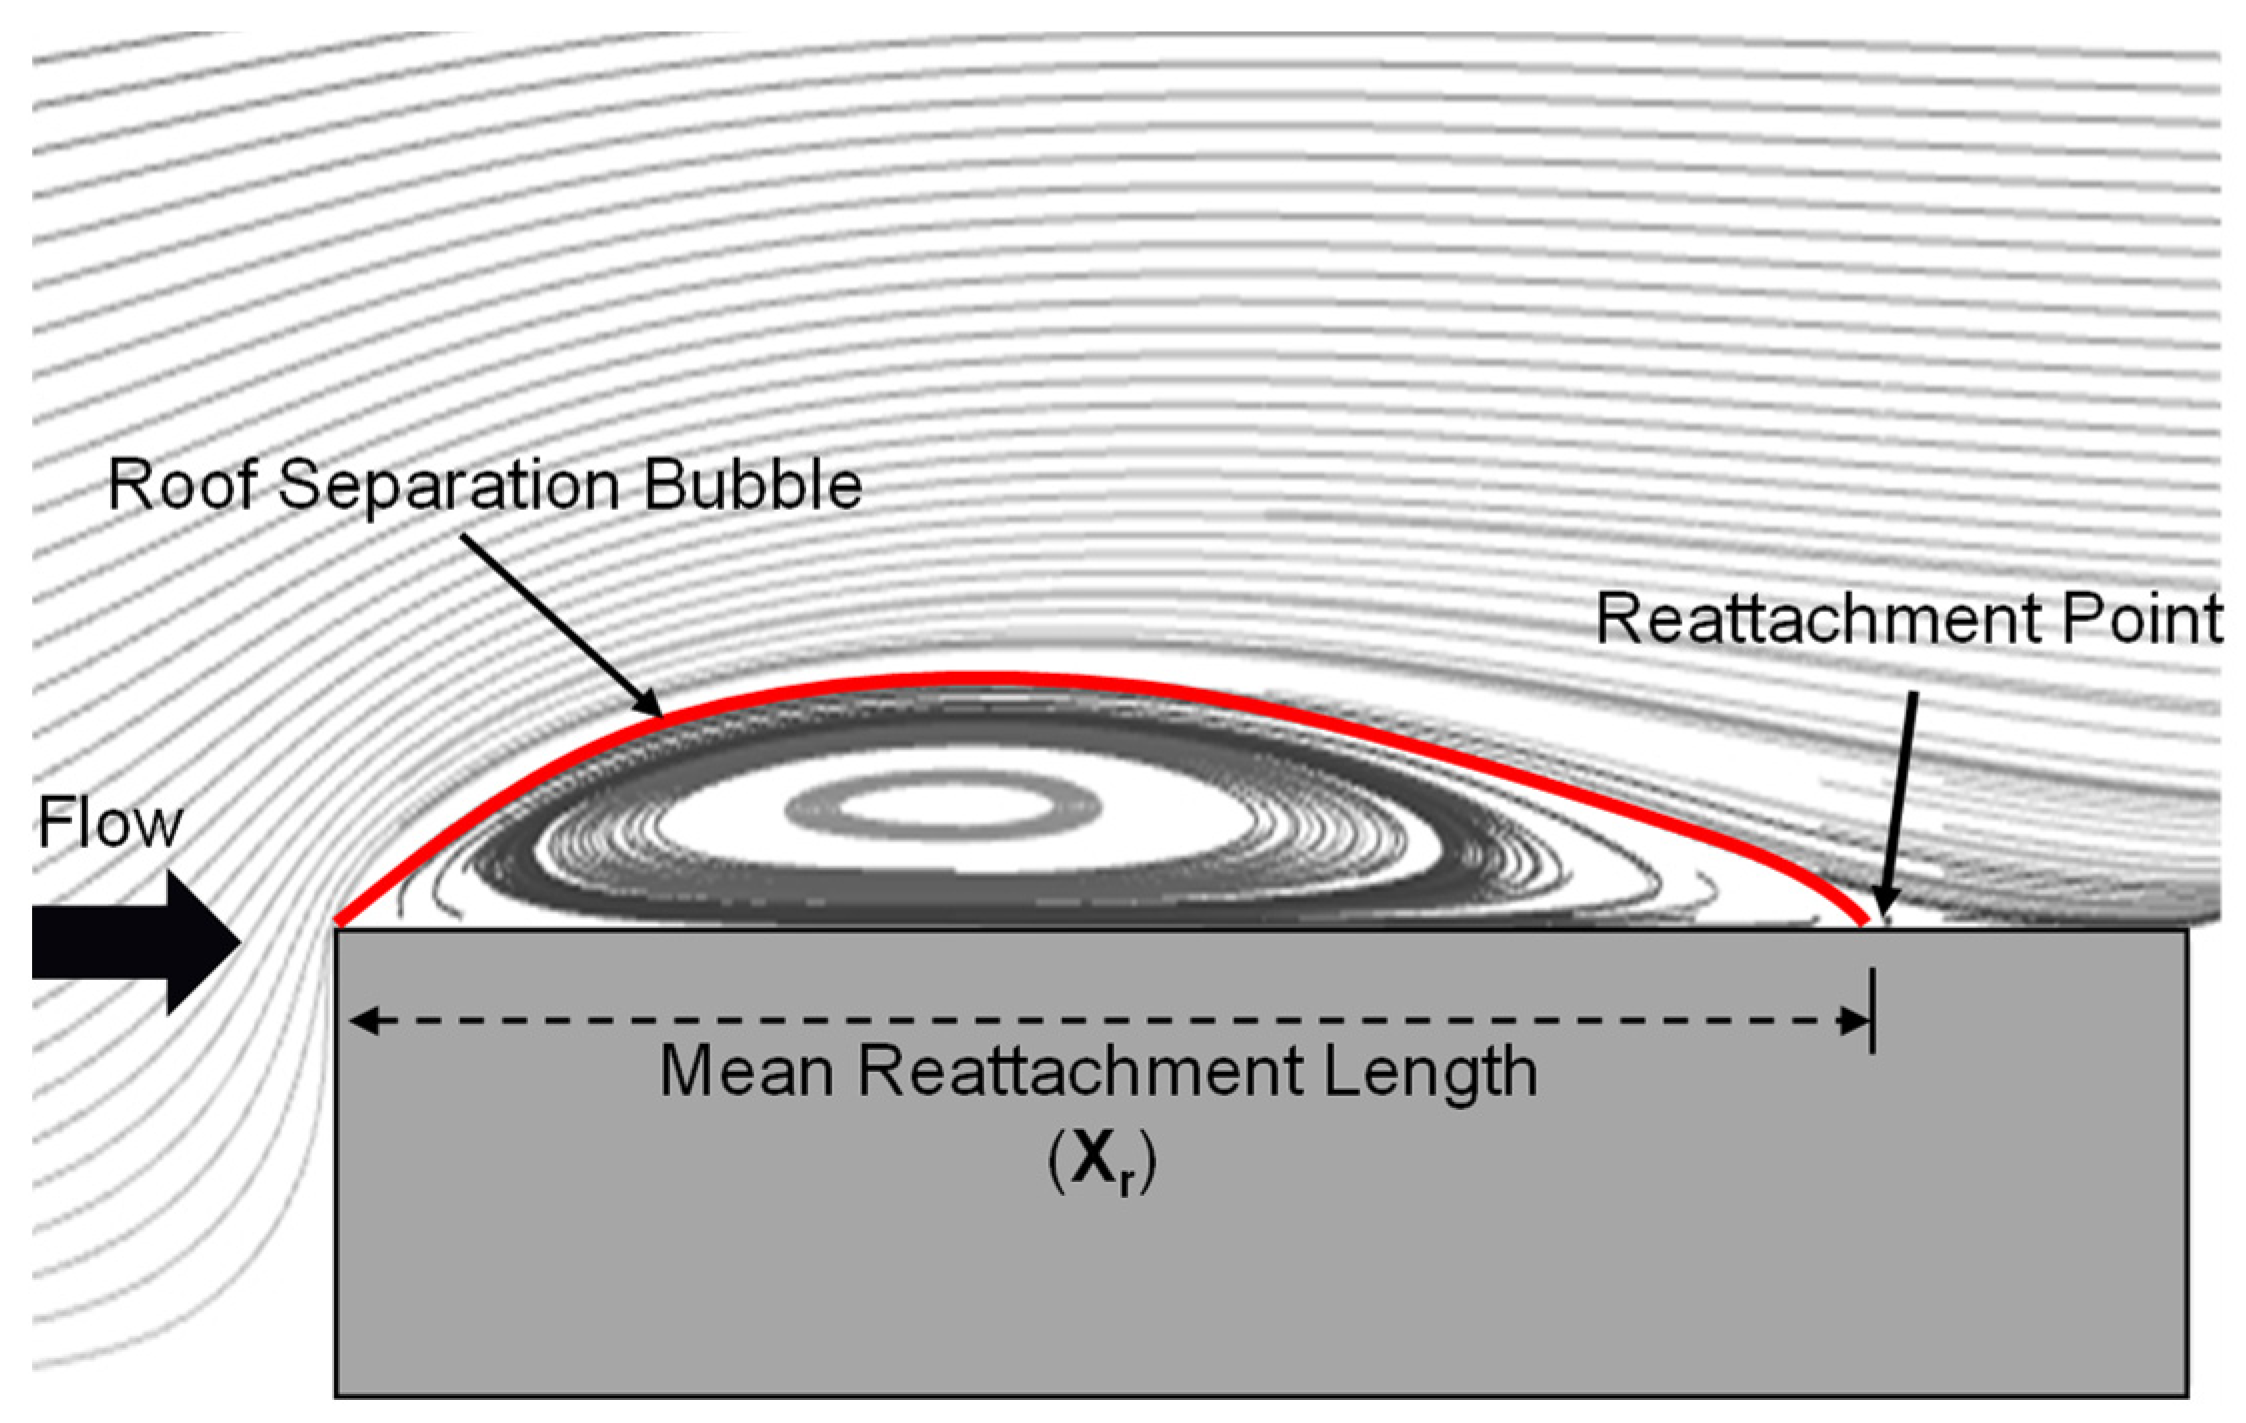
- Estimation of the mean reattachment length () using the first POD eigenmode: By evaluating the dominant POD eigenmodes and eigenvalues, it was deduced that the mean reattachment length () can be represented as the distance from the leading edge to the first zero-valued contour line after the first POD eigenmode reaches its maximum value. This offers a clear, quantifiable measure of the mean reattachment length () on the roof.
- Validation of the POD-based mean reattachment length (): The mean reattachment length () determined via the proposed POD-based method closely aligns with those obtained from an established aerodynamic database, with observed discrepancies being less than 5%. This underscores the robustness and precision of the POD approach in estimating the mean reattachment length () using the first POD eigenmode.
- Methodological advantages: The technique’s capacity to precisely pinpoint the flow reattachment location across the entire separation region, using solely pressure data, is a significant advancement. This negates the need for specialized aerodynamic databases, making the approach adaptable to a model regardless of its shapes and flow conditions.
Author Contributions
Funding
Institutional Review Board Statement
Informed Consent Statement
Data Availability Statement
Acknowledgments
Conflicts of Interest
References
- Ham, H.J.; Bienkiewicz, B. Wind tunnel simulation of TTU flow and building roof pressure. J. Wind Eng. Ind. Aerodyn. 1988, 94, 119–133. [Google Scholar] [CrossRef]
- Lyn, D.A.; Rodi, W. The flapping shear layer formed by flow separation from the forward corner of a square cylinder. J. Fluid Mech. 1994, 267, 353–376. [Google Scholar] [CrossRef]
- Saathoff, P.J.; Melbourne, W.H. Effects of free stream turbulence on surface pressure fluctuations in a separation bubble. J. Fluid Mech. 1997, 337, 1–24. [Google Scholar] [CrossRef]
- Shu, Z.R.; Li, Q.S. Dynamic characterization of wind pressure fluctuations in separated and reattaching flows. Adv. Struct. Eng. 2022, 25, 2001–2009. [Google Scholar] [CrossRef]
- Wu, C.-H.; Akon, A.F.; Kopp, A.G. Effects of turbulence on the mean pressure field in the separated-reattaching flow above a low-rise building. J. Wind Eng. Ind. Aerodyn. 2017, 171, 79–92. [Google Scholar] [CrossRef]
- Chavez, M.; Baskaran, A.; Aldoum, M.; Stathopoulos, T.; Geleta, T.N.; Bitsuamlak, G.T. Wind loading on a low-slope gabled roof: Comparison of field measurements, wind tunnel data, and code provisions. J. Wind Eng. Ind. Aerodyn. 2022, 267, 114646. [Google Scholar] [CrossRef]
- Tieleman, H.W.; Surry, D.; Mehta, K.C. Full/model scale comparison of surface pressures on the Texas Tech experimental building. J. Wind Eng. Ind. Aerodyn. 1996, 61, 1–23. [Google Scholar] [CrossRef]
- Lee, S.; Ham, H.J.; Kim, H.J. Fragility assessment for cladding of industrial buildings subjected to extreme wind. J. Asian Archit. Build. Eng. 2013, 12, 65–72. [Google Scholar] [CrossRef]
- Ellingwood, B.R.; Rosowsky, D.V.; Li, Y.; Kim, J.H. Fragility assessment of light-frame wood construction subjected to wind and earthquake hazards. J. Struct. Eng. 2004, 130, 1921–1930. [Google Scholar] [CrossRef]
- Aly, A.; Bewsowar, R. Aerodynamic mitigation of wind-induced uplift forces on low-rise buildings: A comparative study. J. Build. Eng. 2016, 6, 267–276. [Google Scholar] [CrossRef]
- Mooneghi, M.A.; Kargarmoakhar, R. Aerodynamic mitigation and shape optimization of buildings: Review. J. Build. Eng. 2016, 6, 225–235. [Google Scholar] [CrossRef]
- Sun, H.R.; Ye, J.H. 3D Characteristics of separation bubbles around flat roofs by PIV technique. Eng. Mech. 2016, 33, 121–131. [Google Scholar]
- Chang, P.K. Separation of Flow; Elsevier Science: Amsterdam, The Netherlands, 1970; pp. 272–530. [Google Scholar]
- Melbourne, W.H. Turbulence and the leading edge phenomenon. J. Wind Eng. Ind. Aerodyn. 1993, 49, 45–63. [Google Scholar] [CrossRef]
- Nakamura, Y. Bluff-body aerodynamics and turbulence. J. Wind Eng. Ind. Aerodyn. 1993, 49, 65–78. [Google Scholar] [CrossRef]
- Kasagi, N.; Matsunaga, A.; Kawara, S. Turbulence measurement in a separated and reattaching flow over a backward-facing step with the aid of three-dimensional particle tracking velocimetry. J. Wind Eng. Ind. Aerodyn. 1993, 46–47, 821–829. [Google Scholar] [CrossRef]
- Akon, F.A. Effects of Turbulence on the Separating-Reattaching Flow above Surface-Mounted, Three-Dimensional Bluff Bodies. Ph.D. Thesis, Western University, London, UK, 2017. [Google Scholar]
- Fang, X.; Tachie, M.F. Flows over surface-mounted bluff bodies with different spanwise widths submerged in a deep turbulent boundary layer. J. Fluid Mech. 2019, 877, 717–758. [Google Scholar] [CrossRef]
- Shu, Z.R.; Li, Q.S. An experimental investigation of surface pressures in separated and reattaching flows: Effects of freestream turbulence and leading edge geometry. J. Wind Eng. Ind. Aerodyn. 2017, 165, 55–66. [Google Scholar] [CrossRef]
- Scharnowski, S.; Kähler, C.J. Particle image velocimetry—Classical operating rules from today’s perspective. Opt. Lasers Eng. 2020, 135, 106185. [Google Scholar] [CrossRef]
- Hudy, L.M.; Naguib, A.M.; William, M.; Humphreys, W.M., Jr. Wall-pressure-array measurements beneath a separating/reattaching flow region. Phys. Fluids 2003, 15, 706–717. [Google Scholar] [CrossRef]
- Koklu, M.A. A New Method for Predicting Turbulent Flow Reattachment Location: Application of Stratford Criterion for Reattaching Flows; NASA: Hampton, VA, USA, 2021; pp. 5–6. [Google Scholar]
- Roshko, A.; Lau, J.C. Some observations on transition and reattachment of a free shear layer in incompressible flow. In Proceedings of the 1965 Heat Transfer and Fluid Mechanics Institute, Los Angeles, CA, USA, 21–23 June 1965. [Google Scholar]
- Ruderich, R.; Fernholz, H.H. An experimental investigation of a turbulent shear flow with separation, reverse flow, and reattachment. J. Fluid Mech. 1986, 163, 283–322. [Google Scholar] [CrossRef]
- Westphal, R.V.; Johnston, J.P.; Eaton, J.K. Experimental Study of Flow Reattachment in a Single Sided Sudden Expansion; NASA: Hampton, VA, USA, 1984; pp. 143–144. [Google Scholar]
- Ho, T.C.E.; Surry, D.; Morrish, D.; Kopp, G.A. The UWO contributions to the NIST aerodynamic database for wind loads on low buildings: Part1. Archiving format and basic aerodynamic data. J. Wind Eng. Ind. Aerodyn. 2005, 93, 1–30. [Google Scholar] [CrossRef]
- Li, C.Y.; Chen, Z.; Tim, K.T.; Weerasuriya, A.U.; Zhang, X.; Fu, Y.; Lin, X. The linear-time-invariance notion of the Koopman analysis. Part 2. Dynamic Koopman modes, physics interpretations and phenomenological analysis of the prism wake. J. Fluid Mech. 2023, 959, A15. [Google Scholar] [CrossRef]
- Li, C.Y.; Chen, Z.; Lin, X.; Weerasuriya, A.U.; Zhang, X.; Fu, Y.; Tse, T.K. The linear-time-invariance notion to the Koopman analysis: The architecture, pedagogical rendering, and fluid–structure association. Phys. Fluids 2002, 34, 125136. [Google Scholar] [CrossRef]
- Zhou, L.; Tse, K.T.; Hu, G.; Li, Y. Higher order dynamic mode decomposition of wind pressures on square buildings. J. Wind Eng. Ind. Aerodyn. 2021, 211, 104545. [Google Scholar] [CrossRef]
- Li, C.Y.; Chen, Z.; Weerasuriya, A.U.; Zhang, X.; Lin, X.; Zhou, L.; Tim, K.T. Best practice guidelines for the dynamic mode decomposition from a wind engineering perspective. J. Wind. Eng. Ind. Aerodyn. 2023, 241, 105506. [Google Scholar] [CrossRef]
- Lumley, J.L. The Structure of Inhomogeneous Turbulent Flows. In Atmospheric Turbulence and Radio Wave Propagation, 1st ed.; Yaglom, A.M., Tartarsky, V.I., Eds.; Nauka: Moscow, Russia, 1967; pp. 166–177. [Google Scholar]
- Bienkiewicz, B.; Ham, H.J.; Sun, Y. Proper orthogonal decomposition of roof pressure. J. Wind Eng. Ind. Aerodyn. 1993, 50, 193–202. [Google Scholar] [CrossRef]
- Bienkiewicz, B.; Tamura, Y.; Ham, H.J.; Ueda, H.; Hibi, K. Proper orthogonal decomposition and reconstruction of multi-channel roof pressure. J. Wind Eng. Ind. Aerodyn. 1995, 54/55, 369–381. [Google Scholar] [CrossRef]
- Tamura, Y.; Ueda, H.; Kikuchi, H.; Hibi, K.; Suganuma, S.; Bienkiewicz, B. Proper orthogonal decomposition study of approach wind-building pressure correlation. J. Wind Eng. Ind. Aerodyn. 1997, 72, 421–431. [Google Scholar] [CrossRef]
- Tamura, Y.; Suganuma, S.; Kikuchi, H.; Hibi, K. Proper orthogonal decomposition of random wind pressure field. J. Fluids Struct. 1999, 13, 1069–1095. [Google Scholar] [CrossRef]
- Gilliam, X.; Dunyak, J.P.; Smith, D.A.; Wu, F. Using projection pursuit and proper orthogonal decomposition to identify independent flow mechanisms. J. Wind Eng. Ind. Aerodyn. 2004, 92, 53–69. [Google Scholar] [CrossRef]
- Su, Y.; Di, J.; Li, J.; Xia, F. Wind pressure field reconstruction and prediction of large-span roof structure with folded-plate type based on proper orthogonal decomposition. Appl. Sci. 2022, 12, 8430. [Google Scholar] [CrossRef]
- Wang, F.; Lan, K.M. POD analysis of wind field past rectangular buildings. In Proceedings of the 9th Asia Pacific Conference on Wind Engineering, Auckland, New Zealand, 3–7 December 2017. [Google Scholar]
- Kim, B.; Tse, K.T.; Tamura, Y. POD analysis for aerodynamic characteristics of tall linked buildings. J. Wind Eng. Ind. Aerodyn. 2018, 181, 126–140. [Google Scholar] [CrossRef]
- Kim, B.; Tse, K.T. POD analysis of aerodynamic correlations and wind-induced responses of two tall linked buildings. Eng. Struct. 2018, 176, 369–384. [Google Scholar] [CrossRef]
- Zhou, L.; Tse, K.T.; Hu, G.; Li, Y. Mode interpretation of interference effects between tall buildings in tandem and side-by-side arrangement with POD and ICA. Eng. Struct. 2021, 243, 112616. [Google Scholar] [CrossRef]
- Murakami, T.; Nishida, Y.; Taniguchi, T. Study on Phase Characteristics of Wind Pressure Fields around a Prism Using Complex Proper Orthogonal Decomposition. Wind 2023, 3, 35–63. [Google Scholar] [CrossRef]
- Panofsky, H.; Dutton, J. Atmospheric Turbulence; John Wiley & Sons: New York, NY, USA, 1984. [Google Scholar]
- Weiss, J. A Tutorial on the proper orthogonal decomposition. In Proceedings of the American Institute of Aeronautics and Astronautics (AIAA) Aviation 2019 Forum, Dallas, TX, USA, 17–21 June 2019. [Google Scholar]
- Shim, Y.M.; Sharma, R.N.; Richards, P.J. Proper orthogonal decomposition analysis of the flow field in a plane jet. Exp. Therm. Fluid Sci. 2013, 51, 37–55. [Google Scholar] [CrossRef]
- Kiya, M.; Sasaki, K. Free-stream turbulence effects on a separation bubble. J. Wind Eng. Ind. Aerodyn. 1983, 14, 375–386. [Google Scholar] [CrossRef]
- Li, S.; Liu, Y.; Ming, L.; Zeng, W.; Gu, S.; Gao, Y. The effect of turbulence intensity on the unsteady gust loading on a 5:1 rectangular cylinder. J. Wind Eng. Ind. Aerodyn. 2022, 225, 104994. [Google Scholar] [CrossRef]


| Mode | Eigenvalue | Normalized Eigenvalue |
|---|---|---|
| 1 | 0.91 | 0.14 |
| 2 | 0.77 | 0.11 |
| 3 | 0.49 | 0.08 |
| Turbulence Intensity | ||
|---|---|---|
| = 12.7% | = 0.6% | |
| Maximum (mm) | 410 | 694 |
| Minimum (mm) | 290 | 637 |
| Average (mm) | 326 | 670 |
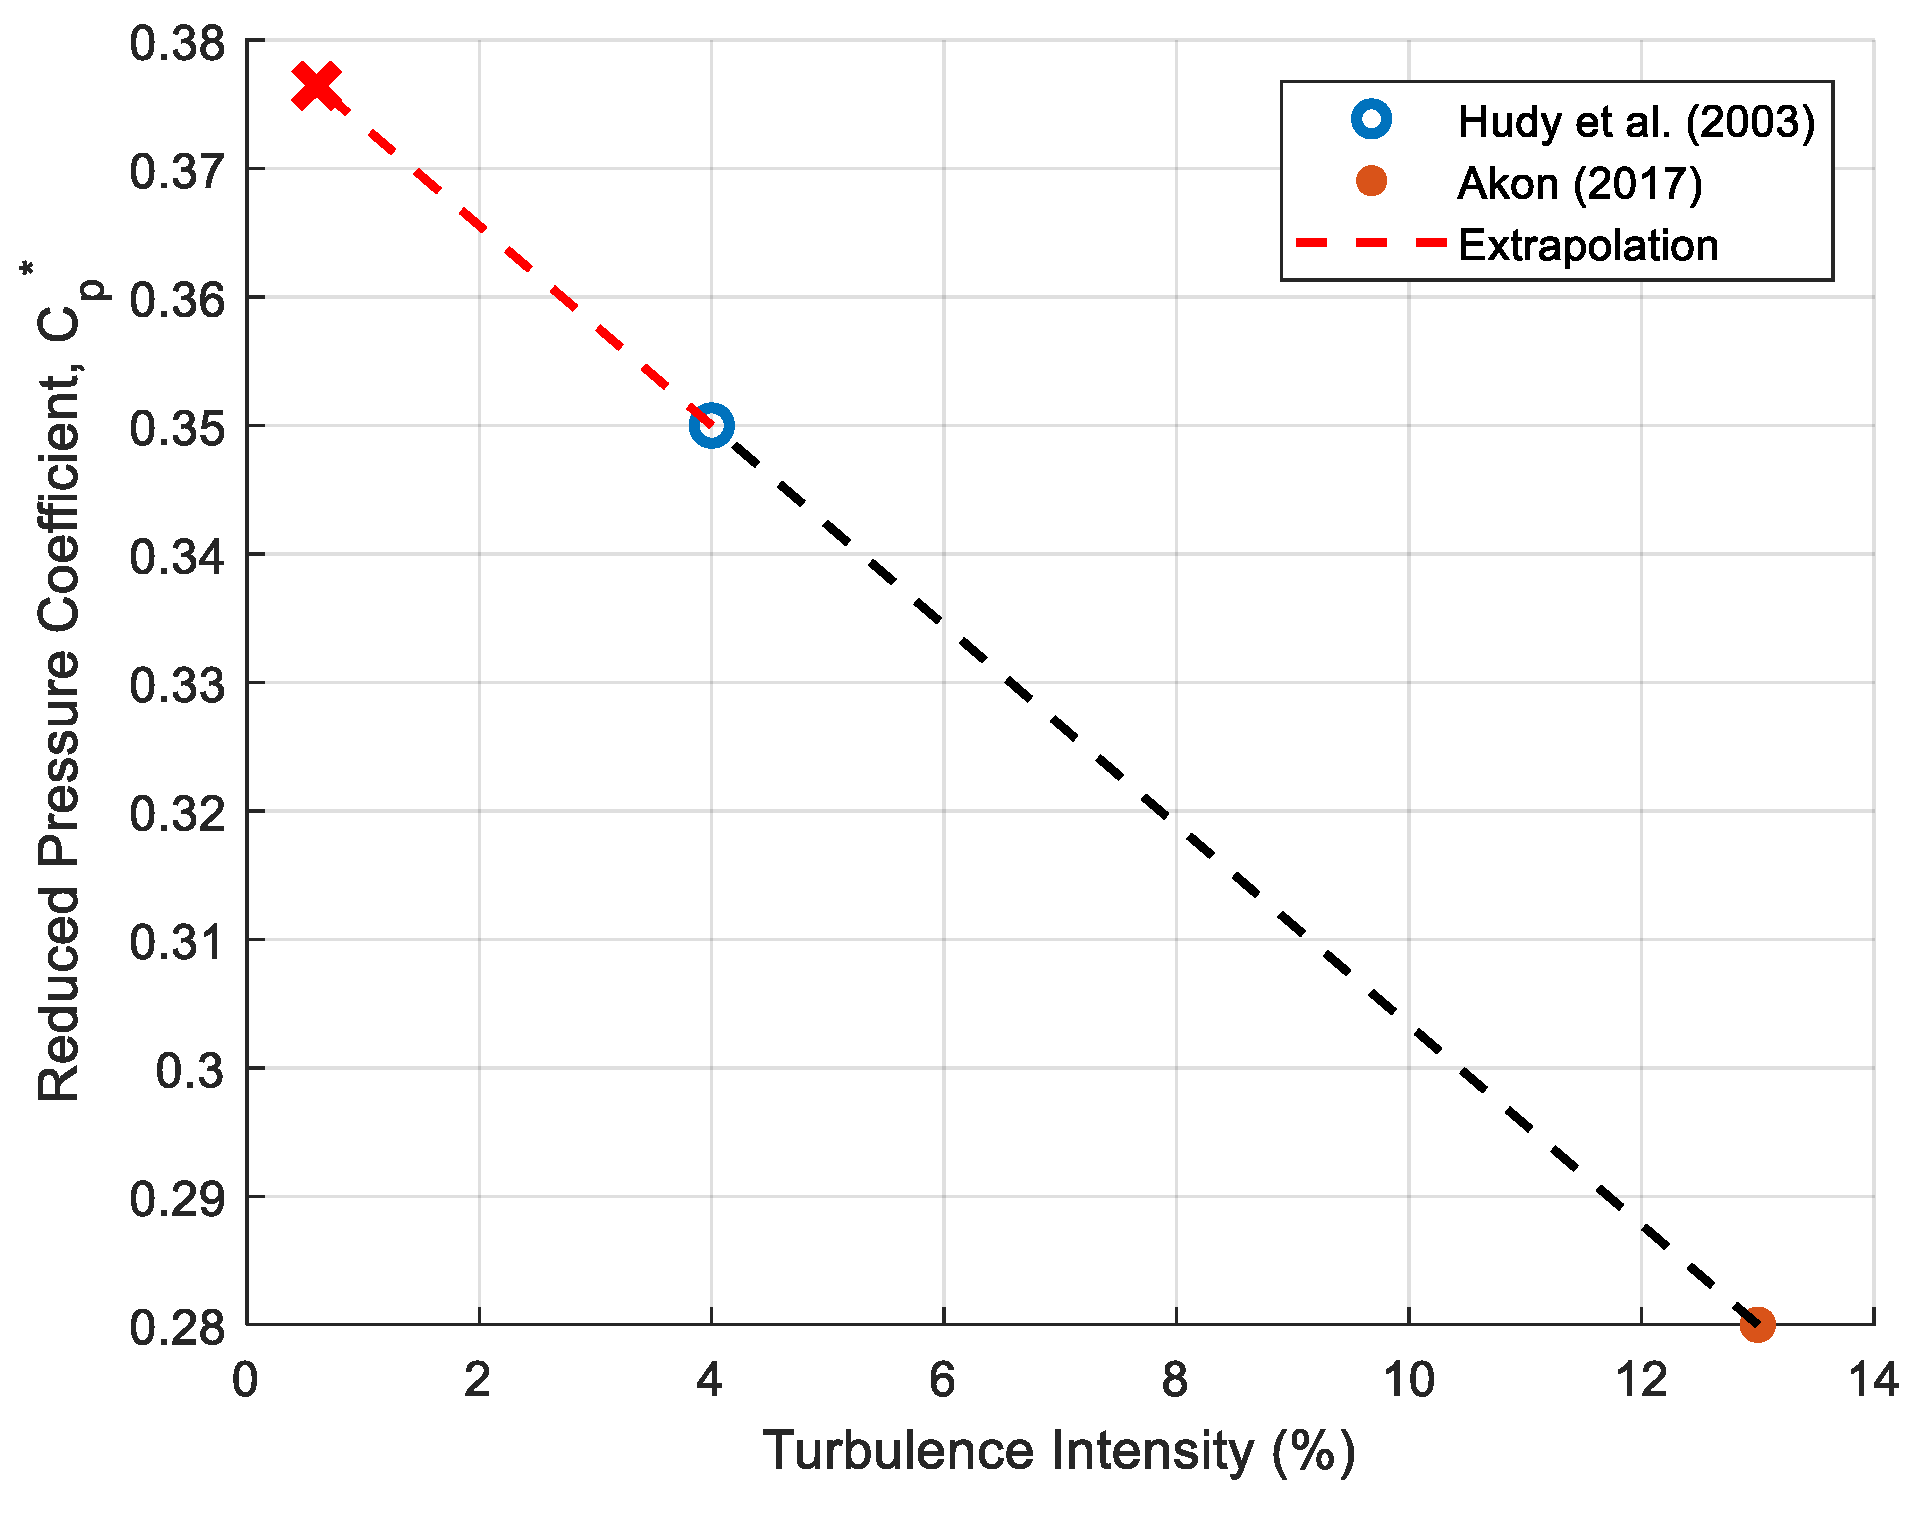
| Turbulence Intensity ( , %) | Reduced Pressure Coefficient () | Reference |
|---|---|---|
| 4 | 0.35 | Hudy et al. [21] |
| 13 | 0.28 | Akon [17] |
| 17 | 0.25 | Akon [17] |
| 18 | 0.24 | Ho et al. [26] |
| 26 | 0.21 | Akon [17] |
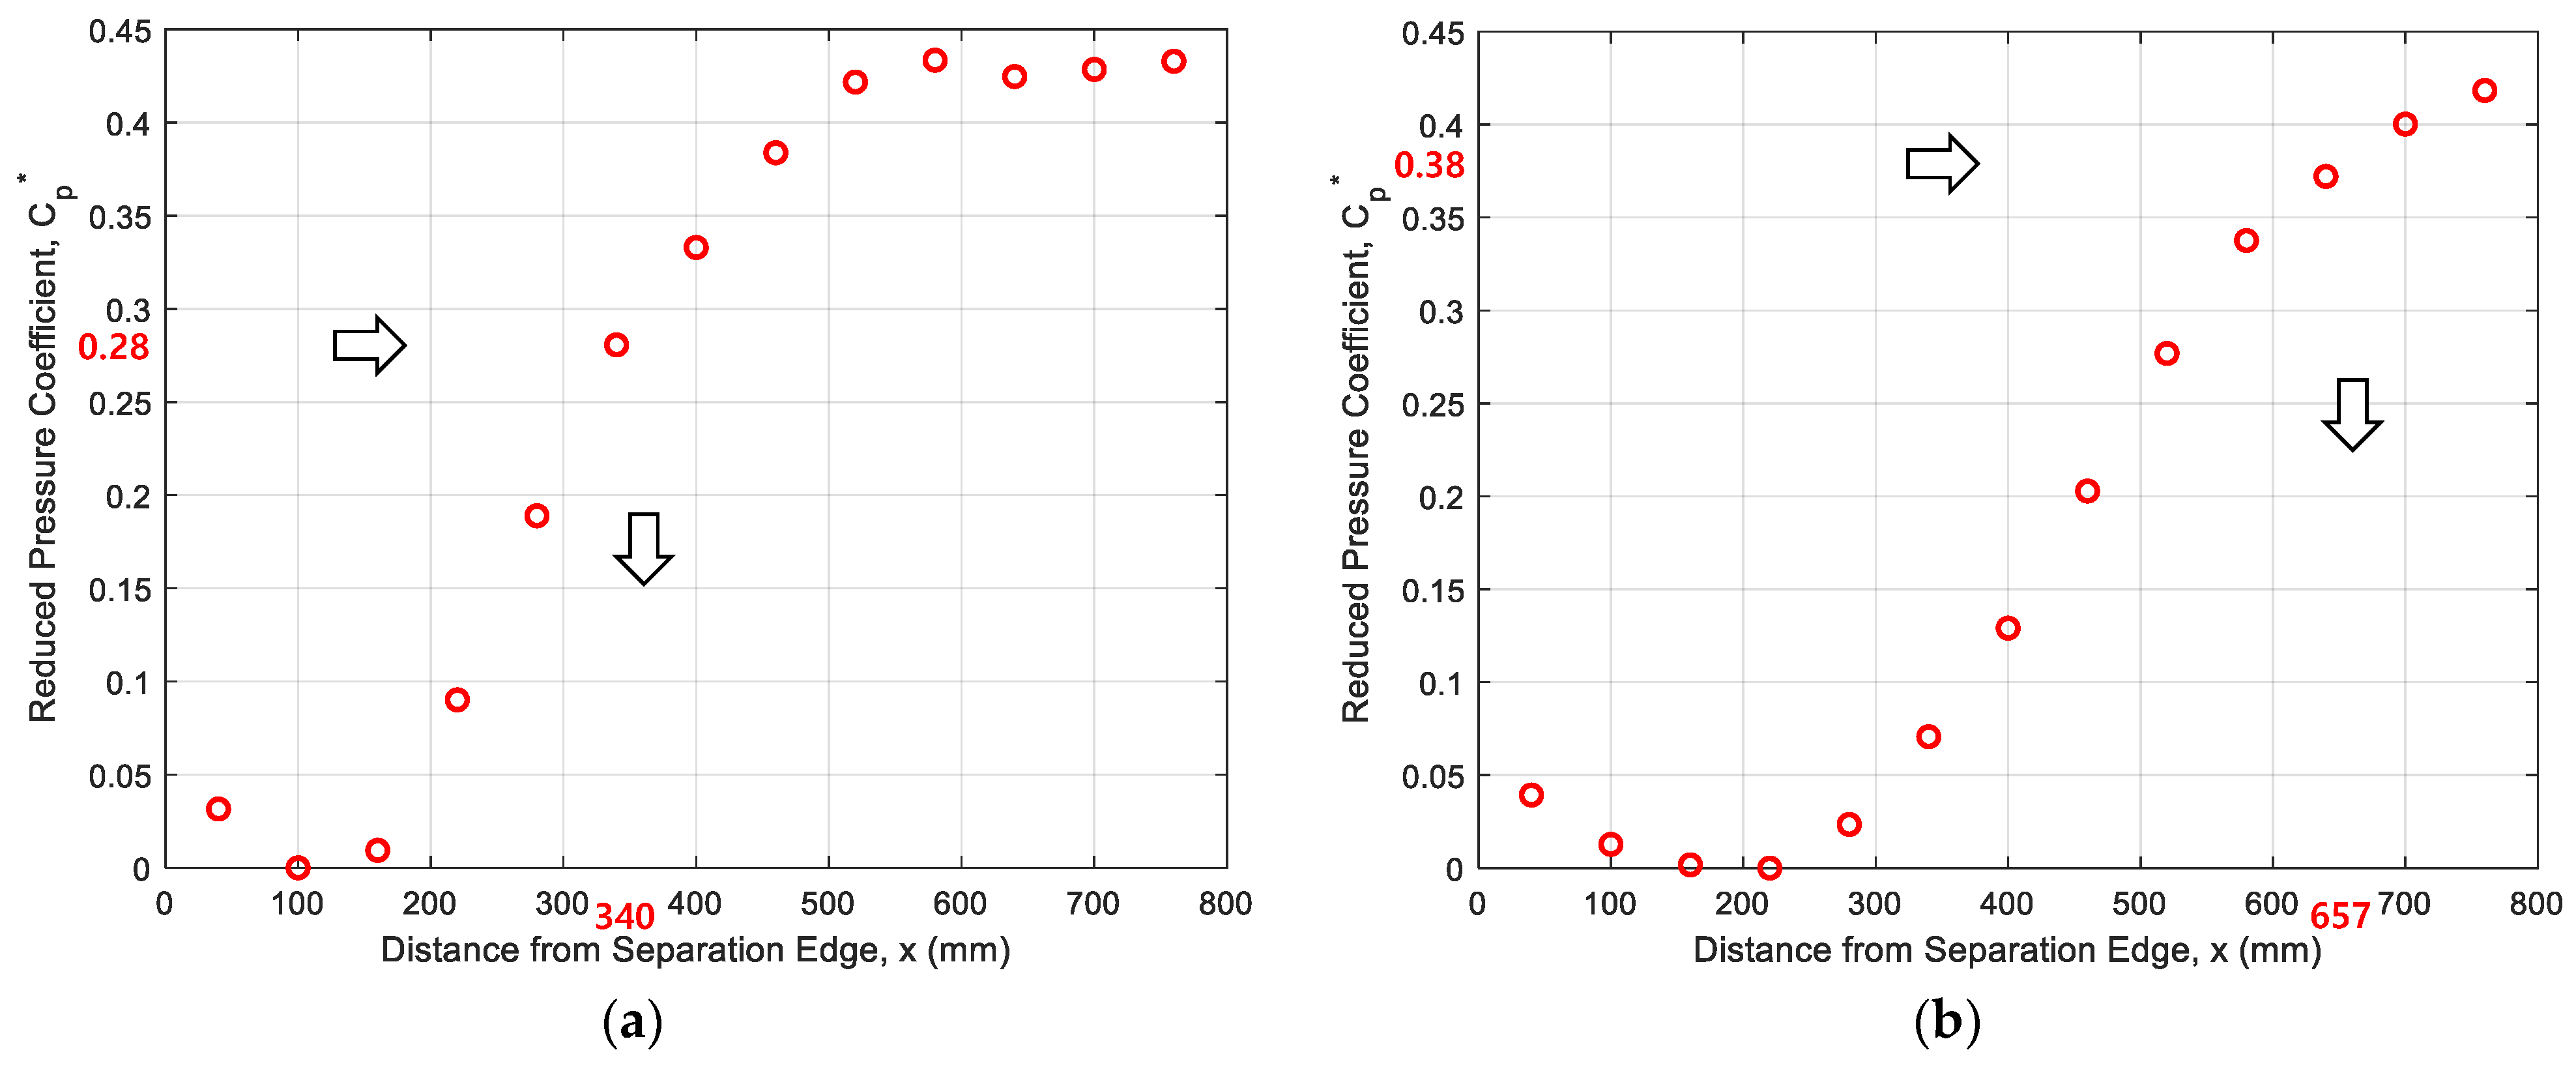
| Turbulence Intensity (, %) | 12.7 | 0.6 |
|---|---|---|
| Mean reattachment length according to the current POD-based method (, mm) | 324 | 689 |
| Mean reattachment length according to Akon’s method [17] (, mm) | 340 | 657 |
| Relative error (%) in the mean reattachment length () between the current POD-based method and Akon’s method [17] | 4.9 | 4.6 |
Disclaimer/Publisher’s Note: The statements, opinions and data contained in all publications are solely those of the individual author(s) and contributor(s) and not of MDPI and/or the editor(s). MDPI and/or the editor(s) disclaim responsibility for any injury to people or property resulting from any ideas, methods, instructions or products referred to in the content. |
© 2023 by the authors. Licensee MDPI, Basel, Switzerland. This article is an open access article distributed under the terms and conditions of the Creative Commons Attribution (CC BY) license (https://creativecommons.org/licenses/by/4.0/).
Share and Cite
Ham, H.J.; Lee, S.; Choi, S.H.; Kim, H.-J. Mean Reattachment Length of Roof Separation Bubbles Using Proper Orthogonal Decomposition. Appl. Sci. 2024, 14, 88. https://doi.org/10.3390/app14010088
Ham HJ, Lee S, Choi SH, Kim H-J. Mean Reattachment Length of Roof Separation Bubbles Using Proper Orthogonal Decomposition. Applied Sciences. 2024; 14(1):88. https://doi.org/10.3390/app14010088
Chicago/Turabian StyleHam, Hee Jung, Sungsu Lee, Seung Hun Choi, and Ho-Jeong Kim. 2024. "Mean Reattachment Length of Roof Separation Bubbles Using Proper Orthogonal Decomposition" Applied Sciences 14, no. 1: 88. https://doi.org/10.3390/app14010088