Article

Fatigue Damage of Rubber Concrete Backfill at Arch Springing Influence on Surrounding Rock Deformation in Tunnel Engineering

1
School of Civil and Architecture Engineering, East China University of Technology, Nanchang 330013, China
2
School of Water Resources and Environmental Engineering, East China University of Technology, Nanchang 330013, China
*
Authors to whom correspondence should be addressed.
Appl. Sci. 2024, 14(10), 4129; https://doi.org/10.3390/app14104129
Submission received: 17 April 2024 / Revised: 6 May 2024 / Accepted: 8 May 2024 / Published: 13 May 2024

Abstract

:
The backfill area of tunnel projects may deform or collapse due to the cyclic disturbance of groundwater and train loads. Hence, the anti-deformation and crack resistance performance of backfill materials under cyclic disturbance is critical to engineering safety. In this paper, concrete was produced by mixing 0.85 mm, 1–3 mm and 3–6 mm rubber particles instead of 10% sand, and tested to discuss the effect of rubber particle size on the deterioration of concrete material properties (compressive characteristics and energy dissipation) after bearing cyclic loading. The stress–strain curve and various parameters obtained through the uniaxial compression test and cyclic load test were used to explore the optimal grain size that can be applied to the tunnel engineering backfill area, and numerical simulation was adopted to calculate the deformation of the surrounding rock and the structural stress of different backfill materials. Research shows that the increase in particle size lessens the compressive strength, deformation resistance and cracking resistance of specimens, but after the cyclic loading test, the concrete material deterioration analysis indicates that rubber concrete has lesser and more stable losses compared to ordinary concrete, so the optimum rubber particle size is 0.85 mm. Numerical calculations show that RC-1 reduces the arch top displacement by 0.4 mm, increases the arch bottom displacement by 0.6 mm and increases the maximum principal stress by 11.5% compared to OC. Therefore, rubber concrete can ensure the strength and stability requirements of tunnel structures, which can provide a reference for similar projects.

1. Introduction

The non-uniform settlement caused by stratum creep and train cyclic load has a significant impact on tunnel structure safety and stability. At present, the backfill materials of expressway tunnel engineering are mainly flake stone concrete and low-strength-grade plain concrete [1,2,3]. Chen Yun [4] used the finite element calculation method by changing the elastic modulus of concrete elements and found that the deformation and stress of the tunnel surrounding rock and the internal force of lining were reduced greatly with the increase in the elastic modulus of backfill concrete at the top of the middle wall. Xu Huifen et al. [5] used foam concrete to replace the traditional arch foot backfill material and verified the tunnel structure strength and anti-floating requirements through numerical model calculation, and successfully implemented it on site. Yao Zhaoming et al. [6] carried out undrained cyclic triaxial tests of saturated soft clay under different confining pressures and consolidation modes, established an explicit model of cyclic cumulative pore pressure and verified the rationality of the model. Previous studies analyzed the long-term settlement of backfill under cyclic loading and its influence on tunnel stability through similar model tests [7,8,9] and indoor cyclic loading tests [10,11]. The mechanical properties, durability and damage characteristics of backfill concrete have a crucial influence on the tunnel’s stability.
Stone flakes concrete and plain concrete usually have defects such as unequal particle size, large strength deviation and poor durability. Shuaib Ahmad has been grinding waste tires and using them as one of the concrete ingredients, as well as mixing them with cement and sand aggregate, etc., to make RC [12]. This new type of concrete has proper toughness [13] and low rigidity [14], and has been widely utilized in roads, bridges, railways, airport runways and other projects [15].
Rubber concrete has good durability, impermeability and corrosion resistance [16,17,18]; a large number of documents indicate that the incorporation of rubber particles can hinder the development of cracks in concrete, improve the toughness of concrete and inhibit crack propagation [19,20,21,22,23,24]. Son et al. [25] found that the compressive strength and elastic modulus of rubber concrete decreased, but the deformation energy and absorption energy increased and the curvature ductility increased by 90%. Han Juhong et al. [26] conducted a drop hammer test on rubber concrete and found that, with the increase in the particle size and content of rubber particles, the impact resistance was better. Ali et al. [27] found that, compared with ordinary concrete, the ultrasonic modulus of tire rubber concrete is greatly reduced, and the sound absorption performance is superior. In addition, rubber concrete also performs better ductility and stability than ordinary concrete after cyclic loading [28]. Huang et al. [29] found that the rubber concrete has large deformation but good stability after cyclic loading, the optimal content of rubber particles is 5% and the optimal ratio particle size is 0.85 mm. Gholampour [30] carried out a cyclic load test on an RC specimen under a confining pressure of 0~25 MPa. Li and Wu [31] found that the main influencing factors of confining pressure on the cyclic performance of confined concrete are reloading modulus and plastic strain. The results show that the ductility of RC is higher than that of NC. Moreover, Song et al. [32,33] analyzed the failure mode of concrete under cyclic loading with the characteristic of dissipation energy hysteresis, and studied the failure mode of concrete under monotonic loading and cyclic loading; the size and type of cracks were directly related to the loading method. Meanwhile, the energy dissipation rate increased with the increase in load level and reached the maximum value at peak strength. Jiang and Liu [34] compared and analyzed the fatigue damage characteristics of concrete via three types of cyclic action on concrete, and evaluated the fatigue life based on the damage variables. The addition of rubber can significantly improve the deformation ability of concrete, and thus increase the service life of the entire structure [35].
In tunnel engineering, rubber concrete can be applied for tunnel roof backfilling and loading reduction, shaft and cross channel space-filling, deep-buried soft rock tunnel reserved deformation layer backfilling, tunnel external insulation layer backfilling in alpine region, tunnel collapse cavity backfilling, etc. However, there are few studies on its application to the wedge part of the tunnel arch foot. This paper mainly concentrates on the influence of rubber particle size on the compressive properties and energy dissipation of concrete and investigates the optimal size of rubber particles in concrete. Subsequently, the tunnel structure with two types of concrete as backfill material is numerically simulated to analyze the deformation and stress of the tunnel structure and to study the role of rubber concrete in tunnel safety.

2. Test Materials and Methods

2.1. Raw Materials

Ordinary Portland cement P.C 42.5, produced by Anhui Conch Cement Co., Ltd. (Anhui, China) was used in the experiment. Table 1 presents the chemical composition of cement with standard consistency water of 25.9%. The fly ash used in the test was class I produced by Pingwei Power Plant in Huainan. Table 1 shows its chemical composition.
Normal river sand was used as the fine aggregate for cement mortar, which was collected from the Huai River, and its particle grading is shown in Figure 1. Then, 5–20 mm continuous graded gravel was used as coarse aggregate. The water reducer was Qinfen construction in Shanxi Province, Hpwr standard high-performance water reducer produced by the material company, which is mainly composed of polycarboxylic acid with a proportion of 1.0%, solid content of 15.0%, water reduction rate of 25.0%, and air content of 2.5%. In the test, the rubber particles were processed from waste rubber tires, and the particle size was 0.85 mm, 1–3 mm, and 3–6 mm. The mixing water in the experiment was city tap water from the laboratory.

2.2. Preparation of Specimens

The design proportion was referred to JGJ55-2011 (2011) [36], and the basic mix proportion of ordinary concrete was water:cement:sand:stone:fly ash:water reducer = 150:310:791:1115:50:3.4. The concrete density was 2419.4 kg/m3. The water–cement ratio was 0.48. The preparation of the rubber concrete test piece was consisted in mixing the rubber particles with particle sizes of 0.85 mm, 1–3 mm, and 3–6 mm into the ordinary concrete with 10% of the mass of cementitious material instead of sand, which were, respectively, recorded as RC-1, RC-2, and RC-3, and the ordinary concrete was recorded as OC. Therefore, the mixed proportion of RC was water:cement:sand:stone:fly Ash:water reducer:rubber = 150:310:593:1115:50:3.4:36. During the test, the test materials were prepared according to the mix proportion of each group, then poured into the mixer to mix for 2–3 min. After entering the mold, they were vibrated on the vibrating platform for about 1.5 min. After curing for 24 h, they were demolded and maintained for 28 days at room temperature of 20 °C ± 2 °C and humidity of no less than 95%. The test piece was a cylinder obtained by coring the cube sample of 100 mm × 100 mm × 100 mm.

2.3. Test Setup and Method

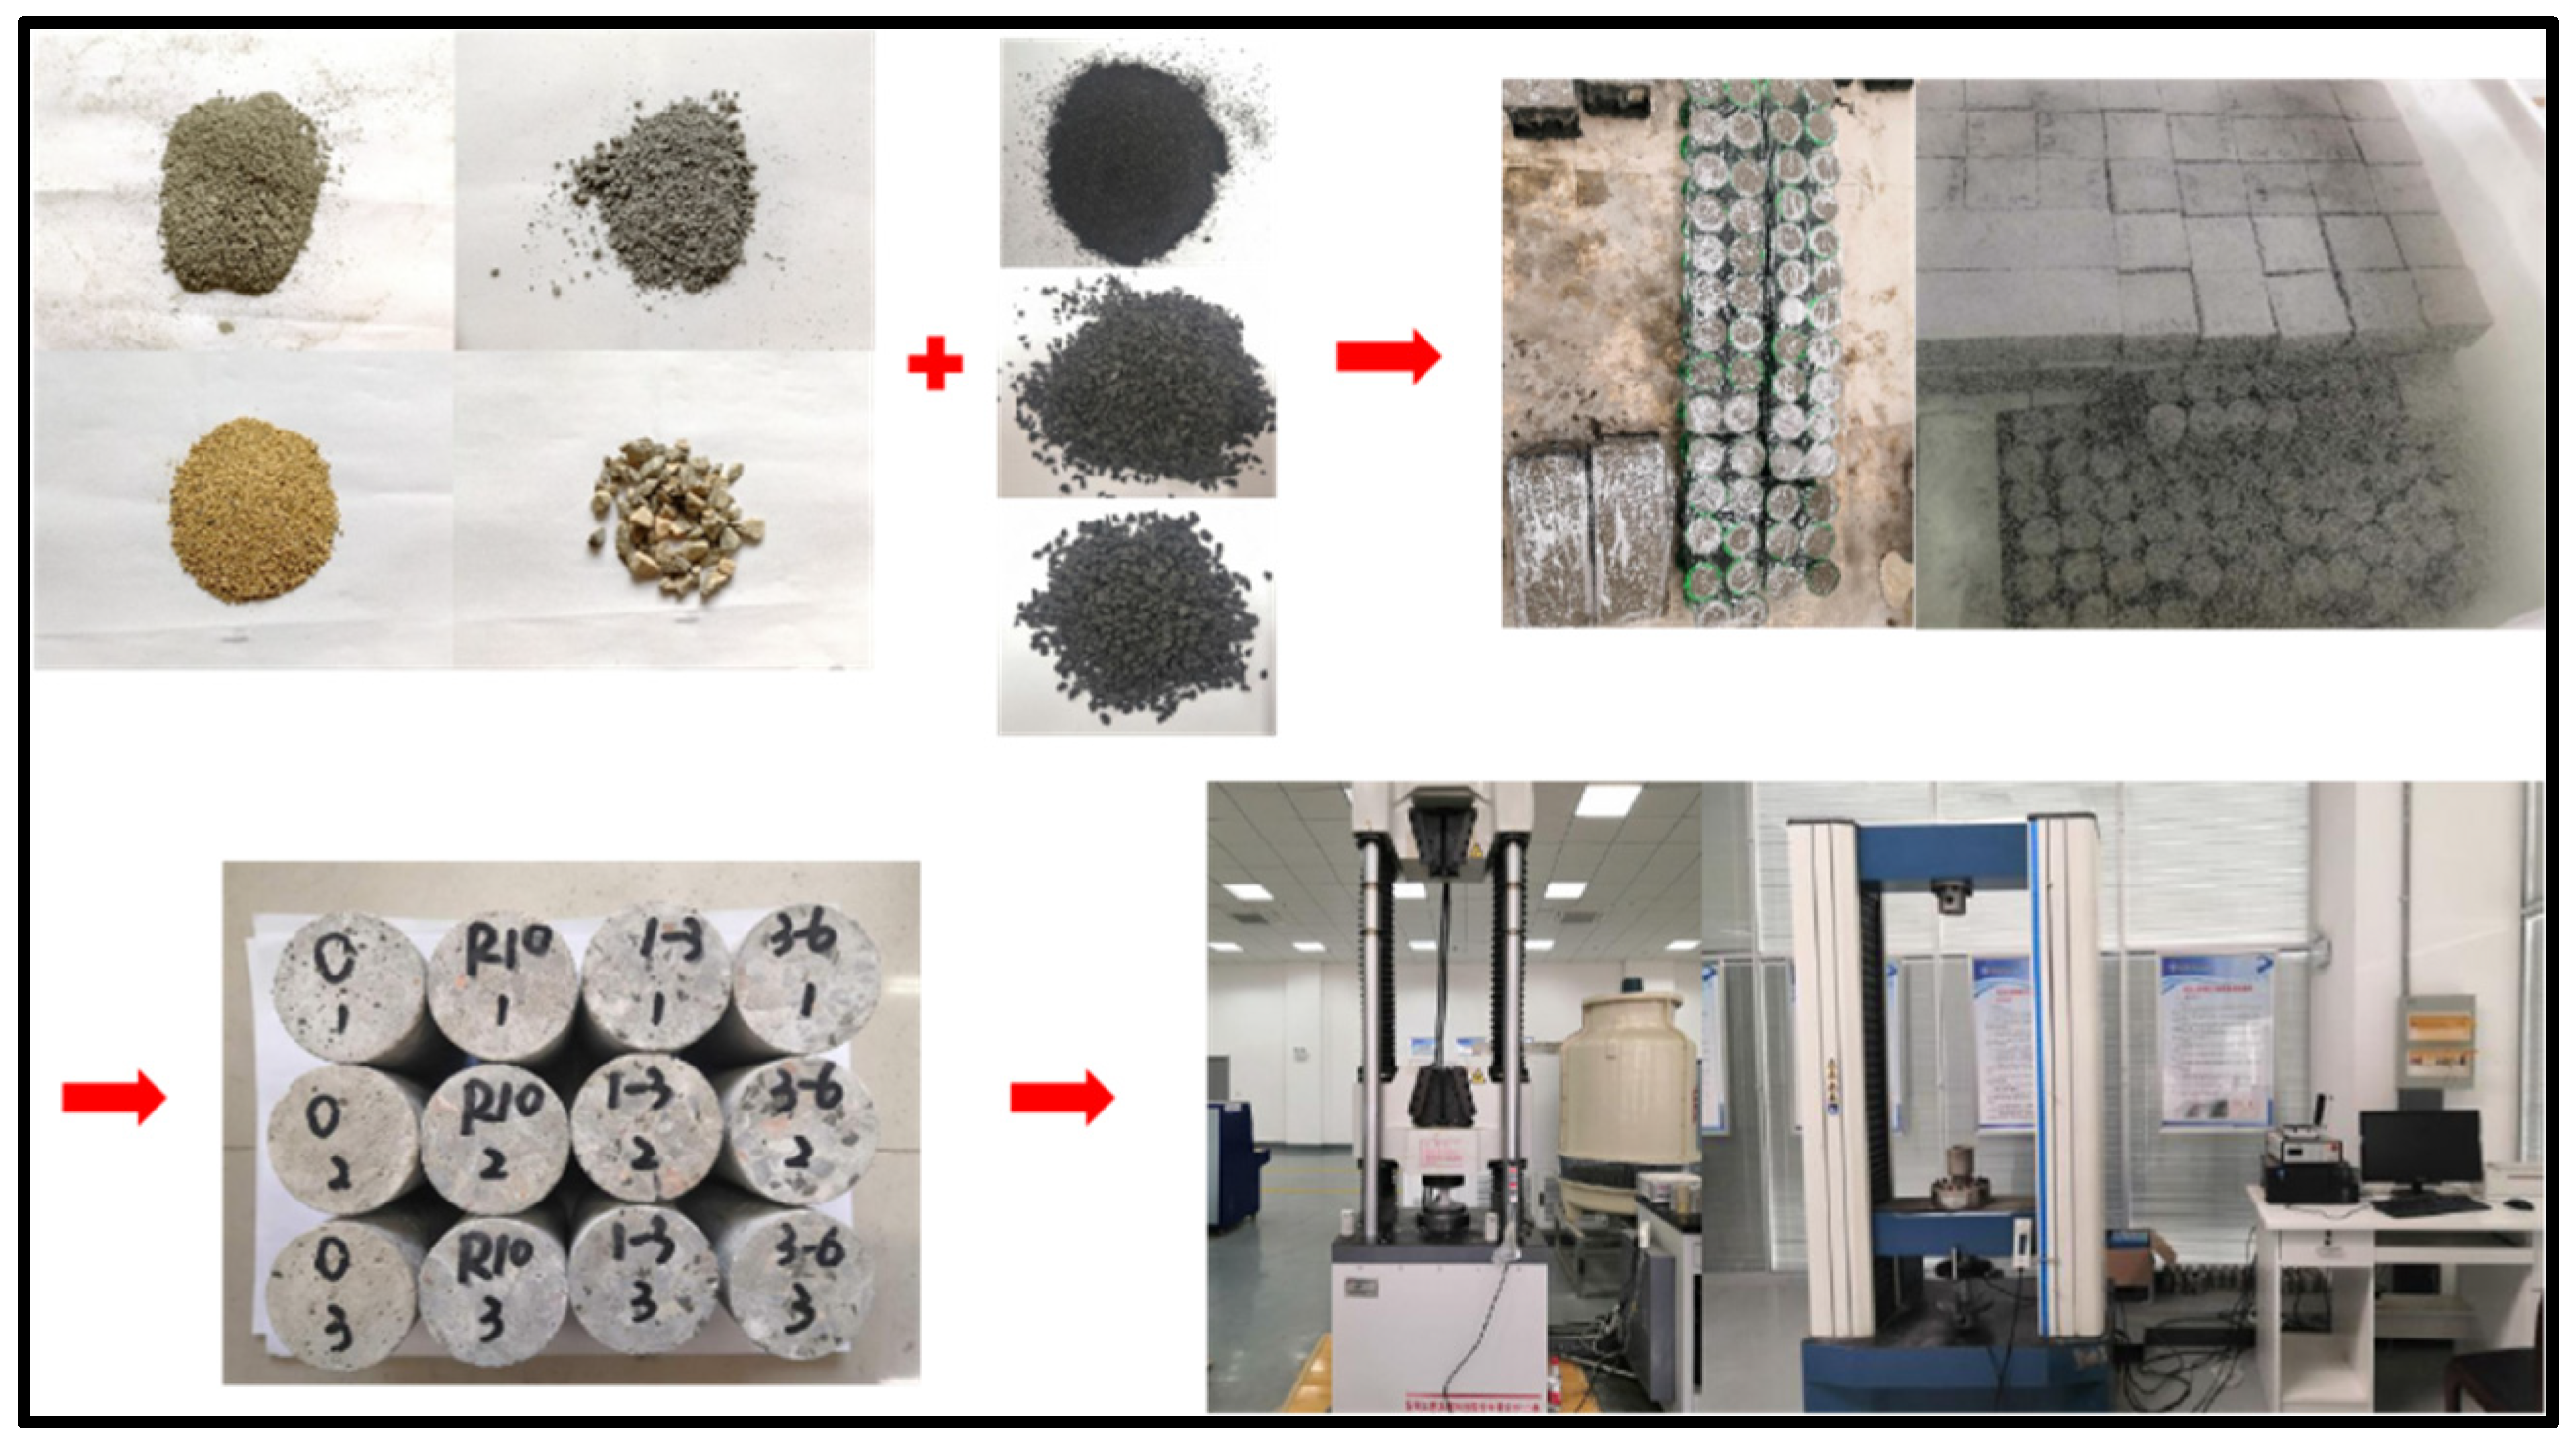
According to GB/T 50081-2002 (2003) [37], the uniaxial compression test and cyclic loading test were carried out for the previously prepared specimens. The uniaxial compressive strength of the specimens was measured using a microcomputer-controlled electro-hydraulic servo universal testing machine (WAW-1000, Shenzhen Suns Technology Stock Co., Ltd., Shanghai, China). The specimens were divided into two groups: (1) For the monotonic test, the displacement loading rate was kept at 3 mm/min; (2) For the cyclic test, the maximum value of the cyclic loading test was set up with 90% of the peak stress under uniaxial compression. Before the cyclic loading test, the samples were numbered first, and there were three parallel samples under the same mix ratio, numbered 1, 2, and 3; then, the end surfaces of these test blocks were polished and leveled to ensure that the loading force of the test blocks was uniform during the cyclic loading test. At the initial stage of the cyclic loading test, the rubber concrete sample was preloaded with 500 N, and the loading mode was force-controlled loading. In the experiment, loading and unloading were carried out as one loop at a time, and a total of 50 cycles were performed. The equal amplitude cyclic loading model was adopted, the upper limit of loading was 90% of the peak stress under uniaxial compression, and the lower limit of unloading was 0 kN; the loading rate was 60 kN/min, and the unloading rate was 30 kN/min. Low unloading rate aimed to ensure that the loading stress can be released slowly in the unloading process without rupture of the test piece due to sudden unloading. The test flowchart is shown in Figure 2. The schematic diagram of the cyclic loading route is shown in Figure 3.

3. Test Results and Discussion

3.1. Crack Morphology and Deformation Characteristics

In the loading test, the failure characteristics of ordinary concrete and rubber concrete specimens were similar: under the cyclic action, the surface cracks of the specimens were longitudinal microcracks, and the end cracks were dense. Under cyclic loading, the main crack of ordinary concrete specimens appeared later, and then the microcrack propagated along the weak part of the cement base. When rubber particles were added, cracks appeared earlier, but microcracks no longer appeared, which means crack resistance was improved. The change in concrete crack under the addition and unloading is shown in Figure 4, and the yellow box represents the variation in cracks during loading and unloading.
Concrete material was composed of hardened cementitious material, coarse aggregate, and interfacial transition zone. Due to the fact that the original defects such as pores, cracks, and bubbles often exist in the interface transition zone, these weak parts were damaged due to stress concentration during loading. Although the addition of rubber particles created many original defects in the interior of the test block due to the interface with the cementitious material, and the macroscopic mechanical properties would be weakened [28], the rubber particles, as the aggregate of the test piece, played the role of energy absorption and dissipation during the loading and unloading process, and tended to restrain the crack tip and prevent further expansion. To sum up, the crack and deformation resistance performance of rubber concrete was better than that of ordinary concrete.
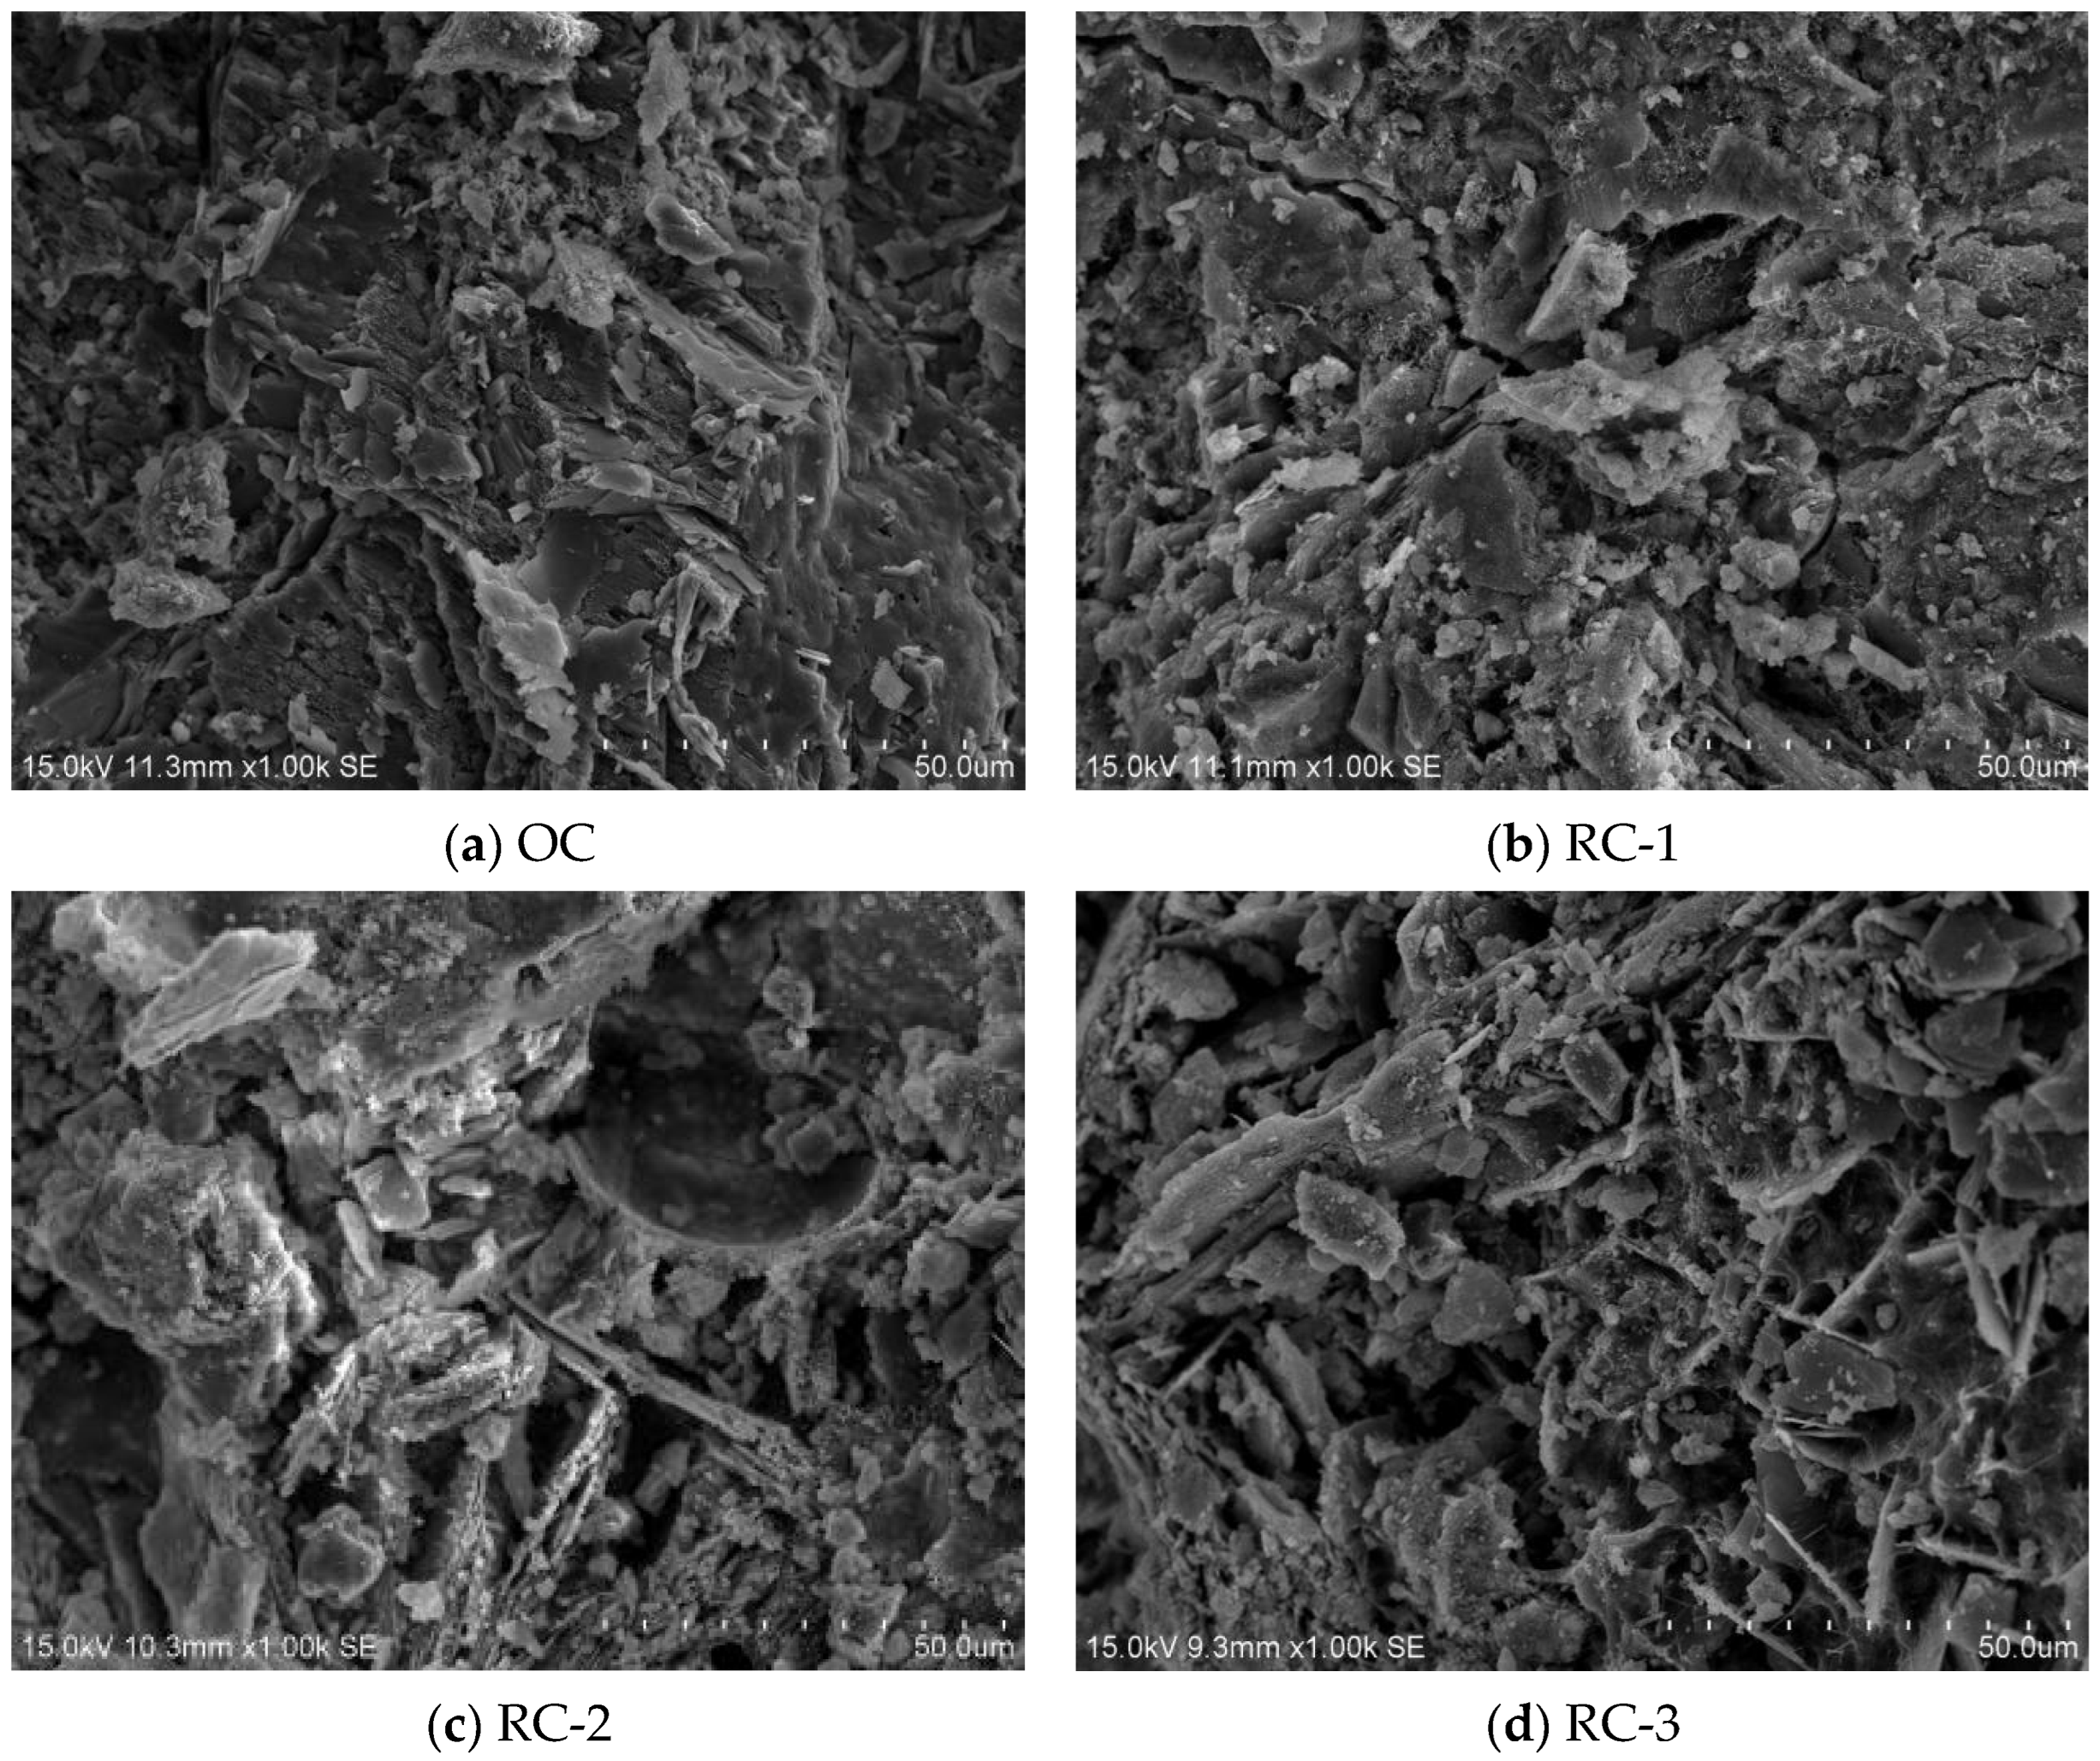
This article conducts research and analysis on concrete materials using scanning electron microscopy (SEM). From Figure 5, it can be seen that, although the cement base inside the concrete material is thin and loose, the cement base inside the ordinary concrete is laminated and the surface is uneven, indicating that the rubber particles play an inhibitory role in the extension and development of the internal cracks of the concrete. With the increase in rubber particle size, the specific surface area of rubber particles increases. Due to its hydrophobicity, the bonding between cement and rubber particles is not tight enough. The interior becomes loose with the increase in rubber particle size, and more pores generate micro-cracks and are interconnected, which will lead to the decrease in the mechanical properties of the concrete material and the increase in the damage performance.

3.2. Stress–Strain Curves

The curves of time and load are achieved based on the tests and the full stress–strain curve is also obtained by the conversion of mechanical Equation (1):
σ = N S , ε = l l 1 l
where ‘σ’ and ‘ε’ are the strain and stress of the concrete, respectively; ‘N’ and ‘S’ represent the axial force and the cross-sectional area of the specimen in the test; ‘l’ and ‘l1’ are the height of specimens before and after loading in the test.
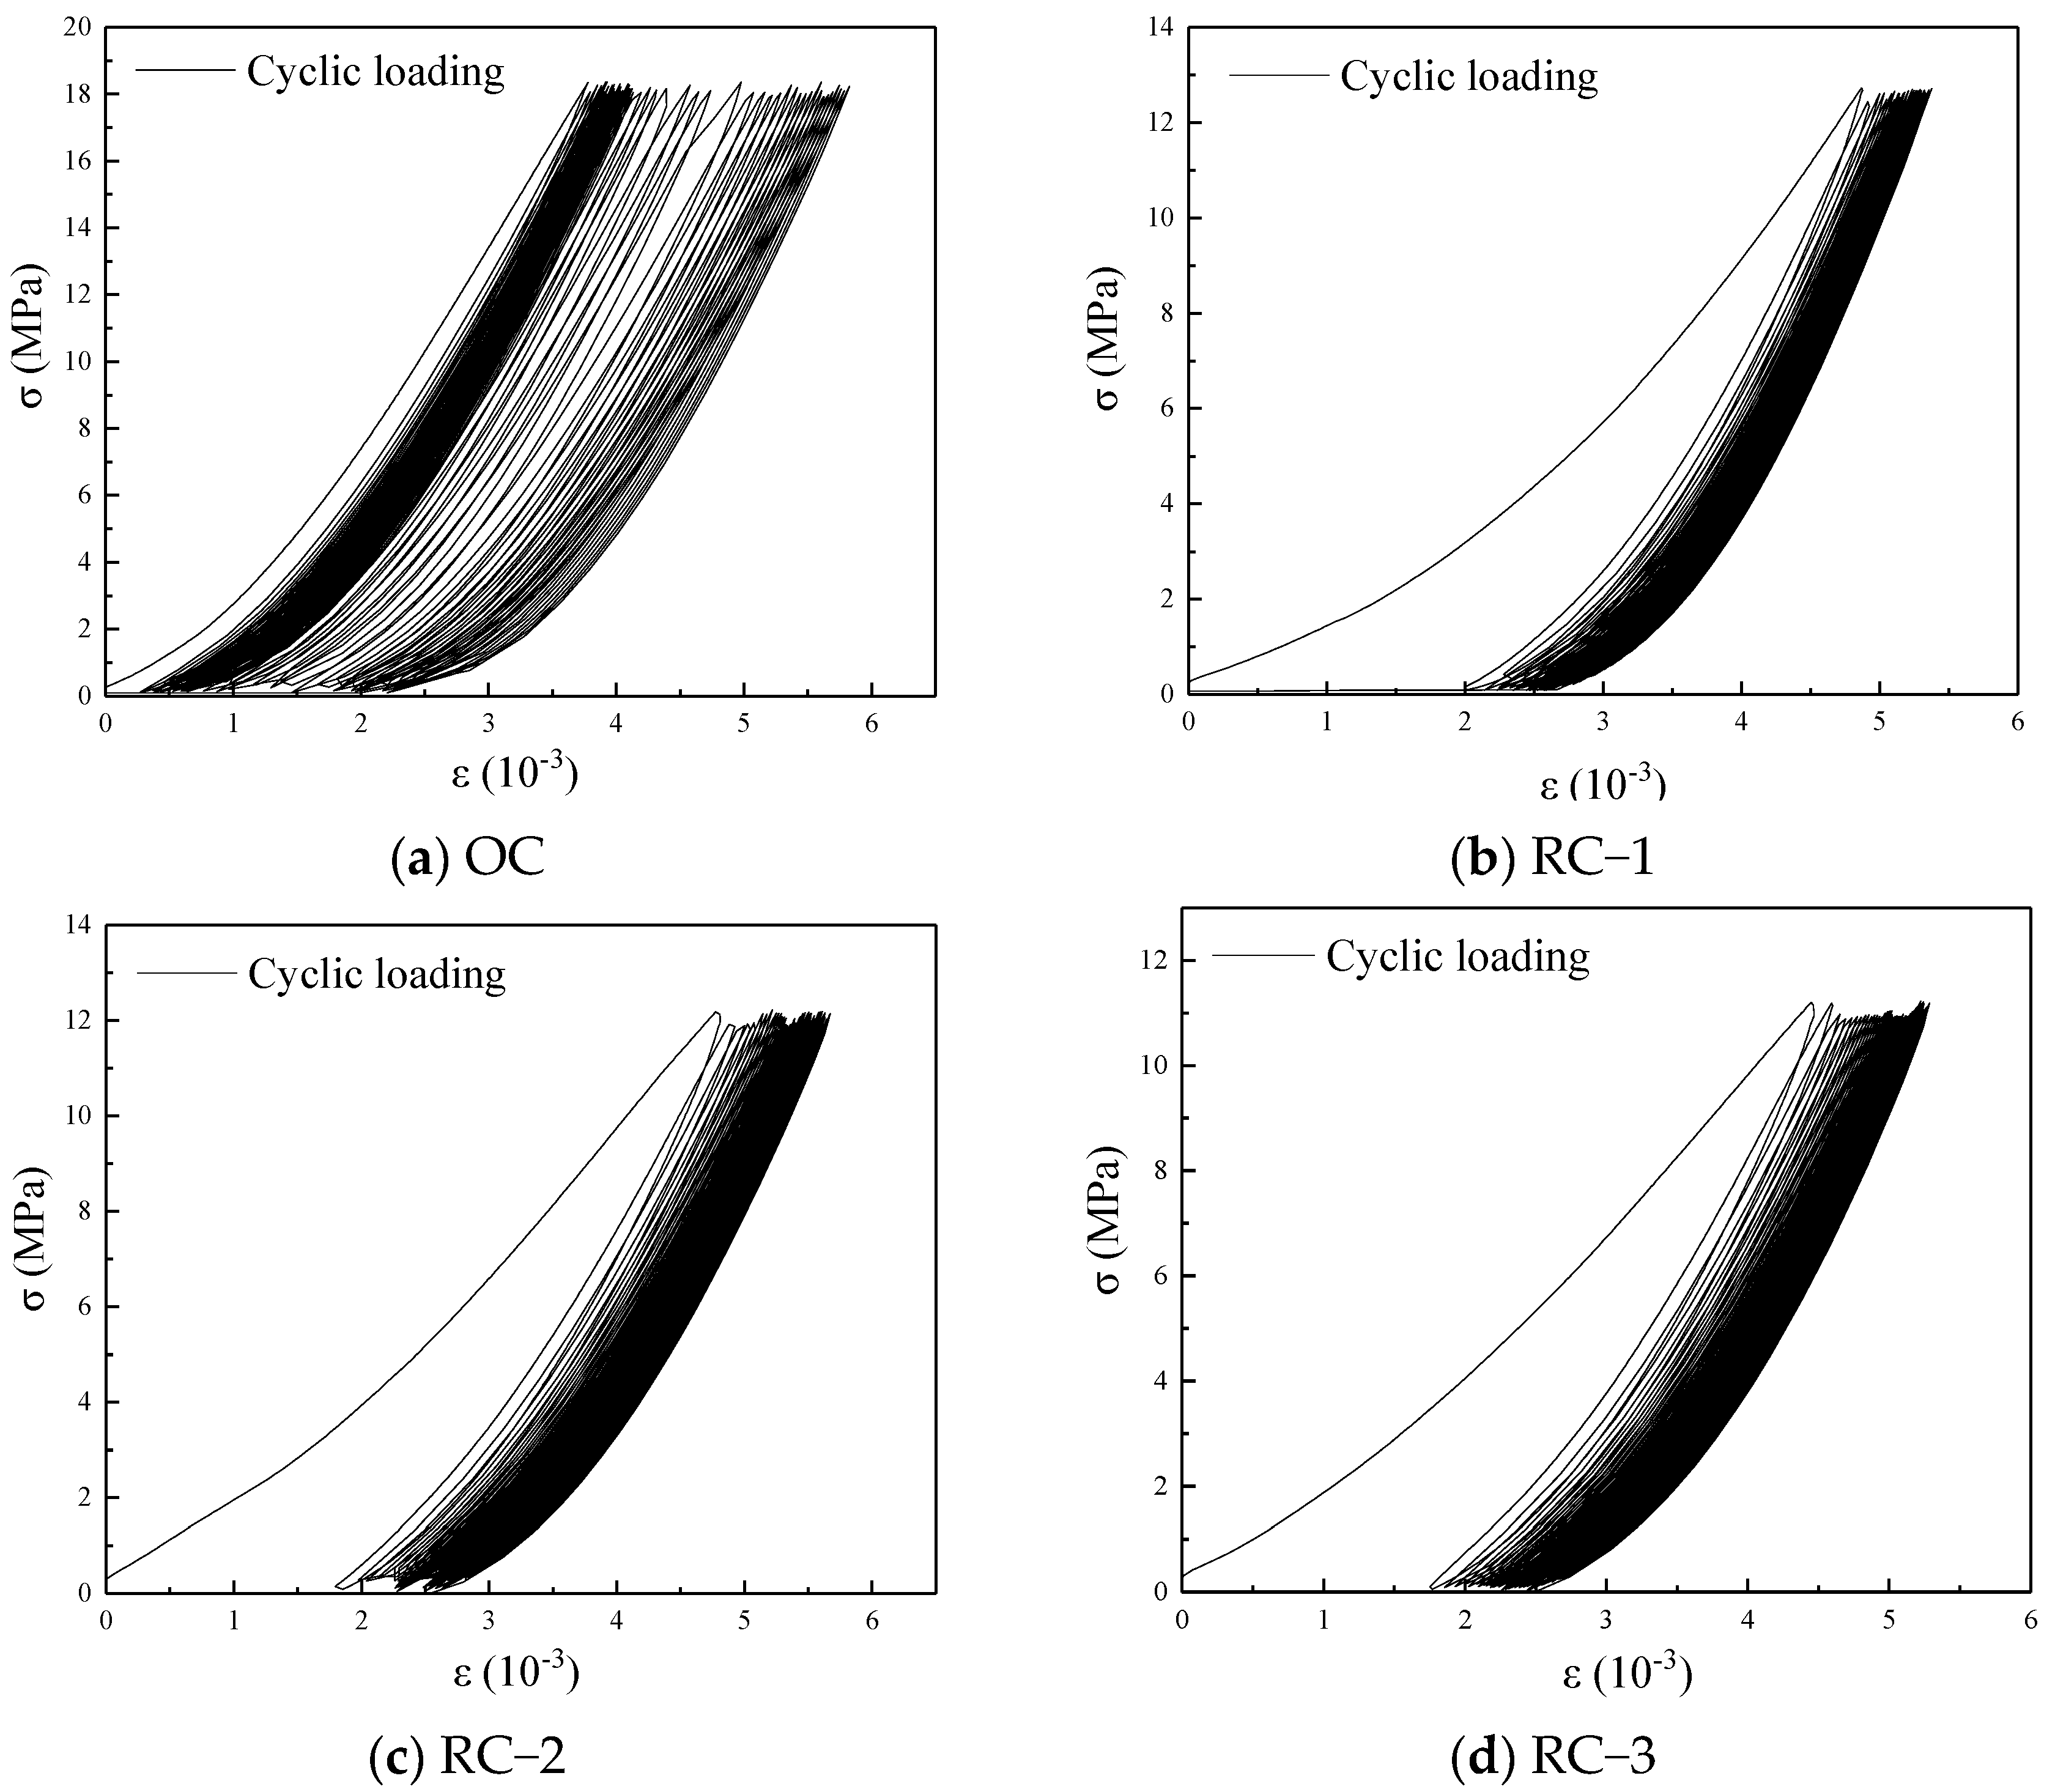
As shown in Figure 6, the OC stress–strain curve shows three stages: first dense, then sparse, and then dense, while the RC shows two stages of first sparse and then dense. It has the following characteristics: (1) As the number of cycles increases, the internal voids of OC specimens are compacted, and almost no dissipation occurs; subsequently, microcracks are generated in the internal pores, and the dissipated energy increases (Hysteresis loop area increases). The cycle continues to increase, the plastic strain reaches the limit, the internal microcracks cease to develop, and the structure achieves equilibrium. On the contrary, after adding rubber particles, the deformation mainly occurs in the first cycle, followed by rapid compaction, and the total strain is small—there are many pores in the RC specimen, and the plastic deformation value increases under pressure. Once cracking occurs, the flexibility of rubber particles plays a role in buffering, preventing, and dissipating energy. (2) With the increase in rubber particle size, the total strain and elastic–plastic deformation increase. This demonstrates that a certain amount of rubber particles can reduce the dissipation energy of the specimen. As the particle size increases, the bonding ability between the surface of the rubber particles and the cementitious material decreases, the strain of the specimen increases, and the dissipation energy increases. (3) According to Hooke’s law Δ σ = Δ E Δ ε , each Δ σ is equal, but Δ ε R C 3 > Δ ε R C 2 > Δ ε O C > Δ ε R C 1 ; therefore, Δ E O C > Δ E R C 3 > Δ E R C 2 > Δ E R C 1 . This further explains that, when the specimen is subjected to the same degree of load, the rubber particles have better deformability.

4. Degradation Analysis

Due to the fact that the size of the specimen has a great influence on the compressive strength, the standard compressive strength is converted according to the following proportional Formula (2) [38]:
σ σ r = 0.691 H D + 0.187 D 100 + 0.065
where ‘r’ is the compressive strength of a standard specimen in mega pascal; ‘H’ is the height of the specimen in millimeters; ‘D’ is the diameter of the specimen in millimeters.

4.1. Compressive Characteristics

The concrete compressive property refers to the ability of the material to withstand loads and resist pressure and impact. Therefore, in this paper, the peak stress, elastic modulus, and toughness indices before and after cyclic loading are compared, respectively, to analyze the compressive property of concrete materials before and after cyclic loading.
(1)
Elastic modulus
In this paper, the secant elastic modulus of concrete materials before and after cyclic loading is calculated according to the “Standard for test method of performance on building mortar” (JGJ/T70-2009) [39]. The stress–strain curve obtained by the unconfined uniaxial compression test is calculated as follows (3):
E = f 0.4 f 0.1 ε 0.4 ε 0.1
where ‘E’ is the elastic modulus of materials, accurate to 0.01 MPa; ‘f0.4’ is the pressure at 40% of peak stress; ‘f0.1’ is pressure at 10% of peak stress; ‘ ε 0.4 ’ is the corresponding strain at f0.4; ‘ ε 0.1 ’ is the corresponding strain at ‘f0.1.
It can be seen from Table 2 that the elastic modulus decreases gradually with the increase in the rubber particle size. Under cyclic loading, the elastic modulus of OC decreased by 0.99 GPa. The elastic modulus of RC decreases slightly, and the minimum decrease is only 0.09 GPa. The elastic modulus of RC-1 exceeds that of OC after cyclic loading. This shows that the addition of rubber particles reduces the stiffness of the specimen, improves the resistance of the concrete material to elastic deformation after cyclic loading, and enhances damping performance.
(2)
Toughness index
The toughness index of the material shown in Figure 7 refers to the work “Mechanical properties of concrete containing a high volume of tire–rubber particles” [27]. The toughness index value is defined as the ratio between the area reaching the ultimate stress of 80% under the stress–strain curve and the area reaching the ultimate stress under the stress–strain curve, and the calculation Formula (4) is as follows. Moreover, the greater toughness index brings better material toughness.
T = A + B A
where ‘T’ is the toughness index of the material; ‘A’ is the area of the region where the stress–strain reaches the ultimate stress; ‘B’ is the area in which the stress–strain curve decreases to 80 percent of the ultimate stress by the ultimate stress.
It can be clearly judged from Table 2 that the toughness index of the RC is greater than that of plain concrete, and the rubber particle size has a significant influence on the toughness index. The toughness index of the sample drops with the increase in rubber particle size. After cyclic loading, the calculation results are within the range of 2.51–3.52. It can be deduced from the result that, when the specimen reaches 80% σf, the area proportion is large, and the rubber particles play an notable role, which means that the incorporation of rubber particles gives the concrete material good ductility and toughness.

4.2. Energy Dissipation Feature

When it comes to rubber concrete, due to the mixing of rubber particles, the internal pores of the concrete are different. The study [40,41] found that energy is more easily absorbed and released after cyclic loading, especially in places with different porosity, which result in the release of elastic deformation, leading to structural damage. Therefore, analyzing energy dissipation is particularly pivotal for studying damage characteristics of concrete materials.
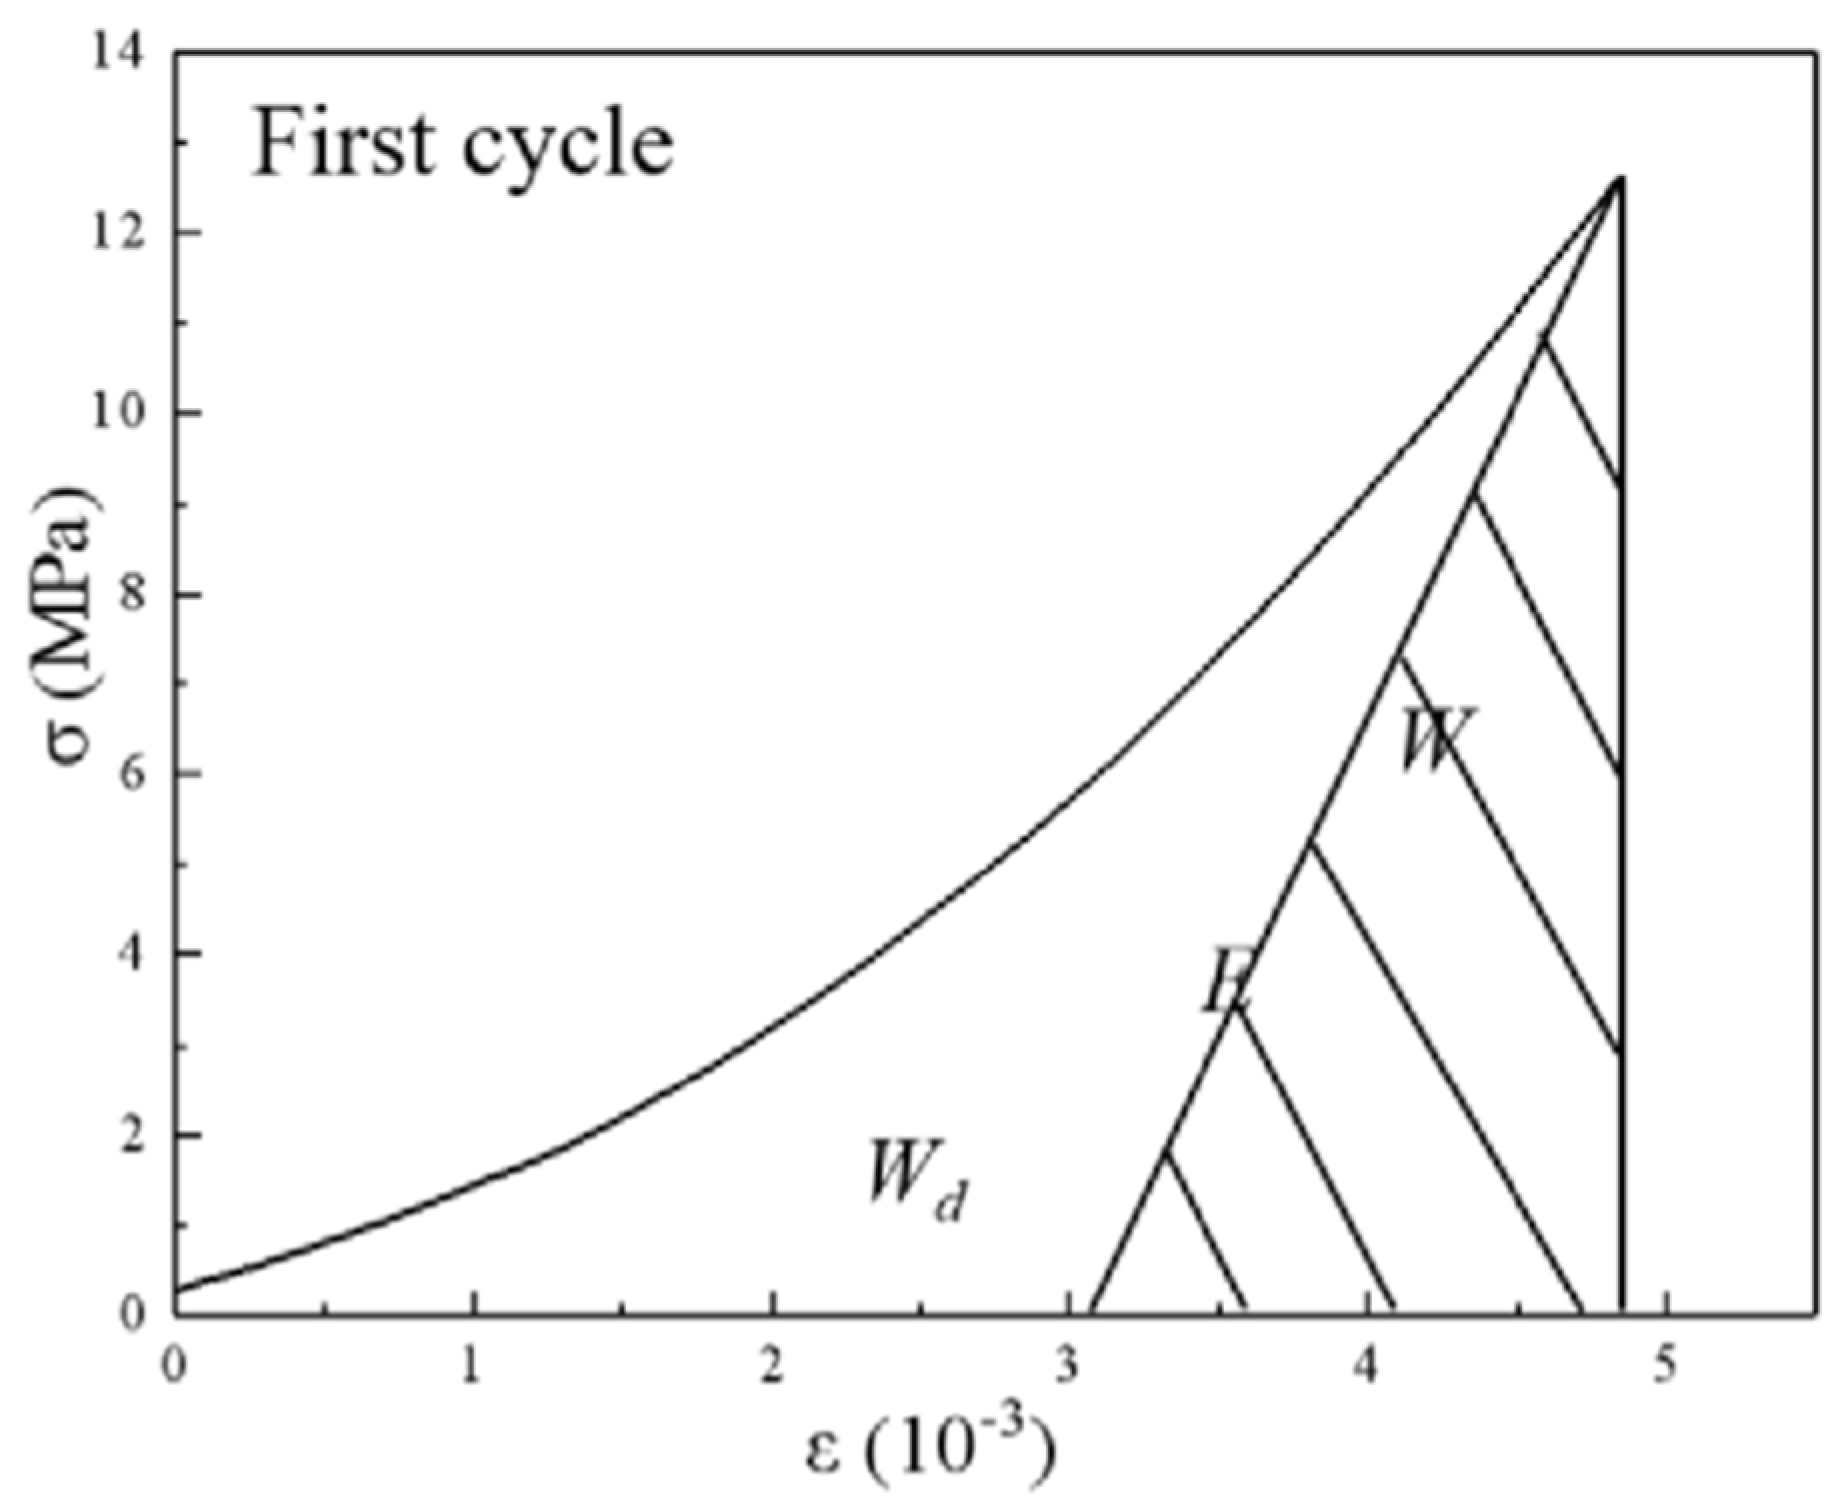
Cyclic loading produces potential energy, and the potential energy of the object is calculated by the selected initial displacement deformation, so the work performed by the material is force multiplied by micro-displacement (F · dr). In this paper, the total absorption energy and dissipation energy of concrete is calculated according to the stress–strain curve. The total absorption energy W is the area under the loading curve, and the dissipation energy Wd is the area of hysteresis loop. The energy dissipation is used to describe the damage of concrete to a certain extent, so the damage variable is defined by the energy dissipation rate which is shown in Equation (5):
D ( i ) = W d ( i ) W ( i )
where ‘W’ is dissipated energy, ‘Wd’ is total absorption energy. Due to the first cycle having no hysteresis loop, the dissipation energy is calculated according to Figure 8 (1 in the figure represents the first cycle) [42]. This article selects W and Wd of 1, 2, 10, 20, 30, 40, and 50 cycle times to compare the damage variables D of rubber concrete mixed with different particles. By using damage variable D, at the same time, we can monitor the damage process of each rubber concrete material in the cycle stage to obtain the suitable rubber particle size in concrete that can be applied in road works. Table 3 indicates the change rule of W and Wd of rubber concrete with cycle times, and Figure 9 shows the change in cycles corresponding to the damage variable.
As shown in Figure 9 and Table 3, W and Wd change slightly after the first cycle, which demonstrates that the energy absorbed and dissipated by concrete in each cycle is almost the same in constant amplitude cyclic loading. The D of ordinary concrete fluctuates within 4.1~10.1%, and with the increase in cycle times, D shows a raising trend within a limited range. The larger the particle size of the rubber is, the larger the D of RC is, and the more damage occurs in the inner part of the test block. When rubber particles are added to the concrete, the internal damage of the concrete can occur after the first cycle loading, and the D of the first cycle is large; as the number of cycles increases, the internal damage cannot increase sharply, the internal pores of the test block are compacted, and the D tends to be stable. The D value of rubber concrete with particle sizes of 0.85 mm, 1–3 mm, and 3–6 mm is 51.1%, 52 5%, and 55.5%, respectively, in the first cycle. After that, D tends to be stable at 8.4~10.1%, 8.6~12.2%, and 10~11.4%, respectively. Moreover, the interface between rubber particles and cement mortar increases, and the pores on the interface increase with the growth of rubber particle size. After cyclic loading, the internal damage of the rubber concrete with large particle size is more serious; as the number of cycles increases, the damage accumulates. However, the damage accumulates slowly due to the constant amplitude of cyclic loading, and the D increases slightly in the cycle process. Therefore, the damage of RC is minor and it can resist the damage caused by cyclic loading when the size of rubber particles is 0.85 mm.
The reason for the phenomenon above is that, during the cyclic loading process, the first internal pore fracture of the compressed concrete results in the generation and development of microcracks, which leads to the structural integrity and stability reduction, and the absorption energy and dissipation energy also change greatly. Moreover, as the number of cycles increases, the internal part of the test block has been compacted, the microcracks change slightly, and the energy maintains a stable state. It can be seen that the fatigue damage of concrete develops slowly under constant amplitude load.

5. Engineering Application

The project is based on the exit section of Puyan Tunnel in Fujian Province, which adopts a “bamboo-cutting” portal. The “open-cut” method is adopted for the open hole, and the drilling and blasting method is introduced to the dark hole. The construction is organized according to the spray anchor construction method. The lithology of the strata in the distribution area of the tunnel is complex, and the longitudinal development along the alignment is a natural valley. The tunnel crosses the Dongya Creek water source protection area, and a river which is mainly supplied by atmospheric precipitation and groundwater develops in the valley, running year-round.
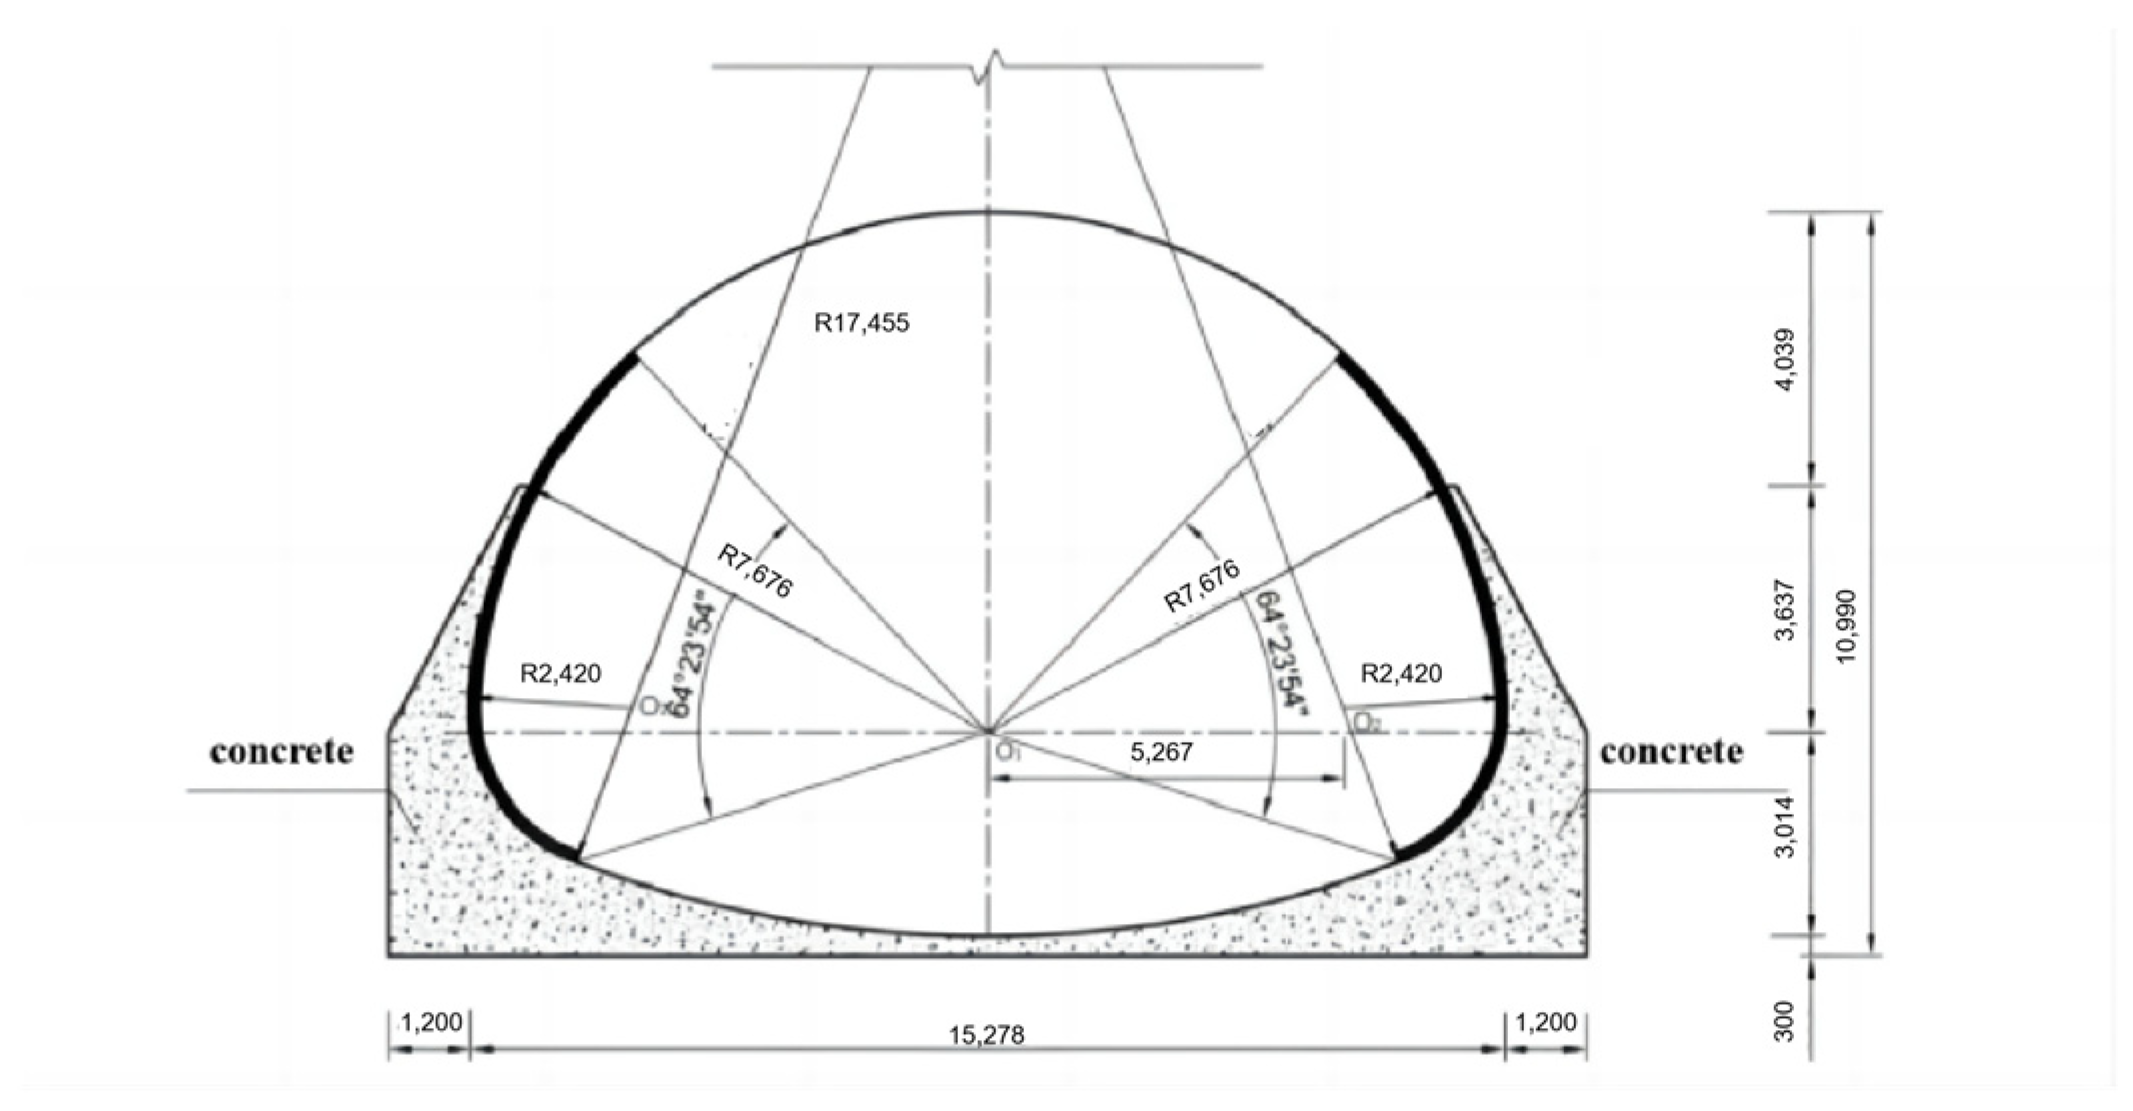
To verify the backfill structural strength and crack width of rubber concrete with 0.85 mm particle size and ordinary concrete, the finite element software ABAQUS 6.14 was used for modeling and analysis. According to relevant data [43], the influence range of tunnel excavation is generally 3–5 times the diameter of the tunnel. The horizontal length of the numerical model in this paper is 120 m, the vertical height is 120 m, and the longitudinal extension is 70 m. The loads are ground overload and water and soil pressure, and the ground overload is taken as 20 kPa considering the effect of heavy load and backfill rolling. The calculation model is shown in Figure 10, and the drawing of the optimization scheme is illustrated in Figure 11.
The tunnel-surrounding rock adopts a Mohr–Coulomb elastic–plastic constitutive model. The tunnel construction only considers the initial support, with the thickness of 25 cm, and the secondary lining is not considered. The top surface of the model uses uniformly distributed loads to simulate the actual buried depth of the upper soil pressure of the tunnel. The displacement constraints in the x-axis direction are set on both sides of the model, and the displacement constraints in the y-axis direction are set at the bottom of the model. The four-node plane strain pore pressure solid element CPE4 I is used for meshing, and the key areas were refined, with a total of 35,350 units, 40,035 nodes, and 79 analysis steps.
The elastic modulus of different concrete materials is used to simulate the compactness of backfill materials in the finite element calculation generally. When evaluating the tunnel safety, the maximum bending moment of the tunnel lining, the maximum compressive stress of the left and right sides, and the settlement of the arch bottom are of most most critical importance. Hence, the data above are selected for calculation and comparative analysis.

Determination of Material Parameters

On the basis of the relevant literature [5,44], the elastic modulus E (MPa) and elastic resistance coefficient K (MPa/m) are calculated according to Formula (6). The elastic modulus E is obtained from the test:
K = E ( 1 + ν ) r .
where ‘ν’ is the Poisson’s ratio of material, taking value as 0.2; ‘r’ is the radius of the tunnel in meters.
From Formula (6), the elastic resistance coefficient is related to the elastic modulus, Poisson’s ratio, and the tunnel radius. The tunnel radius remains the same in this paper. Thus, the comparison of the material parameters is shown in Table 4.
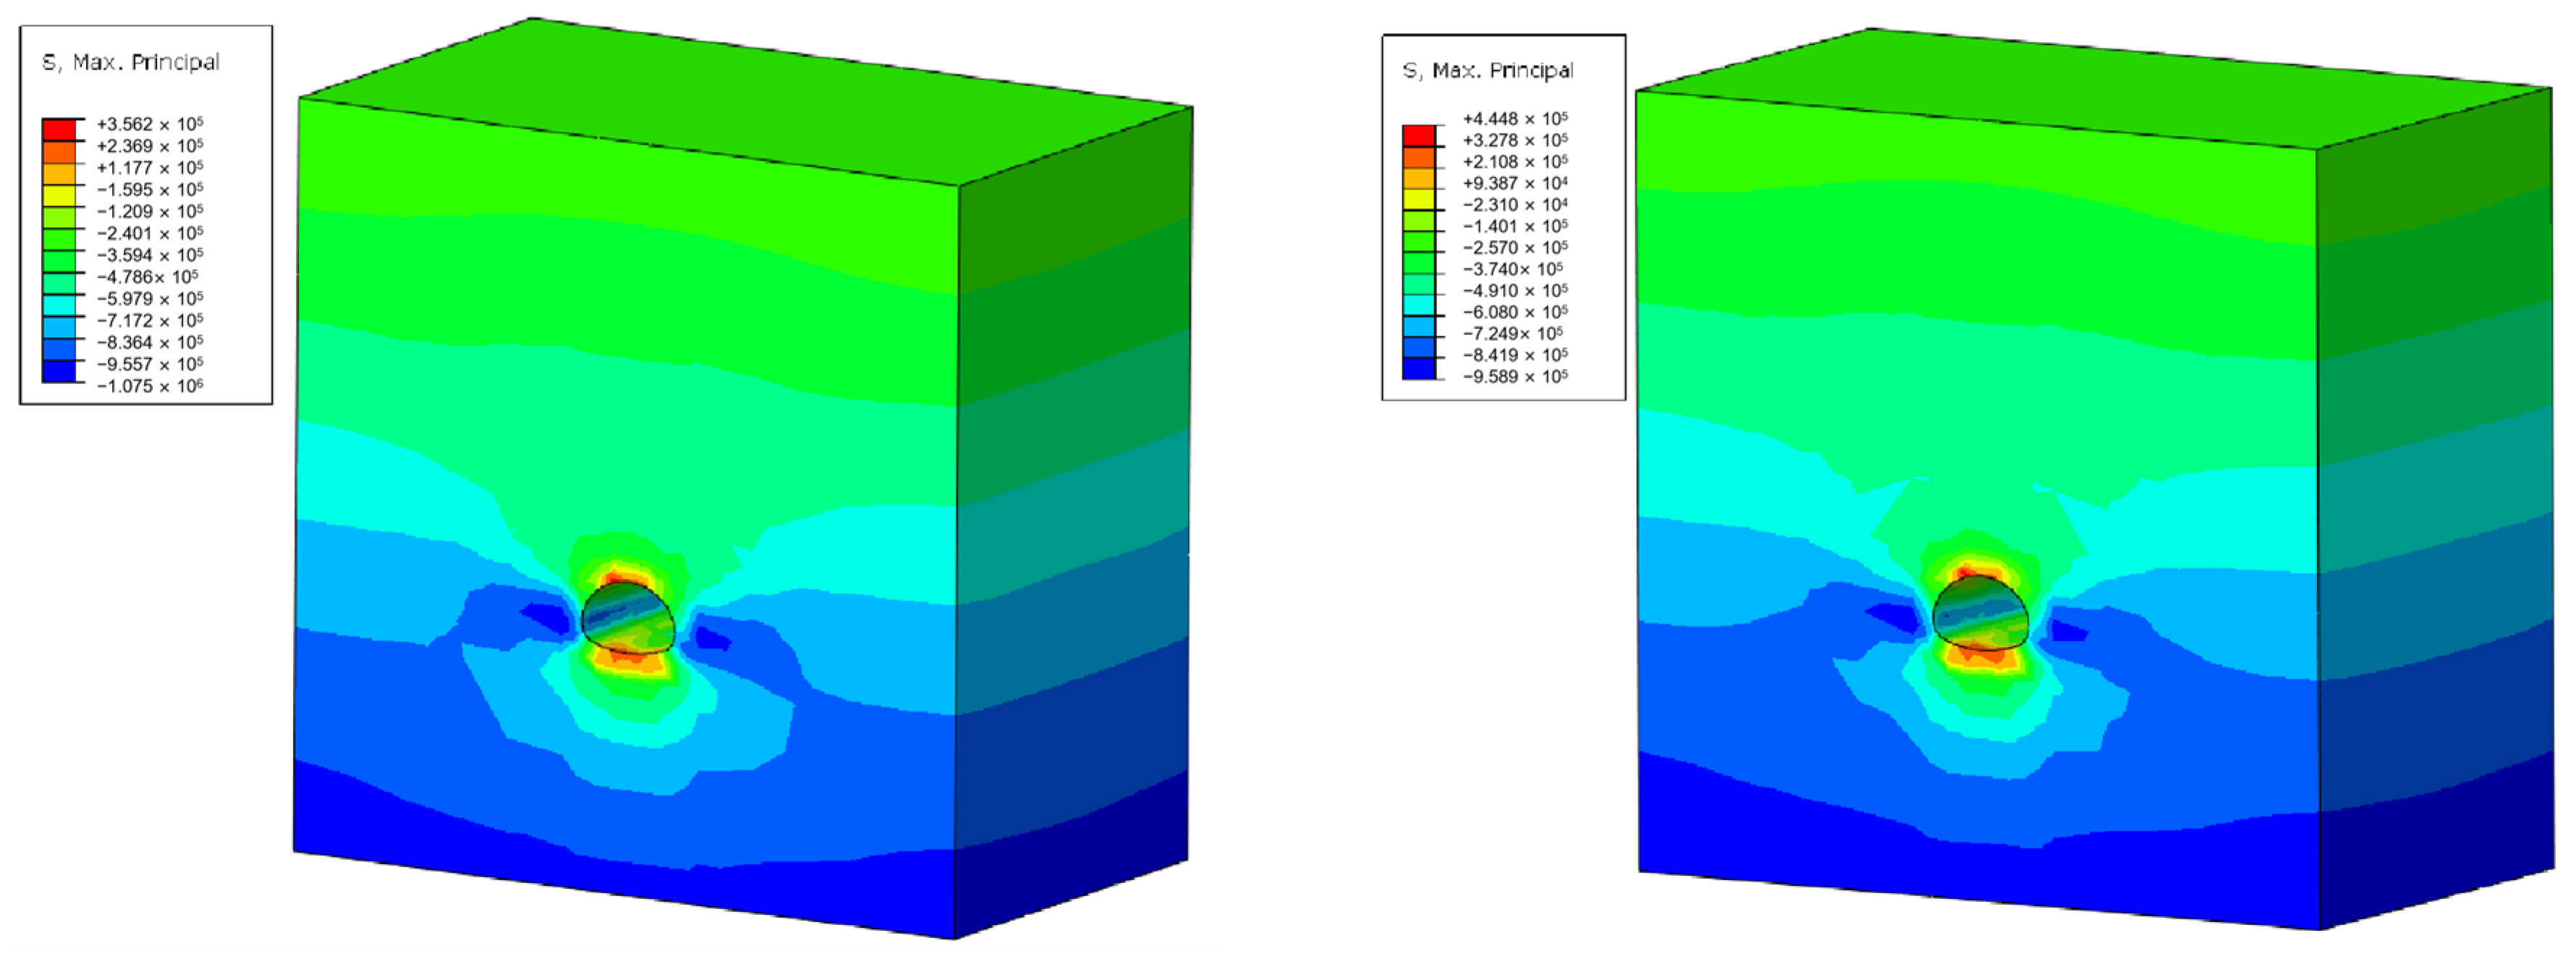
The elastic modulus of ordinary concrete and rubber concrete with 0.85 mm particle size obtained in the test was used to carry out finite element modeling, respectively, and the calculated vault settlement, arch bottom settlement, lining maximum principal stress, and maximum horizontal displacement on the left and right sides of the tunnel were analyzed. The numerical simulation results take the lining vault settlement as an example (Figure 12), and the calculation results are shown in Table 5. It can be seen that, compared with plain concrete, RC-1 has a greater elastic modulus and elastic resistance coefficient after cyclic loading, and its resistance to deformation is stronger.
The simulation results in Table 5 show that, when OC backfill is used, the crown settlement is 29.1 mm, the bottom settlement is −26.4 mm, the maximum horizontal displacement on the left and right sides is 8.58 mm and −8.39 mm, and the maximum principal stress is 0.96 MPa. When RC−1 backfill is used, the deformation values are 28.7 mm, −27.0 mm, 7.61 mm, −7.40 mm, and 1.07 MPa, respectively. Then, the simulation results are analyzed: with RC-1 backfill, the vault settlement decreases by 0.4 mm, and the arch bottom uplift raises by 0.6 mm. The left and right arch waists are symmetrical, the maximum horizontal displacement of the arch waist of RC-1 is lower than that of OC, and the maximum principal stress increases by 11.5%. This proves that the elastic modulus of the backfill concrete has a significant effect on the deformation and forces in the tunnel envelope. The application of rubber concrete can significantly reduce the displacement and stress generated by the backfill of the tunnel structure, which brings a more stable and secure structure.

6. Conclusions

In this paper, the effect of the addition of rubber particles on the mechanical properties of concrete under fatigue load was investigated. The RC and OC with optimal rubber particle size acquired from the experiment were used as backfill materials for numerical simulation and comparative analysis. Thus, the following conclusions could be drawn:
(1)
The purpose of the test was to analyze the effect of adding different-sized rubber particles on concrete material via the stress–strain curve of materials under cyclic loading and observe microcracks on the concrete specimens before and after fatigue loading. The outcome demonstrated that the compressive strength of concrete material decreased with the addition of rubber particles, but the surface crack propagation was inhibited and the deformation resistance was improved. With the increase in rubber particle size, the crack resistance and deformation resistance of rubber concrete decreased. Therefore, 0.85 mm rubber particles resulted in better stability.
(2)
The elastic modulus and toughness indices of concrete materials with different mixing quantities of rubber particles before and after fatigue load were measured and calculated, and the energy dissipation of the specimens was analyzed. The result revealed that, after fatigue loading, the incorporation of rubber particles significantly alleviated the decrease in elastic modulus and toughness index of concrete materials, and RC-1 showed better resistance to elastic deformation, toughness, and ductility. At the same time, the energy dissipation method acquired the loss variables of each cycle accurately. The constant amplitude cyclic loading made the loss accumulate slowly, but it could be found that the damage variable of RC was in a narrow range and resulted in remarkable crack resistance and fatigue resistance.
(3)
Tunnel-surrounding rock deformation and the stress of lining structure using two kinds of backfill concrete were calculated by the finite element method, and the safety and stability of the tunnel structure are contrasted and analyzed. The outcome shows that the deformation and stress of the surrounding rock are lower than those of plain concrete when rubber concrete is used as backfill material. The vault settlement and arch bottom settlement are reduced by 0.4 mm and 0.6 mm, respectively, and the maximum principal stress is increased by 11.5%. Therefore, the stability of the tunnel structure is enhanced by employing rubber concrete backfill.

Author Contributions

All authors contributed to the study’s conception and design. Conceptualization was performed by R.Z. and C.L. Data collection was performed by Z.L. Formal analysis was performed by R.Z. Investigation was performed by R.Z. and J.Z. Methodology was performed by B.W. Writing—original draft was performed by R.Z. Project administration was performed by B.W. All authors have read and agreed to the published version of the manuscript.

Funding

This APC was funded by the Natural Science Foundation of China (Grant Numbers: 52168055 and 52278397), the Natural Science Foundation of Jiangxi Province (Grant Number: 20212ACB204001), “Double Thousand Plan” Innovation Leading Talent Project of Jiangxi Province (Grant Number: jxsq2020101001), China Postdoctoral Science Foundation (Grant Number: 2022M711429), Natural Science Foundation of Jiangxi Province (Grant Number: 20224BAB204058), the Open Foundation of MOE Key Laboratory of Engineering Structures of Heavy Haul Railway (Central South University) (Grant Number: 2022JZZ01) and Jiangxi Province Graduate Innovation Special Fund Project (Grant Number: YC2022-B179). Their support is gratefully acknowledged.

Institutional Review Board Statement

Not applicable.

Informed Consent Statement

Not applicable.

Data Availability Statement

The datasets generated and analyzed during the current study are not publicly available but are available from the corresponding author upon reasonable request.

Conflicts of Interest

The authors declare no conflicts of interest.

Abbreviations

OCOrdinary concrete
RCRubber concrete
RC-1Rubber concrete with a grain size of 0.85 mm
RC-2Rubber concrete with a grain size of 1–3 mm
RC-3Rubber concrete with a grain size of 3–6 mm
σTest compressive strength
σrStandard compressive strength
EElastic modulus
DDamage variables
KElastic resistance coefficient

References

  1. Meng, J. Research on structural force characteristics and scheme optimization of backfilling construction of open-cut tunnel group, Southwest. Jiaotong Univ. 2021. [Google Scholar] [CrossRef]
  2. Zhang, W.; Zhang, R.; Goh, A. Multivariate Adaptive Regression Splines Approach to Estimate Lateral Wall Deflection Profiles Caused by Braced Excavations in Clays. Geotech. Geol. Eng. 2018, 36, 1349–1363. [Google Scholar] [CrossRef]
  3. Zhang, R.; He, C.G.; Fei, W.; Li, J. Experimental study on dynamic pore water pressure of saturated cohesive soil and gravel. Rock Mech. 2006, 10, 1805–1810. [Google Scholar] [CrossRef]
  4. Chen, Y.; Ma, Y.F.; Tang, Q.S.; Zhou, Y. Influence of elastic modulus of back-fill concrete above mid-wall on stability of multi-arch tunnel. J. Central South Univ. Sci. Technol. 2012, 43, 1138–1143. [Google Scholar]
  5. Xu, H.F.; Zeng, C.C. Optimization Design and Construction of Backfilling Materials for the Arch Foot of Long Distance Open Excavation Section of Submarine Tunnel. Portal. Highw. 2021, 66, 376–379. [Google Scholar]
  6. Yao, Z.M.; Zhang, M.H.; Chen, J.H. Cyclic Accumulative Pore Pressure Explicit Model of Saturated Soft Clay and Long-term Settlement Calculation of Subway Tunnel Roadbed. J. China Railw. Soc. 2012, 34, 87–92. [Google Scholar] [CrossRef]
  7. Wang, J.; Li, X.; Guo, B.; Ding, G.; Liu, T.; Sun, Y.; Yu, M. Test Study on Settlement Model of Ultra-Thick Backfill in High-Speed Railway Tunnel through Giant Karst Cave. China Railw. Sci. 2022, 43, 84–95. [Google Scholar] [CrossRef]
  8. Zhao, Y.; Shang, Y.H. Study on Dynamic Characteristics and Cumulative Deformation Law of Subgrade under Dynamic Load of High-speed Train. Railw. Stand. Des. 2017, 61, 56–61. [Google Scholar] [CrossRef]
  9. Ishikawa, T.; Sekine, E.; Miura, S. Cyclic Deformation of Granular Material Subjected to MovingWheel Loads. Can. Geotech. J. 2011, 48, 691–703. [Google Scholar] [CrossRef]
  10. Yang, B.M.; Liu, B.G. Analysis of Long-Term Settlement of Shield Tunnel in Soft Soil Areatunder Cyclic Loading of Subway Train. China Railw. Sci. 2016, 37, 61–67. [Google Scholar]
  11. Jiang, Z.; Gao, G.Y.; Zhao, H.; Chen, G.Q. Long-term settlement of tunnels induced by subway moving load in soft soil districts. Chin. J. Geotech. Eng. 2013, 35, 301–307. [Google Scholar]
  12. Pang, D.P.; Liu, F.; Li, L.J. Survey of application and research of rubber concrete. China Rubber Ind. 2007, 54, 182–185. [Google Scholar]
  13. Sgobba, S.; Borsa, M.; Molfetta, M.; Marano, G.C. Mechanical performance and medium-term degradation of rubberised concrete. Constr. Build. Mater. 2015, 98, 820–831. [Google Scholar] [CrossRef]
  14. Elchalakani, M. High strength rubberized concrete containing silica fume for the construction of sustainable road side barriers. Structures 2015, 1, 20–38. [Google Scholar] [CrossRef]
  15. Yang, R.; Wang, Z. Application Research of Rolled Rubber Concrete in Engineering. Concrete 2011, 12, 139–141. [Google Scholar]
  16. Sofi, A. Effect of waste tyre rubber on mechanical and durability properties of concrete–A review. Ain Shams Eng. J. 2018, 9, 2691–2700. [Google Scholar] [CrossRef]
  17. Hu, P.; Zhu, H. Experimental study on permeability of crumb rubber concrete. J. Tianjin Univ. Technol. 2006, 22, 8–12. [Google Scholar] [CrossRef]
  18. Jie, X.U.; Yao, Z.Y.; Yang, G.; Han, Q.H. Research on crumb rubber concrete: From a multi-scale review. Constr. Build. Mater. 2020, 232, 117282. [Google Scholar] [CrossRef]
  19. Jing, X.U.; Hong, J.X.; Wan, Y.; Liu, J.P. In fluence of rubber powder on shrinkage cracking of concrete. Concrete 2009, 10, 96–98. [Google Scholar]
  20. Suad, A.B. Investigation of corrosion damage in a reinforced concrete structure in Kuwait. ACI Mater. J. 1998, 3, 226–231. [Google Scholar] [CrossRef]
  21. Nehdi, M.; Khan, A. Cementitious composites containing recycled tire rubber: An overview of engineering properties and potential applica-tions. Cem. Concr. Aggreg. 2001, 23, 3–10. [Google Scholar] [CrossRef]
  22. Toutanji, H.A. The use of rubber tire particles in concrete to replace mineral aggregate. Cem. Concr. Compos. 1996, 18, 135–139. [Google Scholar] [CrossRef]
  23. Wang, B.M.; Guo, Z.Q.; Han, Y. The research progress of rubberied concrete on the shrinkage and cracking property. Low Temp. Arch. Technol. 2012, 34, 4–6. [Google Scholar] [CrossRef]
  24. Chen, W.W. Research on Toughness of Crumb Rubber Concrete. Tianjin Univ. 2014. [Google Scholar]
  25. Son, K.S.; Iman, H.; Kypros, P.K. Strength and deformability of waste tyre rubber-filled reinforced concrete columns. Constr. Build. Mater. 2011, 25, 218–226. [Google Scholar] [CrossRef]
  26. Han, J.H.; Yuan, Q.; Feng, L.Y.; Wang, W.W.; Zhao, F. Research on Shock Resistance of Rubber Concrete. Yellow River 2018, 40, 107–114. [Google Scholar]
  27. Khaloo, A.R.; Dehestani, M.; Rahmatabadi, P. Mechanical properties of concrete containing a high volume of tire–rubber particles. Waste Manag. 2008, 28, 2472–2482. [Google Scholar] [CrossRef] [PubMed]
  28. Pang, J.Y.; Chen, Y.; Huang, X.; Liu, G.C.; Huang, J. Impact of Equal-amplitude Cyclic High Stress Loading on Mechanical and Deformation Properties of Rubber Concrete. J. Changjiang River Sci. Res. Inst. 2020, 37, 142–148. [Google Scholar]
  29. Huang, X.; Pang, J.; Liu, G.; Chen, Y. The influence of equal amplitude high stress repeated loading on the mechanical and deformation characteristics of rubber concrete—ScienceDirect. Constr. Build. Mater. 2020, 266, 121–135. [Google Scholar] [CrossRef]
  30. Gholampour, A.; Fallah Pour, A.; Hassanli, R.; Ozbakkaloglu, T. Behavior of actively confined rubberized concrete under cyclic axial compression. J. Struct. Eng. 2019, 145, 04019131. [Google Scholar] [CrossRef]
  31. Li, P.D.; Wu, Y.F. Stress-strain behavior of actively and passively confined concrete under cyclic axial load. Compos. Struct. 2016, 149, 369–384. [Google Scholar] [CrossRef]
  32. Song, Z.T.; Thomas, F.H.; Heinz, K. Inhomogeneous mechanical behaviour of concrete subjected to monotonic and cyclic loading. Int. J. Fatigue 2020, 132, 105383. [Google Scholar] [CrossRef]
  33. Song, Z.; Konietzky, H.; Frühwirt, T. Hysteresis energy-based failure indicators for concrete and brittle rocks under the condition of fatigue loading. Int. J. Fatigue 2018, 114, 298–310. [Google Scholar] [CrossRef]
  34. Jiang, D.Y.; Liu, Y.H.; Chen, J. Fatigue performance of ordinary concrete subjected to stepwise discontinuous cyclic loading. J. Southeast Univ. 2019, 49, 631–637. [Google Scholar]
  35. Abusharar, S.W. Effect of Particle Sizes on Mechanical Properties of Concrete Containing Crumb Rubber. Innov. Syst. Des. Eng. 2015, 6, 114–125. [Google Scholar]
  36. JGJ55-2011; Specification for Mix Proportion Design of Ordinary Concrete. China Architecture & Building Press: Beijing, China, 2011.
  37. GB/T 50081-2002; Standard for Test Method of Mechanical Properties on Ordinary Concrete. China Architecture & Building Press: Beijing, China, 2003.
  38. Liu, H.R.; Xia, L.L.; Dai, Y.; Zhao, M.; Zhou, Z.; Liu, H.B. Fabrication and characterization of novel hydroxyapatite/porous carbon composite scaffolds. Mater. Lett. 2012, 66, 36–38. [Google Scholar] [CrossRef]
  39. JGJ/T70-2009; Standard for Test Method of Basic Properties of Construction Mortar. China Architecture & Building Press: Beijing, China, 2009.
  40. Hany, N.F.; Hantoche, E.G.; Harajli, M.H. Axial stress-strain model of CFRP-confined concrete under monotonic and cyclic loading. J. Com. Constr. 2015, 19, 1–16. [Google Scholar] [CrossRef]
  41. Wang, C.L.; Xu, B.G.; Li, S.L.; Tang, H.Y. Study on a constitutive model of damage of SFRC under uniaxial compression. Rock Soil Mech. 2006, 27, 151–154. [Google Scholar] [CrossRef]
  42. Hu, S.C. Study on mechanical properties and energy response characteristics of high-porosity concrete under cyclic loading and unloading. China Univ. Min Technol. 2018. [Google Scholar]
  43. Yue, X.G. Numerical simulation analysis on the influence of blasting construction of small clear distance tunnel. Railw. Constr. Technol. 2018, 4, 9–12. [Google Scholar]
  44. Chen, W.Z.; Tian, H.M.; Yang, F.D.; Geng, Y.M. Study of effects of foam concrete preset deformation layer on long-term stability of deep soft rock tunnel. Rock Soil Mech. 2011, 32, 2577–2583. [Google Scholar] [CrossRef]
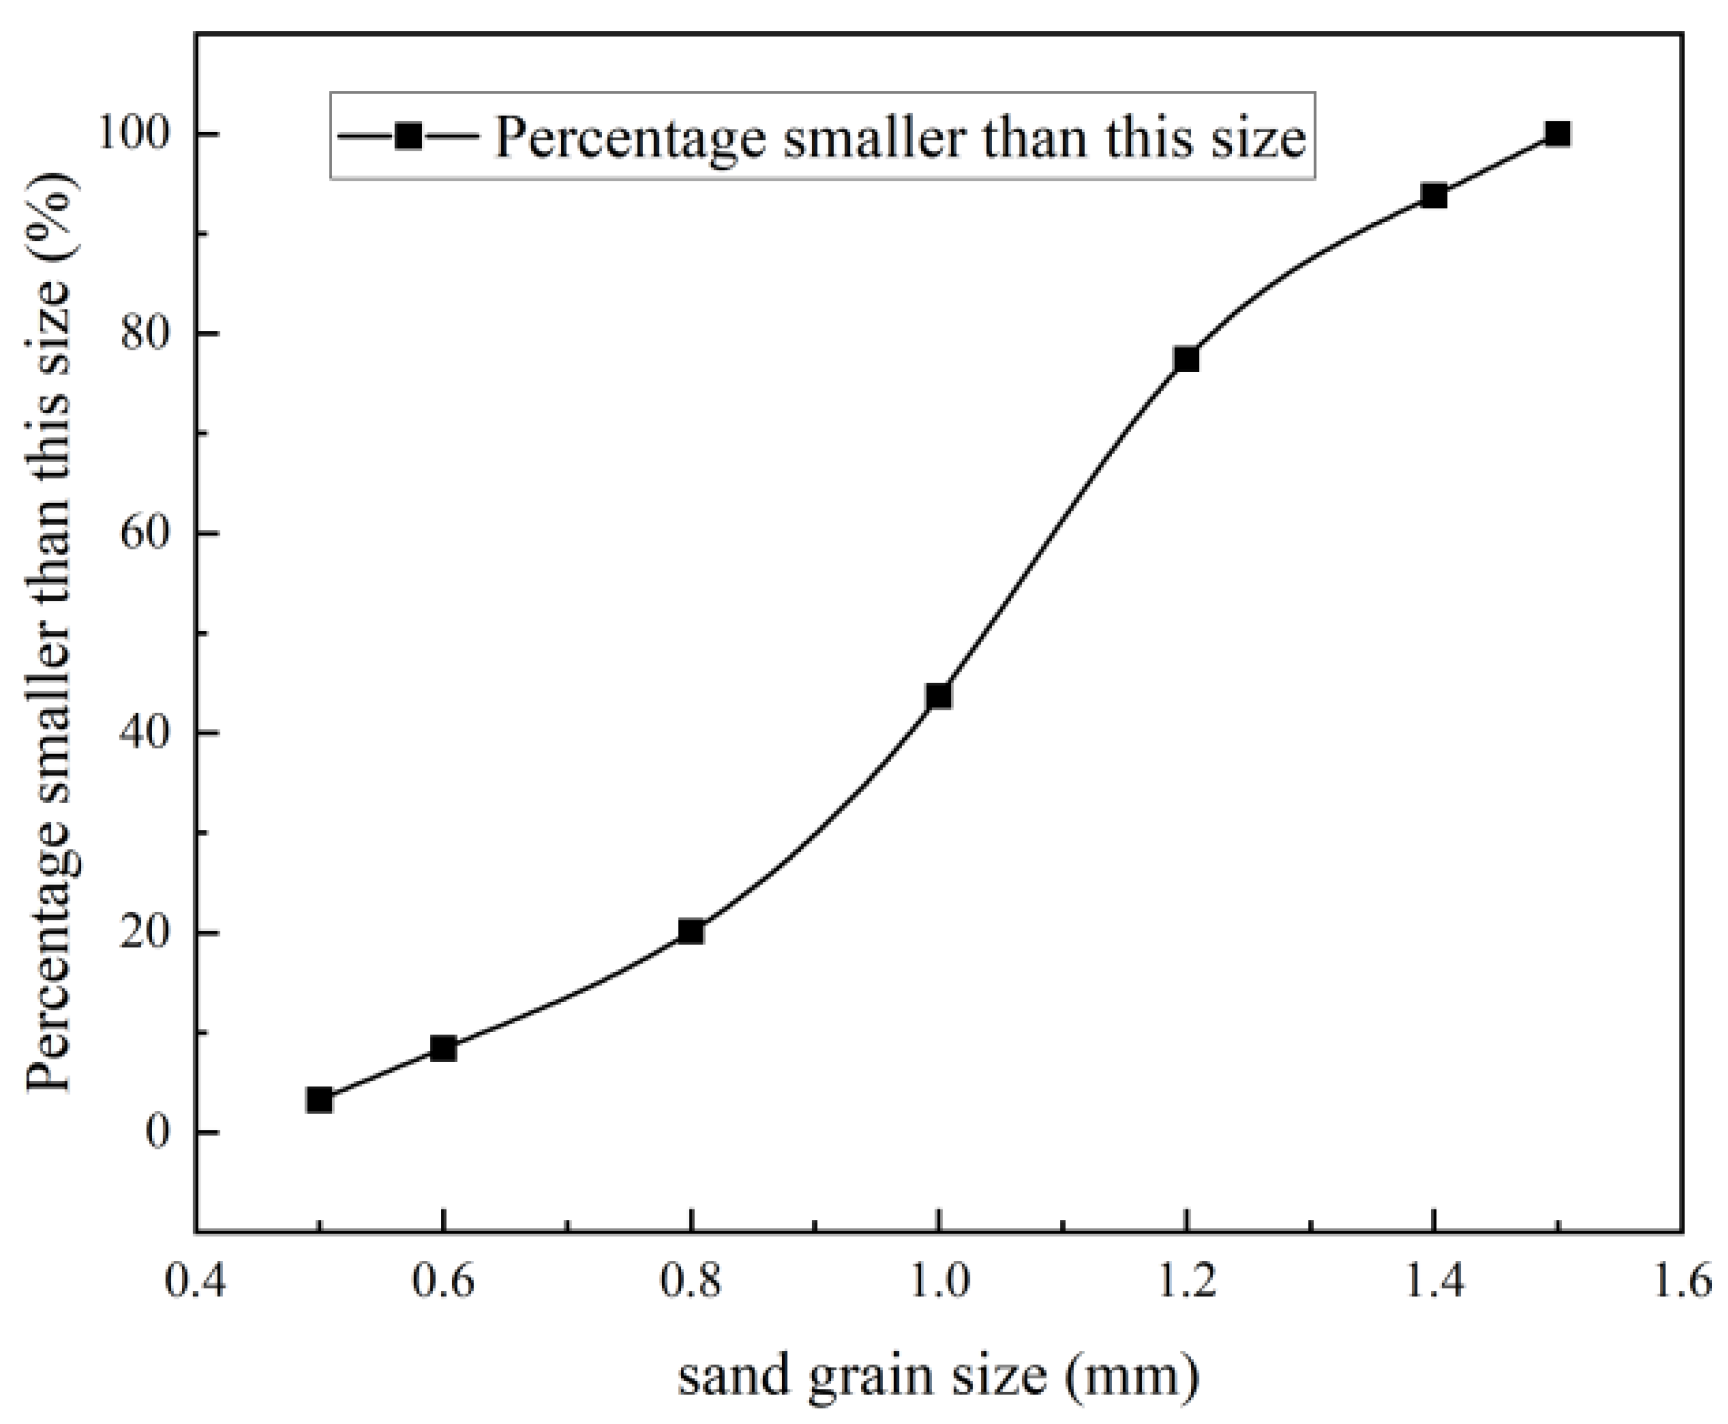
Figure 1. Particle gradation chart of sand.
Applsci 14 04129 g001
Figure 2. Testing process.
Applsci 14 04129 g002
Figure 3. Pattern of cyclic loading.
Applsci 14 04129 g003
Figure 4. The observation of the specimen under cyclic loading. (The spuare represents the variation of cracks during loading and unloading).
Applsci 14 04129 g004
Figure 5. SEM image of rubber concrete of each particle size.
Applsci 14 04129 g005
Figure 6. Stress−strain curves of the concrete specimens (the OC strain is small first and then large, and the RC is the opposite).
Applsci 14 04129 g006
Figure 7. Schematic diagram of toughness index calculation.
Applsci 14 04129 g007
Figure 8. The relationship between the values in the first cycle. (‘W’ is dissipated energy, ‘Wd’ is total absorption energy).
Applsci 14 04129 g008
Figure 9. Damage variable of rubber concrete.
Applsci 14 04129 g009
Figure 10. Computational model.
Applsci 14 04129 g010
Figure 11. Schematic diagram of the scheme.
Applsci 14 04129 g011
Figure 12. Maximum principal stress diagram.
Applsci 14 04129 g012
Table 1. Cementing material chemical composition (%).
CompositionCaOSiO2Al2O3MgOFe2O3Na2OSO3Ignition Loss
ContentCement63.1122.605.031.464.38-2.241.18
Fly ash2.4753.2634.720.394.071.90-4.07
Table 2. Mechanical properties index parameters before and after cyclic loading and unloading.
Samplefp/MPaff/MPaE1/GPaE2/GPaT1T2
OC20.318.32.461.472.872.51
RC-114.112.71.681.543.913.52
RC-213.612.31.551.463.663.33
RC-312.411.21.82 1.293.122.76
Note: The uniaxial compressive strength without cyclic loading is noted as fp; the uniaxial compressive strength of cyclic loading is noted as ff; the elastic modulus before and after cyclic loading is noted as E1, E2; the toughness index before and after cyclic loading is noted as T1, T2.
Table 3. Variation in energy of rubber concrete with cycle times. (J) (the energy dissipation of the first cycle concrete material is relatively large, and then the change is small).
Test Piece Number1/n2/n10/n20/n30/n40/n50/n
WdWWdWWdWWdWWdWWdWWdW
OC2.428.91.126.21.926.02.625.92.327.22.425.82.625.7
RC-112.324.11.314.71.214.11.213.71.213.61.413.61.413.9
RC-213.625.81.616.11.915.91.815.41.315.51.615.51.715.4
RC-312.322.31.513.91.412.71.312.51.312.51.312.71.412.4
Table 4. Material parameter.
Test Piece NumberWeigh
γ (kN/m3)
E (MPa)K (MPa/m)νHydraulic Conductivity (m/s)
OC241470231.10.22.3 × 10−6
RC-1211540242.10.22.1 × 10−6
Table 5. Computing result.
Evaluating IndicatorOCRC-1
Crown settlement (mm)29.128.7
Bottom settlement (mm)−26.4−27.0
Horizontal displacement of left arch waist (mm)8.587.61
Horizontal displacement of right arch waist (mm)−8.39−7.40
Maximum principal stress (MPa)0.961.07
Disclaimer/Publisher’s Note: The statements, opinions and data contained in all publications are solely those of the individual author(s) and contributor(s) and not of MDPI and/or the editor(s). MDPI and/or the editor(s) disclaim responsibility for any injury to people or property resulting from any ideas, methods, instructions or products referred to in the content.