Article

Intelligent Diagnosis of Concrete Defects Based on Improved Mask R-CNN

School of Civil Engineering, Architecture and Environment, Hubei University of Technology, Wuhan 430068, China
*
Author to whom correspondence should be addressed.
Appl. Sci. 2024, 14(10), 4148; https://doi.org/10.3390/app14104148
Submission received: 10 April 2024 / Revised: 6 May 2024 / Accepted: 10 May 2024 / Published: 14 May 2024
(This article belongs to the Section Civil Engineering)

Abstract

:
With the rapid development of artificial intelligence, computer vision techniques have been successfully applied to concrete defect diagnosis in bridge structural health monitoring. To enhance the accuracy of identifying the location and type of concrete defects (cracks, exposed bars, spalling, efflorescence and voids), this paper proposes improvements to the existing Mask Region Convolution Neural Network (Mask R-CNN). The improvements are as follows: (i) The residual network (ResNet101), the backbone network of Mask R-CNN which has too many convolution layers, is replaced by the lightweight network MobileNetV2. This can solve the problem that the large number of parameters leads to a slow training speed of the model, and improve the ability to extract features of smaller targets. (ii) Embedding attention mechanism modules in Feature Pyramid Networks (FPNs) to better extract the target features. (iii) A path aggregation network (PANet) is added to solve the problem that the model Mask R-CNN lacks the ability to extract shallow layer feature information. To validate the superiority of the proposed improved Mask R-CNN, the multi-class concrete defect image dataset was constructed, and using the K-means clustering algorithm to determine the aspect ratio of the most suitable prior bounding box for the dataset. Following, the identification results of improved Mask-RCNN, original Mask-RCNN and other mainstream deep learning networks on five types of concrete defects (cracks, exposed bars, spalling, efflorescence and voids) in the dataset were compared. Finally, the intelligent identification system for concrete defects has been established by innovatively combining images taken by unmanned aerial vehicles (UAVs) with our improved defect identification model. The reinforced concrete bridge defects images collected by UAVs were used as test set for testing. The result is the improved Mask R-CNN with superior accuracy, and the identification accuracy is higher than the original Mask-RCNN and other deep learning networks. The improved Mask-RCNN can identify the new untrained concrete defects images taken by UAVs, and the identification accuracy can meet the requirements of bridge structural health monitoring.

1. Introduction

Concrete has excellent durability and it is one of the most important materials in the field of civil engineering. However, for roads, bridges, tunnels, houses and other infrastructure with long service periods that are subjected to influencing factors such as vehicle loads and climate, these factors will cause various defects on their concrete surfaces, such as cracks, exposed bars, spalling, efflorescence and voids [1]. These defects not only affect the aesthetics of concrete structures but also reduce the bearing capacity and stability of concrete structures, which can endanger people’s lives and property [2,3]. So, the regular detection of concrete defects for important buildings is necessary.
Manual visual inspection is the traditional and popular defect detection method; the inspectors carry inspection tools to measure, photograph and record the defects, and then classify them. However, during inspections of roads, tunnel walls, train plate rails and other structures, the road must be closed, as it will have a bad effect on the traffic. When the inspectors work, they must take a special detection vehicle to reach the vicinity of the defect, but there are still some defect locations that cannot be reached. At this time, some researchers have used numerical simulation techniques to assess the residual capacity of the concrete elements in question [4], such as the innovative discrete element method [5,6] and the traditional finite element method [7]. However, only the overall bearing capacity of the structure can be assessed and subtle concrete defects cannot be detected.
The use of UAVs for the inspection of building surface defects solves these problems [8,9]; when inspectors remotely operate UAVs to photograph the defects, it is both safe and fast. However, the inspectors still need to classify the recorded images, which takes a lot of time.
Researchers have started to use image processing techniques for the segmentation and recognition of structural defect images [10,11]. With the rapid development of computer technology, people have begun to explore how to use computer technology to interpret images, which is referred to as computer vision technology [12].
Computer vision technology simulates biological vision through computers and related equipment, and then determines the target category. Computer vision tasks mainly include image classification, target detection, semantic segmentation and instance segmentation. Image classification is to analyze an input image and return the label task of a category contained in the image. Target detection consists of extracting the moving foreground or the target of interest from the video or image taken. The objective is to detect the target’s position and category simultaneously. In general, semantic segmentation requires decoding the image to the pixel domain completely, and then target detection is carried out according to the information of each pixel. Instance segmentation is to locate and classify each decoded pixel domain on the basis of semantic segmentation by a rectangular detection frame.
In recent years, when researchers use deep learning techniques to perform computer vision tasks, excellent results are obtained, and certain typical deep learning models have been applied to image recognition and classification in several industries, such as crop pest identification [13], medical lesion detection and identification [14], autonomous driving [15], robotics [16] and air quality prediction [17]. The faster region-based convolutional neural networks (Faster R-CNNs), single shot multibox detector (SSD), You Only Look Once (YOLO), U-networks (U-net) and Mask R-CNN are the typical deep learning models. In these models, Faster R-CNN, SSD and YOLO can only perform target detection, U-Net can only perform semantic segmentation and Mask R-CNN is the most popular algorithm for instance segmentation at present. Mask R-CNN adds a mask branch for semantic segmentation on the basis of Faster R-CNN, fully convolutional network (FCN) is used for semantic segmentation for each proposal box of Faster R-CNN and segmentation, localization and classification tasks are carried out simultaneously.
In civil engineering, these models are also widely utilized for the target detection of the defect images of the important buildings, such as cracks in high-speed railway slab tracks [18], cracks and exposed bars on the surface of tunnel walls [19], cracks on the surface of the high-rise bridge pier and cracks [20], steel corrosion and loosened bolts in steel bridges [21]. Concrete cracks were successfully detected by the Faster R-CNN based model, and a bounding box was generated to locate the cracks [22]. The improved network model based on YOLO was also successful in achieving the target detection of various concrete defects, such as cracks on concrete surfaces [23,24], spots, exposed bars and spalling [25]. In the literature [26], U-Net was used to achieve pixel-level segmentation of concrete cracks; it output a black and white image where the white areas represent the background and black areas represent the cracks.
However, these research results do not achieve instance segmentation of the defects, just only target detection and semantic segmentation. Instance segmentation, as a combination of target detection and semantic segmentation, not only pinpoints the edge of the defect but also labels different parts with the same kind of defect in the image. In literature [27] and literature [28,29], concrete voids and cracks were segmented based on Mask R-CNN, respectively, but both studies only address one kind of defect. In addition, researchers have cut the images before performing concrete defect identification, only one or two types of defects were retained in one image and there is artificial interference [30]. However, in original defect images, the size and shape of each defect are different and different types of defects may appear in one image, so it is difficult to achieve instance segmentation and takes a lot of time.
ResNet101, the backbone network of Mask R-CNN which has too many convolution layers and only one feature layer, has a lower ability to extract features from smaller defects, and the large number of parameters leads to the slow training speed of the model.
In order to obtain higher identification accuracy and better segmentation performance for concrete defects, the main work of this paper is as follows:
(1)
Constructed the dataset from multiple defects of concrete. Collected the concrete defect images, including crack, exposed bar, spalling, efflorescence and void, and used data expansion techniques (translation, flip, brightness change and noise addition) to expand the dataset, which solves the problem of the unbalanced number of samples in the concrete defect dataset and enhances the robustness and generalization of the model.
(2)
Optimized the scale and aspect ratio of the prior box. Used the K-means clustering algorithm to determine the most appropriate scale and aspect ratio of the prior box for the multiclass concrete defect dataset aforementioned, so that the rectangular prediction boxes could be evenly distributed on the concrete defects and the redundancy of prediction boxes could be reduced.
(3)
Replaced the residual network (ResNet101) with the lightweight network MobileNetV2 as the backbone network of Mask R-CNN, and combined with the path aggregation network (PANet), which solves the problem that ResNet101 has a lower ability to extract shallow feature information and its speed of computation is slow. Embedded attention mechanism modules in FPNs, which increased the extraction of semantic information by the model, and effectively avoided the influence of background on the performance of the model.
This paper is organized as follows: in Section 2, we describe the methods used for building and improving an instance segmentation model of concrete defect based on Mask-RCNN. In Section 3, we describe the dataset, the model parameters and the model performance evaluation indexes. In Section 4, we describe the results of instance segmentation. In Section 5, we describe different network model detection results in the open dataset. In Section 6, we describe detection results in actual engineering applications. In Section 7, we provide conclusions.

2. Methods

2.1. Mask R-CNN

Mask R-CNN constructs a mask branch based on Faster R-CNN, so it has both target detection functions and semantic segmentation functions and has become the pioneer of instance segmentation. Mask R-CNN adopts ResNet101 as the backbone for image feature extraction, which solved the problem that deep neural networks were difficult to train due to the exploding and vanishing gradient problem. The Mask R-CNN architecture is shown in Figure 1; it contains five parts:
(1)
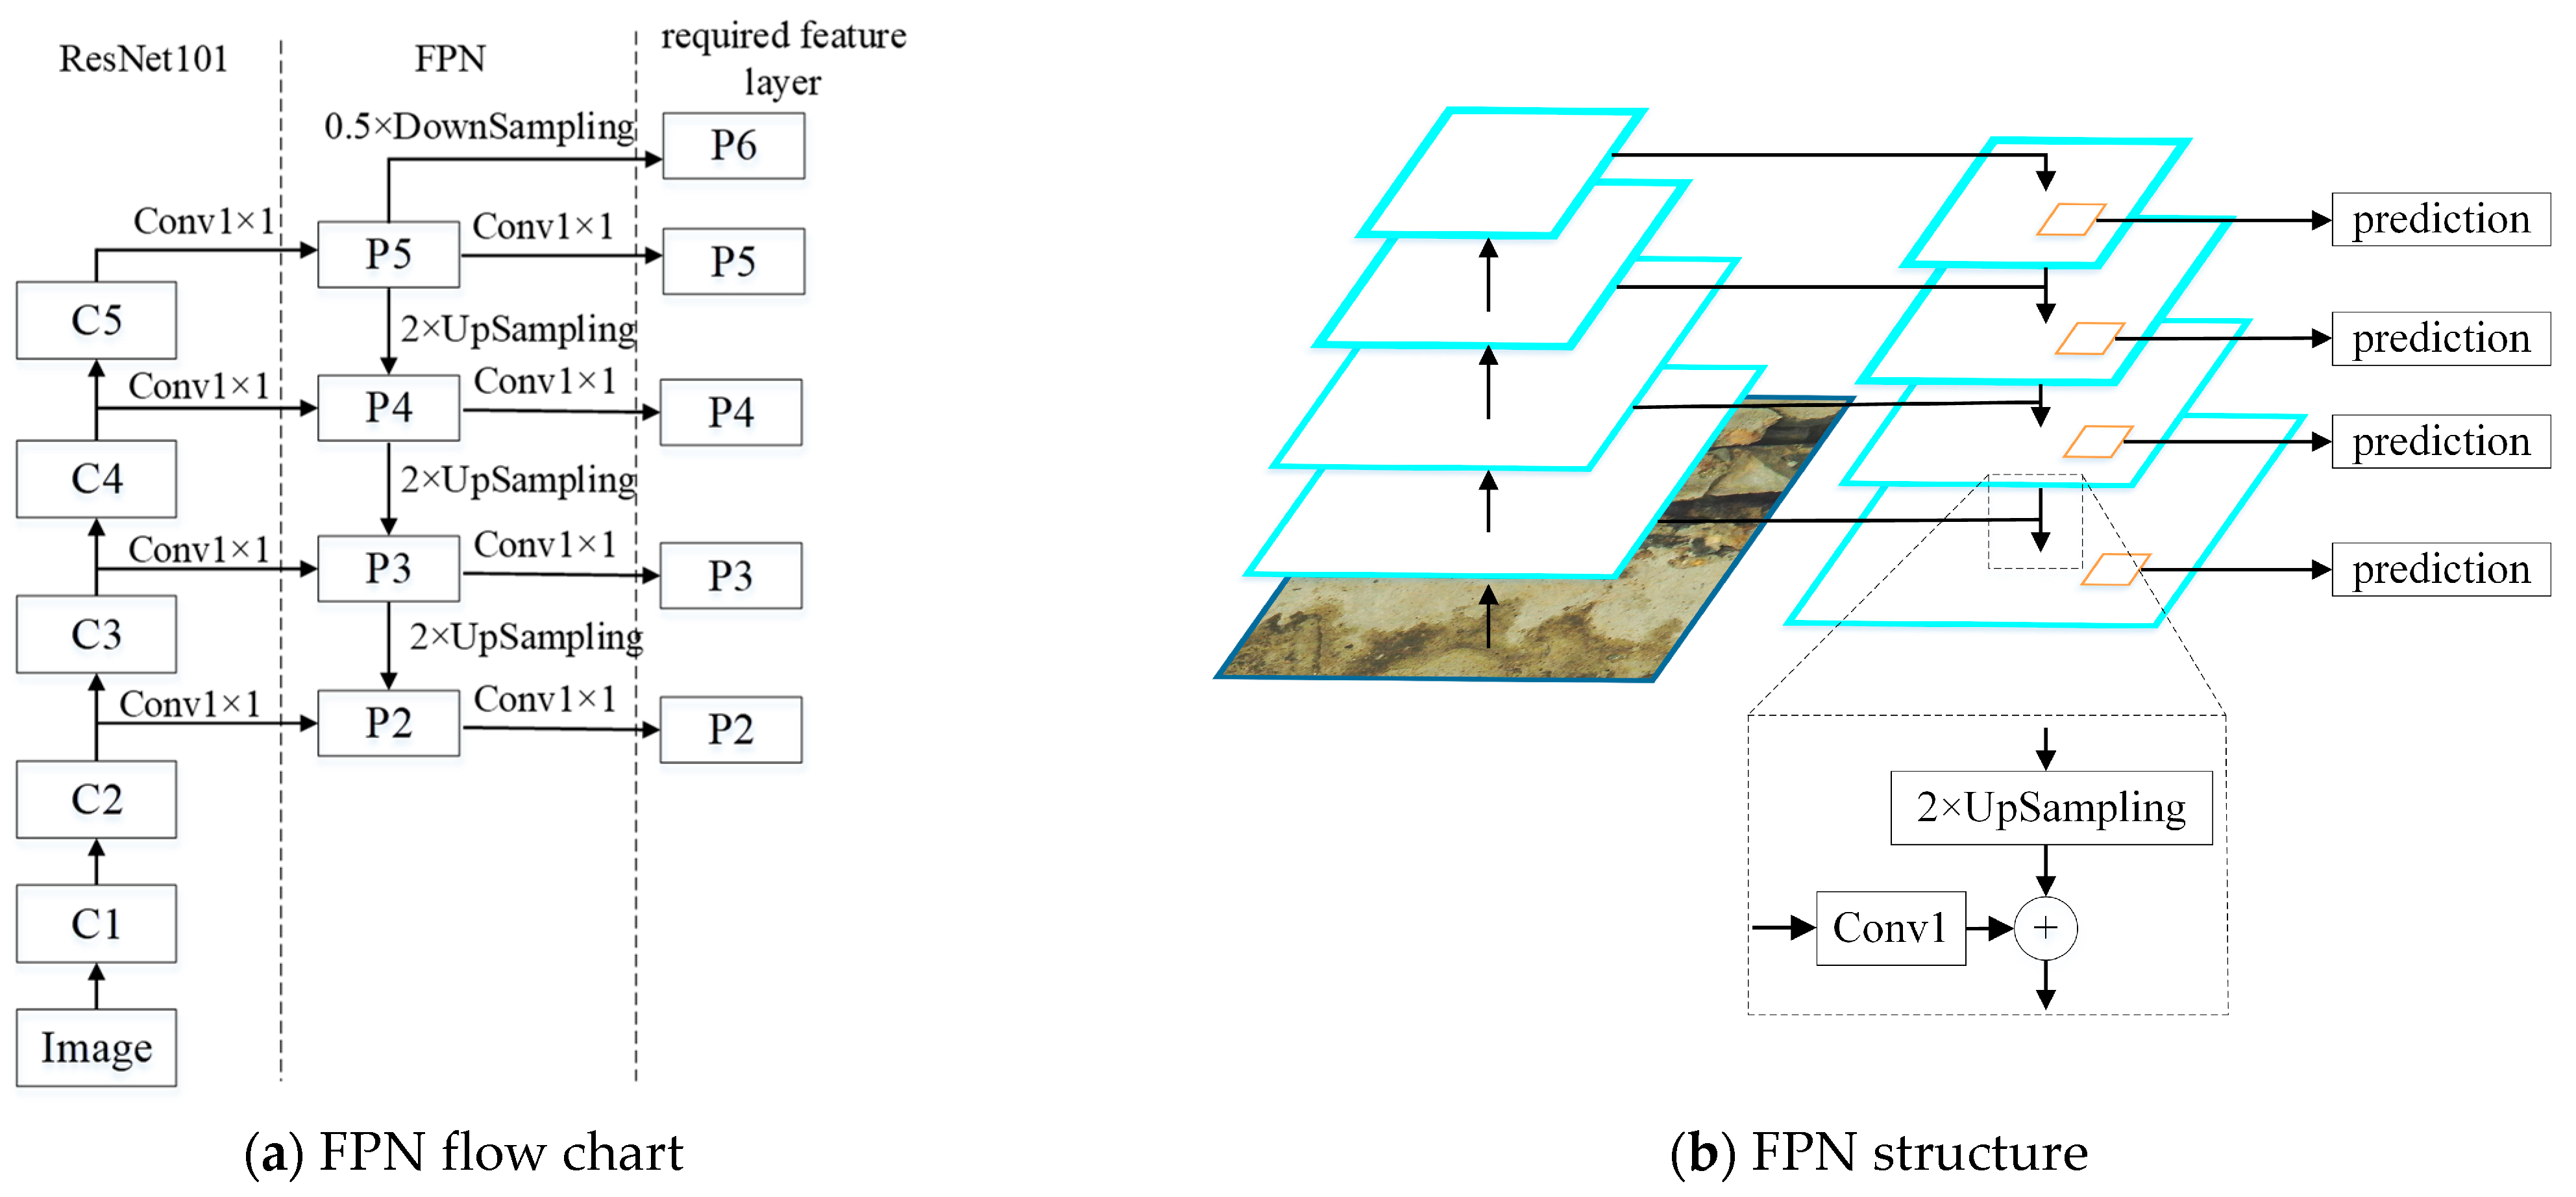
Feature extraction network: combined ResNet101 and FPNs to extract the multiscale feature map. As shown in Figure 2, the left is ResNet101, and the original image is convolved and pooled to obtain the feature figures C1–C5 of the five stages. Then, C5 is copied into P5, P5 is up-sampled, C4 is conducted dimensionality reduction and then C4 and P5 are fused to obtain P4, and so on, forming a top-down feature pyramid. Generally, convolutional neural networks (CNNs) directly use the feature maps of the last layer to predict the targets; although the feature map of the last layer has strong semantics, the resolution is relatively low, so the relatively small targets cannot be detected easily. FPN fuses the high semantic feature information of the higher layer with the high-resolution feature information of the lower layer, and can make the prediction on each feature layer, so that the features of smaller targets can be extracted more easily.
(2)
Region proposals: input feature map into region proposal network (RPN), take each pixel in the feature map as the center, map out nine different anchor boxes (which are formed by a free combination of three different aspect ratios (0.5, 1, 2) and three different pixel scales (1282, 2562 and 5122)) on the original image, to obtain multiple candidate regions of interest (ROIs); These candidate ROIs are judged by softmax on whether they contain targets, and bounding box regression is used to correct the position of anchors. The non-maximum suppression algorithm is used to filter out some candidate ROIs. Then, obtain region proposals.
(3)
ROI Align: through ROI Align, the region proposals are aligned to each pixel of the feature map, and each pixel of the feature map is aligned to fixed features.
(4)
Fully connected network: the region proposals which are aligned by pixel and fixed features are used for target classification and prediction box regression (target location).
(5)
Mask branch: generates a prediction box and classifies and masks the pixel points inside the box to obtain the semantic segmentation results.
The loss function L of Mask R-CNN is shown in Equation (1).
The loss function L contains three components: classification loss L c l s , detection loss L b o x and segmentation loss L m a s k .
L = L c l s + L b o x + L m a s k = 1 N c l s i l c l s p i , p i + λ 1 N r e g i p i L r e g t i , t i + L m a s k
where,
l c l s p i , p i = lg p i p i + 1 p i 1 p i ; L r e g = 1 N r e g i p i l r e g t i , t i
l r e g t i , t i = S m o o t h L 1 x = 0.5 x 2 ,   x < 1 x 0.5 ,   x 1 , x = t i t i
L m a s k = i t i lg s i g m o i d x i + 1 t i lg 1 s i g m o i d x i
where i is the index of the anchor box in each batch; p i represents the predicted probability when the anchor point i is a certain anchor box. If the anchor box is positive, the true label p i is 1; this means that the anchor box has a high overlap with a ground-truth object and the anchor box can be used to predict that object. If the anchor box is negative, and the true label p i is 0, this means that the overlap of this anchor box with any real object is so low that this anchor box should not be used to predict the target; t i represents the four parameterized co-ordinate vectors of the predicted bounding box and t i represents the four parameterized co-ordinate vectors of the true bounding box, which are the horizontal co-ordinate offsets of the center of the bounding box with respect to the center of the original candidate region, the vertical co-ordinate offset of the center of the bounding box with respect to the center of the original candidate region, the scaling factor of the width of the bounding box with respect to the width of the original candidate region and the scaling factor of the height of the bounding box with respect to the height of the original candidate region; S m o o t h L 1 is the regression loss function; N r e g is the regression loss standard normalization function.

2.2. Improvement on Mask-RCNN

The original Mask R-CNN adopts ResNet101 as the backbone network, which has too many convolution layers and only one feature layer. With the increasing depth of the convolution layer, it has a lower ability to extract features for smaller targets in concrete defects, such as cracks and voids, and the large number of parameters leads to slow training speed of the model.
In this paper, MobileNetV2 was used instead of ResNet101 in Mask-RCNN which is elaborated in Section 2.1. MobileNet is a lightweight network launched by Google, which was first proposed in 2017, aiming to greatly reduce the size of the model and speed up the computing speed of the model without sacrificing too much network performance. It is widely used because of its lightweight structure and excellent performance. MobileNet has three series, MobileNetV1, MobileNetV2 and MobileNetV3.
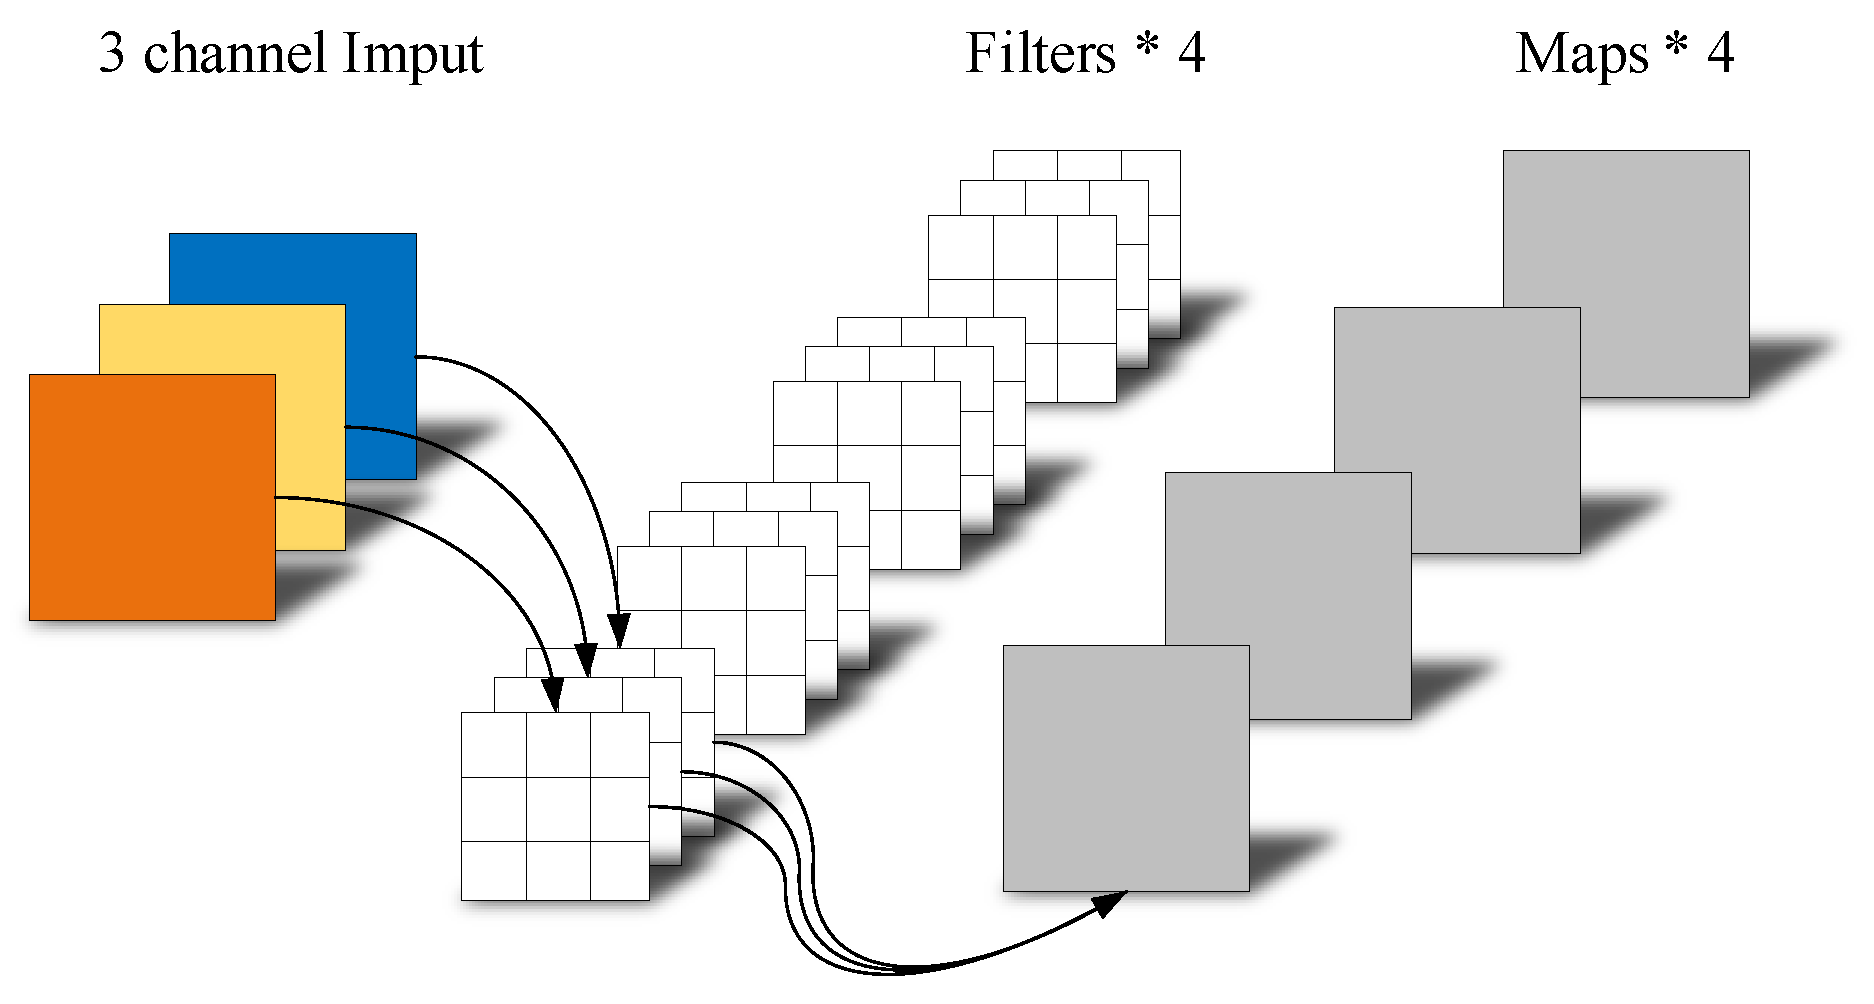
MobileNet V1 replaces standard convolutions with depthwise Separable Convolutions; it contains channel-to-channel convolution (depthwise convolution) and point-to-point convolution (pointwise convolution). In standard convolution, as shown in Figure 3, if the image is input, which has a size of 5 × 5 × 3, and wants to obtain the output which has a size of 3 × 3 × 4, then it needs four filters, and every filter contains three convolution kernels (size is 3 × 3). After each position in the three channels of each convolution kernel and each position in the three channels of the input image is element-wise multiplied, the three convolution kernels in every filter are merged to obtain feature maps. In this calculation, the number of parameters calculated is 3 × 3 × 3 × 4. As shown in Figure 4, in Depthwise Separable Convolutions, each convolution kernel operates on only one channel of feature input, so the number of convolution kernels is equal to the number of channels for input features; for the example mentioned earlier, if the image is input, with a size of 5 × 5 × 3, and want to obtain the output which has a size of 3 × 3 × 4, then it needs three filters, every filter contains one convolution kernel (size is 3 × 3), to obtain three maps (size is 3 × 3). Through dimensionality reduction and point-to-point convolution to fuse the information of three maps to obtain filters, every filter contains three convolution kernels (size is 1 × 1), merging the three convolution kernels in every filter to obtain feature maps. In this calculation, the number of parameters calculated is 3 × 3 × 1 × 3 + 1 × 1 × 3 × 4; compared with the number of standard convolution parameters, the number of depthwise separable convolution parameters is greatly reduced.
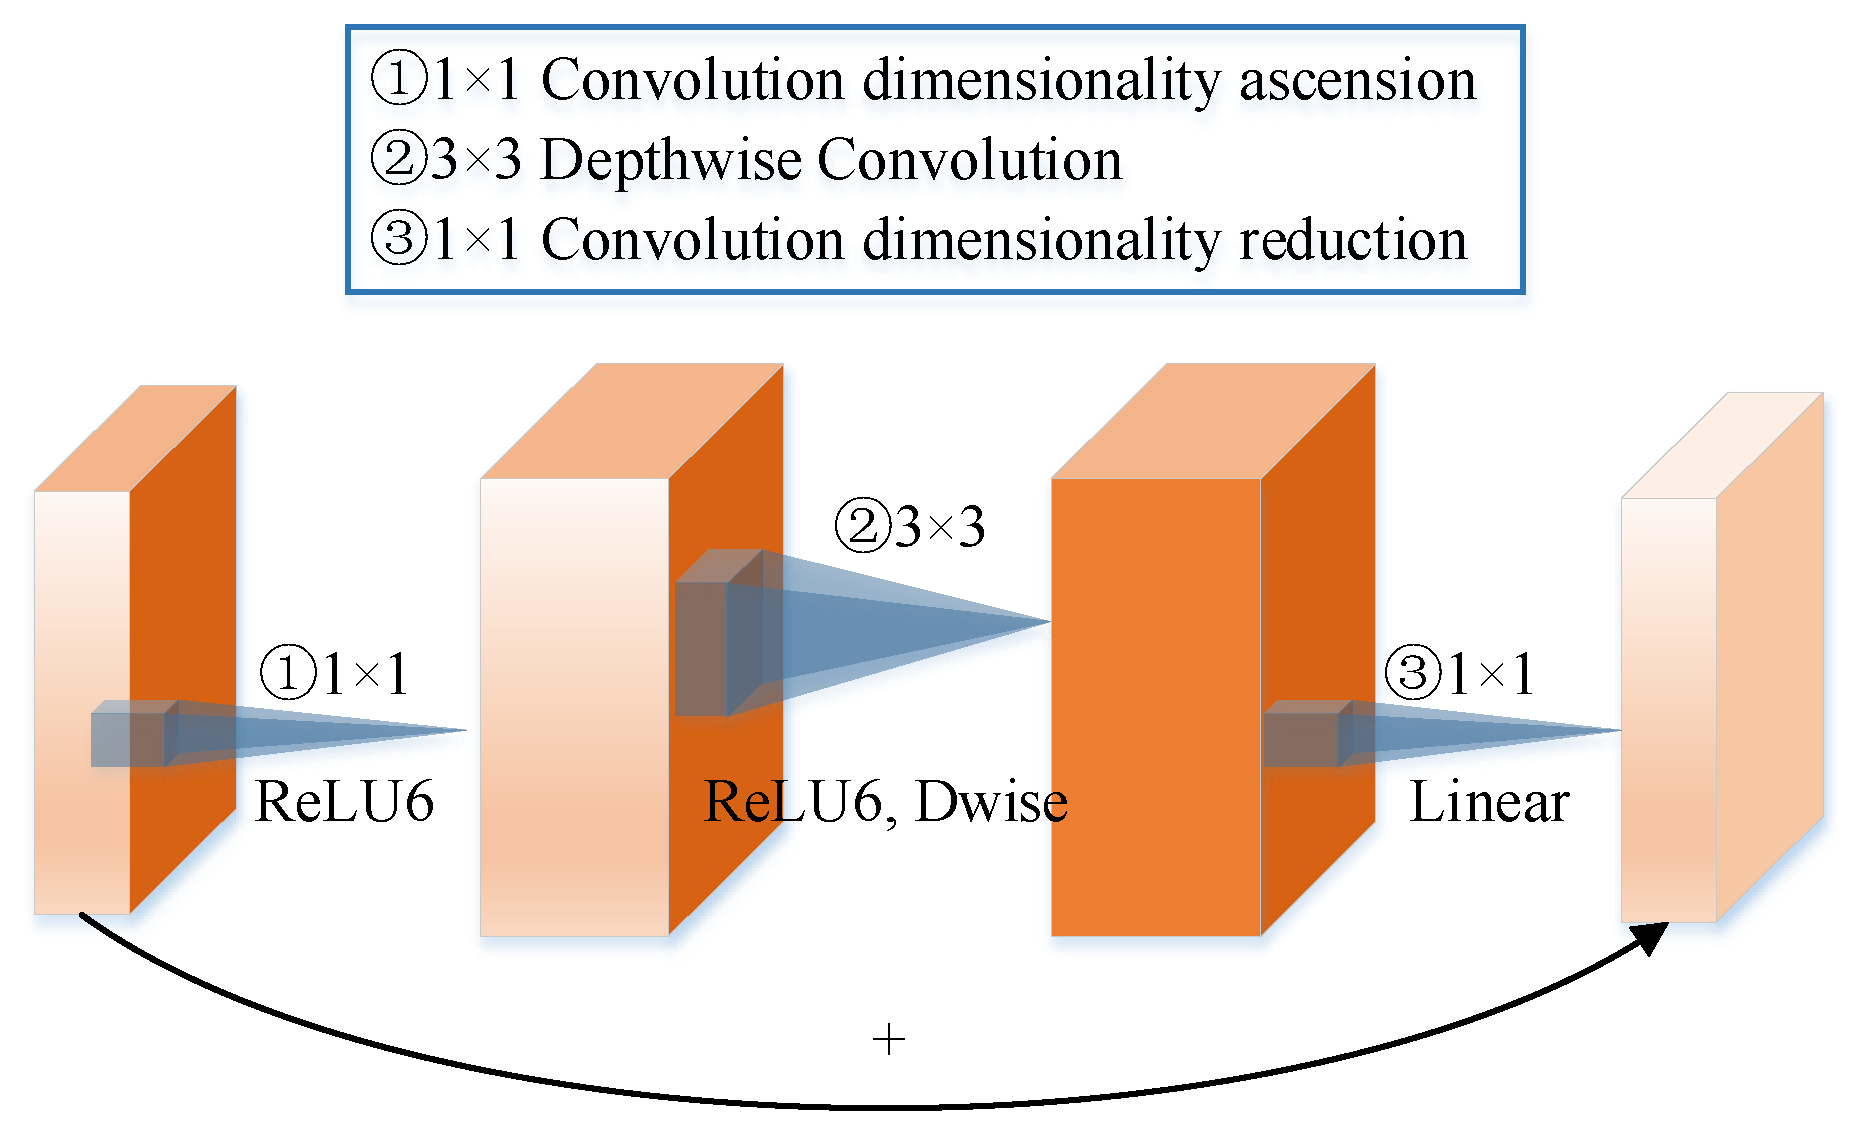
MobileNet V2 replaces the residual block with the inverted residual block on the basis of MobileNet V1. Figure 5 shows the computation process of the residual block in ResNet; first, dimensionality reduction is conducted for the input feature map by the convolution which has the size 1 × 1, then the convolution is used which is the size 3 × 3 to extract features and finally, the convolution is used which is the size 1 × 1 to conduct dimensionality ascension. It can reduce the calculation amount when the convolution conducts the feature extraction, so the computing speed of the network can be improved. However, if dimensionality reduction is conducted for the input feature map before feature extraction, it will lose some feature information. Figure 6 shows the computation process of the inverted residual block in MobileNet V2; first, dimensionality ascension by the convolution is conducted for the input feature map which is the size 1 × 1; then, the depthwise convolution is used, which is the size 3 × 3, to extract features, so such operation can extract more feature information; finally, the convolution of the size 1 × 1 is used to conduct dimensionality reduction.
MobileNet V2 adopts Linear Bottlenecks on the basis of MobileNet V1. In MobileNet V1, the activation function is ReLU. Using ReLU in a low dimensional space will cause great information loss, so in MobileNet V2, the last ReLU function is removed from each residual block, no activation function is used, and the module is called Linear BottleNecks; it can reduce the information loss caused by the activation function ReLU.
MobileNet V3 adds the attention mechanism based on MobileNet V2, and redesigns the activation function and the structure of the time-consuming layer. In view of the stability and applicability of the network structure, this paper selected MobileNet V2 as the backbone network.
For better identification of concrete defect features, the co-ordinate attention module is added to the feature extraction network to improve the detection performance of the model. The structure of the CA attention module is shown in Figure 7. For the feature layer of size W × H × C, firstly, average pooling is carried out along the horizontal X-direction and the vertical Y-direction, respectively, to generate the two feature layers of size 1 × H × C and W × 1 × C, which are subsequently spliced, and then downscaled by the convolution kernel of size 1 × 1, which reduces the number of its channels to the original C/r (r is the downsampling ratio), and then input to the batch normalization layer (BN) to improve the stability and convergence speed of the model. Then, through the activation function of h-Swish, the output feature layer after dimensionality reduction is separated according to the original height and width, and the feature layer is separated by using the two 1 × 1 convolution kernels, the separated two feature layers are transformed to the same number of channels as the input feature layer and the probability distributions of the above two feature layers are calculated by the Sigmoid function to obtain the attention weights in the horizontal and vertical directions, and the weights in the two directions are multiplied by the original feature map matrix to obtain the feature map with co-ordinate attention.
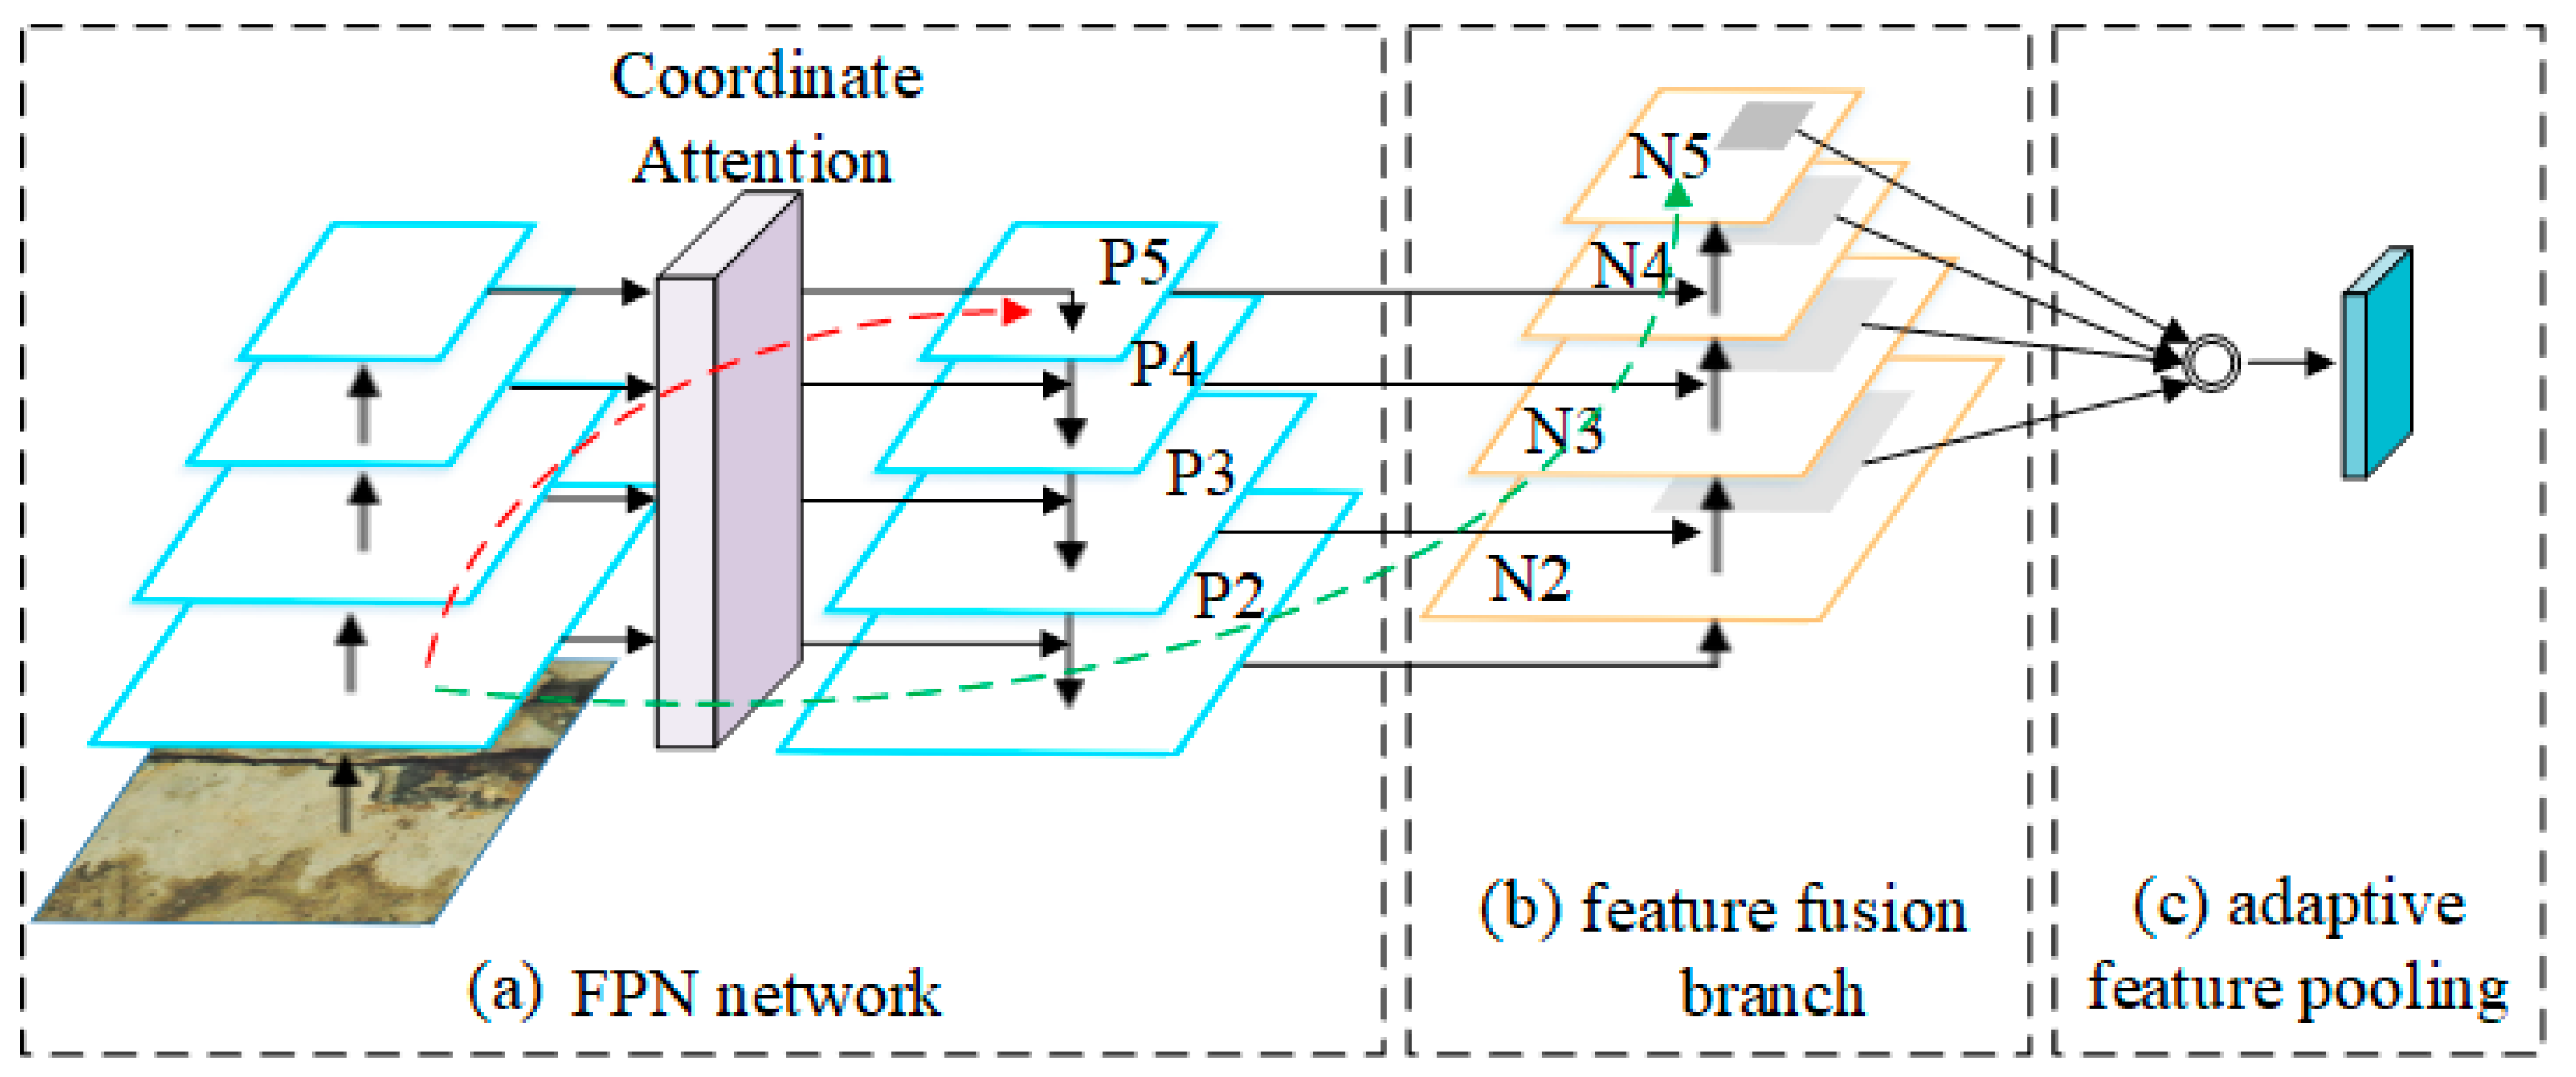
In the original Mask-RCNN, the feature pyramid networks (FPNs) use a bottom-up to top-down path to extract the multiscale feature map, the feature information is transmitted from the bottom layer to the top layer (the P5 layer) which would take dozens or even hundreds of convolutional layers, as shown by the red dotted line in Figure 8. After so many layers of transmission, it will lose a lot of feature information. In FPN, candidate regions are assigned to different feature layers according to their sizes. A small candidate region is allocated to a low-level layer (such as layer P2), while a large candidate region is allocated to a high-level layer (such as layer P5). This processing method is simple and effective, but it may not be able to obtain optimal feature fusion results. For example, candidate regions with a smaller pixel difference may be assigned to different feature layers, but in fact, the two candidate regions are very approximate.
This paper added a bottom-up feature fusion layer and adaptive feature pool to the FPN network to solve the above problem, it included the FPN network, bottom-up path augmentation and adaptive feature pooling, as shown in Figure 8. The path augmentation used a bottom-up path to fuse the feature information; in this way, the feature information of the lower layer was transmitted to the N2~N5 layer through only a few layers, as shown by the green dotted line in Figure 8. It will reduce the loss of feature information from the low layer to the high layer. In adaptive feature pooling, every region proposal was aligned to each pixel of the N2~N5 feature maps through ROI Align. There were four different feature maps for each ROI, and then four different feature maps were fused together to generate the final feature map, as shown by the gray area in Figure 8c. In this way, the final feature map can include richer contextual information, and the subsequent target classification and target location are more accurate based on it.

3. Experimental Data and Parameters

3.1. Experimental Data

This paper made the dataset containing five types of concrete defects. The defect images in the dataset were from the daily bridge inspection work carried out by Hubei University of Technology. The software Label-Me 4.5.13 was applied to label concrete defects, and the label forms were linear, rectangular and wrapped. LabelMe can select the appropriate label form according to the contour shape of different concrete defects. The images labeled are shown in Figure 9.
The training effect of the deep learning model has a great correlation with the sample size of the dataset. The larger the dataset, the better the effect reflected in the model. This paper adopted data augmentation technology to augment the dataset. Augmentation methods included changing brightness, adding noise, adding random points, translating images and flipping images. Each generated image will have at least one effective data augmentation method, as shown in Figure 10.
After augmentation, the total number of images in the dataset is 11,853. These images were randomly divided into a training set, verification set and test set according to the ratio 8:1:1.

3.2. Aspect Ratios of the Anchor Boxes

Generally, in Mask R-CNN, there are three aspect ratios of anchor boxes (0.5, 1, 2). However, the shape of the concrete defects is varied, such as the cracks are slender, and the spalling is polygonal; these anchor boxes (three different aspect ratios (0.5, 1, 2)) are not necessarily suitable for the shape of the concrete defects.
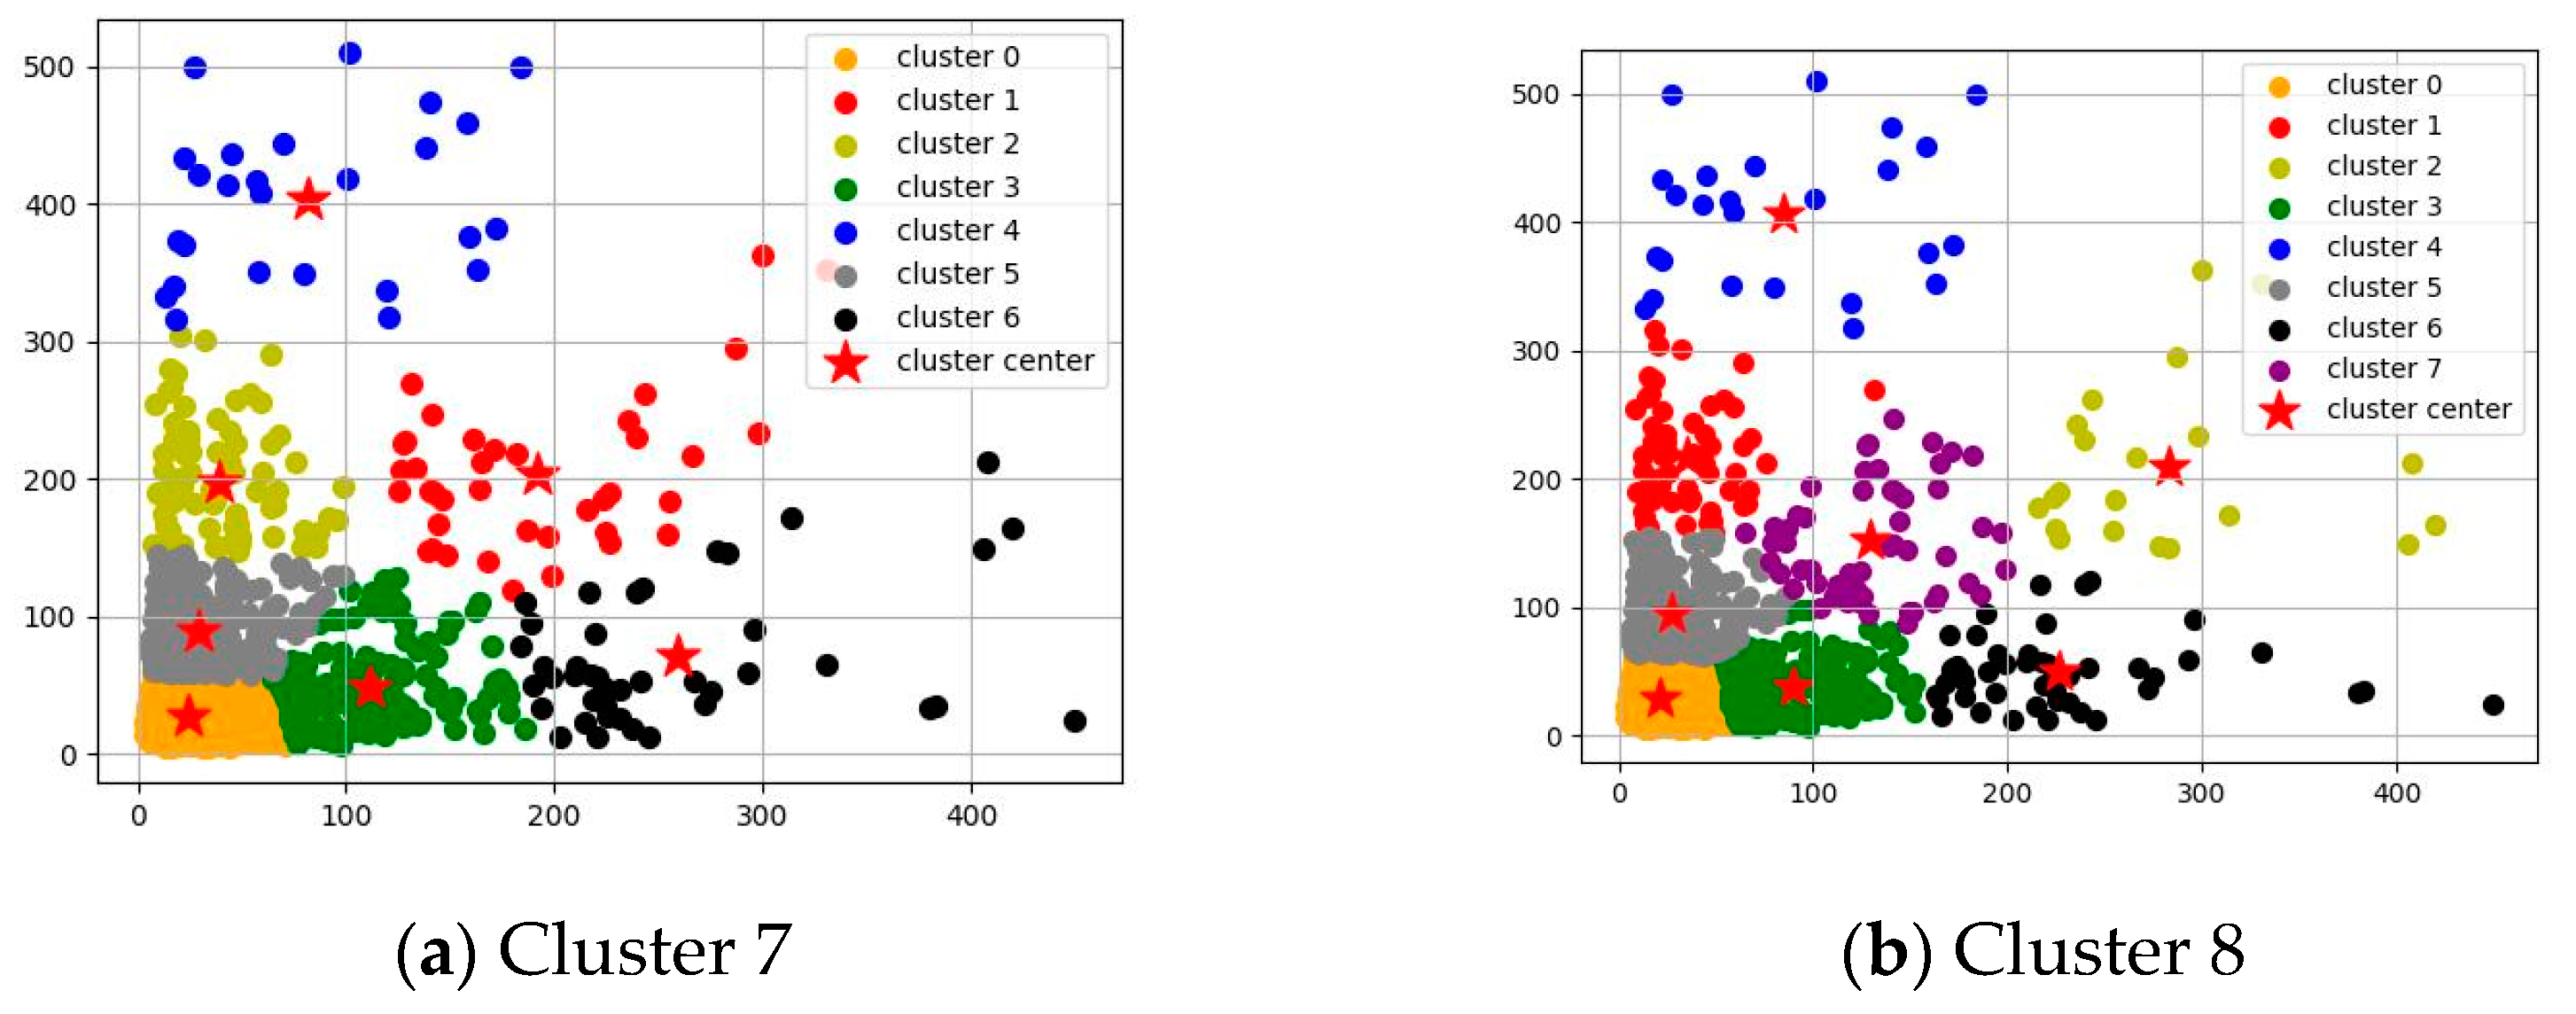
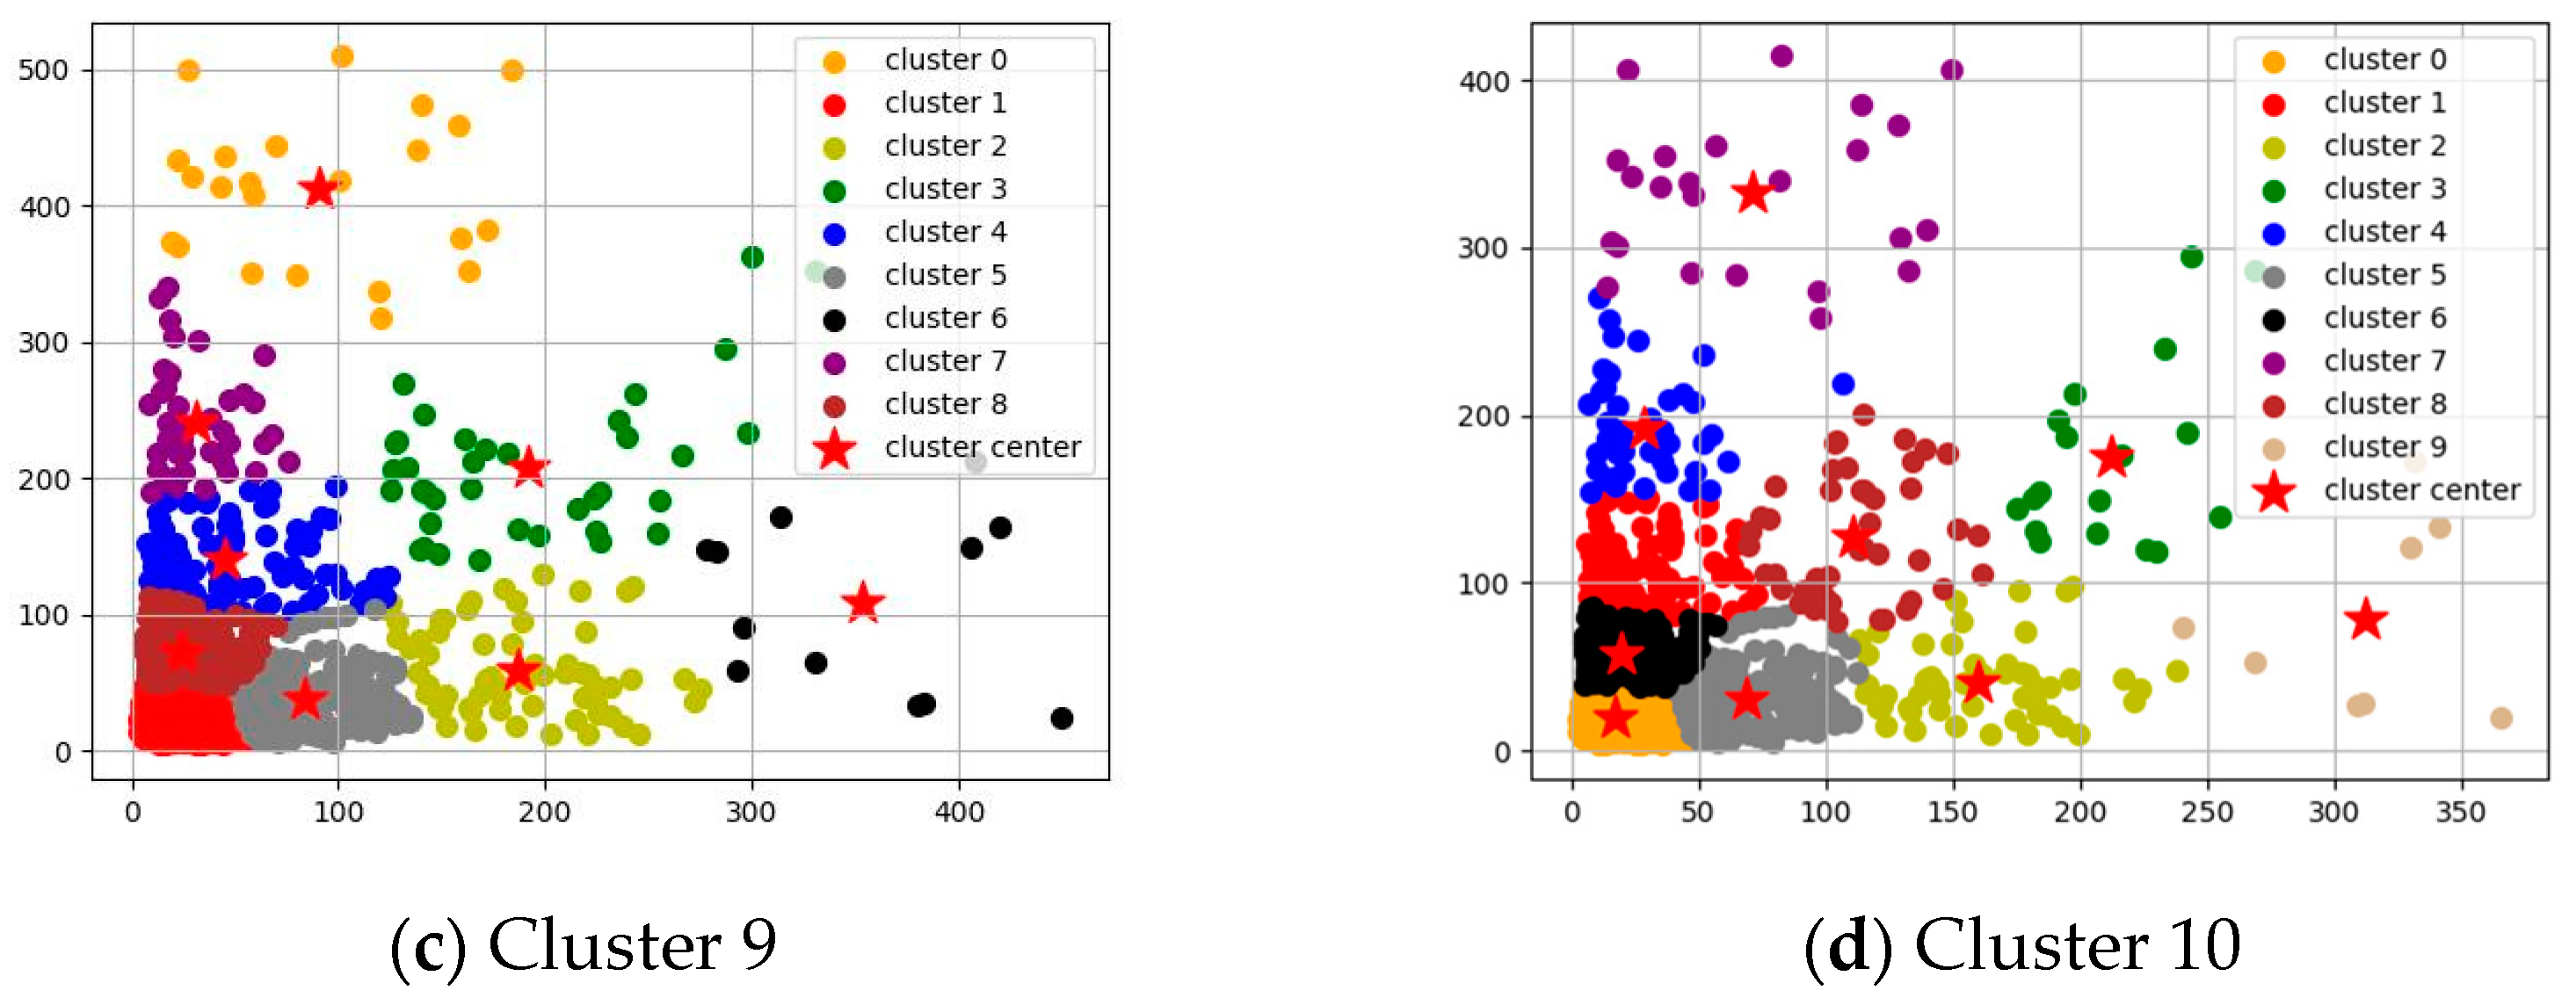
In this paper, the K-means clustering algorithm was used to select the proper aspect ratios of the anchor boxes. In the K-means clustering algorithm, K data points were randomly selected as the initial clustering center, and for each data point in the dataset, its distance to each cluster center is calculated and assigned to the cluster corresponding to the cluster center with the closest distance. For each cluster, calculate the average of all data points within it and use this average as the new cluster center. The above steps are repeated until the clustering centers no longer change significantly or a preset number of iterations is reached. When the clustering center starts invariant, this means that the algorithm has converged to a state where each sample point is assigned to the nearest clustering centre and these assignments do not change in successive iterations. All the samples are correctly classified, and the optimal classification result is achieved. Figure 11 shows the clustering graph for the concrete defect dataset. with the increasing number of clusters, the clustering center starts to be invariant until the ninth cluster. This state does signify that the algorithm has found a ‘locally optimal’ classification result. At this time, the aspect ratios of the anchor box are (0.06, 1, 17.36).

3.3. Model Training

The segmentation model based on Mask-RCNN was constructed on the TensorFlow platform. TensorFlow is a deep learning framework developed by Google based on the programming language Python, which has a wide range of applications in the fields of vision, natural language processing and other scenarios.
In the model training, the initial learning rate was set to 0.001; the size of batch was set to 32; the training period was set to 30; each training period was set to 3000 steps; and the learning momentum factor was set to 0.9. Stochastic gradient descent (SGD) was used as the optimization algorithm, with ReLU as the activation function and Adam as the optimizer.

3.4. Evaluation Index

For the segmentation task, whether the prediction anchor box can accurately contain the targets determines whether the segmentation of the whole segmentation network is successful or not. In RPN, intersection over union (IoU) is used to judge whether the prediction anchor box is correct. Shown in Figure 12, B1 is the ground-truth bound, B2 is the prediction anchor box.
If the prediction anchor box and the ground-truth bound overlap perfectly, the intersection is equal to the union, IoU = 1. Generally, if IoU ≥ 0.5, the target is considered to have been predicted successfully [31], so 0.5 is the threshold of IoU. However, the higher the IoU threshold is, the more accurate the bounding box.
In this paper, the threshold of IoU was set as 0.75. The image sample is predicted by Mask-RCNN. If the value of IoU is greater than 0.75, this sample is defined as a true positive (TP). If the value of IoU is less than 0.75, this sample is defined as a false negative (FN). If a negative sample is predicted to a positive sample, this sample is a false positive (FP).
Main Evaluation indexes, for instance segmentation results, are as follows: precision, recall rate, average precision (AP) and mean average precision (mAP) [30]. Precision is the percentage of correct detection (TP) in all detection results, while recall represents the fraction of correct detection (TP) found within all ground truths. The formulas are as follows:
p r e c i s i o n = T P T P + F P
r e c a l l = T P T P + F N
AP is obtained by calculating the area under the precision–recall curve, and mAP is obtained by averaging the average accuracy of the total categories (N) in the verification set. The formulas are as follow:
A P = 0 1 P R d R
m A P = A P N

4. Experimental Evaluation and Analysis

4.1. Influence of the Aspect Ratios of the Anchor Boxes

In the original Mask-RCNN, the three different aspect ratios of anchor boxes are 0.5, 1 and 2. In this paper, the K-means clustering algorithm was used to select the proper aspect ratios of the anchor boxes; the three different aspect ratios of anchor boxes adopted in this paper are 0.06, 1 and 17.36. It is just that the aspect ratios of anchor boxes changed; nothing else changed. Table 1 shows the target detection results of original aspect ratios and improved aspect ratios.
As shown in Table 1, compared with the original Mask-RCNN, through the K-means clustering algorithm, the overall precision, recall rate and AP value of the model are up 0.4%, 0.7% and 0.7%, respectively, which shows that the K-means clustering algorithm improved the Mask-RCNN network model for the target detection of multiscale concrete defects.

4.2. Improved Mask-RCNN Detection Results

After the proper aspect ratios of anchor boxes are determined (0.06, 1 and 17.36), the predicted results of improved Mask-RCNN and original Mask-RCNN are shown in Table 2.
As shown in Table 2, compared with the original Mask-RCNN, the overall precision, recall rate and AP value of the improved Mask-RCNN model are up 0.8%, 2% and 3.7%. It shows that the improvement methods proposed in this paper are effective, the false detection and missing detection are reduced, and the AP values of cracks and voids are up 5.1% and 4.8%, respectively.

4.3. Instance Segmentation Visualization Results

Instance segmentation is a combination of target detection and semantic segmentation; visual results are more intuitive. Figure 13 shows the target detection visualization results of the original and improved Mask-RCNN models, and Figure 14 shows the semantic segmentation visualization results of the original and improved Mask-RCNN models.
As shown in Figure 13a and Figure 14a, both the target detection results and semantic segmentation results of the original Mask-RCNN model do not detect voids, only cracks are detected, which is missed detection. As shown in Figure 13b and Figure 14b, spalling and exposed bar are not accurately located in the target detection. Spalling is not completely masked in instance segmentation. As shown in Figure 13c and Figure 14c, part of the efflorescence is not detected in the target detection. Efflorescence is not completely masked in instance segmentation.
The comparison experimental results show that the improved Mask-RCNN model can more accurately locate and detect the defect and that the precision and recall rate are higher than the original model, and the missed detection and error mask operation are reduced.

4.4. Predicted Results of Different Network Models

In this section, the current mainstream deep learning models Faster R-CNN and YOLOv5 were applied to the defect detection for concrete. The models were trained by the same hyperparameters, and the same dataset. Using the same test set, the detection results of different target detection models are shown in Table 3.
As shown in Table 3, YOLOv5 takes the least time to inference an image on average, but has the lowest mAP value; the Mask R-CNN+K-means model, which changed the aspect ratios and scales of the anchor boxes through the K-means clustering algorithm, has higher overall accuracy than both the Faster R-CNN and the original Mask R-CNN model. Compared with Mask-RCNN+* without an embedded CA module, the improved Mask-RCNN in this paper has about 1% higher mAP value and just only 0.02 s lower inference time. Compared to the calculated results of other models, the improved Mask R-CNN model has the highest overall accuracy (mAP = 92.5%) and the difference in inference time is small for the comparison with Mask R-CNN+*. In summary, the improvement methods for Mask R-CNN in this paper are effective and appropriate for concrete defect detection.

5. Detection Results of Open Dataset

To verify the applicability and accuracy of the improved Mask R-CNN model for instance segmentation for different concrete defect datasets, this paper used the open dataset provided by Martin Mundt et al. [32] (downloaded from https://doi.org/10.5281/zenodo.2620293) to test. The defects of the open dataset include cracks, exposed bars, spalling and efflorescence and do not contain void defects. Some of the visualization results are shown in Figure 15; the different network models detection results are shown in Table 4.
As shown in Table 4, comparing with YOLOv5, Faster-RCNN and the original Mask-RCNN, all of them are the current mainstream network models, and all of them have high accuracy and low inference time. When tested on an open dataset, using the same hyperparameters, dataset and test set training as these models, the improved Mask-RCNN still has the highest mAP value; only YOLOv5 has a lower inference time than the improved Mask-RCNN. However, YOLOv5 has the lowest mAP value, which is close to 15% different from the improved Mask-RCNN in this paper. The mAP value of Faster-RCNN is about 10% lower and the inference time is about 0.2 s higher than the improved Mask-RCNN in this paper. Compared with the original Mask-RCNN, the improved Mask-RCNN has about 2% higher mAP value and about 0.4 s lower inference time. In the comprehensive comparison of mAP value and inference time, the improved Mask-RCNN is the best.

6. Engineering Applications

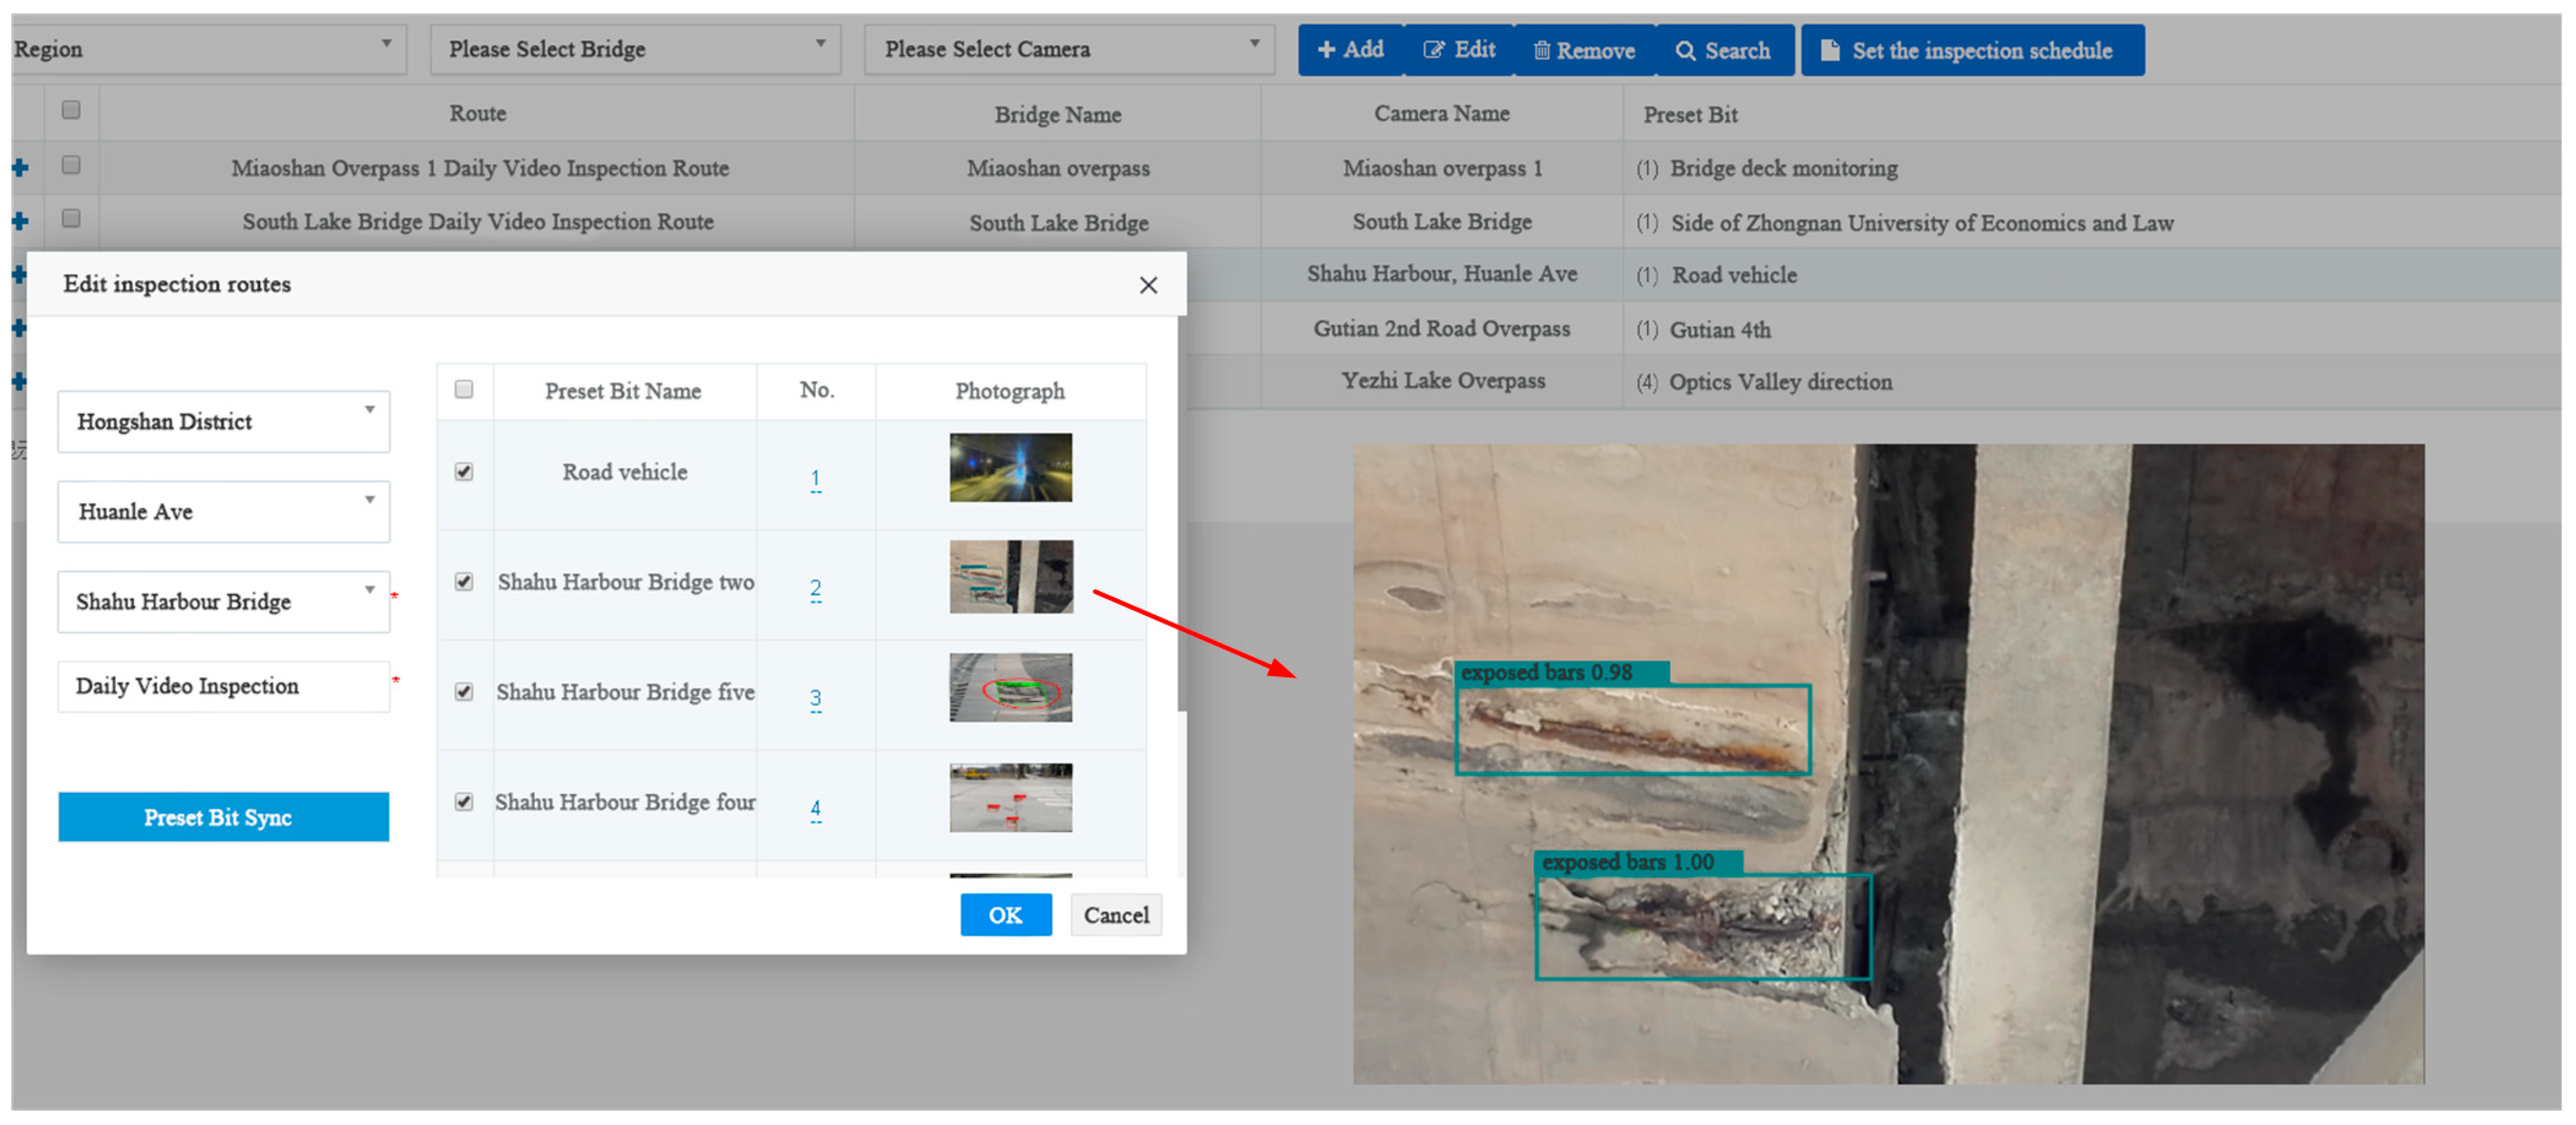
In order to form a closed loop from identification to maintenance of concrete defects, the concrete defect intelligent identification system was designed, which consists of an image acquisition module, a defect identification module and a subsequent maintenance module. Considering the convenience and ease of development on the Web side, this study encapsulated the improved Mask R-CNN model and built the system based on the Web side. To exclude possible artificial interference in the production of the dataset and to verify the feasibility of the method in actual engineering, the DJI Matrice 300RTK UAV was used to collect defects images in bulk. The flow diagram of the concrete defect intelligent identification system is shown in Figure 16. The concrete defect intelligent identification system identification result is shown in Figure 17.
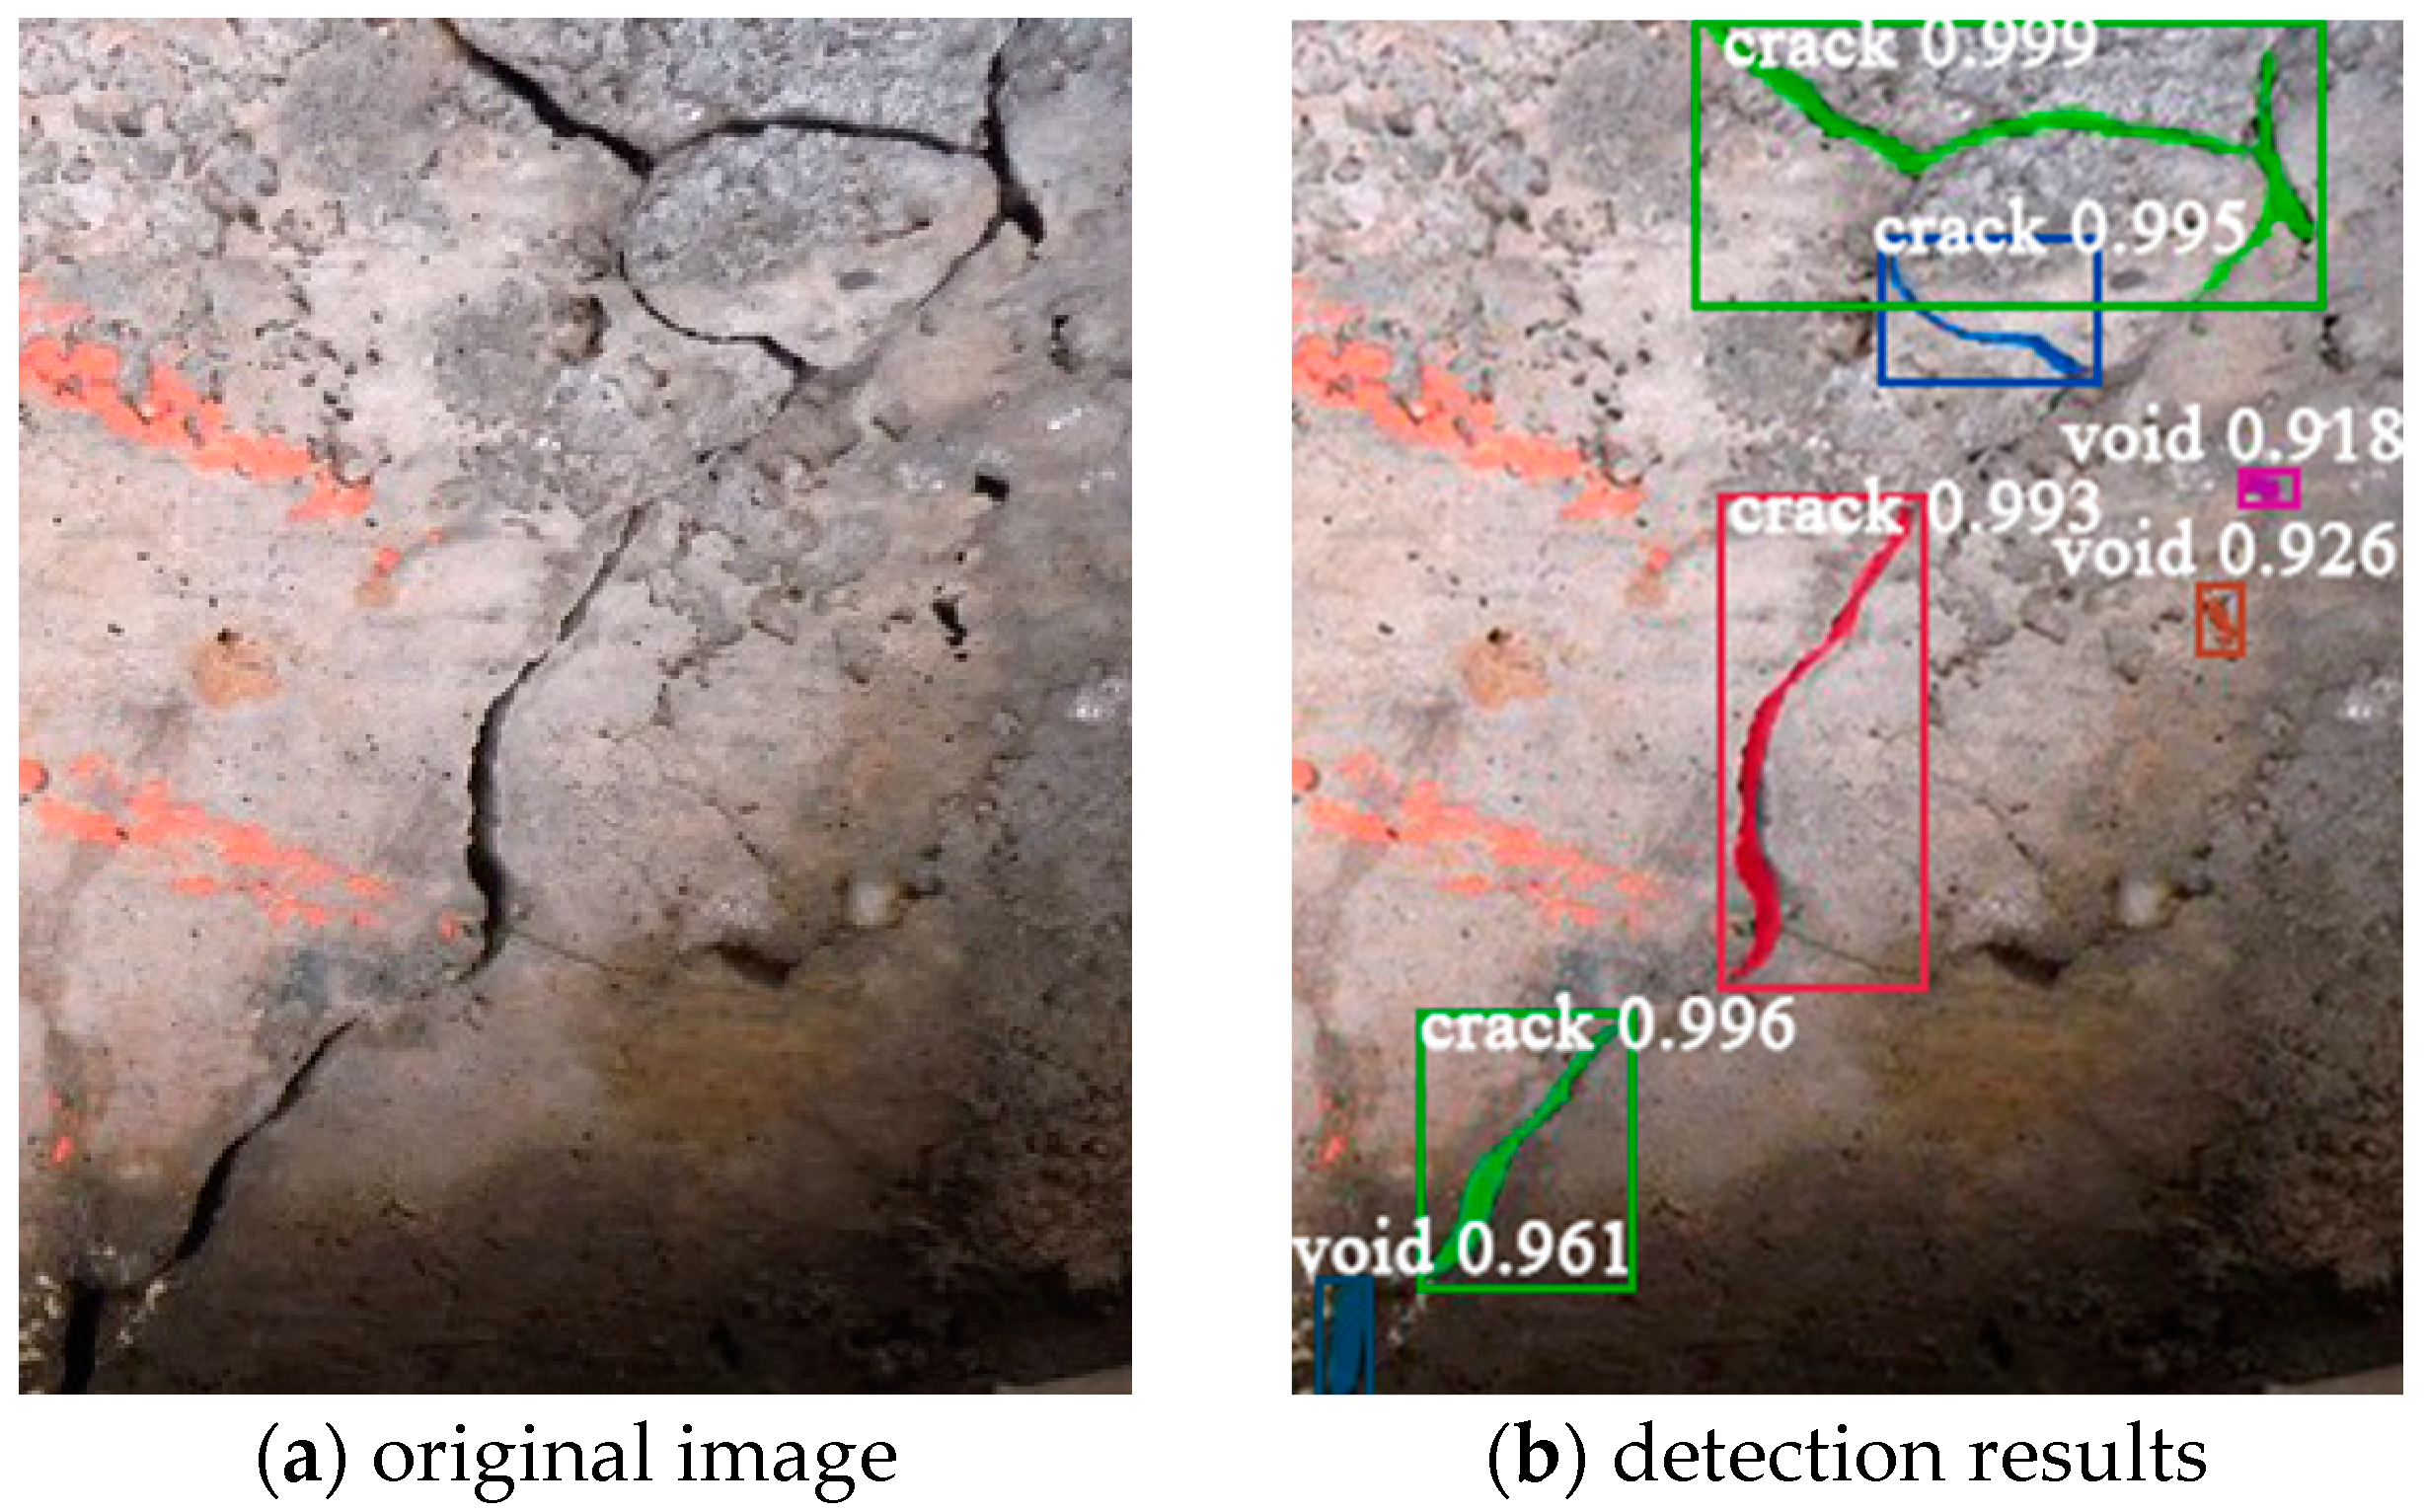
As shown in Figure 16, the defect images are transmitted to the image database through the wireless network; the concrete defect intelligent identification system obtains the image from the image database by executing the defect identification operation. Then, the defect identification module is used to identify the acquired image, determine whether the image contains defects and if there is a relevant defect, obtain the defect information and back it up to the historical database. Finally, the defect information and historical database are transmitted to the bridge health monitoring system. The maintenance personnel will view the defect information, and carry out reconnaissance and subsequent bridge maintenance on the damaged parts of the corresponding bridges. This paper used the images of reinforced concrete bridge defects collected by the DJI Matrice 300RTK UAV, which is located on the Wuhan–Huangshi expressway. The detection results are shown in Figure 18.
Figure 18a shows the original image taken by the UAVs; this paper used it directly in model inference without any special processing of the image. Figure 18b shows the example of detection results; the detection results are consistent with the actual defect information, with fewer missed detection and false detection.
The detection results are shown in Table 5. The improved Mask R-CNN proposed in this paper has higher detection accuracy for the images taken by the UAVs which is new and untrained, where the AP values of cracks, exposed bars, spalling, efflorescence and void are 86.3%, 95.9%, 91.2%, 92.7% and 87.1%, respectively, and the mAP value is 90.6%. It is shown that the proposed method can effectively detect the five major types of concrete defects, which is suitable for actual engineering applications.

7. Conclusions

In this paper, an improved Mask-RCNN is proposed to conduct instance segmentation for defects in concrete. The main findings are presented as follows:
(1)
The K-means clustering algorithm can improve the precision and recall rate of the Mask-RCNN network model for the target detection of multiscale concrete defects.
(2)
The improvement method proposed in this paper can reduce the number of model parameters and calculations, and improve the model calculation speed and inference speed. The improved Mask R-CNN model can more accurately locate and detect the defect, and the precision and recall rate are higher than the original model, and the missed detection and error mask operation are reduced.
(3)
Comparing the accuracy and inference time of the original Mask-RCNN model and the YOLOv5, Faster-RCNN for defect identification, the improved Mask-RCNN model has the highest overall accuracy (mAP = 92.5%) with a very small difference in inference time.
(4)
The improved Mask R-CNN proposed in this paper has higher detection accuracy for the images taken by the UAVs which is new and untrained; the overall accuracy, recall rate and mAP values reach 94.7%, 95.3%, and 90.6%, respectively, and it is suitable for actual engineering applications.

Author Contributions

Conceptualization, C.H. and Y.Z.; methodology, C.H.; resources, C.H. and Y.Z.; data curation, Y.Z. and X.X.; writing—original draft preparation, C.H.; writing—review and editing, C.H., Y.Z. and X.X. All authors have read and agreed to the published version of the manuscript.

Funding

This research was funded by National Natural Science Foundation of China, grant number 51708188.

Institutional Review Board Statement

Not applicable.

Informed Consent Statement

Not applicable.

Data Availability Statement

The raw data supporting the conclusions of this article will be made available by the authors on request.

Conflicts of Interest

The authors declare that they have no conflicts of interest to report regarding the present study.

References

  1. Rathod, H.; Gupta, R. Sub-surface Simulated Damage Detection using Non-destructive testing techniques in reinforced-concrete slabs. Constr. Build. Mater. 2019, 215, 754–764. [Google Scholar] [CrossRef]
  2. Scattarreggia, N.; Salomone, R.; Moratti, M.; Malomo, D.; Pinho, R.; Calvi, G.M. Collapse analysis of the multi-span reinforced concrete arch bridge of caprigliola, Italy. Eng. Struct. 2022, 251, 113375. [Google Scholar] [CrossRef]
  3. Salem, H.; Helmy, H. Numerical investigation of collapse of the Minnesota I-35W bridge. Eng. Struct. 2014, 59, 635–645. [Google Scholar] [CrossRef]
  4. Pinho, R.; Scattarreggia, N.; Orgnoni, A.; Lenzo, S.; Grecchi, G.; Moratti, M.; Calvi, G.M. Forensic estimation of the residual capacity and imposed demand on a ruptured concrete bridge stay at the time of collapse. Structures 2023, 55, 1595–1606. [Google Scholar] [CrossRef]
  5. Scattarreggia, N.; Malomo, D.; DeJong, M.J. A new Distinct Element meso-model for simulating the rocking-dominated seismic response of RC columns. Earthq. Eng. Struct. Dyn. 2022, 52, 828–838. [Google Scholar] [CrossRef]
  6. Malomo, D.; Pinho, R.; Penna, A. Using the applied element method for modelling calcium silicate brick masonry subjected to in-plane cyclic loading. Earthq. Eng. Struct. Dyn. 2018, 47, 1610–1630. [Google Scholar] [CrossRef]
  7. Xu, Z.; Lu, X.; Guan, H.; Lu, X.; Ren, A. Progressive-Collapse Simulation and Critical Region Identification of a Stone Arch Bridge. J. Perform. Constr. Facil. 2013, 27, 43–52. [Google Scholar] [CrossRef]
  8. Peng, X.; Zhong, X.; Zhao, C.; Chen, A.; Zhang, T. A UAV-based machine vision method for bridge crack recognition and width quantification through hybrid feature learning. Constr. Build. Mater. 2021, 299, 123896. [Google Scholar] [CrossRef]
  9. Wang, H.-F.; Zhai, L.; Huang, H.; Guan, L.-M.; Mu, K.-N.; Wang, G.-P. Measurement for cracks at the bottom of bridges based on tethered creeping unmanned aerial vehicle. Autom. Constr. 2020, 119, 103330. [Google Scholar] [CrossRef]
  10. Dorafshan, S.; Thomas, R.J.; Maguire, M. Comparison of deep convolutional neural networks and edge detectors for image-based crack detection in concrete. Constr. Build. Mater. 2018, 186, 1031–1045. [Google Scholar] [CrossRef]
  11. Kheradmandi, N.; Mehranfar, V. A critical review and comparative study on image segmentation-based techniques for pavement crack detection. Constr. Build. Mater. 2022, 321, 126162. [Google Scholar] [CrossRef]
  12. Zhong, B.; Wu, H.; Ding, L.; Love, P.E.D.; Li, H.; Luo, H.; Jiao, L. Mapping Computer Vision Research in Construction: Developments, Knowledge Gaps and Implications for Research. Autom. Constr. 2019, 107, 102919. [Google Scholar] [CrossRef]
  13. Wang, K.; Chen, K.; Du, H.; Liu, S.; Xu, J.; Zhao, J.; Chen, H.; Liu, Y.; Liu, Y. New image dataset and new negative sample judgment method for crop pest recognition based on deep learning models. Ecol. Inform. 2022, 69, 101620. [Google Scholar] [CrossRef]
  14. Yang, L.; Li, Z.; Ma, S.; Yang, X. Artificial intelligence image recognition based on 5G deep learning edge algorithm of Digestive endoscopy on medical construction. Alex. Eng. J. 2021, 61, 1852–1863. [Google Scholar] [CrossRef]
  15. Fujiyoshi, H.; Hirakawa, T.; Yamashita, T. Deep learning-based image recognition for autonomous driving. IATSS Res. 2019, 43, 244–252. [Google Scholar] [CrossRef]
  16. Ak, A.; Topuz, V.; Midi, I. Motor imagery EEG signal classification using image processing technique over GoogLeNet deep learning algorithm for controlling the robot manipulator. Biomed. Signal Process. Control 2021, 72, 103295. [Google Scholar] [CrossRef]
  17. Aggarwal, A.; Toshniwal, D. A hybrid deep learning framework for urban air quality forecasting. J. Clean. Prod. 2021, 329, 129660. [Google Scholar] [CrossRef]
  18. Ye, W.; Deng, S.; Ren, J.; Xu, X.; Zhang, K.; Du, W. Deep learning-based fast detection of apparent concrete crack in slab tracks with dilated convolution. Constr. Build. Mater. 2022, 329, 127157. [Google Scholar] [CrossRef]
  19. Zhou, Z.; Zhang, J.; Gong, C. Automatic detection method of tunnel lining multi-defects via an enhanced You Only Look Once network. Comput. Civ. Infrastruct. Eng. 2022, 37, 762–780. [Google Scholar] [CrossRef]
  20. Jang, K.; An, Y.; Kim, B.; Cho, S. Automated crack evaluation of a high-rise bridge pier using a ring-type climbing robot. Comput. Civ. Infrastruct. Eng. 2020, 36, 14–29. [Google Scholar] [CrossRef]
  21. Ali, R.; Kang, D.; Suh, G.; Cha, Y.-J. Real-time multiple damage mapping using autonomous UAV and deep faster region-based neural networks for GPS-denied structures. Autom. Constr. 2021, 130, 103831. [Google Scholar] [CrossRef]
  22. Kang, D.; Benipal, S.S.; Gopal, D.L.; Cha, Y.-J. Hybrid pixel-level concrete crack segmentation and quantification across complex backgrounds using deep learning. Autom. Constr. 2020, 118, 103291. [Google Scholar] [CrossRef]
  23. Deng, J.; Lu, Y.; Lee, C.S. Imaging-based crack detection on concrete surfaces using You Only Look Once network. Struct. Health Monit. 2020, 20, 484–499. [Google Scholar] [CrossRef]
  24. Park, S.E.; Eem, S.-H.; Jeon, H. Concrete crack detection and quantification using deep learning and structured light. Constr. Build. Mater. 2020, 252, 119096. [Google Scholar] [CrossRef]
  25. Jiang, Y.; Pang, D.; Li, C. A deep learning approach for fast detection and classification of concrete damage—ScienceDirect. Autom. Constr. 2021, 128, 103785. [Google Scholar] [CrossRef]
  26. Liu, Z.; Cao, Y.; Wang, Y.; Wang, W. Computer vision-based concrete crack detection using U-net fully convolutional networks. Autom. Constr. 2019, 104, 129–139. [Google Scholar] [CrossRef]
  27. Wei, F.; Yao, G.; Yang, Y.; Sun, Y. Instance-level recognition and quantification for concrete surface bughole based on deep learning. Autom. Constr. 2019, 107, 102920. [Google Scholar] [CrossRef]
  28. Joshi, D.; Singh, T.P.; Sharma, G. Automatic surface crack detection using segmentation-based deep-learning approach. Eng. Fract. Mech. 2022, 268, 108467. [Google Scholar] [CrossRef]
  29. Kim, B.; Cho, S. Image-based concrete crack assessment using mask and region-based convolutional neural network. Struct. Control. Health Monit. 2019, 26, e2381. [Google Scholar] [CrossRef]
  30. Xu, Y.; Li, D.; Xie, Q.; Wu, Q.; Wang, J. Automatic defect detection and segmentation of tunnel surface using modified Mask R-CNN. Measurement 2021, 178, 109316. [Google Scholar] [CrossRef]
  31. Chen, X.; Fang, H.; Lin, T.Y.; Vedantam, R.; Gupta, S.; Dollár, P. Microsoft COCO Captions: Data Collection and Evaluation Server. arXiv 2015, arXiv:1504.00325. [Google Scholar] [CrossRef]
  32. Mundt, M.; Majumder, S.; Murali, S.; Panetsos, P.; Ramesh, V. Meta-learning Convolutional Neural Architectures for Multi-target Concrete Defect Classification with the COncrete DEfect BRidge IMage Dataset. In Proceedings of the IEEE/CVF Conference on Computer Vision and Pattern Recognition, Long Beach, CA, USA, 15–20 June 2019; pp. 11188–11197. [Google Scholar]
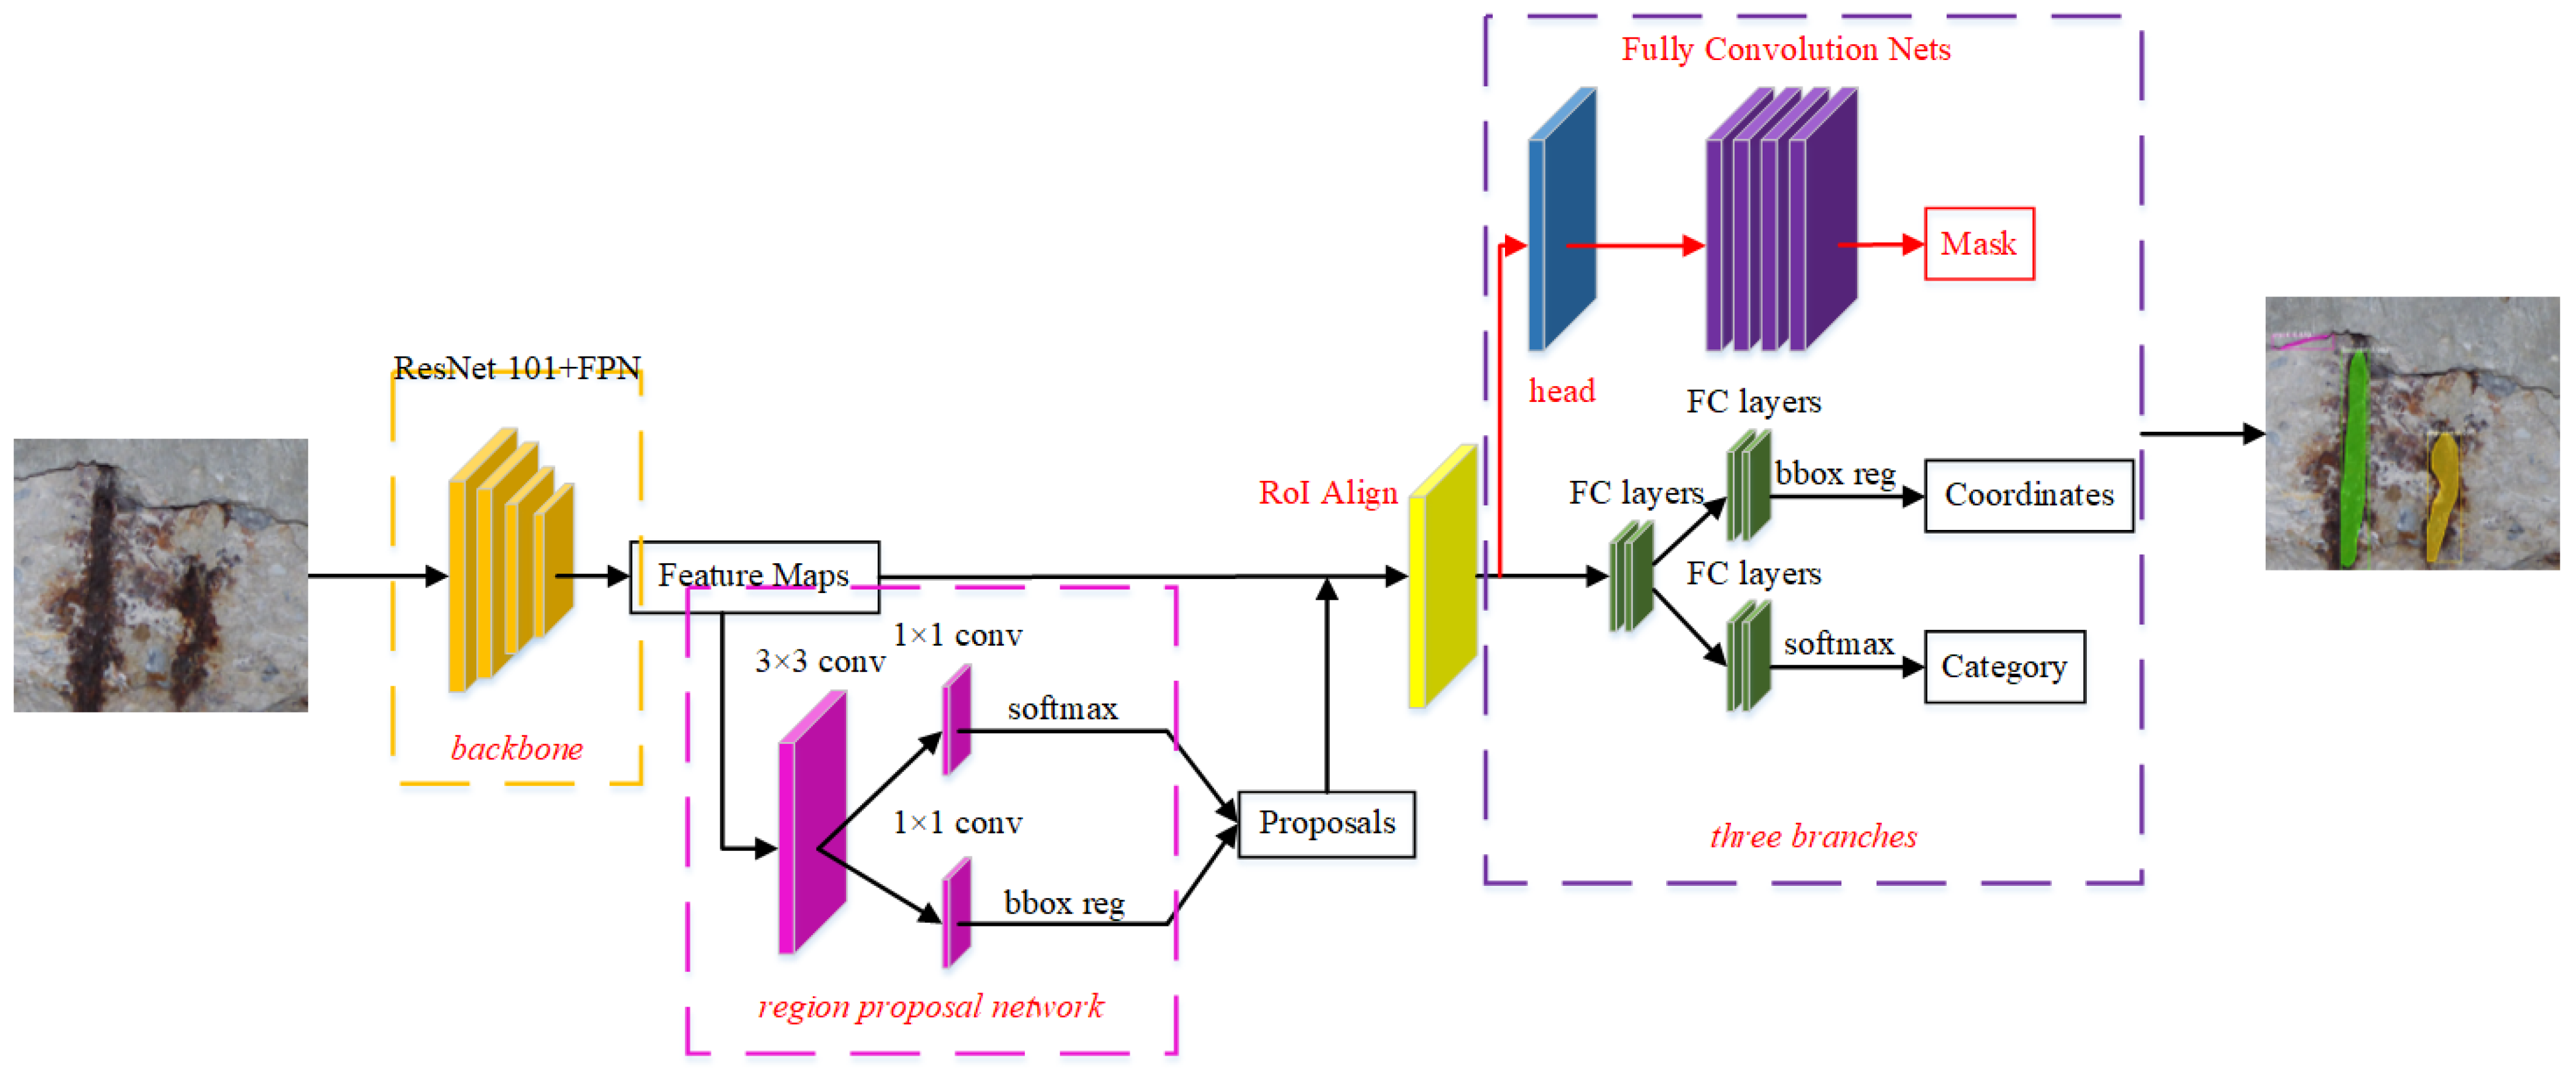
Figure 1. Mask R-CNN model structure.
Applsci 14 04148 g001
Figure 2. FPN structure and flow chart.
Applsci 14 04148 g002
Figure 3. The standard convolution structure.
Applsci 14 04148 g003
Figure 4. The depthwise separable convolution structure.
Applsci 14 04148 g004
Figure 5. The residual block.
Applsci 14 04148 g005
Figure 6. The inverted residual block.
Applsci 14 04148 g006
Figure 7. The structure of CA attention module.
Applsci 14 04148 g007
Figure 8. Improved FPN structure.
Applsci 14 04148 g008
Figure 9. Example of labeled images.
Applsci 14 04148 g009
Figure 10. Example of a partial data augmentation.
Applsci 14 04148 g010
Figure 11. K-means visual clustering graph.
Applsci 14 04148 g011aApplsci 14 04148 g011b
Figure 12. Calculation method of the IoU of an anchor box.
Applsci 14 04148 g012
Figure 13. Target detection visualization results.
Applsci 14 04148 g013
Figure 14. Semantic segmentation visualization results.
Applsci 14 04148 g014aApplsci 14 04148 g014b
Figure 15. Example of the visualization results.
Applsci 14 04148 g015
Figure 16. The concrete defect intelligent identification system flow diagram.
Applsci 14 04148 g016
Figure 17. The concrete defect intelligent identification system identification result.
Applsci 14 04148 g017
Figure 18. Example of detection results for the image taken by the UAVs.
Applsci 14 04148 g018
Table 1. Detection results of original aspect ratios and improved aspect ratios.
Evaluation IndicatorDefect TypeTotal
CrackExposed BarsSpallingEfflorescenceVoid
OriginalK-MeansOriginalK-MeansOriginalK-MeansOriginalK-MeansOriginalK-MeansOriginalK-Means
TP18518925325420720525926221521411191124
FP16151091210151317147061
FN25218746201722237974
Precision/%92.092.696.296.694.595.394.595.392.793.994.194.8
recall rate/%88.190.097.097.398.197.292.893.990.790.393.493.8
AP/%81.183.393.394.092.792.687.789.585.984.888.188.8
Table 2. Detection results of original Mask-RCNN and improved Mask-RCNN.
Evaluation IndicatorDefect TypeTotal
CrackExposed BarsSpallingEfflorescenceVoid
ImprovedK-MeansImprovedK-MeansImprovedK-MeansImprovedK-MeansImprovedK-MeansImprovedK-Means
TP19618925925421120526426222321411531124
FP141579810111312145261
FN12215736151715235074
Precision/%93.392.697.396.696.395.396.095.394.993.995.694.8
recall rate/%94.290.098.197.398.697.294.693.993.690.395.893.8
AP/%88.483.397.094.095.892.692.089.589.684.892.588.8
Table 3. Detection results of different target detection models.
MethodCrack
AP/%
Exposed Bars AP/%Spalling AP/%Efflorescence AP/%Void AP/%mAP/%Inference Time/s
Faster-RCNN76.093.388.389.784.886.40.752
YOLOv571.582.885.485.474.279.90.274
Mask-RCNN81.193.392.787.785.988.10.871
Mask-RCNN + K-means83.394.092.689.584.888.80.870
Mask-RCNN+*87.596.294.590.688.491.40.504
Improved Mask-RCNN88.497.095.892.089.692.50.525
Note: Mask-RCNN+* is for Mask-RCNN + PANet + Improved FPN + K-means.
Table 4. Detection results of different target detection models on open dataset.
MethodCrack
AP/%
Exposed Bars AP/%Spalling AP/%Efflorescence AP/%mAP/%Inference Time/s
Faster-RCNN80.294.683.991.285.00.692
YOLOv573.884.781.385.381.30.135
Mask-RCNN83.097.597.696.193.60.811
Mask-RCNN + K-means85.197.397.696.294.10.815
Mask-RCNN+*87.998.697.797.395.40.423
Improved Mask-RCNN88.198.997.897.695.60.467
Note: Mask-RCNN+* is for Mask-RCNN + PANet + Improved FPN + K-means.
Table 5. UAVs defect identification results.
Evaluation IndicatorDefect TypeTotal
CrackExposed BarsSpallingEfflorescenceViod
TP5373552748256
FP4221413
FN3131311
Precision/%92.997.396.496.492.394.7
recall rate/%94.698.694.896.494.1 95.3
AP/%86.395.991.292.787.1
Disclaimer/Publisher’s Note: The statements, opinions and data contained in all publications are solely those of the individual author(s) and contributor(s) and not of MDPI and/or the editor(s). MDPI and/or the editor(s) disclaim responsibility for any injury to people or property resulting from any ideas, methods, instructions or products referred to in the content.