Abstract
In circumstances influenced by freeze–thaw cycles, the strength of rock diminishes, necessitating an in-depth investigation into its corresponding anchoring support schemes. This study conducted experiments on rocks with and without fractures at angles of 0°, 45°, and 90° subjected to freeze–thaw cycles of 0, 10, 20, and 30 iterations. It explored the effects of fracture inclination, anchoring conditions, and freeze–thaw cycles on the mechanical properties of rock. The primary findings from the experiments are as follows: (1) fracture inclination significantly impacts rock strength, with the most pronounced deterioration observed in samples with a 45° fracture, exhibiting strengths and elastic moduli at 28.4% and 73.4%, respectively, of those of fracture-free samples; (2) anchoring effectively controls deformation but concurrently induces stress concentrations, resulting in Y-shaped crack formation around the anchoring rod; (3) the degree of strength reduction due to freeze–thaw cycles is angle-dependent, with fracture-free and 90° fracture samples exhibiting diminished strength post freezing, while the 45° fracture samples’ strength remains largely unchanged. Additionally, this study employed a numerical model, coupling a discrete element method (DEM) with a finite difference method (FDM), to simulate experimental conditions, yielding conclusions consistent with experimental outcomes, and notably revealing a prevalence of tensile cracks over shear cracks within samples under uniaxial compression.
1. Introduction
In the realm of natural rock formations, a diverse array of fractures exists, profoundly impacting the rock’s strength and various other properties. The numerous fractures concealed within rock structures remain elusive and uncertain, thereby exacerbating the inherent instability of their strength and escalating the risks associated with geotechnical engineering endeavours. In the domain of practical engineering, anchor reinforcement frequently serves as a pivotal method used to bolster fractured rock formations, enhancing their resistance to deformation. Moreover, within permafrost zones situated at elevated altitudes, such as the Qinghai–Tibet Plateau in China, the indigenous dry and cold climate induces recurrent cycles of freezing and thawing within the rock matrix, resulting in long-term structural damage. Hence, the investigation of fractured rocks characterized by a low water content in alpine regions assumes significant practical importance [1,2,3,4,5,6].
In the realm of laboratory experimentation, a multitude of studies have been conducted, focusing on elucidating the effects of fractures of varying lengths, angles, and geometries on the performance of rock both with and without anchorage. Cao et al. [7] discerned a significant impact of fracture inclination angle on the damage load of specimens, with the load increasing from 0° to 60° and subsequently decreasing from 60° to 90°. Morgan et al. [8] executed uniaxial compression tests on granitic specimens featuring pre-existing flaw pairs characterized by diverse inclination angles, bridging angles, and ligament lengths, aiming to investigate the development of fractures and the aggregation behaviour of granites. Moreover, the researchers conducted theoretical analyses to elucidate the damage patterns within the rock. Sarfarazi et al. [9] conducted numerical simulations on rocks containing trapezoidal joints, revealing that the damage pattern in such jointed rocks was predominantly influenced by joint overlap. Mohammadi et al. [10] utilised the finite element method to analyse the damage process in rocks harbouring prefabricated fractures, facilitating the prediction of the emergence and propagation of new cracks in prefabricated fractured rocks. Wu et al. [11] established a “rock-coal-bolt” (RCB) composite system and scrutinised the action mechanism of anchors under tensile and shear stresses. Meanwhile, Li et al. [12] developed a damage model for fractured rocks subjected to cyclic loading from the perspective of energy dissipation and analysed the evolution patterns of the elastic modulus and residual strain in fractured rocks.
In the domain of freeze–thaw cycling, extensive experimental and numerical investigations have been conducted to probe the ramifications of such cycles on the toughness, fracture mechanisms, and fatigue deterioration of rocks. Abdolghanizadeh et al. [3] investigated the impact of temperature fluctuations, exposing specimens to 0, 5, 10, 20, and 30 freeze–thaw cycles, and noted a non-linear decline in both the type I and type II fracture toughness of sandstones with the increasing cycle count. Yahaghi et al. [13] conducted a detailed examination of the mechanical properties of sandstone subjected to 20 to 40 and 40 to 60 freeze–thaw cycles, observing changes in damage morphology and a reduction in both Brazilian tensile strength and uniaxial compressive strength. As the number of freeze–thaw cycles increased, the primary failure mode of the sandstone transitioned from axial splitting to shearing along a single plane in the UCS tests, and from central smooth fractures to central zigzag fractures in the BTS tests. Niu et al. [14] observed that freeze–thaw cycles induce notable localized fatigue damage around the crack tips in sandstone specimens. The number of FT cycles they considered was 0, 15, 30, 45, 60, and 75, respectively. They observed that the peak strain of flawed sandstone specimens increased with an increase in the number of cycles. Liu et al. [15] conducted uniaxial compressive strength and P-wave velocity tests on incompletely saturated freeze–thawed rocks, establishing a critical saturation threshold of 60%, beyond which freeze–thaw damage escalates sharply. Macro-cracks were found to form inside clay minerals and propagate onto the surfaces of fully saturated specimens, while dried red sandstone remained intact without obvious defects after 50 freeze–thaw cycles. Vlahou et al. [16] advanced a mathematical model to elucidate the damage and fracture processes in water-saturated porous fractured rocks under freeze–thaw conditions, probing the interplay between the fracture propagation rate, permeability, and elasticity of the rock matrix. Chen et al. [17] explored the compression characteristics and damage modalities of saturated sandstone across various fracture dips and freeze–thaw cycles (0, 20, 40, and 60)), revealing a significant impact on the damage mode solely at a 5° inclination. The fracture mode of sandstone was found to be dependent on the inclination angle. Zhang et al. [18] harnessed Mindlin’s displacement solution and introduced a freeze–thaw cycling factor to predict the performance of fully bonded rock anchors subjected to a number of cycles from 0 to 75. Yuan et al. [19] conducted experimental and numerical simulations on rocks reinforced with grouted anchors under 30 freeze–thaw conditions, resulting in the development of a degradation model for anchorage limits. Their findings indicated that shearing failure was caused by a decrease in the strength and stiffness of the cement mortar, resulting in a loss of bonding ability.
Numerous scholars have undertaken research concerning anchored fractured rock; however, the overall research in this domain remains incomplete [20,21,22]. For instance, in the realm of rock fractures, extant studies have addressed various forms of fractures, encompassing diverse lengths and angles. Nevertheless, there remains a deficiency in simulating the morphology of fractures within rock masses pertinent to practical engineering applications. Existing investigations predominantly focus on the weakening effects of freeze–thaw cycles on rock properties under unanchored conditions, neglecting a thorough examination of anchored fractured rock formations. However, under freeze–thaw conditions, the anchoring support of fractured rock masses becomes profoundly significant. Against this backdrop, this study primarily delves into the uniaxial compressive performance of anchored rock with embedded fractures under freeze–thaw cycling. It aims to elucidate the comprehensive effects of embedded fractures, anchorage conditions, and freeze–thaw actions on rock support, complemented by the establishment and analysis of numerical models. The findings of this research hold substantial significance in elucidating the support mechanisms of rock masses with embedded fractures under freeze–thaw conditions.
2. Experimental Introduction
2.1. Specimens
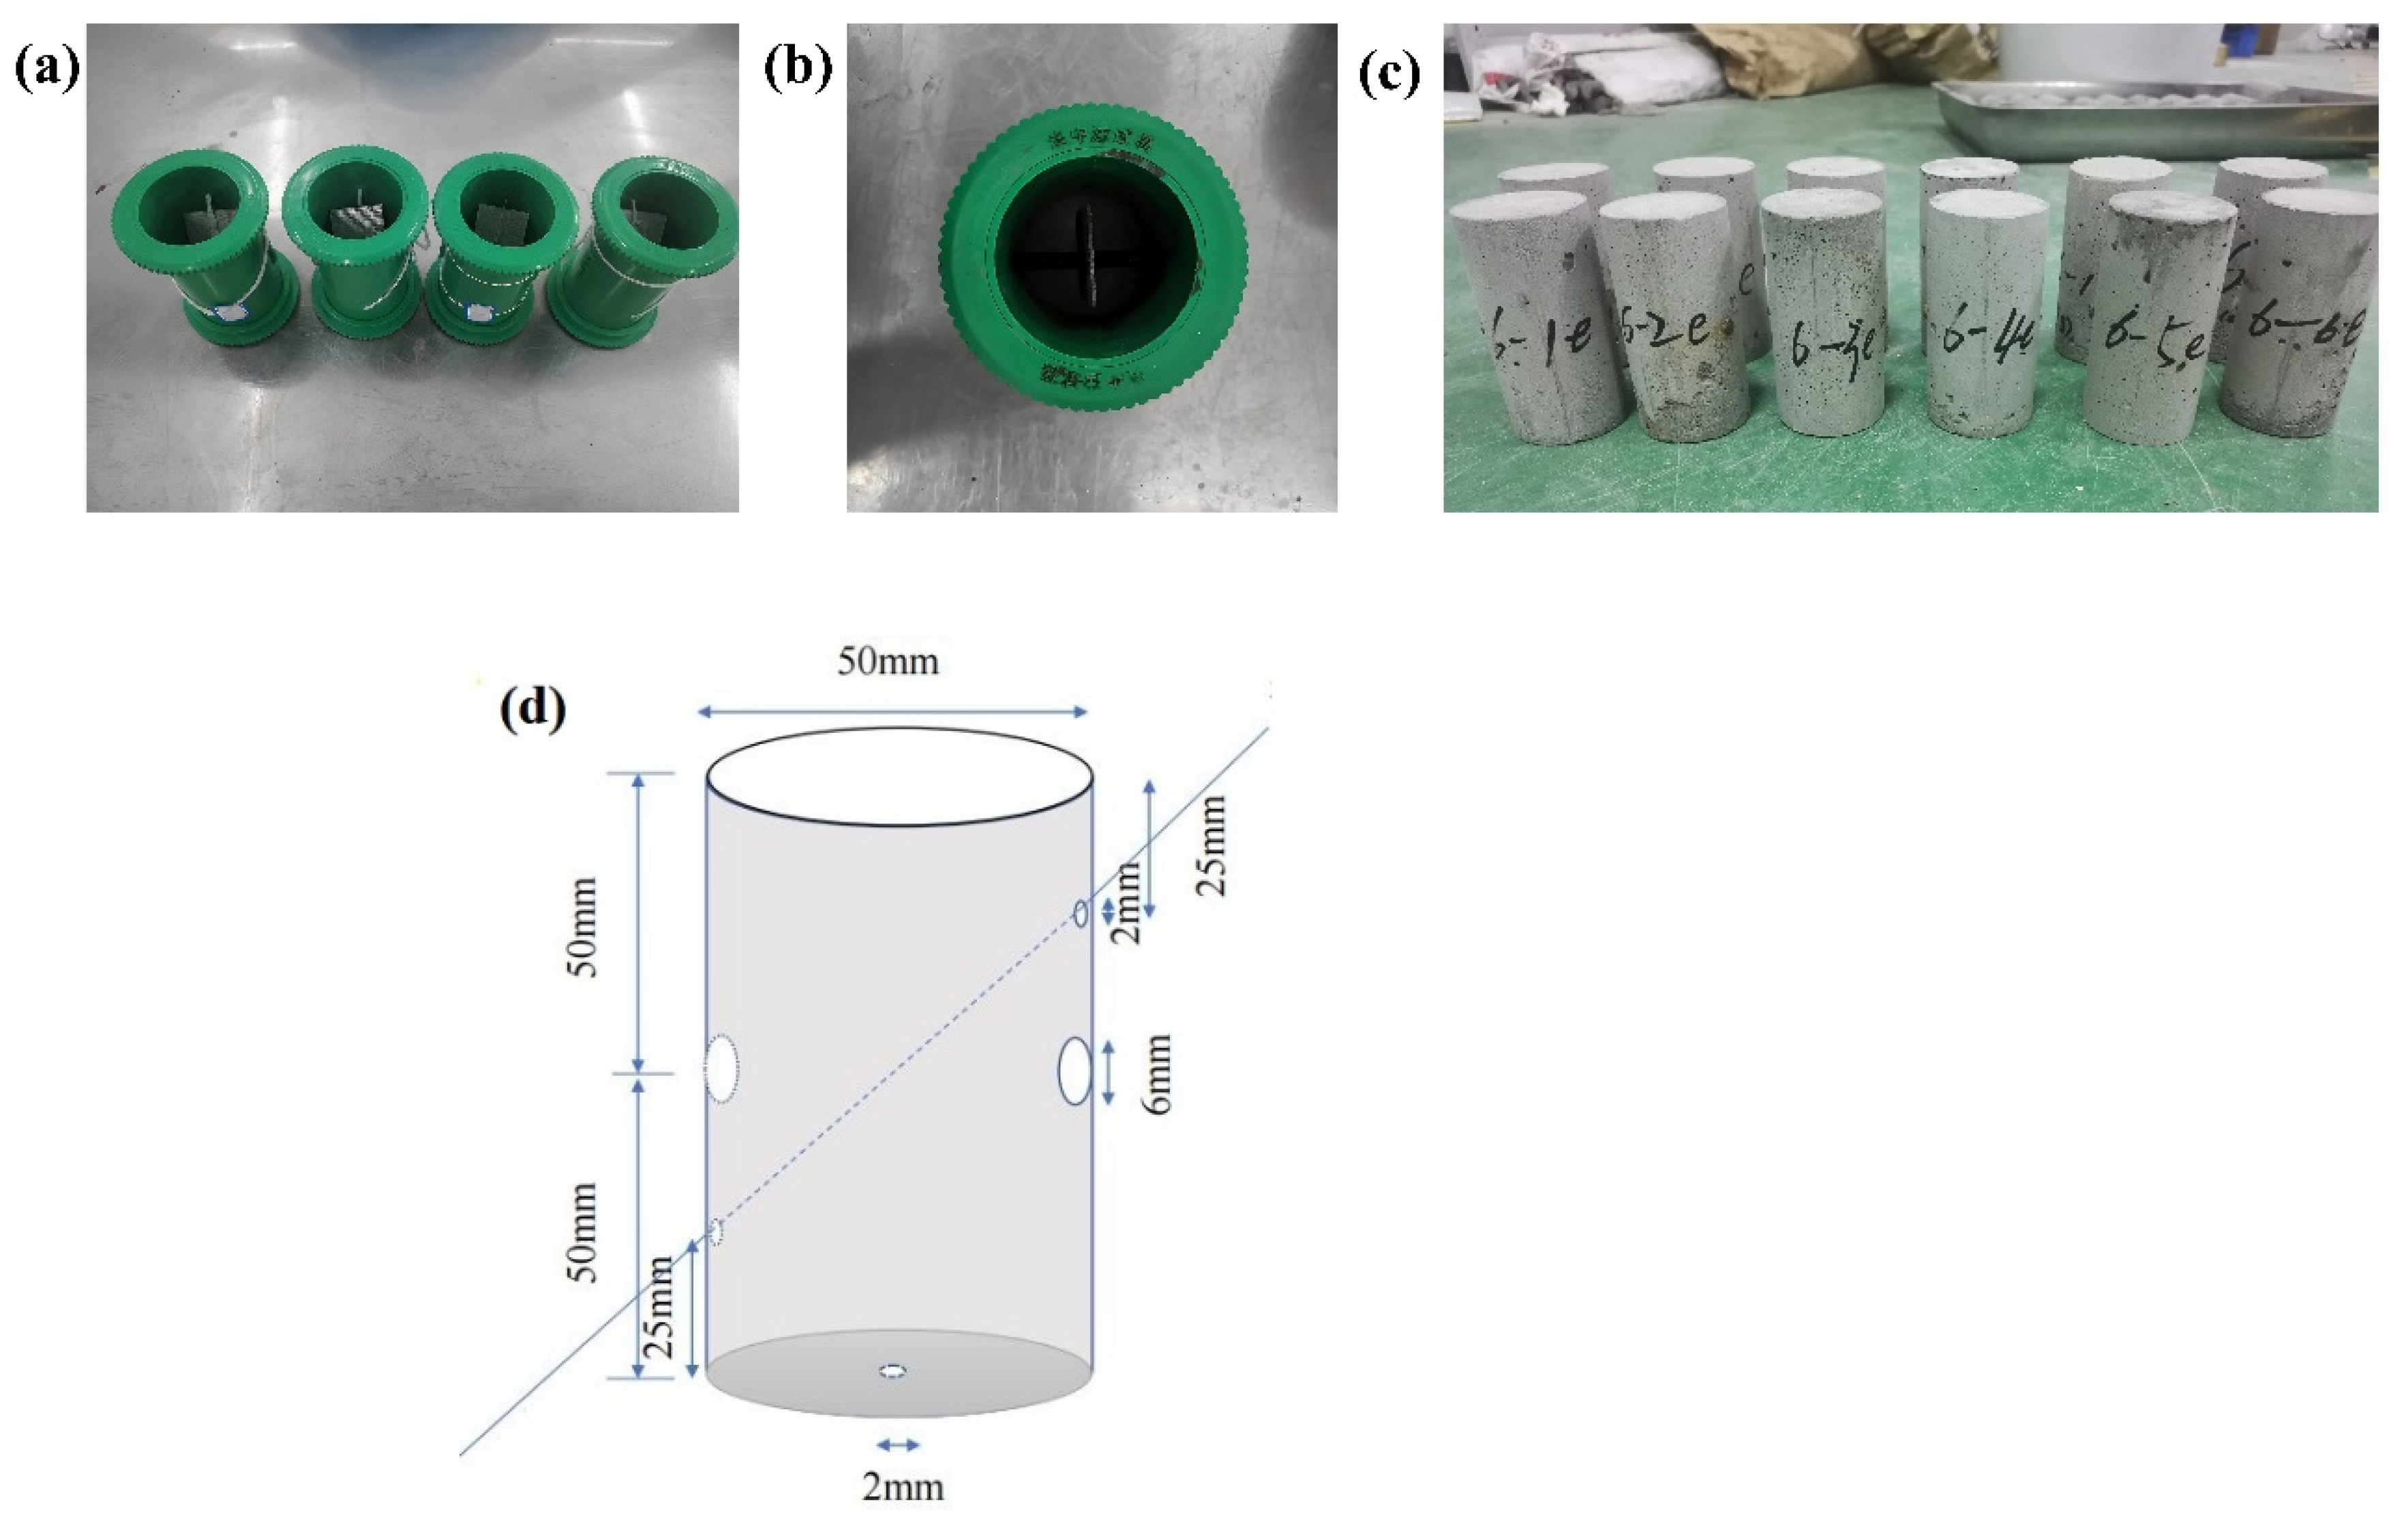
This experiment involved the preparation of cylindrical rock specimens with dimensions of Φ50 mm × 100 mm using cement mortar. The mass ratio of the ingredients for the specimens was cement–nano SiO2–water–high-efficiency water reducer–standard sand = 50:1:13:2.5:40. Considering that the strength of mica sheets is significantly lower than that of these specimens, mica sheets with dimensions of 50 mm × 30 mm × 1 mm were employed to simulate inherent fractures. These sheets were fixed in place and oriented using fine cotton threads. In order to simulate anchor rods, threaded steel bars with a diameter of 6 mm and a length of 50 mm were utilised. Suitable moulds were prepared through drilling to facilitate the placement of mica sheets and anchor rods, as illustrated in Figure 1a–c for the moulds and specimens, respectively. Figure 1d shows the schematic diagram of a 45° inclination fracture. Following the completion of specimen fabrication, they were placed in a concrete curing chamber for 28 days. Freeze–thaw cycles were induced using the natural water immersion method, with the specimens fully submerged in water for 48 h [23]. During the freeze–thaw process, specimens were promptly removed from immersion to minimize water loss.
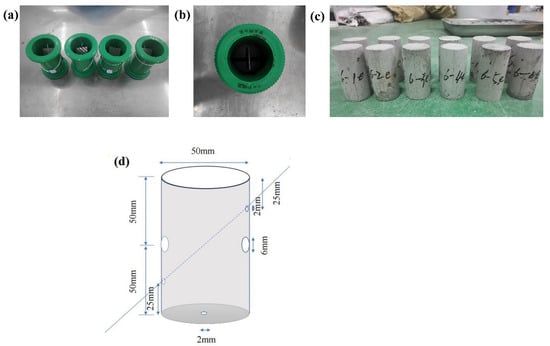
Figure 1.
Specimen preparation: (a) mould for 45° fracture specimens, (b) mould for 90° fracture specimens with rock bolt, (c) specimens after curing, (d) the schematic diagram of 45° inclination fracture.
2.2. Experimental Design
This experiment includes three variables: anchor rods, inherent fractures, and freeze–thaw cycles, with three specimens tested for each condition, resulting in a total of 72 specimens, as illustrated in Table 1. The experiment includes three forms of fractures, no fracture, 45° fracture, and 90° fracture, as well as two configurations of anchor rod placement: no anchor rod and horizontal anchor rod. In relation to the freeze–thaw cycle parameters of this experiment, a literature review revealed that freeze–thaw cycle counts commonly centred around 0/20/40/60. Therefore, drawing upon the experiences of previous scholars, this experiment designated its freeze–thaw cycle counts as 0, 10, 20, and 30. Regarding the duration of the freeze–thaw cycles, rock specimens typically require several hours to freeze. Consequently, this experiment was planned with a 12 h freezing followed by a 12 h thawing period to ensure thorough freeze–thaw processes. Furthermore, this specific timing was chosen with a consideration of the practical constraints faced by experimenters during nighttime operations, facilitating the occurrence of the thawing phase over half-day intervals.

Table 1.
Experiment plan.
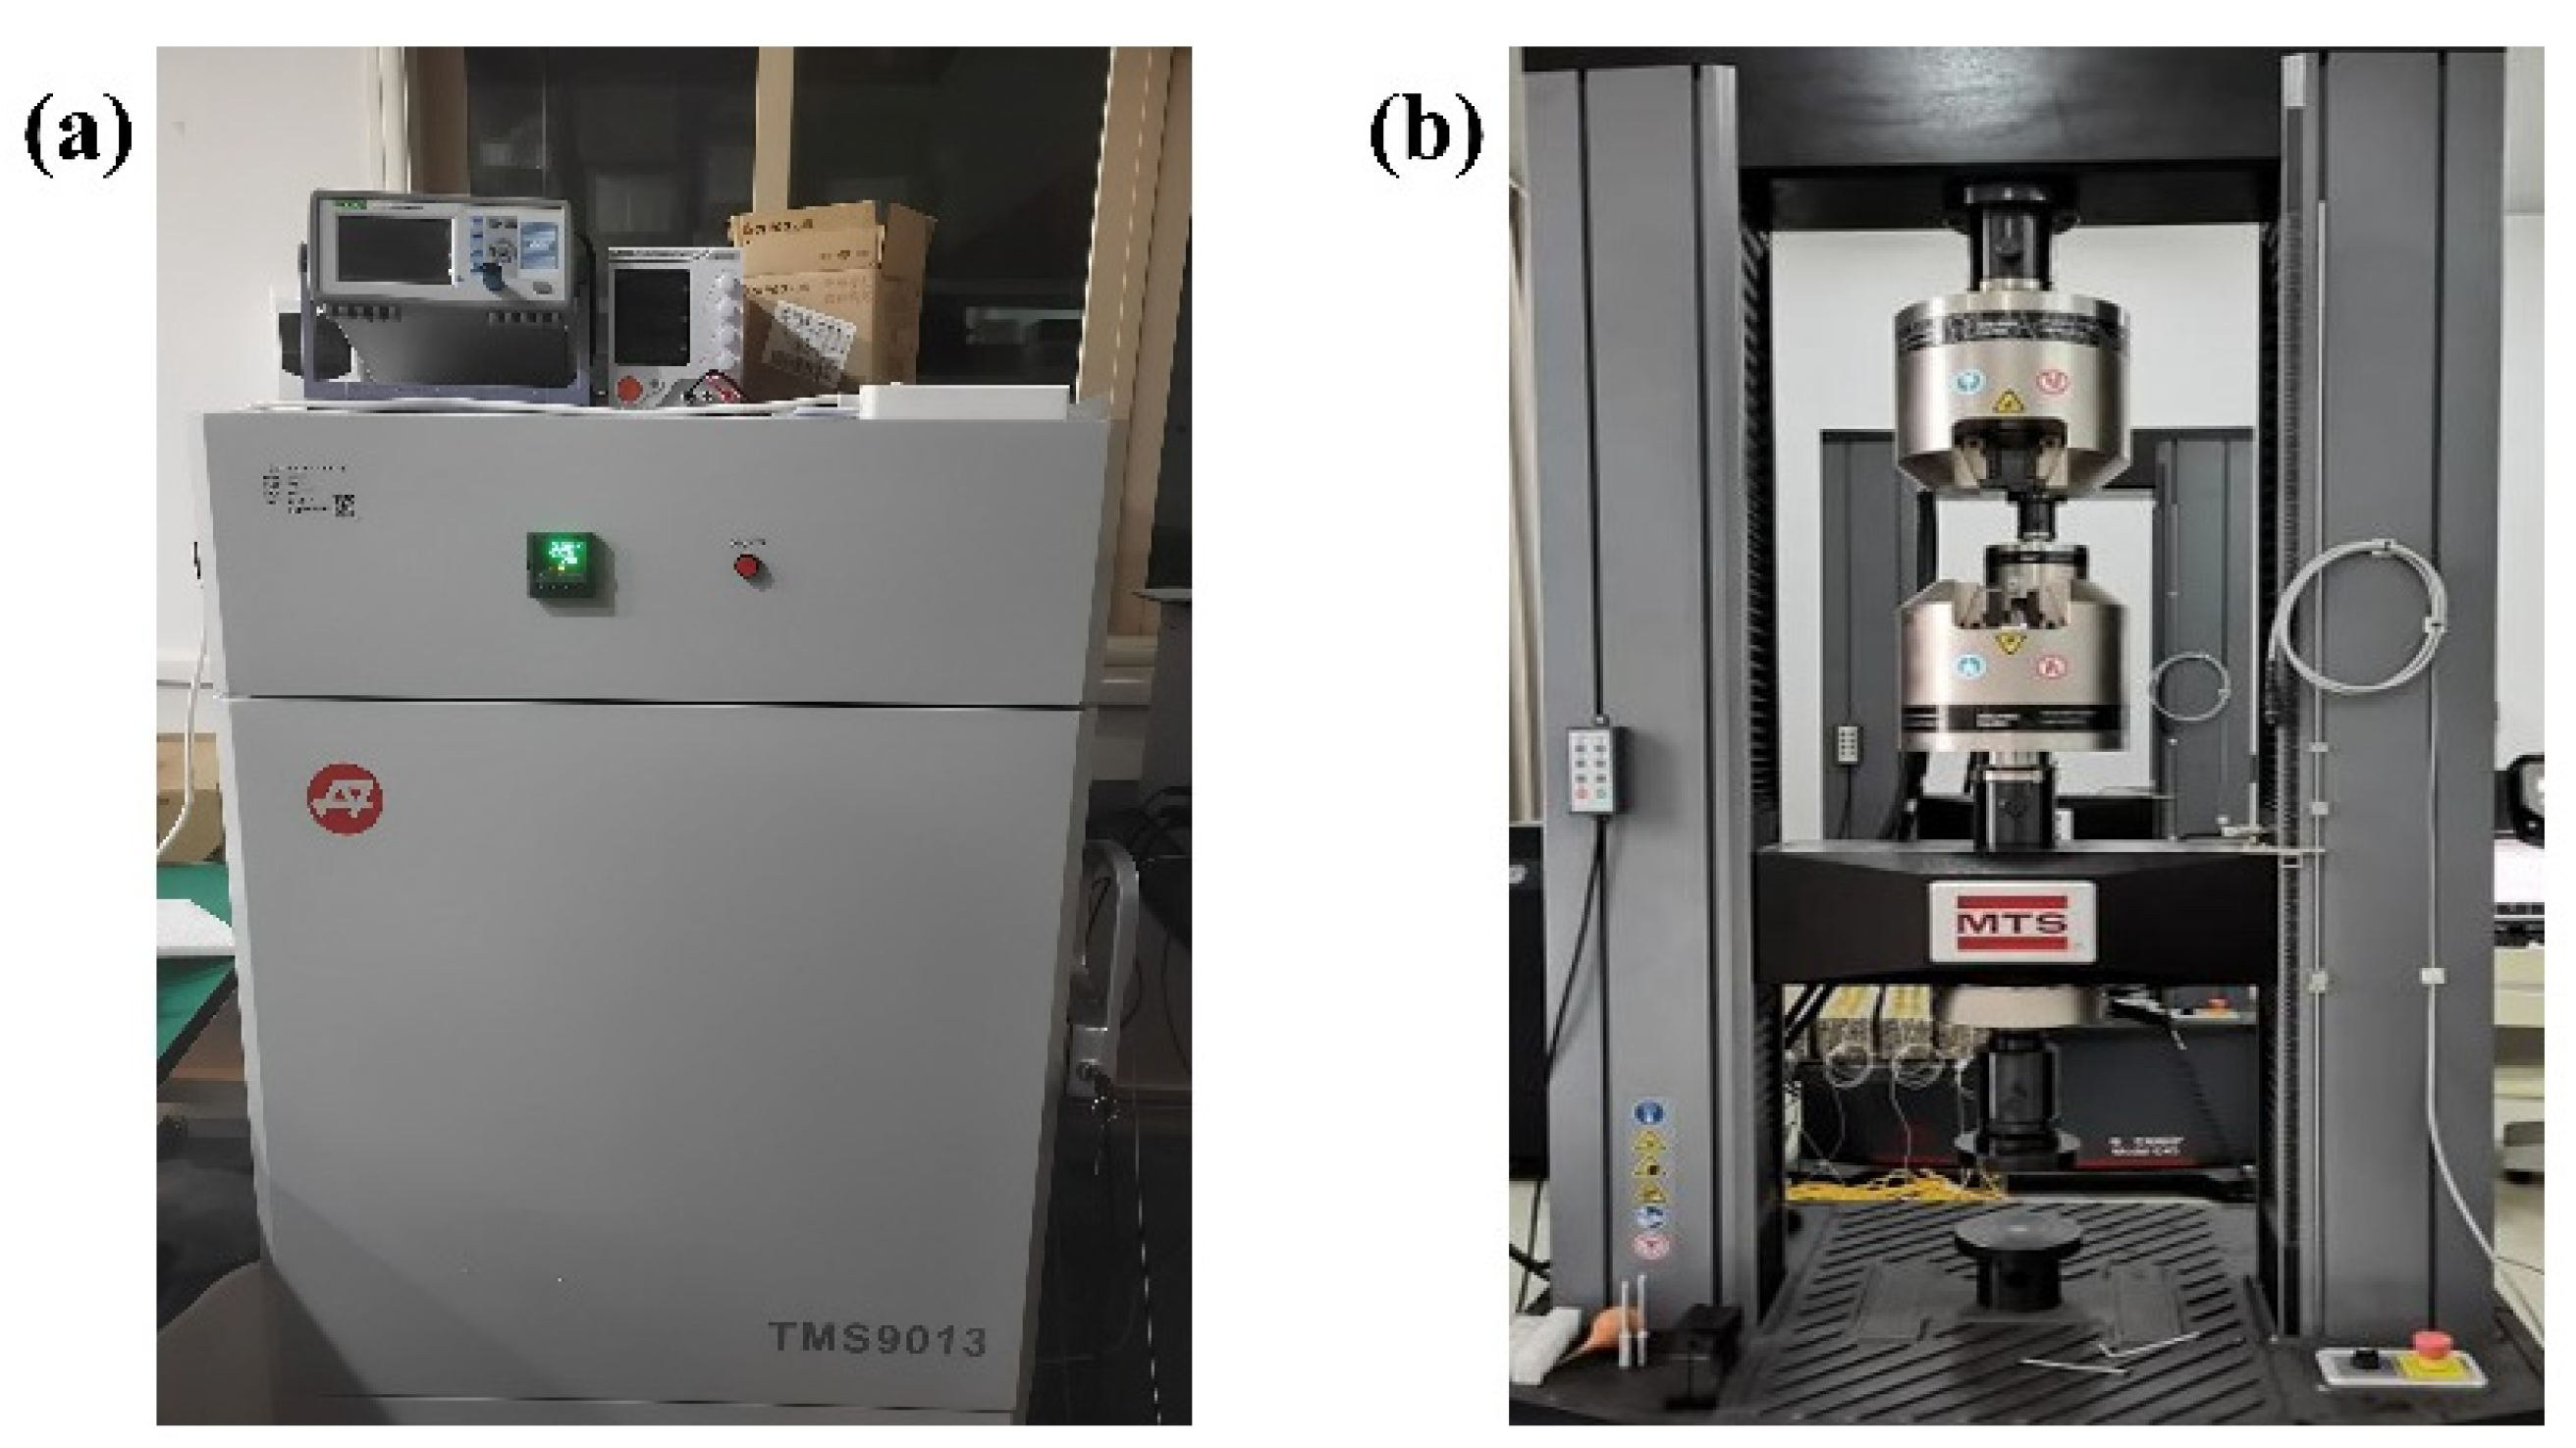
Uniaxial compression testing employs a computer-controlled electronic universal testing machine with a maximum load capacity of 300 kN and a loading rate set at 0.3 mm/min (Figure 2a). Freeze–thaw testing utilizes a furnace controlled by Hot Disk equipment, model TOMOS TMS9013, to regulate temperature (Figure 2b). The freeze–thaw cycle temperature ranges from −20 °C to 20 °C, with a set temperature stabilization time of 30 min. The testing protocol involves a freeze–thaw cycle period of 5 h, comprising 2.5 h of freezing followed by 2.5 h of thawing. The freeze–thaw cycle is set to repeat for 0, 10, 20, and 30 cycles.
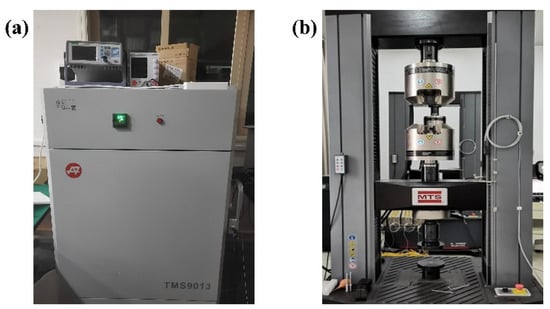
Figure 2.
Test apparatus: (a) temperature control devices, (b) electronic universal testing machine.
3. Numerical Simulation Parameters
This study employs the coupled approach of PFC3D-FLAC3D to simulate the uniaxial compression test characteristics of rock-like specimens under anchoring and fracture conditions. The geometric parameters of the model are set in proportion to the experimental setup. The discrete element method is employed to construct models for rock-like materials, with the main material adopting a parallel bonded constitutive model and prefabricated fractures utilising a smooth joint constitutive model. The linear parallel bond model, as an application of a linear model, is suitable for contact situations such as ball–ball and ball–facet interactions. This model includes the finite mechanical behaviour between contacts and can simulate the mechanical properties of various materials like cementitious materials. The existence of parallel bonding does not inhibit sliding between contact surfaces. Additionally, parallel bonding functions to transmit forces and moments, effectively connecting and influencing the interactions between two contacting bodies. The material calibration parameters for various components of the numerical simulation are defined as follows in Table 2, Table 3 and Table 4.

Table 2.
Parameters of sandstone-like materials.

Table 3.
Prefabricated structural surface parameters.

Table 4.
Mechanical parameters.
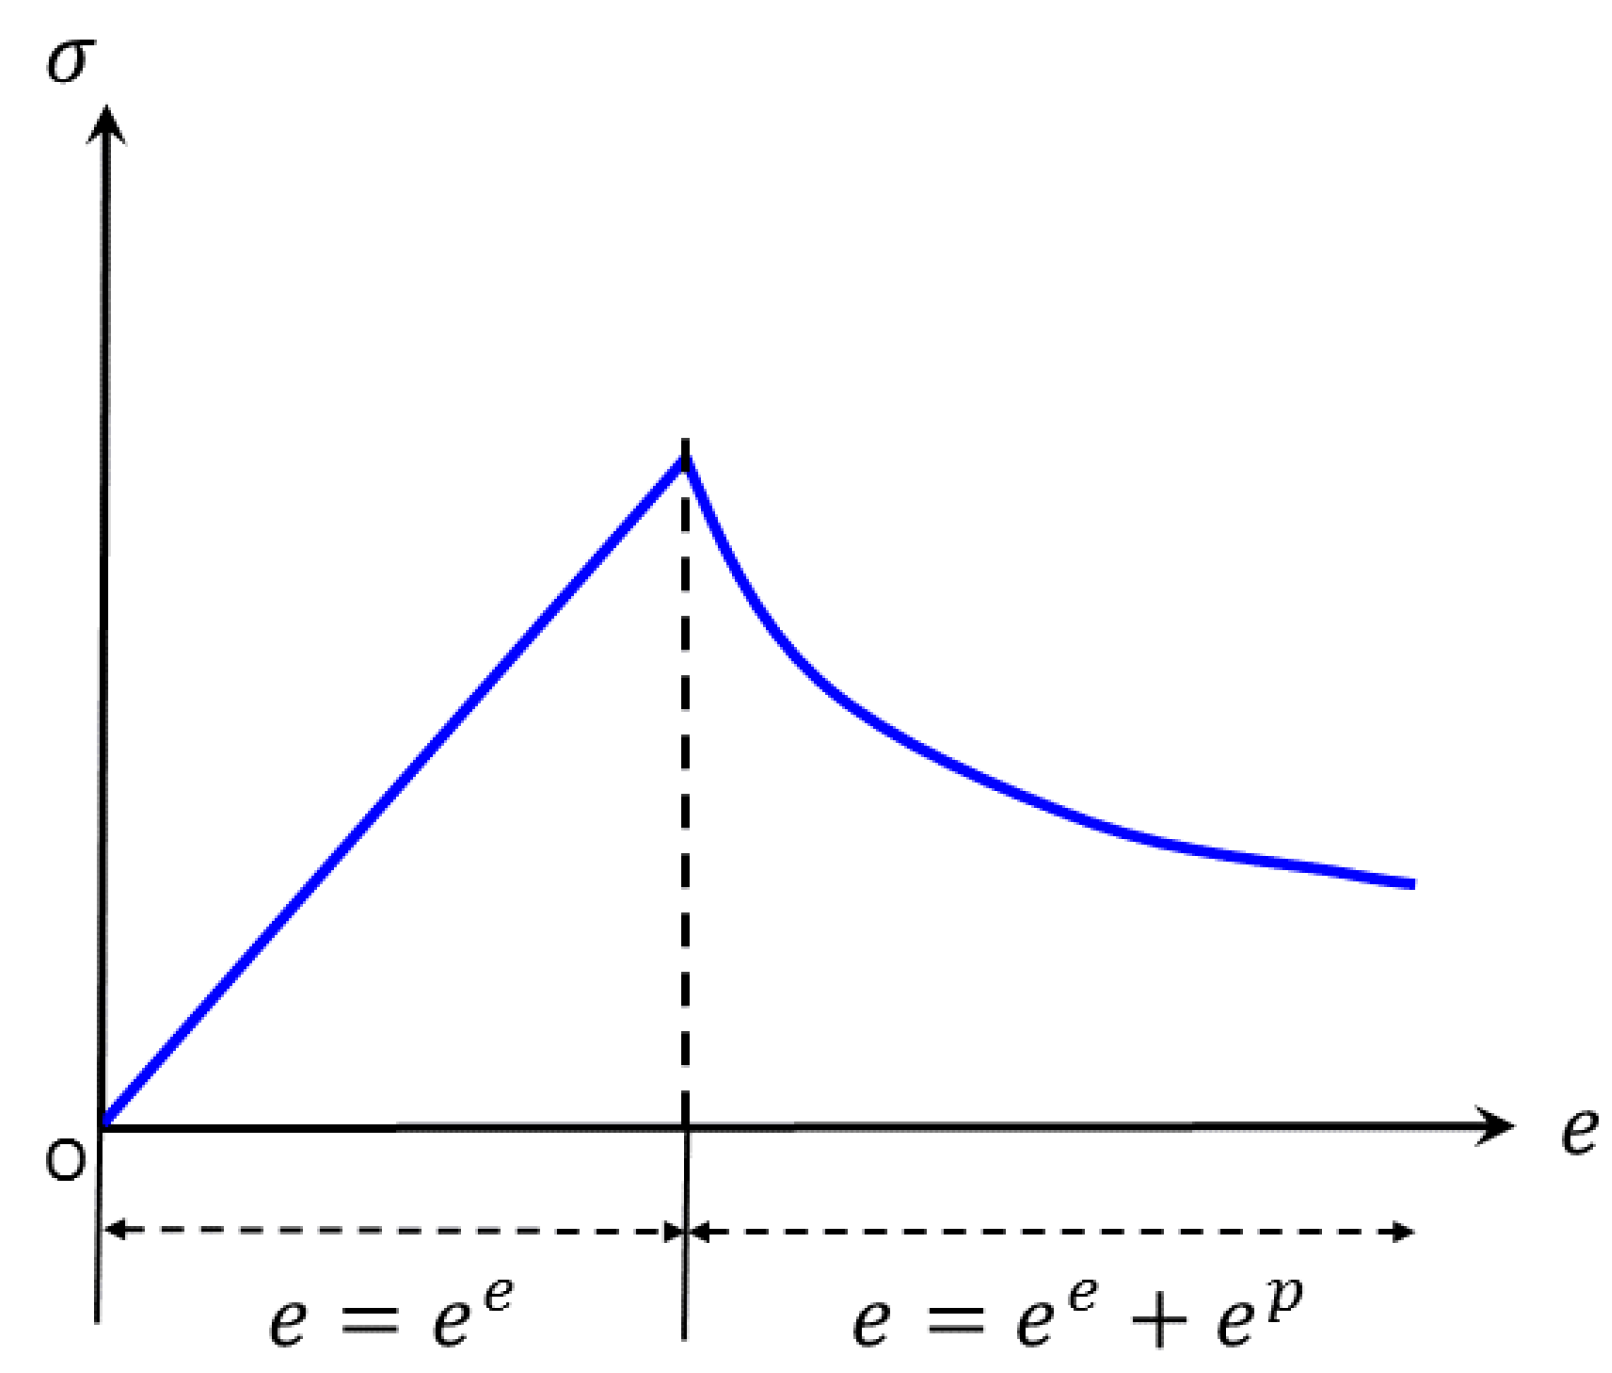
Currently, there is no dedicated constitutive model for metallic materials in FLAC. To describe this process more accurately, this section adopts a strain softening/hardening model to simulate the behaviour of anchors under tension. This model is based on the Mohr–Coulomb model and is characterised by strain softening or hardening behaviour after yielding, as shown in Figure 3. After plastic yield, cohesion, frictional resistance, and tensile strength undergo softening or hardening phases. This hardening and softening behaviour can be flexibly controlled using piecewise linear functions based on plastic strain. By defining the yield point and parameters of the post-yield hardening phase of anchor materials, a simplified anchor model has been constructed to better simulate its mechanical performance in practical engineering applications. The specific parameters for the anchor are detailed in Table 5.
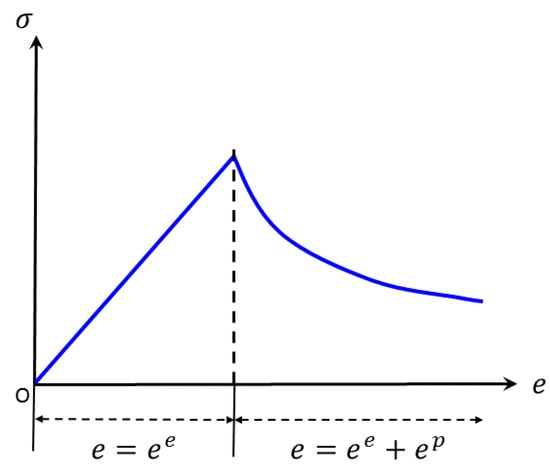
Figure 3.
Example stress–strain curve of strain-softening/hardening model. (: elastic strain, : plastic strain).

Table 5.
Parameters of bolt mechanical model.
4. Analysis and Discussion
4.1. The Influence of Fracture Dip Angle on Anchor Specimen Strength
Through a multifactorial analysis of variance and visual examination of the experimental results, it has been discerned that the fracture dip angle stands as the primary controlling factor governing the strength of specimens. As shown in Figure 4, under varied conditions, the strength of specimens with a 45° fracture dip angle consistently falls below that of specimens without fractures and those with a 90° fracture dip angle (see Figure 3). With equivalent anchor restraint conditions and freeze–thaw cycles, the following relationships in terms of strength among the specimens emerge: 45° fracture dip angle < 90° fracture dip angle < no fractures. Under conditions devoid of anchor restraints, the tangent modulus of specimens exhibits the following relationship: 45° fracture dip angle < 90° fracture dip angle ≈ no fractures. For instance, considering specimens subjected to ten freeze–thaw cycles without anchor restraints, the average strengths are 18.3 MPa, 5.2 MPa, and 13.4 MPa, respectively, for specimens with no fractures, a 45° fracture dip angle, and a 90° fracture dip angle. Notably, the strength of specimens with a 45° fracture dip angle and 90° fracture dip angle accounts for 28.4% and 73.4%, respectively, of that of specimens without fractures. The average tangent moduli for specimens with no fractures, a 45° fracture dip angle, and a 90° fracture dip angle are 3.26 GPa, 1.38 GPa, and 2.12 GPa, respectively. This indicates that the strength of specimens with a 45° fracture dip angle and 90° fracture dip angle corresponds to 42.3% and 65.2%, respectively, of that of specimens without fractures, as depicted in Table 6.

Figure 4.
The impact of fracture dip angle on rock properties: (a) variation in compressive strength, (b) variation in tangential modulus.

Table 6.
Relationship between the strength and tangent modulus of fractured specimens and specimens without fractures.
The presence of fracture angles induces shear failure along the predetermined planes of weakness in the specimens, with inclined sliding planes, typified by a 45° fracture dip angle, proving less advantageous than vertical sliding planes. Consequently, the stress conditions become more intricate, resulting in heightened shear stress on structural planes under identical loads, thereby rendering them more susceptible to failure. Similarly, variations in the tangent moduli follow suit, with the deformation of specimens with a 45° fracture dip angle primarily governed by the shear modulus on weak structural planes, manifesting in their lower values and diminished overall stiffness compared to specimens without anchor restraints. This discrepancy in the deformation behaviour between specimens with and without anchor restraints signifies a distinct phenomenon warranting further investigation.
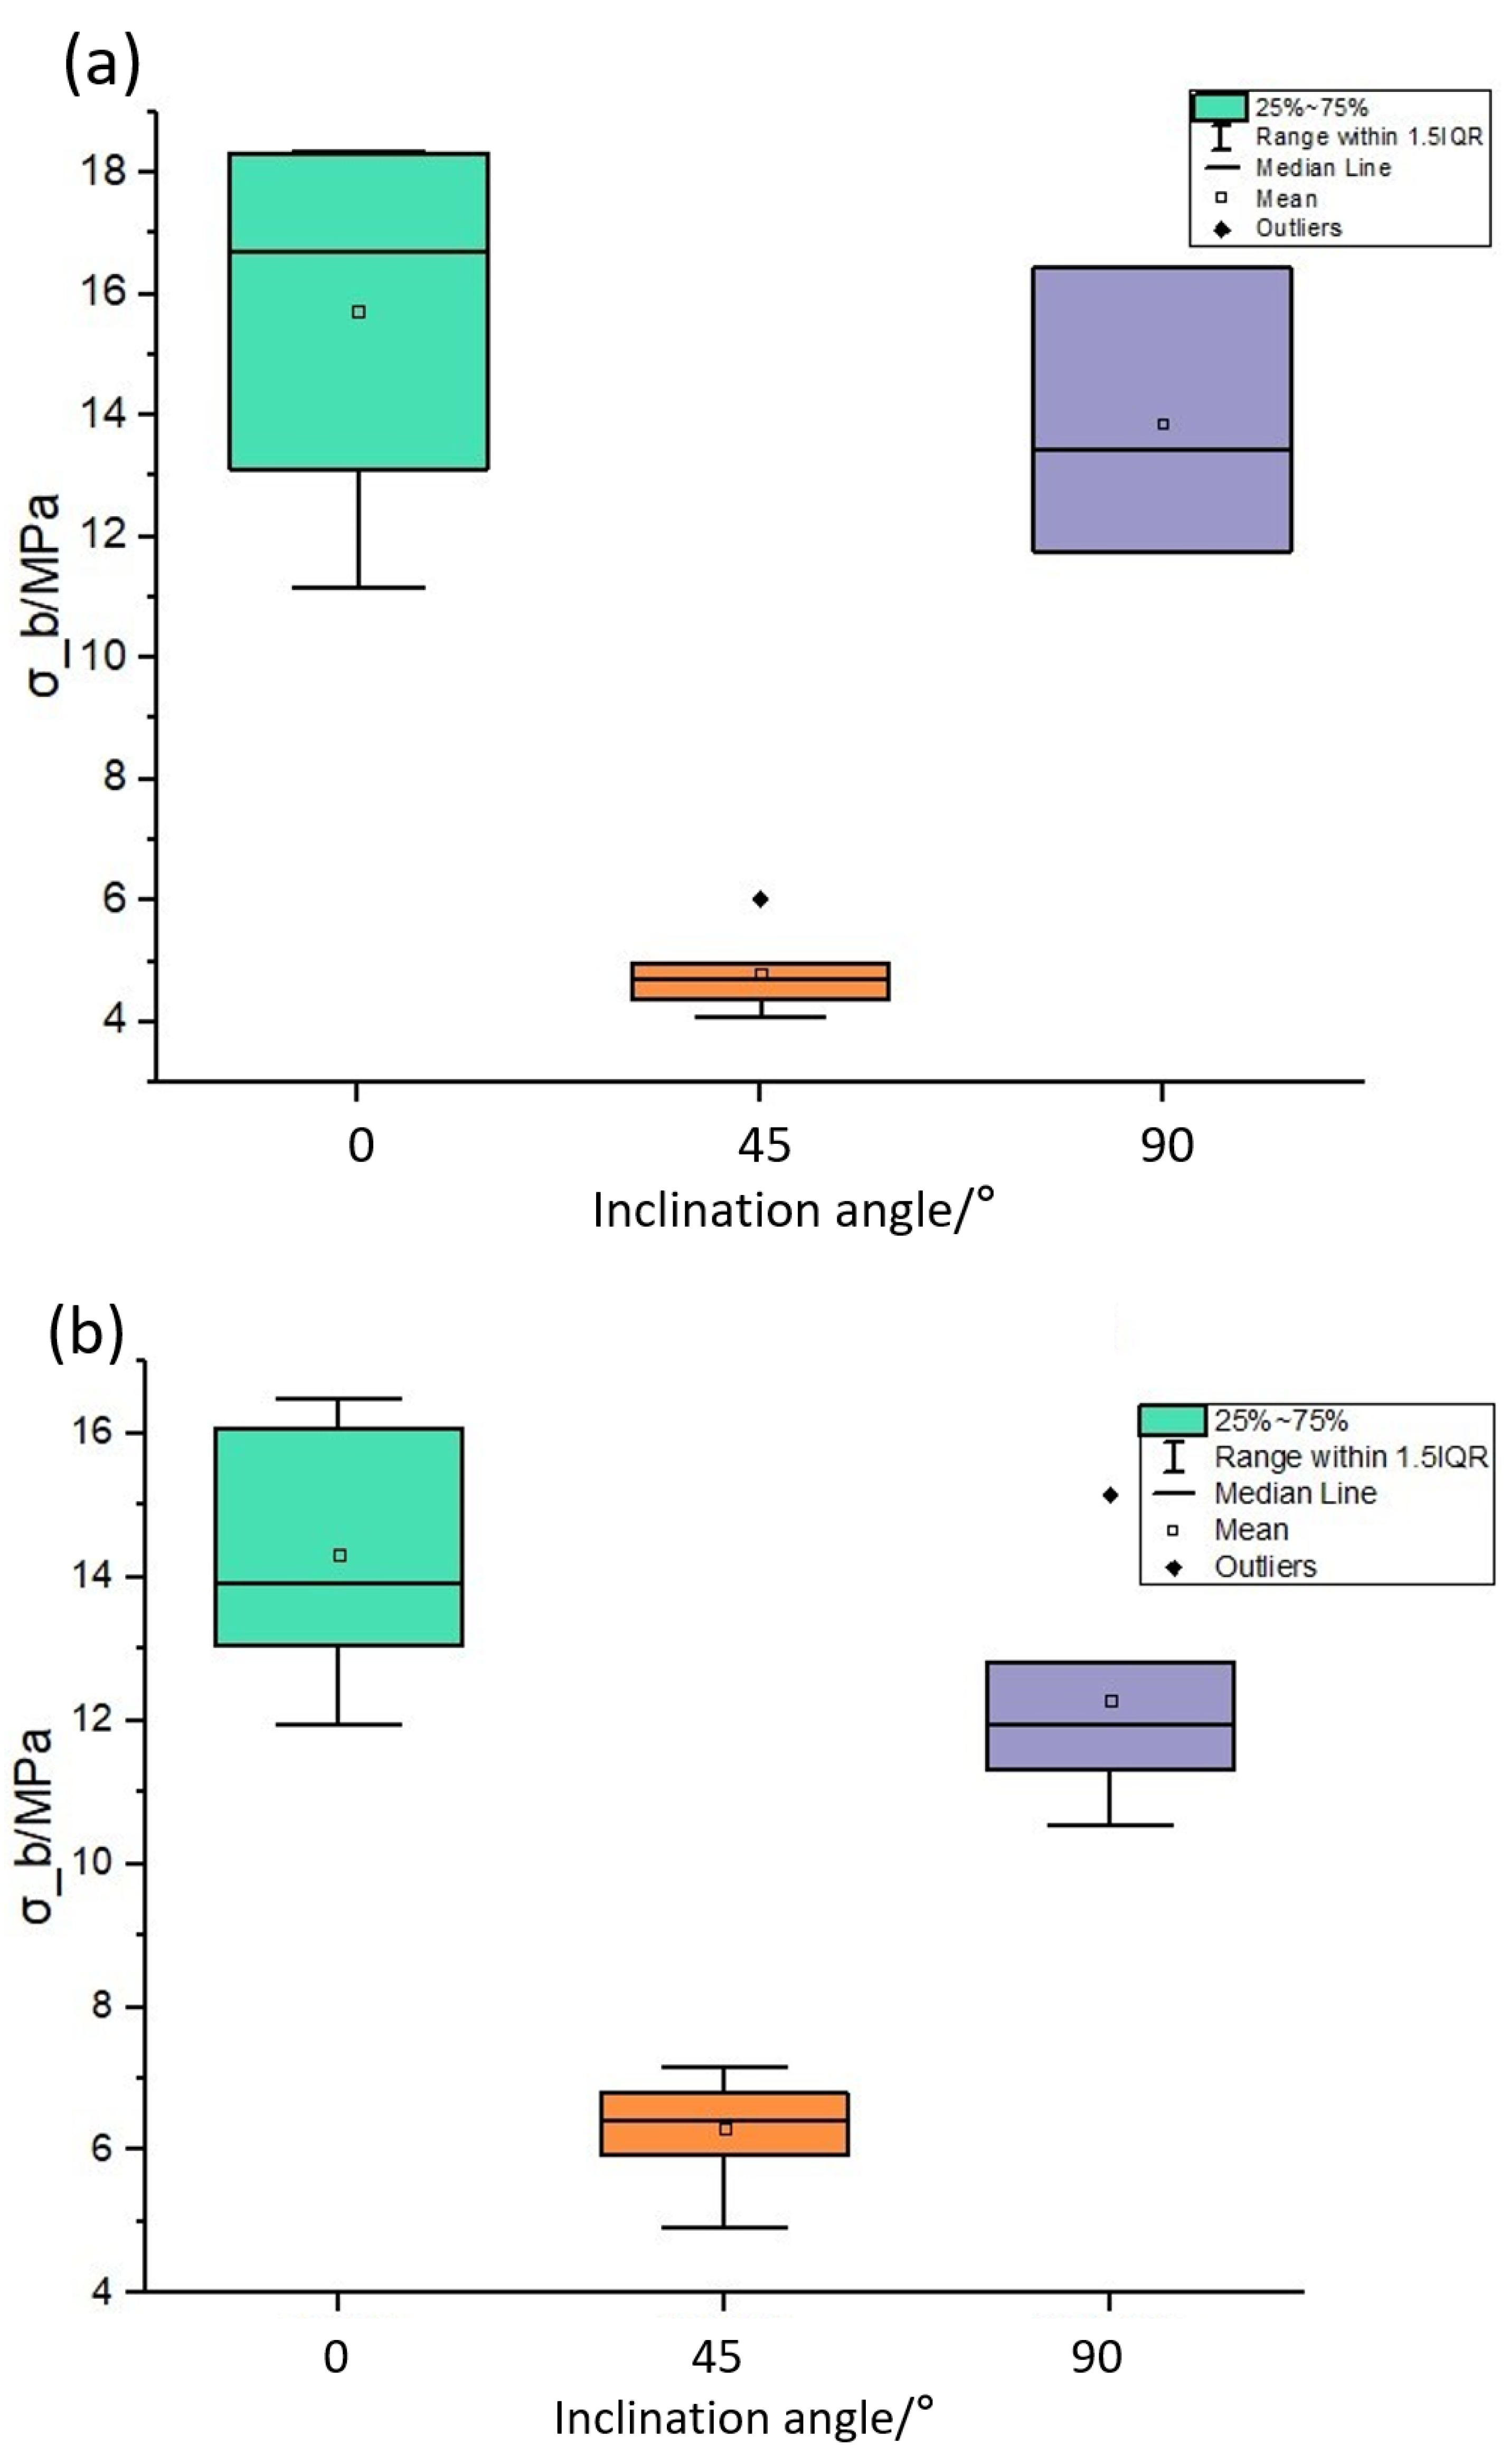
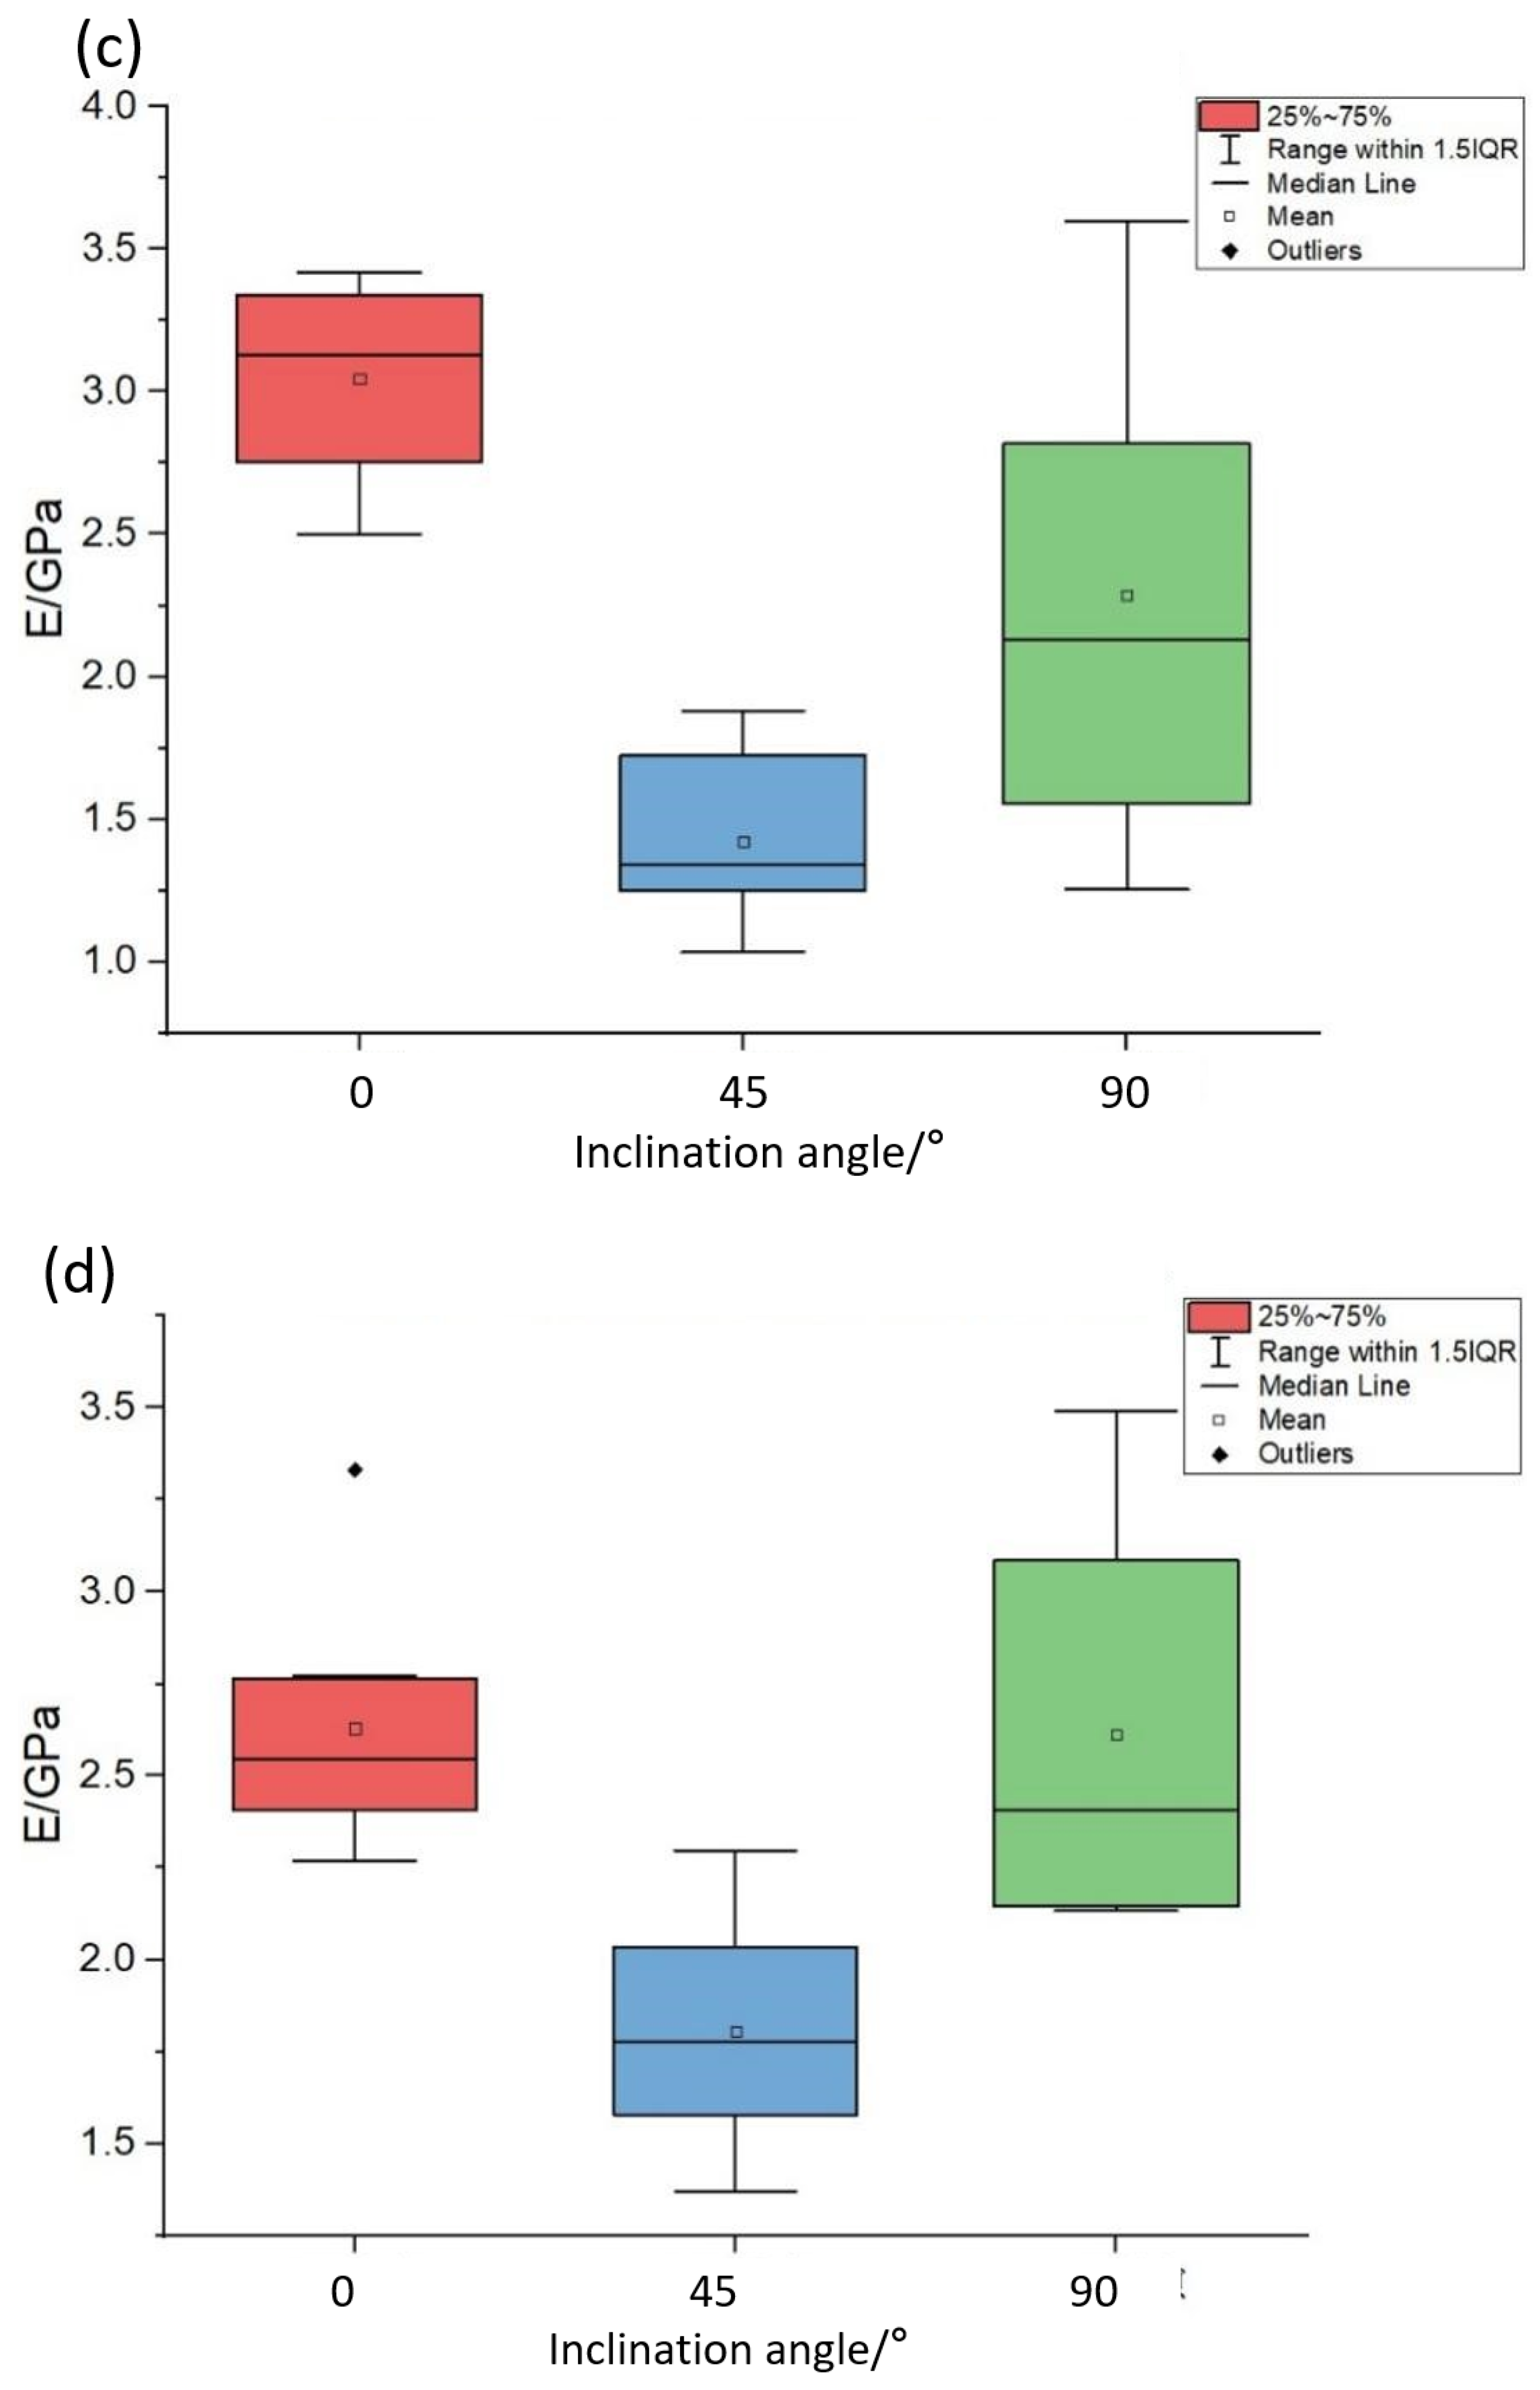
Combining specimens subjected to varying freeze–thaw cycles for statistical analysis, as depicted in Figure 5, reveals that specimens with a 45° fracture dip angle exhibit the lowest degree of dispersion in their strength, followed by those with a 90° fracture dip angle. This variability in dispersion data underscores the distinct characteristics of the reliability of strength for inclined fractures approximating 45°, compared to those nearing a vertical orientation. Although the mean strength of fractures approaching 45° is lesser than those approaching a vertical orientation, the larger dispersion observed in specimens with a 90° fracture dip angle suggests that a higher safety factor should be applied in supporting and reinforcing engineering measures for fractures approaching a vertical orientation.
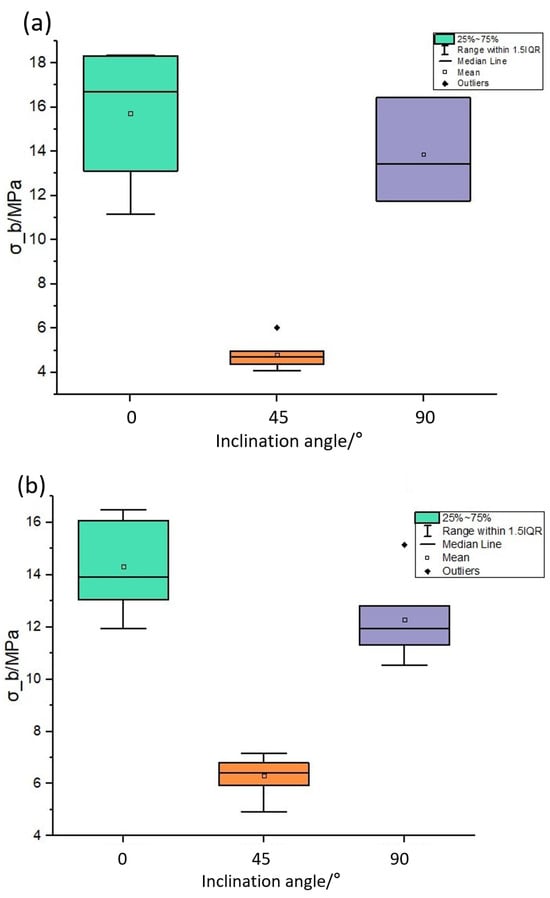
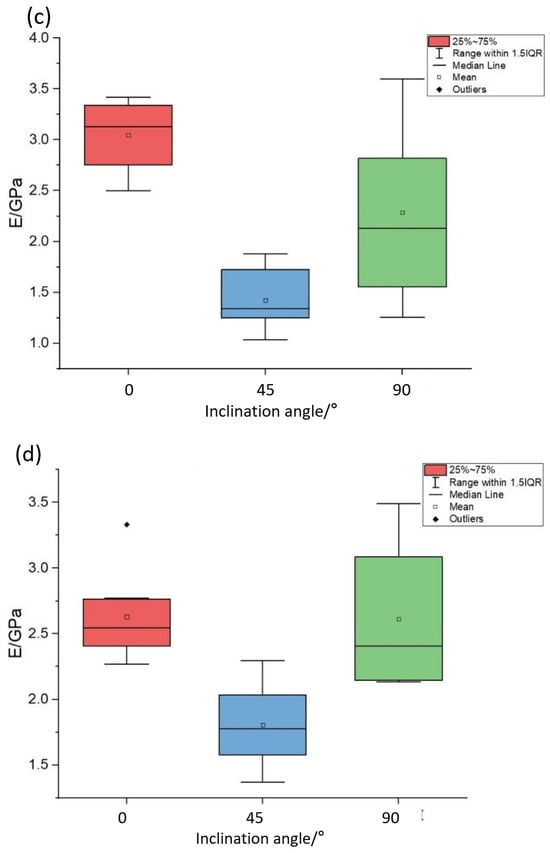
Figure 5.
Box plots depicting the distribution of the strength and elastic modulus of specimens under different pre-existing fracture conditions: (a) strength in unbolted specimens, (b) strength in bolted specimens, (c) elastic modulus in unbolted specimens, (d) elastic modulus in bolted specimens.
4.2. Impact of Anchoring Conditions on Specimen Strength
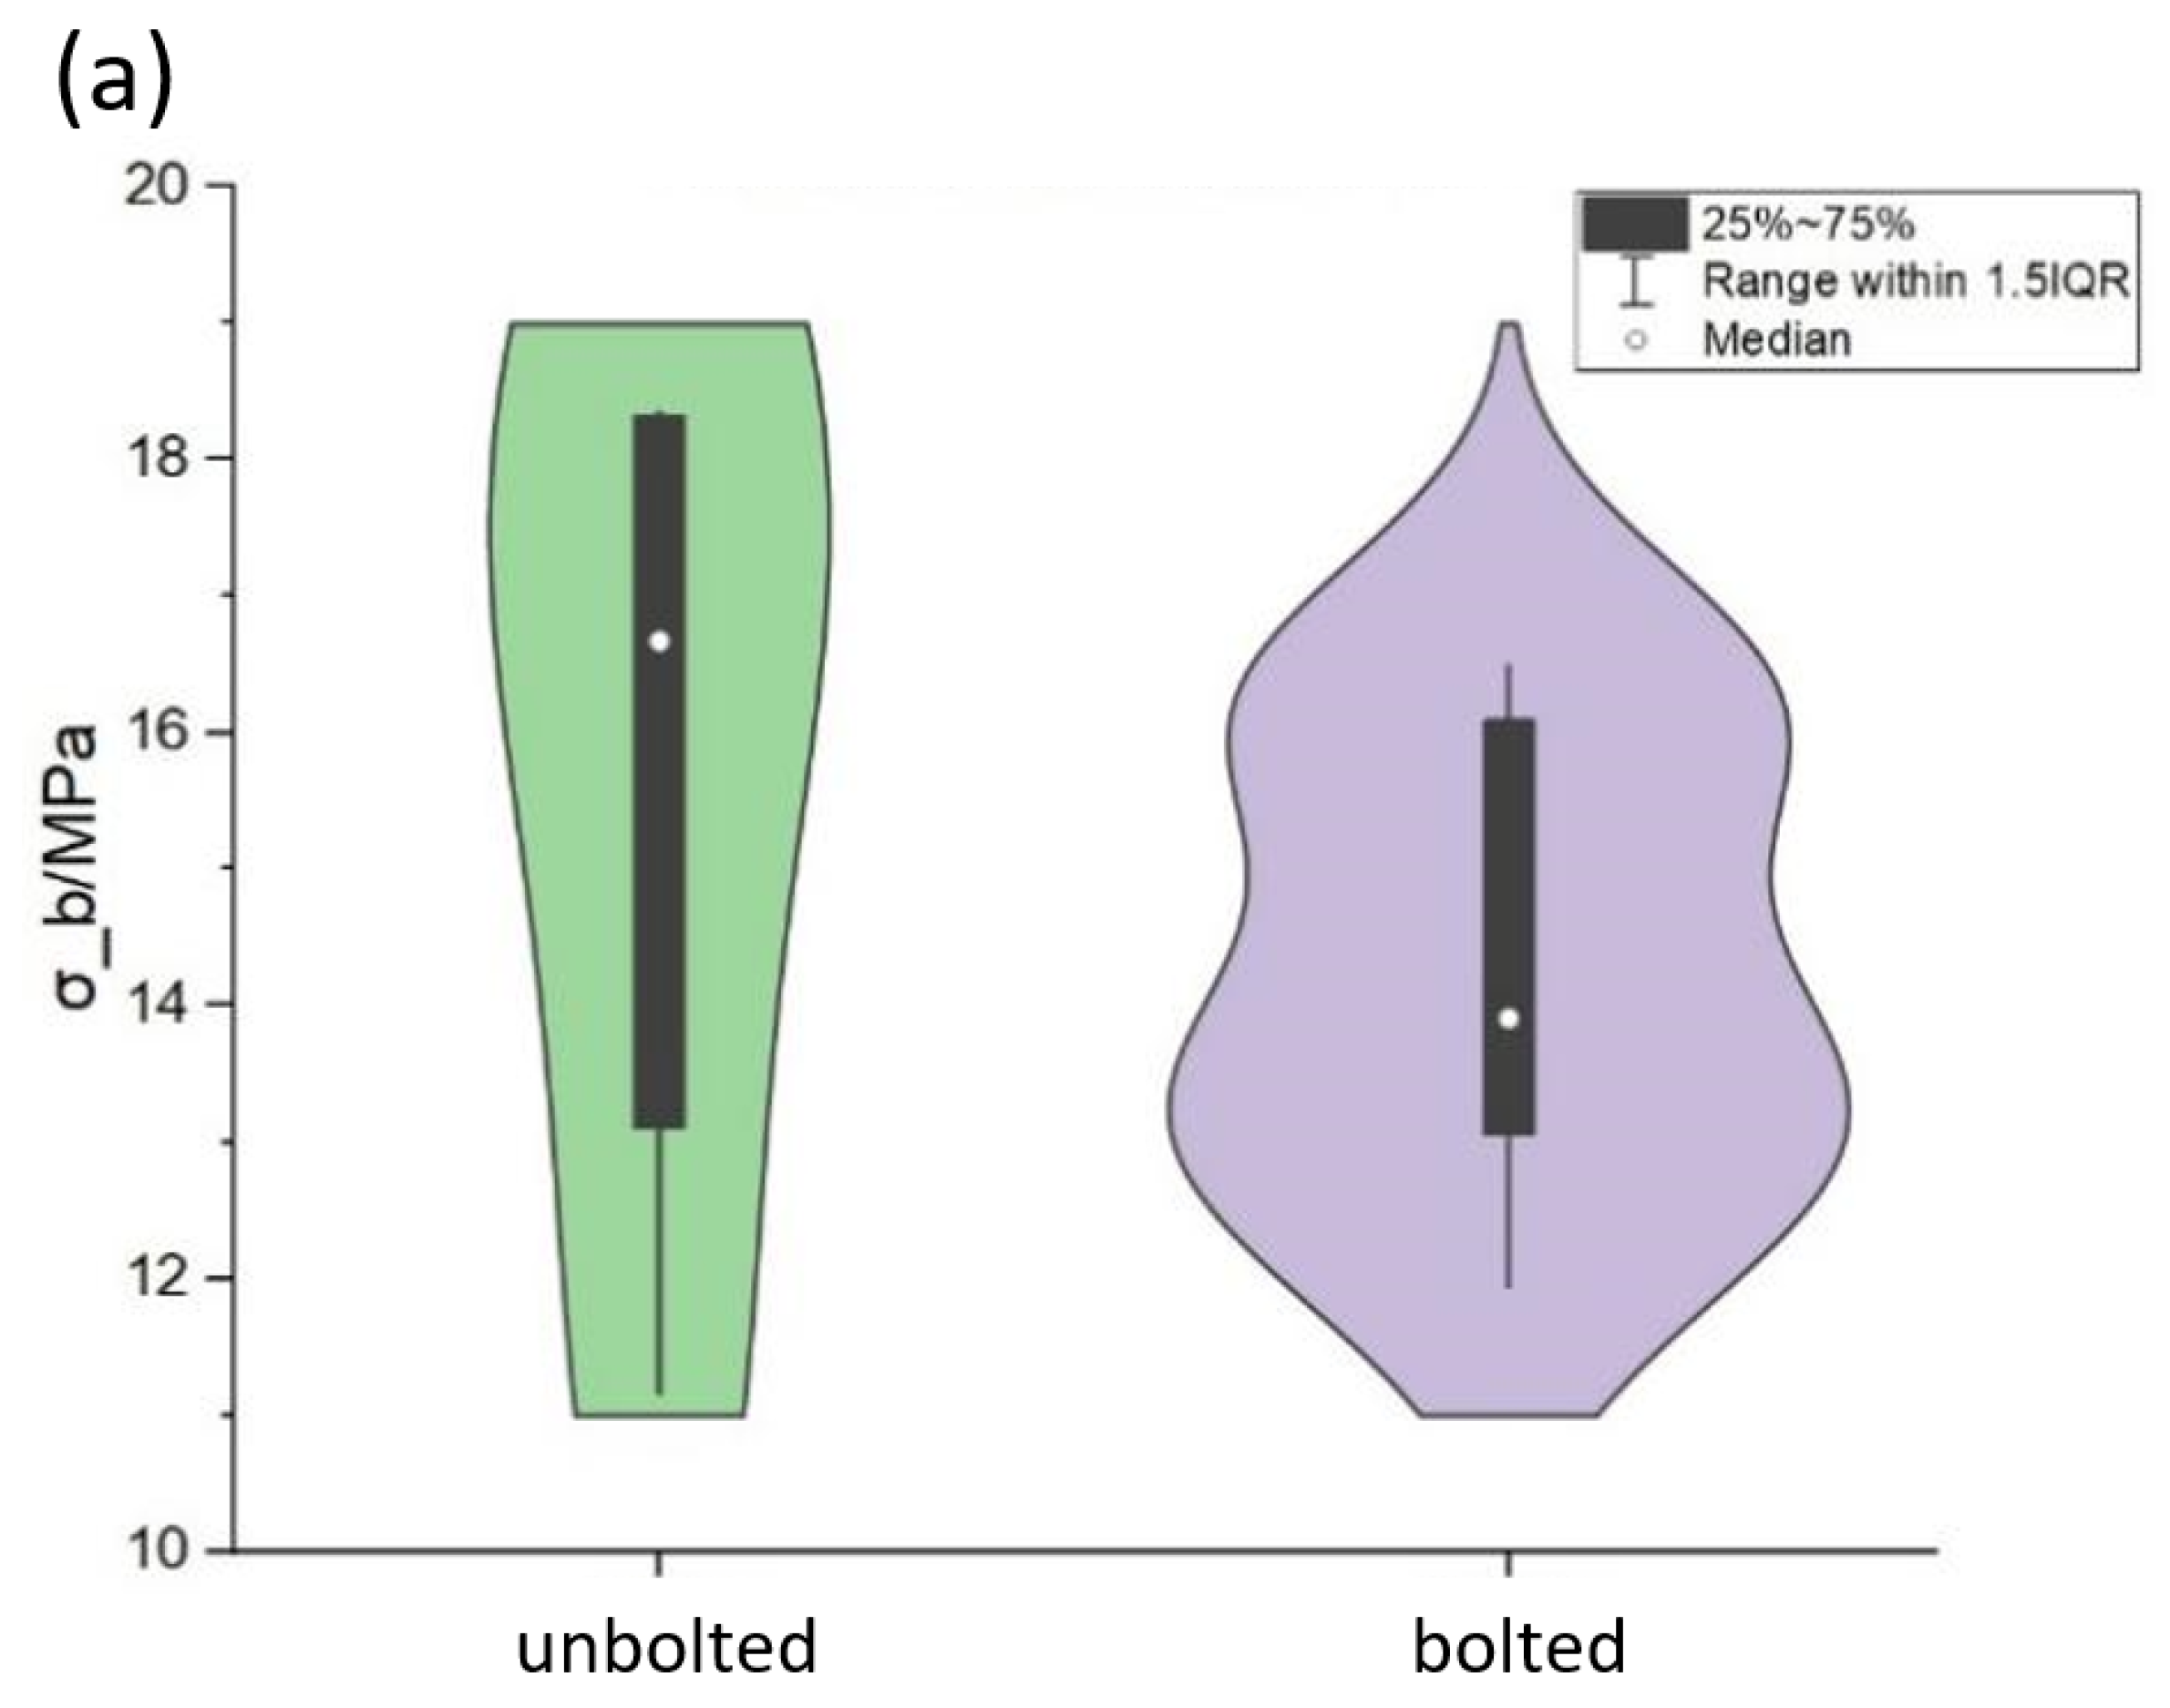
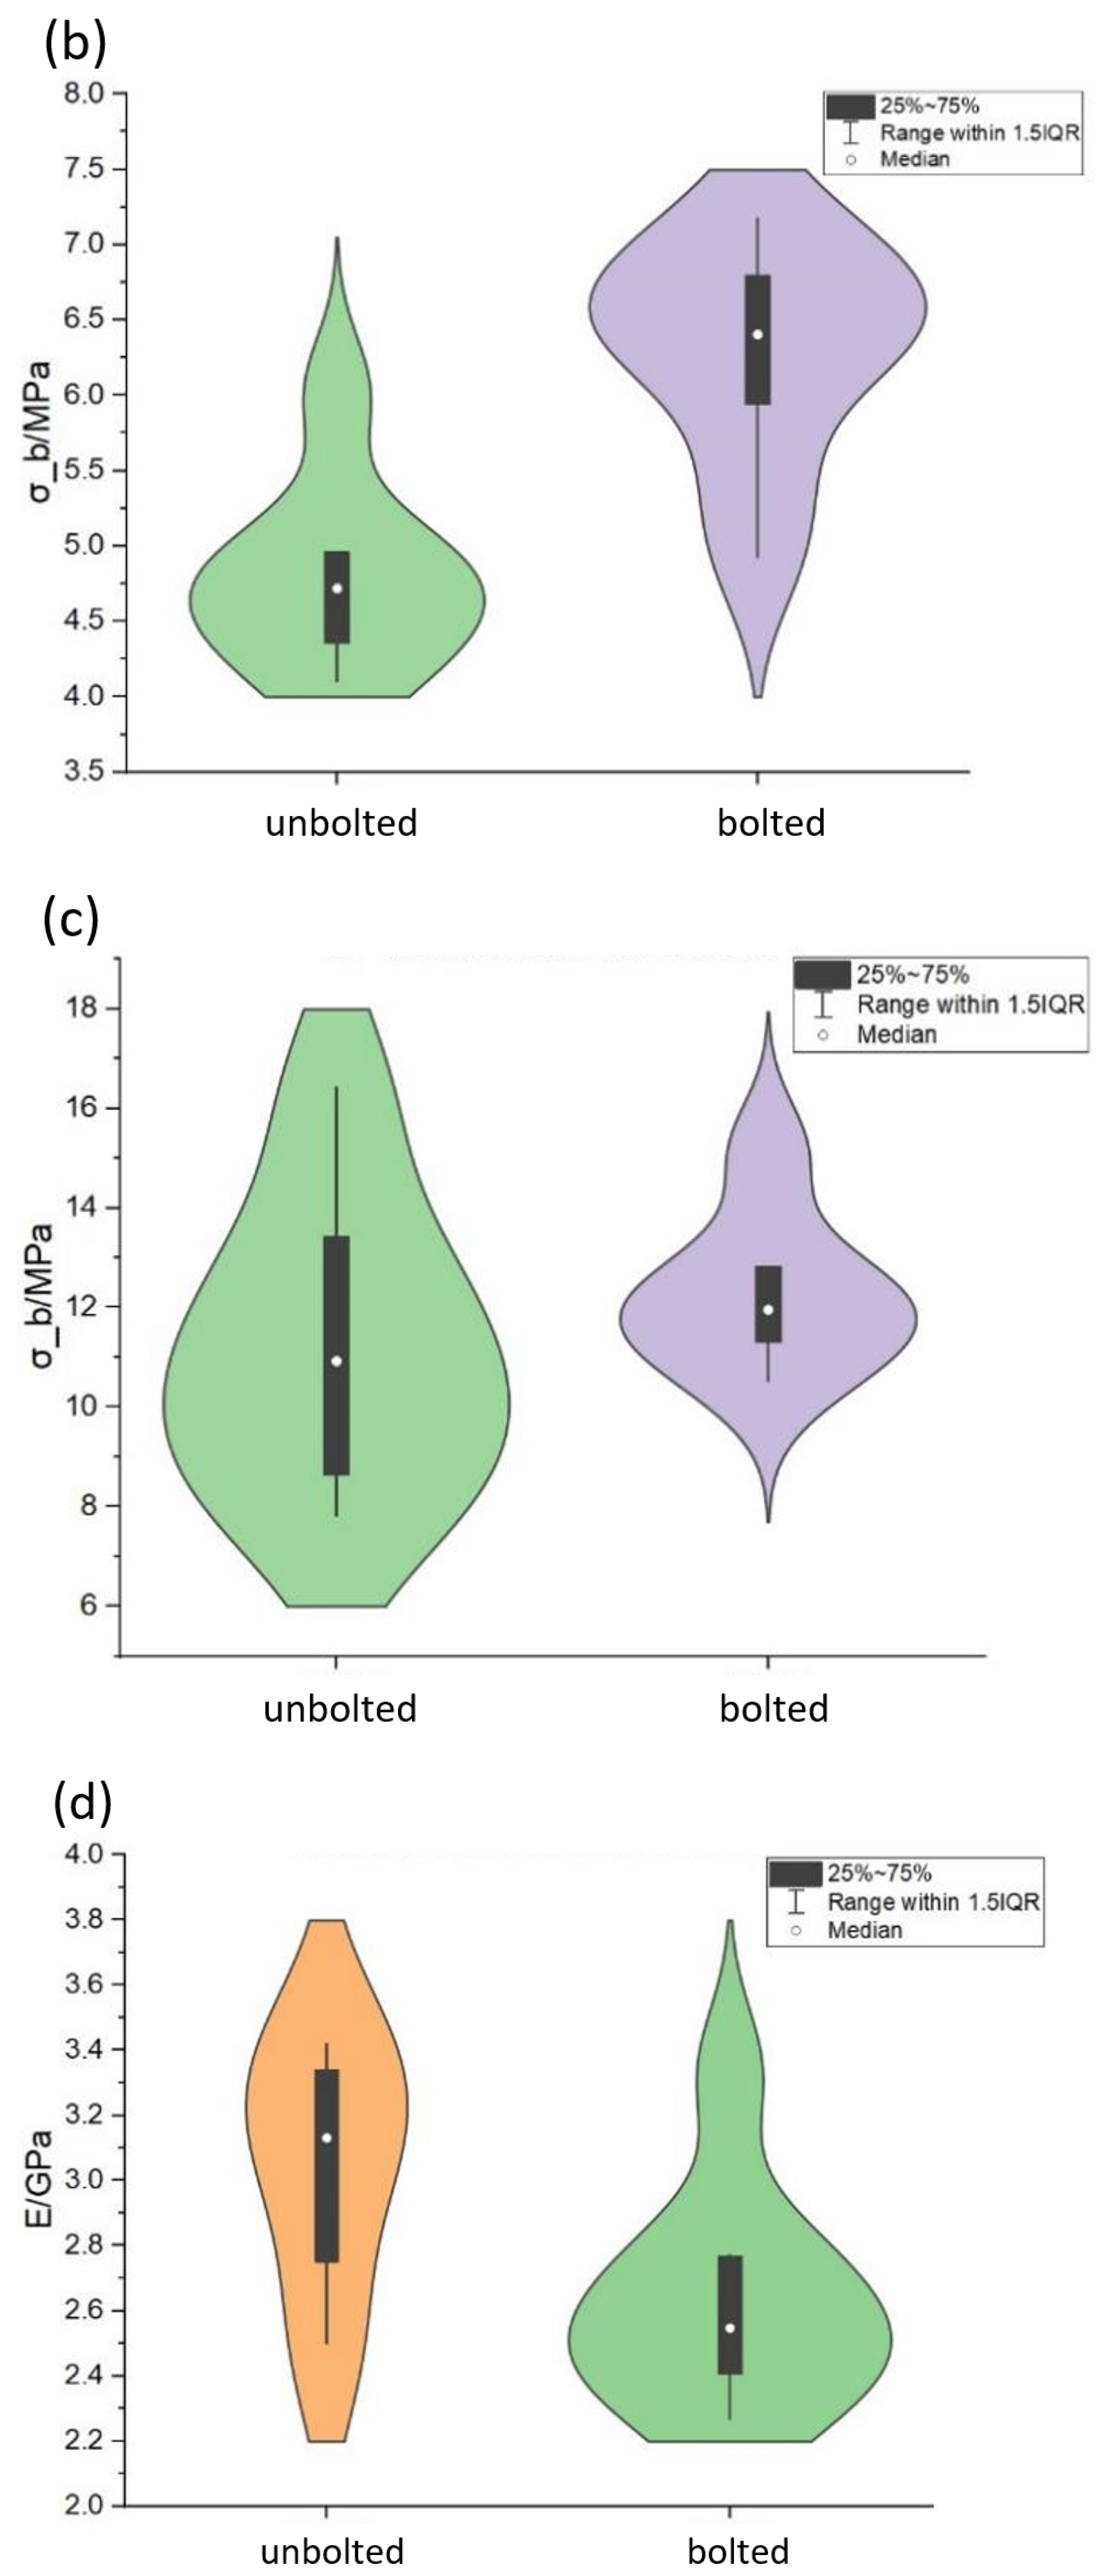
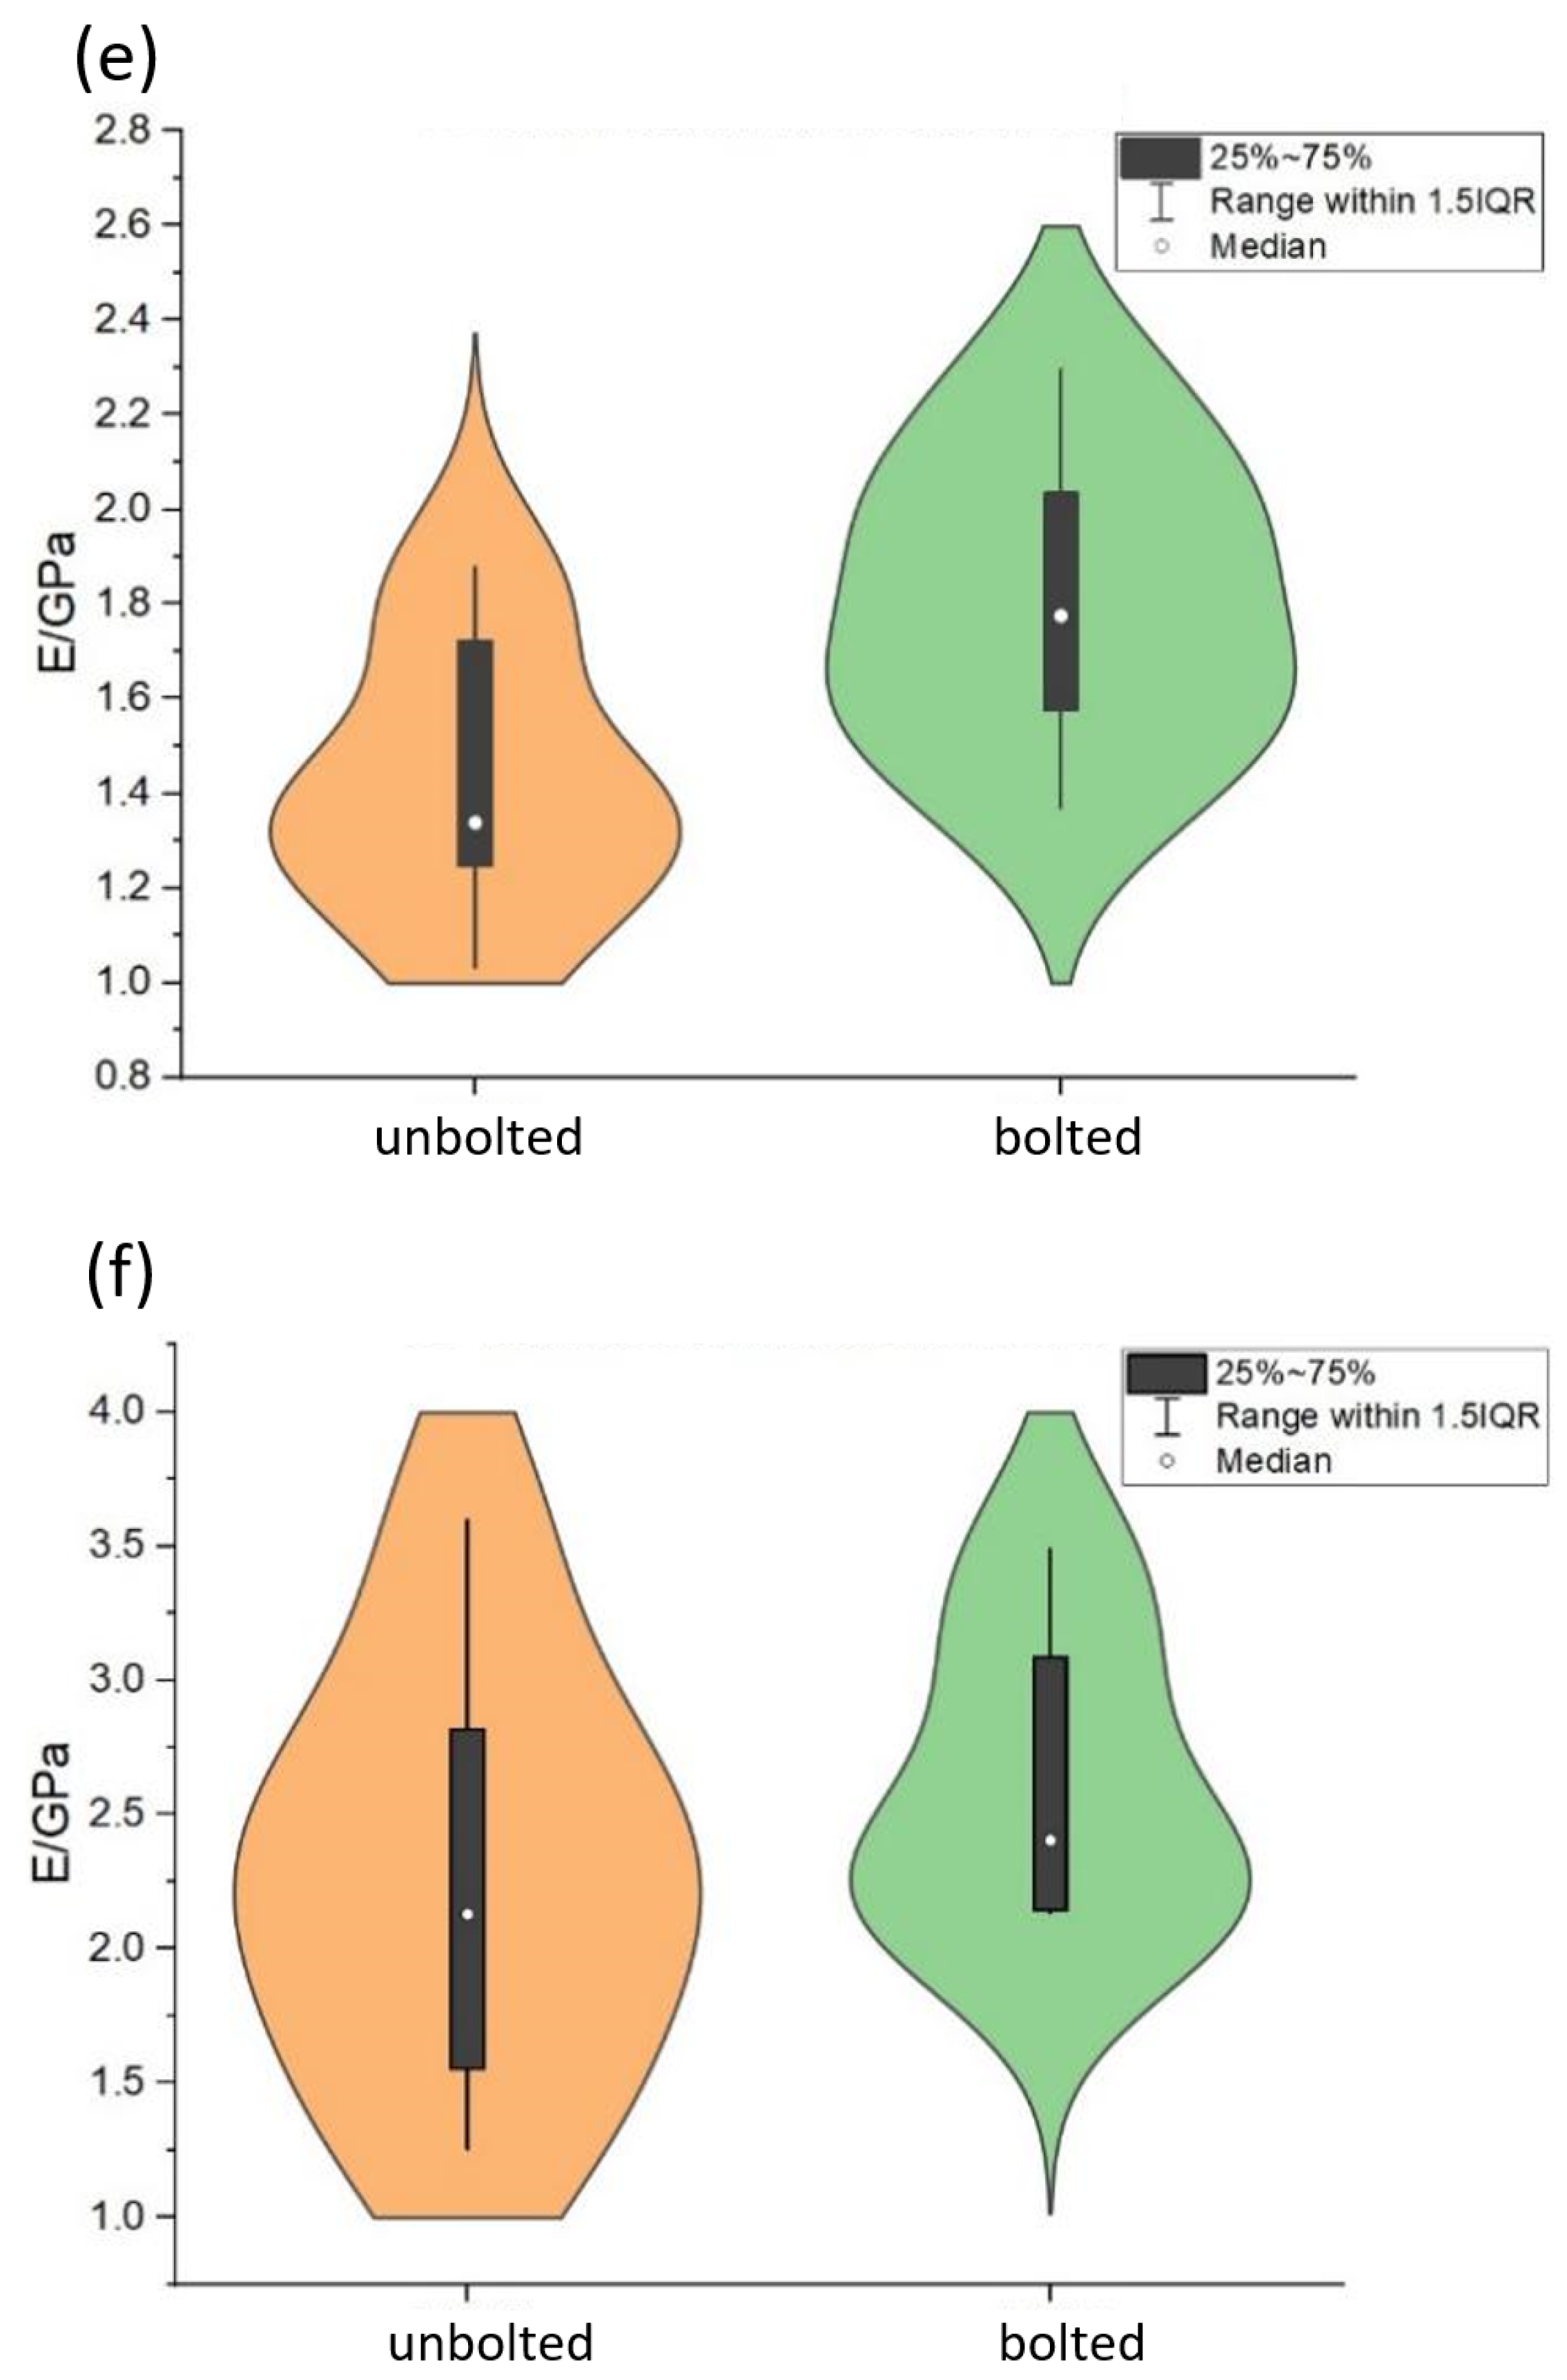
Our anchoring methods are classified into three types based on the ratio of the length of the anchored section to the length of the borehole: end anchoring, extended anchoring, and full-length anchoring. Experimental comparisons were made between the strength and modulus of specimens with and without cracks, coupled with and without anchor rods, studying the supportive effect of full-length anchoring on the specimens. Statistical analyses were conducted on specimens subjected to different freeze–thaw cycles, as illustrated in Figure 5 and Table 7. From this analysis, the following conclusions can be drawn: (1) Under different prefabricated structural surface conditions, the influence of anchoring conditions on specimen strength varies significantly. Compared to unbolted specimens without fractures, the mean strength of unfractured bolted specimens decreases by 8.9%, while that of 45° fractured bolted specimens increases by 31.2%, and that of 90° fractured bolted specimens increases by 9.3%. Statistically, anchoring exhibits the most effective reinforcement for 45° fractured specimens. (2) Under different prefabricated structural surface conditions, the influence of anchoring conditions on a specimen’s tangent modulus also exhibits significant variation. Compared to unbolted specimens without fractures, the mean tangent modulus of unfractured bolted specimens decreases by 13.7%, while that of 45° fractured bolted specimens increases by 26.8%, and that of 90° fractured bolted specimens increases by 14.2%.

Table 7.
A comparative analysis of parameters for specimens with and without bolting.
The reasons for these phenomena can be elucidated as follows: For unfractured specimens, the addition of a high-stiffness anchor, which is stiffer than the specimen’s strength, leads to stress concentration around the anchor rod during failure, causing cracks to expand and weaken both their strength and stiffness (Figure 6). For 45° fractured specimens, sliding occurs along the pre-existing weak structural surface during failure; the anchor rod exerts tension and shear forces, providing an anchoring restraint in that direction. This simultaneously counteracts external forces in the sliding direction, thereby enhancing specimen strength. For 90° fractured specimens, due to the perpendicular orientation of the prefabricated structural surface to the end face, both the stress concentration and anchoring effects of the anchor influence the final failure of the specimen. The crack propagation shifts from predominantly extending from the pre-existing structural surface to jointly extending from around the anchor and the edge of the structural surface. The anchoring of the anchor controls crack propagation along the prefabricated structural surface, thereby enhancing its strength, while the stress concentration effect reduces the specimen’s strength.
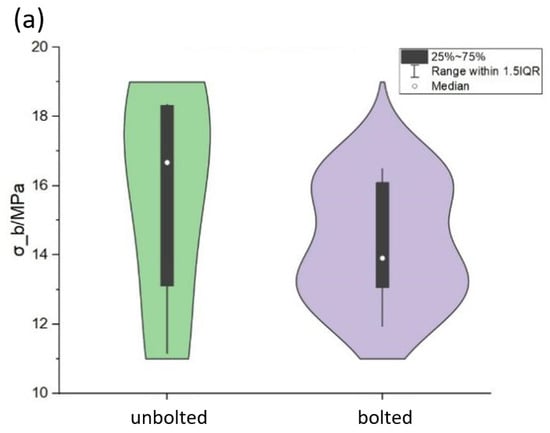
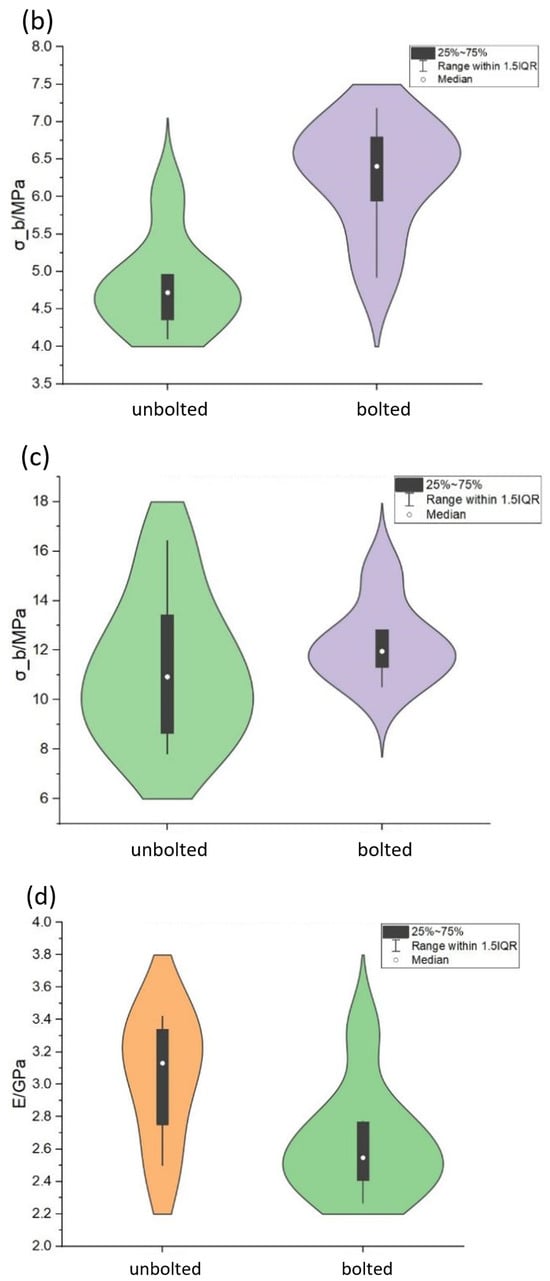
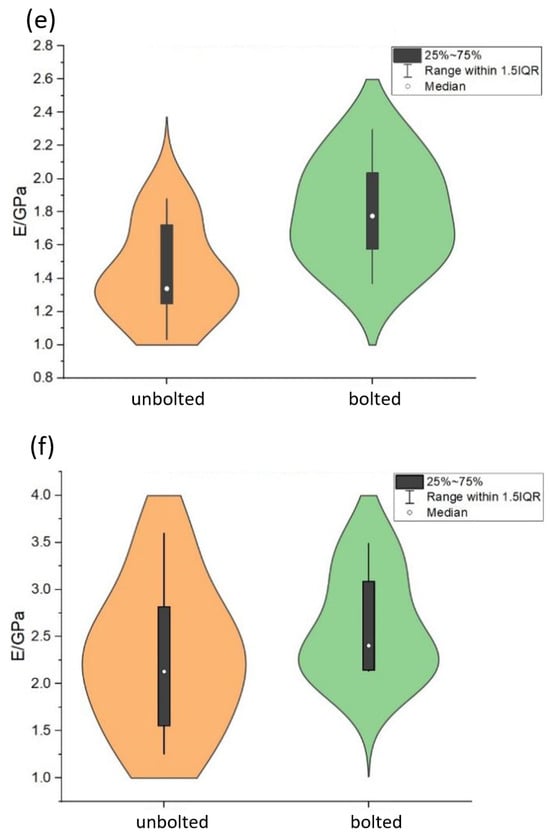
Figure 6.
Comparison of strength and tangential modulus of bolted and unbolted specimens: (a–c) strength comparison of intact, 45° fractured, and 90° fractured specimens; (d–f) elastic modulus comparison of intact, 45° fractured, and 90° fractured specimens.
4.3. Effect of Freeze–Thaw Cycles on the Strength of Specimens
The specimens were subjected to freeze–thaw cycles within a temperature range of −20 °C to 20 °C, with a cycle duration of 4 h, and their uniaxial compression results are depicted in Figure 7. The relationship between strength and the number of freeze–thaw cycles was modelled using a linear function, as follows:
σb—strength of the specimen (MPa); N—number of freeze–thaw cycles; ,—fitting constants. Their specific values are shown in Table 8.

Table 8.
Values of the fitting constants.
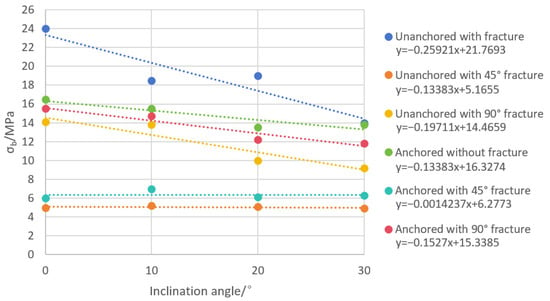
Figure 7.
Relationship between compressive strength and freeze–thaw cycles for different types of specimens.
Figure 7.
Relationship between compressive strength and freeze–thaw cycles for different types of specimens.
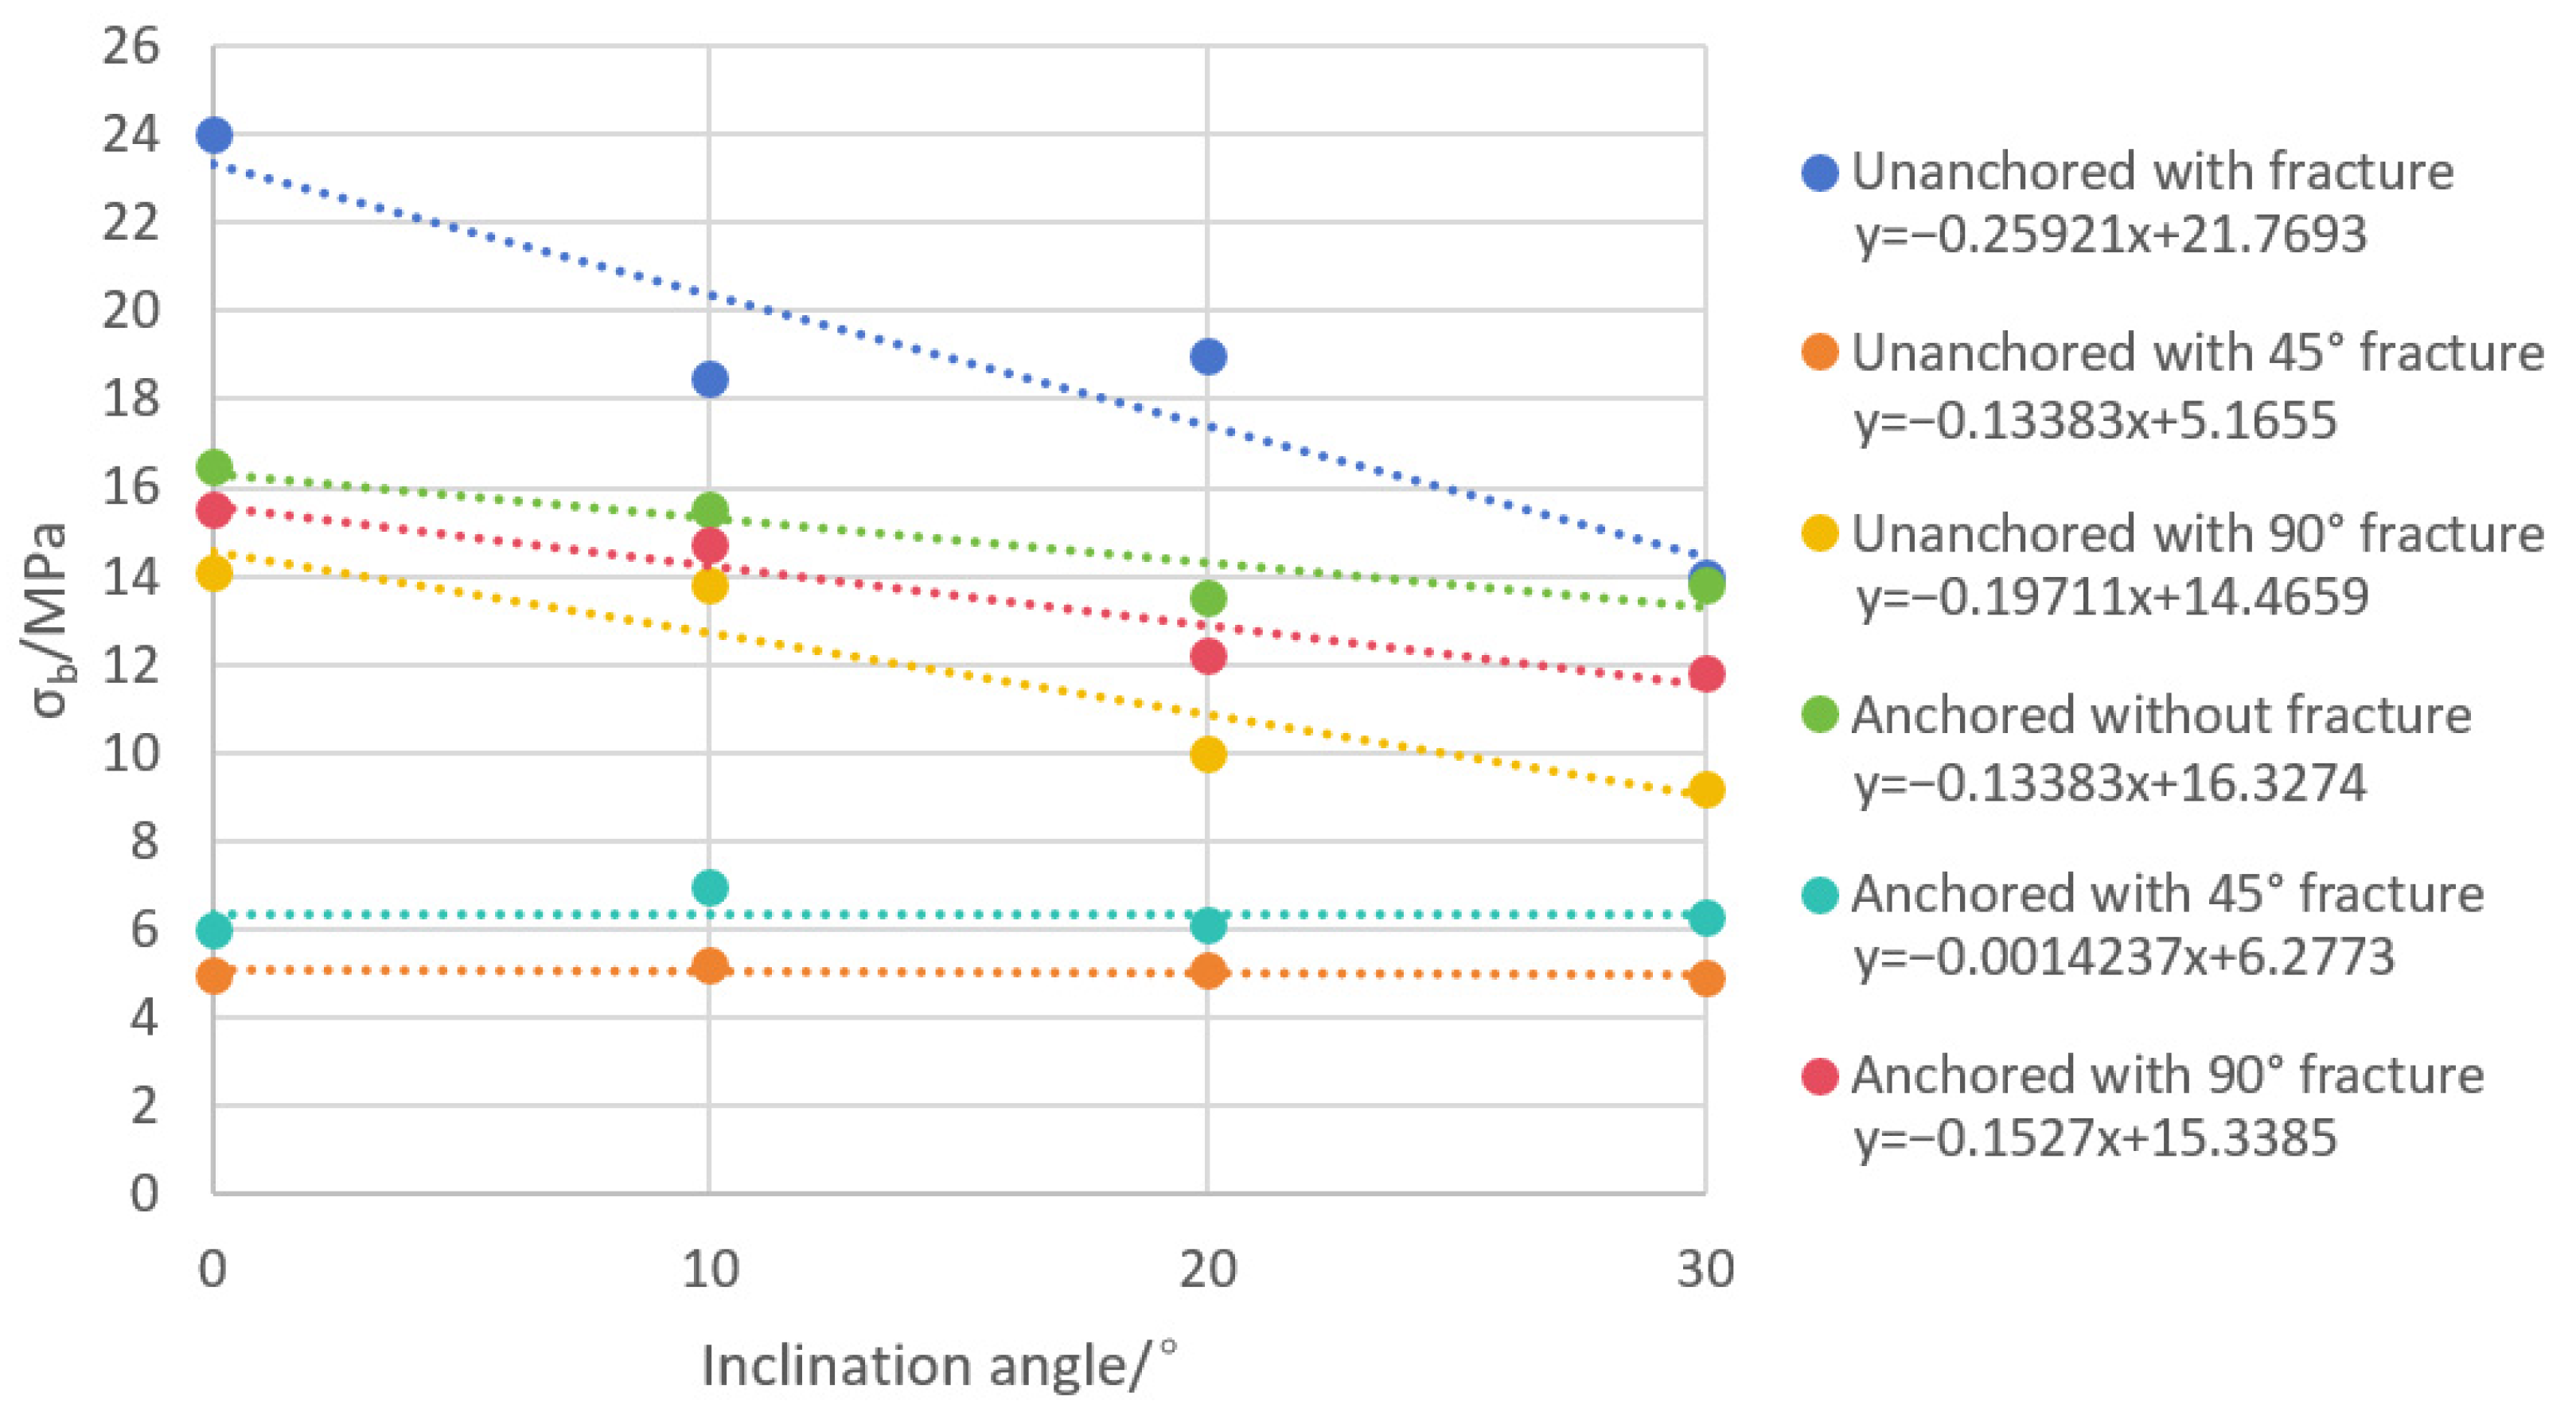
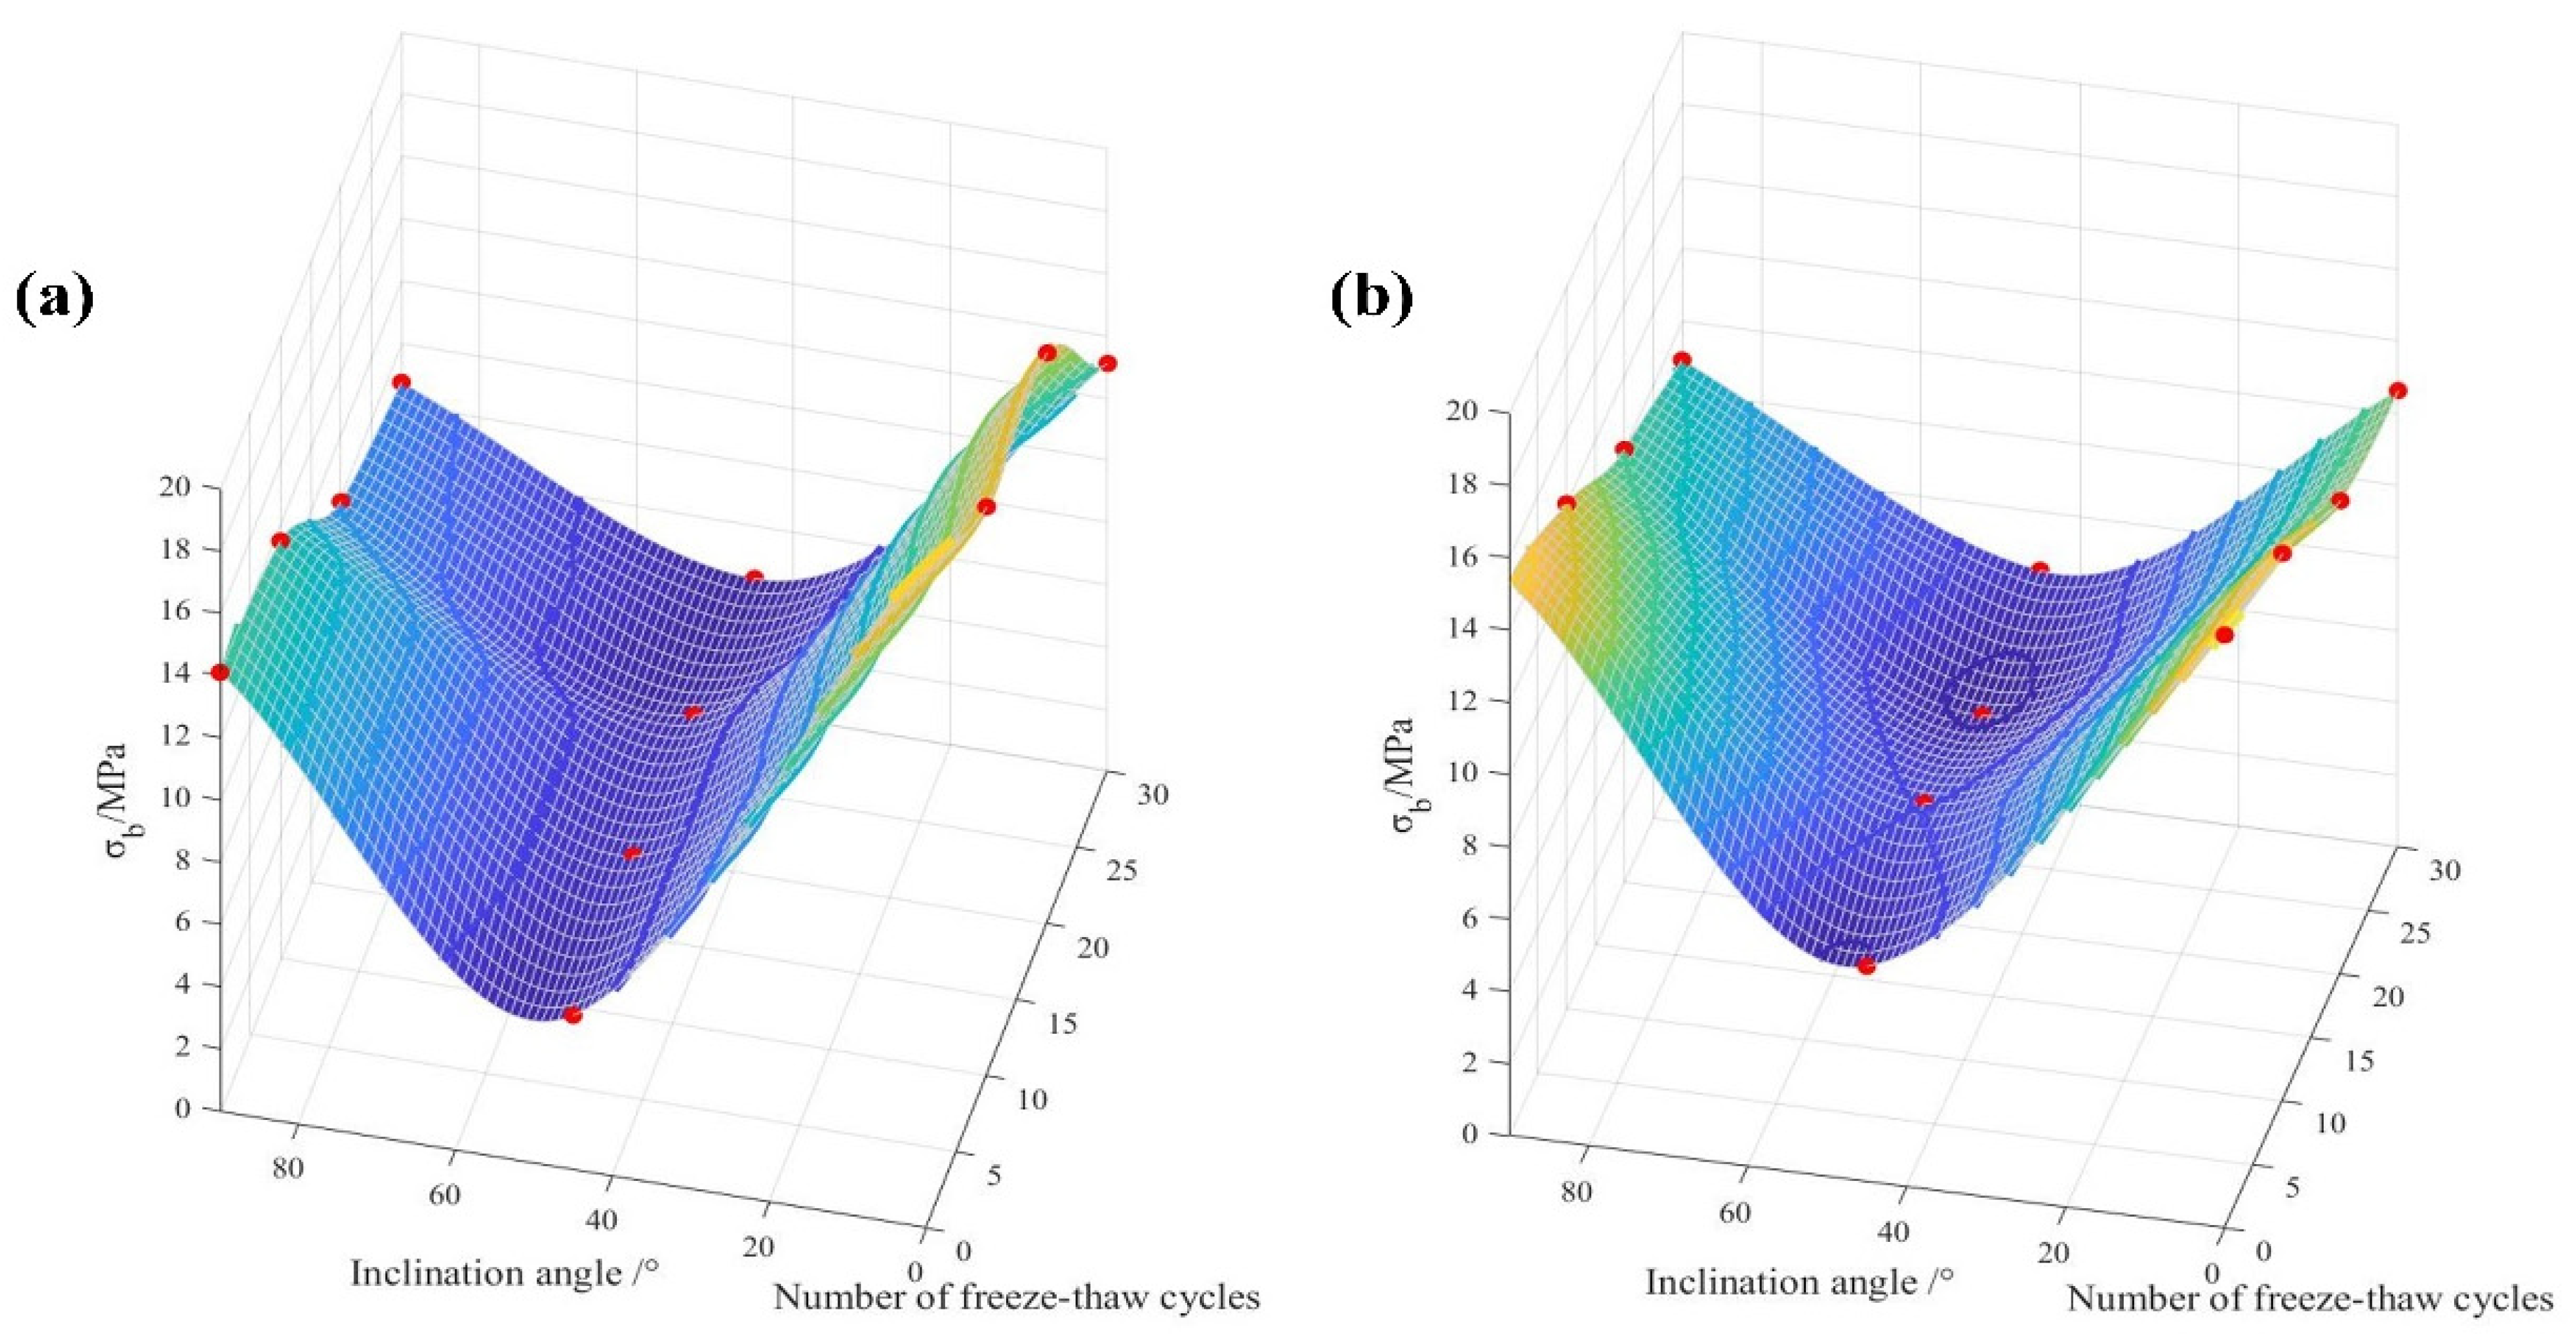
Only the strength of unfractured and 90° fractured specimens increased with the number of freeze–thaw cycles, whereas the weakening effect on 45° fractured specimens was less pronounced. This occurrence can be attributed to four categories of specimens: unfractured without anchors, unfractured with anchors, 90° fractured without anchors, and 90° fractured with anchors. The freeze–thaw cycles induce an expansion of internal microcracks due to frost action, thereby reducing the specimen’s compressive strength. However, for 45° fractured specimens without and with anchors, the microcracks generated by frost action have minimal impact on the specimen’s strength. The absolute value of the fitting constant is nearly zero, indicating that their strength is primarily governed by the shear strength of their pre-existing structural surface. According to Figure 8, it is evident that the influence of fractures on rock strength is significantly greater than that of freeze–thaw cycles. The red dots in the figure represent the data obtained from the experiments. Different colours in the figure correspond to different strength values. Strength values closer to the blue colour indicate lower strength, whereas values closer to the yellow colour indicate higher strength. Therefore, in engineering applications in permafrost regions, careful consideration should be given to the influence of rock fracture dip angle on rock strength and stability.
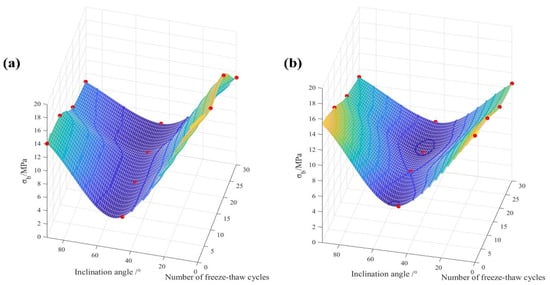
Figure 8.
Variation of specimen strength with freeze–thaw cycles and fracture dip angle in the presence and absence of anchors (note: 0° denotes specimens without fractures): (a) strength of unbolted specimens, (b) strength of bolted specimens.
4.4. Stress–Strain Relationship
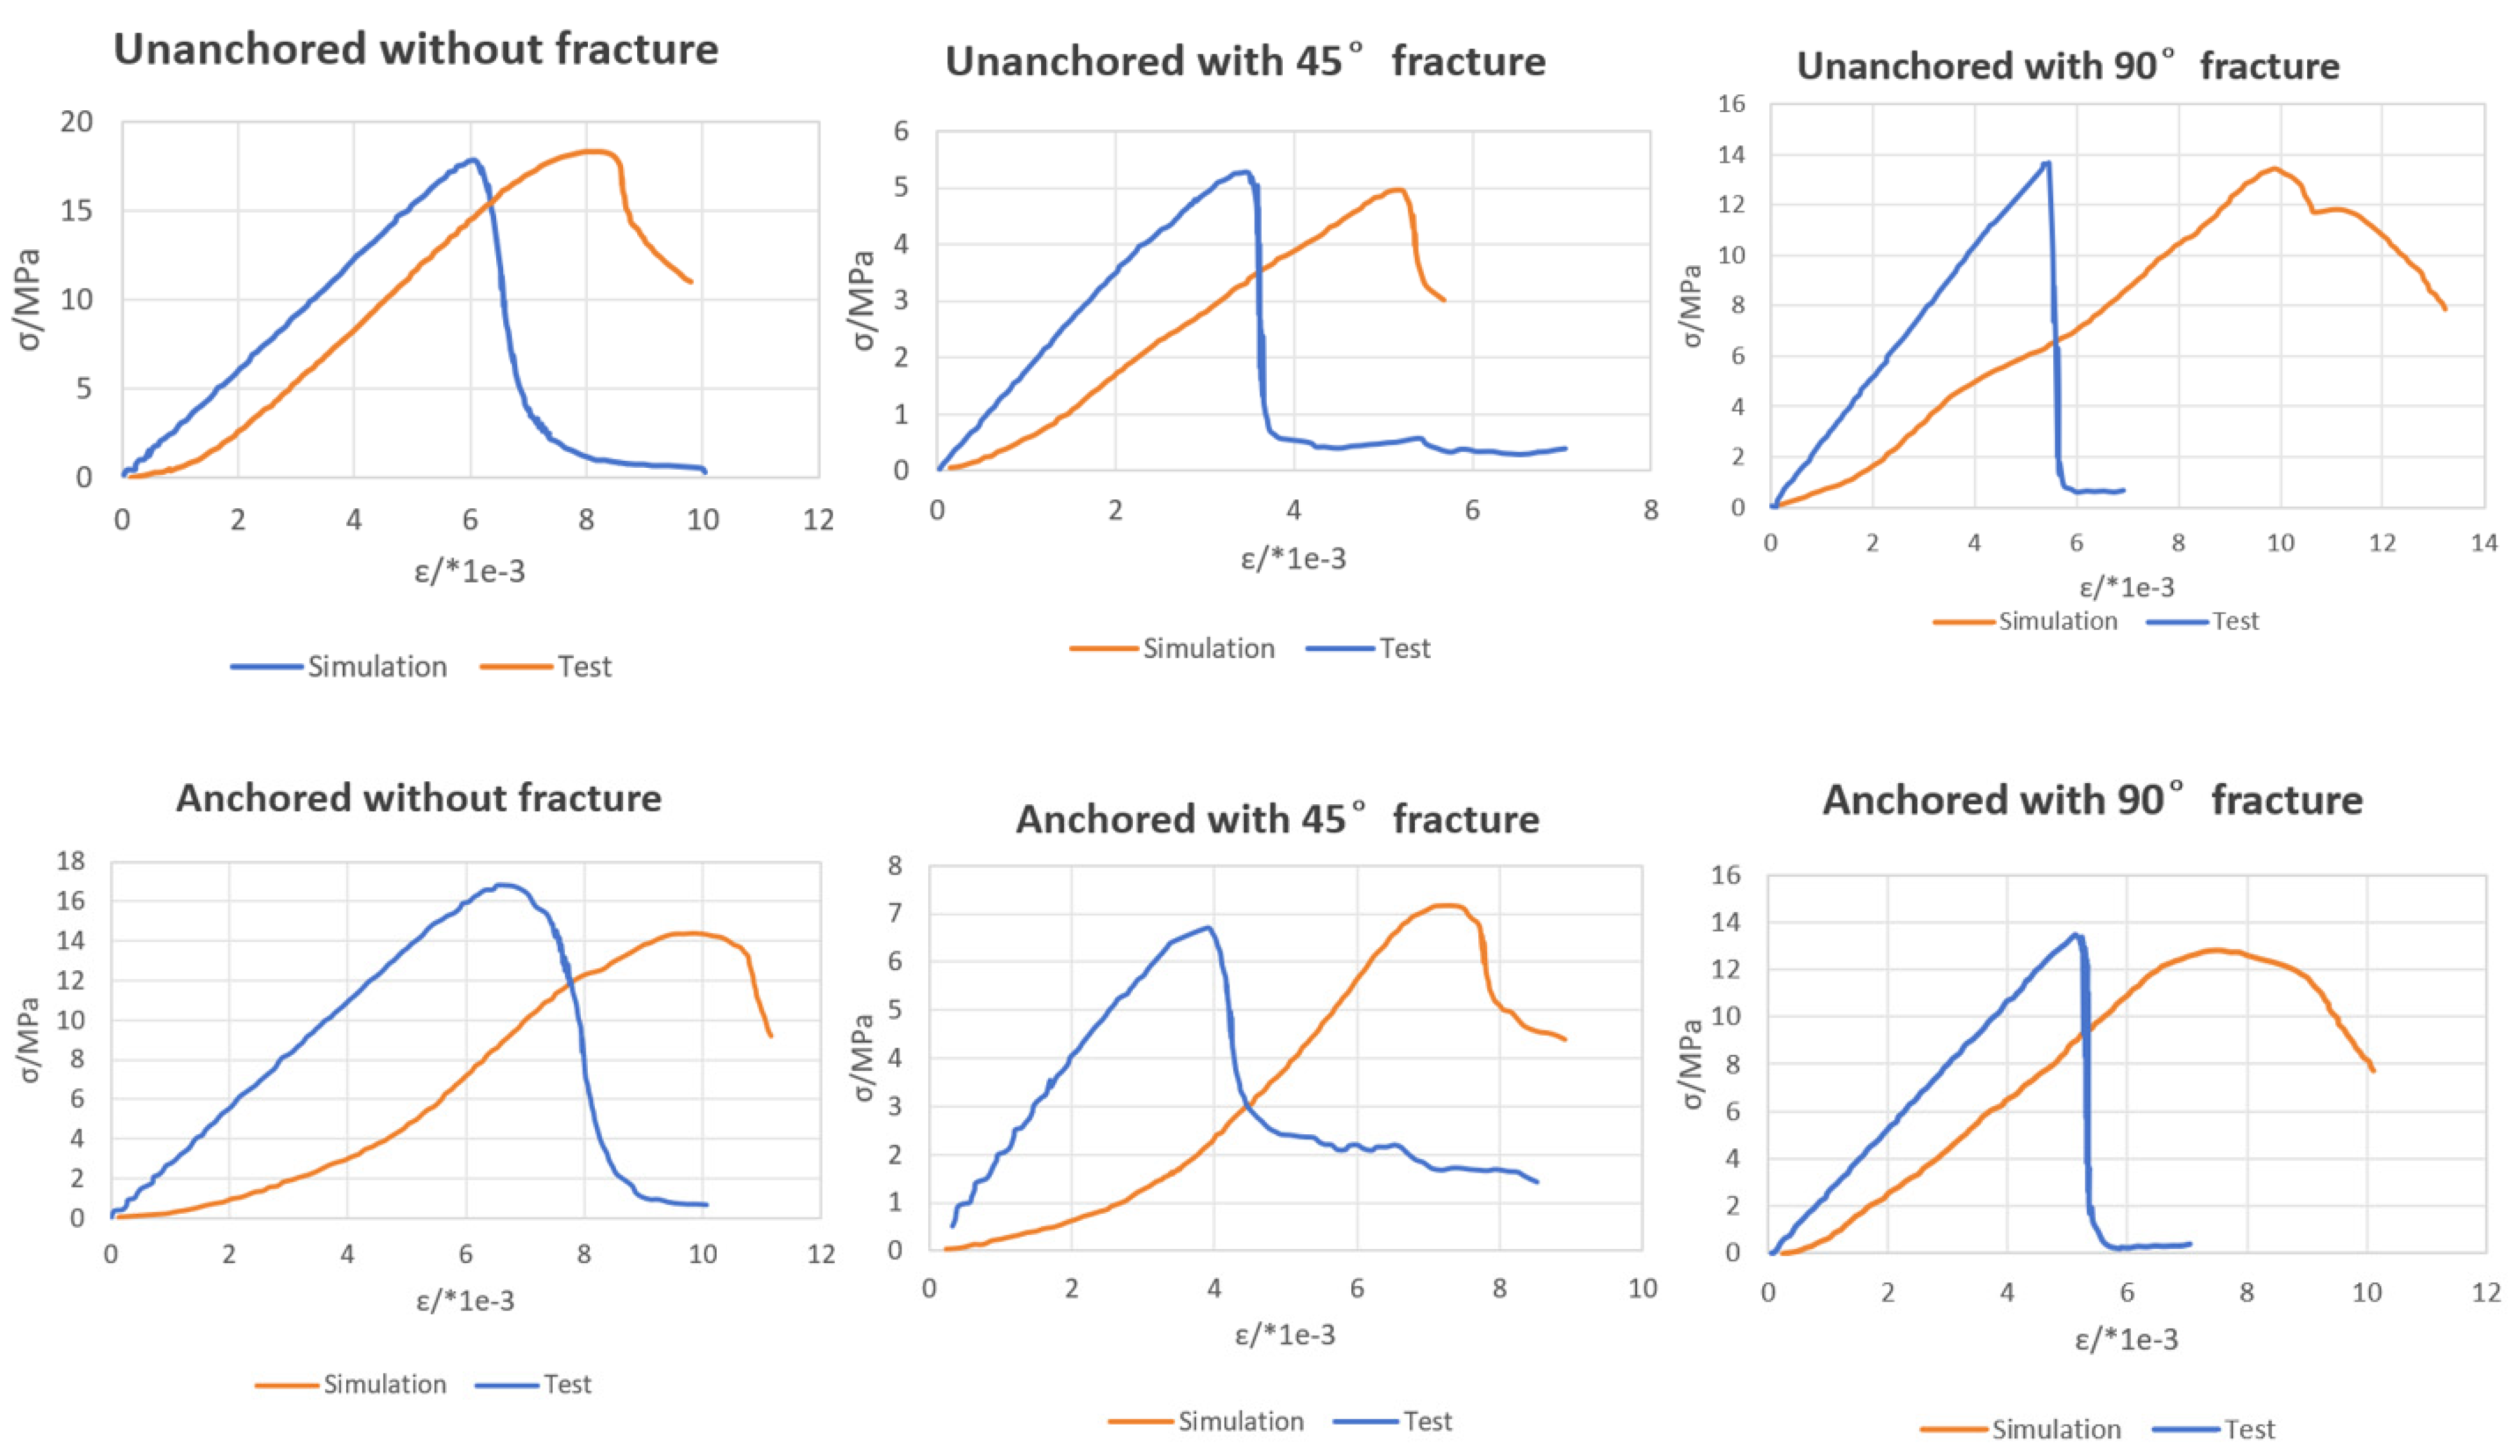
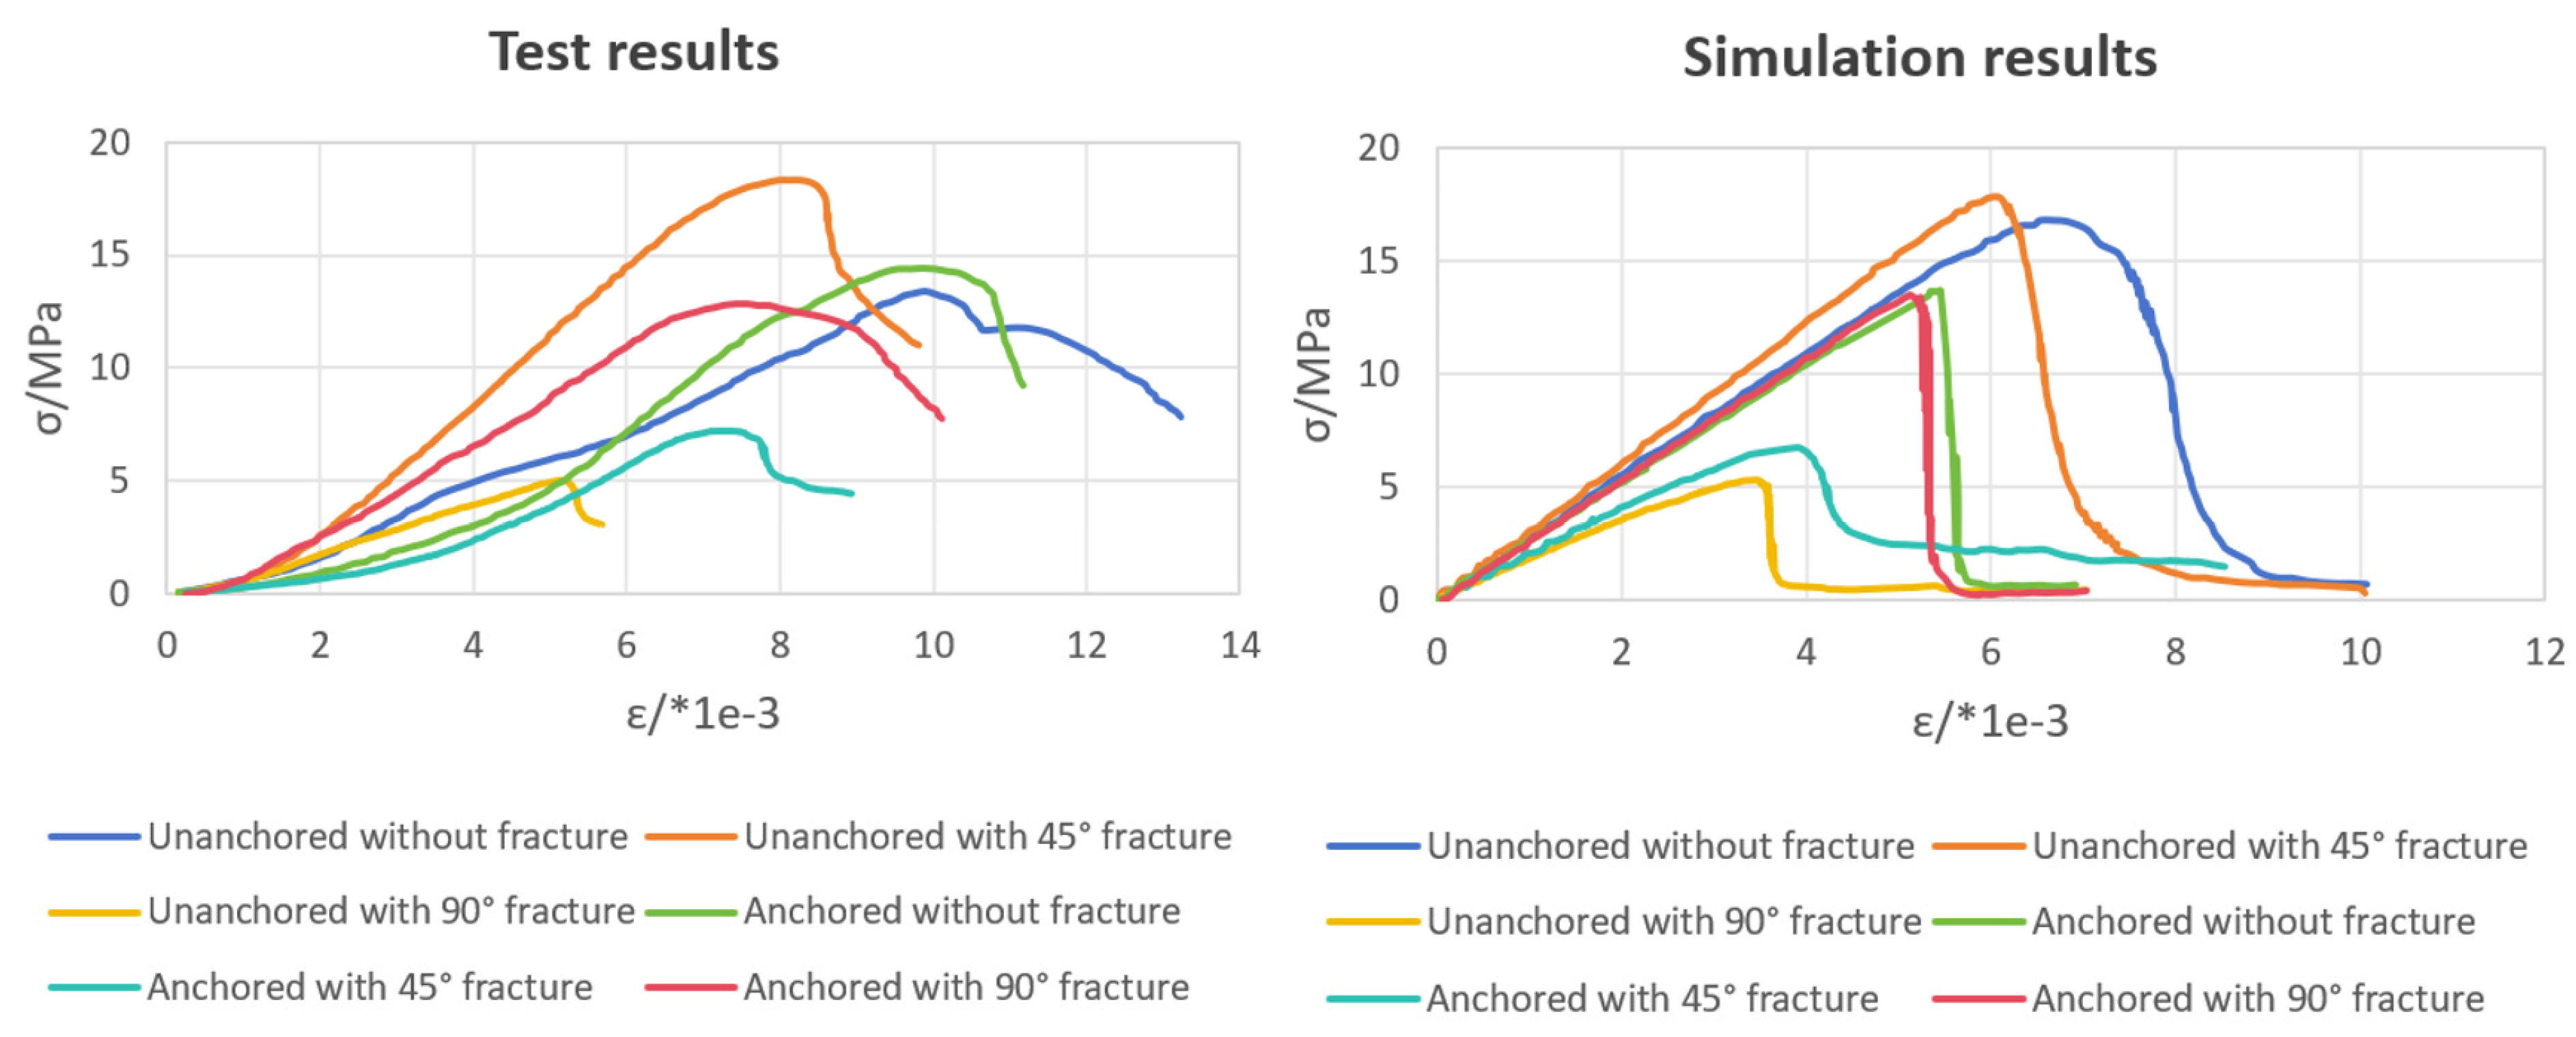
The stress–strain curves obtained from our experimental and numerical simulation processes, as depicted in Figure 9, exhibit certain differences between specimens under different conditions. Unbolted specimens without fractures manifest a degree of plasticity near their peak, followed by a phase of incomplete brittleness during their failure stage. In contrast, unbolted specimens with a 45° fracture dip angle show minimal plasticity near their peak and exhibit a brittle failure with a relatively small strain at failure. Unbolted specimens with a 90° fracture dip angle display a certain degree of plasticity near their peak; however, their stress–strain curves exhibit significant fluctuations during the deformation process, with the failure stage ranging between brittleness and ductility. Unbolted specimens with anchors demonstrate a relatively prolonged plastic phase near their peak, yet exceptions exist, as the failure stage still presents characteristics of incomplete brittleness. Bolted specimens with a 45° fracture dip angle show a degree of plasticity near their peak compared to unbolted specimens, with less pronounced brittleness during the failure stage. Bolted specimens with a 90° fracture dip angle exhibit a plastic phase near their peak, followed by a certain degree of ductility during their failure stage. The presence of anchors enhances their plasticity near their peak and their ductility after the peak on the stress–strain curve.
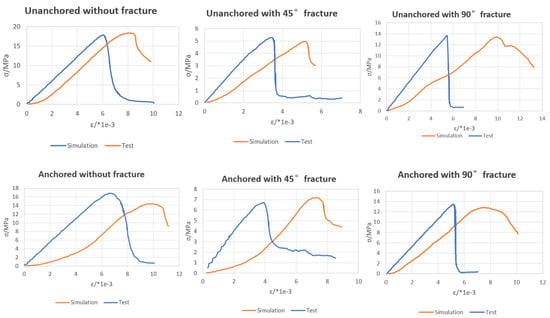
Figure 9.
Stress–strain curves for experimental and numerical simulation results.
Utilizing the aforementioned parameters, simulations were conducted for specimens under six conditions (Figure 10): unbolted without pre-existing fractures, unbolted with a 45° pre-existing fracture dip angle, unbolted with a 90° pre-existing fracture dip angle, bolted without pre-existing fractures, bolted with a 45° pre-existing fracture dip angle, and bolted with a 90° pre-existing fracture dip angle. The stress–strain curves obtained from simulations closely matched the experimental results in terms of peak stress, tangent modulus, and other key data.
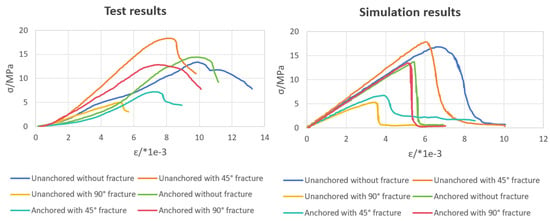
Figure 10.
The stress–strain curves obtained from experimental observations and numerical simulations.
4.5. Analysis of Failure Modes and Crack Development
4.5.1. Laboratory Test Results
- (1)
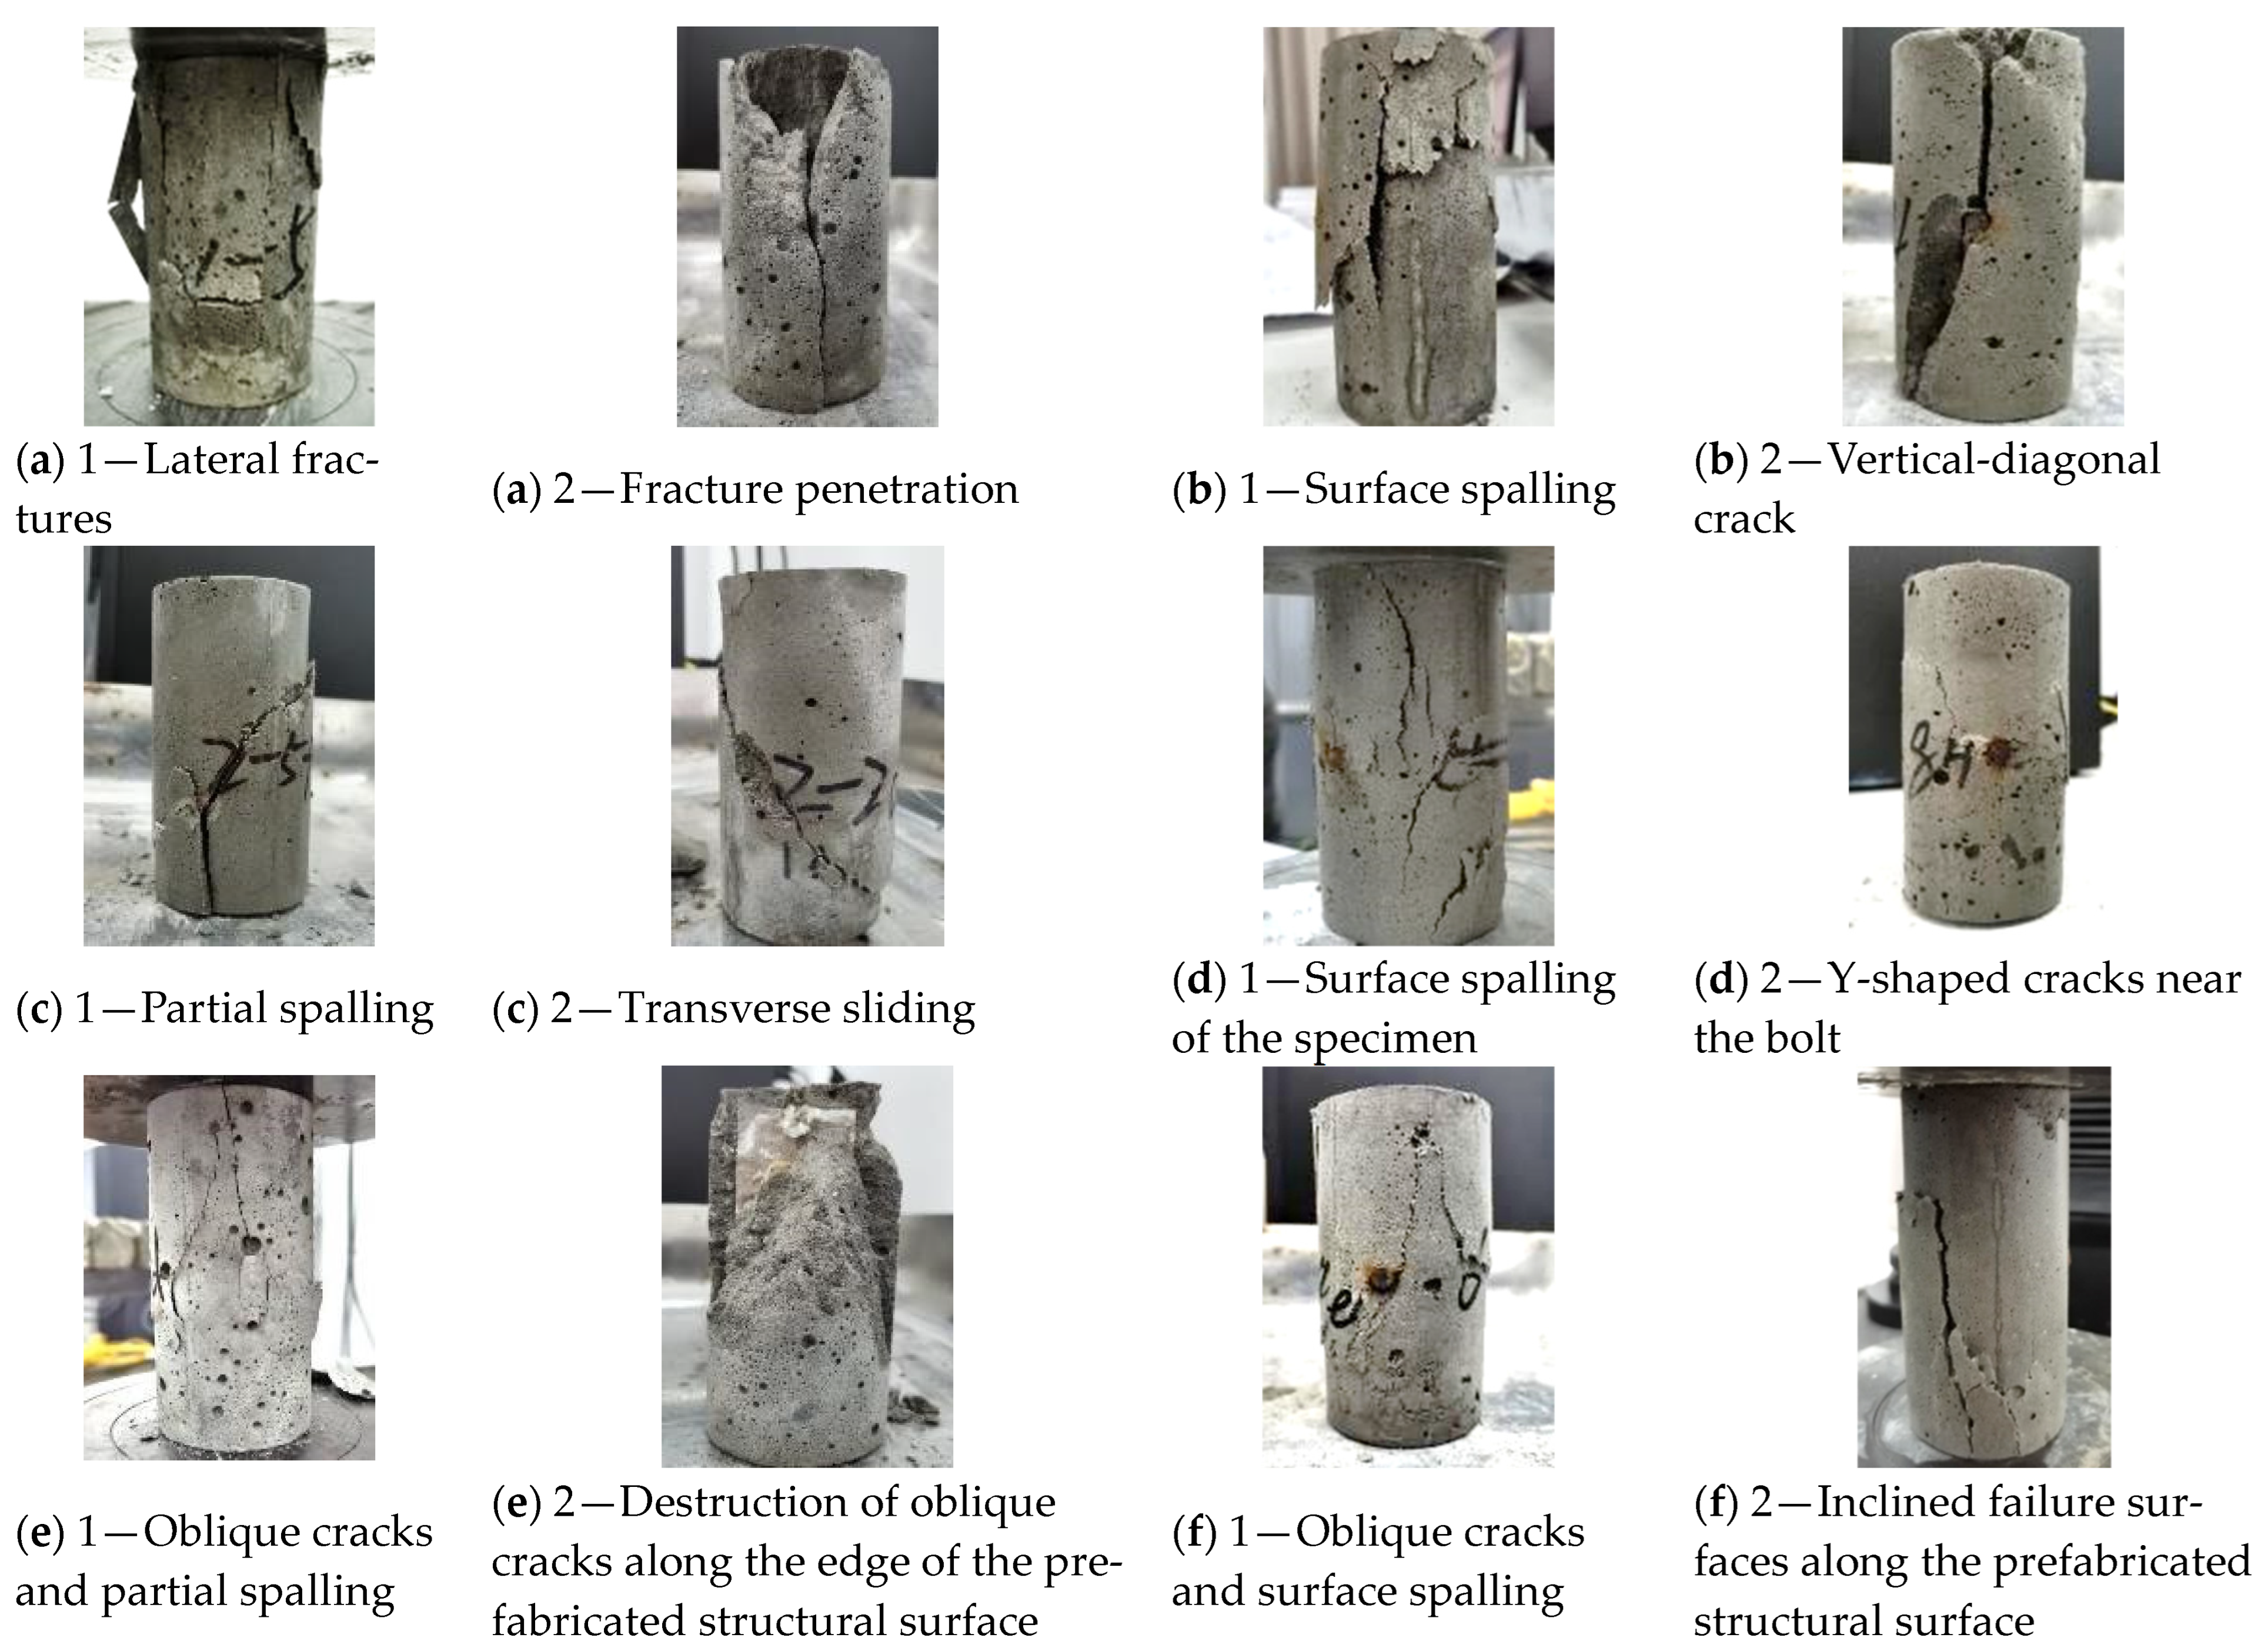
- As shown in Figure 11(a-1), the specimen without bolts or prefabricated fractures exhibits a failure mode characterized by local spalling and overall brittle irregular shear. Fractures initiate from the surface in the form of local tensile-induced vertical wing fractures. As these fractures propagate vertically, adjacent fracture edges intersect to form oblique fractures and even lateral fractures with bulging, some of which progress inward, leading to partial spalling. As illustrated in Figure 11(a-2), the oblique fractures and vertical fractures that have not yet resulted in spalling continue to propagate inward, with larger fractures penetrating the specimen upon failure.
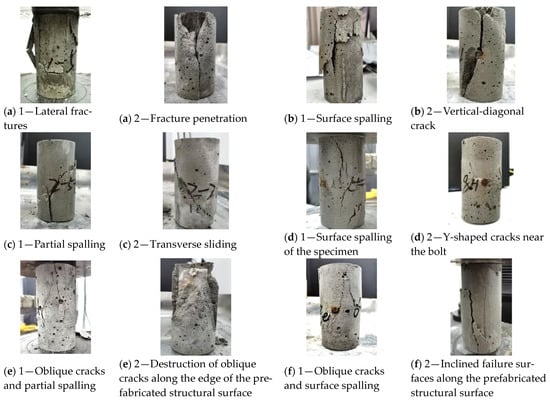 Figure 11. Cracks and failure patterns of specimens (Note: (a) denotes specimens without fractures and bolts, (b) denotes specimens without fractures but with bolts, (c) denotes specimens with a 45° prefabricated fracture and no bolts, (d) denotes specimens with a 45° prefabricated fracture and bolts, (e) denotes specimens with a 90° prefabricated fracture and no bolts, and (f) denotes specimens with a 90° prefabricated fracture and bolts).
 - (2)
- The specimen with bolts but without prefabricated fractures displays a failure mode characterized by local spalling and brittle shear failure developing around the bolt-induced stress concentration zone. As shown in Figure 11(b-1), fractures initiate from the end face and around the bolt-induced stress concentration zone, manifesting as local tensile-induced vertical or oblique wing fractures. Some surface fractures intersect and propagate inward, potentially resulting in spalling. As depicted in Figure 11(b-2), the failure surface typically consists of fractures that independently or mutually communicate through vertical–oblique cracks, oblique–oblique cracks, or Y-shaped cracks formed by the bolt.
- (3)
- In Figure 11(c-1), the specimen with a 45° prefabricated fracture but without bolts exhibits a failure mode characterized by brittle sliding along the prefabricated structural surface. Prior to failure, the specimen also exhibits local tensile-induced vertical wing fractures, some of which have the opportunity to form spalling zones or similar spalling-like morphologies before complete failure. As shown in Figure 11(c-2), near failure, certain parts of the specimen’s surface projected along the long axis of the prefabricated fracture initiate shear fractures, which subsequently extend to form an entire oblique fracture surface, resulting in complete internal sliding along the prefabricated structural surface upon failure.
- (4)
- The specimen with a 45° prefabricated fracture and bolts exhibits a failure mode characterized by brittle sliding along the prefabricated structural surface. This mode includes the development of vertical fractures along the end face, vertical fractures leading to spalling, and oblique fractures induced by the stress concentration zones around the bolt (as shown in Figure 11(d-1,d-2)). Additionally, there are fractures expanding outward from the prefabricated structural surface, with some fractures overlapping and interconnecting. During the specimen’s sliding along the prefabricated structural surface, the bolt anchorage restricts movement. As failure occurs, fractures propagate outward around the bolt, and once the fractures reach a critical size and quantity, the anchorage effect fails, leading to specimen failure.
- (5)
- The specimen with a 90° prefabricated fracture but without bolts exhibits a failure mode characterized by local spalling and overall brittle multi-angle shear. During the fracture development stage, local tensile-induced vertical wing fractures are observed. As these fractures propagate vertically, adjacent fracture edges intersect to form oblique fractures (as shown in Figure 11(e-1)), with some specimens also exhibiting lateral fractures and bulging. The failure mode includes one type of destruction along the prefabricated structural surface and its extensions, and another type of oblique brittle shear failure not along the prefabricated structural surface, as illustrated in Figure 11(e-2).
- (6)
- The specimen with a 90° prefabricated fracture and bolts exhibits a failure mode characterized by local spalling primarily induced by the stress concentration around the bolt and secondarily by developments along the prefabricated structural surface. Fractures initiate from the end face and around the bolt-induced stress concentration zone, manifesting as local tensile-induced vertical or oblique wing fractures. Some surface fractures intersect and propagate inward, potentially leading to spalling (as shown in Figure 11(f-1)). The failure surface typically comprises fractures that independently or mutually communicate through vertical–oblique cracks, oblique–oblique cracks, or Y-shaped cracks formed by the bolt. Fractures developing from the prefabricated structural surface may directly evolve into a penetrating fracture surface or may connect with the main penetrating fracture, resulting in an inclined penetrating failure surface, as depicted in Figure 11(f-2).
4.5.2. Numerical Simulation Results
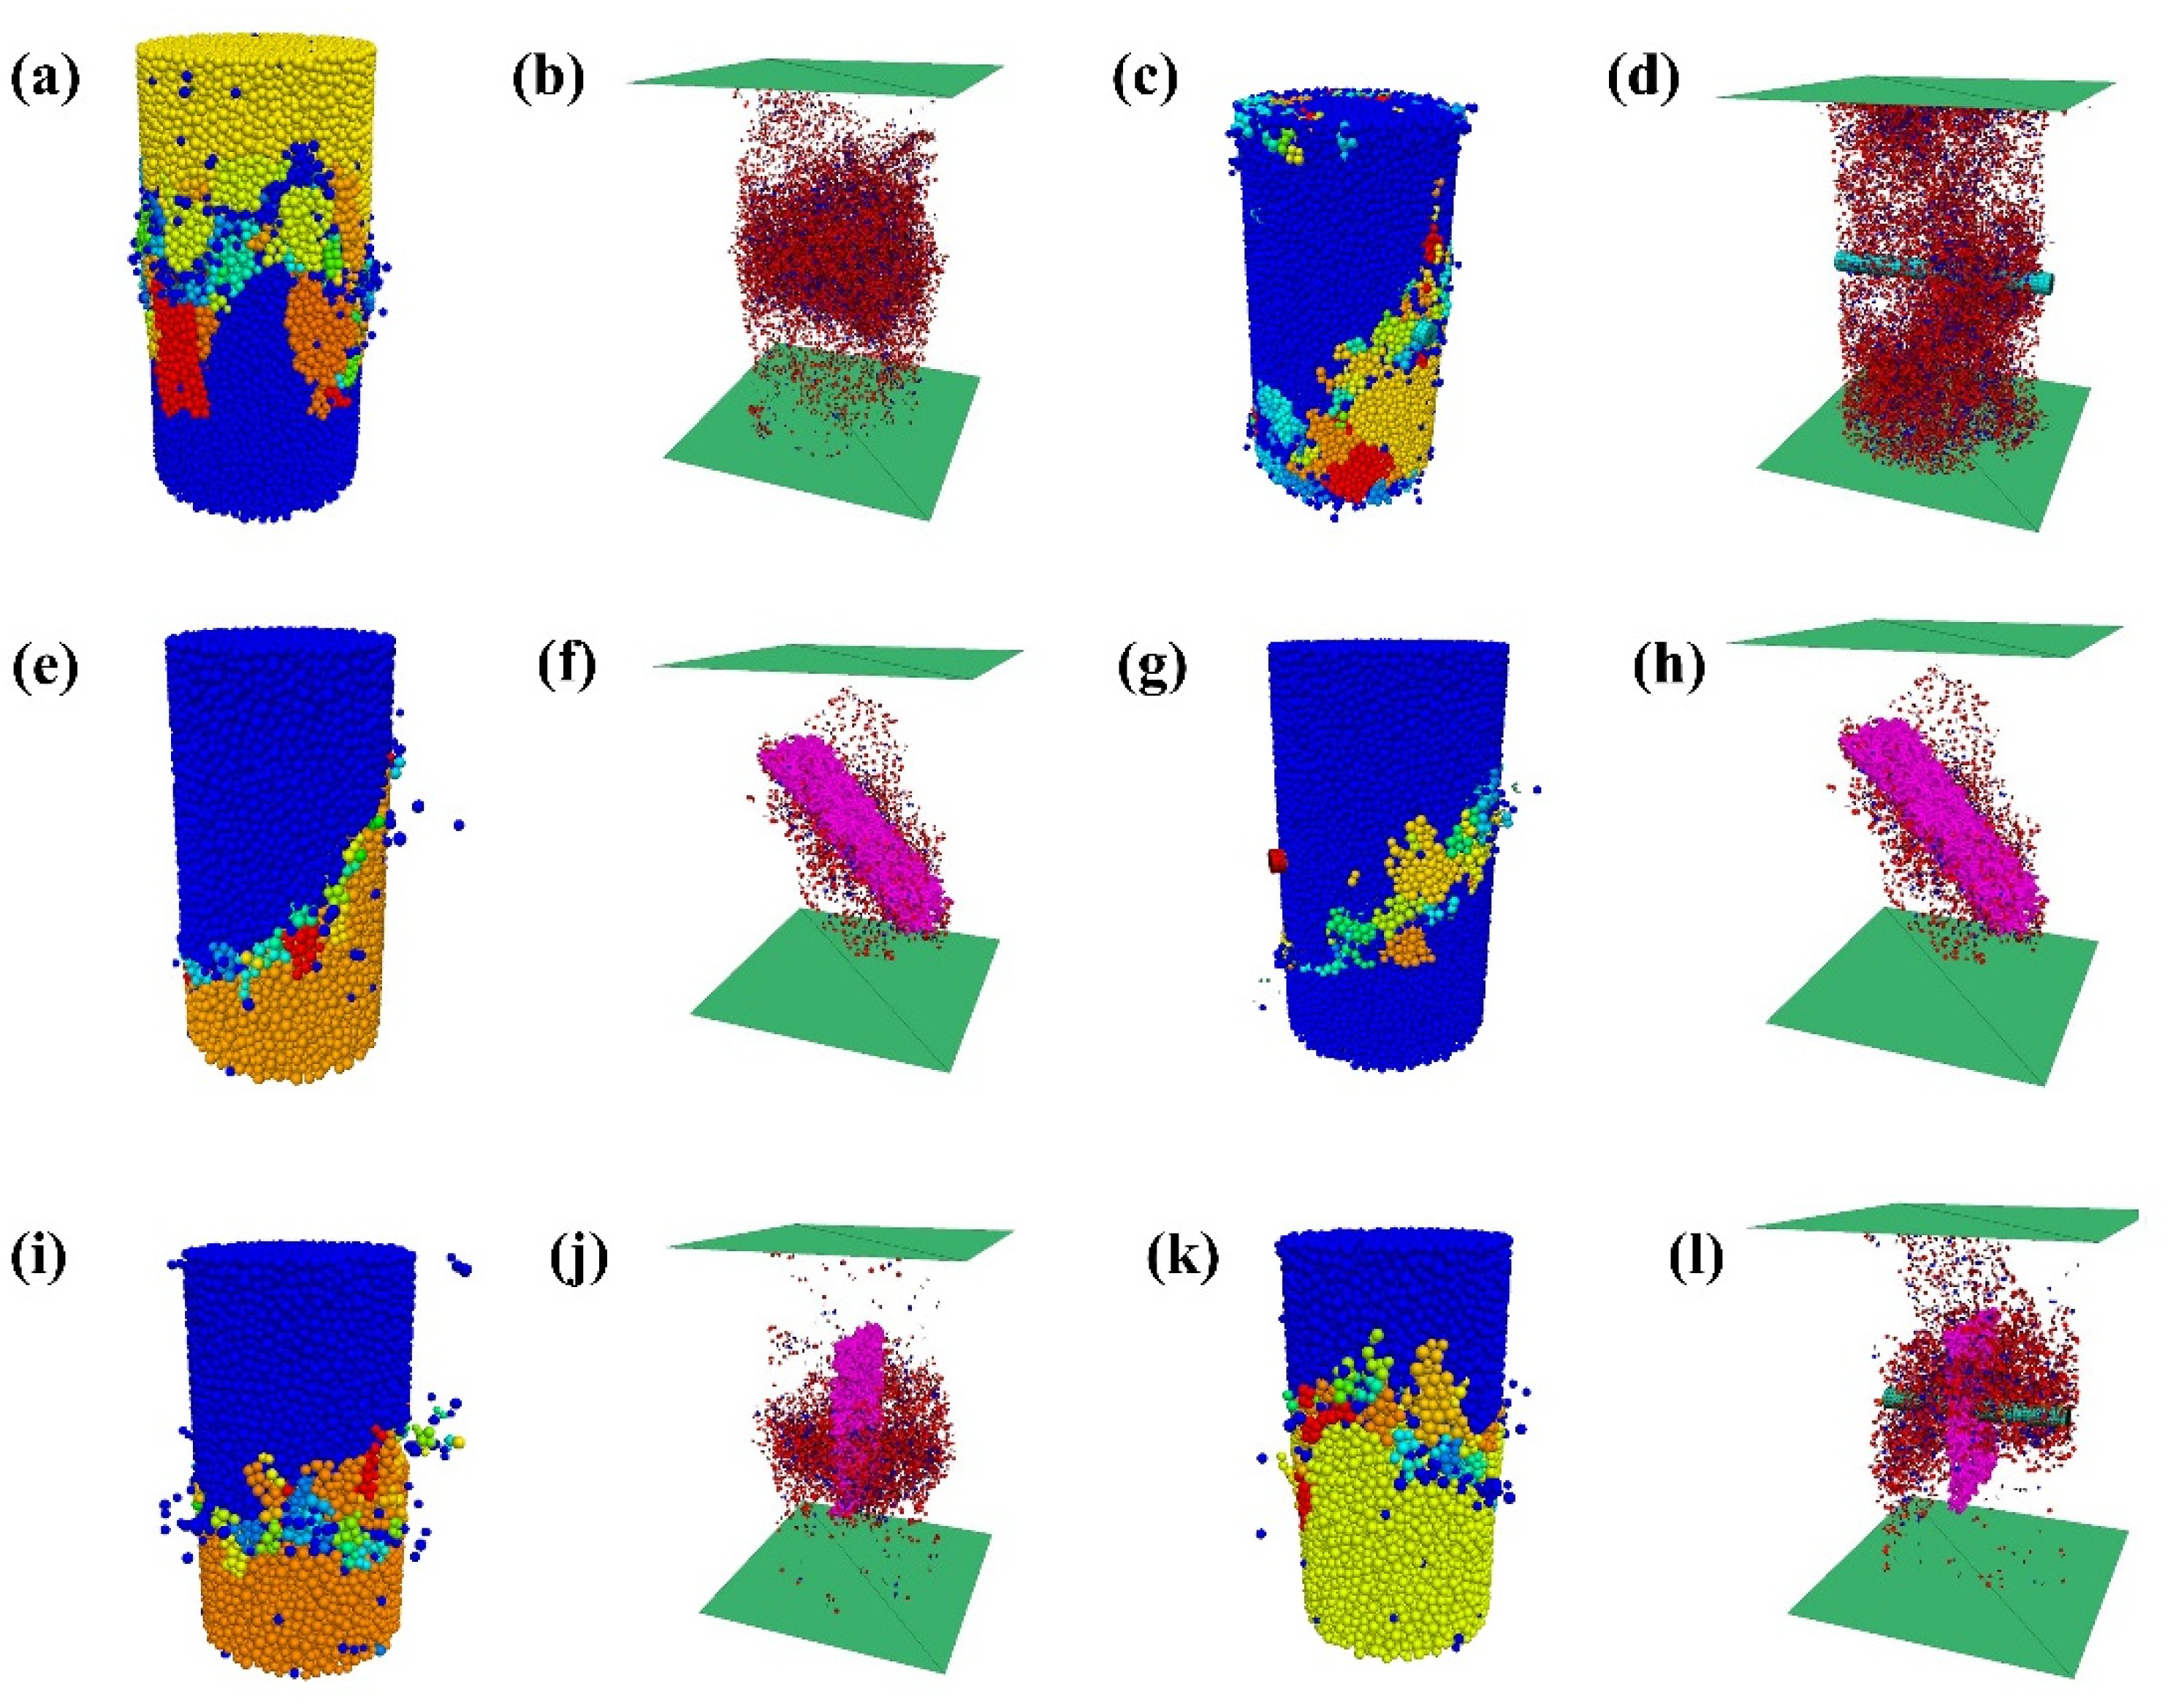
The numerical simulation results align with the experimental findings, demonstrating a significant influence of anchor rods on the failure modes of specimens, as evidenced by the distribution of surface cracks and microcracks illustrated in Figure 12.
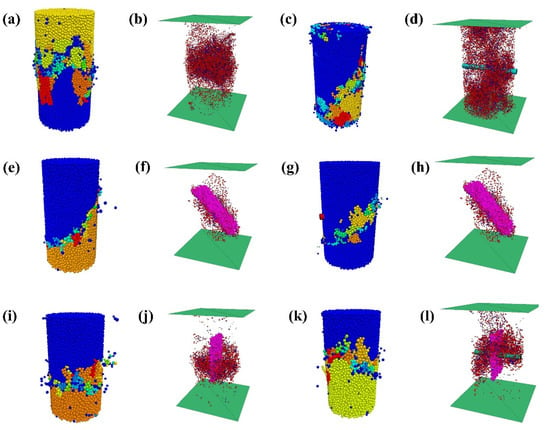
Figure 12.
Distribution of surface cracks and microcracks in specimens, with tension cracks in red and shear cracks in blue: (a,b) the unbolted specimen without fractures, (c,d) the unbolted specimen with a 45° fracture, (e,f) the unbolted specimen with a 90° fracture, (g,h) the bolted specimen without fractures, (i,j) the bolted specimen with a 45° fracture, (k,l) the bolted specimen with a 90° fracture.
- (1)
- In Figure 12a,b, for specimens without anchor rods and no pre-existing cracks, during uniaxial compression, oblique surface cracks and vertical surface cracks are observed, accompanied by spalling regions and occasional bulging spalling in the central area. Internal cracks are predominantly distributed across the inclined section of the breakthrough.
- (2)
- In Figure 12e,f, for specimens with a 45° pre-existing crack, surface cracks during uniaxial compression primarily occur on the inclined section, consistent with the pre-existing structural plane, with internal microcracks extending from the pre-existing structural plane.
- (3)
- Similarly, in Figure 12i,j, for specimens with a 90° pre-existing crack, surface oblique cracks and vertical cracks are observed during uniaxial compression, along with spalling regions, with a plethora of internal microcracks distributed around the pre-existing crack.
- (4)
- In Figure 12c,d, for specimens with anchor rods but no pre-existing cracks, during uniaxial compression, wing cracks extending from the stress concentration zones around the anchor rods are first observed, propagating outward as oblique cracks and vertical cracks. Additionally, localized spalling areas are present, with fracture surfaces intersecting with the stress concentration zones around the anchor rods.
- (5)
- Similarly, in Figure 12g,h, for specimens with anchor rods and a 45° pre-existing crack, the surface cracks during uniaxial compression primarily occur on the inclined section, consistent with the pre-existing structural plane, with internal microcracks extending from both the pre-existing structural plane and stress concentration zones around the anchor rods.
- (6)
- In Figure 12k,l, for specimens with anchor rods and a 90° pre-existing crack, during uniaxial compression, wing cracks extending from the stress concentration zones around the anchor rods are observed, propagating outward as oblique cracks and vertical cracks, with localized spalling areas. Internal microcracks originate from both the pre-existing structural plane and stress concentration zones around the anchor rods.
The numerical simulation results indicate a more pronounced occurrence of localized spalling in specimens without anchor rods, whereas specimens with anchor rods exhibit stress concentration phenomena around the anchor rods, leading to the formation of long cracks and breakthrough cracks. Internal microcracks predominantly initiate in the vicinity of the anchor rods and the pre-existing structural plane, with tension cracks outnumbering shear cracks significantly.
5. Conclusions
This study conducted experimental research and a numerical simulation verification on specimens of rock-like materials under different crack conditions, and with or without anchor rods. The main conclusions drawn are as follows:
- (1)
- The angle of pre-existing fractures significantly influences the strength of rocks, with their strength ranking consistently as follows: specimens with 45° fractures < specimens with 90° fractures < intact specimens. Stress concentration occurs around the bolt, which weakens the compressive performance of intact specimens but enhances the strength of specimens containing fractures. Additionally, the bolt induces plasticity at the specimen’s peak, followed by post-peak ductility.
- (2)
- Freeze–thaw cycles notably degrade the compressive strength of specimens without cracks and with 90° pre-existing cracks, with a more pronounced weakening effect observed in specimens without anchor rods. The fitting line slopes of specimens without cracks and without anchor rods, specimens without cracks and with anchor rods, specimens with 90° pre-existing cracks and without anchor rods, and specimens with 90° pre-existing cracks and with anchor rods are −0.259, −0.134, −0.197, and −0.153, respectively. However, the effect of freeze–thaw cycles on specimens with 45° pre-existing cracks is less significant, indicating a weaker weakening effect on the strength of low-water-content pre-existing weak structural plane rocks.
- (3)
- The failure modes of specimens are influenced by the interaction between their pre-existing cracks and anchor rods. Both specimens with 45° pre-existing cracks and anchor rods and specimens without cracks and anchor rods exhibit sliding failure along the pre-existing crack plane, while specimens without cracks and with 90° pre-existing cracks, under no-anchor conditions, exhibit external spalling and internal large-angle shear failure. In terms of crack development, various types of specimens exhibit vertical or oblique wing cracks along the specimen surface, with specimens with 45° pre-existing cracks also exhibiting shear cracks generated by the extension of pre-existing cracks.
- (4)
- A coupled model combining the PFC3D discrete element method and FLAC3D finite difference method was employed to simulate the unfrozen experimental conditions. The specimen material was modelled using a parallel bonded constitutive model, the pre-existing structural plane was modelled using a smooth joint constitutive model, and the anchor rods were modelled using a linear elastic constitutive model. The simulation results are in good agreement with the experimental data.
- (5)
- Comparing the results of numerical simulations, specimens without bolts exhibit more pronounced localized spalling, whereas specimens with bolts show stress concentrations around the bolt, resulting in the formation of long and penetrating cracks. Internal microcracks within the specimens generally initiate from the bolt and pre-existing structural surfaces, with tension cracks being more prevalent than shear cracks.
Author Contributions
Conceptualization, F.H. and Y.C.; Writing—original draft, F.H.; Writing—review & editing, Y.C.; Visualization, F.H.; Funding acquisition, Y.C. All authors have read and agreed to the published version of the manuscript.
Funding
This research received no external funding.
Institutional Review Board Statement
Not applicable.
Informed Consent Statement
Not applicable.
Data Availability Statement
The data presented in this study are available on request from the corresponding author.
Acknowledgments
Lijie Zhu, Shaokun Chen, Jinbiao Mo and the Underground Space Engineering Group are acknowledged for the research.
Conflicts of Interest
The authors declare that they have no known competing financial interests or personal relationships that could have appeared to influence the work reported in this paper.
References
- Elumalai, V.; Nwabisa, D.P.; Rajmohan, N. Evaluation of high fluoride contaminated fractured rock aquifer in South Africa—Geochemical and chemometric approaches. Chemosphere 2019, 235, 1–11. [Google Scholar] [CrossRef] [PubMed]
- Guo, B.; Zang, W.; Yang, F.; Han, B.; Chen, S.; Liu, Y.; Yang, X.; He, T.; Chen, X.; Liu, C.; et al. Spatial and temporal change patterns of net primary productivity and its response to climate change in the Qinghai-Tibet Plateau of China from 2000 to 2015. J. Arid. Land 2020, 12, 1–17. [Google Scholar] [CrossRef]
- Abdolghanizadeh, K.; Hosseini, M.; Saghafiyazdi, M. Effect of freezing temperature and number of freeze–thaw cycles on mode I and mode II fracture toughness of sandstone. Theor. Appl. Fract. Mech. 2020, 105, 102428. [Google Scholar] [CrossRef]
- Liu, Y.; Dai, F. A review of experimental and theoretical research on the deformation and failure behavior of rocks subjected to cyclic loading. J. Rock Mech. Geotech. Eng. 2021, 13, 1203–1230. [Google Scholar] [CrossRef]
- Lindner, F.; Wassermann, J.; Igel, H. Seasonal freeze-thaw cycles and permafrost degradation on Mt. Zugspitze (German/Austrian Alps) revealed by single-station seismic monitoring. Geophys. Res. Lett. 2021, 48, e2021GL094659. [Google Scholar] [CrossRef]
- Yang, M.; Wang, S.; Yao, T.; Gou, X.; Lu, A.; Guo, X. Desertification and its relationship with permafrost degradation in Qinghai-Xizang (Tibet) plateau. Cold Reg. Sci. Technol. 2004, 39, 47–53. [Google Scholar] [CrossRef]
- Cao, R.-H.; Cao, P.; Lin, H.; Ma, G.; Chen, Y. Failure characteristics of intermittent fissures under a compressive-shear test: Experimental and numerical analyses. Theor. Appl. Fract. Mech. 2018, 96, 740–757. [Google Scholar] [CrossRef]
- Morgan, S.P.; Johnson, C.A.; Einstein, H.H. Cracking processes in Barre granite: Fracture process zones and crack coalescence. Int. J. Fract. 2013, 180, 177–204. [Google Scholar] [CrossRef]
- Sarfarazi, V.; Ghazvinian, A.; Schubert, W.; Blumel, M.; Nejati, H.R. Numerical Simulation of the Process of Fracture of Echelon Rock Joints. Rock Mech. Rock Eng. 2013, 47, 1355–1371. [Google Scholar] [CrossRef]
- Mohammadi, H.; Pietruszczak, S. Description of damage process in fractured rocks. Int. J. Rock Mech. Min. Sci. 2019, 113, 295–302. [Google Scholar] [CrossRef]
- Wu, G.S.; Yu, W.J.; Zuo, J.P.; Du, S.H. Experimental and theoretical investigation on mechanisms performance of the rock-coal-bolt (RCB) composite system. Int. J. Min. Sci. Technol. 2020, 30, 759–768. [Google Scholar] [CrossRef]
- Li, T.; Pei, X.; Wang, D.; Huang, R.; Tang, H. Nonlinear behavior and damage model for fractured rock under cyclic loading based on energy dissipation principle. Eng. Fract. Mech. 2019, 206, 330–341. [Google Scholar] [CrossRef]
- Yahaghi, J.; Liu, H.; Chan, A.; Fukuda, D. Experimental and numerical studies on failure behaviours of sandstones subject to freeze-thaw cycles. Transp. Geotech. 2021, 31, 100655. [Google Scholar] [CrossRef]
- Niu, Y.; Zhou, X.; Zhang, J.; Qian, Q. Experimental study on crack coalescence behavior of double unparallel fissure-contained sandstone specimens subjected to freeze-thaw cycles under uniaxial compression. Cold Reg. Sci. Technol. 2019, 158, 166–181. [Google Scholar] [CrossRef]
- Liu, Y.; Cai, Y.; Huang, S.; Guo, Y.; Liu, G. Effect of water saturation on uniaxial compressive strength and damage degree of clay-bearing sandstone under freeze-thaw. Bull. Eng. Geol. Environ. 2020, 79, 2021–2036. [Google Scholar] [CrossRef]
- Vlahou, I.; Worster, M.G. Freeze fracturing of elastic porous media: A mathematical model. Proc. R. Soc. A Math. Phys. Eng. Sci. 2015, 471, 2175. [Google Scholar] [CrossRef]
- Chen, L.; Wu, P.; Chen, Y.; Zhang, W. Experimental Study on Physical-mechanical Properties and Fracture Behaviors of Saturated Yellow Sandstone Considering Coupling Effect of Freeze-Thaw and Specimen Inclination. Sustainability 2020, 12, 1029. [Google Scholar] [CrossRef]
- Zhang, W.; Song, Y.; Huang, L.; Gong, S. Analytical relations for the mechanical properties of full-length bonded rock bolts when subjected to freeze–thaw processes. Comput. Geotech. 2022, 145, 104667. [Google Scholar] [CrossRef]
- Yuan, J.; Ye, C.; Yang, J.; Xie, Z.; Liu, J.; Wang, S.; Liu, Y. Experimental and numerical investigation on the deterioration mechanism for grouted rock bolts subjected to freeze–thaw cycles. Bull. Eng. Geol. Environ. 2021. prepublish. [Google Scholar] [CrossRef]
- Ju, M.; Li, X.; Li, X.; Zhang, G. A review of the effects of weak interfaces on crack propagation in rock: From phenomenon to mechanism. Eng. Fract. Mech. 2022, 263, 108297. [Google Scholar] [CrossRef]
- Alneasan, M.; Behnia, M.; Bagherpour, R. Applicability of the classical fracture mechanics criteria to predict the crack propagation path in rock under compression. Eur. J. Environ. Civ. Eng. 2020, 24, 1761–1784. [Google Scholar] [CrossRef]
- Saadat, M.; Taheri, A. A numerical approach to investigate the effects of rock texture on the damage and crack propagation of a pre-cracked granite. Comput. Geotech. 2019, 111, 89–111. [Google Scholar] [CrossRef]
- Yu, C.; Tang, S.; Tang, C.; Duan, D.; Zhang, Y.; Liang, Z.; Ma, K.; Ma, T. The effect of water on the creep behavior of red sandstone. Eng. Geol. 2019, 253, 64–74. [Google Scholar] [CrossRef]
Disclaimer/Publisher’s Note: The statements, opinions and data contained in all publications are solely those of the individual author(s) and contributor(s) and not of MDPI and/or the editor(s). MDPI and/or the editor(s) disclaim responsibility for any injury to people or property resulting from any ideas, methods, instructions or products referred to in the content. |
© 2024 by the authors. Licensee MDPI, Basel, Switzerland. This article is an open access article distributed under the terms and conditions of the Creative Commons Attribution (CC BY) license (https://creativecommons.org/licenses/by/4.0/).

