Article

A Method for Evaluating Systematic Risk in Dams with Random Field Theory

1
PowerChina Chengdu Engineering Corporation Limited, No. 1 Huanhua North Road, Chengdu 610072, China
2
State Key Laboratory of Hydraulics and Mountain River Engineering, College of Water Resource & Hydropower, Sichuan University, No. 24 South Section 1, Yihuan Road, Chengdu 610065, China
*
Author to whom correspondence should be addressed.
Appl. Sci. 2024, 14(11), 4349; https://doi.org/10.3390/app14114349
Submission received: 20 March 2024 / Revised: 20 April 2024 / Accepted: 17 May 2024 / Published: 21 May 2024
(This article belongs to the Section Civil Engineering)

Abstract

:
The parameters of gravity dams and foundation materials objectively exhibit spatial variability due to environmental and load influences, which significantly affect the safety status of dam structures. Therefore, a safety risk analysis method for a gravity dam–foundation system based on random field theory is proposed in this paper. Spatial variabilities in materials are particularly considered by using the finite element method. Then, composite response surface equations for the performance function (PF) of strength and stability failure are established, and then, the system failure risk is obtained using the Monte Carlo method. The proposed method solves the problem wherein the effect of spatial variability on failure risk cannot be reflected accurately by the performance function of multi-element sliding paths, and the difficulties in solving the failure risk of the series–parallel system due to multiple failure paths and their complex correlations. The application of a gravity dam shows that the developed method overcomes the disadvantages of the traditional method, such as the homogenization of the spatially random characteristics of parameters and the overestimation of failure risk in the system due to large variance estimation.

1. Introduction

Dams are widely used in the world for irrigation, shipping, power generation, flood control, water supply, etc. The safe operation of dams has long been a great concern for governments and scholars [1,2]. According to the statistics of 142 gravity dam accidents between 1802 and 1998, more than 50% were caused by foundation instability and structure damage [3,4,5,6,7,8], so making sure the long-term safe operation of gravity dams is particularly important. What is more, the parameters of concrete and rock materials in dam–foundation systems objectively exhibit spatial variability due to construction factors, load effects, etc., significantly affecting the structural response and stability safety risks of the dam. Therefore, it is necessary to reasonably evaluate the safety risks of gravity dams on complex foundations considering the spatial variability of concrete and foundation materials.
Dam risk analysis has garnered widespread attention, particularly in areas, such as system risk, stability risk, overtopping risk, etc. [9,10,11,12], one of which is the instability risk of dam–rock foundation systems. The instability of a dam–rock foundation system generally results from pre-existing geological features and uncertainty in the foundation. For a gravity dam foundation, reliability analysis and assessment play a critical role in safety assessment. Thus, much research has been conducted on the reliability analysis of system safety in gravity dams and foundations. Hariri-Ardebili and Pourkamali-Anaraki [13] put forward a finite element method–support vector machine-based hybrid methodology to quantify the reliability of concrete dams. Wei et al. [14] proposed a reliability analysis method for gravity dams based on a probability fuzzy–interval-hybrid model and an improved branch and bound method. Liu et al. [15] developed an advanced first-order second-moment method based on finite elements for the reliability of gravity dam anti-sliding stability. Carvajal et al. [16,17] performed a reliability analysis of a gravity roller-compacted concrete (RCC) dam using Monte Carlo simulation (MCS) and the first-order reliability method (FORM). Tang et al. [18] quantified the 12 risk factors for earth dam failure using a Bayesian network, which was helpful for the development of an intelligent BN modeling framework.
The above studies show that the random variable model is usually adopted in the risk or reliability analysis of concrete gravity dams and foundations [19,20], where the spatial variability of material parameters is homogenized by statistical characteristics. However, the rock mass in the foundation is generally natural material, the engineering characteristics of which are significantly affected by deposition, chemical weathering, physical degradation, hydrothermal change, and loading history, performing obvious spatial variability in the material parameters [21]. Moreover, concrete gravity dams strongly show heterogeneity and stochastic characteristics in their material parameters due to the influences of multiple construction zones, complex construction processes, long construction periods, and difficult maintenance, and they are highly vulnerable to environmental impacts. Rock masses and concrete can behave quite differently from homogeneous material due to the spatial variability of the parameters [22], which further affects the system reliability of the dam and rock foundation.
Recently, some researchers have paid special attention to the spatial variability of dam and foundation materials. Lu et al. [23] and Li et al. [24] determined the influence laws of concrete material parameters on the dynamic response characteristics of gravity dams based on the aspects of damage area distribution, crack length statistics, displacement in the crest, energy dissipation, and parameter sensitivity. Chi et al. [25] performed a stochastic analysis of seepage using three types of random fields, and the application showed that the spatial variability of hydraulic conductivity induces differences using different random fields. However, it should be noted that there are very few studies on dam risk analysis considering the spatial variability of the mechanical parameters of rock masses and concrete. Therefore, this study intends to propose a system risk analysis model and method considering the spatial variability of dams and rock foundations, which lacks investigation and needs to be urgently solved.
The purpose of this paper is to study the key technologies and methods of systematic risk analysis used for dams a complex foundations, considering the spatial variability of the mechanical parameters of rock masses and concrete. The main contents of the current research are arranged as follows: (a) studying the simulation method of the spatial variability of rock masses and concrete based on random field theory and the midpoint method; (b) constructing composite response surface equations (RSEs) for strength and stability failure performance function considering the spatial variability of parameters and putting forward a calculation method and technical process for systematic failure risk using the Monte Carlo method; and c) by taking a concrete gravity dam–rock foundation system as an example, the applicability and rationality of the proposed method in this paper are analyzed and discussed.

2. A Finite Element Simulation Method for Gravity Dams Considering the Spatial Variability of Parameters

For geotechnical engineering projects like the complex foundations of gravity dams, the influences of faults, joints, and fissures in the foundation cannot be ignored. In this study, a random field theory-based spatial variability simulation method is introduced to describe the uncertainties of parameters in gravity dams that can be achieved with the midpoint method. As we know, the parameters of dam bodies and foundation materials mostly follow a normal or log-normal distribution [26], so the normal and log-normal correlation random field simulation methods are put forward, and they are applied to a concrete gravity dam with a complex foundation.
According to the midpoint method, the two-dimensional dam–rock foundation system model needs to be discretized into n elements (V1, V2, …, Vi, …, Vn), and their center point is defined as Xi (i = 1, 2, …, n). In this study, the spatial variability of mechanical parameters in the rock and concrete foundation is determined using an autocorrelation function, with an exponential autocorrelation function being adopted [27,28,29]:
ρ i , j = exp ( x i x j L x + y i y j L y )
where ρi,j stands for the parameters’ autocorrelation coefficient in two arbitrary elements: i, j; xi and yi stand for the i element’s x- and y-coordinates; xj and yj stand for the j element’s x- and y-coordinates; and Lx and Ly stand for the autocorrelation distances in the x- and y-directions.
Firstly, according to the coordinate information, Xi (i = 1, 2, …, n) in the dam–rock foundation system and the exponential autocorrelation function (Equation (1)), the autocorrelation coefficient matrix ρn×n can be expressed:
ρ n × n = ρ 11 ρ 12 ρ 1 n ρ 21 ρ 22 ρ 2 n ρ n 1 ρ n 2 ρ n n
Secondly, the autocorrelation coefficient matrix, ρn×n, can be decomposed based on the Cholesky decomposition method [30]:
ρ n × n = B n × n T B n × n
where Bn×n is an upper triangular matrix.
Then, an independent standard normal distribution random sequence matrix, Am×n, is generated; then, a linear transformation for matrix Am×n is conducted based on the linear transformation invariance of normal random variables:
D m × n = A m × n B n × n
where n stands for the number of elements, and m stands for the sampling time.
Lastly, a normal or log-normal distribution sampled matrix, Xij, satisfying the autocorrelation coefficient is expressed as
X i j = σ × D i j + μ x s a t i s f i e s   t h e   n o r m a l   d i s t r i b u t i o n exp σ ln x × D i j + μ ln x x s a t i s f i e s   t h e   l o g n o r m a l   d i s t r i b u t i o n
σ ln x = ln ( 1 + α 2 ) μ ln x = ln μ σ ln x 2 2
where μ and σ stand for the mean and standard deviation of x, respectively; α stands for the coefficient of variation, which is α =σ/μ; σlnx and μlnx stand for the mean and standard deviation of the normal distribution corresponding to the logarithmic normal variable, X, respectively.

3. Risk Analysis Method for Gravity Dams Considering the Spatial Variability of Parameters

3.1. Construction of Performance Functions for Strength and Stability Failure

The rock foundation under a gravity dam has complex stress states, failure mechanisms, and failure paths. The performance functions of dam–foundation systematic failure should be constructed by using critical failure paths with a consideration of material properties, constitutive relations, and failure criteria. In this paper, the load increment method is adopted to search the critical failure paths of the gravity dam–foundation system.
When conducting a safety risk analysis of gravity dams, strength failure and stability failure are the main two critical failure modes for gravity dams [31]. The yield failure of concrete and rock under stress and the sliding force of the foundation surface or deep sliding surface greater than the resistance force both belong to the ultimate bearing capacity limit state. Therefore, the strength failure of the dam body and the stability of the dam foundation can be expressed using corresponding strength criteria and shear resistance formulas in the finite element analysis.
For brittle materials like rock and concrete, the Drucker–Prage criterion is commonly adopted to construct the performance function, G1(X), of strength failure, that is
G 1 X = k a I 1 J 2
I 1 = σ 1 + σ 2 + σ 3
J 2 = 1 6 [ σ 1 σ 2 2 + σ 2 σ 3 2 + σ 3 σ 1 2 ]
where a and k are the constants related to cohesion, c, and the internal friction angle, φ, of rock materials; I1 is the first invariant function of the stress tensor; J2 is the second invariant of the stress deviator; and σ1, σ2, and σ3 are the stresses in three directions.
For the stability failure of a complex foundation, its performance function, G2(X)), can be constructed by
G 2 X = i = 1 n f i σ i + c i l i i = 1 n τ i l i
where n stands for the element number of a sliding channel; σi and τi stand for the normal and shear stress of element i, respectively; f i and ci stand for the frictional coefficient and cohesion of element i, respectively; and li stands for the length of element i along the direction of the sliding path.
However, the strength and stability performance functions of gravity dams established based on Equations (7)~(10) are high-order multivariate implicit functions of random variables, which cannot be directly used for engineering risk analysis. To solve this problem, this article adopts the quadratic response surface method (RSM) with higher simulation accuracy, which does not consider cross-terms, to construct the performance functions considering the spatial variability of parameters.
For the strength failure, the RSE of the performance function for the kth element of the mth failure path is
G 1 ( m , k ) X = k a I 1 J 2 = a 0 1 + i = 1 n b i 1 X i + i = 1 n d i 1 X i 2
G 2 ( k ) X = i = 1 n f i σ X i + c i l i i = 1 n τ X i l i
σ X = a 0 2 + i = 1 m b i 2 X i + i = 1 m d i 2 X i 2
τ X = a 0 3 + i = 1 m b i 3 X i + i = 1 m d i 3 X i 2
where G2(k)(X) is the composite RSE of the performance function for the kth stability failure path; X is the random variable of x1, x2, …, xn; and a 0 2 , b i 2 , d i 2   a 0 3 , b i 3 , and d i 3 are the parameters of the RSE to be solved.

3.2. MC Method for Calculating System Failure Probability

For a complex dam–rock foundation system, there are many failure paths, which leads to great difficulties in determining the correlation among failure paths and solving the reliability of series and parallel systems (Figure 1). To solve these problems, an agent model of the performance function for strength and stability failure is established. According to the spatial variability of the mechanical parameters of rock mass and concrete, the failure probability of the rock foundation system of the gravity dam and each critical failure path is calculated through the overall simulation using the MC method.
For a dam–rock foundation system with n failure paths, the failure events of n failure paths are defined as A1, A2, …, and An, and the failure probability, Pfi, of the ith failure path is
P f i = P ( A i )
If n failure paths belong to the parallel system, then the parallel system failure probability, P f P , can be expressed by
P f P = P ( A 1 A 2 A n )
For the convenience of calculation, an indicative function is pre-set:
I F x = 1 , i = 1 n A i 0 , i = 1 n A ¯ i
Therefore, the parallel system failure probability, P f P , is
P f P = 1 N j = 1 N I F x j
where N is the total amount of MC sampling; F(x)j is the value of performance function corresponding to the jth sampling.
If n failure paths belong to the series system, then the system failure probability, P f S , can be expressed by
P f S = P ( A 1 A 2 A n ) = i = 1 n P ( A i ) 1 i < j n P ( A i A j ) + 1 i < j < k n P ( A i A j A k ) + + ( 1 ) n 1 P ( A 1 A 2 A n )
Similarly, another indicative function is established:
I F x = 1 , i = 1 n A i 0 , i = 1 n A ¯ i
Therefore, the series system failure probability, P f S , is
P f S = 1 N j = 1 N I F x j
Then, the system failure probability can be calculated using the MC method according to Equations (18) and (21); the solution’s technical flow is shown in Figure 2.

4. Case Study

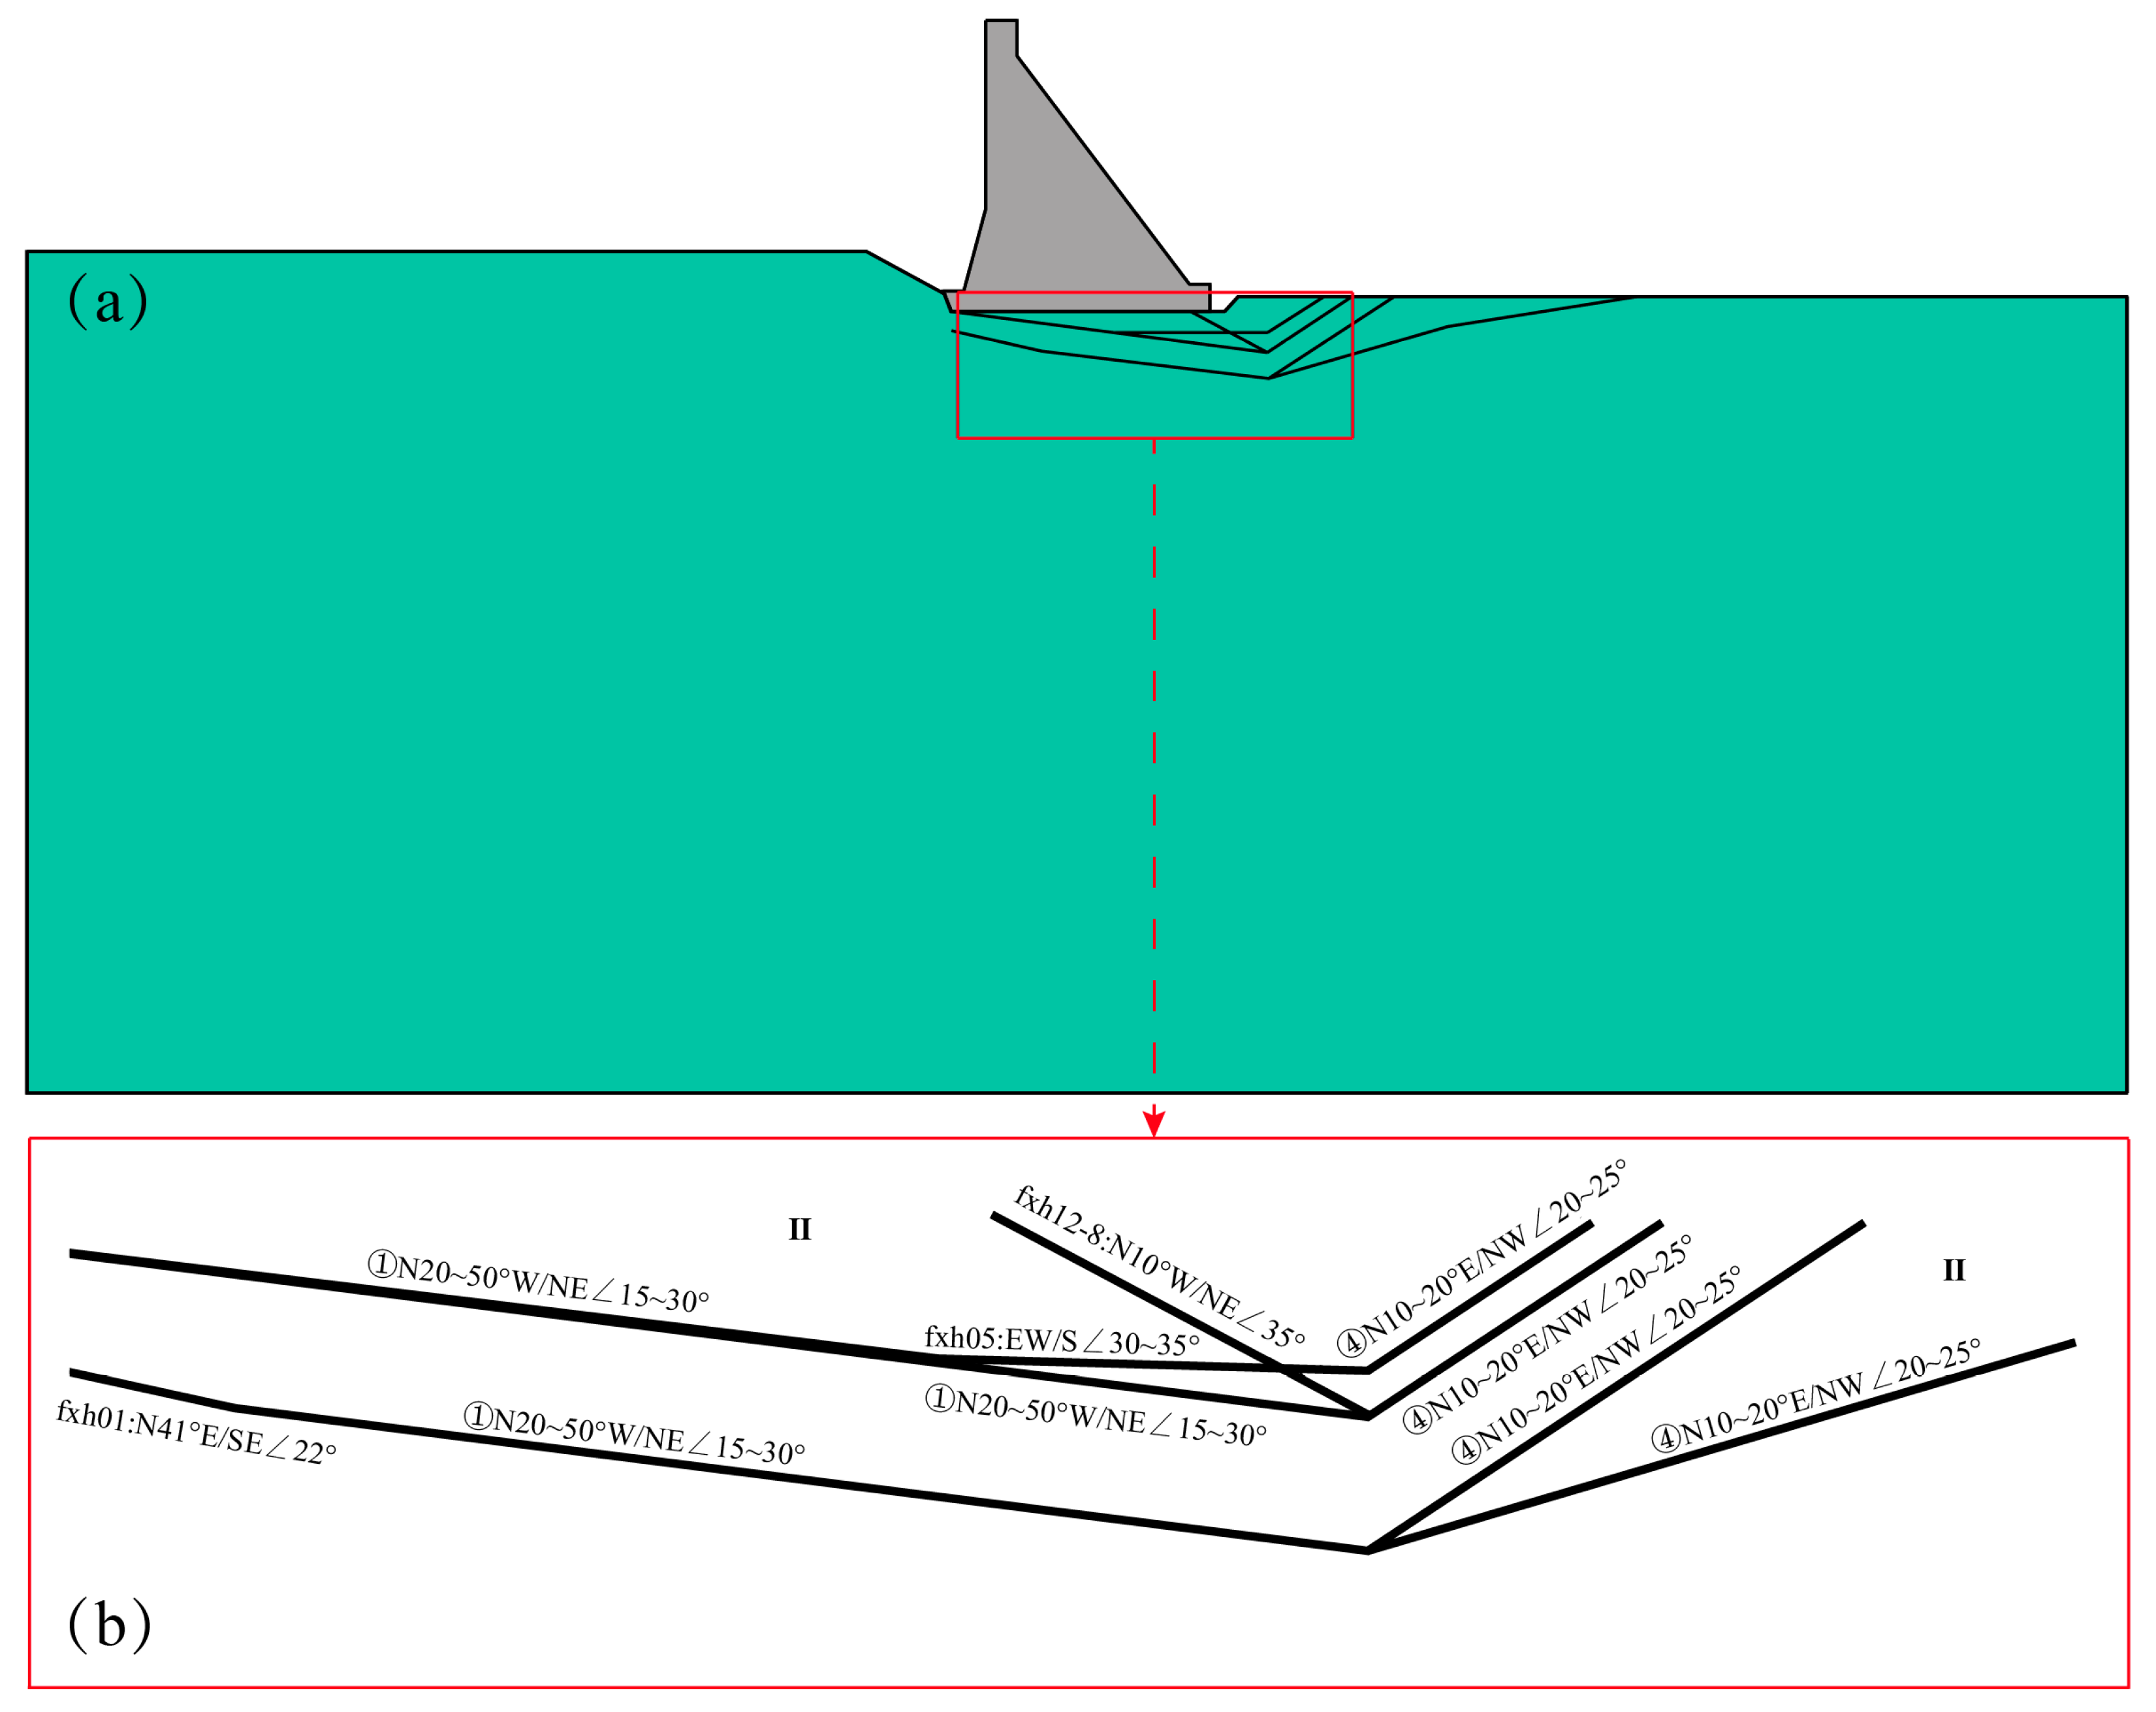
4.1. Project Overview and Geological Condition

The complex rock foundation and an overlying typical dam section of a hydropower project in Southwest China are taken as the research objects, the model of which are shown in Figure 3a, and Figure 3b is the a detailed diagram of the foundation. The rock foundation is mainly composed of type II rock mass (including basalt, breccia lava, and tuff) and a small amount of type III rock mass (e.g., breccia lava) near the exposed surface. Due to tectonic movements, plenty of faults, and dislocation zones, fractures have developed in this stratum. The dislocation zone extends longitudinally, which is mainly compressive, torsional, and locally tensile. The dislocation zone is mainly composed of crushed rock, breccia, a small amount of mylonite, and fault gouges. Two groups of fissures have developed in the foundation of the dam section, ① N20°~50°W/NE ∠ 15°~30° and ④ N10°~20°E/NW ∠ 20°~25°, and the staggered zone in the foundation mainly includes fxh01, fxh05, and fxh12-8. Considering the influence of the overlying dam structure on the foundation stress and deformation behavior, both the foundation system and the dam structure are meshed with 76,096 elements using the ABAQUS software 6.14.
Based on a geological survey, the design report of this project, and the statistical results of the relevant literature [32,33,34], the physical and mechanical parameters of the rock mass and concrete are shown in Table 1. The uncertainty and spatial variability of the elastic modulus, cohesion, and friction coefficient of the bedrock, structural plane, and dam concrete are considered, which have a significant influence on the stress and strain of the dam–foundation system. Based on the results of compressive elastic modulus drilling tests at 22 monitoring points in an arch dam, the autocorrelation distance of the vertical compressive modulus obtained by using the autocorrelation function method is about 6.0 m, and the correlation between compressive modulus at further measurement points is significantly reduced [35]. At the same time, it is advisable to take a vertical correlation distance of 3–6 m considering the close relationship between the spatial variability of material parameters in the vertical direction of concrete dams and their pouring height. Similar to soil materials, the autocorrelation function of concrete materials in the horizontal direction is generally greater than that in the vertical direction. Due to temperature control and pouring strength, the size of the pouring surface is generally controlled between 15 m and 20 m. Therefore, it is recommended to take 3–5 times the autocorrelation distance in the vertical direction for the horizontal direction. Additionally, the reservoir water is selected to be a random variable with an average value of 136.46 m and a coefficient of variation of 0.05. The relevant parameters of dam and foundation materials and their statistical characteristics are given in Table 1.

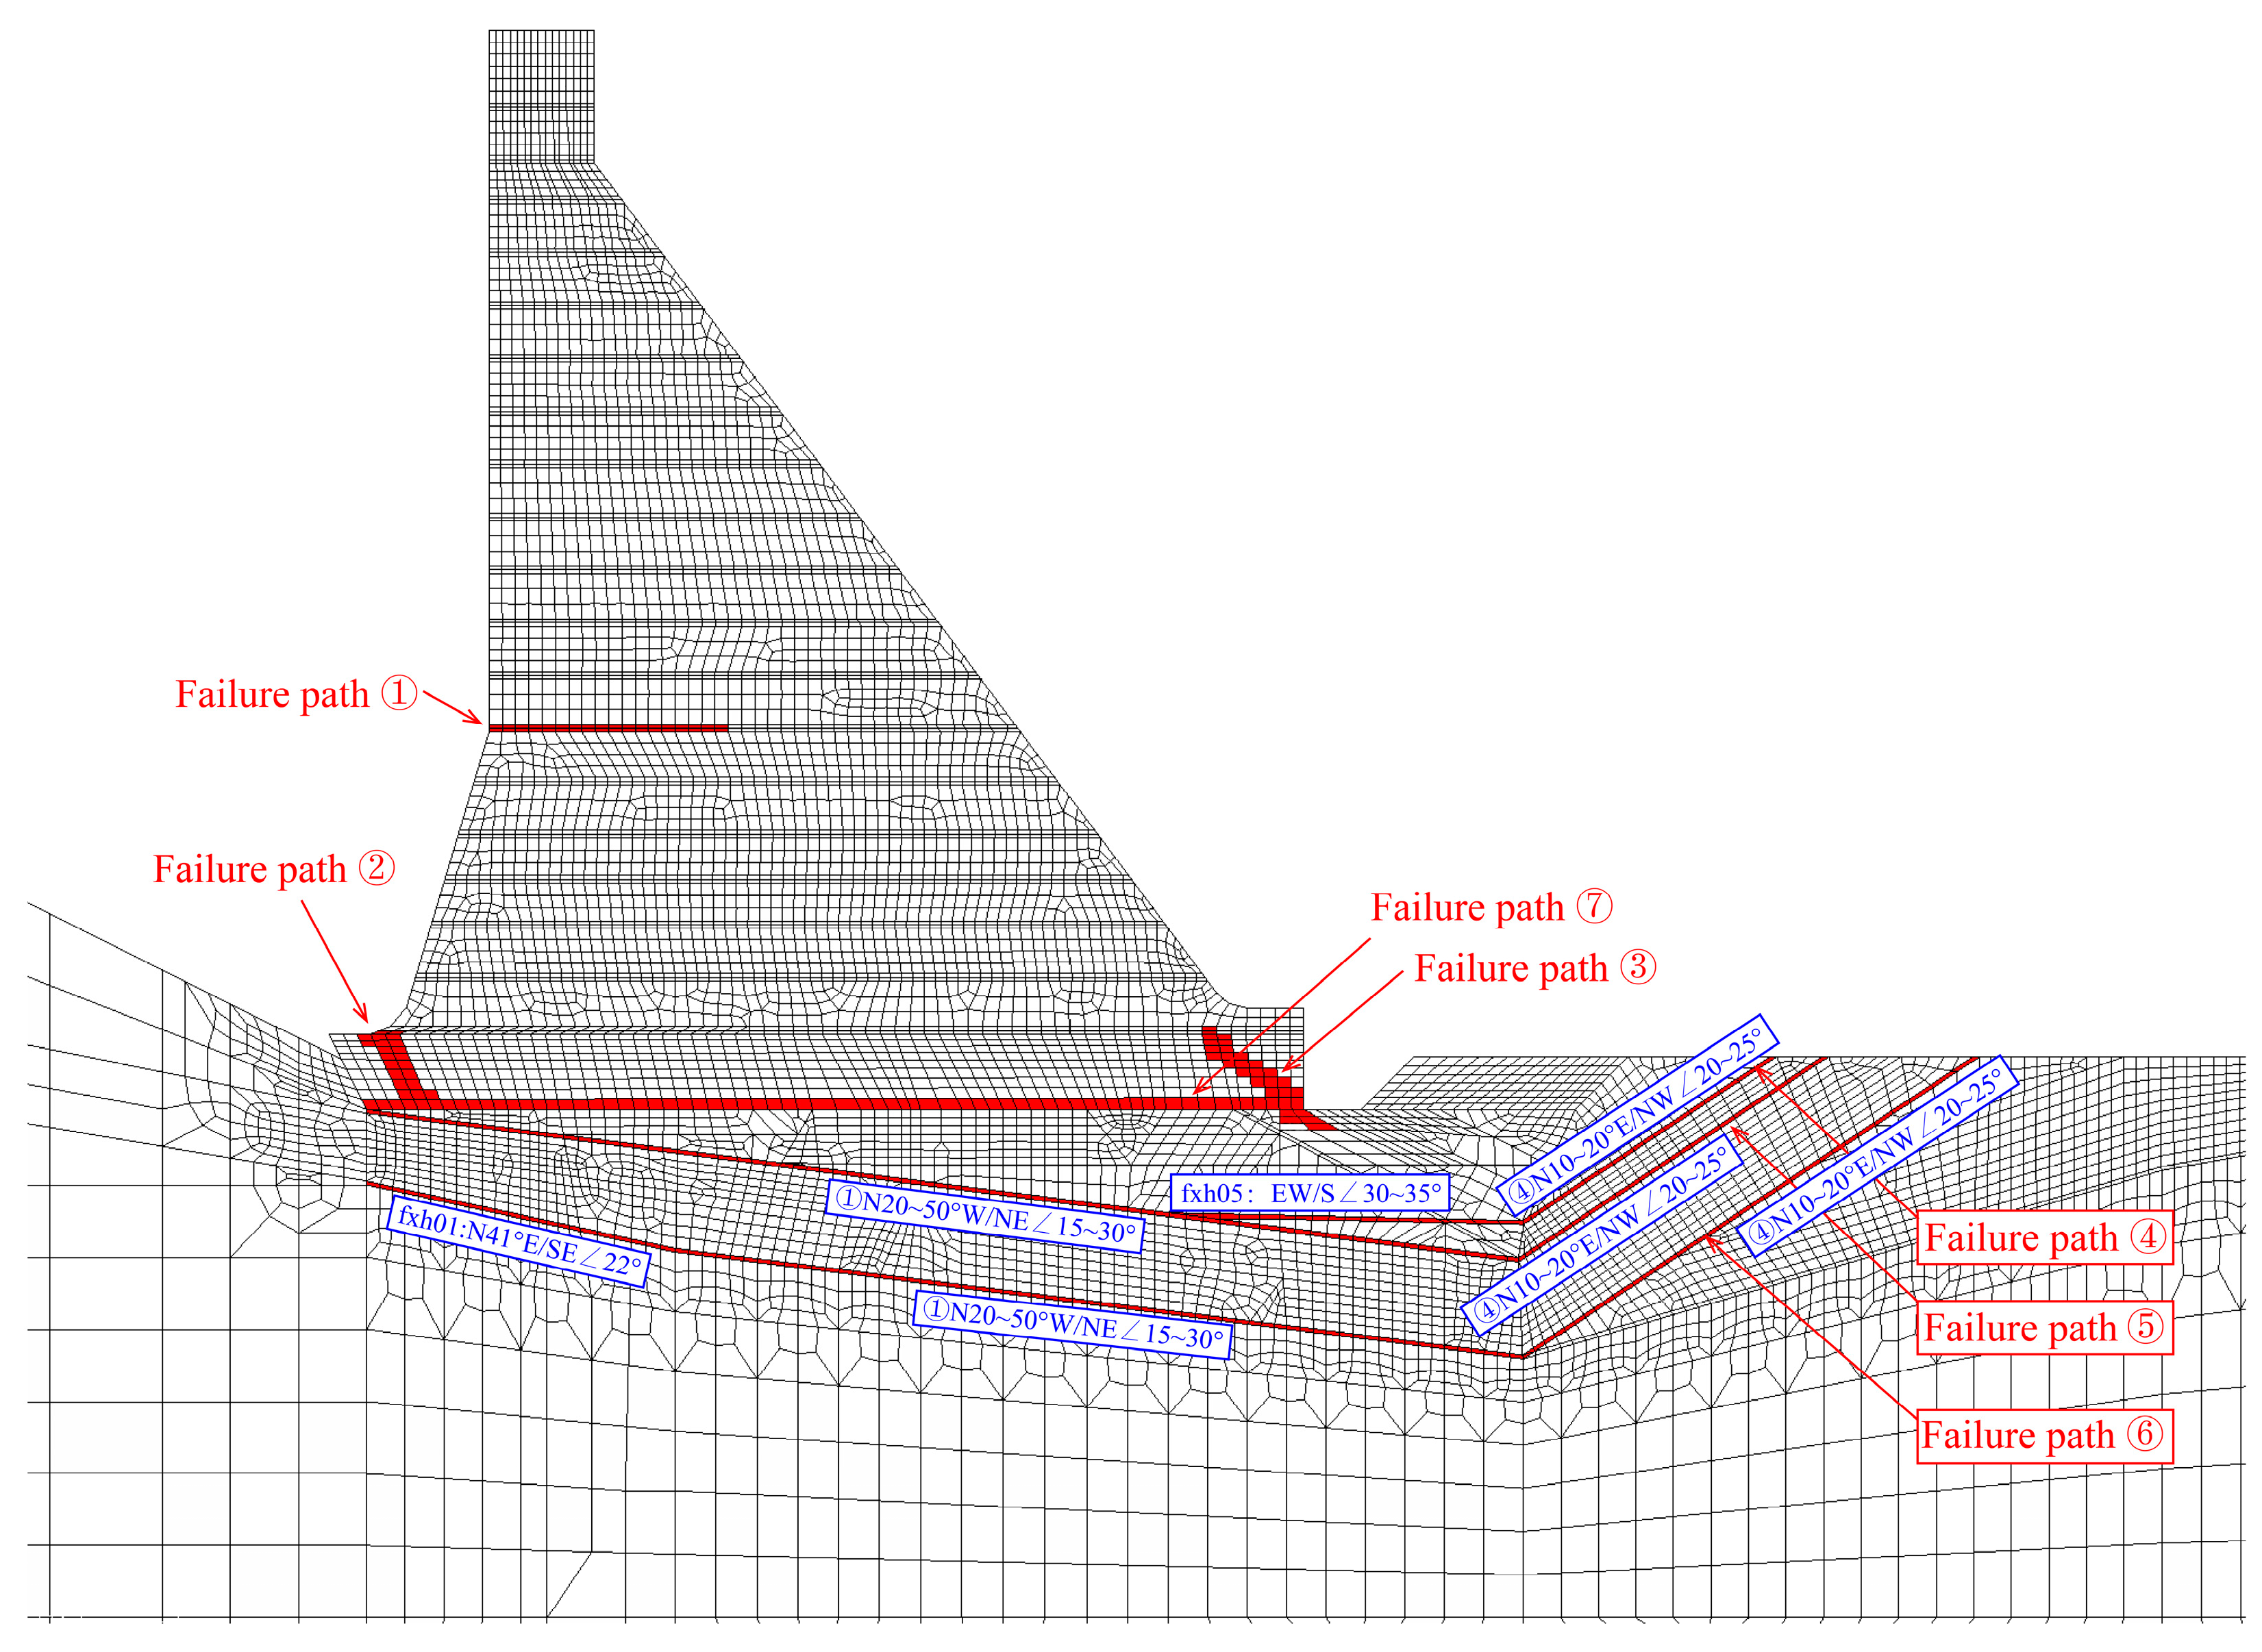
4.2. Critical Failure Paths and Performance Functions

As seen in Figure 3, there are many structural planes due to the complexity of the rock foundation; thus, it is important to determine the critical failure paths. Therefore, the potential failure paths are searched using the load increment method, and seven potential critical failure paths in the dam–foundation system are obtained according to the progressive failure process of elements under step-by-step loading (as shown in Figure 4), in which failure paths ①–③ are in the dam body and failure paths ④–⑦ are in the foundation.
For these determined critical failure paths, the performance functions are constructed according to the failure criteria.
For the strength failure
G 1 ( m , k ) H , E , c , f = k a I 1 J 2 = A X T
For the stability failure
G 2 ( k ) X = i = 1 n f i σ X i + c i b i i = 1 n τ X i b i
σ X i = A X T
τ X i = A X T
A = a 1 , a 2 , , a 21
X = 1 , H , E 1 , E 2 , E 3 , c 1 , c 2 , c 3 , f 1 , f 2 , f 3 , H 2 , E 1 2 , E 2 2 , E 3 2 , c 1 2 , c 2 2 , c 3 2 , f 1 2 , f 2 2 , f 3 2
where A is the undetermined coefficient matrix of the RSEs; matrix X is determined by the number of random variables and the forms of the RSEs; the other symbols retain their original meanings, as above.
To improve the speed of numerical simulation, the hardware conditions for this simulation are as follows: (1) CPU: 13th Gen Intel(R) Core (TM) i7-13700F; (2) RAM: 32.0 GB; (3) NVIDIA Geforce RTX 3060. Given the above hardware and the ABAQUS software 6.14, the processing time of each simulation takes less than 2 min, and then, the RSE sequences can be quickly constructed through finite element simulations with 27 sets of samples that are generated by using the orthogonal design method [35]. The results of solving the coefficients of the RSEs indicate that the multiple correlation coefficients for structural strength failure and dam stability failure are almost always greater than 0.98, implying that the fitting effect of the RSEs is good.

4.3. Risk Analysis of the Dam–Rock Foundation System

Through the overall simulation of determining critical failure paths based on the proposed risk analysis method considering the spatial variability of parameters, the failure probability of each failure path and the dam-rock foundation system can be obtained, as shown in Table 2. The failure probability of the dam-foundation system considering the spatial variability of parameters is 7.10 × 10⁻⁴, and the failure probability of each path ranges from 6.11 × 10⁻⁴ to 9.53 × 10⁻⁸. The failure probability of path ④ in the rock foundation is the highest, which is 6.11 × 10⁻⁴. The failure path ④ is formed by the cutting combination of fault interlayer developed in the foundation with the characteristics of shallow buried depth, small inclination, low strength, strong variability, and other factors, which indicates that it is the main control path of the dam-rock foundation system. The risk of the foundation has a significant influence on the failure probability of the dam-rock foundation system, especially for a complex foundation composed of different types of rock masses and weak structural planes. The potential failure paths and probability usually become the key factors to determine the risk of the dam-rock foundation system, which should be paid special attention to in the process of design and construction.
Compared with the results above, the failure probability of the dam–rock foundation system and the maximum failure probability of a single failure path without considering the spatial variability of parameters are 1.18 × 10⁻³ and 9.49 × 10⁻⁴, respectively. It can be seen that the failure probability of the dam–rock foundation system and each path without considering the spatial variability of parameters is higher than when considering the spatial variability of parameters. When the spatial variability of the parameters is not considered, the spatial variability of the parameters is homogenized by the traditional random variable model with high variance estimation so that the failure probability of the dam–rock foundation system is overestimated.

5. Conclusions

(1) A log-normal random field simulation method is proposed to simulate the spatial variability characteristics of concrete and foundation materials in a dam–foundation system. Through in-depth research on the finite element simulation of the spatial variability of gravity dams and foundation materials, as well as by using the failure risk analysis method of structural systems, a composite response surface equation for dam structure and foundation stability functions considering parameter spatial variation is constructed, which solved the problem of the inaccurate consideration of parameter spatial variability in failure path performance functions.
(2) A Monte Carlo simulation method and a process for determining failure risk in a dam–foundation system have been proposed, which solve the problem wherein the multi-element sliding path performance function cannot accurately consider the influence of parameter spatial variability on failure risk, as well as the problems of multiple failure paths in large block structures, complex relationships between parameters and paths, and difficulty in solving the failure risk of series–parallel systems.
(3) An engineering application shows that the proposed method has good practicability and high precision, which overcomes the defects of the overestimation of failure probability caused by high variance estimation and the homogenization of spatial random characteristics in large-volume concrete and rock foundations.
The method proposed in this article is meaningful for those engaged in structural safety risks. What is more, this article proposes a universal method for other gravity dams; this method is applicable, with the main difference being the search method for critical failure paths, performance functions, and parameter distribution characteristics, which vary depending on the project. It can be concluded that the proposed method provides an effective way to reasonably evaluate the reliability of a system consisting of complex foundations and overlying structures.

Author Contributions

Conceptualization, C.R., Z.Z. and B.G; methodology, C.R., Z.Z., L.P. and X.L.; software, Z.Z., B.G. and K.H.; formal analysis, Z.Z. and K.H.; investigation, C.R.; resources, L.P, and B.G; data curation, Z.Z. and B.G; writing—original draft preparation, C.R.; writing—review and editing, L.P.; funding acquisition, X.L. All authors have read and agreed to the published version of the manuscript.

Funding

This research was funded by the National Natural Science Foundation of China (No. 52309162) and the Fundamental Research Funds for the Central Universities (YJ202287).

Institutional Review Board Statement

Not applicable.

Informed Consent Statement

Not applicable.

Data Availability Statement

The data presented in this study are available on request from the corresponding author.

Conflicts of Interest

Congyong Ran, Zhengjun Zhou and Binfeng Gong were employed by the company PowerChina Chengdu Engineering Corporation Limited. The remaining authors declare that the research was conducted in the absence of any commercial or financial relationship that could be construed as a potential conflict of interest.

References

  1. Wu, Y.; Jia, J.; Wang, Y.; Zheng, C.; Zhao, L.; Jia, B. Investigation on hydraulic fracturing and flexible anti-hydrofracturing solution for Xiaowan Arch Dam. Appl. Sci. 2023, 13, 9302. [Google Scholar] [CrossRef]
  2. Song, J.; Liu, Y.; Yang, J. Dam safety evaluation method after extreme load condition based on health monitoring and deep learning. Sensors 2023, 23, 4480. [Google Scholar] [CrossRef]
  3. Redlinger, J.F. Lessons from Dam Incidents USA; American Society of Civil Engineers: Reston, VA, USA, 1975. [Google Scholar]
  4. Vogel, A. Bibliography of the History of Dam Failures; WorldCat: Tarboro, NC, USA, 1980. [Google Scholar]
  5. US Bureau of Reclamation (USBR). Downstream Hazard Classification Guidelines; American Society of Civil Engineers: Reston, VA, USA, 1988.
  6. Stanford University (SU). National Performance of Dams Program. 1994. Available online: http://npdp.st-anford.edu (accessed on 19 March 2024).
  7. Singh, V.P. Dam Breach Modeling Technology; Springer: Amsterdam, The Netherlands, 1966. [Google Scholar]
  8. Zhang, L.; Peng, M.; Chang, D. Dam Failure Mechanisms and Risk Assessment; Statistical Analysis of Failures of Dikes; John Wiley & Sons: Singapore, 2016. [Google Scholar]
  9. Zhang, H.; Li, Z.; Li, W.; Song, Z.; Ge, W.; Han, R.; Wang, T. Risk analysis of instability failure of earth-rock dams based on the Fuzzy Set Theory. Water 2021, 13, 3088. [Google Scholar] [CrossRef]
  10. Wang, F.; Li, H.; Sheng, J.; Yuan, L.; Pan, Y.; Zhao, J. A Bayesian method for dam failure risk analysis using causal loop diagrams and word frequency analysis. Nat. Hazards 2023, 119, 2159–2177. [Google Scholar] [CrossRef]
  11. Nahar, T.; Rahamn, M.; Kim, D. Effective safety assessment of aged concrete gravity dam based on the reliability index in a seismically induced site. Appl. Sci. 2021, 11, 1987. [Google Scholar] [CrossRef]
  12. Lee, J.; Lim, H. A fracture model for dynamic sliding safety evaluation of a concrete dam subjected to seismic excitation. Appl. Sci. 2023, 13, 10294. [Google Scholar] [CrossRef]
  13. Hariri-Ardebili, M.A.; Pourkamali-Anaraki, F. Support vector machine based reliability analysis of concrete dams. Soil Dyn. Earthq. Eng. 2018, 104, 276–295. [Google Scholar] [CrossRef]
  14. Wei, B.; Zhang, S.; Yuan, D.; Xu, F. Reliability analysis method of gravity dam based on probability-fuzzy-interval hybrid model and improved branch and bound method. Shuili Xuebao 2022, 53, 1476–1489. [Google Scholar] [CrossRef]
  15. Liu, Y.; Lin, C.; Liu, X.; Du, X.; Zhou, X. Fast solution method for static and dynamic reliability of gravity dam anti-sliding stability based on finite element method. J. China Three Gorges Univ. (Nat. Sci.) 2023, 45, 8–13. [Google Scholar] [CrossRef]
  16. Carvajal, C.; Peyras, L.; Bacconnet, C.; Bécue, J. Probability modelling of shear strength parameters of RCC gravity dams for reliability analysis of structural safety. Eur. J. Environ. Civ. Eng. 2009, 13, 91–119. [Google Scholar] [CrossRef]
  17. Carvajal, C.; Peyras, L.; Bacconnet, C. On the loading/shear strength coupling in the probabilistic formulation of the limit-state in shear for gravity dams. Eur. J. Environ. Civ. Eng. 2010, 14, 283–301. [Google Scholar] [CrossRef]
  18. Tang, X.; Chen, A.; He, J. Optimized variable selection of Bayesian network for dam risk analysis: A case study of earth dams in the United States. J. Hydrol. 2023, 617, 129091. [Google Scholar] [CrossRef]
  19. Wang, S.; Xu, B.; Zhu, Z.; Li, J.; Lu, J. Reliability analysis of concrete gravity dams based on least squares support vector machines with an improved particle swarm optimization algorithm. Appl. Sci. 2022, 13, 12315. [Google Scholar] [CrossRef]
  20. He, J.; Yang, D.; Wu, Z. System reliability analysis of foundation stability of gravity dams considering anisotropic seepage and multiple sliding surfaces. Eng. Comput. 2022, 39, 3108–3128. [Google Scholar] [CrossRef]
  21. Wang, Q.; Ren, X.; Li, J. Modeling of unstable creep failure of spatial variable rocks subjected to sustained loading. Comput. Geotech. 2022, 148, 104847. [Google Scholar] [CrossRef]
  22. Yang, R.; Sun, B.; Wan, Y.; Gao, X. Application of the improved entry and exit method in slope reliability analysis. Appl. Sci. 2023, 13, 10081. [Google Scholar] [CrossRef]
  23. Lu, X.; Wu, Z.Y.; Pei, L.; He, K.; Chen, J.K.; Li, Z.F.; Yang, Z. Effect of the spatial variability of strength parameters on the dynamic damage characteristics of gravity dams. Eng. Struct. 2019, 183, 281–289. [Google Scholar] [CrossRef]
  24. Li, Z.; Wu, Z.; Chen, J.; Lu, X.; Pei, L.; Chen, C. Effect of correlated random fields on nonlinear dynamic responses of gravity dam. Nat. Hazards 2021, 106, 79–96. [Google Scholar] [CrossRef]
  25. Chi, F.; Breul, P.; Carvajal, C.; Peyras, L. Stochastic seepage analysis in embankment dams using different types of random fields. Comput. Geotech. 2023, 162, 105689. [Google Scholar] [CrossRef]
  26. Zhang, M.; Li, Z.K.; Su, X. Probabilistic volume element modeling in elastic damage analysis of quasi-brittle materials. Chinese J. Rock Mech. Eng. 2005, 24, 4282–4287. [Google Scholar]
  27. Li, K.S.; Lumb, P. Probabilistic design of slopes. Can. Geotech. J. 1987, 24, 520–535. [Google Scholar] [CrossRef]
  28. Wu, Z.; Wang, S.; Ge, X. Slope reliability analysis by random FEM under constraint random field. Rock Soil Mech. 2009, 30, 3086–3092. [Google Scholar]
  29. El-Ramly, H.; Morgenstern, N.R.; Cruden, D.M. Probabilistic stability analysis of a tailings dyke on presheared clay-shale. Can. Geotech. J. 2011, 40, 192–208. [Google Scholar] [CrossRef]
  30. Wen, D.; Zhuo, R.; Ding, D.; Zheng, H.; Cheng, J.; Li, Z. Generation of correlated pseudorandom variables in Monte Carlo simulation. Acta Phy. Sin. 2012, 61, 220204. [Google Scholar] [CrossRef]
  31. He, K.; Pei, L.; Lu, X.; Chen, J.; Wu, Z. Research and application of critical failure paths identification method for dam risk analysis. Math. Probl. Eng. 2020, 2020, 4103804. [Google Scholar] [CrossRef]
  32. Wang, T.Q.; Pan, Q.L.; Ma, Z.B.; Shen, P.P. Study on Elastic Modulus and Poisson’s ratio of Roller Compacted Concrete in Shuangfengsi Reservoir. In Proceedings of the Academic Exchange Conference on Building Technology and Managemen, Beijing, China, 17 December 2014. [Google Scholar]
  33. Power China Chengdu Engineering Corporation Limited. Special Report on the Determination of Dam Foundation Surface and the Review of Anti-Sliding Stability; Power China Chengdu Engineering Corporation Limited: Chengdu, China, 2010. [Google Scholar]
  34. Wu, L. Preliminary analysis of elastic modulus stochastic field’s effect on concrete dam stress. Yunnan Water Power 2002, 18, 79–81. [Google Scholar]
  35. Tai, S.; Sun, Y.; He, J. Applied Mathematical Statistic; Wuhan University Press: Wuhan, China, 2005; pp. 204–231. [Google Scholar]
Figure 1. Schematic diagram of failure paths of gravity dam–rock foundation system.
Applsci 14 04349 g001
Figure 2. Reliability simulation flow chart of a rock foundation system for a gravity dam considering the spatial variability of its parameters.
Applsci 14 04349 g002
Figure 3. Model of the rock foundation system and overlying dam structure.
Applsci 14 04349 g003
Figure 4. Distribution of potential critical failure paths for the system.
Applsci 14 04349 g004
Table 1. Mechanical parameters of materials (including the spatial variability parameters).
LocationMaterialsDistributionMeanCVLxLy
FoundationElastic modulusLog-normal18 (GPa)0.1405
CohesionLog-normal1.75 (MPa)0.36405
Friction coefficientNormal1.30.2405
Poisson’s ratio-0.22---
Density-2700 (kg/m3)---
Structural planeElastic modulusLog-normal1 (GPa)0.1405
CohesionLog-normal0.15 (MPa)0.4405
Friction coefficientNormal0.750.25405
Poisson’s ratio-0.3---
Density-2700 (kg/m3)---
Dam concreteElastic modulusLog-normal37.8 (GPa)0.1105
CohesionLog-normal1.3 (MPa)0.25105
Friction coefficientNormal1.350.15105
Poisson’s ratio-0.2---
Density-2552 (kg/m3)---
Note: CV, coefficient of variation.
Table 2. Risk results for the dam–foundation system.
Failure PathsConsidering the Spatial Variability of ParametersWithout Considering the Spatial Variability of Parameters
Path Failure RiskSystem RiskPath Failure RiskSystem Risk
Dam4.50 × 10−77.10×10−45.51 × 10−71.18 × 10⁻³
8.10 × 10−79.16 × 10−7
Dam–Foundation5.37 × 10−52.19 × 10⁻⁴
Foundation6.11 × 10−49.49 × 10⁻⁴
4.13 × 10−49.06 × 10−4
2.52 × 10−61.66 × 10−5
9.53 × 10−82.53 × 10−7
Disclaimer/Publisher’s Note: The statements, opinions and data contained in all publications are solely those of the individual author(s) and contributor(s) and not of MDPI and/or the editor(s). MDPI and/or the editor(s) disclaim responsibility for any injury to people or property resulting from any ideas, methods, instructions or products referred to in the content.

