Article

Research on the Positioning Method of Steel Belt Anchor Holes Applied in Coal Mine Underground

School of Mechanical and Power Engineering, Zhengzhou University, Zhengzhou 450001, China
*
Author to whom correspondence should be addressed.
Appl. Sci. 2024, 14(11), 4360; https://doi.org/10.3390/app14114360
Submission received: 28 March 2024 / Revised: 8 May 2024 / Accepted: 15 May 2024 / Published: 21 May 2024

Abstract

:
In order to improve the automation and safety of underground steel belt support in coal mines, a method for the intelligent identification and positioning of steel belt anchor holes in roadway support using inductive sensors is proposed. Using STM32F407ZGT6 as the main control chip, tasks such as data acquisition and processing, motor motion control, etc., are assigned based on the real-time operating system FreeRTOS. Using the XY mobile platform equipped with inductive sensors to detect steel belts, The collected data includes coordinate values and voltage values. Adaptive threshold generation and correction strategies are used for threshold segmentation and extraction of anchor hole boundary points. The principle of Hough circle transformation is used to fit the extracted boundary points into circles. The results show that this method can perform anchor hole positioning with a positioning error of within 5 mm, meeting the design requirements.

1. Introduction

Coal production in China is mainly performed via underground mining, which needs a large number of tunnels to be built. To ensure the smooth flow of tunnels and the stability of the surrounding rocks, and to prevent the occurrence of roofing and side wall falling accidents, anchor support for tunnels is needed [1,2,3]. The traditional anchor support operations are mainly manual, which have two problems: one is that drilling anchor holes generates high labor costs, and the overall work efficiency is low; the second is that there are high safety hazards in the vicinity of the coal mining and support work surfaces, especially in the unfinished support of tunnels, and the workers’ on-site operation is high risk [4,5].
Domestic coal production is becoming more and more intelligent [6,7]. Since the mid-20th century, coal mining has evolved from mechanization, through stages of automation, informatization, and digitalization. Since the realization of mechanized mining, the global mining community has been pursuing the achievement of intelligent mining to liberate miners. Currently, many scholars have optimized the mechanical structure of the anchor drilling rigs used in coal mines for automation control [8,9,10]. The optimization of the mechanical structure and the remote control of the anchor drilling rigs can improve work efficiency and reduce the need for manpower. However, these improvements only achieve the automation of the anchor drilling rigs, while the position of the anchor holes still needs to be manually determined [11,12]. The automation of the whole drilling and anchoring operation is not fully achieved. The automatic identification and positioning of the drilling and anchoring locations (i.e., where the drill rod makes holes and inserts the anchor bolts) are key technologies in enhancing the level of intelligence of anchor drilling machines.
After tunneling in the roadway, steel belts are laid and the anchor bolts are anchored through the anchor holes in the steel belts. It is essential to identify and accurately locate the anchor holes on the steel belts because if the positioning is inaccurate, the drill bit will hit the steel belt, which can easily damage the equipment and in severe cases, cause safety accidents. Therefore, the precise identification and location of the anchor holes on the supporting steel belts are of great importance. Current methods for anchor hole positioning predominantly utilize machine vision technology. Qiao [13] implemented anchor hole positioning using the YOLOv5 model. However, this method tends to have poor accuracy under conditions of small holes and poor lighting. Ge et al. [14] used an improved SSD-MobileNetV2 model for detecting anchor holes in coal mines. Lei et al. [15] employed a binocular vision technique to locate anchor holes in coal mine tunnels, but the accuracy of these methods can still be impacted by factors such as dust and poor lighting in mine tunnels.
To address these issues, it is necessary to select a positioning method that is unaffected by light and dust. Currently, the principle of electromagnetic induction is widely used for detecting cracks and defects in metals like steel plates [16]. Yuan et al. [17] applied a DC electromagnetic motion-induced eddy current non-destructive testing technology to detect cracks in bearings and gears, and proposed a quantitative characterization method for crack depth/width. Duan et al. [18] used a magnetic drive array eddy current probe method for detecting defects on the inner walls of long-distance metal pipelines, which effectively identified defects. Xiong et al. [19] utilized an array sensor eddy-current detection system to identify abrasions on high-speed railway steel rails, and effectively evaluated the extent and shape of the abrasion damage. As a special form of defect, the anchor holes in the steel plates can also be detected with the principle of electromagnetic induction. Therefore, this paper proposes a method using inductive sensors to identify and locate anchor holes in steel strips.
Inductive sensors are a type of metal-inductive linear device [20], whose sensing surface will generate an alternating magnetic field when electrified. When a metal object approaches the sensing surface, the metal will generate eddy currents, which absorbs energy from the oscillator and leads to a linear decrease in the output amplitude of the oscillator. Based on the changes in the decrease, the non-contact detection of the object is completed. The entire laid steel belt is scanned with inductive sensors. When anchor holes, grooves, or edges on the steel belt are scanned, the voltage output of the inductive sensors will change. Through the analysis of the voltage at different positions, the anchor holes can be identified and located. This method has no sliding contact points and will not be affected by non-metallic factors such as dust during operation, making it broadly applicable in coal mine roadways.
This paper adopts the real-time operating system FreeRTOS. Tasks such as system operation, data collection, and data transmission are established in this system. Additionally, task switching is achieved by setting task priorities, which ensures the real-time performance of the system [21,22].

2. Overall System Design

2.1. Hardware Platform Construction

After laying the steel belt at the top of the coal mine tunnels, it is necessary to locate the anchor holes of the steel belt, and use the robotic arm to move the detection platform to a position close to the steel belt, and then use the mobile platform to carry inductive sensors for detecting the steel belt. The detection platform was built in the laboratory, and the schematic diagram of the platform structure is shown in Figure 1.
The XY mobile platform consists of two slides which enable the sensor to move along the X and Y axes. Each slide is equipped with a grating ruler to record the sensor’s position in real time. The controller is the central hub for system control and data processing, with a motor driver controlling the stepper motor to provide power for the detection platform.
Figure 2 presents the overall layout of the detection system. The coordinate paper is laid out beneath the platform to verify the positioning accuracy of anchor holes on the steel belt. The detection surface of the sensor is covered with a small amount of dust to simulate the dusty environment of a coal mine tunnel.

2.2. System Control Core

To meet the requirements of the externally connected function modules of the system, the high-performance and low-power STM32F407 is used as the main control chip [23], which is based on the ARM Cortex-M4 core. The chip has a 32-bit floating point unit (FPU) and an adaptive real-time accelerator, capable of executing from flash memory with zero wait states, and equipped with a memory protection unit and digital signal processing (DSP) capabilities. With a clock frequency of 168 MHz, the STM32F407 boasts a computing power of up to 210 DMIPS. In addition, it integrates interfaces such as Ethernet, USART, FSMC, and CAN, fulfilling the requirements of various embedded system designs. The analog-to-digital converter (ADC) within the control chip is used to convert the voltage collected from the inductive sensor.

2.3. System Software Design

The system software is designed with the STM32CubeMX 6.4.0 graphical user interface (GUI) tool [24] (hereafter referred to as CubeMX) and the MDK-ARM integrated development environment (hereafter referred to as MDK). CubeMX is a graphical tool for generating driver configuration and initialization code for the STM32 series MCUs. When configuring hardware resources such as pins, clocks, and registers in CubeMX, it automatically performs pin remapping and clock multiplication calculations, and generates low-level driver code for the hardware resources, significantly improving the development efficiency of the system’s hardware and software. CubeMX supports some commonly used middleware such as RTOS, USB, LwIP, graphics, and file systems. Additionally, CubeMX supports toolchains including MDK and IAR, which facilitates new project creation or project configuration modification in different IDEs. Once the MDK toolchain is chosen, the project configured and generated in CubeMX can be directly opened in MDK.

2.4. FreeRTOS Introduction and Porting

FreeRTOS is a lightweight embedded operating system developed by C programming language. The number of tasks is not limited in the system and a priority scheduling algorithm is supported. Each task is assigned a certain priority and the processor prioritizes tasks in a ready state. FreeRTOS also supports a round-robin scheduling algorithm, which allows different tasks to have the same priority level and enables these tasks to share the processor within the same period.
This paper adopts CubeMX to integrate the FreeRTOS. The main parameters to be configured include the preemptive scheduler, system main frequency, system clock, maximum priority number, and heap size. All these configurations are reflected in the related macro definitions in the FreeRTOSConfig.h file. In addition, FreeRTOS execution requires a call to osSystickHandler() in the SysTick_Handler interrupt function, where the SVC_Handler and PendSV_Handler system interruptions are modified internally to construct operating beats for the real-time operating system. FreeRTOS mainly consists of files such as list.c (kernel scheduling linked lists), queue.c (queues), croutine.c (shared stack tasks), and task.c (tasks). This paper employs individual shared stack tasks (task.c) to establish multiple task threads, which support preemptive scheduling among them.
The whole control system is capable of communication with the host computer, controlling motors, as well as data collection and processing. To meet the demands for system real-time performance and stability, the open-source real-time operating system FreeRTOS is ported. The task planning is shown in Figure 3.
(1)
System Initialization
The initialization task is mainly about the system, which includes the system clock, serial ports, IIC buses, GPIO pins, timers, and suspending its own tasks after application task creation.
(2)
Host Computer Communication Task
The host computer communication task requires the host computer to send control commands to the control system through this task. The task employs DMA for data transfer to improve the MCU utilization rate. To respond promptly to control commands sent by the host computer, a DMA receive interrupt is set up. When the DMA interrupt is triggered, the interrupt service routine releases a semaphore. Acquiring this semaphore, the blocked host communication task exits the blocked state, and enters the ready state, waiting for the system scheduler to dispatch it for execution. When ready, the task interprets the received control commands.
(3)
Data Collection Task
The data collection task involves collecting voltage, coordinates, and touch switch status data. The controller directs the stepper motors to move the XY mobile platform, which carries an inductive sensor to perform a comprehensive detection of the steel belt and sends real-time voltage signals to the controller during the detection. As the platform moves, the grating ruler on the X and Y axes outputs pulse signals, which are received by the controller with its internal encoder mode to determine the coordinates of the inductive sensor. The controller collects these coordinate data and voltage values from the inductive sensor to identify and locate anchor holes later. When the inductive sensor moves to the ends of the slider, the loading board will touch the microswitch, prompting the controller to adjust the motor’s direction of motion.

2.5. Platform Movement Detection

In the process of carrying inductive sensors to collect signals, the distance between the moving platform and the steel belt in the vertical direction stays fixed, and the guideway adopts the following moving mode: the X-axis and Y-axis return to the origin at the time of reset. When the Y-axis moves from the starting point to the end point, the X-axis moves 1 mm towards the end point. When the Y-axis moves from the end point to the starting point and when the X-axis moves to the end point of the set point, the signal collection is completed. The moving mode is shown in Figure 4.

3. Coil Self-Inductance Simulation Analysis

ANSYS Electronics Desktop 2021 R1 software [25] is a user-friendly tool with powerful functions and a precise structure for 2D/3D electromagnetic finite element analysis. It calculates various electromagnetic fields, including static electric, static magnetic, time-varying electric, time-varying magnetic, eddy current, transient, and temperature fields. The simulation analysis is conducted on the sensor coil of the inductive sensor with the ANSYS Electronics Desktop software. The purpose of the analysis is to explore how the vertical distance between the inductive sensor and the steel belt affects the detection results.
A portion of the steel belt is selected for analysis in the construction of the steel belt simulation model. The selected section is a steel cuboid with a length of 270 mm, a width of 230 mm, and a thickness of 3 mm. The anchor holes have a diameter of 35 mm. The sensor’s coil is made of copper and consists of five turns with an inner diameter of 20 mm and an outer diameter of 40 mm. The solution domain coincides with the coil boundary and is specified as a vacuum. The simulation model is shown in Figure 5.
To analyze the impact of the distance between the inductive sensor and the steel belt on anchor hole identification, the vertical distance between the coil and the steel belt is set at 10 mm, 15 mm, 20 mm, 25 mm, and 30 mm. The simulated self-inductance of the coil is then recorded as it moves horizontally toward the edge of the steel belt at different positions, as displayed in Figure 6.
The simulation results indicate that when the coil is close to the steel belt, a valley value of the self-inductance is observed when the center of the coil aligns exactly with the center of the anchor hole, namely when the distance is 38 mm, which accurately reflects the location of the anchor hole. As the distance between the coil and the steel belt increases, changes in the coil’s self-inductance become less significant, which cannot accurately indicate the position of the anchor hole. To verify the above simulation results, the voltage of the inductive sensor at different lateral positions are measured at different coil-to-belt distances, as shown in Figure 7. The experiment considers the need to maintain a safe distance between the inductive sensor and the steel belt. It is suggested that when the inductive sensor detects a reduction in the steel plate area, the self-inductance inside the coil decreases, resulting in an increase in the output voltage of the inductive sensor. The results shown in Figure 7 are consistent with the simulation data in Figure 6. The optimal anchor hole detection effect occurs when the coil is at a vertical distance of 10–20 mm from the steel belt and the detection effect gradually worsens when the distance becomes 20–25 mm. Therefore, due to the influence of the inductive sensor structure, the appropriate distance between the coil and the steel belt for detection with the inductive sensor should be 15–20 mm.

4. Realization of Steel Belt Anchor Hole Positioning

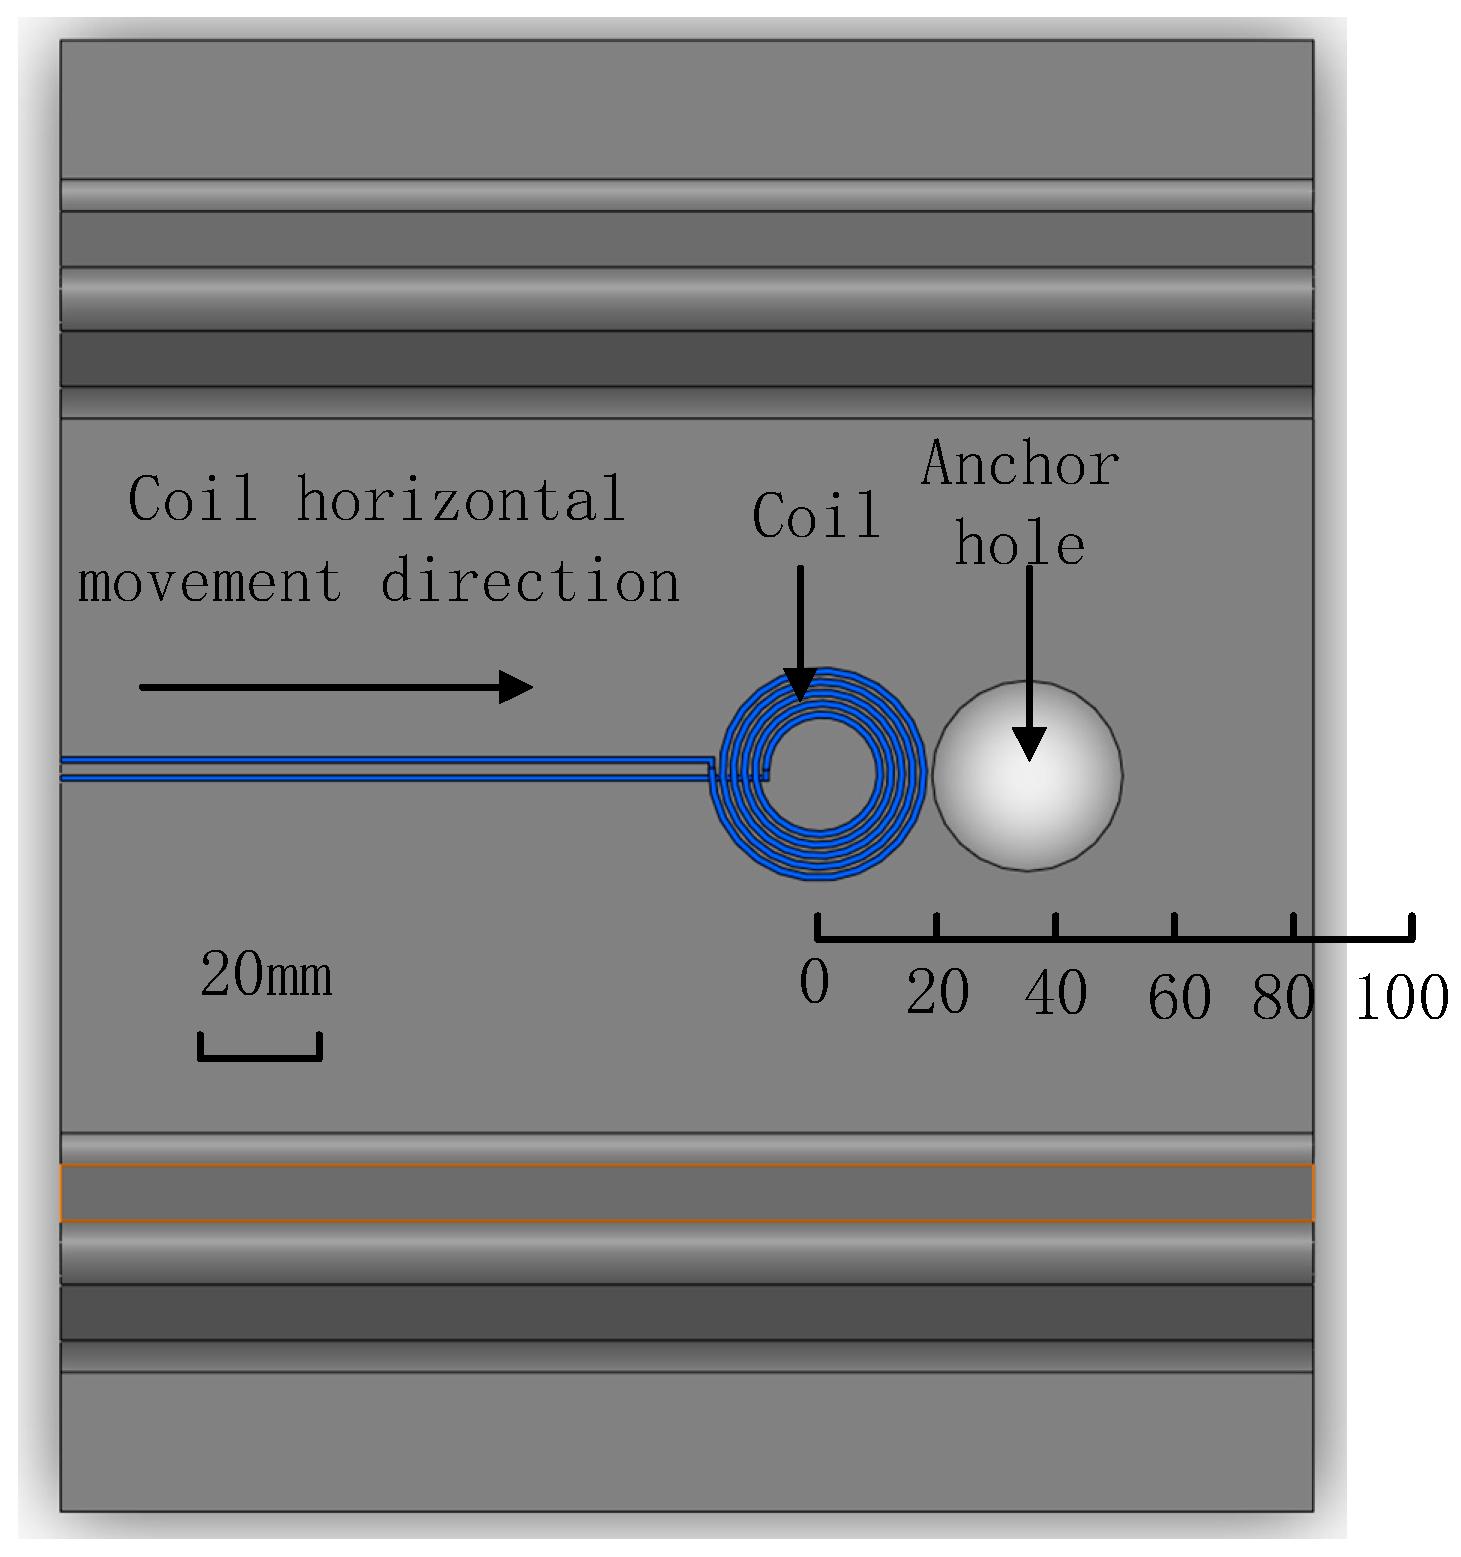
4.1. Data Collection

To verify that the dusty environment in the tunnel has no effect on the detection results of the inductive sensor, the steel belt is detected when the dust is placed on the detection surface of the inductive sensor and when the dust is not placed. The results are shown in Figure 8. By comparing the voltage values with and without dust at the same location in Figure 8, the maximum difference between them is within 2%. This indicates that the dusty environment has a particularly small impact on the detection results of the inductive sensor.
The controller records the coordinates of the inductive sensor position output from the scale and the voltage value output from the inductive sensor at that position. A three-dimensional graph of the data is shown in Figure 9.

4.2. Target Data Extraction

The voltage values collected in the above data are obtained from the collected voltage matrix according to the number of rows representing different horizontal coordinates and the number of columns representing different vertical coordinates V x y , where V is the voltage value, and x and y are the horizontal and vertical coordinates of that voltage value. To obtain the target data in the region where the anchor holes are located, global threshold segmentation [26] is used, where only one threshold value is used in the whole matrix to divide the matrix into two regions, i.e., the target object and the background object. The extraction process of the anchor hole boundary is shown in Figure 10.
The anchor hole in the steel belt is circular and its area is noted as S 1 . Scanning the elements in the voltage matrix yields a voltage maximum value of V max , and a voltage minimum value of V min . The sensor outputs the lowest voltage value when it detects the groove at the bottom of the steel belt, and it outputs the highest voltage value when it detects the air outside the steel belt. The voltage value is close to the highest voltage value when it detects the anchor holes. The initial voltage global threshold value is set as follows:
V 0 = 0.9 V max V min + V min
In the equation, V 0 is the initial voltage global threshold; V max is the maximum voltage value; and V min is the minimum voltage value.
The data in the voltage matrix are segmented into target object and background according to Equation (2), which is given below:
G x y = 1 , V x y > V 0 0 , V x y V 0
In the equation, x is the horizontal coordinate of the point; y is the vertical coordinate of the point; V x y is the voltage value; and G x y is the binarized value.
The voltage matrix becomes a binarized matrix consisting only of 0 and 1 after the voltage matrix is segmented through the threshold. When the value in the binarized matrix is 0, the position of the value is indicated by a black dot, and the result is shown in Figure 11. The irregular edges and shapes appear because the steel belt is tilted and some areas of the belt itself are defective during the detection process of the inductive sensor, resulting in fluctuations and noise in the collected data.
Then, the boundary points are extracted and the binarized matrix is iterated. When the value is 1 and 0 appears near the value, the position of the value in the matrix is recorded. After the end of the iteration, the position where the value 1 of the recorded position is indicated by a black dot, and the value of the unrecorded position in the matrix is set to 0. As shown in Figure 12, the boundary points contain the boundaries of the anchor holes and the boundaries of the steel belts. When setting the initial voltage global threshold, the boundary extracted after threshold segmentation will be unable to respond to the anchor hole information, so through the adaptive threshold generation and correction strategy [27], the neighboring points in the obtained boundary points are connected, and the largest area S 2 in the enclosed graph and the area of the anchor hole of the steel belt S 1 are taken for comparison to adjust the global threshold V 0 . When 0.8 S 1 S 2 S 1 , the threshold segmentation ends. When S 2 < 0.8 S 1 , the threshold value V 0 should be reduced and changed to V 0 = V 0 5 , and the threshold segmentation is repeated; when S 2 > S 1 , the threshold value V 0 should be increased and changed to V 0 = V 0 + 5 , and the threshold segmentation is repeated.

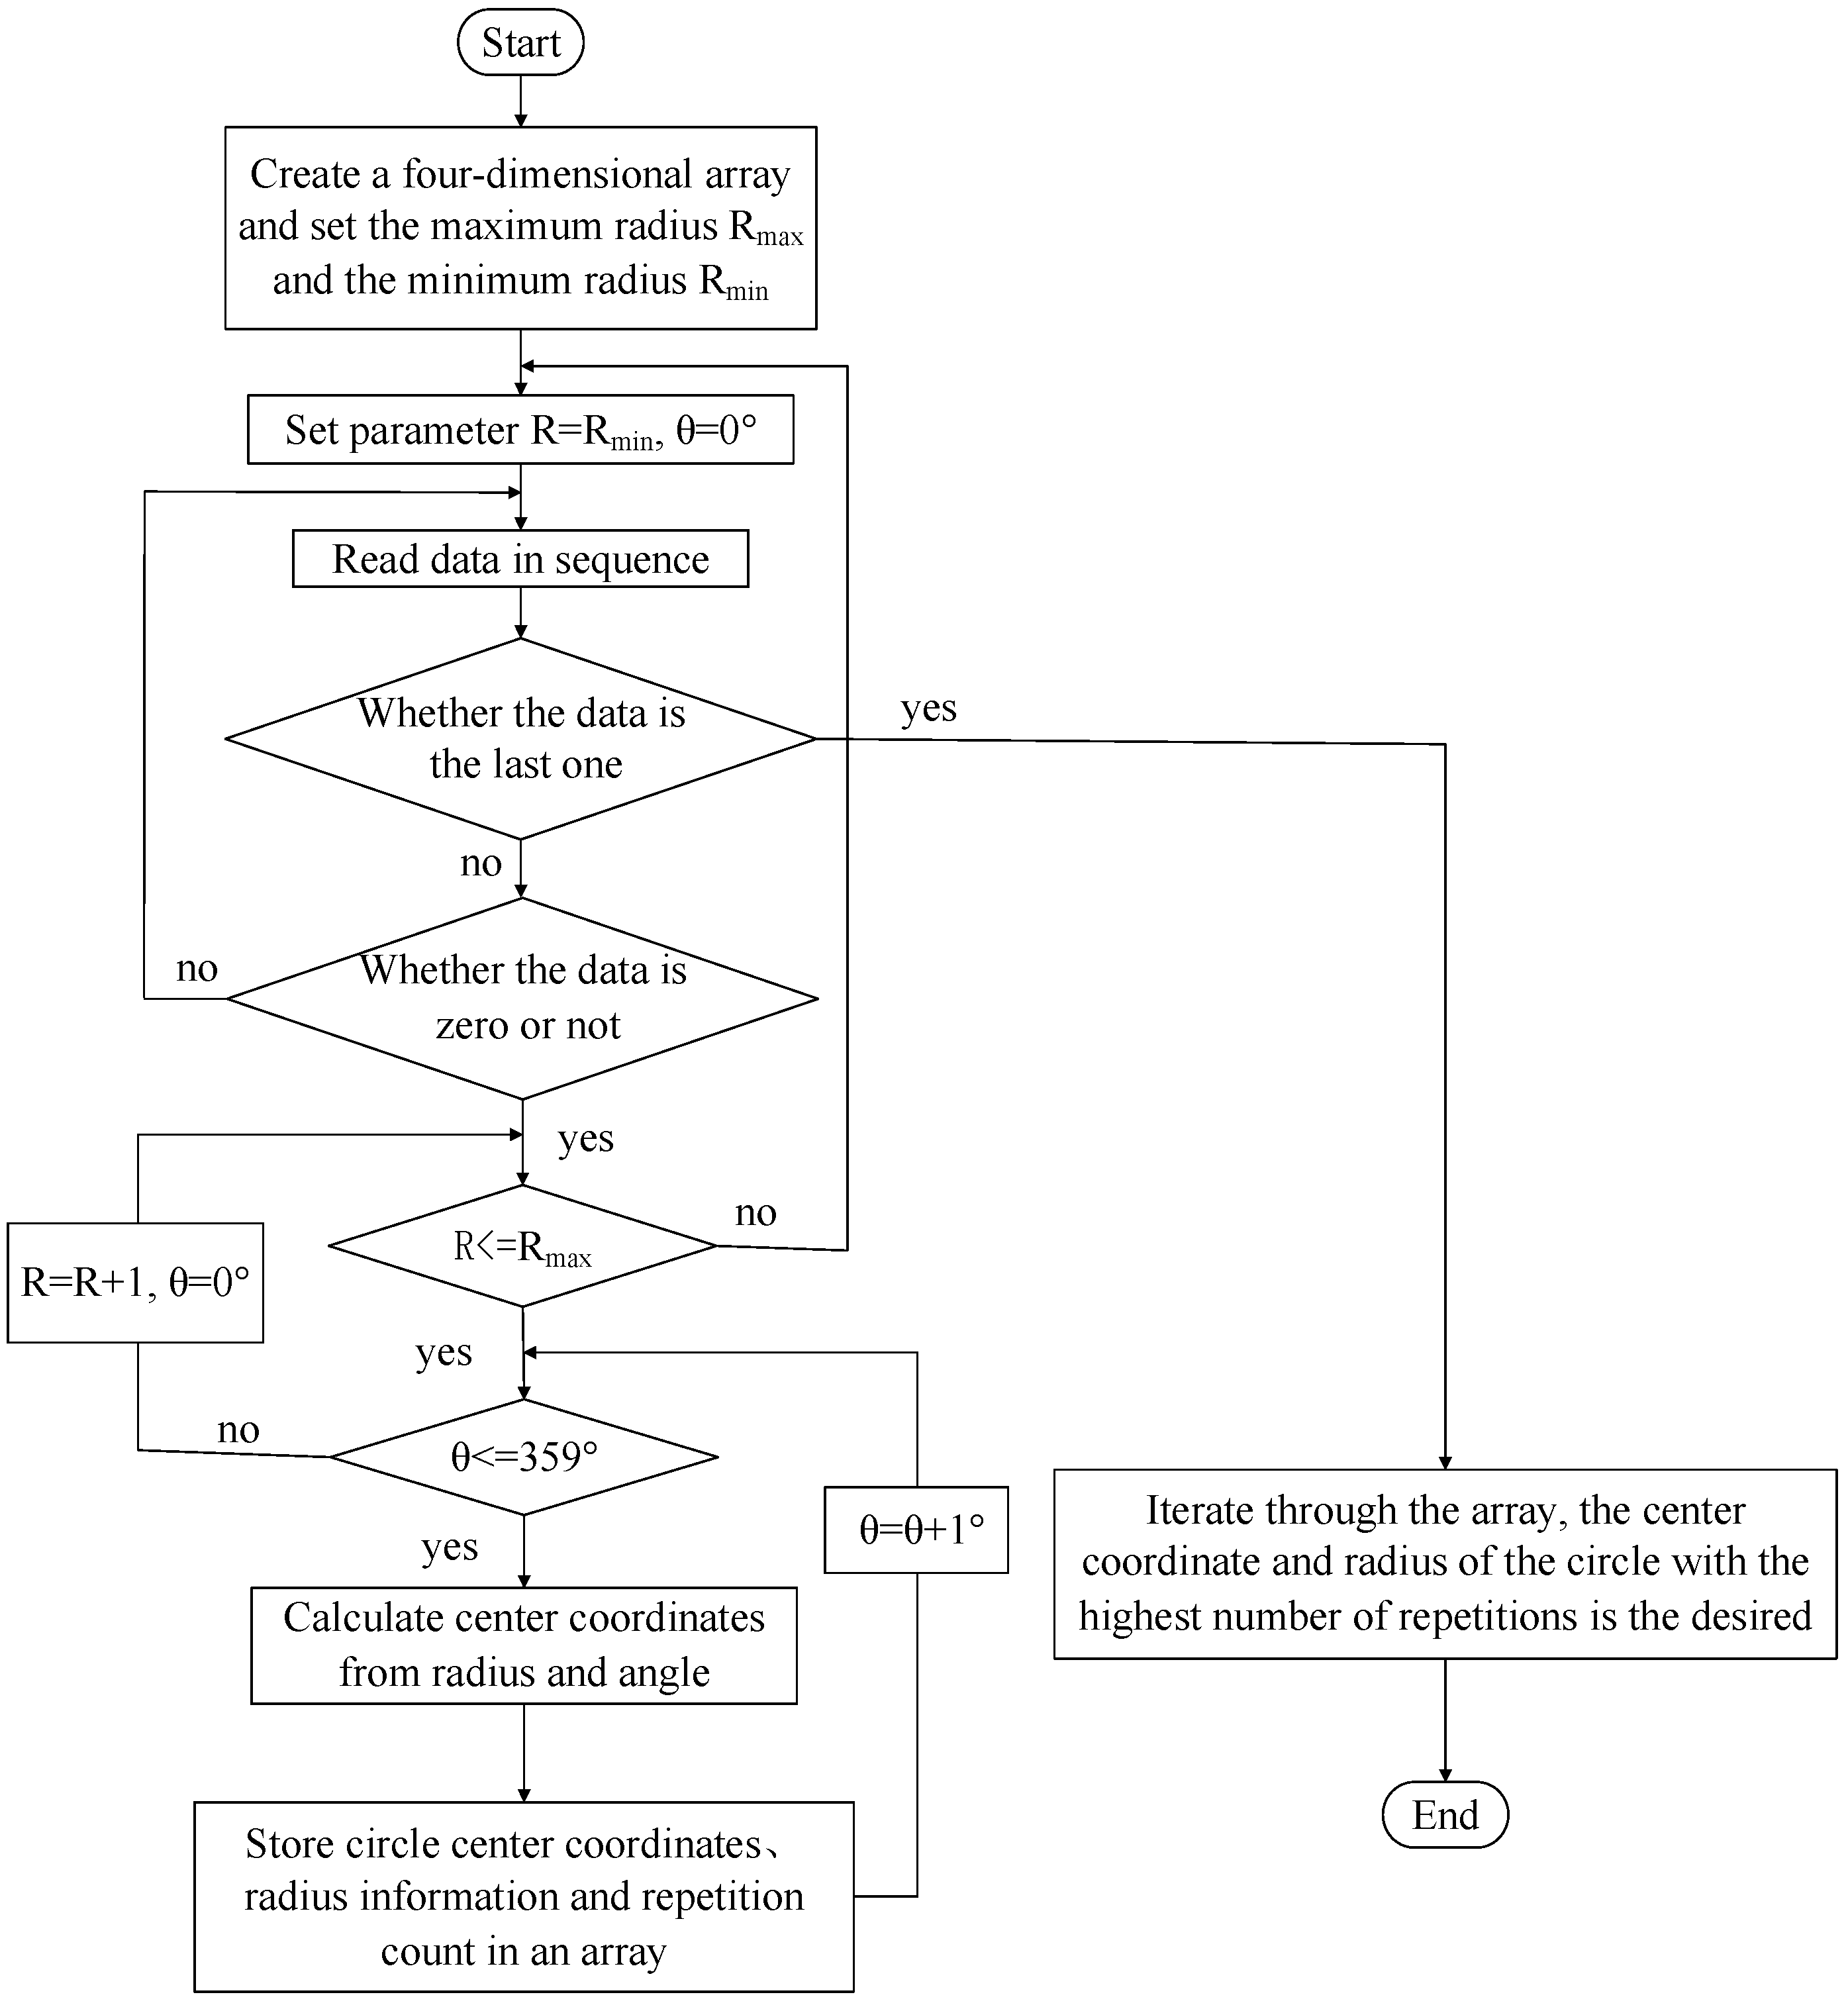
4.3. Positioning of the Anchor Holes

The Hough transform is a typical algorithm in the field of digital image processing and machine vision [28] and can be applied to the detection of straight lines and circles. The properties of the anchor hole boundaries after binarization are similar to those of the image, so the principle of the Hough transform can be applied to the detection of circles in the matrix.
A point i on the boundary in Figure 12 has the coordinates of x i , y i , which can be a point on a circle with radius R and center coordinates X i , Y i , as shown in Equation (3):
x i X i 2 + y i Y i 2 = R 2
Equation (3) can be transformed, as shown below:
X i = x i R cos θ
Y i = y i R sin θ
In the equation, θ is the angle, 0 θ 359 , and θ takes an integer.
For point x i , y i , set R max and R min to the radius of the anchor hole of the steel belt as a reference and take the value between them in turn. For each R value, take θ value from 1° to 359° in turn, and calculate the centroid coordinates X i , Y i according to Equations (4) and (5). Then, the centroid coordinates are obtained, and record the rounded centroid coordinates and the radius R used for calculating the centroid coordinates together. Iterate over the points on the boundary in Figure 12 and repeat the above operation; the recorded center coordinates and radius will be repeated. As the number of repetitions increases, it means that more and more boundary points are on the circle with center coordinates X i , Y i and radius R . Calculate the number of repetitions, and find the largest number of repetitions of the center coordinates X i , Y i . At this time, the center coordinates X i , Y i and radius R of the circle are composed of the largest number of boundary points, which is the closest to the true value of the anchor hole of the calculation of all the center coordinates and radius, so that the center coordinates and radius are considered to be the center coordinates and radius of the anchor hole. The flowchart is shown in Figure 13.
Firstly, create a four-dimensional array to store the circle center coordinates, radius information, and the number of repetitions. When threshold segmentation is performed, there is an error between the radius of the circle sought in the extracted anchor hole boundary points and the actual anchor hole radius, so the maximum and minimum radii are set, and the radius of the anchor hole of the steel belt is within that range.
Each a point on the boundary in Figure 12 is read. Starting from the smallest radius R = R min , the angle increases by 1°, according to Equations (4) and (5) to calculate the center of the circle coordinates, and after rounding and radius are put into an array to calculate the number of repetitions, in the form of X i , Y i , R , m , m for the number of repetitions. After calculating all the points, iterate the four-dimensional array, and the largest value of m corresponding to the center of the circle coordinates and radius is required. By calculating, the obtained Hough circle detection result is shown in Figure 14.

5. Experimental Section

To verify the accuracy of the proposed algorithm, a detection platform for steel strip anchor holes was constructed according to the hardware and software system introduced in Section 2. Initially, the actual coordinates of the steel strip anchor holes were determined using the coordinate paper laid out as shown in Figure 2. Subsequently, the steel strip was tested on the detection platform, and the detection coordinates were outputted.
With the vertical distance between the detection platform and the steel strip fixed at 15 mm, the position of the steel strip was changed multiple times and subjected to detection. The results, presented in Table 1, show that the positioning error is within 5 mm, meeting the positioning requirements.
In actual detection, the vertical distance between the detection platform and the steel strip may vary. To verify the accuracy of this detection method, the vertical distance was set at 17 mm and 19 mm, and multiple detections were carried out, with the detection results presented in Table 2 and Table 3.
The positioning errors in the above three tables are within 5 mm, meeting the design requirements. It can also be inferred that the closer the vertical distance between the inductive sensor and the steel strip, the smaller the detection error.

6. Conclusions

This paper introduces a method for identifying and positioning anchor holes in steel belts using an inductive probe. A detection platform was constructed based on functional requirements, and the software system was designed and developed accordingly. The induction of the head coil of the inductive probe was simulated and analyzed using ANSYS Electronics Desktop 2021 R1 software, and was experimentally validated to determine the most suitable vertical detection distance. The detection platform was used to position the holes in the steel belts, and the collected data were analyzed using an algorithm developed from Hough transform. The resulting anchor hole positioning error was within 5 mm. This study provides a solution for the automated positioning of anchor holes in coal mine tunnels, which is able to replace manual operations.

Author Contributions

Conceptualization, J.Z.; methodology, J.Z.; software, Y.W.; validation, Y.W.; formal analysis, Y.W.; investigation, H.W.; resources, H.W.; data curation, Y.W.; writing—original draft preparation, Y.W.; writing—review and editing, G.L.; visualization, J.Z.; supervision, Y.W.; project administration, Y.W.; funding acquisition, G.L. All authors have read and agreed to the published version of the manuscript.

Funding

This research was funded by the Key Support Program of Henan Province Industry-University-Research, grant number 172107000008.

Institutional Review Board Statement

Not applicable.

Informed Consent Statement

Not applicable.

Data Availability Statement

The data present in this study are available on request from the corresponding author. The data are not publicly available due to privacy.

Acknowledgments

The authors express sincere gratitude for the support received from various project funds, which has been instrumental in facilitating the successful completion of this research endeavor. In addition, the authors wish to thank the reviewers for their useful and constructive comments.

Conflicts of Interest

The authors declare no conflicts of interest.

References

  1. Wang, B. Current situation and trend analysis of coal mine tunnel excavation technology and equipment. J. Coal Sci. Technol. 2020, 48, 1–11. [Google Scholar]
  2. Kang, H.; Wang, J.; Lin, J. Analysis of application cases of bolt support in coal mine tunnels. J. Rock Mech. Eng. 2010, 29, 649–664. [Google Scholar]
  3. Xue, G.; Cheng, J.; Guan, J.; Li, X.; Wu, M. Robotized advance support scheme and optimum support opportunity for deep fully mechanized roadway. J. Min. Sci. 2019, 4, 349–356. [Google Scholar]
  4. Zhang, F.; Wang, H.; Wang, H.; Li, Z.; Wang, Y. Intelligent identification and positioning of steel strip anchor holes for coal mine roadway support. J. Ind. Min. Autom. 2022, 48, 76–81. [Google Scholar]
  5. Wang, H.; Wang, B.; Zhang, X.; Li, F.; Du, C. Key technology and engineering practice of intelligent rapid heading in coal mine. J. China Coal Soc. 2021, 46, 2068–2083. [Google Scholar]
  6. Wang, G.; Pang, Y.; Ren, H. Intelligent mining mode and technical path for coal mines. J. Min. Rock Control. Eng. 2020, 2, 5–19. [Google Scholar]
  7. Wang, G.; Liu, F.; Pang, Y.; Ren, H.; Ma, Y. Coal mine intellectualization: The core technology of high quality development. J. China Coal Soc. 2019, 44, 349–357. [Google Scholar] [CrossRef]
  8. He, A.; Wu, L.; Du, S.; Han, F.; Liu, F. Development of a fully automatic two arm roof bolt drilling vehicle for coal mines. J. Coal Sci. Technol. 2019, 47, 165–169. [Google Scholar]
  9. Wu, H.; Liu, F.; Wang, S.; Xu, J.; Qiu, Z. Design of a four arm anchor rod drilling vehicle. J. Coal Min. Mach. 2011, 32, 23–25. [Google Scholar]
  10. Zhang, G. Research on the application of PLC based intelligent visualization control system for anchor drill. J. Mach. Tools Hydraul. 2018, 46, 129–132. [Google Scholar]
  11. Kang, H.; Jiang, P.; Liu, C.; Wang, Z.; Luo, C.; Guo, J.; Chen, Z.; Cao, X. Current situation and development trend of rock bolting construction equipment in coal roadway. J. Mine Autom. 2023, 49, 1–18. [Google Scholar]
  12. Gao, Z.; Guo, Z. Type characteristics and research direction of automatic bolting frame. J. Coal Sci. Technol. 2023, 51, 212–224. [Google Scholar]
  13. Qiao, J. Research on the identification of steel belt holes for underground anchoring operations in coal mines based on machine vision. Master’s Thesis, Coal Science Research Institute, Beijing, China, 2022. [Google Scholar]
  14. Ge, S.; Zhang, Y.; Qin, J.; Li, X.; Wang, X. A detection method for underground anchor holes in coal mines based on optimized SSD-MobileNetV2. J. Min. Rock Control. Eng. 2023, 5, 66–74. [Google Scholar]
  15. Lei, M.; Zhang, X.; Dong, Z.; Wan, J.; Zhang, C.; Zhang, G. Locating anchor drilling holes based on binocular vision in coal mine roadways. J. Math. 2023, 11, 4365. [Google Scholar] [CrossRef]
  16. Guo, Z.; Sasayama, T. Detection of Surface and Back-Surface Defects on Metal Plate via Rectangular Wave Eddy Current Testing Using Magnetoresistive Sensor. J. IEEE Trans. Magn. 2023, 59, 6200505. [Google Scholar] [CrossRef]
  17. Yuan, F.; Yu, Y.; Li, L.; Tian, G. Investigation of DC electromagnetic-based motion induced eddy current on NDT for crack detection. J. IEEE Sens. J. 2021, 21, 7449–7457. [Google Scholar] [CrossRef]
  18. Duan, Z.; Xie, S.; Li, L.; Li, J.; Chen, H.; Chen, Z. Detection of defects in pipeline structures based on magnetic transmission eddy current array probe. J. Trans. China Electrotech. Soc. 2020, 35, 4627–4635. [Google Scholar]
  19. Xiong, L.; Liu, X.; Zhang, Y.; Shi, Y.; Zhang, Y.; Chen, Z. Identification of High-Speed railway rail abrasions based on eddy current detection. J. Railw. Eng. 2022, 62, 8–12. [Google Scholar]
  20. Zhou, Y.; Ye, W.; Zhang, C.; Fu, J.; Liang, R. Study on influence factors of inductive sensor to identify scrap metal. J. Transducer Microsyst. Technol. 2023, 42, 17–20, 24. [Google Scholar]
  21. Xu, J.; Zhang, Y.; Yang, J.; Wang, Y. Vehicle Condition Monitoring System Based on FreeRTOS. J. Electron Devices 2021, 44, 439–443. [Google Scholar]
  22. Chen, R.; Zeng, Q.; Yang, J.; Xiong, D.; Li, S.; Su, L. AGV development based on FreeRTOS embedded system. J. Mach. Des. Res. 2022, 38, 35–41. [Google Scholar]
  23. Wang, D.; Mo, X. Design and Implementation Smart Home of Intelligent Lighting System Based on STM32 and HC-SR501. J. Chongqing Univ. Technol. (Nat. Sci.) 2016, 30, 135–142. [Google Scholar]
  24. Chen, D.; Wang, Y.; Jin, X. Design of experiment on DAC signal output based on STM32. J. Exp. Technol. Manag. 2019, 36, 72–75. [Google Scholar]
  25. Jiang, J.; Zeng, Z.; Fu, Y.; Zhan, E.; Long, D. MCR-WPT system simulation based on ANSYS Electronics Desktop/Maxwell3D. J. Chem. Autom. Instrum. 2021, 48, 634–639. [Google Scholar]
  26. Yu, L.; Kang, J.; Wang, N.; Shao, L. A new threshold segmentation method for cotton root images. J. Hebei Univ. (Nat. Sci. Ed.) 2022, 42, 124–130. [Google Scholar]
  27. Wang, Y.; Guo, Z.; Fang, C.; Yang, G.; Wang, Q.; Guo, X. Adaptive threshold-based recurrent pruning algorithm. J. Appl. Res. Comput. 2022, 39, 1467–1471, 1477. [Google Scholar]
  28. Hollitt, C. A convolution approach to the circle Hough transform for arbitrary radius. J. Mach. Vis. Appl. 2013, 24, 683–694. [Google Scholar] [CrossRef]
Figure 1. Structural diagram of steel belt anchor hole inspection platform.
Applsci 14 04360 g001
Figure 2. Hardware layout of steel belt anchor hole inspection system.
Applsci 14 04360 g002
Figure 3. Control system task planning.
Applsci 14 04360 g003
Figure 4. Sketch of sensor movement patterns.
Applsci 14 04360 g004
Figure 5. Simulation model.
Applsci 14 04360 g005
Figure 6. Relationship between the coil’s horizontal displacement and its self-inductance at different distances from the steel belt.
Applsci 14 04360 g006
Figure 7. Experimental verification.
Applsci 14 04360 g007
Figure 8. Comparison of detection results with and without dust.
Applsci 14 04360 g008
Figure 9. Voltage values at different positions.
Applsci 14 04360 g009
Figure 10. Flowchart of anchor hole boundary extraction.
Applsci 14 04360 g010
Figure 11. Binary map after threshold segmentation.
Applsci 14 04360 g011
Figure 12. Extracted map of binarized boundary.
Applsci 14 04360 g012
Figure 13. Flowchart of Hough circle detection program.
Applsci 14 04360 g013
Figure 14. Hough circle detection.
Applsci 14 04360 g014
Table 1. Anchor hole identification and positioning results at a vertical distance of 15 mm.
No.Actual Coordinates/mmDetecting Coordinates/mmError/mm
1(670, 350)(672, 351)(2, 1)
2(566, 395)(568, 393)(2, 2)
3(645, 380)(644, 382)(1, 2)
4(505, 355)(507, 356)(2, 1)
5(510, 350)(512, 348)(2, 2)
6(525, 360)(523, 362)(2, 2)
7(508, 365)(510, 367)(2, 2)
8(530, 370)(528, 371)(2, 1)
Table 2. Anchor hole identification and positioning results at a vertical distance of 17 mm.
No.Actual Coordinates/mmDetecting Coordinates/mmError/mm
1(680, 380)(683, 382)(3, 2)
2(566, 400)(565, 403)(1, 3)
3(615, 395)(617, 393)(2, 2)
4(525, 370)(528, 368)(3, 2)
5(572, 360)(570, 362)(2, 2)
6(545, 375)(548, 377)(3, 2)
7(570, 365)(567, 367)(3, 2)
8(557, 374)(559, 377)(2, 3)
Table 3. Anchor hole identification and positioning results at a vertical distance of 19 mm.
No.Actual Coordinates/mmDetecting Coordinates/mmError/mm
1(690, 370)(687, 372)(3, 2)
2(576, 405)(579, 408)(3, 3)
3(654, 390)(650, 392)(4, 2)
4(510, 330)(512, 328)(2, 2)
5(530, 365)(532, 368)(2, 3)
6(570, 375)(567, 378)(3, 3)
7(610, 382)(613, 380)(3, 2)
8(605, 395)(602, 392)(3, 3)
Disclaimer/Publisher’s Note: The statements, opinions and data contained in all publications are solely those of the individual author(s) and contributor(s) and not of MDPI and/or the editor(s). MDPI and/or the editor(s) disclaim responsibility for any injury to people or property resulting from any ideas, methods, instructions or products referred to in the content.

