Abstract
The deterioration mechanism of red-bed soft rock is attributed to microstructural changes induced by water–rock interactions, where the damage to pores and the development of fractures significantly impact its macroscopic mechanical performance. The microstructural deterioration pattern of red-bed rock with different water saturation times was obtained by scanning electron microscopy (SEM), which showed that the microdamage effect of mudstone is an evolutionary process comprising the dissolution and detachment of its internal soluble bond structure. Three-dimensional (3D) images of the water-saturated damage of the rock mass were extracted by computed tomography (CT) scanning and calculated based on the box-counting algorithm to obtain the fractal dimension of the fracture development, leading to the theory that a soft rock fracture has multiple fractal characteristics. With the continuous increase in the water saturation time, the pores inside the rock mass began to reorganize and connect, and the mudstone specimens showed accelerated damage and some self-similarity. Furthermore, chemical element testing was conducted on the solutions used for water saturation, leading to the establishment of a microscopic interfacial evolution model describing water–rock damage, with theoretical equations derived based on diffusion theory.
1. Introduction
Red-bed soft rock, which is particularly susceptible to reactions with water because of the large amount of clay minerals present within it, is a rock mass with a porous medium that softens with water and disintegrates with water loss. The deterioration of the intergranular cementing material reduces the mechanical properties of the soft rock, leading to prominent geohazard problems in red mudstone areas. Currently, research on water–rock interactions in red-bed soft rocks focuses on three areas: water–rock disintegration, structural damage, and strength change (Guery et al. [1]; Deng et al. [2]; Zhu [3]; Zhou et al. [4]). The disintegrability of red-bed soft rocks is defined as the capacity of an intact rock mass to break down into bulk under water–rock interaction. This disintegration is caused by the destruction of the internal bonding structure of the red-bed soft rock, which leads to an increase in the inhomogeneity coefficient, an increase in the specific surface area and a decrease in the disintegration resistance index. This process is also accompanied by the disruption of the internal connecting bonds of the minerals and the release of energy. Numerous scholars have conducted wet–dry cycle tests on red-bed soft rocks (Liu et al. [5]; Zhan et al. [6]; Yan et al. [7]). Red-bed damage is accompanied by changes in microstructure and mineral composition. The key deterioration factor of mudstone in the damage process is the fragmentation and suspension of particles due to the softening and dissolution of the interfacial cementation structure. With the softening and damage of solid particles, the ion concentration in deionized distilled water will gradually increase. Some scholars have described the damage process of red mudstone based on the second law of diffusion (Chen et al. [8]; Liu et al. [9]). The process of water–rock interaction invariably results in structural damage to red-bed soft rock. This destruction of the macroscopic structure is the cumulative manifestation of microstructural damage. The structural change rule of red-bed soft rock can be obtained by wet–dry cycle tests. Furthermore, the structural change process of red-bed soft rock can be observed based on image technology, such as CT scanning, SEM, etc. (Yao et al. [10]; Zhou et al. [11]; Zhou et al. [12]; Zhang et al. [13]). The strength variation of soft rock has been extensively researched, with a particular focus on compressive strength and shear strength. These studies have established a comprehensive mechanical testing system for the investigation of the water–rock interaction, elucidated the underlying strength change rule in soft rock’s water–rock interaction and proposed a constitutive model to describe the strength change (Mandal et al. [14]; Huancollo et al. [15]; Alekseev et al. [16]; Jaiswal et al. [17]).
Fractal theory was first proposed by the French mathematician Benoit Mandelbrot in 1975 and is mainly used to describe the many objects in nature with an irregular geometry (Mandelbrot [18]). These objects have a disordered geometry and no regular geometric features, and fractal theory is suitable for describing this class of objects. It uses self-similarity theory to describe the irregular geometric objects in nature from local to whole, from ordered to disordered and from finite to infinite. Therefore, fractal theory can effectively describe nonlinear problems, and a large number of researchers have applied fractal theory to describe the morphology of fractures and evaluate the cracking mechanisms (Hewage et al. [19]; Du et al. [20]; Chen et al. [21]). The deterioration of rocks is characterized by the generation and evolution of fractures that are irregular and disordered. Consequently, the irregular evolution of rocks in the deterioration process can be characterized by means of three-dimensional fractal dimensions, thus enabling the complexity of the arrangement of the fractures to be studied (Zhang et al. [22]).
The preceding studies reveal that the majority of existing research has focused on qualitative analysis, with a notable absence of studies investigating the nature of the water–rock interaction in soft rocks and the evolution law of water–rock interfaces. However, the generation and development of microscopic fractures in soft rock have been identified as playing a pivotal role in the mechanical properties of these materials. To address the aforementioned issues, this study employs SEM and CT scanning techniques to quantitatively analyze microscopic waterstone damage in soft rocks based on fractal theory. This analysis reveals the dispersion degree and density of the fracture development. Additionally, the ion concentration in the solution used for water saturation is examined to obtain the rule of change. Finally, a kinetic model describing the changes in the soft rock microfacies is proposed.
2. Materials and Methods
2.1. Material
The specimens utilized in the experiment were undisturbed samples of red-bed soft rock from the rear edge of the Duanqu landslide in Nanjian County, Sichuan Province, China. These samples were sealed with plastic wrap and Ziploc bags and subsequently transported to the laboratory for processing and testing. In its natural state, the compressive strength is 6.5 MPa, the cohesion is 2.04 MPa, the internal friction angle is 32.5°, the porosity is 0.6%, the density is 1.95 g/cm3 and the water content is 18.6%. Following a period of 90 days of water saturation, the compressive strength of the soft rock was found to be 3.4 MPa, with a cohesion value of 1.24 MPa, an internal friction angle of 18.7°, porosity of 7.66%, a density of 1.71 g/cm3 and water content of 36.1%. The main mineral components were quartz, sodium feldspar, microplagioclase feldspar, calcite, hematite, kaolinite, illite and montmorillonite. The specimens used for CT scanning were four standard cylindrical mudstone samples with dimensions of Φ50 mm × 100 mm, designated as C1, C2, C3 and C4, respectively. The specimens were prepared in accordance with the test procedures of the International Society for Rock Mechanics (ISRM) (Ulusay et al. [23]). The samples used for scanning electron microscopy were flake soft rock samples obtained from the same area. The specimen soaking solution was deionized water, and the test temperature was 20 ± 0.5 °C.
2.2. Test Procedures
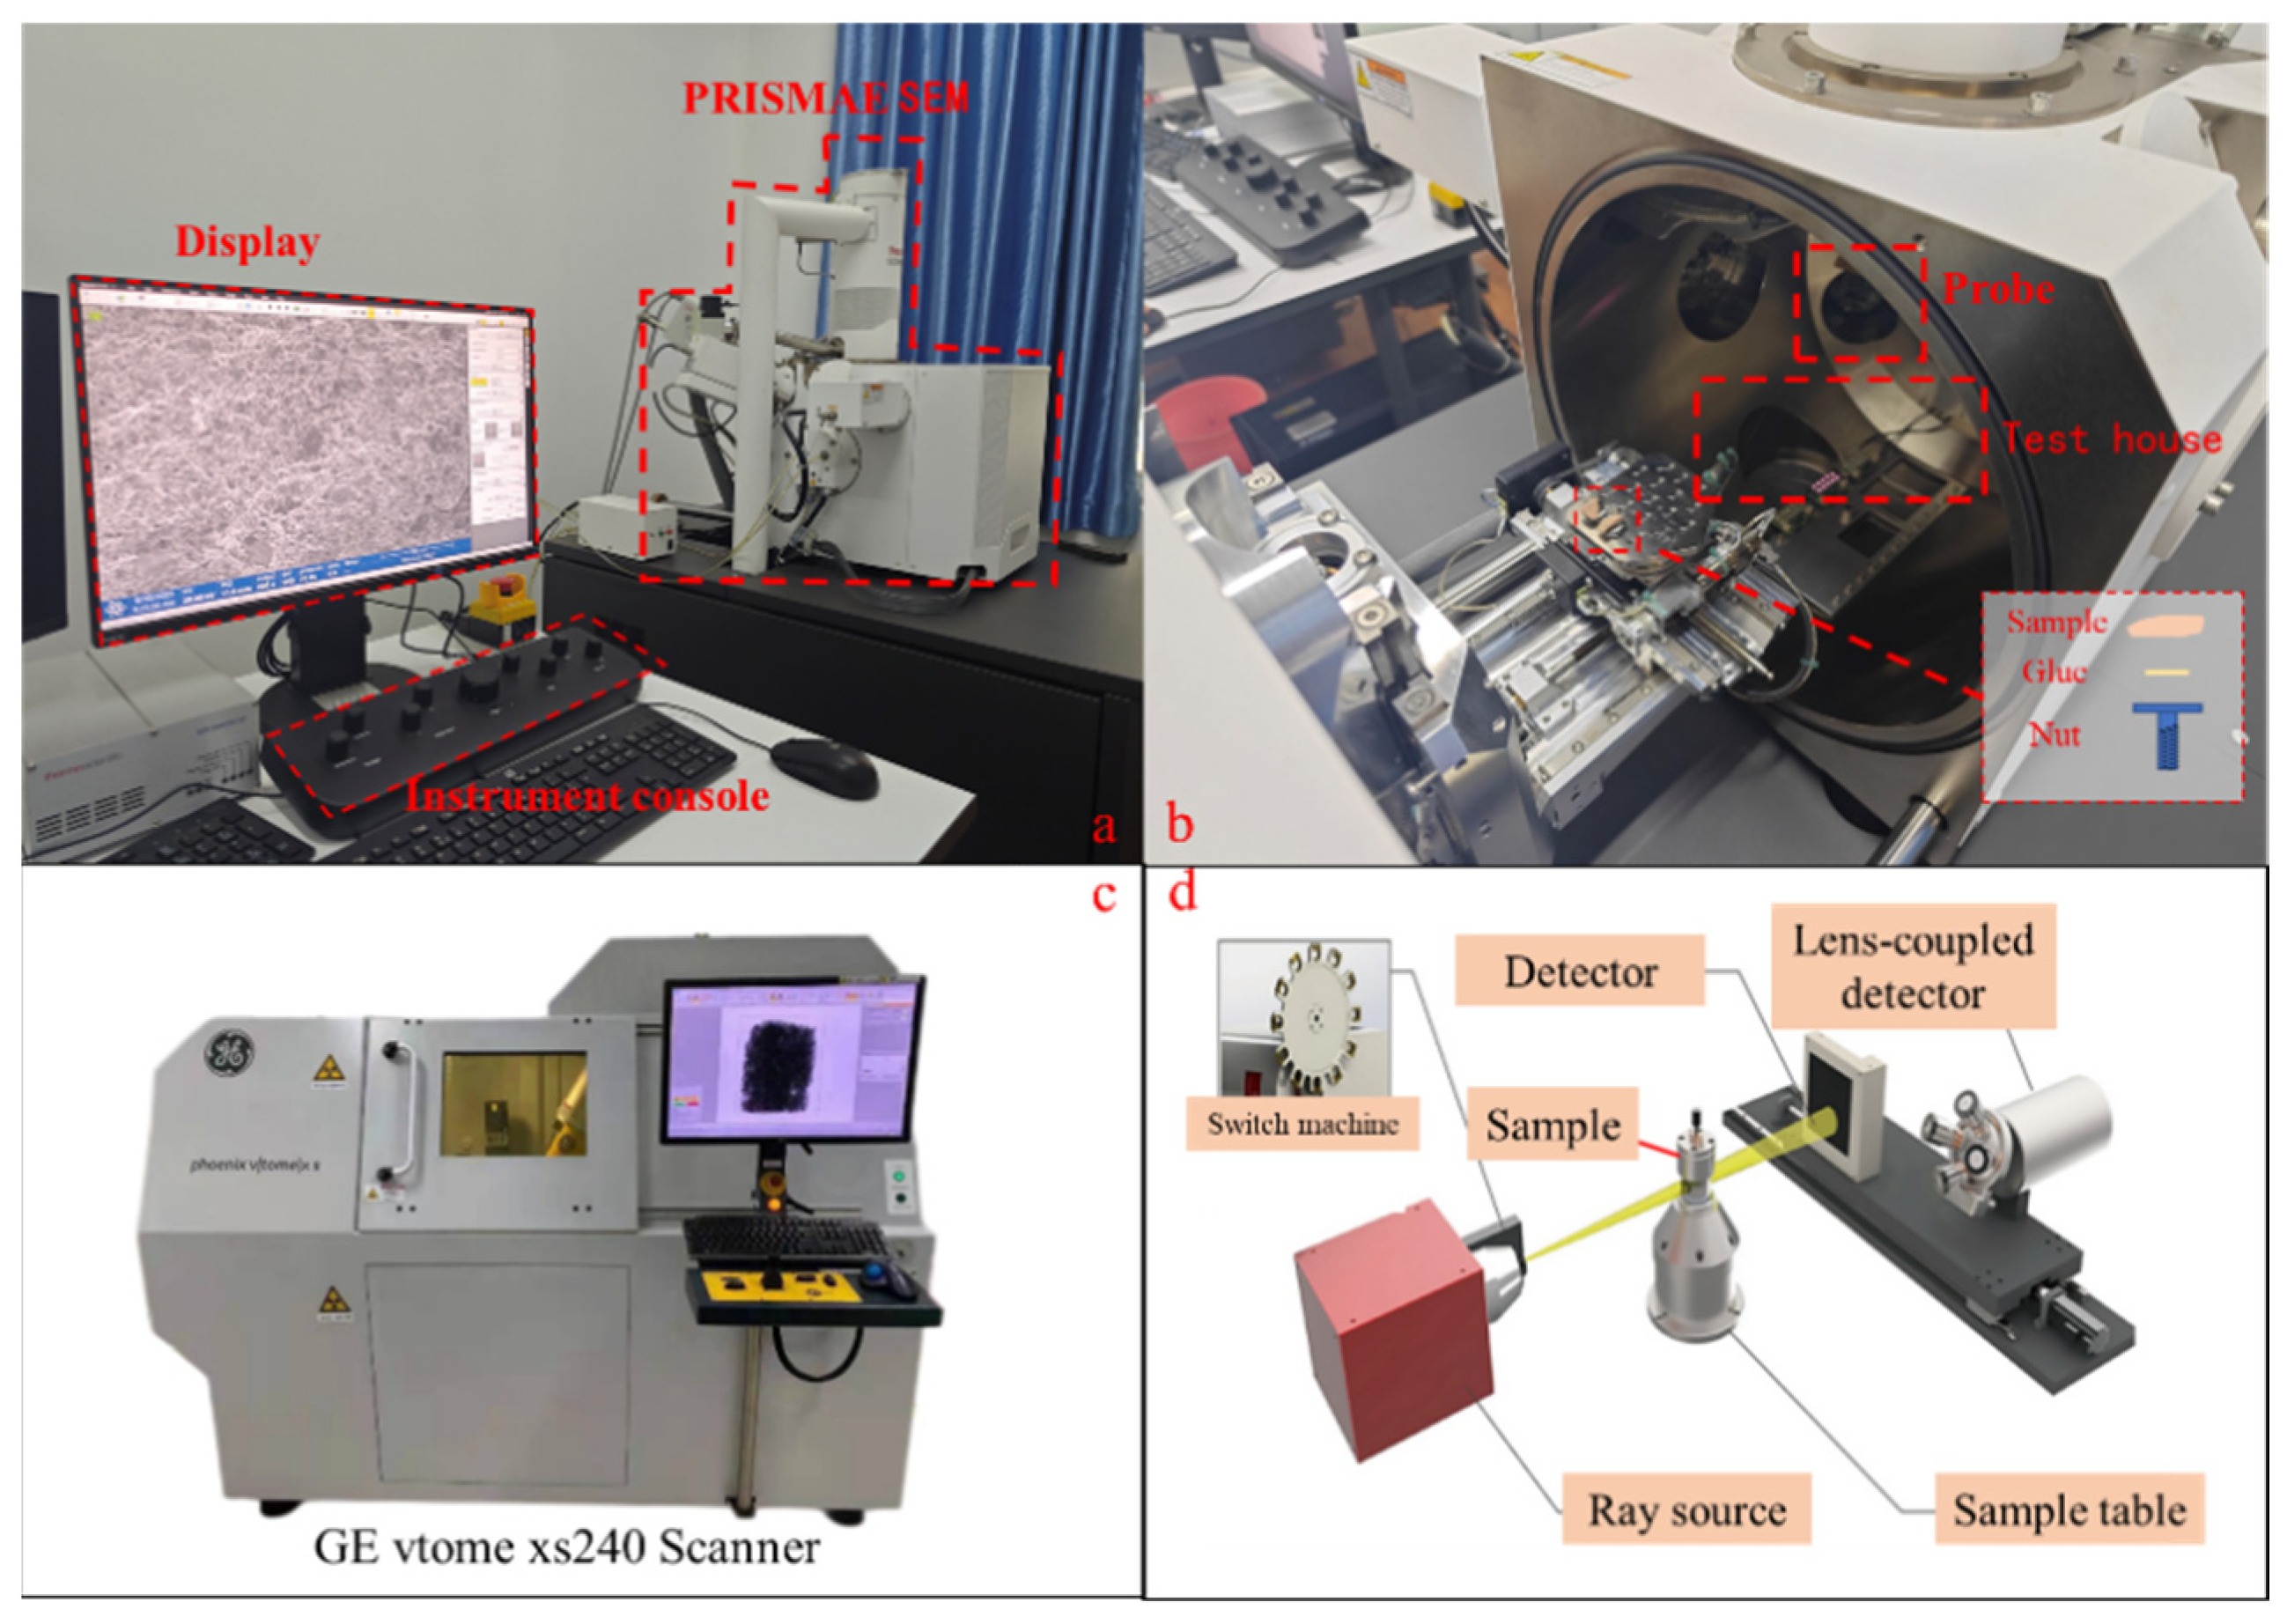
In order to reduce the influence of various mineral components in the solution on the test results and to accurately obtain the changing rule of the water–rock interaction in the red bed, deionized water was used as the soaking solution in this test. The flake samples were observed using a PRISMAE scanning electron microscope with a resolution of 3.0 nm after soaking in deionized water for 0, 7, 30 and 90 days (Figure 1a,b). Two samples, designated as A and B, were subjected to testing, and three observations were recorded for each sample: A1, A2, A3, B1, B2 and B3. Following their observation, the samples were carefully removed and re-immersed without replacing the soaking solution. A small quantity of the soaking solution was extracted using a dropper for ion concentration detection, with the aim of determining the ionic rule of change following the completion of each soaking period. Cylindrical specimens were immersed in deionized water for durations of 0, 7, 30 and 90 days. The GE vtome xs240 scanner was employed to obtain sliced images (Figure 1c,d), with the maximum magnification of 1.46X–100X, a minimum voxel size of 1 micron and an observable sample mass of 10 kg. The magnification employed in this test was 25X, with the smallest voxel measuring 2 microns. The scanner’s operational principle is to detect damage to the specimen through the degree of attenuation of the X-rays. The X-rays exhibit varying degrees of penetration capacity for different specimens, and their signal reception results in distinct morphological characteristics. A radiation detector situated at the opposite end of the sample receives the signal; analyzes its intensity, frequency, speed and other parameters; and transmits the data to the data acquisition instrument in order to obtain the electronic radiation signal in a given direction.

Figure 1.
Test instruments ((a) collecting instrument; (b) scanning electron microscopy; (c) CT scanner; (d) CT scanning principle).
3. Results
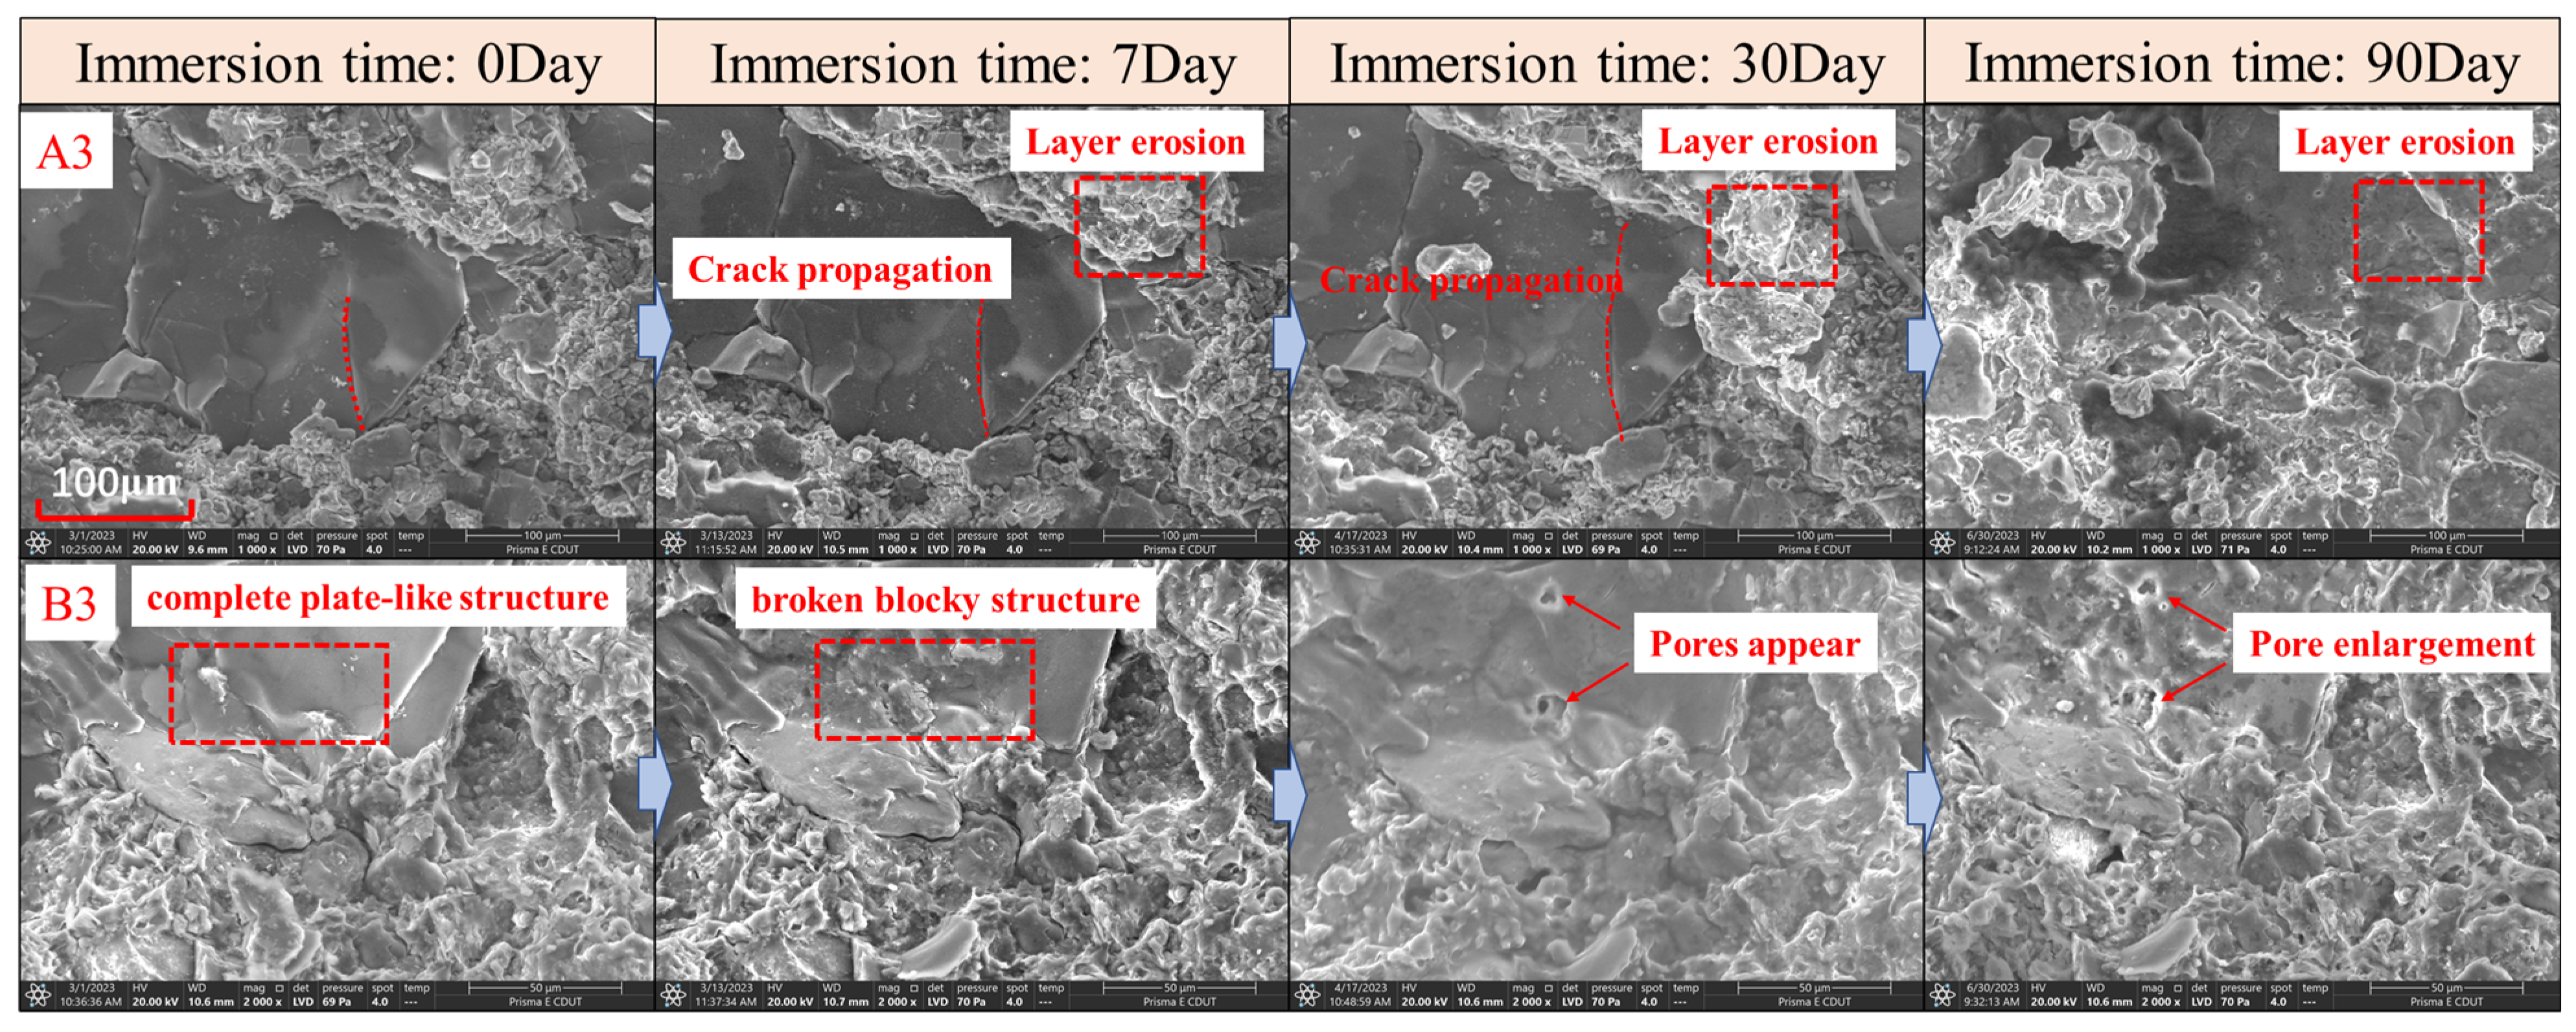
A total of six observation points were observed in the test. The A3 and B3 observation points, which demonstrated superior results, were analyzed as exemplars. As illustrated in Figure 2, the samples exhibit a mixture of flocculated and plate-like structures. The interfacial joints are connected by broken flocculated structures, and the main fractures and pores of the observed samples are distributed at the junction of the two. Among these, a small proportion are fractures resulting from the deterioration of the plate-like structure, while the majority are fractures and pores caused by the separation of the flocculated structure from the plate-like structure, as well as the detachment of the flocculated structure itself (Huang et al. [24]). The process of change is shown in Figure 2 below.

Figure 2.
Microstructural changes in red-bed soft rock.
In its natural state, the structure of the red-bed soft rock is characterized by two distinct types of structures: broken blocky structures and complete plate-like structures. The broken structure surrounds the plate-like structure, and the plate-like part is more complete. There are a few fractures distributed at the boundaries, while the internal structure has fewer fractures. The surrounding fragmented area is jagged and uneven in size and distribution, with clearly visible borders.
Following a seven-day saturation period, the specimens exhibited a predominantly fragmented structure, with complete plate-like structures present in the surrounding area. However, the tiny fractures in the plate-like structure began to gradually extend to the surrounding area, and the originally smooth surface gradually became rough, with tiny pores sporadically distributed. Concurrently, some of the blocks were observed to be shedding in layers. The fractures around the block extended and opened up, resulting in an increase in the depth and area of the surrounding pores and the shedding of broken particles from the pore walls. The original tiny particles were partially detached from the rock mass, and the larger particles had become more fragmented, with the boundaries gradually blurring, resulting in the surrounding fragmented mass beginning to change towards a flocculent shape.
After a period of one month during which the specimens were saturated with water, the lamellar shedding phenomenon on the surface of the originally intact block structure gradually intensified, resulting in the gradual disintegration of the entire piece. Pores of 3 μm–5 μm appeared in the middle of the specimen, dividing the intact rock mass. The peripheral fracture structure had essentially detached from the parent rock, and the boundary was blurred, essentially completely transformed into flocculent material. The form of contact also began to gradually transition from the original face-to-face contact to face-to-edge and edge-to-corner contact. As a result, the tiny particles on the surface began to fall off in large areas.
Following a period of 30 days during which the specimens were once again saturated with water, the interfacial connection between the particles began to break away from the rock mass and dissolve with the water as it entered the interior of the soft rock. The original small pores began to expand around them, and the larger pores began to gradually connect to form fractures. The original intact portion of the large area was peeled off in layers, and the tiny particles were almost completely transformed into flocculent material. The original intact rock mass began to soften and become loose. Overall, the micro-morphology changed significantly from the natural state, and the previous shape was almost eliminated.
The deterioration of the red-bed soft rock at the microscopic level is primarily manifested by the softening effect of water on the filler between the particles. This results in the tiny particles shifting from a solid to a flocculated form and gradually dissolving in the water, which in turn increases the porosity and expands the tiny fractures. In essence, the microdamage action of soft rocks is an evolutionary process involving the dissolution and detachment of their internal soluble linkage structures. This process of the dissolution of grain boundaries is referred to as the micro-interfacial effect in red-bed soft rocks.
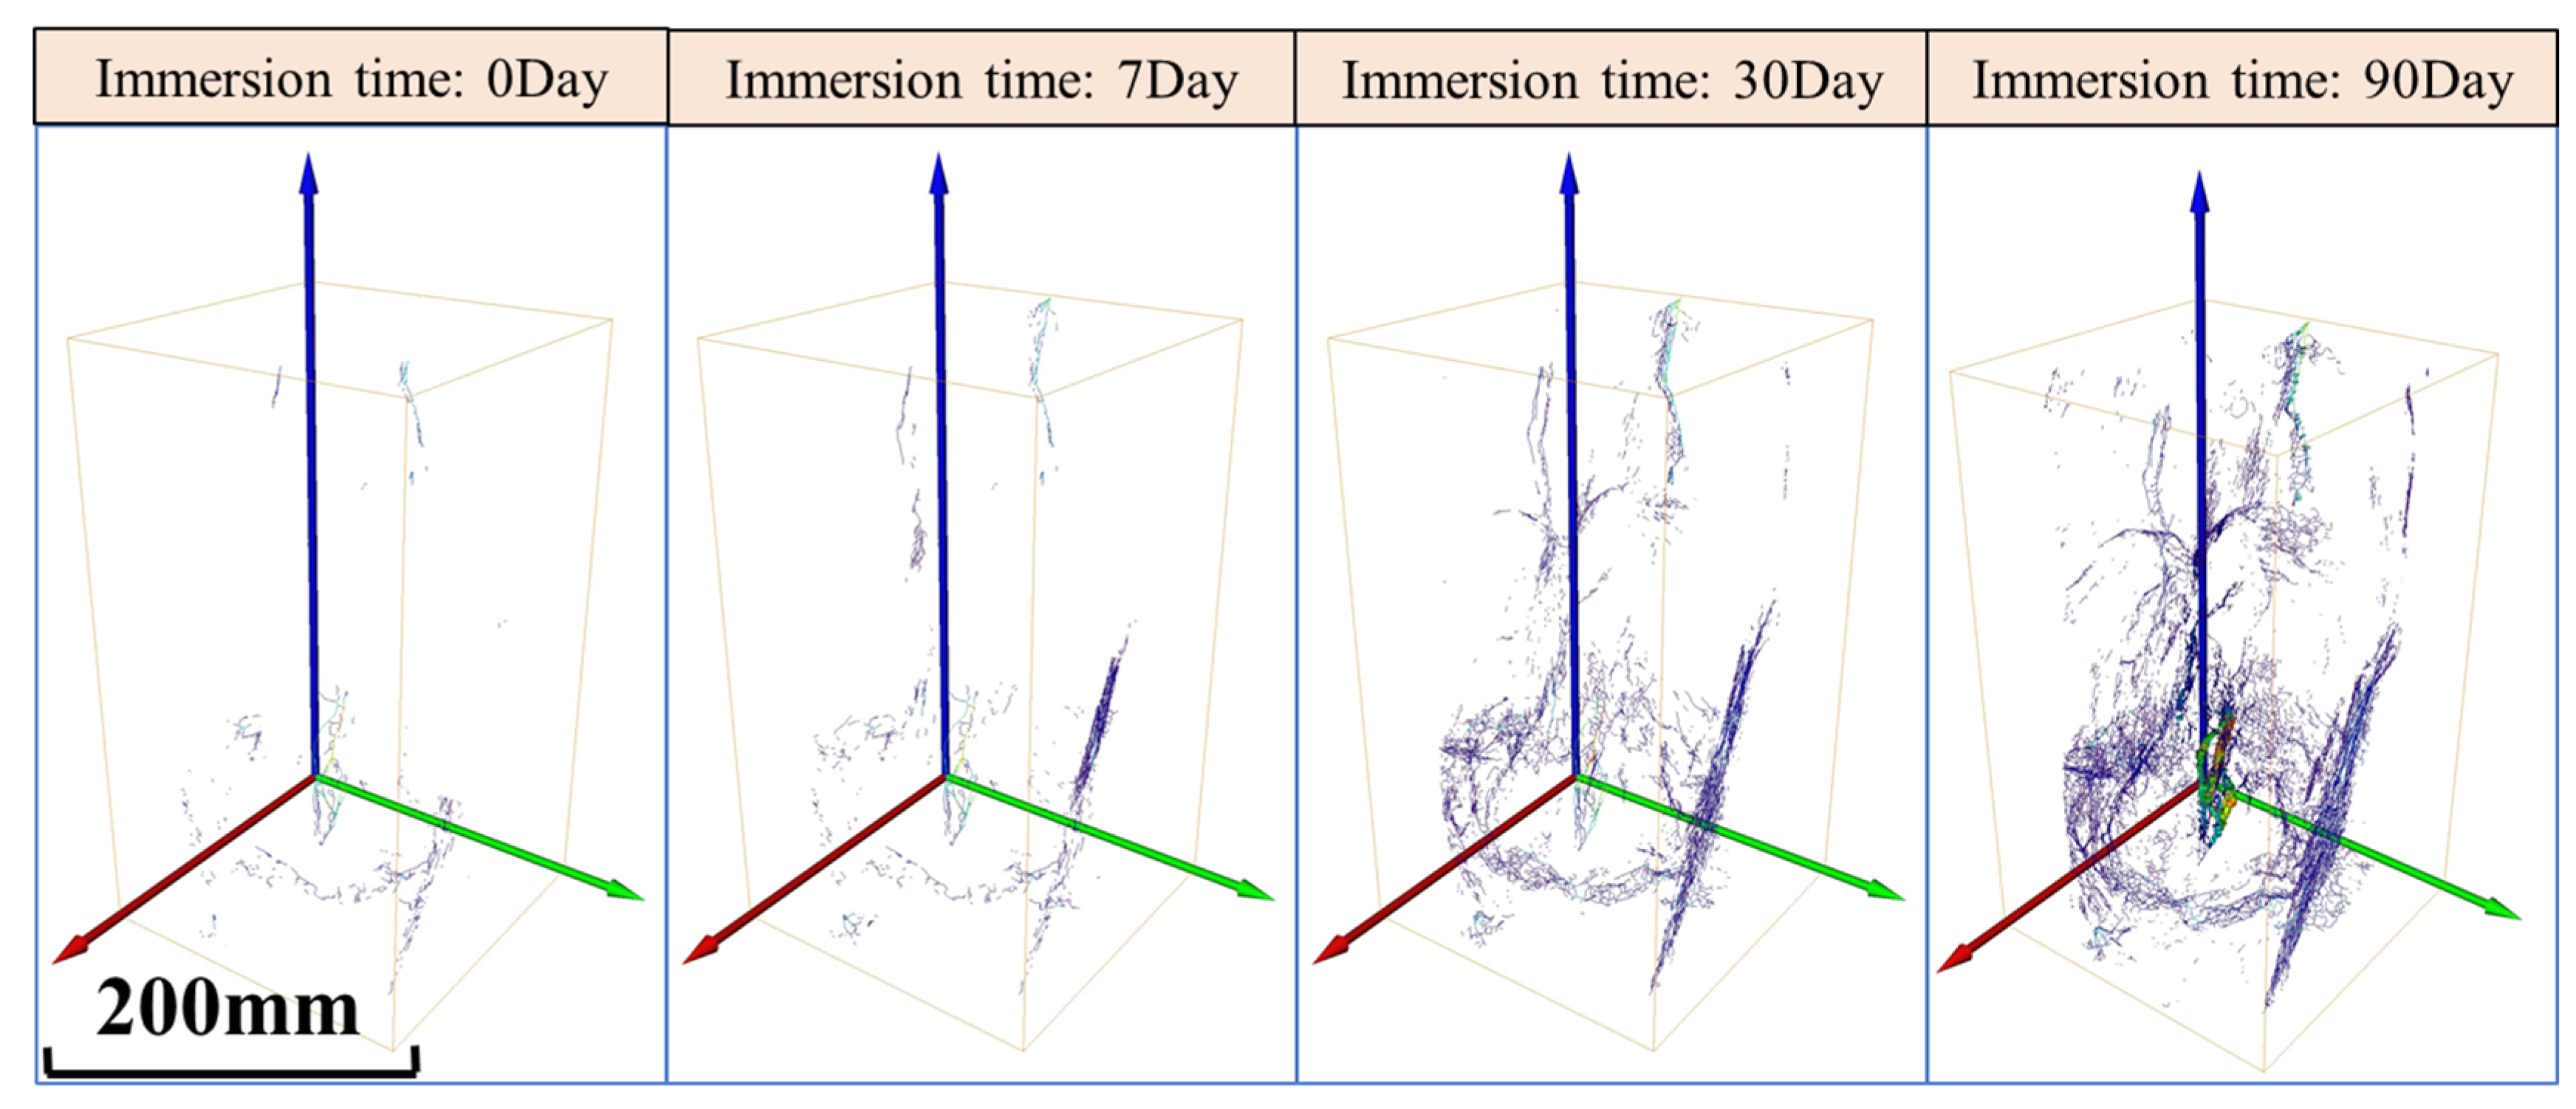
Through the regular observation and recording of four sets of cylindrical samples sampled from the same location, the morphology of the red-bed soft rock specimens with different water saturation times was obtained. As illustrated in Figure 3, the surface of the specimen in its natural state is intact and has no directly visible pores or fractures. The slight color difference in the middle of the specimen is the result of the close association of different mineral compositions, and the specimen profile is complete. Upon reaching a saturation time of seven days, the surface of the specimen exhibited the emergence of approximately 0.3-mm-wide fractures, accompanied by the crumbling of the specimen’s edge. At a saturation time of 30 days, the fractures on the specimen’s surface began to extend and gradually connect from top to bottom, reaching a width of 0.5 mm. At 90 days of water saturation, the upper portion of the specimen exhibited a significant area of falling blocks, with the fractures beginning to connect with each other. The fracture width expanded from 0.5 mm to 0.8 mm. The specimen prism exhibited a collapse at the edge, accompanied by the disappearance of almost any discernible boundaries. The acquired attenuation signals of the red-bed soft rock were reconstructed in 3D using VGStudio MAX 3.0. The 3D model of the red-bed soft rock was then quantitatively analyzed and key parameters were extracted using the 3D visualization software Avizo 2019.
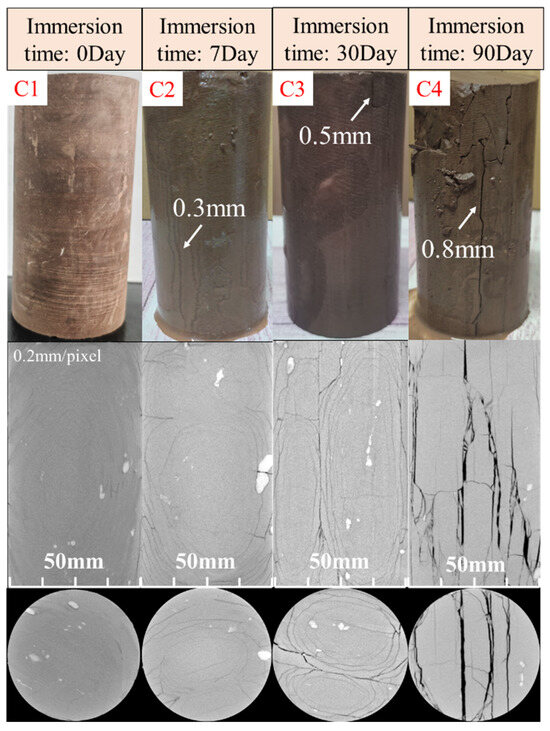
Figure 3.
Photographs of red-bed soft rock water saturation tests.
The test results indicate that the damage to the red-bed soft rock at saturation extended from the exterior to the interior. The tiny fractures in the initial water-saturated state gradually expanded into large fractures, and then the fractures were connected with each other and finally fell off in the form of flakes. Within 30 days of water saturation, the red-bed soft rock was essentially intact. At 30 days to 90 days, the sample began to display unconnected fractures, at which point it remained morphologically intact. After more than 90 days of water saturation, the specimen reached a state of basic fragmentation, no longer meeting the requisite mechanical test conditions.
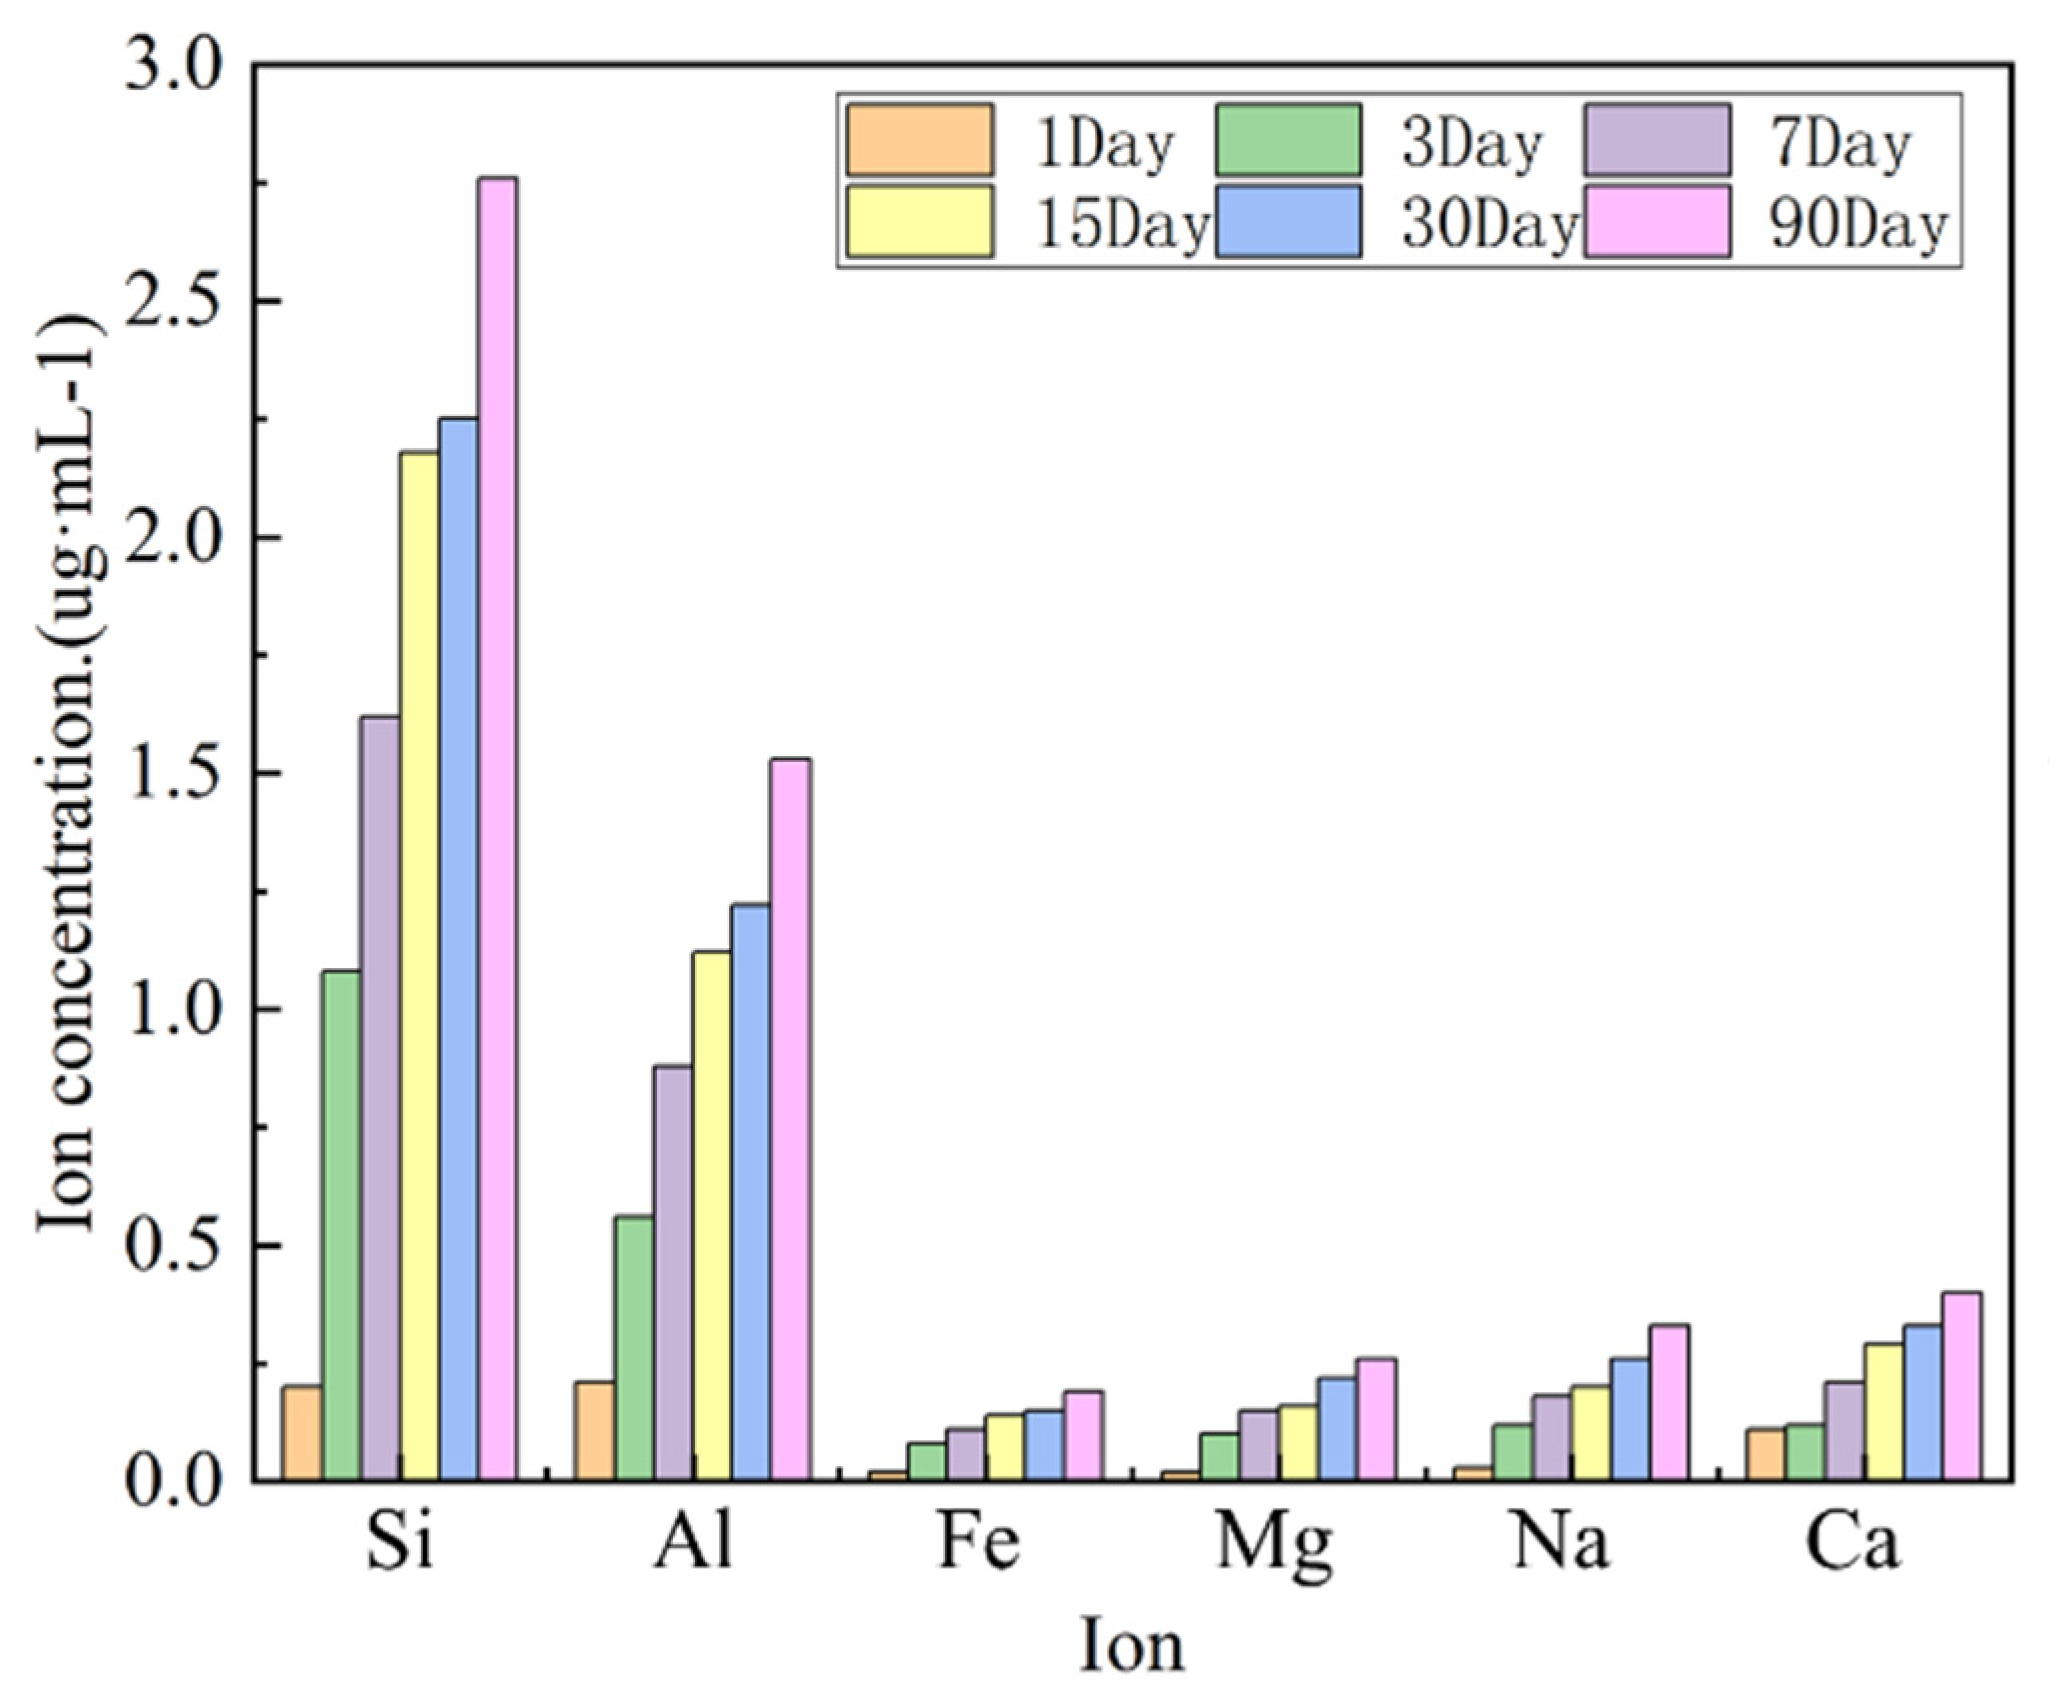
In the SEM water saturation process, the ionic concentration changes of Si4+, Al3+, Fe2+3+, Mg2+, Na+ and Ca2+ in the aqueous solution used for 1, 3, 7, 15, 30 and 90 days of water saturation in the specimens were determined using an X-ray fluorescence spectrometer. The results of the assay are shown in Table 1. Given that different ions possess disparate valences, the concentrations of ions in aqueous solutions exhibit considerable variability.

Table 1.
Statistics of ion concentrations in aqueous solution.
The precipitation of Si and Al ions occurred first, resulting in a faster growth rate. The results demonstrated that the aqueous solution exhibited the greatest increase in content with Si ions, followed by Al ions. When combined with the aforementioned XRD test, it can be observed that the mineral elements of these two ions are the minerals with the highest content in the red-bed soft rock, as well as the important constituent elements of clay minerals. Consequently, during the deterioration and dissolution of red-bed soft rock, Al and Si ions are dissolved in the water in significant quantities, accompanied by the dissolution of other ions. This change process is illustrated in Figure 4.

Figure 4.
Changes in solution ions.
As can be seen from Figure 4, although a variety of ions exhibited an increasing trend with the increase in the water saturation time, their proportion in the total number of ions was almost constant. This suggests that the relative rates of change in the concentrations of the six ions are almost the same under different saturation time conditions.
4. Discussion
4.1. Quantitative Analysis of Microscopic Interfacial Damage in Soft Rock
With regard to interfacial cleavage, it can be observed that all of the cleavage generated by the deterioration of the red-bed soft rock during water saturation is developed from microporous cleavage. In this section, we analyze the three-dimensional structural distribution characteristics of the fractures in the process of the emergence and expansion of the red-bed specimens under different water saturation times. The objective is to determine the fractal relationship between the equivalent diameters and the surface area and volume of the fractures, respectively.
In the process of damage in the rock mass, the fractures all possess non-standard geometrical forms, so it is necessary to quantitatively analyze the evolution process of the fractures. Firstly, the equivalent diameter of the fracture needs to be extracted, which can be calculated by
where Deq is the equivalent diameter of the fracture, which is the diameter of a sphere of the same volume as the target fracture, and V is the volume of the fracture.
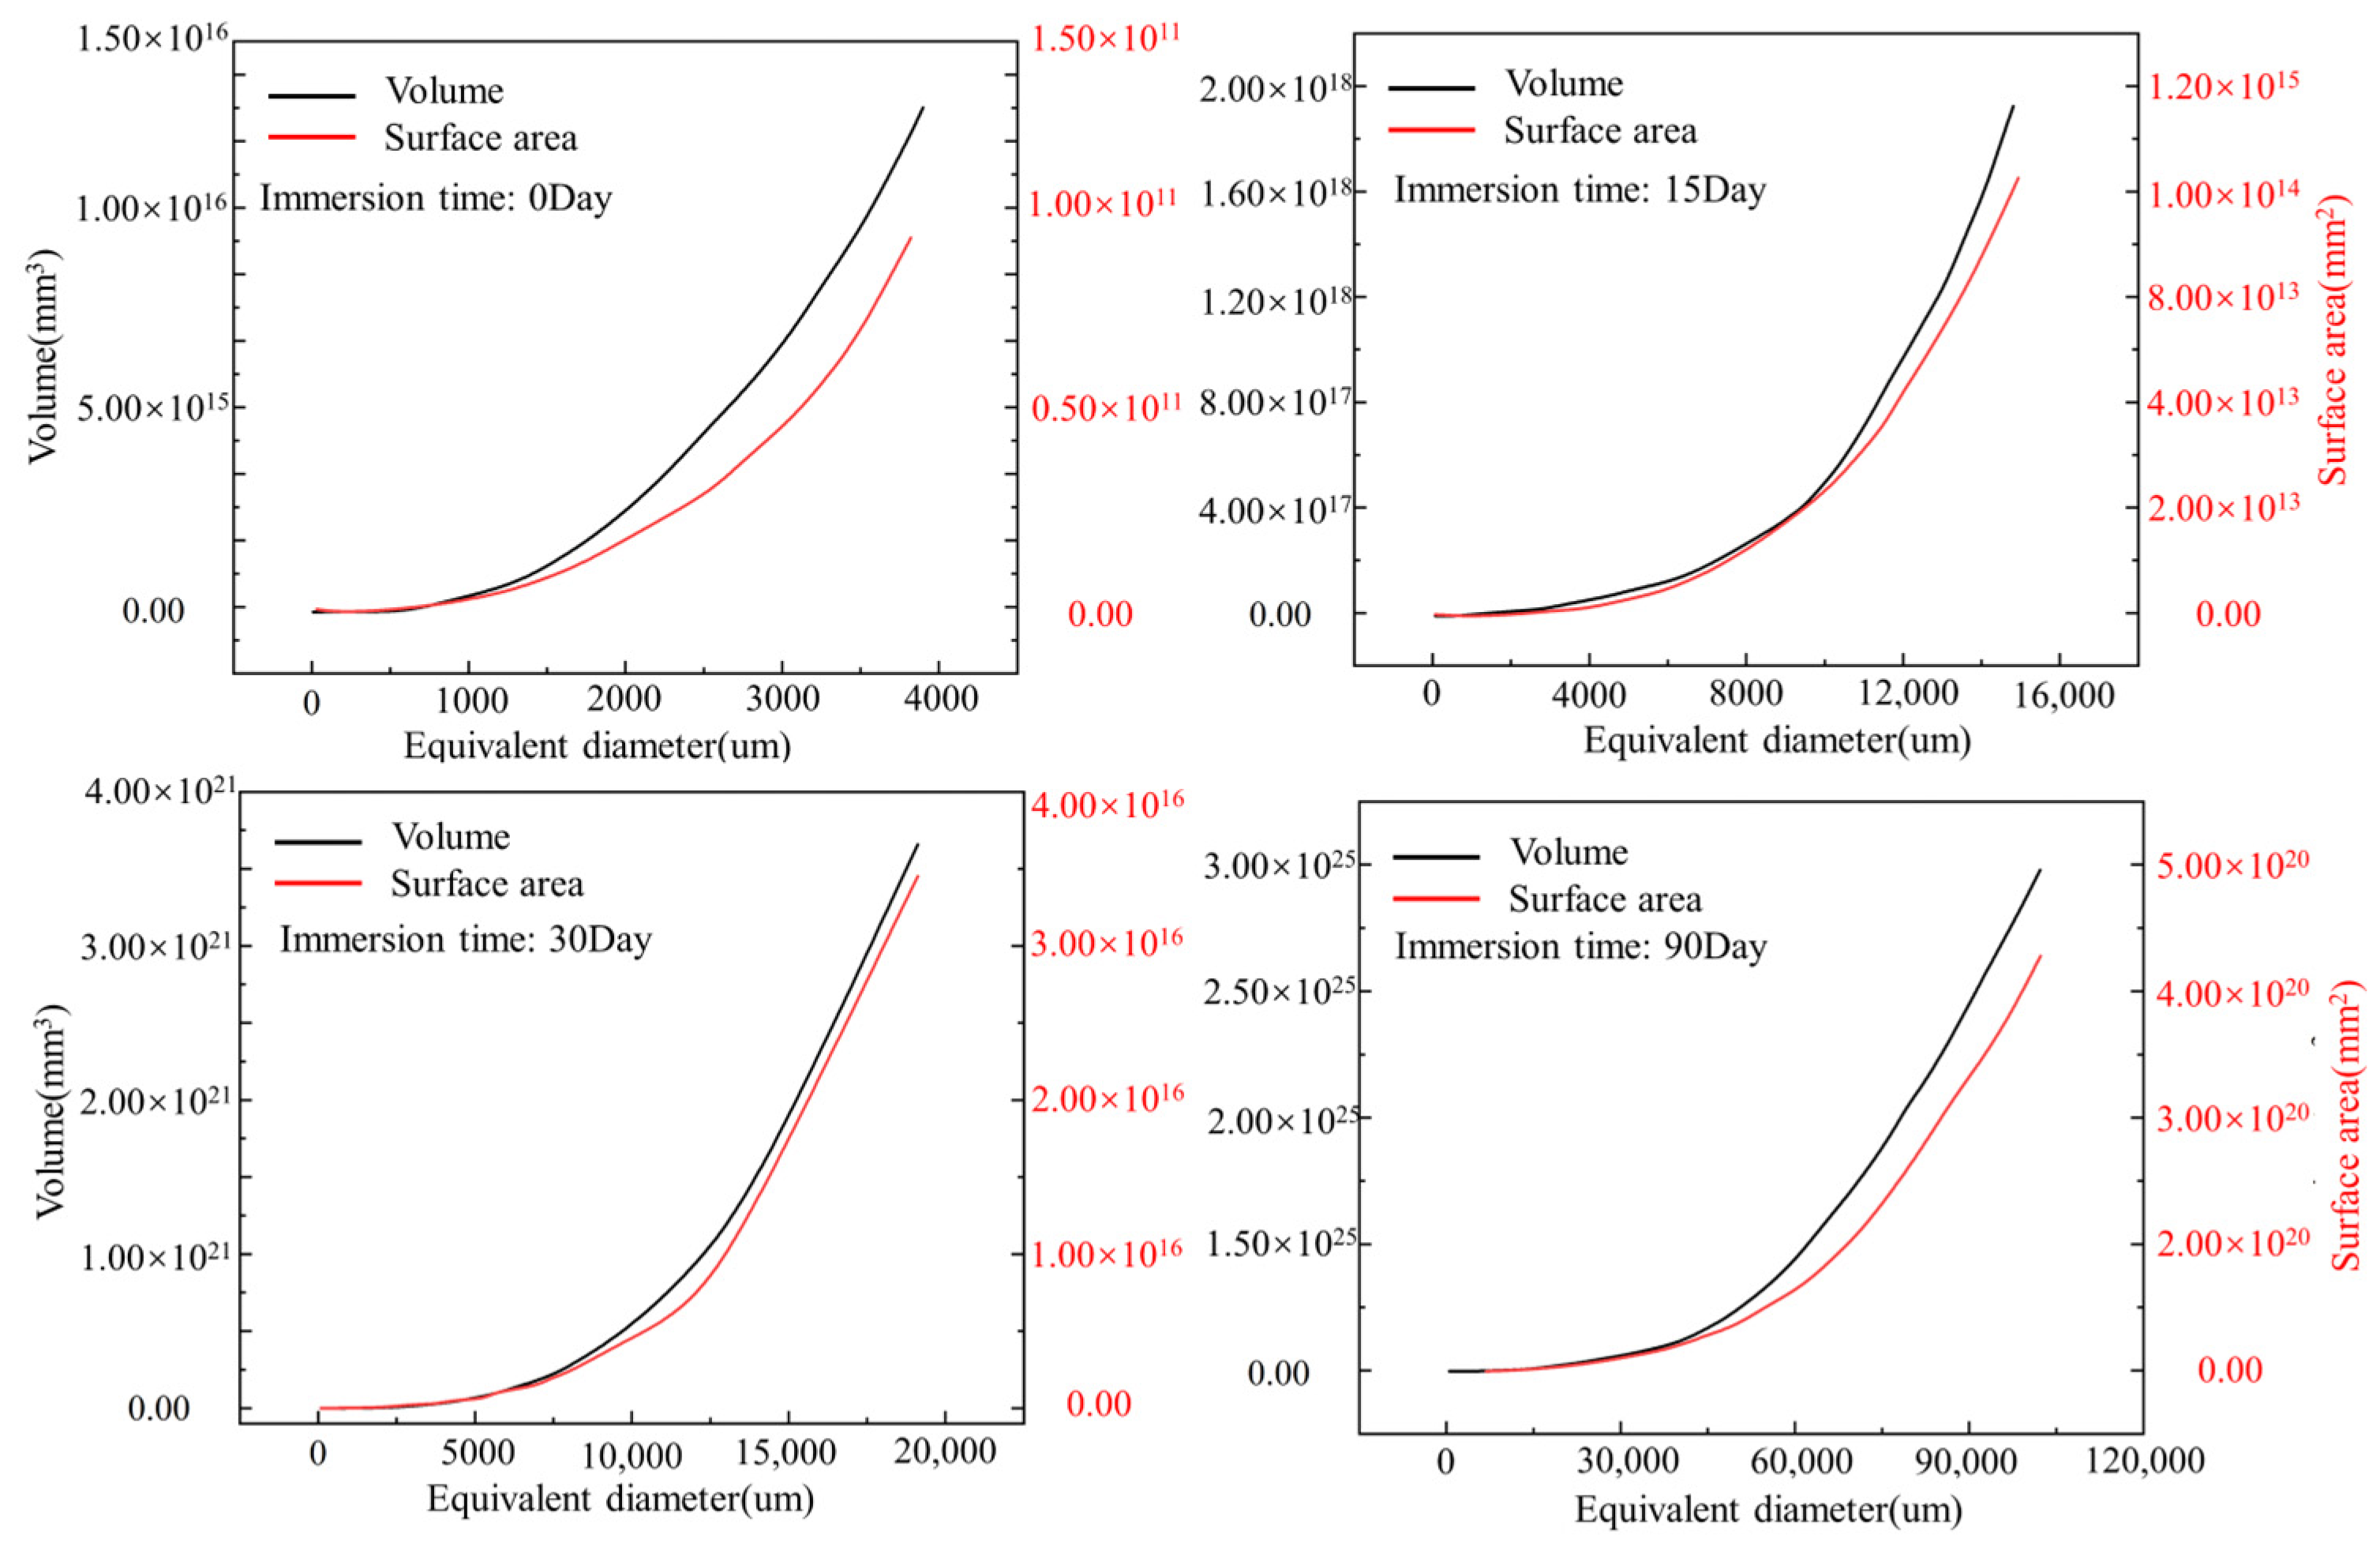
The surface area and fracture volume of the red-bed soft rock fractures with four water saturation times were subjected to further curve fitting, as shown in Figure 5. The fitting results demonstrate that with the increase in the water saturation time, the maximum equivalent diameter identified grows from 4000 μm to 16,000 μm, an increase of approximately 400%. Furthermore, at the same saturation time, the fracture volume and fracture surface area demonstrate an accelerated upward trend with the increase in the equivalent diameter. It is noteworthy that the volume of the fracture exhibits fluctuations with the increase in the equivalent diameter when the equivalent diameter is relatively small.
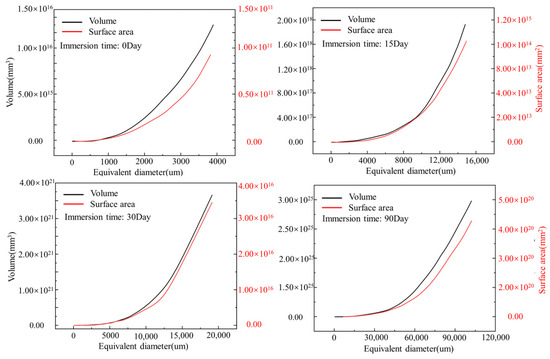
Figure 5.
Fracture statistics for different water saturation times in the red-bed soft rock.
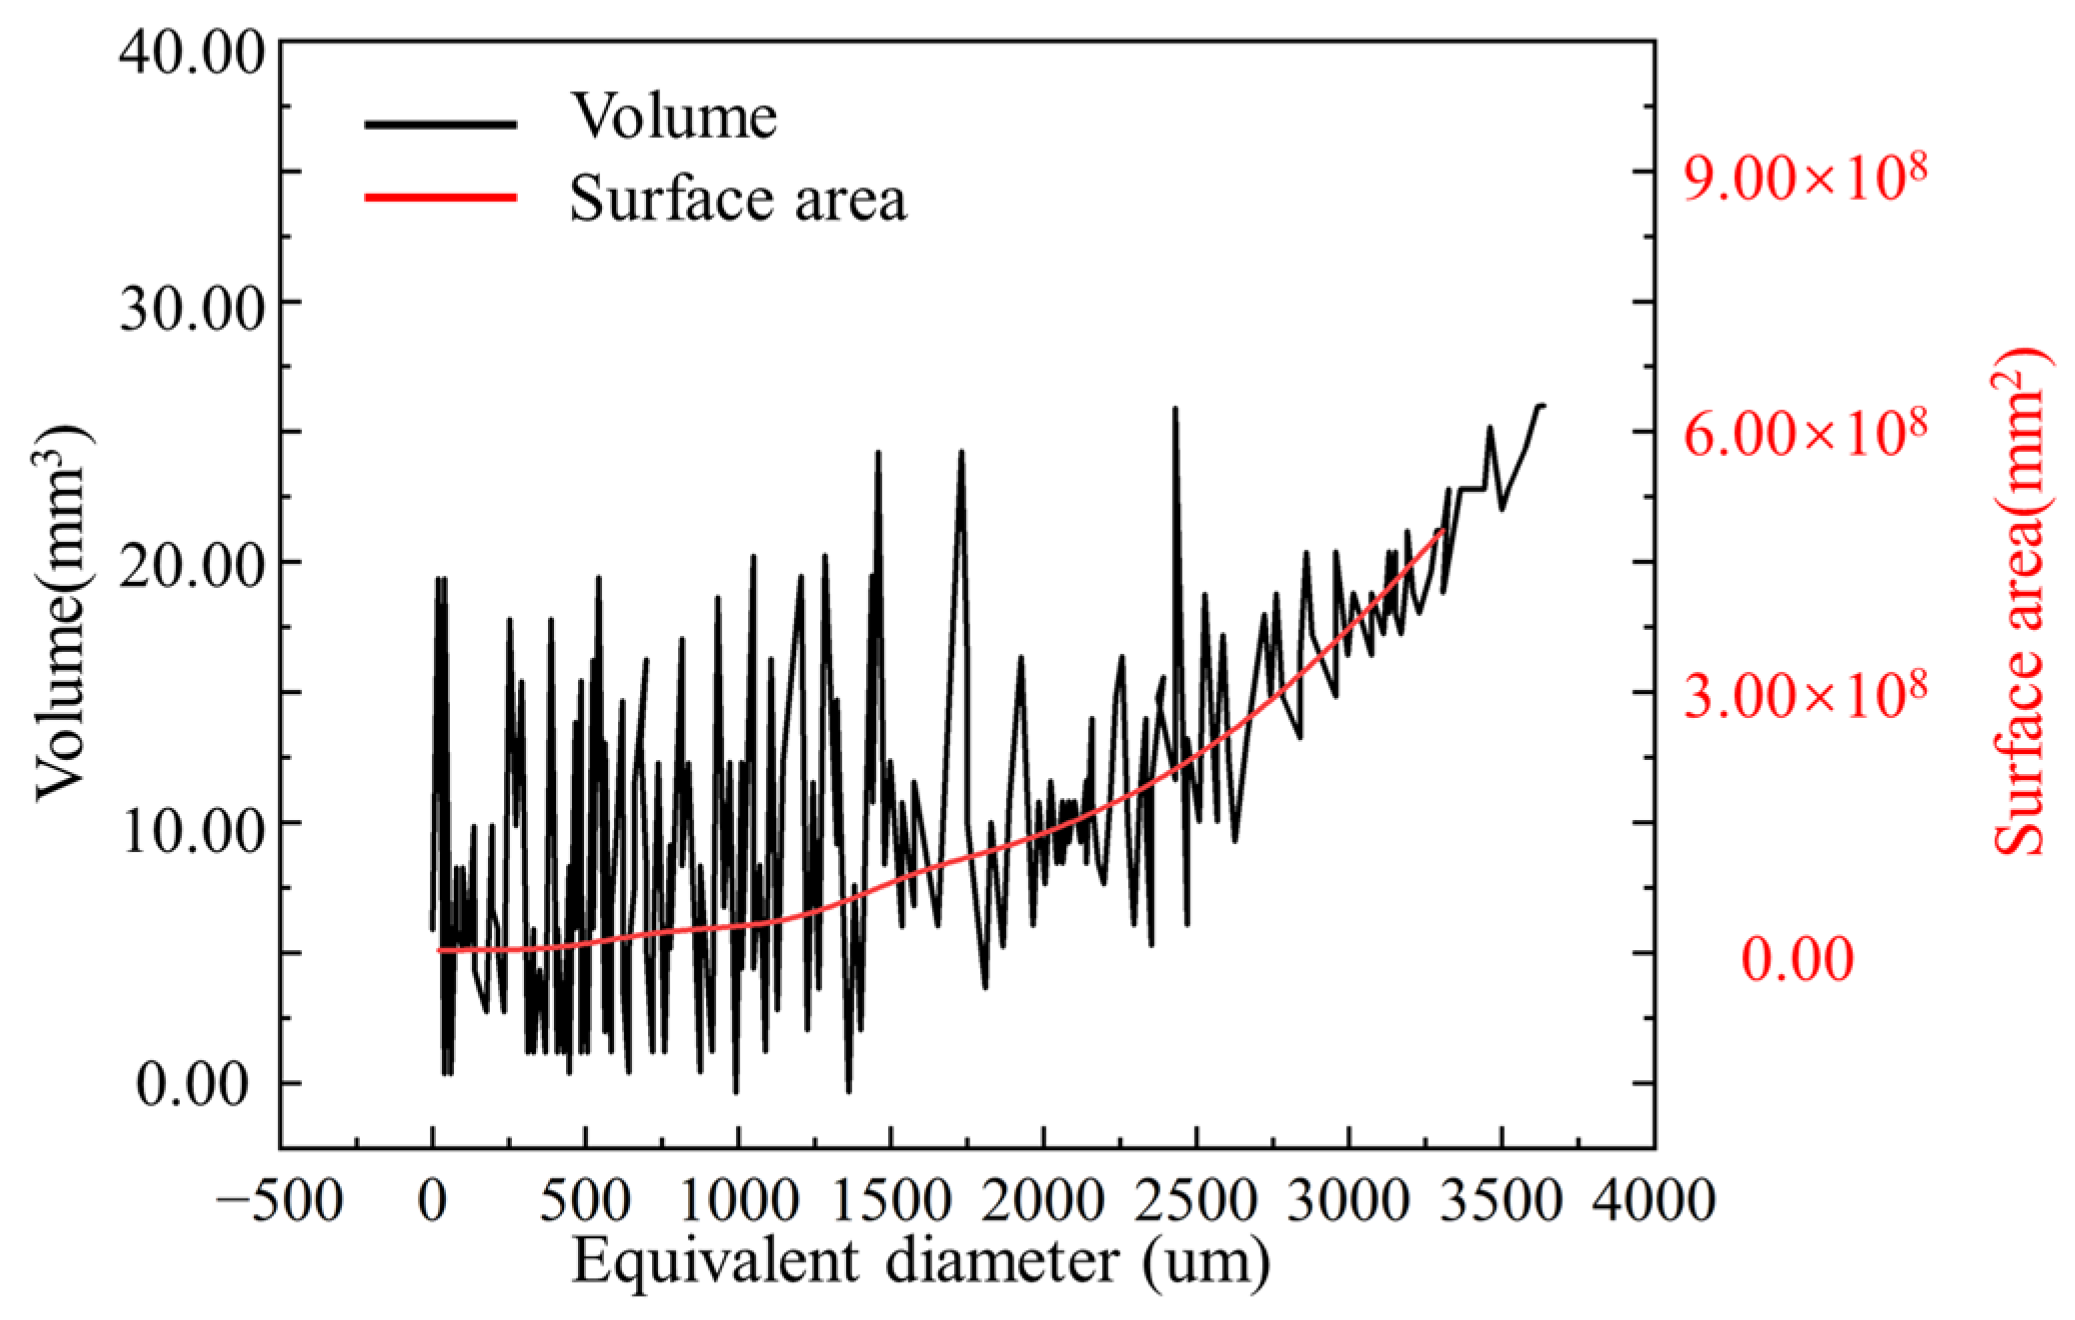
Figure 6 illustrates the change in the fracture structure parameters of the microporous fracture at 30 days of water saturation. It can be observed that the fluctuations gradually stabilize with the increase in equivalent diameter. This is attributed to the formation of microporous fractures at the initial stage, where the 3D shape factor is high, resulting in a highly irregular fracture morphology. As the water saturation time increases, the microporous cleavage gradually enlarges and approaches a sphere, while its 3D shape factor gradually decreases and ultimately tends to 1. At this point, the pore is a standard sphere.
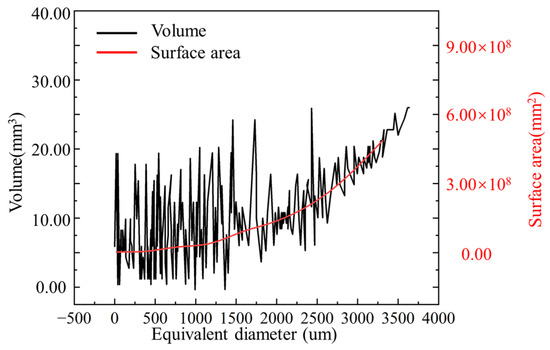
Figure 6.
Microporous fracture statistics.
4.2. Three-Dimensional Fractal Dimension of Red-Bed Soft Rock Fracture Structure
The deterioration of rocks is characterized by irregular and disordered generation and the evolution of fractures. Therefore, the irregular evolution of rocks in the deterioration process can be characterized in terms of three-dimensional fractal dimensions to study the complexity of the arrangement of fractures. The single fractal dimension, as a quantitative index, is a fundamental parameter used to quantitatively measure self-similar random shapes and phenomena. The box-counting method is a widely used approach in fractal calculations in nature. Therefore, this method is adopted in this paper to calculate the fractal dimension of the fracture distribution in the red-bed soft rock specimens. This method offers a more profound understanding of the fracture distribution law and enables an accurate interpretation of the self-similar characteristics of fracture extension in red-bed soft rock. This, in turn, provides a more scientific foundation for the assessment of the stability of red-bed soft rock structures (Wu et al. [25]).
The single fractal dimension of the fracture distribution on the surface of a cylindrical specimen of red-bed soft rock can be expressed as
where r is the mesh edge length after squaring the fractures, N(r) is the number of meshes to mesh the fractures, C is the scale constant and D is the fractal dimension. Taking logarithmic treatment for Equation (2) yields
The red-bed soft rock specimens have a 3D structure, and a single fractal dimension is not able to represent the distribution and development process of 3D fractures. Therefore, we introduce the concept of multiple fractals to characterize the statistical self-similarity with different local properties. The 3D fractal structure is similar to that in 1D. While, in 1D fractals, a mesh is used to cut the clefts, in 3D fractals, a cubic mesh is required to cut the irregular clefts. The cubic mesh constitutes a succession of small boxes, each of which covers only one cleft. The fractures throughout the specimen are wrapped by numerous small boxes, which are used to describe the irregular geometric objects of the 3D structure (Xie [26]). Its 3D structure is calculated by
where V denotes the volume of the geometric object, D denotes the 3D fractal dimension, A denotes the surface area of the geometric object and C0 is the scale constant.
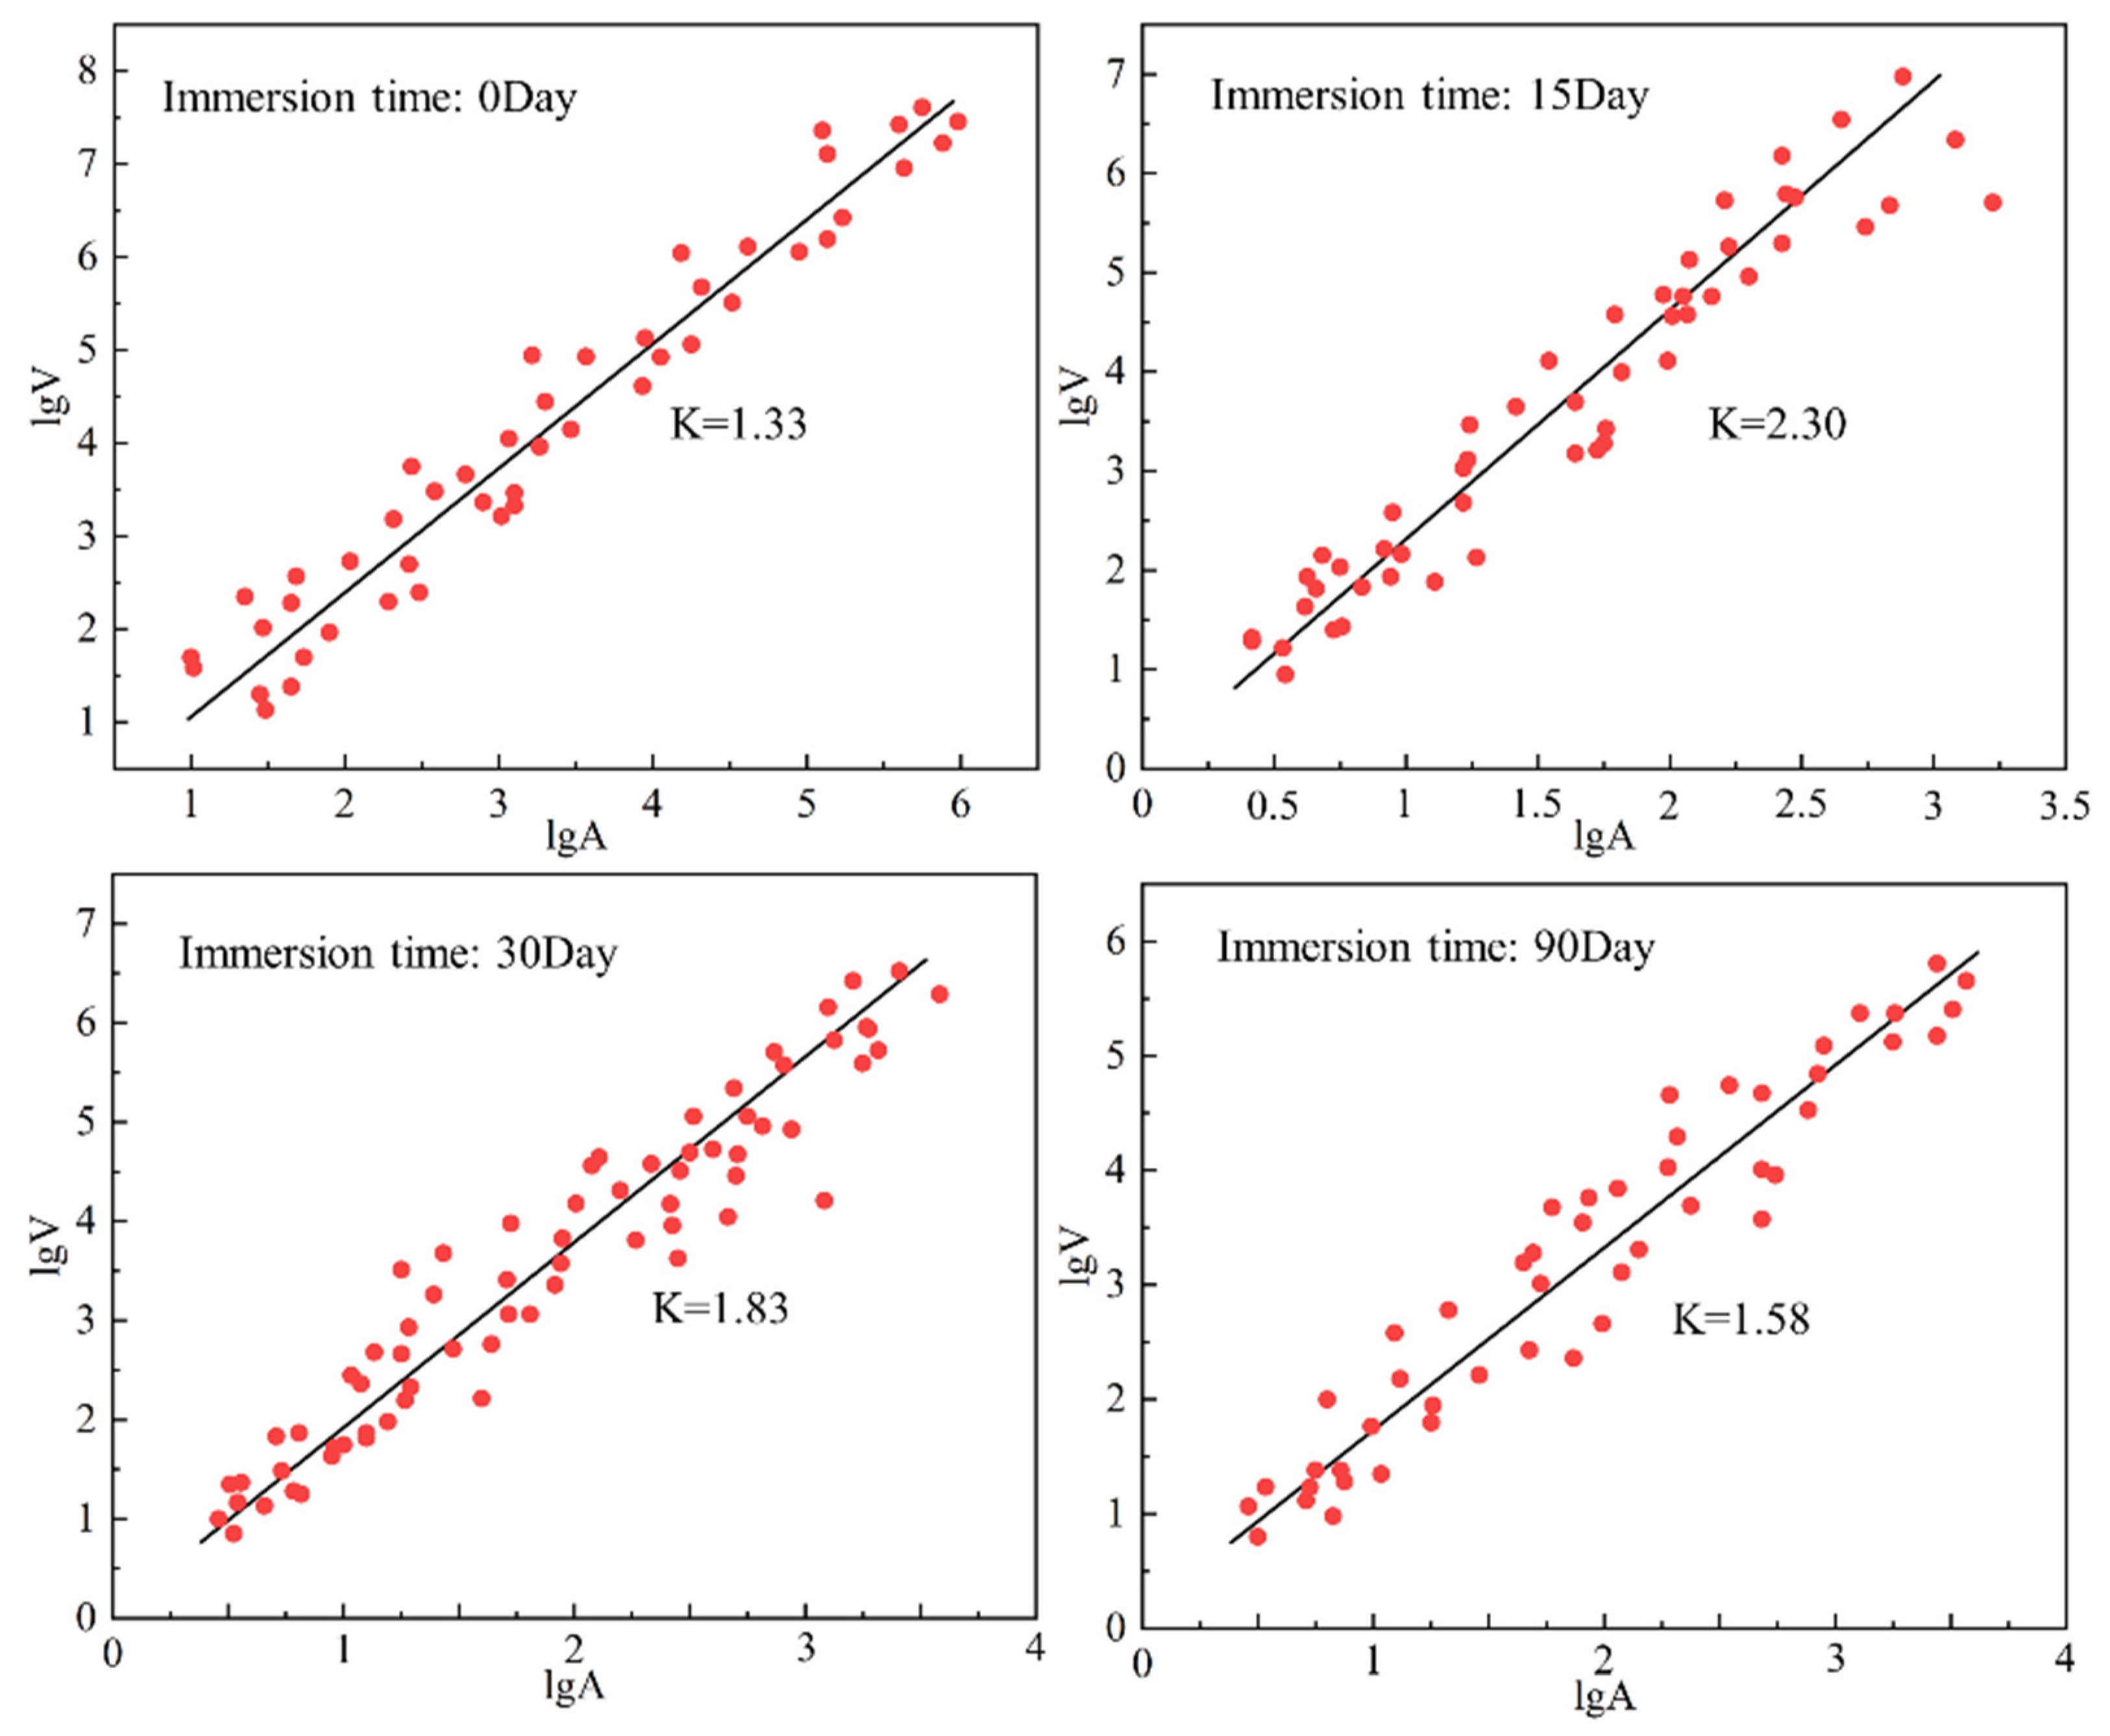
The soft rock is saturated with water and produces fractures, which are numerous and messy, but the new fractures have self-similar characteristics to the original fractures after different saturation times. Therefore, the Label Analysis algorithm can be applied to calculate the target volume, and the information of the fractures in different areas can be extracted. Calculations were performed using the extracted surface area and volume, and the fracture volume and surface area were separately logarithmically processed. The coordinate corresponding points of different small boxes were plotted separately in double logarithmic coordinates, and the principle of least squares was utilized to fit the different points into a straight line. Meanwhile, we define the slope of the fitted straight line segment as the fractal coefficient K, which is further generalized to the 3D coordinates. The fractal dimension D is calculated by
In accordance with the aforementioned fractal theory, VGStudio MAX was utilized to superimpose the fracture pixels for each class of red-bed soft rock samples under varying water saturation time conditions. The number of small boxes was 50 when the fissures are the most numerous, and thus 50 small boxes were selected to calculate the fractal coefficients and fitted as a straight line using the least squares method. The fitting results are shown in Figure 7. The fractal dimension was subsequently calculated and the results are presented in Table 2.
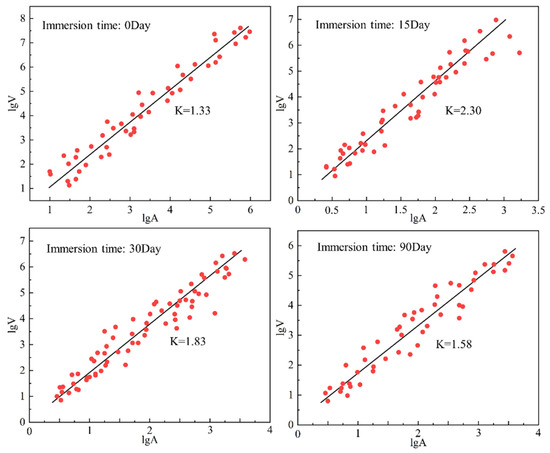
Figure 7.
Plot of sample fit relationships in double logarithmic coordinates.
Table 2.
Results of 3D fracture analysis for each zone of red-bed soft rock with different water saturation times.
The results of the above calculation demonstrate a pronounced increase in the fractal dimension during the initial stage of water saturation. This can be attributed to the substantial impact of water damage on the red-bed soft rock during this period. The red-bed soft rock, which is relatively intact in its natural state, begins to display disordered pores and fractures due to the action of water, as illustrated in Figure 8. This phenomenon leads to an increase in the value of its fractal dimension. As the saturation time increases, the pores in the soft rock are reorganized and connected, resulting in faster damage to the samples and a greater development rate among the fractures than the rate of new pore formation. Concurrently, the orientation and distribution of the fractures exhibit self-similarity, leading to a reduction in the 3D fractal dimension.
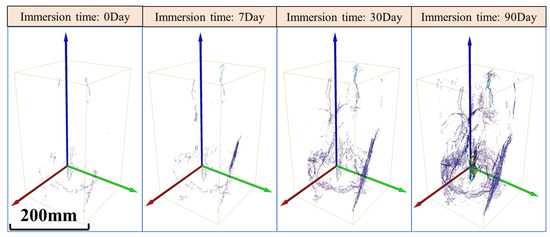
Figure 8.
Fracture evolution diagram.
4.3. Analysis of Interface Evolution
The deterioration of red-bed soft rocks under the influence of water is characterized by a number of processes, including softening, occlusion, scouring, adsorption and lubrication. Additionally, the cementing capacity of the cementing material between the particles at the interfaces is weakened, and stretching, compression, torsion and translation occur between the rock particle skeletons (Schöner et al. [27]). The aforementioned physical effects result in the expansion of the cemented material and subsequent dissolution in water. This is evidenced by the emergence of pore spaces within the soft rock that dilate and connect to form fractures. Over time, the fractures expand and connect with each other, allowing the particles to detach from their parent bodies (Parcerisa et al. [28]).
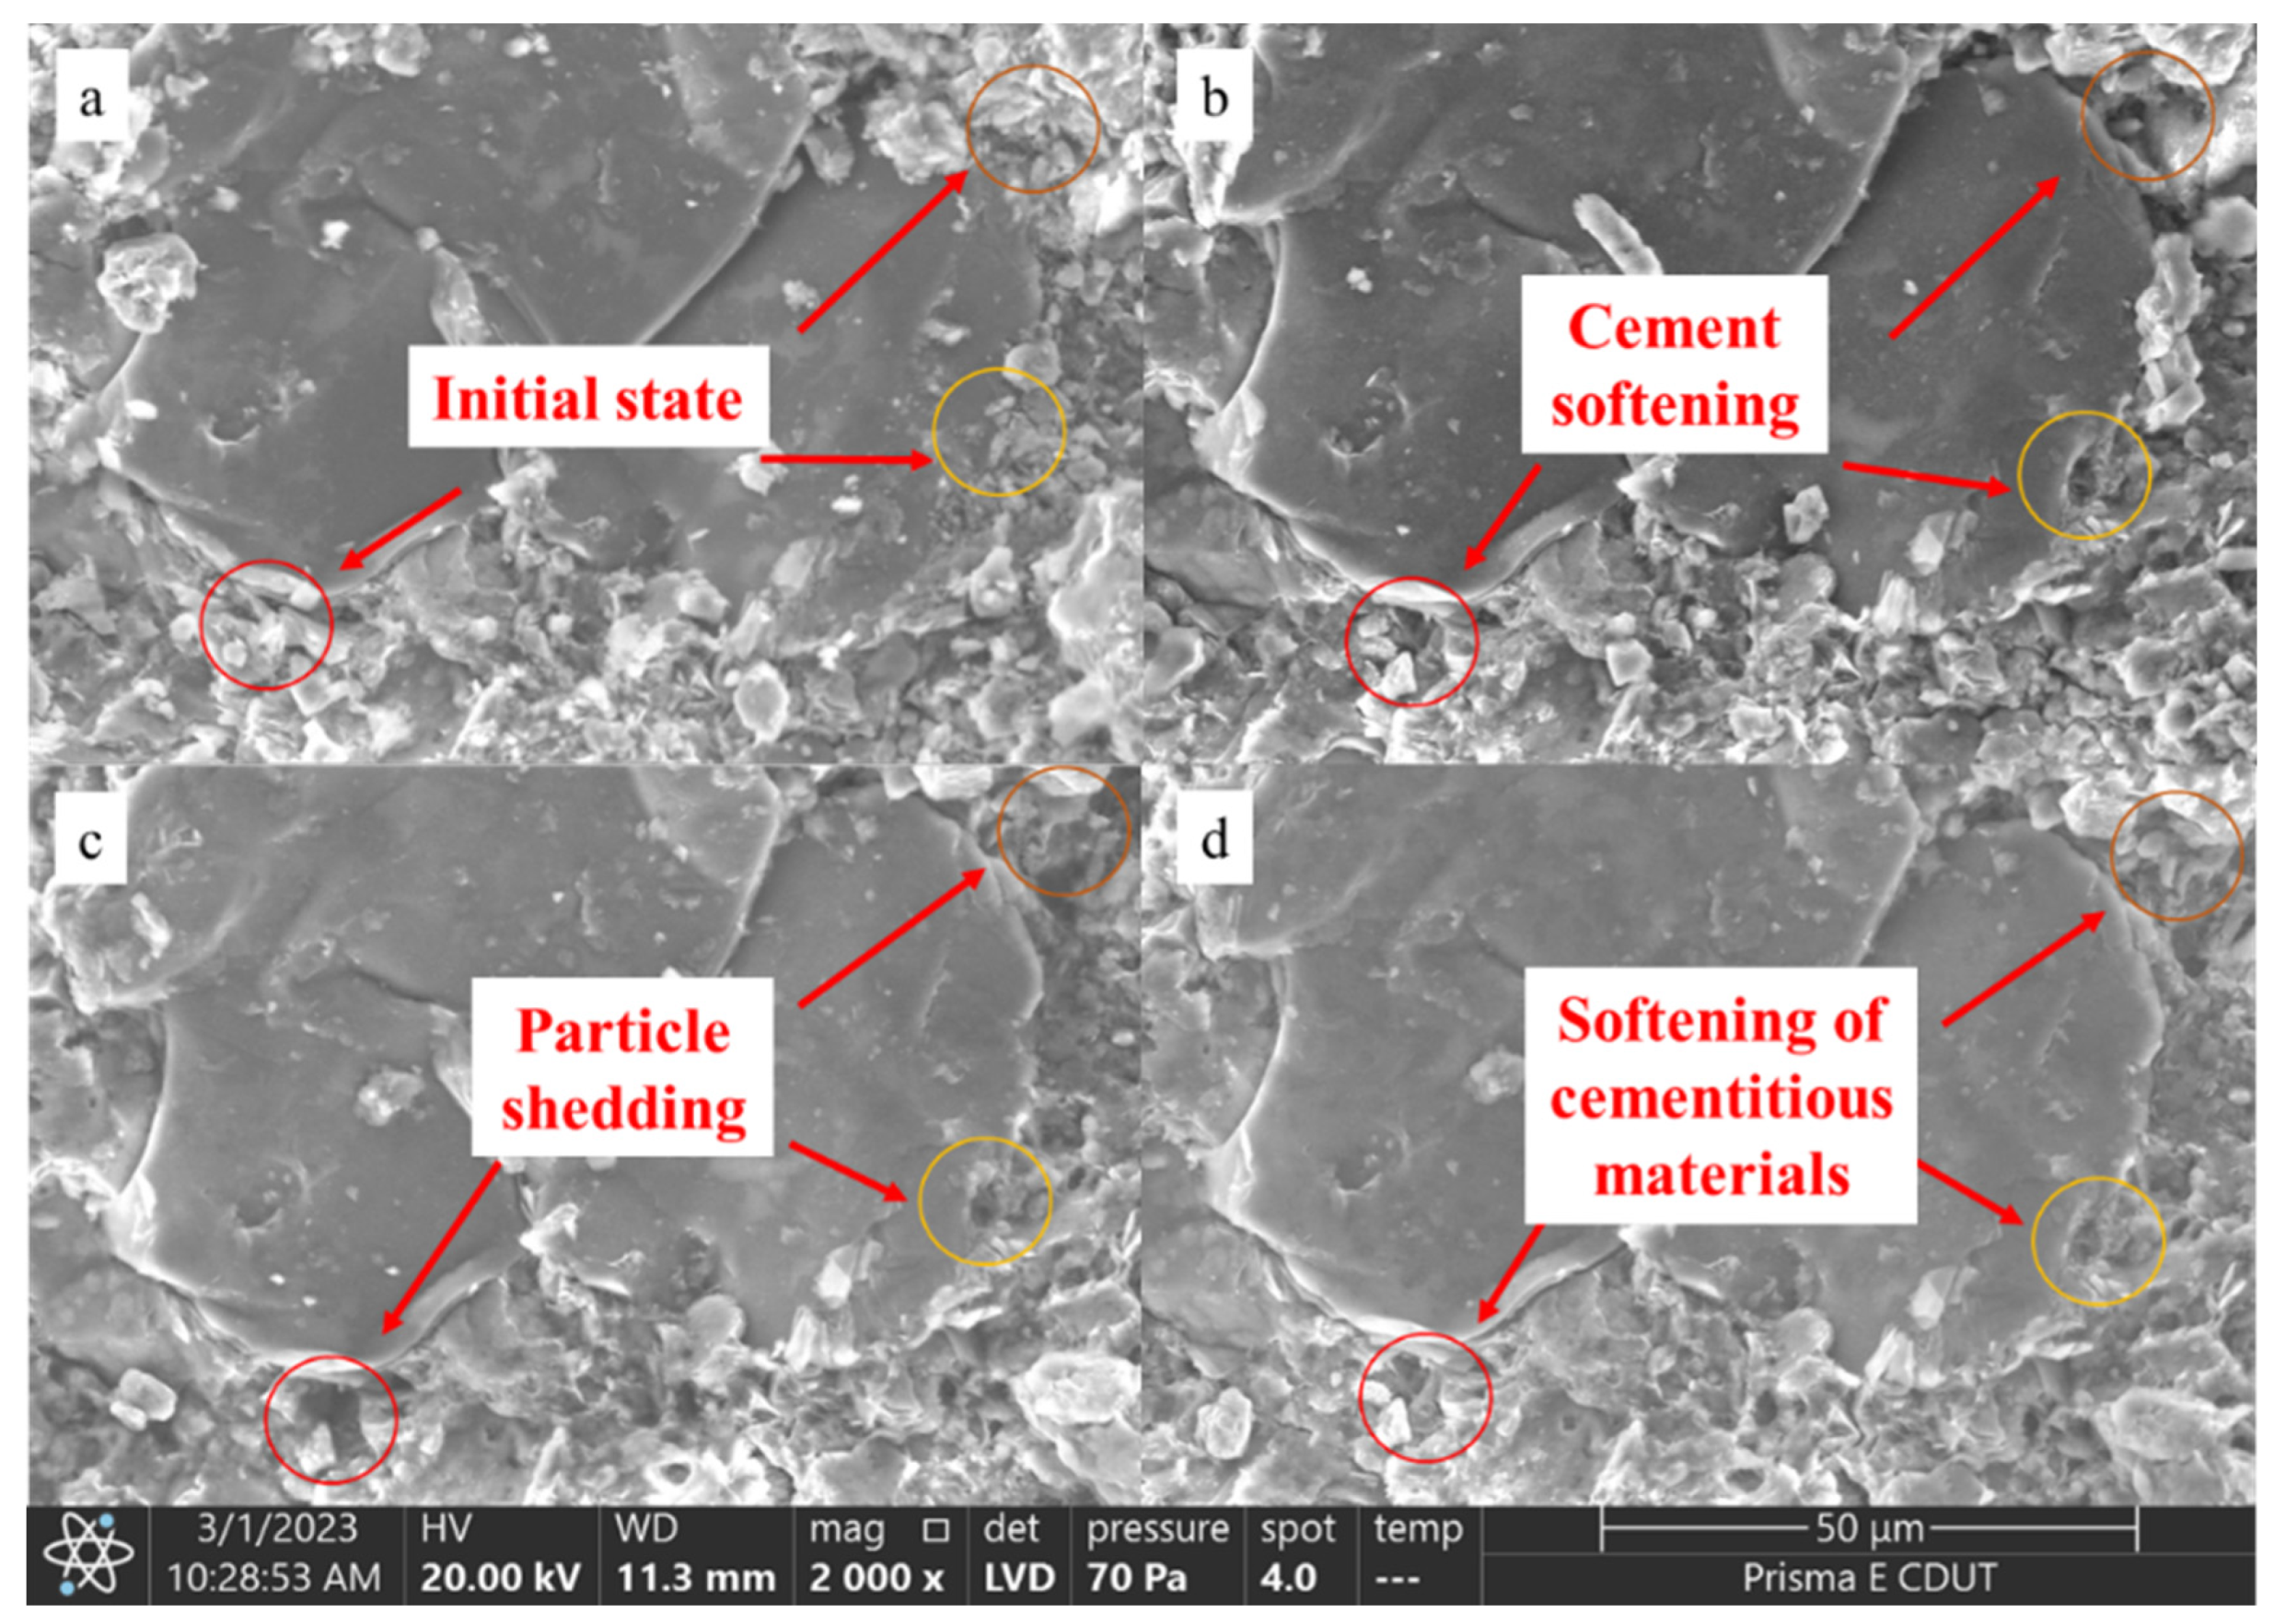
This section presents an analysis of point A1 in the SEM test. As illustrated in Figure 9a, the microstructure of the specimens subjected to different water saturation times reveals that the particle boundaries underwent significant deterioration and dissolution after one week of saturation. The particles that were originally tightly cemented by the cementing material spread out due to the deterioration and dissolution of the cementing material, while the loosely cemented part was gradually detached from the parent rock and washed away by the aqueous solution with the increase in the water saturation time, as shown in Figure 9b. After one month of water saturation, the deterioration of the cemented material described above continued, resulting in the shedding of more debris particles. Consequently, new pores emerged and the fractures expanded, as illustrated in Figure 9c,d. The phenomenon was observed in all samples during the test.
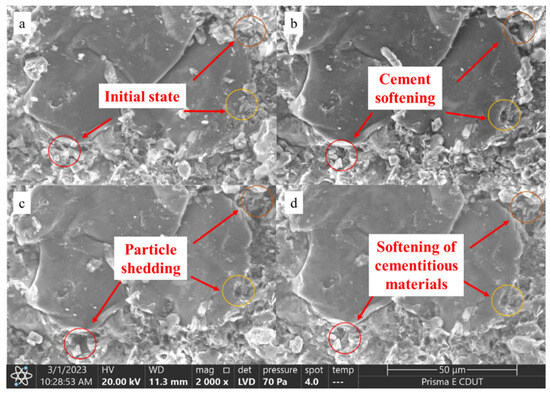
Figure 9.
Softening and dissolution of granular cementing material.
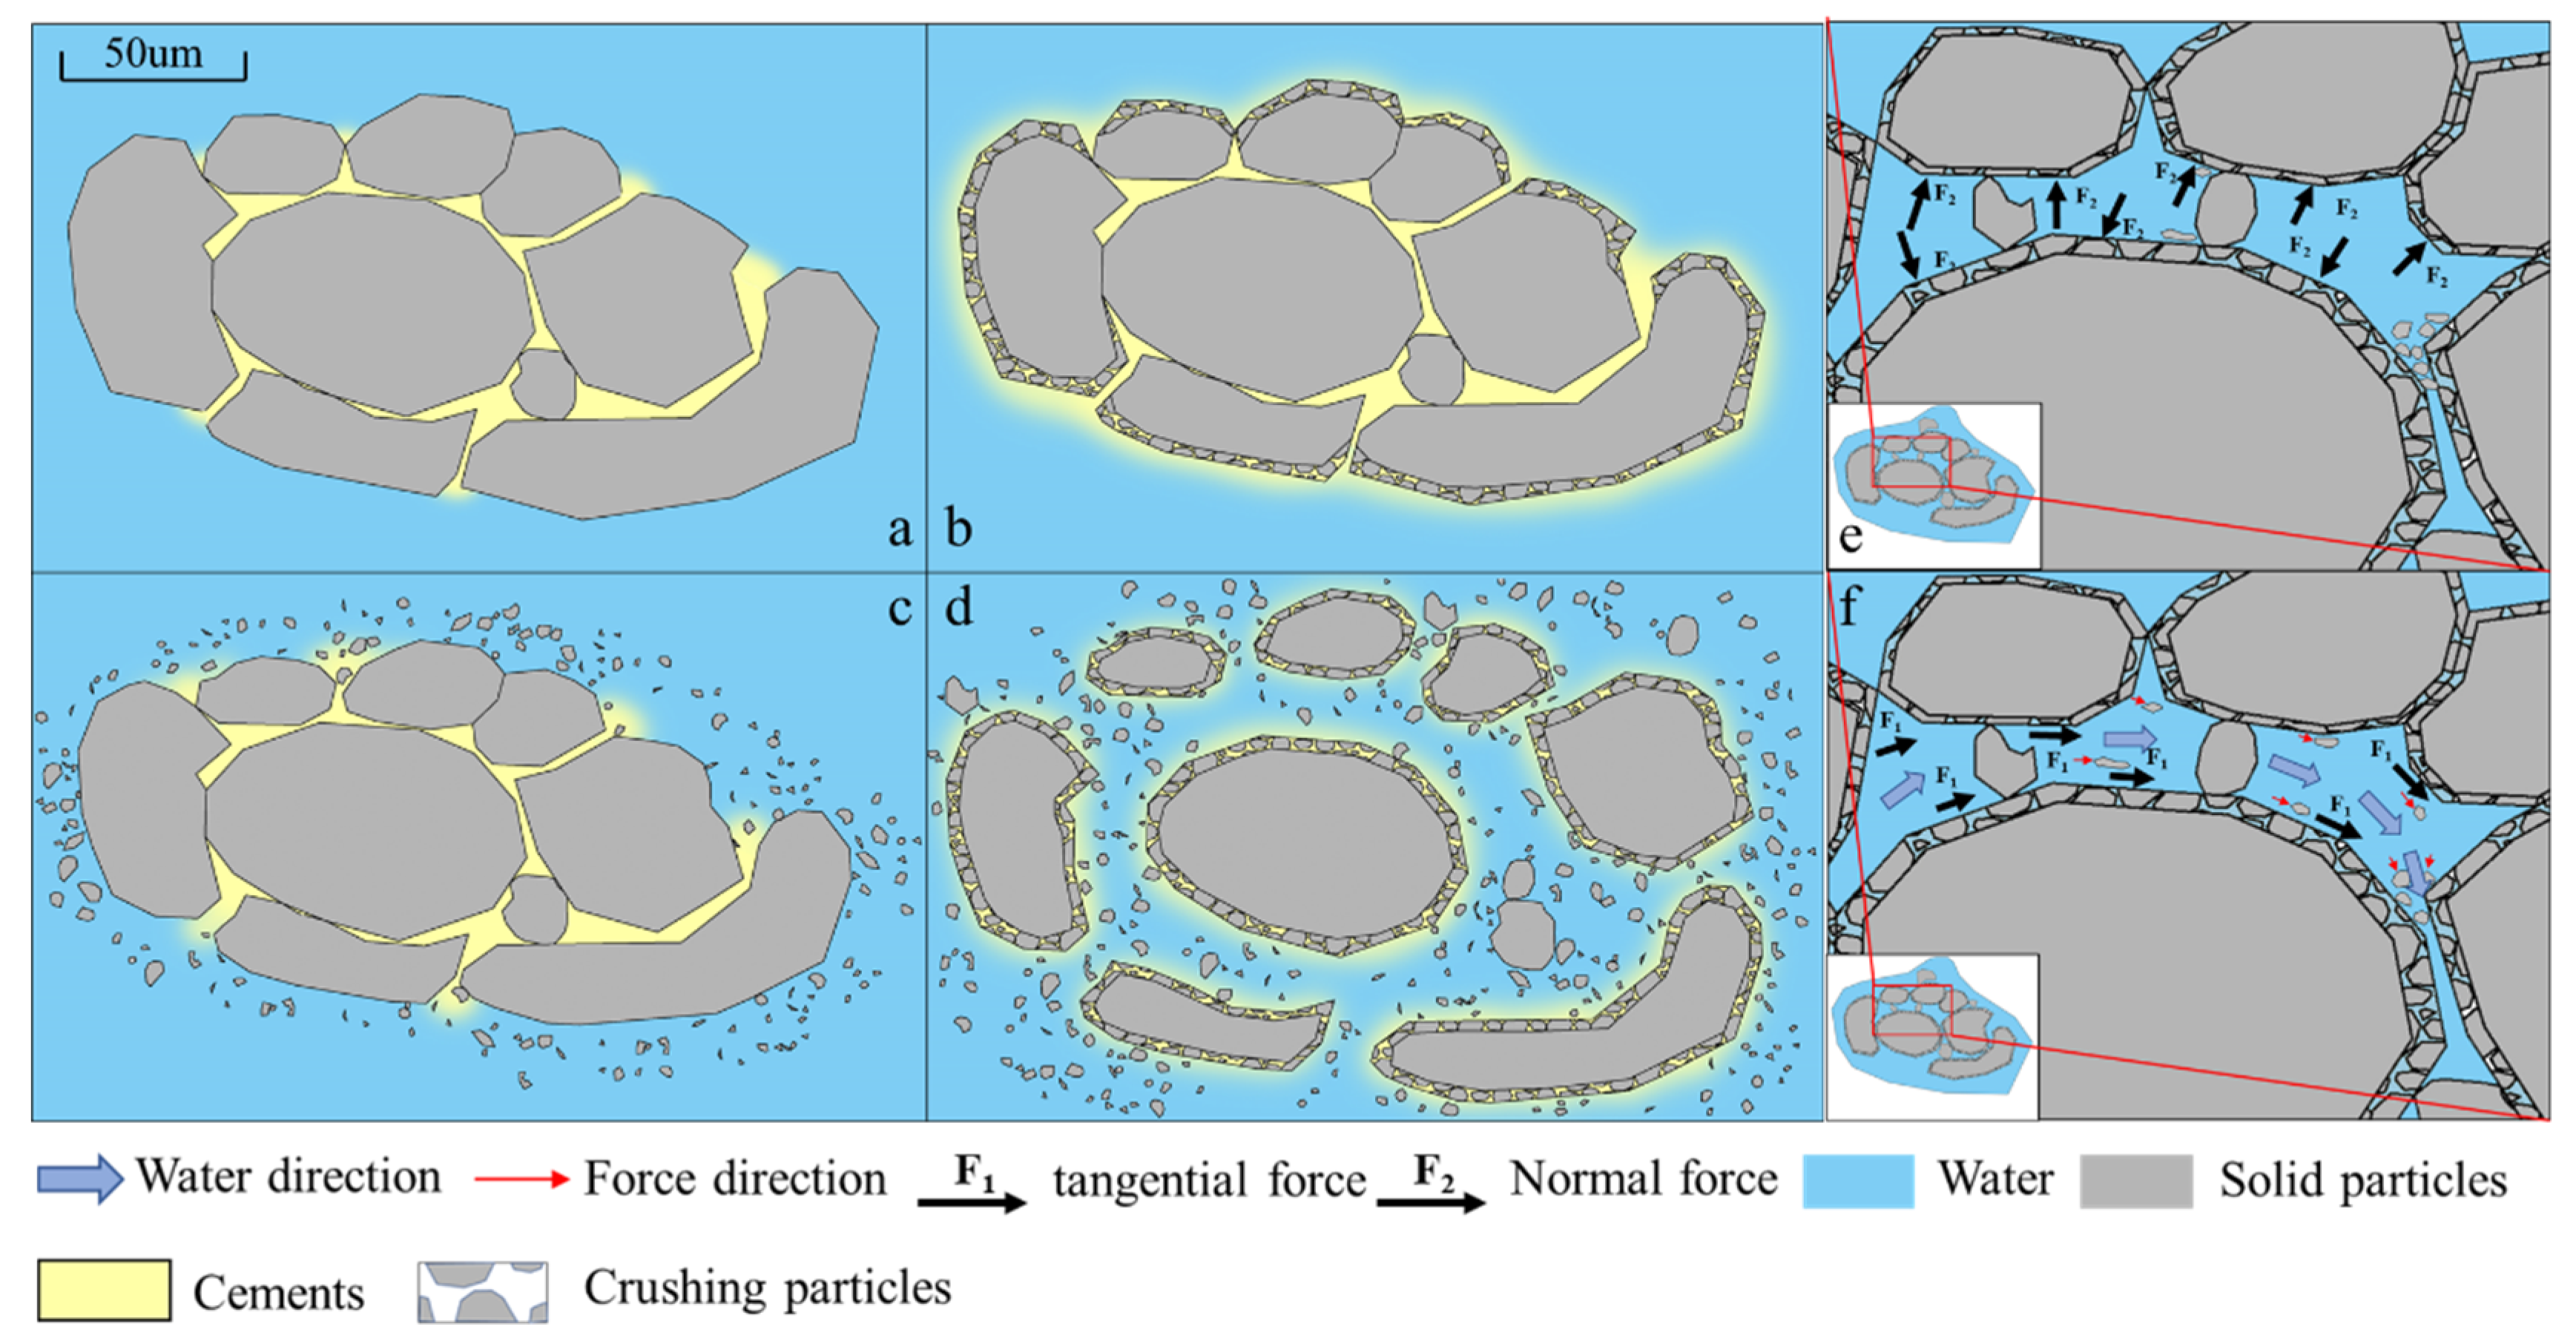
It can be observed that the microscopic interfacial softening mechanism of red-bed soft rocks is the dissolution and destruction of the internal cemented interface. As the water saturation time increases, the cementation process breaks down, resulting in the detachment of particles from the parent rock and their suspension in the water. The high clay mineral content of the red-bed soft rocks facilitates the ingress of water into the particle interstitials, thereby accelerating the softening process depicted in Figure 10a–d.

Figure 10.
Schematic diagram of particle interface disruption and mechanical effects at the particle interface ((a–d) particle interface disruption; (e) hydrodynamic pressure; (f) hydrostatic pressure).
The stretching, compression, torsion and translation between the rock particle skeletons are mainly manifested as changes in the mechanical effects between particles. The mechanical effects between particles are mostly due to the water pressure, because they act with water, followed by intermolecular forces. The water pressure is divided into hydrodynamic pressure and hydrostatic pressure, both of which play a major role. Hydrodynamic pressure is generated when water flows through a rock mass that is not saturated. This generates osmotic pressure (tangential thrust) on large particles in the vicinity of the channel in the same direction as the flow direction. Additionally, tiny particles with diameters smaller than the flow channel move with the flow of water and even flow out of the interior of the skeleton, exacerbating the damage and deterioration of the soil particles, as demonstrated by Figure 10e. Hydrostatic pressure is directed as a positive stress perpendicular to the water–rock interface and is located between the granular skeletons of the tiny particles. This causes the tiny pores to be subjected to outward expanding forces, with the direction perpendicular to the pore wall, thereby subjecting the pore space to force expansion. In accordance with the effective stress principle, the total stress on the particles is the sum of the effective stress and the pore water pressure. Consequently, an increase in hydrostatic pressure reduces the effective stress on the particles, resulting in a saturated water softening effect, as illustrated in Figure 10f.
4.4. Kinetic Modeling of Microscopic Interfacial Evolution in Red-Bed Soft Rock
The preceding analysis of microstructural changes and mineral composition alterations has revealed that the primary factor contributing to the deterioration of soft rock in the damage process is the fragmentation and suspension of particles resulting from the softening and dissolution of the interfacial cementation structure. The use of distilled water in the experiment resulted in a gradual increase in the ion concentration in the distilled water due to the softening and degradation of solid particles during the degradation of the red-bed soft rock. In accordance with the second law of diffusion, the concentration of the diffusing substance varies over time and extends spherically into space along the diffusion direction in the absence of external interference. Concurrently, the concentration gradient of the diffusing substance is proportional to the rate of change of the diffusion distance. In this paper, the water–rock interface evolution law is obtained through tests. The second law of diffusion is expressed in three dimensions in Equation (6). However, under hydrostatic conditions and with a test vessel in the form of a disk, this expression can be simplified to a one-dimensional form, as shown in Equation (7).
The initial and boundary condition is
where ▽2 is the Laplace operator, C is the concentration of an element in solution, C0 is the initial concentration of an element in solution when X > 0, C1 is the concentration of an element in solution when X is at infinity, Dc is the diffusion coefficient of an element and X is the diffusion distance.
The analytical solution of this equation is expressed as
The concentration of the diffused substance changes with time and decreases with the increase in distance. Consequently, the location of the determination of the elemental concentration must be considered. Elemental diffusion is a spherical diffusion process that occurs from the center point in all directions, with the radius of determination designated as r. The above equation can be rewritten as
where r is the ion diffusion distance of the measurement point; erfc(x) is the residual error function, often used to describe the diffusion process of a particle, and is summed to one with the Gaussian error function erf(x). The functions erfc(x) and erf(x) are, respectively, calculated by
Equation (10) can be organized and simplified as
The functions (11) and (12) above are higher-order functions; thus, they are simplified with Taylor expansions and higher-order infinitesimals are discarded in order to describe the change in ion concentration in aqueous solution.
Equation (16) can be organized as
The above equation can be rewritten as
From Equation (18), we can derive the relationship between the saturation time and ion concentration. To validate the accuracy of this equation, we will identify its parameters based on the aforementioned XRF test. In Equation (18), there are four unknowns: Dc, r, C0 and C1. Dc is a constant, while r represents the ion diffusion distance of the measurement point. Further, the data were fitted according to the measured values, and the fitting results are shown in Table 3.
Table 3.
Microkinetic model parameter fitting results.
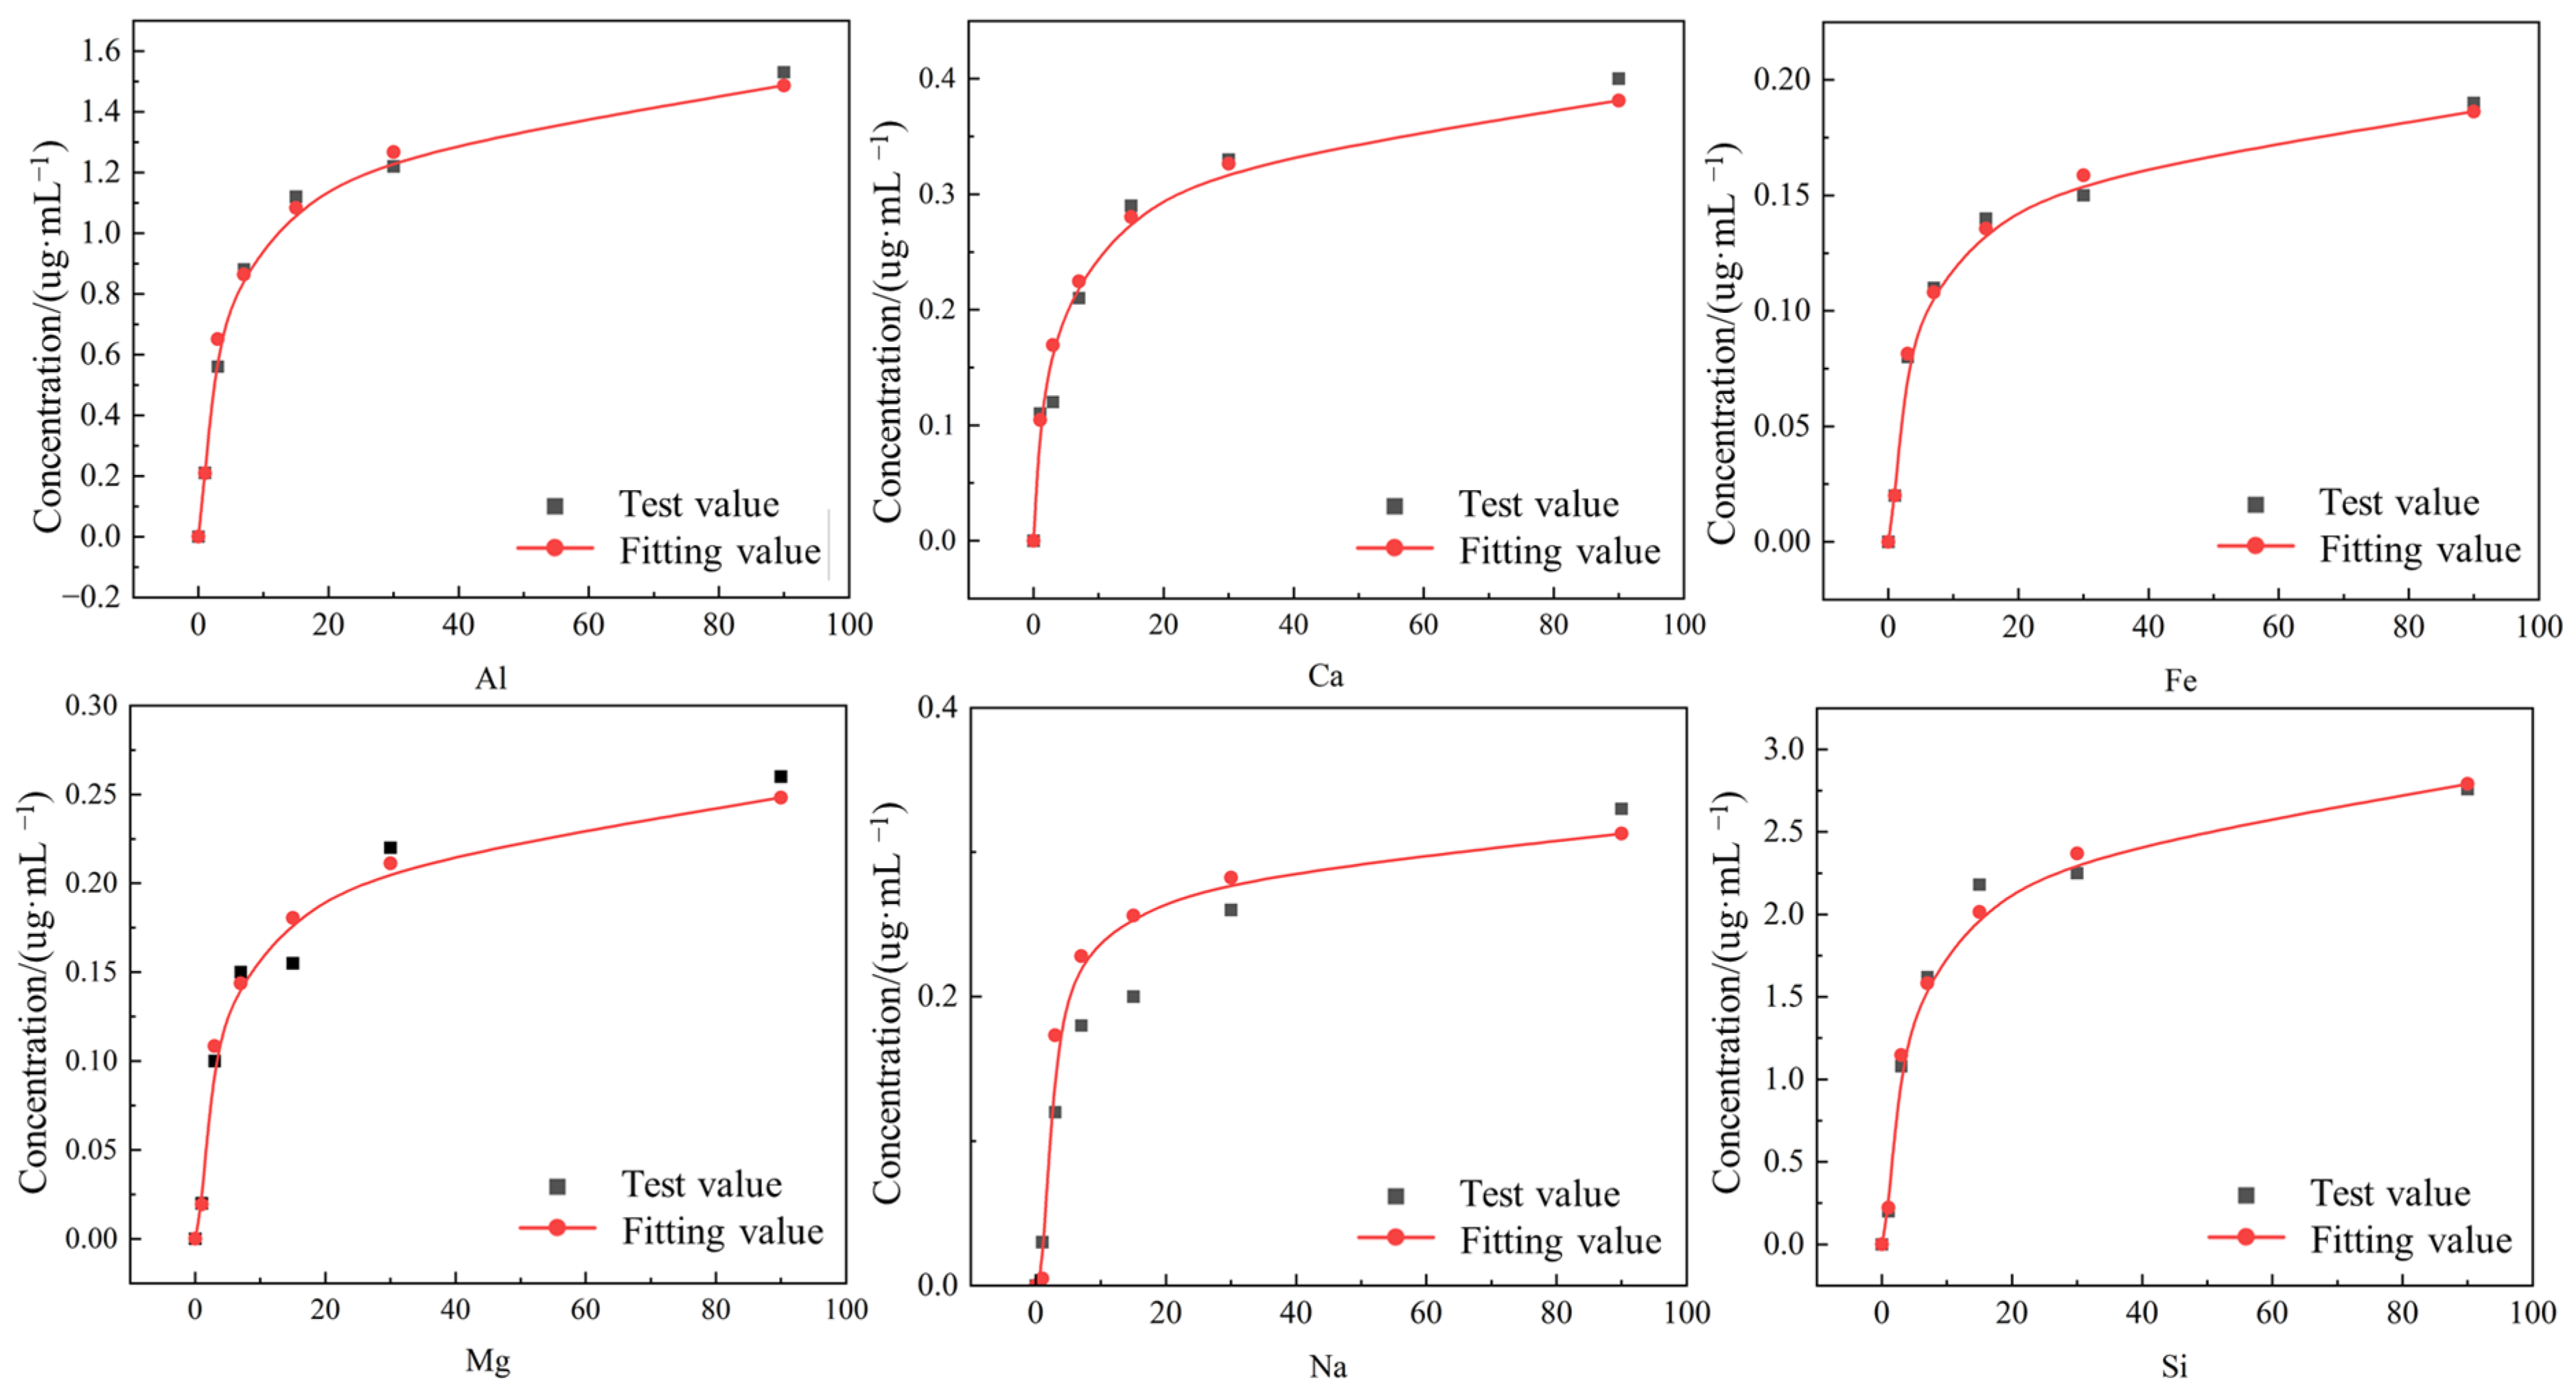
The results of the comparison between the test data and the fitting results are presented in Figure 11. It can be observed that the linear fitting results are largely consistent with the test-measured data, with a correlation exceeding 0.97, which provides evidence for the reliability of Equation (18).
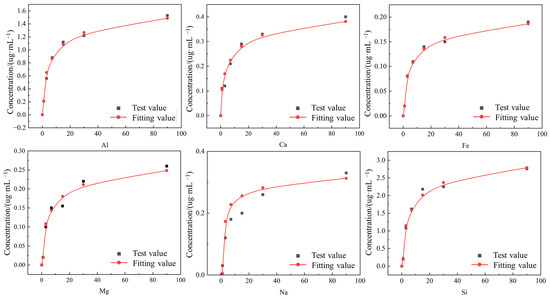
Figure 11.
Parameter fitting of the kinetic model of interface evolution.
5. Conclusions
The microscopic damage process of red-bed soft rock is fully revealed through the study of the interfacial evolution kinetic model of red-bed soft rock, which provides a new idea for the quantitative study of water–rock damage in red-bed soft rock. The degree of damage to this type of rock can be predicted by the change in the solution ion concentration. By applying fractal theory to the description of fracture extension in red-bed soft rock, the stage of fracture development can be predicted, which in turn facilitates the prediction and prevention of red-bed geologic disasters. The following paragraphs present the conclusions of this paper.
The micro-interfacial effect of the red-bed soft rock is primarily evidenced by the softening effect of water on the filler between the particles. This transforms the tiny solid particles into flocculent particles, which gradually dissolve in the water. This process results in the expansion of tiny fractures and an increase in porosity. In essence, the microscopic damage of soft rock is the evolutionary process of the dissolution and detachment of its internal soluble joint structure.
The 3D fractures were quantitatively analyzed using multiple fractal theory. In the early stage of water saturation, water exerts a greater impact on the damage of the red-bed soft rock. This is evidenced by the emergence of disorganized pores and fractures in the natural state of the red-bed soft rock, which leads to a dramatic increase in the fractal dimension of the rock. As the saturation time continues to increase, the internal pores begin to reorganize and connect, the soft rock specimens accelerate the damage and the rate of fracture development exceeds the rate of new pore generation. Concurrently, the orientation and distribution of the fractures exhibit some self-similarity, resulting in a decrease in the 3D fractal dimension.
It is established that hydrodynamic pressure and hydrostatic pressure cause damage to soft rock. Hydrodynamic pressure is defined as the pressure generated by water flow and infiltration at the early stage of water saturation, when the rock mass is still unsaturated. This pressure generates infiltration pressure on the large particles around the channel in the same direction as the flow direction (tangential thrust). The direction of hydrostatic pressure is a positive stress perpendicular to the water–rock interface, situated between the granular skeletons of the tiny particles. This causes the tiny pores to be subjected to an outward expansion force. This force, perpendicular to the pore walls, causes the pores to expand under force.
The change in ion concentration in the solution of red-bed soft rock under different water saturation times has been observed to result in the precipitation of a significant number of ions from the red-bed soft rock during water–rock interaction. Based on the principles of diffusion theory, this study proposes a kinetic model for the evolution of the micro-interface of red-bed soft rock. This model is capable of accurately describing the nonlinear ion change rule of the micro-interface of the red-bed water–rock interaction, and it is able to fit the calculated value with the measured value to a high degree of accuracy.
In future research, an experimental study will be conducted on samples of red-bed soft rock under a three-directional stress state. This will enable the experimental specimens to be more closely aligned with natural samples, and the number of experimental samples will be increased to enhance the credibility of the conclusions and to further verify the present conclusions.
Author Contributions
Conceptualization, H.Z. and D.Z.; methodology, H.Z.; software, H.Z.; validation, H.Z. and J.L.; formal analysis, H.Z. and J.L.; investigation, H.Z. and R.Y.; resources, D.Z.; data curation, H.Z.; writing—original draft preparation, H.Z.; writing—review and editing, H.Z.; visualization, H.Z.; supervision, D.Z.; project administration, D.Z.; funding acquisition, D.Z. All authors have read and agreed to the published version of the manuscript.
Funding
The study is financially supported by the National Natural Science Foundation of China (No. 42293353).
Institutional Review Board Statement
Not applicable.
Informed Consent Statement
Not applicable.
Data Availability Statement
The original contributions presented in the study are included in the article.
Acknowledgments
Thanks to all funding agencies.
Conflicts of Interest
All authors declare no conflict of interest.
References
- Guery, A.A.; Cormery, F.; Shao, J.F.; Kondo, D. A micromechanical model of elastoplastic and damage behavior of a cohesive geomaterial. Int. J. Solids Struct. 2008, 45, 1406–1429. [Google Scholar] [CrossRef]
- Deng, H.F.; Zhou, M.L.; Li, J.L.; Fang, J.C.; Xiao, Y.; Zhang, H.B.; Wang, C.X. Mechanical properties of red-bed soft rock under water-rock interaction. Chin. J. Rock Mech. Eng. 2016, 31, 3481–3491. [Google Scholar]
- Zhu, J.J. Study on Water-Rock Mechanism and Time-Dependent Deformation Characteristics of Red Beds Soft Rock in Central Yunnan. Ph.D. Thesis, Chengdu University of Technology, Chengdu, China, 2019. [Google Scholar]
- Zhou, C.Y.; Peng, Z.Y.; Shang, W. On the key problem of the water-rock interaction in geoengineering: Mechanical variability of special weak rocks and some development trends. Rock Soil Mech. 2002, 23, 124–128. [Google Scholar]
- Liu, Z.; He, X.; Zhou, C. Influence Mechanism of Different Flow Patterns on the Softening of Red-Bed Soft Rock. J. Mar. Sci. Eng. 2019, 7, 155. [Google Scholar] [CrossRef]
- Zhao, Z.; Liu, H.; Lyu, X.; Wang, L.; Tian, Z.; Sun, J. Experimental Study on the Damage and Deterioration Behaviour of Deep Soft Rock under Water-Rock Interaction. Geofluids 2021, 2021, 8811110. [Google Scholar] [CrossRef]
- Yan, L.; Liu, P.; Peng, H.; Kašanin-Grubin, M.; Lin, K. Laboratory study of the effect of temperature difference on the disintegration of redbed softrock. Phys. Geogr. 2019, 40, 149–163. [Google Scholar] [CrossRef]
- Chen, H.; Ji, W.; Zhang, S. The principle of diffusion chronology and its application in the study of magmatic systems. J. Rock Sci. 2022, 38, 1499–1511. [Google Scholar]
- Liu, C.; Liu, X.L.; Zhang, D.; Wu, C.; Wang, E.; Wang, S. The water-rock interface dynamic model of soft rock softening and its evolution law. J. Geotech. Eng. 2022, 44, 2280–2289. [Google Scholar]
- Yao, W.; Li, C.; Zhan, H.; Zhou, J.-Q.; Criss, R.E.; Xiong, S.; Jiang, X. Multiscale Study of Physical and Mechanical Properties of Sandstone in Three Gorges Reservoir Region Subjected to Cyclic Wetting–Drying of Yangtze River Water. Rock Mech. Rock Eng. 2020, 53, 2215–2231. [Google Scholar] [CrossRef]
- Zhou, C.; Cui, G.; Yin, H.; Yu, L.; Xu, G.; Liu, Z.; Zhang, L. Study of soil expansion characteristics in rainfall-induced red-bed shallow landslides: Microscopic and macroscopic perspectives. PLoS ONE 2021, 16, e0246214. [Google Scholar] [CrossRef]
- Zhou, C.Y.; Liang, N.; Liu, Z. Multifractal characteristics of pore structure of red-bed soft rock in water. J. Eng. Geol. 2020, 28, 1–9. [Google Scholar]
- Zhang, Z.H.; Wei, W.; Zhang, J.; Jia, H. Determination method of pore multi-scale fractal dimension of red sandstone based on CT scanning. Geol. Technol. Bull. 2022, 41, 254–263. [Google Scholar]
- Mandal, P.; Sarout, J.; Rezaee, R. Triaxial Deformation of the Goldwyer Gas Shale at In Situ Stress Conditions-Part II: Viscoelastic Creep/Relaxation and Frictional Failure. Rock Mech. Rock Eng. 2023, 56, 7441–7474. [Google Scholar] [CrossRef]
- Huancollo, H.J.M.; Saboya, F.; Tibana, S.; McCartney, J.S.; Borges, R.G. Thermal Triaxial Tests to Evaluate Improvement of Soft Marine Clay through Thermal Consolidation. Geotech. Test. J. 2023, 46, 579–597. [Google Scholar] [CrossRef]
- Alekseev, A.; Bezvolev, S. Evaluation of Creep Indicators of Plastic-Frozen Soil According to Laboratory and Field Tests. Soil Mech. Found. Eng. 2023, 60, 86–92. [Google Scholar] [CrossRef]
- Jaiswal, M.; Sebastian, R.; Mulaveesala, R. Detecting meso-damage and subsurface cracks in a hard rock using frequency-modulated thermal wave imaging. Meas. Sci. Technol. 2024, 35, 035403. [Google Scholar] [CrossRef]
- Mandelbrot, B.B. Les Object Fractals: Forme, Hasard et Dimension; Flammarion: Paris, France, 1975. [Google Scholar]
- Hewage, S.A.; Tang, C.-S.; Mehta, Y.; Zhu, C. Investigating cracking behavior of saline clayey soil under cyclic freezing-thawing effects. Eng. Geol. 2023, 326, 107319. [Google Scholar] [CrossRef]
- Du, J.; Whittle, A.J.; Hu, L.; Divoux, T.; Meegoda, J.N. Coupling grid nanoindentation and surface chemical analysis to infer the mechanical properties of shale mineral phases. Eng. Geol. 2023, 325, 107304. [Google Scholar] [CrossRef]
- Chen, L.; Liu, T.; Jia, B.; Tang, J.; Liu, J. Acoustic emission and fractal characteristics of red beds soft rock under water-force coupling. Sci. Rep. 2024, 14, 4423. [Google Scholar] [CrossRef] [PubMed]
- Zhang, G.; Ling, S.; Liao, Z.; Xiao, C.; Wu, X. Mechanism and influence on red-bed soft rock disintegration durability of particle roughness based on experiment and fractal theory. Constr. Build. Mater. 2024, 419, 135504. [Google Scholar] [CrossRef]
- Ulusay, R.; Hudson, J.A. The Complete ISRM Suggested Methods for Rock Characterization Testing and Monitoring: 1974–2006; Kozanof Set: Ankara, Turkey, 2007. [Google Scholar]
- Huang, K.; Kang, B.; Zha, F.; Li, Y.; Zhang, Q.; Chu, C. Disintegration characteristics and mechanism of red-bed argillaceous siltstone under drying-wetting cycle. Environ. Earth Sci. 2022, 81, 336. [Google Scholar] [CrossRef]
- Wu, Z.R.; Pan, W.P. Application of fractal geometry theory in stability analysis of geotechnical slopes. J. Hydraul. Eng. 1996, 4, 79–82 + 78. [Google Scholar]
- Xie, H.P. Fractal geometry and its application in geotechnical mechanics. J. Geotech. Eng. 1992, 14, 14–24. [Google Scholar]
- Schöner, R.; Gaupp, R. Contrasting red bed diagenesis: The southern and northern margin of the Central European Basin. Int. J. Earth Sci. 2005, 94, 897–916. [Google Scholar] [CrossRef]
- Parcerisa, D.; Gómez-Gras, D.; Travé, A.; Martín-Martín, J.; Maestro, E. Fe and Mn in calcites cementing red beds: A record of oxidation-reduction conditions -: Examples from the Catalan Coastal Ranges (NE Spain). J. Geochenmical Explor. 2006, 89, 318–321. [Google Scholar] [CrossRef]

Disclaimer/Publisher’s Note: The statements, opinions and data contained in all publications are solely those of the individual author(s) and contributor(s) and not of MDPI and/or the editor(s). MDPI and/or the editor(s) disclaim responsibility for any injury to people or property resulting from any ideas, methods, instructions or products referred to in the content. |
© 2024 by the authors. Licensee MDPI, Basel, Switzerland. This article is an open access article distributed under the terms and conditions of the Creative Commons Attribution (CC BY) license (https://creativecommons.org/licenses/by/4.0/).