Article

Changes in Countermovement Jump Height in Elite Volleyball Players in Two Competitive Seasons: Consideration on the Technique of Execution of the Jump

Department of Physiology and Biochemistry, Faculty of Physical Education and Sport, University of Physical Education, 31-571 Kraków, Poland
*
Author to whom correspondence should be addressed.
Appl. Sci. 2024, 14(11), 4463; https://doi.org/10.3390/app14114463
Submission received: 1 May 2024 / Revised: 18 May 2024 / Accepted: 21 May 2024 / Published: 23 May 2024
(This article belongs to the Special Issue Effects of Physical Training on Exercise Performance—2nd Edition)

Abstract

:
Monitoring athletes’ well-being during the competitive season is a common practice in team sports, and countermovement jump (CMJ) is often introduced to monitor neuromuscular fatigue of the players. In this pilot observational study, we aimed to evaluate changes in jump performance in professional volleyball players during their two competitive seasons after introducing different executions of the jump test. Different execution of the flight phase of the jumps was introduced as a differentiating factor. Nine professional volleyball players (age: 23.3 ± 1.9 years; volleyball training experience: 10.4 ± 1.9 years; body height: 192.3 ± 8.3) performed CMJ measurements 1–2 times a week on a contact mat during two competitive seasons, and a total number of 1008 jumps (540 in season 1 and 468 in season 2) was collected. Players’ CMJ height significantly decreased (p < 0.05) in season 2 by approximately 4%, and standard deviation of the data reduced by approximately 30%. Our study confirms that the testing procedures need to be rigorous as different execution of the jump may be associated with changes in CMJ height. Execution of the jump should not be interchangeable using the same measurement device, and the technique introduced in season 2 seems to be more appropriate for this measurement device.

1. Introduction

Monitoring athletes’ well-being is a common practice in high-performance sport to optimize the training process and performance during the competition [1]. Neuromuscular fatigue (NMF) can be defined as a reduction in the maximal voluntary force that a muscle group can generate. The fatigue generated by the training and insufficient recovery can influence team sports performance, especially during an intense competitive period [2]. If the fatigue is excessive and not enough focus is placed on the recovery, the risk of injury or illnesses arises [3]. The authors suggest that post-competition recovery of 48 h is a minimum period to restore the testosterone–cortisol ratio [4], but there is a possibility that even 4–5 days may be needed to fully recover after an intense competition [4,5]. Thus, monitoring fatigue may be crucial as it can lead to an increased availability of the players and subsequently influence a team’s chance of success [6,7]. It is especially important in team sports which involve frequent competition and traveling that may result in accumulating fatigue over time. Apart from physiological factors, the psychological factors should also be taken into consideration. Mental fatigue may impair physical performance, and observing fluctuations in mood, emotions and perceived stress can be valuable information for coaches of an athlete’s individual response to training [8,9].
Monitoring fatigue during the competitive season is a common practice that takes place in team sports. The trend of collecting athletes’ monitoring data within team sports tends to increase and the practitioners are recommended to use simple, valid and reliable solutions to monitor athletes’ well-being and prescribe training [10]. Practitioners usually introduce various methods to monitor training load and fatigue in athletes [11,12]. Subjective monitoring tools (e.g., wellness questionnaires, session rating of perceived exertions) can be introduced separately [1,13,14] or with the addition of objective assessments (e.g., strength and power testing, GPS monitoring) in an integrated approach [8,15]. Until now, the strength and conditioning coaches have been surveyed several times about their monitoring procedures [16,17,18]. 84% of practitioners tend to introduce subjective questionnaires, 61% of practitioners introduce neuromuscular performance testing and more than a half (54%) use vertical jump testing [16]. Also, the latest survey by Asimakidis et al. indicated that a countermovement jump (CMJ) is the most frequently (used by 92% of practitioners) used test for jump performance assessment [18]. CMJ is reliable [19] and sensitive in monitoring neuromuscular status [20] and may be more suitable to use than other vertical jumping tests such as squat jump or drop jump [21]. It was proved to be useful in team sports involving powerful actions such as sprinting or jumping [17,22,23], and tracking the average CMJ height may be more appropriate than the highest CMJ height to monitor NMF [20]. However, the authors suggested that this marker of NMF should not be introduced in relation to endurance runners as it shows the lack of sensitivity [24]. As these kinds of measurements are frequently implemented, the idea of injury risk during the testing procedures could be raised. So far, researchers have not examined extensively the potential risk of injury during testing procedures of CMJ, and no specific relationship was found in squat jump or depth jump testing in regards to knee or low back injury [25].
Despite being a popular tool to monitor NMF [16,17,18], the authors identified the lack of method standardization for CMJ as the testing procedures seem to be carried out with different technical execution [26]. It is important to select appropriate tests for a given population of the athletes, and testing within strength and conditioning should be simple and serve a purpose. Practitioners need to know why they introduce a given test and how it should be conducted to maximize its utility [27,28]. Also, the selected test needs to be valid and reliable to effectively track changes in an athlete’s performance [29]. The same principles apply to a technology that is used to assess vertical jump characteristics. Originally, force platforms that measure ground reaction force exerted by the subject were classified as ‘gold standard’ [30]. They allow the analysis of kinematic variables of the jump (e.g., countermovement depth, time to peak force) in addition to kinetic variables (e.g., jump height, mean force) [31]. Despite providing a lot of potentially useful data, both laboratory-based and portable force platforms are expensive [32], and often the practitioners are forced to use the alternatives. Fortunately, there is a variety of technologies that can be implemented as an effective replacement to a force platform. Infrared platforms [33], contact mats [34], inertial devices [35] or even a smartphone video application [36] may be used as a more affordable option to track vertical jump height. However, it should be noted that the results from different devices are not interchangeable, in order to evaluate changes in jump height over time [37]. Thus, it is suggested to always perform the measurements with the same device to avoid misinterpretation of received results.
In this pilot observational study, we analyzed changes in CMJ height during two competitive seasons. So far, authors have conducted investigations that contained several testing procedures through the competitive season [38,39] and also weekly CMJ testing [40]. In our study, CMJ testing was performed weekly on a contact mat to assess NMF and monitor athletes’ well-being and enhance the decision-making process to optimize prescribing training microcycles. In accordance with the authors [26,27,28], the general instructions of jump’s execution were unchanged between two competitive seasons. However, we introduced a differentiating factor in jump execution between the seasons and observed changes in jump height (JH). Thus, the main goal of our study was to evaluate changes in jump performance in professional volleyball players during two competitive seasons. Another aim of this study was to determine whether the execution method of the jump during the same test can change the results of JH in CMJ.

2. Materials and Methods

2.1. Study Design

This study lasted two competitive seasons, and nine professional volleyball players participated in the study. In the first season (S1), participants were instructed to perform testing procedures in a certain way, and in the second season (S2), some changes in execution of the test were introduced during measurements. Each season, before data collection, the participants of the study were familiarized with the testing procedures for two weeks within four to five gym sessions. It was introduced to clarify testing procedures so they could therefore be run smoothly with as little disruption as possible. Data collection during the seasons began at the beginning of the preparatory cycle (early August) and was carried until the end of the competitive season (late April). Data were collected usually once or twice a week (depending on a schedule of the games), but some weeks the measurements were not performed due to various reasons (e.g., game schedule, break in training, different conditions of the gym sessions, etc.). All testing sessions were performed at the beginning of the gym sessions for the team and took approximately 20 min. Measurements were carried in the same gym within the same place in the gym and on the same type of surface. The majority of the gym sessions were performed in the morning, and only these were kept for the statistical analysis (66 sessions in total—36 in the first season and 30 in the second season). All morning sessions were performed at the similar time of the day (starting at 9–10 a.m.). Participants performed a standardized warm-up, and after a warm-up, performed an experimental protocol consisting of two CMJs with an approximately 90 s rest interval (Figure 1). Apart from testing sessions, players participated in their volleyball training schedule (daily afternoon training sessions and matches during the weekends). A simplified representation of the organization of the competitive season and testing procedures is presented in Figure 1.
There were the following inclusion criteria to participate in the study: (a) professional level of competition (Divisions under Polish Volleyball League (PLS—Polska Liga Siatkówki); (b) valid medical examination. Additionally, inclusion criteria to participate in an experimental session were: (a) lack of injuries or other health contraindications; (b) participant’s willingness and verbal readiness; (c) verbal agreement of the supervisor of the measurements. Additionally, the supervisor of the study had a possibility to withdraw a given player from the measurements based on his subjective assessment (e.g., lack of sleep, performance/number of jumps during a volleyball session on the previous day etc.). Despite the volleyball team roster consisting of fourteen players, the results of only nine players were kept for the statistical analysis as they participated in both competitive seasons, five players changed clubs between the seasons. All participants were informed about the study protocol, voluntarily took part in the study and signed an informed consent. The study protocol was accepted by the Bioethics Committee (Regional Medical Chamber in Kraków, opinion no: 1/KBL/OIL/2022) and performed according to the ethical standards of the Declaration of Helsinki 2013.

2.2. Participants

Nine professional male volleyball players (age: 23.3 ± 1.9 years; volleyball training experience: 10.4 ± 1.9 years; body height: 192.3 ± 8.3) participated in this study. They compete in the second-highest division in Poland, and players participating in this study included 1 setter, 4 outside hitters, 2 middle blockers and 2 liberos. Their body mass was regularly assessed and is presented in Table 1 and Table 2.

2.3. Warm-Up

Each testing day started with a standardized warm-up that consisted of three parts: (1) aerobic warm-up; (2) full-body mobility; (3) dynamic warm-up. The goal of the first part of the warm-up was to increase body temperature. It was performed on a treadmill, and it included 3 min of fast walking/slow running (5–6 km/h) and 3 min of running at 9–10 km/h. Then, the players performed full-body mobility that was performed in three positions: (1) quadruped; (2) half-kneeling; (3) plank on straight arms. They performed 10 repetitions of each exercise, and this part of the warm-up took approximately 5 min. Quadruped exercises included (a) extending/flexing spine (cat–camel); (b) internal/external rotations of the hips. Half-kneeling exercises were: (a) adductor/hamstring mobility; (b) hip mobility performed in 3 positions; (c) thoracic rotations. The last part of the mobility warm-up included: (a) isolated downward–upward movement of the scapulas; (b) pushing hips up with straight legs and returning to plank (downward dog to plank). Afterwards, the third part of the warm-up was performed standing, and it consisted of a set of 10 repetitions of dynamic stretching: (a) knee to chest with calf raise; (b) heel to buttocks with calf raise). Lastly, the athletes performed (a) 2 sets of pogo jumps (mini jumps using only ankle joints) performed for 10 s with 30 s of rest period between sets; (b) 5 countermovement jumps (in a non-continuous manner). The athletes were allowed to perform a warm-up at their own pace, and approximately 60 s after a standardized warm-up, they were prepared to perform testing procedures.

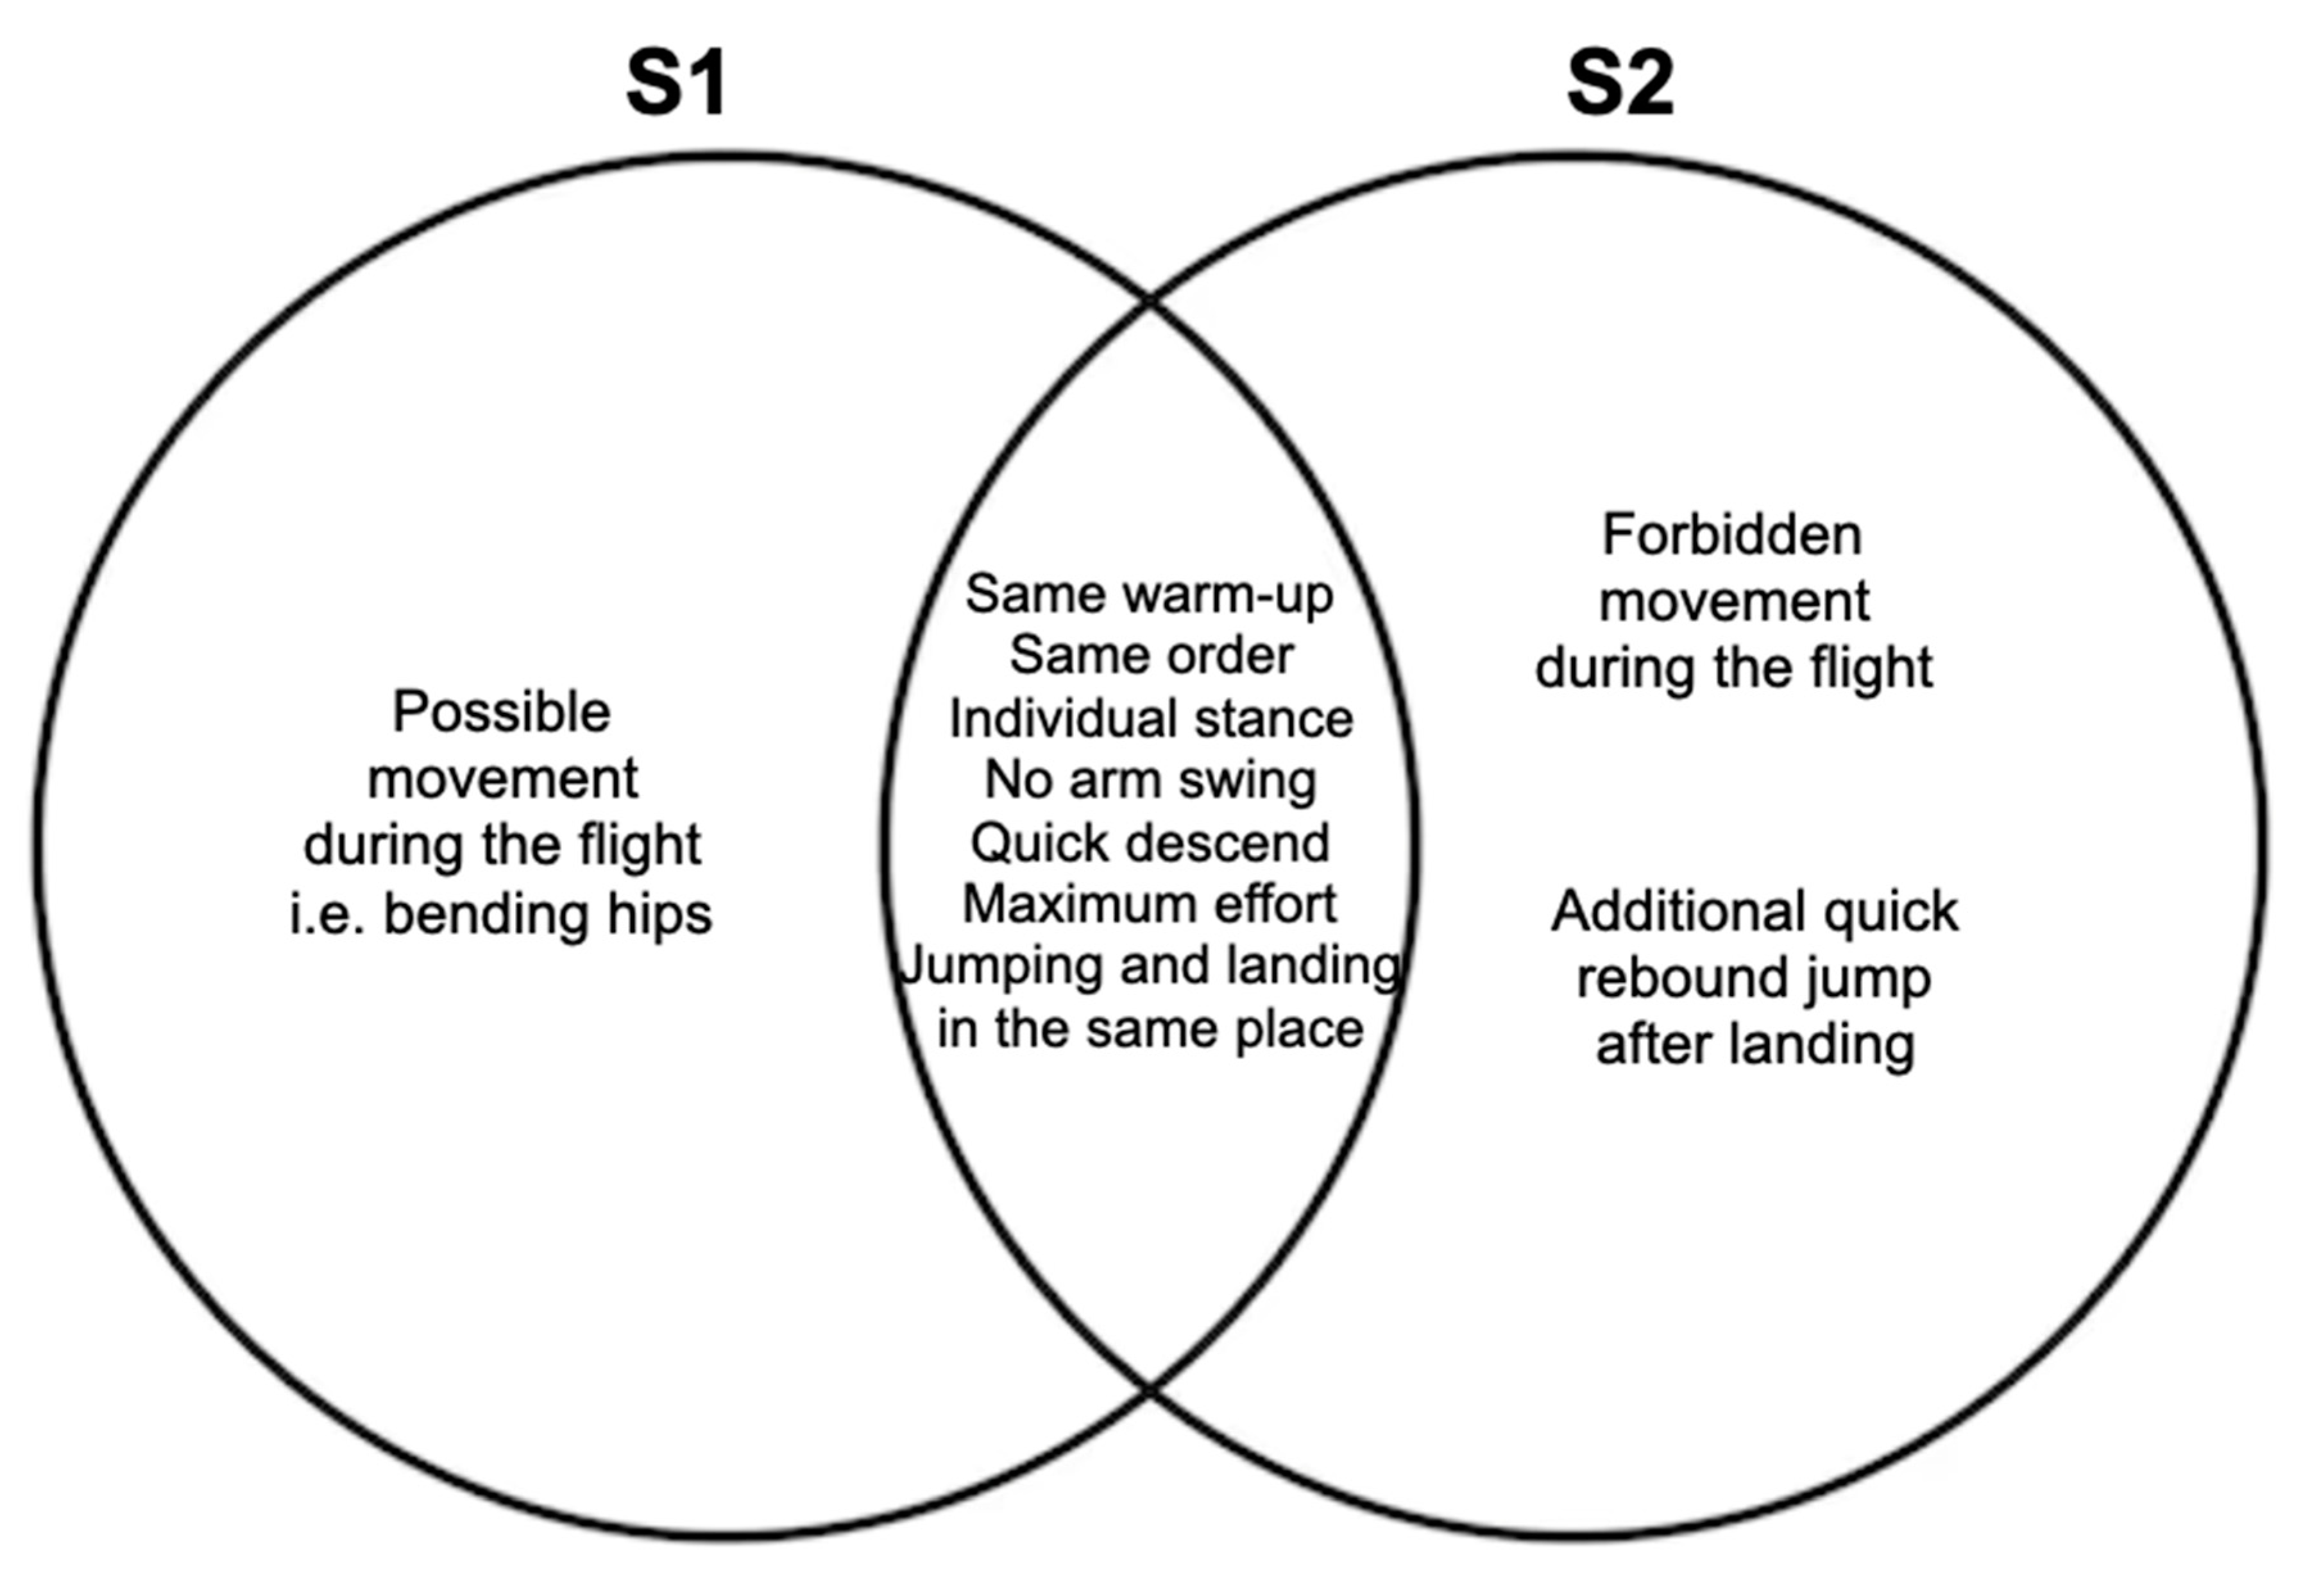
2.4. Testing Sessions

Testing sessions began with a standardized warm-up. Sixty seconds after a standardized warm-up, participants performed a CMJ on a contact mat. Then, approximately 90 s later, they performed another CMJ. Results of the study involve analysis performed for 9 players (as they were present in both competitive seasons), but testing procedures usually involved approximately 12 players. Two of the jumps were performed in the same order during all of the sessions in a given season. As the athletes were allowed to perform a warm-up at their own pace and were finishing it at slightly different rest intervals, the investigator of the study prepared the order of the jumps based on that. The athletes who were finishing the warm-up first were the first ones to start testing after approximately 60 s of rest interval (Figure 2). As testing procedures took place in a group setting, there is a possibility that the athletes did not always perform their first jump after exactly 60 s of rest interval after a warm-up. However, the rest interval of approximately 90 s between jumps was strictly monitored with a jumping mat software (Chronojump 2.3.0.), and it was forbidden to exceed 100 s.

2.5. Jumping Measurements

Jumping measurements were performed on a Chronojump jumping mat (Spain) that was proved to be a low-cost valid and reliable tool for monitoring variations in vertical jumping performance [41,42,43]. Execution of the measurements varied between the seasons, but some of the parts were unchanged for both seasons. All the CMJs were performed without the arm swing (hands placed on the hips), and in both seasons, the athletes could choose their stance width and were instructed to descend quickly until they reach approximately 90 degrees of knee flexion and jump as high as possible. In S1, the athletes were instructed to perform the jump in the same manner every testing session while having more freedom in the movement (i.e., bending the hips and dorsiflexion of the ankles as in the volleyball block). In S2, additional cues included forbidding the athletes any movement during the flight and an additional quick rebound jump immediately after landing to ensure soft landing on the mat in the same position as during the take-off (full plantar flexion) (Figure 3). Because the CMJ was performer with hands placed on the hips, the athletes were unable to use an extrinsic motivator (e.g., jumping to an object) [44], but the external verbal motivation was introduced through the measurements as it was suggested to potentially increase performance under fatigue [45]. During all the measurements, the participants were instructed to perform jumps with a maximum effort, and their performance was constantly assessed by the supervisor of the study. If an athlete did not feel comfortable during the measurements or his performance was extraordinarily low due to some health problems, he was withdrawn out of the measurements, and his results were not taken into statistical analysis.

2.6. Subjective Monitoring

In addition to objective monitoring of neuromuscular fatigue by frequent CMJ testing, a subjective monitoring was also introduced to the participants of the study. After their training sessions, they rated the exertion of these sessions by using an sRPE scale [46,47] and also a subjective wellness questionnaire regarding their subjective readiness to training. There are a variety of tools that are implemented in sports to monitor sleep, mental fatigue, stress or motivation [13,14,48]. They are more or less detailed, but our approach was to simplify the process as much as possible. Therefore, we prepared a simplified questionnaire, and the athletes were supposed to rate their subjective morning readiness to train (until noon) by choosing an appropriate number (also possible halves, e.g., 6.5) and optionally leaving an additional comment about their sleep routine, muscle or joint soreness, etc. This type of subjective monitoring was introduced in S1 and was continued in an unchanged manner in S2. The athletes were educated about this type of measurement and were allowed to change the number when they felt that their initial assessment was incorrect. The chart used in this study is presented in Table 3.

2.7. Statistical Analysis

During the competitive season, the average CMJ height was used to monitor neuromuscular fatigue, as suggested by the authors [20]. However, we decided to conduct an additional, separate analysis of daily higher jumps so the statistical analysis was performed in two manners: (1) calculating mean jump height and standard deviation of all jumps; (2) calculating mean jump height and standard deviation of the jumps with daily higher jump height in a given session. The Shapiro–Wilk test was used to check data distribution. The significance of differences between S1 and S2 was assessed by Wilcoxon’s test, and the significance was set at p < 0.05. The effect size (Cohen’s d) was calculated and interpreted as small (0.20), medium (0.50) or large (0.80) [49]. Statistical analysis was performed using STATISTICA 13.1 PL software (StatSoft, Inc., Tulsa, OK, USA).

3. Results

Analyzing team results, the significant decrease in JH (p < 0.05) between two seasons was found in regards to all the jumps performed by the players and daily higher jumps of the given sessions. Also, Cohen’s d indicates medium effect in both manners of statistical analysis (Table 4).
Individual analysis of all jumps performed by the players during two competitive seasons indicates a 4.1% decrease in JH in S2. There is only one player (n9) who did not have his JH reduced in S2. Additionally, individual standard deviation of players’ JH decreased by 30.4% in S2 (Table 5).
Analyzing data regarding daily higher jumps, a reduction in JH by 4.4% in S2 can be observed (excluding n9, who improved his JH by 1.7%). Individual standard deviation of players’ JH decreased by 30% in S2 (Table 6).
Analyzing players’ results of subjective monitoring (based on Table 3), no significant difference (p < 0.05) was found between measurements of S1 and S2 (Table 7).

4. Discussion

The most important finding of this study is that the small change in technical execution of a CMJ test was associated with subsequent JH in professional volleyball players when the measurements were performed using the same device. Introducing more rigorous testing procedures in S2 and changing execution of the CMJ during the flight phase led to a statistically significant decrease in JH. Also, individual analysis of players’ jumps indicated that a standard deviation in JH data drastically decreased by approximately 30%. It highlights the importance of carrying out the measurements in the same rigorous manner with special attention to execution of the test.
To our knowledge, this kind of investigation has not been carried out so far. Monitoring fluctuations in weekly CMJ measurements during the competitive season was described in division I basketball players [40] but not within professional athletes. A large amount of data was taken into the statistical analysis (540 jumps in S1 and 468 in S2; 1008 jumps in total) so the results are not based on three or four measurements that took place during the competitive season [38,39]. The results prove that the testing procedures need to be carried out with particular caution to assess CMJ height appropriately. As the practitioners are often not able to afford ‘gold standard’ devices and they are forced to use cheaper alternatives during in-field testing, they should be aware of the limitations of the device implemented into measurements [50]. Weakley et al. [28] highlighted some key recommendations regarding testing procedures to improve its reliability in sports science. They placed the emphasis on describing testing considerations regarding various subjects such as equipment, environmental conditions, tester’s and athlete’s familiarization with the test and equipment. Researchers underline the importance of executing the test in the same manner [27,28], and despite having instructions as to how the test should be performed, a discrepancy within execution of the test by different investigators can be observed [26]. Our work confirmed that the proper execution of the test is critical in obtaining reliable results, especially when no ‘gold standard’ device is introduced into measurements.
Our measurements that took place in S1 could be considered suboptimal as we allowed more freedom in the movement to imitate athlete’s technical action (as in volleyball block), and it is in opposition to current recommendations [26]. These measurements were examined in the same manner consistently, but the addition of one technical cue in S2 changed the dynamics of the measurements. The approximately 4% decrease in JH and decrease in standard deviation by approximately 30% is a discrepancy that would probably not be expected while using the same testing device. Contact mats are considered as an appropriate tool to test vertical JH for slow stretch-shortening cycle as in CMJ [34,51], and the particular mat used in this study was also suggested to be appropriate [41,42,43]. However, some authors indicate that contact mats are appropriate to test JH in college-aged athletes but question its utility with the population of professional athletes as its accuracy seems to decrease with higher values of JH [52]. Our results provide an important insight into testing with this type of equipment. We suggest that in order to maximize accuracy of the measurements and its utility for subsequent NMF monitoring, the practitioners need to implement more rigorous testing procedures as in S2. A 4% decrease in JH was a statistically significant decrease, and it is important in the context of testing CMJ as its approximate between-day coefficient of variation was described as 3.5% [28]. Therefore, if we select an execution of the test that does not maximize the probability of receiving as accurate results as possible, we potentially increase the risk of unreliable testing procedures. CMJ is used not only to track NMF [20] but also as a hint to identify potential talent in youth athletes [53] and ranking the players within the group [28]. The results of our investigation promote high-quality, standardized procedures as they often influence subsequent decision-making within sport institutions.
The approximately 4% decrease in JH was statistically significant, but the approximately 30% decrease in standard deviation may be more relevant for strength and conditioning coaches. To track NMF, it is a common practice to introduce basic statistical analysis such as z-score, coefficient of variation or smallest worthwhile change [28]. In all of these statistical calculations, one of the variables is a standard deviation. Results presented in Table 4 and Table 5 demonstrated a large decrease in standard deviation after introducing more rigorous testing procedures in S2 for all the players (Table 4 and Table 5). Analyzing players’ individual changes in standard deviation between S1 and S2, some results need special attention as such changes as demonstrated by athletes n1 (45 and 37.5%), n3 (58.2 and 54.8%) and n8 (47.1 and 38.6%) should persuade practitioners to implement execution of the CMJ test of S2. A large decrease in the standard deviation means that the results of the measurement are oriented much closer to the mean, and it directly influences the use of highlighted statistical tools as they become much more sensitive to changes in JH. If a strength and conditioning coach uses z-score to compare individual results of a given session to overall data collected during an extended period, such changes in standard deviation may alter the decision-making process within the team. Usually, an integrated approach of subjective and objective monitoring is implemented [8,15], but in the case of using only CMJ measurements to assess NMF, the practitioners could decide incorrectly about a player’s contribution during technical sessions. To put it into perspective, a result of JH that is lower than an athlete’s mean by 3 cm for players n1, n3 or n8 could lead to a completely different intervention regarding these players. In relation to standard deviations from S1, a coach could potentially keep athletes within their normal training regimen, but with the results from S2, he could also potentially modify their participation in a technical session or even withdraw them from the session. In our opinion, this example appropriately illustrates how the decrease in standard deviation in S2 can be even more important than the decrease in JH.
An argument that could be raised against the results of our study is that apart from execution of the jump, a number of other factors can influence their performance in the test. The players could simply be introduced to more physically demanding sessions or participate in a higher number of the games and had insufficient recovery. However, the role of the players between the seasons became unchanged, the starters in S1 were also the starters in S2, the bench players in S1 were also the bench players in S2. Naturally, their playing time could slightly differ, but they generally practiced a similar amount of time (as hours of practice are restricted by the club environment) and participated in nearly the same amount of official games (30 games in S1 and 33 games in S2). Thus, it cannot be said that the smaller mean JH negatively influenced players’ volleyball performance as they advanced to the play-off series in S2 and could not achieve it in S1. Also, according to Table 7, players’ subjective readiness to train did not significantly differ between S1 and S2 (was even slightly higher in S2) so we can assume that their subjective readiness to measurements was similar in S1 and S2 and did not affect the results (Table 7). Another argument may concern the lack of measurements involving one repetition maximum (1RM) of multi-joint lower body movements such as deadlifts, squats or power cleans. The latest research indicates that the measurements of this type are not commonly introduced within the high-performance environment during the competitive season [18]. The isometric mid-thigh pull (IMTP) test is the most popular choice within the practitioners (35%), but it was not performed within a population of our study due to the lack of measurement device. Despite not performing frequent IMTP test or 1RM or 3RM measurements of multi-joint lower body movements, the athletes regularly participated in resistance training that involved different forms of exercises such as squats, trap bar deadlifts, power cleans, etc., to promote their maximal strength and rate of force development. Therefore, we can assume that their level of maximal strength most likely remained unchanged within the competitive seasons and was not a limiting factor to CMJ measurements. However, as the athletes’ training prescriptions changed weekly to optimize their performance during the competition, it should be taken into consideration that their physical condition could also slightly vary during the measurements because of these frequent changes.
Apart from characteristics describing physical condition of the athletes during the measurements, a variety of other external factors could also be associated with their performance. Despite having the same recovery modalities through both competitive seasons (ice baths, sauna, pneumatic compression, visits with a qualified physiotherapist), the athletes had a freedom to choose their recovery modalities on a daily basis. As it was not taken into consideration during the measurements, it could also play a small role in players’ results. Additionally, the athletes were acquainted with general guidelines of sports nutrition, but their caloric intake was not strictly controlled during the measurements, and it could influence their energy level and recovery. Also, in addition to diet, hydration may play a role in athletes’ performance and can affect individual fluctuations in an athlete’s body mass [54,55]. Another factor that influences performance is sleep [56], and its restriction was found to impair athlete’s maximal jump performance [57]. As the competitive season is long and exhaustive, mental fatigue could also arise and influence an athlete’s mental health and motivation [8,9]. Thus, the psychological factors could also play a role in an athlete’s result during the measurements. Despite the inability to control all the external variables that could be associated with CMJ performance, it should be highlighted that apart from the proper execution of a jump, a number of other factors may correlate with results of the test.
Our study has practical applications and can be transferred to high-performance environments. Despite force platforms being a ‘gold standard’ for CMJ measurements, the practitioners are often forced to use cheaper alternatives in in-field testing, and contact mats are often chosen for this matter. Our results provide an additional context to already existing guidelines regarding testing procedures [26,27,28]. Apart from the proper execution of the jump in the same environment, the coaches also need to implement the most reliable technique that can guarantee the most repeatable results. Our approach to give the athletes more freedom during flight phase in S1 and let them bend the hips as in the volleyball block seem to be suboptimal for weekly CMJ measurements to monitor NMF within team sports. Introducing more rigorous testing in S2 allowed us to significantly decrease standard deviation of their JH, and it improved the sensitivity of the test while using this specific measurement device. Our investigation involved professional athletes and large data collected during two competitive seasons so the strength and conditioning coaches using this type of equipment may apply results of this study into their training environment. Therefore, during CMJ measurements, not only the device should be interchangeable but also the execution of the jump, as different executions within the same device could be associated with influencing the vertical JH. However, as the sample size was small, extrapolating the results of our study to other athletes should be performed with caution. The researchers should be encouraged to verify it through further investigation with a larger sample size and more controlled design of external factors (i.e., sleep, nutrition, etc.).

5. Limitations of the Study

In addition to its strengths, the study also has its limitations. Despite a large collection of data, the study involved only nine participants. However, it was impossible to increase the number of participants as we could analyze the results of the players who retained their club status within two competitive seasons. Also, in spite of reminding the athletes the proper execution of the jump consistently, the exact execution of the jump was not controlled by any camera controlling motion or any similar device. Lastly, the device used for jump measurements did not allow to control the kinematic variables of the CMJs that could be reported in addition to JH [31]. Also, apart from physical characteristics of the athletes, a number of other external factors (i.e., recovery modalities, motivation, sleep, nutrition) may correlate with results of the test and should be more controlled in further investigation.

6. Conclusions

This pilot observational study provided in-depth individual analysis of changes in JH in professional volleyball players during two competitive seasons. Execution of the jump during a flight phase as a differentiating factor between the seasons was associated with changes in the results of jumping measurements, and using the technique of S2 seems to be more appropriate using this type of measurement device. The results of our study indicated that it not only decreased JH but also decreased standard deviation of the data, and at the same time, the decline in JH was not associated with a deterioration in volleyball performance. Therefore, it highlights the importance of having consistent, rigorous testing procedures while mastering an athlete’s execution of the jump during numerous occasions using the same device in order to effectively track changes between separate measurement sessions.

Author Contributions

Conceptualization, S.M.; Methodology, S.M.; Formal Analysis, S.M. and M.M.; Investigation, S.M.; Data Curation, S.M.; Writing—Original Draft Preparation, S.M.; Writing—Review and Editing, M.M.; Supervision, M.M. All authors have read and agreed to the published version of the manuscript.

Funding

The APC was financed within the program of the Minister of Science in Poland under the name ‘Regional Excellence Initiative’ in years 2024–2027 (project number: RID/SP/0027/2024/01) in the amount of PLN 4,053,904.00.

Institutional Review Board Statement

All participants were informed about the study protocol, voluntarily took part in the experiment and signed the informed consent. The study protocol was approved by the Bioethics Committee (Regional Medical Chamber in Kraków, Poland; opinion no: 1/KBL/OIL/2022) and performed according to the ethical standards of the Declaration of Helsinki 2013.

Informed Consent Statement

Informed consent was obtained from all subjects involved in the study.

Data Availability Statement

The raw data supporting the conclusions of this article will be made available by the authors on request.

Conflicts of Interest

The authors declare no conflicts of the interest.

References

  1. Saw, A.E.; Main, L.C.; Gastin, P.B. Monitoring the athlete training response:subjective self-reported measures trump commonly used objective measures: A systematic review. Br. J. Sports Med. 2016, 50, 281–291. [Google Scholar] [CrossRef] [PubMed]
  2. Alba-Jiménez, C.; Moreno-Doutres, D.; Peña, J. Trends Assessing Neuromuscular Fatigue in Team Sports: A Narrative Review. Sports 2022, 10, 33. [Google Scholar] [CrossRef]
  3. Jones, C.M.; Griffiths, P.C.; Mellalieu, S.D. Training Load and Fatigue Marker Associations with Injury and Illness: A Systematic Review of Longitudinal Studies. Sports Med. 2017, 47, 943–974. [Google Scholar] [CrossRef] [PubMed]
  4. McLelan, C.P.; Lovell, D.I.; Gass, G.C. Creatine kinase and endocrine responses of elite players pre, during, and post rugby league match play. J. Strength Cond. Res. 2010, 24, 2908–2919. [Google Scholar] [CrossRef] [PubMed]
  5. McLean, B.D.; Coutts, A.J.; Kelly, V.; McGuigan, M.R.; Cormack, S.J. Neuromuscular, Endocrine, and Perceptual Fatigue Responses During Different Length Between-Match Microcycles in Professional Rugby League Players. Int. J. Sports Physiol. Perform. 2010, 5, 367–383. [Google Scholar] [CrossRef]
  6. Marcora, S.M.; Staiano, W.; Manning, V. Mental fatigue impairs physical performance in humans. J. Appl. Physiol. 2009, 106, 857–864. [Google Scholar] [CrossRef]
  7. Nässi, A.; Ferrauti, A.; Meyer, T.; Pfeiffer, M.; Kellmann, M. Psychological tools used for monitoring training responses for athletes. Perform. Enhanc. Health 2017, 5, 125–133. [Google Scholar] [CrossRef]
  8. Thorpe, R.T.; Atkinson, G.; Drust, B.; Gregson, W. Monitoring Fatigue Status in Elite Team-Sport Athletes: Implications for Practice. Int. J. Sports Physiol. Perform. 2017, 12, 227–234. [Google Scholar] [CrossRef]
  9. Hägglund, M.; Waldén, M.; Magnusson, H.; Kristenson, K.; Bengtsson, H.; Ekstrand, J. Injuries affect team performance negatively in professional football: An 11-year follow-up of the UEFA Champions Leaguinjury study. Br. J. Sports Med. 2013, 47, 738–742. [Google Scholar] [CrossRef]
  10. Thornton, H.R.; Delaney, J.A.; Duthie, G.M.; Dascombe, B.J. Developing Athlete Monitoring Systems in Team Sports: Data Analysis and Visualization. Int. J. Sports Physiol. Perform. 2019, 14, 698–705. [Google Scholar] [CrossRef]
  11. Halson, S.L. Monitoring Training Load to Understand Fatigue in Athletes. Sports Med. 2014, 44, 139–147. [Google Scholar] [CrossRef] [PubMed]
  12. Bourdon, P.C.; Cardinale, M.; Murray, A.; Gastin, P.; Kellmann, M.; Varley, M.C.; Gabbett, T.J.; Coutts, A.J.; Burgess, D.J.; Gregson, W.; et al. Monitoring Athlete Training Loads: Consensus Statement. Int. J. Sports Physiol. Perform. 2017, 12, 2161–2170. [Google Scholar] [CrossRef] [PubMed]
  13. Coyne, J.O.C.; Haff, G.G.; Coutts, A.J.; Newton, R.U.; Nimphius, S. The Current State of Subjective Training Load Monitoring—A Practical Perspective and Call to Action. Sports Med. Open 2018, 4, 58. [Google Scholar] [CrossRef] [PubMed]
  14. Montull, L.; Slapšinskaitė-Dackevičienė, A.; Kiely, J.; Hristovski, R.; Balagué, N. Integrative Proposals of Sports Monitoring: Subjective Outperforms Objective Monitoring. Sports Med. Open 2022, 8, 41. [Google Scholar] [CrossRef] [PubMed]
  15. Lourenço, L.; Gouveia, E.R.; Sarmento, H.; Ihle, A.; Ribeiro, T.D.; Henriques, J.; Martins, F.; França, C.; Ferreira, R.M.; Fernandes, L.; et al. Relationship between Objective and Subjective Fatigue Monitoring Tests in Professional Soccer. Int. J. Environ. Res. Public Health 2023, 20, 1539. [Google Scholar] [CrossRef] [PubMed]
  16. Taylor, K.L.; Chapman, D.W.; Cronin, J.; Newton, M.J.; Gill, N.D. Fatigue Monitoring in High Performance Sport: A Survey of Current Trends. J. Aust. Strength Cond. 2012, 20, 12–23. [Google Scholar]
  17. Beere, M.; Jeffreys, I. Physical testing and monitoring practices in elite male football. Prof. Strength Cond. 2021, 62, 29–42. [Google Scholar]
  18. Asimakidis, N.D.; Bishop, C.J.; Beato, M.; Mukandi, I.N.; Kelly, A.L.; Weldon, A.; Turner, A.N. A survey into the current fitness testing practices of elite male soccer practitioners: From assessment to communicating results. Front. Physiol. 2024, 15, 1376047. [Google Scholar] [CrossRef] [PubMed]
  19. Markovic, G.; Dizdar, D.; Jukic, I.; Cardinale, M. Reliability and Factorial Validity of Squat and Countermovement Jump Tests. J. Strength Cond. Res. 2004, 18, 551–555. [Google Scholar] [CrossRef]
  20. Claudino, J.G.; Cronin, J.; Mezêncio, B.; McMaster, D.T.; McGuigan, M.; Tricoli, V.; Amadio, A.C.; Serrão, J.C. The countermovement jump to monitor neuromuscular status: A meta-analysis. J. Sci. Med. Sport 2017, 20, 397–402. [Google Scholar] [CrossRef]
  21. Gathercole, R.J.; Sporer, B.C.; Stellingwerff, T.; Sleivert, G.G. Comparison of the Capacity of Different Jump and Sprint Field Tests to Detect Neuromuscular Fatigue. J. Strength Cond. Res. 2015, 29, 2522–2531. [Google Scholar] [CrossRef] [PubMed]
  22. Edwards, T.; Spiteri, T.; Piggott, B.; Bonhotal, J.; Haff, G.G.; Joyce, C. Monitoring and Managing Fatigue in Basketball. Sports 2018, 6, 19. [Google Scholar] [CrossRef] [PubMed]
  23. Garrett, J.; Graham, S.R.; Eston, R.G.; Burgess, D.J.; Garrett, L.J.; Jakeman, J.; Norton, K. A Novel Method of Assessment for Monitoring Neuromuscular Fatigue within Australian Rules Football Players. Int. J. Sports Physiol. Perform. 2019, 14, 598–605. [Google Scholar] [CrossRef] [PubMed]
  24. Garcia-Pinillos, F.; Ramirez-Campillo, R.; Boullosa, D.; Jiménez-Reyes, P.; Latorre-Román, P.A. Vertical Jumping as a Monitoring Tool in Endurance Runners: A Brief Review. J. Hum. Kinet. 2021, 80, 297–308. [Google Scholar] [CrossRef] [PubMed]
  25. Tomasevich, C.L.; Woldstad, J.C.; Jones, D.D. Risk of injury analysis in depth jump and squat jump. J. Hum. Sport Exerc. 2022, 17, 761–781. [Google Scholar] [CrossRef]
  26. Petrigna, L.; Karsten, B.; Marcolin, G.; Paoli, A.; D’Antona, G.; Palma, A.; Bianco, A. A Review of Countermovement and Squat Jump Testing Methods in the Context of Public Health Examination in Adolescence: Reliability and Feasibility of Current Testing Procedures. Front. Physiol. 2019, 10, 450076. [Google Scholar] [CrossRef] [PubMed]
  27. McGuigan, M.R.; Cormack, S.J.; Gill, N.D. Strength and Power Profiling of Athletes: Selecting Tests and How to Use the Information for Program Design. Strength Cond. J. 2013, 35, 7–14. [Google Scholar] [CrossRef]
  28. Weakley, J.; Black, G.; Mclaren, S.; Scantlebury, S.; Suchomel, T.J.; McHanon, E.; Watts, D.; Read, D. Testing and Profiling Athletes: Recommendations for Test Selection, Implementation, and Maximizing Information. Strength Cond. J. 2024, 46, 159–172. [Google Scholar] [CrossRef]
  29. Hopkins, W. How to interpret changes in an athletic performance test. Sportscience 2004, 8, 1–7. [Google Scholar]
  30. Linthorne, N.P. Analysis of Standing Vertical Jumps Using a Force Platform. Am. J. Phys. 2001, 69, 1198–1204. [Google Scholar] [CrossRef]
  31. Anicic, Z.; Janicijevic, D.; Knezevic, O.M.; Garcia-Ramos, A.; Petrovic, M.R.; Cabarkapa, D.; Mirkov, D.M. Assessment of Countermovement Jump: What Should We Report? Life 2023, 13, 190. [Google Scholar] [CrossRef] [PubMed]
  32. Lake, J.; Mundy, P.; Comfort, P.; McMahon, J.J.; Suchomel, T.J.; Carden, P. Concurrent Validity of a Portable Force Plate Using Vertical Jump Force-Time Characteristics. J. Appl. Biomech. 2018, 34, 410–413. [Google Scholar] [CrossRef] [PubMed]
  33. Glatthorn, J.F.; Gouge, S.; Nussbaumer, S.; Stauffacher, S.; Impelizzeri, F.M.; Maffiuletti, N.A. Validity and reliability of optojump photoelectric cells for estimating vertical jump height. J. Strength Cond. Res. 2011, 25, 556–560. [Google Scholar] [CrossRef] [PubMed]
  34. Borges, N.G., Jr.; Borges, L.; Dias, J.A.; Wentz, M.D.; Mattos, D.; Petry, R.; Domenech, S.C. Validity of a new contact mat system for evaluating vertical jump. Mot. Rev. Educ. Física 2011, 17, 26–32. [Google Scholar] [CrossRef]
  35. Ortega, J.P.; Garcia, J.; Ibáñez, S.J. Validity and reliability of the WIMU inertial device for the assessment of the vertical jump. PeerJ. 2018, 6, e4709. [Google Scholar] [CrossRef] [PubMed]
  36. Gençoğlu, C.; Ulupınar, S.; Özbay, S.; Turan, M.; Savaş, B.C.; Asan, S.; İnce, I. Validity and reliability of “My Jump app” to assess vertical jump performance: A meta-analytic review. Sci. Rep. 2023, 13, 20137. [Google Scholar] [CrossRef] [PubMed]
  37. Soler-Lopéz, A.; Garcia-de-Alcaraz, A.; Moreno-Villanueva, A.; Pino-Ortega, J. Concurrent Validity and Reliability of Devices to Measure Jump Height in Men’s Handball Players. Sensors 2022, 22, 9070. [Google Scholar] [CrossRef] [PubMed]
  38. Debien, P.; Mancini, M.; Coimbra, D.R.; de Freitas, D.G.S.; Miranda, R.; Filho, M.G.B. Monitoring Training Load, Recovery, and Performance of Brazilian Professional Volleyball Players During a Season. Int. J. Sports Physiol. Perform. 2018, 13, 1182–1189. [Google Scholar] [CrossRef]
  39. de Pedro-Muñez, A.; Álvarez-Yates, T.; Serrano-Gómez, V.; Garcia-Garcia, O. Intraseason Changes in Vertical Jumps of Male Professional Basketball Players. Int. J. Environ. Res. Public Health. 2023, 20, 5030. [Google Scholar] [CrossRef]
  40. Murr, S.; Aldred, M.; Games, J. Monitoring Countermovement Jump Performance for Division I Basketball Players over the Competitive Season. Am. J. Sports. Sci. 2023, 11, 33–40. [Google Scholar] [CrossRef]
  41. Pueo, B.; Jimenez-Olmedo, J.M.; Lipińska, P.; Buśko, K.; Penichet-Tomas, A. Concurrent validity and reliability of proprietary and open-source jump mat systems for the assessment of vertical jumps in sport sciences. Acta Bioeng. Biomech. 2018, 20, 51–57. [Google Scholar] [CrossRef]
  42. Pueo, B.; Penichet-Tomas, A.; Jimenez-Olmedo, J.M. Reliability and validity of the Chronojump open-source jump mat system. Biol. Sport 2020, 37, 255–259. [Google Scholar] [CrossRef] [PubMed]
  43. Villalon, L.; Jimenez-Olmedo, J.M.; Aparicio-Aparicio, I.; Sanchis-Sanchis, R. Reliability of countermovement jump estimation using the Chronojump jump mat: Intra-session and within-session. J. Physic. Educ. Sport 2024, 24, 133–140. [Google Scholar] [CrossRef]
  44. Kremer, D.E.; Stanford, L.; Lucas, J. The effects of an extrinsic motivator on vertical jump height. Int. J. Exerc. Sci. Conf. Proc. 2022, 16, 323. [Google Scholar]
  45. Barte, J.C.M.; Nieuwenhuys, A.; Geurts, S.A.E.; Kompier, M.A.J. Motivation counteracts fatigue-induced performance decrements in soccer passing performance. J. Sports Sci. 2019, 37, 1189–1196. [Google Scholar] [CrossRef] [PubMed]
  46. Foster, C.; Florhaug, J.A.; Franklin, J.; Gottschall, L.; Hrovatin, L.A.; Parker, S.; Doleshal, P.; Dodge, C. A New Approach to Monitoring Exercise Training. J. Strength. Cond. Res. 2001, 15, 109–115. [Google Scholar] [CrossRef]
  47. Comyns, T.; Flanagan, E.P. Applications of the Session Rating of Perceived Exertion System in Professional Rugby Union. Strength Cond. J. 2013, 35, 78–85. [Google Scholar] [CrossRef]
  48. Sawczuk, T. Training Loads and Player Wellness in Youth Sport: Implications for Illness. Ph.D. Thesis, Leeds Beckett University, Leeds, UK, September 2019. [Google Scholar]
  49. Cohen, J. Statistical Power Analysis for the Behavioral Sciences, 2nd ed.; Elsevier Science: New York, NY, USA, 2013. [Google Scholar]
  50. Kozinc, Ž.; Pleša, J. Discrepancy among Different Methods for Vertical Jump Height Determination and Its Implications for Field-Based Testing: A Narrative Review. Meas. Phys. Educ. Exerc. Sci. 2022, 27, 248–256. [Google Scholar] [CrossRef]
  51. Kenny, I.C.; Cairealláin, A.O.; Comyns, T.M. Validation of an Electronic Jump Mat to Assess Stretch-Shortening Cycle Function. J. Strength Cond. Res. 2012, 26, 1601–1608. [Google Scholar] [CrossRef]
  52. Whitmer, T.D.; Fry, A.C.; Forsythe, C.M.; Andre, M.J.; Lane, M.T.; Hudy, A.; Honnold, D.E. Accuracy of a Vertical Jump Contact Mat for Determining Jump Height and Flight Time. J. Strength Cond. Res. 2015, 29, 877–881. [Google Scholar] [CrossRef]
  53. Teramoto, M.; Cross, C.L.; Willick, S.E. Predictive value of national football league scouting combine on future performance of running backs and wide receivers. J. Strength Cond. Res. 2016, 30, 1379–1390. [Google Scholar] [CrossRef] [PubMed]
  54. Savoie, F.-A.; Kenefick, R.W.; Ely, B.R.; Cheuvront, S.N.; Goulet, E.D.B. Effect of Hypohydration on Muscle Endurance, Strength, Anaerobic Power and Capacity and Vertical Jumping Ability: A Meta-Analysis. Sports Med. 2015, 45, 1207–1227. [Google Scholar] [CrossRef] [PubMed]
  55. Judge, L.W.; Bellar, D.M.; Popp, J.K.; Craig, B.W.; Schoeff, M.A.; Hoover, D.L.; Fox, B.; Kistler, B.M.; Al-Nawaiseh, A.M. Hydration to Maximize Performance and Recovery: Knowledge, Attitudes, and Behaviors among Collegiate Track and Field Throwers. J. Hum. Kinet. 2021, 79, 111–122. [Google Scholar] [CrossRef] [PubMed]
  56. Cook, J.D.; Charest, J. Sleep and Performance in Professional Athletes. Curr. Sleep Med. Rep. 2023, 9, 56–81. [Google Scholar] [CrossRef]
  57. Mah, C.D.; Sparks, A.J.; Samaan, M.A.; Souza, R.B.; Luke, A. Sleep Restriction Impairs Maximal Jump Performance and Alters Lower Extremity Joint Coordination Variability in Elite Athletes. J. Sports Sci. 2019, 37, 1981–1988. [Google Scholar] [CrossRef]
Figure 1. A simplified representation of the organization of the study.
Applsci 14 04463 g001
Figure 2. Testing session design.
Applsci 14 04463 g002
Figure 3. Characteristics of jump execution in S1 and S2.
Applsci 14 04463 g003
Table 1. Inter-players’ body mass changes in competitive season 1.
No.Competitive Season 1
AugustOctoberNovemberDecemberJanuaryFebruaryMarchAprilx
179.481.982.683.882.581.983.582.282.2
282.282.780.480.278.279.879.880.580.5
365.766.265.765.566.364.865.565.765.7
482.783.683.282.382.8 83.283.083.0
580.98282.881.581.582.580.981.781.7
686 8586.986.887.685.586.386.3
783.283.383.283.385.285.883.984.084.0
895.995.394.3979593.493.394.994.9
990.39091.492.891.392.992.891.691.6
x82.983.183.283.783.383.683.283.383.3
SD8.38.38.08.88.29.18.18.28.4
Body mass is presented in kilograms. In case of a gap, a player did not perform the assessment on a given day.
Table 2. Inter-players’ body mass fluctuations in competitive season 2.
No.Competitive Season 2
AugustOctoberNovemberDecemberJanuaryFebruaryMarchAprilx
180.979.380.779.37980.28079.979.9
281.678.777.5777675.777.677.777.7
3666665.26665.36665.665.765.7
486.184.6848282.784.386.384.384.3
582.881.282.682.782.785.58683.483.4
686.787.789.188.687.988.388.888.288.2
781.381.582.381.582.982.5 82.082.0
892.792.792.890.591.290.692.591.991.9
993.994.795.392.290.990.793.39393.0
x83.682.983.382.282.182.683.882.982.9
SD8.28.58.98.08.17.99.28.28.4
Body mass is presented in kilograms. In case of a gap, a player did not perform the assessment on a given day.
Table 3. Subjective wellness questionnaire.
Morning Readiness Chart
3—injured/illness, not able to participate in any type of training
4—extremely fatigued, serious muscle or joint soreness, not able to fully participate in training, requirement of different type of training or recovery day
5—very fatigued, moderate muscle or joint soreness, ready to participate in training but some training adjustments may be needed
6—slightly fatigued, small muscle or joint soreness, ready to fully participate in training
7—feeling well, possible small muscle or joint soreness, ready to fully participate in training
8—feeling very well, no sign of muscle or joint soreness, ready to fully participate in training
9—fully rested, no sign of muscle or joint soreness, ready to fully participate in training
10—fully recovered, no sign of any fatigue or soreness
Table 4. Team results of JH in S1 and S2.
SeasonNumber of JumpsJH (cm)
Mean ± SD
pCohen’s d
All the jumps
S154046.7 ± 3.50.010.55
S246844.8 ± 3.3
Daily higher jumps
S127047.5 ± 3.60.010.6
S223445.4 ± 3.4
Table 5. Individual analysis of all jumps in S1 and S2.
No.Number of Jumps in S1Number of Jumps in S2Mean JH in S1Mean JH in S2Change in %SD of JH in S1SD of JH in S2Change in %
1663842.640.3−5.42.111.16−45
266524240.4−3.82.462.14−13
366584946−6.12.561.07−58.2
4705851.849.4−4.61.941.39−28.4
5685445.443.6−41.771.58−10.7
6425650.847.8−5.91.751.08−38.3
7465447.544.7−5.91.611.43−11.2
8644843.642.5−2.52.11.11−47.1
9525047.648.21.32.151.88−12.6
x6052.046.744.8−4.12.051.43−30.4
SD10.46.23.53.3 0.320.38
JH—jump height.
Table 6. Individual analysis of daily higher jumps in S1 and S2.
No.Number of Jumps in S1Number of Jumps in S2Mean JH in S1Mean JH in S2Change in %SD of JH in S1SD of JH in S2Change in %
1331943.640.8−6.42.241.4−37.5
2332642.541−3.52.72.2−18.5
3332950.146.7−6.82.631.2−54.4
4352952.650.3−4.42.121.4−34
5342745.844.2−3.52.041.8−11.8
6212851.548.6−5.61.731.3−24.9
7232748.745.3−72.161.6−25.9
8322444.543−3.42.11.29−38.6
9262547.948.71.72.552−21.6
x302647.545.4−4.42.251.58−30
SD5.23.13.63.4 0.320.35
JH—jump height.
Table 7. Individual results of players’ subjective monitoring.
No.Mean Individual Result of Subjective Monitoring in S1Standard Deviation of Individual Result of Subjective Monitoring in S1Mean Individual Result of Subjective Monitoring in S2Standard Deviation of Individual Result of Subjective Monitoring in S2
16.320.616.710.51
26.820.586.60.57
37.110.687.070.68
46.580.576.630.63
56.590.746.80.76
66.440.696.650.6
76.630.746.70.69
86.560.426.520.44
96.380.496.560.64
x6.600.616.690.61
SD0.240.110.160.10
p0.173
Disclaimer/Publisher’s Note: The statements, opinions and data contained in all publications are solely those of the individual author(s) and contributor(s) and not of MDPI and/or the editor(s). MDPI and/or the editor(s) disclaim responsibility for any injury to people or property resulting from any ideas, methods, instructions or products referred to in the content.

