Abstract
Processing polyethylene terephthalate (PET) into functional materials has both sustainable and economic significance. Therefore, this study aims to prepare functional nanofibers using PET, combining electrospun nanofibers with metal–organic frameworks (MOFs), which is an effective solution to increase the added value of functional nanofiltration membranes (NFMs). The surface morphology of PET fibers is successfully controlled by electrospinning parameters and post-treatment. The formation of a uniform coating of CuBTC crystals on the PET surface is induced by a simple and low-cost in situ growth technique. CuBTC@PET was treated to prepare superhydrophobic CuBTC@PET (SCP), thus improving the stability of CuBTC in water and expanding its potential applications. Through a series of optical and thermal characterizations, the porous morphology formation mechanism and MOF in situ growth mechanism of SCP fibers were discussed. Then, the air filtration performance and bacteriostatic properties of SCP nanofiltration membranes were investigated. The as-prepared SCP showed a high water contact angle (146.4°), low-pressure drop (39.7 Pa), and high filtration efficiency (95.3%, 3 μm NaCl), as well as unique, broad-spectrum antibiosis potency against Staphylococcus aureus (S. aureus) and Escherichia coli (E. coli). This study shows that SCP nanofiltration membranes can be practically applied in high-performance antibacterial filtration membranes.
1. Introduction
Healthcare-acquired infections (HAIs) are now recognized as a major threat to the safety of patients and healthcare workers worldwide. According to the World Health Organization (WHO), healthcare-acquired infections are one of the leading causes of complications and deaths in hospital patients, leading to millions of infections and hundreds of thousands of deaths worldwide each year [1,2,3]. The transmission of bacterial and viral pathogens is a major threat that contributes to the persistence of HAIs [4]. Indirect contact with contaminated surfaces and airborne droplet transmission are the two most common modes of pathogen transmission [5]. Although currently adopted mask standards provide users with basic protection, further research and improvements are needed in terms of particulate matter (PM) filtration efficiency and the inactivation of airborne pathogens [6]. However, the increasing resistance of pathogens to antibiotic drugs has become a worldwide public health problem. Therefore, there is a need to find an alternative to the current conventional antibiotic suppression to avoid the negative effects of drug resistance [7].
Nanofibers have attracted much attention in the field of air filtration by their size effect, high specific surface area, and high porosity [8,9]. Electrostatic spinning technology is one of the most promising nanofiber fabrication technologies due to the simple equipment, easy control, and low price [10]. Electrostatic spinning technology can make nanofiber materials with various structures, such as porous fibers, hollow fibers, beaded fibers, and core–shell fibers [11,12].
Although nonwoven membranes made by stacking electrospun fibers have a large number of voids and pores, these fibrous membranes cannot be considered porous electrospun fibers [13]. Porous fibers should refer to pits or voids on the surface or inside of a single fiber. Porous electrospun fibers have more contact area to intercept contaminant particles in the gaseous medium and load more contaminants due to their higher specific surface area and porosity [14,15]. The conventional pore formation mechanism of the electrostatic spinning process is similar to template casting [16]. The formation of pores in the electrostatic spinning process is essentially a process that controls the solidification of the polymer in solution. Depending on the strategy of the solidification process, the mechanism of porous formation at this stage can be categorized into thermally induced phase separation (TIPS) involving temperature changes, solvent-induced phase separation (SIPS) by selecting a highly volatile solvent, and non-solvent-induced phase separation (NIPS) by controlling the precursor in solution or the environment [17]. Most polymer electrostatically spun fibers are in a low-crystalline or non-crystalline state [18]. Therefore, porous PET fibers were prepared by an electrostatic spinning technique and a post-processing strategy of non-solvent-induced phase separation.
As an emerging class of nanoscale porous materials, metal–organic frameworks (MOFs), which are crystalline structures consisting of metal ions combined with organic ligands, exhibit great potential as carriers of metal ions. These structures are stabilized by chemical bonding between organic ligands and metal ions, which not only maintains their morphological and structural integrity but also effectively restricts their activity, thus achieving stable and slow release of metal ions. Since their first discovery in 1990, MOFs have been investigated for applications in bacteriostasis [19,20,21,22], filtration [23,24,25,26,27], gas storage [28,29], partitioning, energy storage [30], catalysis [31], water harvesting [32], and drug release [33]. CuBTC (also known as HKUST-1 or MOF-199) was first synthesized and published in 1999 by Chui et al. [34]. Because of its simple synthesis method, excellent thermal stability, and good moisture stability development, it is one of the most fully characterized and widely studied MOF materials to date. However, most of the previous studies focused on MOFs in powder form, which limited the application of MOFs due to their challenges such as dust contamination, poor water stability, and low recycling rate.
In this study, a CuBTC@PET composite fiber membrane was prepared based on the aqueous phase synthesis of CuBTC, and the in situ growth of CuBTC on a PET fiber substrate was achieved by a simple and low-cost layer-by-layer growth method, which effectively solved the above problem. Polyethylene terephthalate (PET) fibers are widely used in the modern textile field because of their durability, high tensile strength, and low price [35,36]. PET molecular chains have open ester groups on both sides of the molecular chain, which can provide binding sites for the subsequent in situ growth of CuBTC without any treatment, which greatly reduces the cost and difficulty of preparing CuBTC composite fibers.
In this paper, the excellent flexibility and nanoscale size of electrostatically spun fibers are combined with the high porosity, specific surface area, surface charge, and metal ion carrying capacity of CuBTC. Compared with the traditional electrostatically spun fibers, the great advantages of CuBTC@PET composite fibers in the adsorption of PM and bacterial inhibition make it an ideal material with high efficiency of filtration and bacterial inhibition performance. They provide an effective solution for the preparation of high-performance air filtration and bacteriostatic membranes.
2. Materials and Methods
2.1. Materials
All the chemicals used were of analytical grade. Polyethylene terephthalate (PET), trifluoroacetic acid (TFA), dichloromethane (DCM), ethanol absolute (EtOH), and N-methylpyrrolidone (NMP) were purchased from Shanghai Macklin Biochemical Co., Ltd., Shanghai, China. Copper(ii) nitrate hydrate (Cu(NO3)2·3H2O), trimesic acid, 1,3,5-benzenetricarboxylic acid (BTC), N, N-dimethylformamide (DMF), and 1H,1H,2H,2H-perfluorooctyltriethoxysilane (POTS) were purchased from Sigma-Aldrich Co., Ltd., Shanghai, China.
2.2. Preparation of PET Porous Electrospun Membrane
The PET granules were dried in an electrically heated blower oven for 2 h. TFA and DCM were mixed in different mass ratios and added to the PET granules with thorough stirring, followed by stirring for 1 h with a magnetic stirrer at 300 RMP and 35 °C until PET granules were completely dissolved, and then the precursor solutions were configured with different solvent ratios and polymer concentrations. The spinning voltage and flow rate were controlled during the electrostatic spinning process to complete the one-way experiment, The temperature was 25 °C, the humidity was 45%, the acceptance distance was fixed at 15 cm, and the rotational speed of the drum was fixed at 350 RMP. The drum material was SS316 stainless steel, and the size was Φ100 × 300. The prepared fibrous membranes were dried in a fume hood for 24 h to ensure the complete evaporation of the organic solvents. The parameter settings for each specimen for electrostatic spinning are shown in Table 1.

Table 1.
Parameters of the electrostatic spinning process.
The fiber membrane prepared in the previous step was immersed in ethanol for cleaning to remove impurities deposited in the air. Mixed solutions with NMP and ethanol ratios (V:V) of 2:3, 1:1, and 3:2 were configured, and the ethanol-cleaned PET fibers were submerged in the NMP/ethanol solution with magnetic stirring for sufficient mixing and were immersed in NMP/ethanol solution for 30 min, 45 min, and 60 min, respectively, and then the dried fibrous membranes were immersed in ethanol for 15 s. The treated fibrous membranes were subsequently dried for 12 h. The dried fibrous membranes were then dried for 12 h.
2.3. Preparation of Superhydrophobic CuBTC@PET Composite Membrane
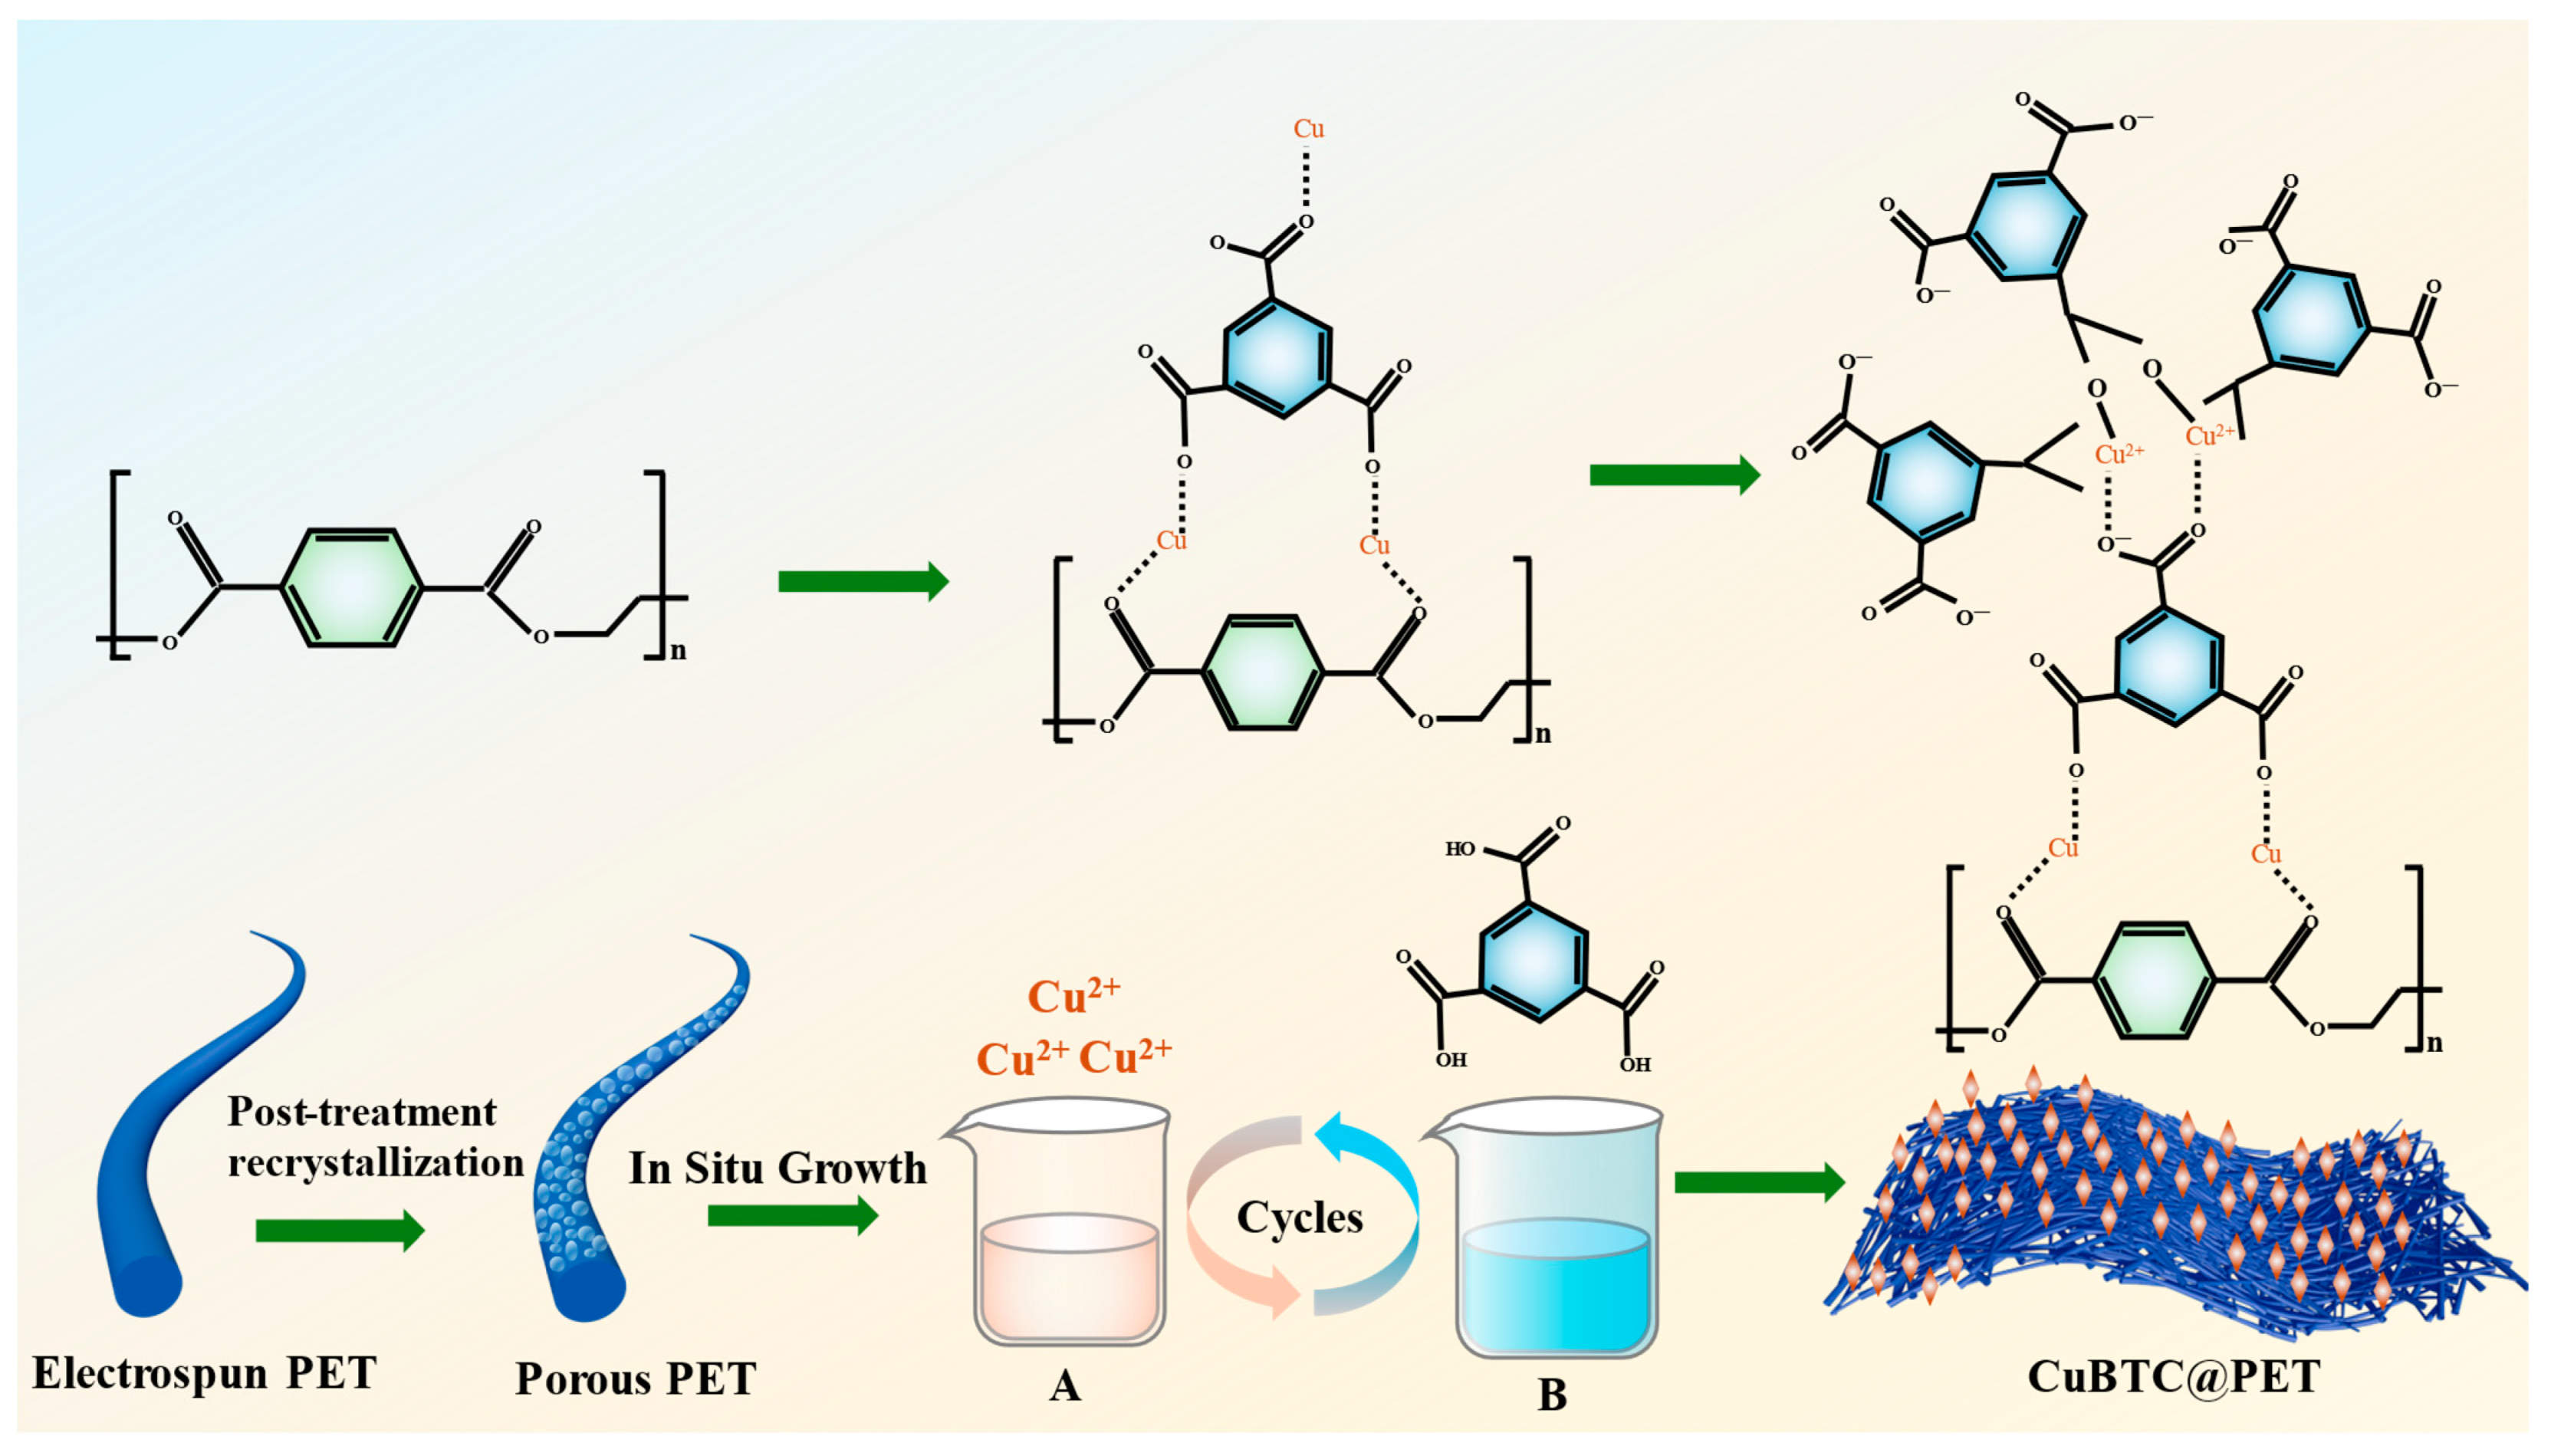
CuBTC@PET fiber was based on the method of synthesizing CuBTC powder in an aqueous phase under room-temperature conditions. PET electrospun fibers were used as the substrate so that Cu2+ ions and homobenzoic acid were used to directly grow CuBTC crystals in situ on PET fibers. DMF, deionized water, and ethanol were mixed in a 1:1:1 ratio to 48 mL, and 3.6 g of Cu(NO3)2-3H2O and 1.35 g of BTC were added. Then, the two solutions were dispersed by ultrasonication for 20 min; the specific parameters were as follows: the ultrasonic power was 230 W, the closed cycle time was 15 s, and the open cycle time was 45 s. The Cu2+-containing solution A and the BTC ligand solution B were obtained. The PET fiber membrane before and after recrystallization treatment was cut to 20 cm × 20 cm, and the metal skeleton was grown layer-by-layer as follows: the fiber membrane was immersed into solution A for 15 min, washed with anhydrous ethanol for 15 s, immersed into solution B for 15 min, and then washed with anhydrous ethanol for 15 s. The above steps are one cycle. The sample was cycled for 3, 5, 7, or 9 cycles. Finally, the composite fiber membrane with ethanol was cleaned 4 times to remove the residual Cu2+ and ligand from the fiber surface. The prepared fiber membranes were dried in a fume hood for 12 h to obtain CuBTC@PET composite fiber membranes with different growth cycles. The detailed route of the experiment is shown in Figure 1.

Figure 1.
Schematic route of CuBTC@PET preparation.
The CuBTC@PET composite fiber membrane prepared in the previous step was sheared to 4 cm × 4 cm and washed twice using anhydrous ethanol to remove inter-fiber impurities. Subsequently, 1 mL of POTS solution was added to 20 mL of anhydrous ethanol, and the treated CuBTC@PET was immersed in the mixed solution at 30 °C for 1 h. Subsequently, the composite fiber membranes were taken out from the mixed solution and dried at 140 °C for 1 h in an electric blast drying oven, and the resulting superhydrophobic CuBTC@PET composite fiber membranes were prepared for further experiments.
2.4. Characterization of Membranes
The fiber micromorphology of the PET fiber membrane, recrystallized porous PET fiber membrane, CuBTC powder, and CuBTC@PET composite fiber membrane was observed and analyzed using a JSM-7610F Plus field emission scanning electron microscope (SEM) from JEOL, Tokyo, Japan.
The distribution of elements such as C, O, Cu, Si, and F on the surface of the CuBTC@PET composite fiber membrane and superhydrophobic CuBTC@PET composite fiber membrane was quantitatively and qualitatively examined by using an EDS spectrometer of 7021-H from HORIBA, Kyoto, Japan.
A Bruker D8 Advance X-ray diffractometer (USA) was used to slowly sweep the samples at 2°/min, and the measurement angles were 2θ = 5~50°. CuBTC@PET composite nanofibers with different cycles, CuBTC powder, and CuBTC@PET water stability before and after hydrophobic modification were tested.
The elemental full spectra of PET nanofibers, 5-cycle CuBTC@PET composite fiber membranes, and superhydrophobic CuBTC@PET composite fibers were analyzed by an X-ray photoelectron spectroscopy (XPS) instrument (ESCALAB 250Xi) from Thermo Fisher, Waltham, MA, USA, in the scanning range of 50 to 1500 eV, and the elemental narrow spectral scans of C, O, Cu, Si, and F were performed after the split-peak fitting.
The functional groups of PET-dissolved porous fiber membrane, CuBTC powder, CuBTC@PET composite fiber membrane, and superhydrophobic CuBTC@PET composite fiber membrane were analyzed at 400–2300 cm−1 by a Nicolet iS10 Fourier transform infrared spectrometer (FTIR) from Thermo Fisher, Waltham, MA, USA, with a signal resolution of 2 cm−1.
The contact angle of the fiber membrane was experimented with using the DCAT21 dynamic contact angle measuring instrument from Beijing Huahai Henghui Science and Technology Co., Ltd., Beijing, China. The droplet method was chosen for the contact angle test, and the volume of water droplets was 5 μL. The contact angle of each sample was obtained at different moments by timing the droplets’ contact with the samples until the end of the recordings after the droplets were stabilized on the surface of the samples.
Changes in thermal properties of CuBTC@PET composite fibers before and after hydrophobicity modification were analyzed using an STA7300 thermogravimetric–differential thermal analyzer from Hitachi, Japan, with a set heating rate of 15 °C/min and a measurement temperature interval from 20 °C to 800 °C.
2.5. Filtration Performance Test
The pore size distribution and specific surface area of the PET nanofiber membrane, CuBTC powder, and CuBTC@PET composite nanofiber membrane were determined by using the fully automatic specific surface area and porosity distribution analyzer (BET) of ASAP2020 from Mack, Atlanta, GA, USA. The adsorption and desorption isotherms of nitrogen were measured at the temperature of liquid nitrogen, and the specific surface area and pore size distribution of the samples could be obtained directly according to the self-contained calculation model.
The filtration performance of CuBTC@PET composite fiber membrane under different parameters was tested on the DR251XL automatic filter tester from Suzhou Checker Instruments. A sample with a test area of 30 cm × 30 cm was clamped between the upper and lower grippers, and the flow rate of the airflow through the sample was controlled by the flow control knob to be 32 L/min. The aerosol generator produces atomized NaCl particles with a random distribution of particle size, the number of upstream and downstream particles (N1 and N2, respectively) can be detected by the connected laser particle counter, and the computer will automatically give the filtration efficiencies of particles with particle sizes of ≥0.3 μm, ≥0.5 μm, ≥1 μm, ≥3 μm, ≥5 μm, and ≥10 μm according to the efficiency formula η = (N1 − N2)/N1 × 100%; the compression resistance can be obtained by pressure sensor. The pressure resistance can be obtained through the pressure sensor test.
2.6. Antibacterial Test
The antimicrobial test was carried out using the zone of inhibition method. The samples were cut into 1 cm diameter discs and sterilized by UV light for 30 min. The vessels and culture medium required for the experiment were autoclaved at 121 °C for 2 h in a GR60DA autoclave from Guangzhou Anxin Biotechnology (Guangzhou, China) and then taken out and put on the ultra-clean bench that had been sterilized by ultraviolet light for 30 min. The sterilized hot solid culture medium was cooled and solidified. A certain amount of Staphylococcus aureus and Escherichia coli were taken into the liquid medium with an inoculating ring and incubated at 37 °C, 135 r/min in a constant temperature oscillator for 10 h to the appropriate concentration (106 CFU/mL). Next, 0.1 mL of the bacterial solution was pipetted into a Petri dish with a pipette gun, and the surface was scraped with an applicator stick so that the bacterial solution completely covers the surface. Using sterile tweezers, the sample disc was gently pressed to make it fit tightly in the center of the Petri dish. The petri dish was then incubated at 37 °C for 18 h and then removed to measure the size of the emerging inhibition circle.
3. Results and Discussion
3.1. Morphology and Characterization of the CuBTC@PET Membranes
3.1.1. PET Electrospun Fiber Morphology Study
The one-factor control microscopic morphology of PET fiber membrane prepared by electrostatic spinning is shown in Figure 2; the SEM images shown are all magnified 30,000 times. The spinning parameters of Figure 2A are as follows: TFA/DCM is 1:1; PET 12 wt%; 16 kV; 1 mL/h. The diameter distribution is more uniform, with an average diameter of 374.22 ± 70.56 nm. The effect of the solvent system on the morphology of the fibers can be seen by observing Figure 2A–C. Researchers generally believe that TFA/DCM is a better solvent for PET electrostatic spinning [37,38]. TFA has a high dielectric constant and low surface tension (42.1 N/m and 13.63 dyn/cm), and as a good solvent for PET, it can be effective in stretching droplets to form a stable jet. DCM has a low dielectric constant and high surface tension (8.9 N/m and 28.12 dyn/cm), and as a co-solvent, it can be used as an auxiliary solvent to control the fiber size through the adjustment of the ratio. As shown in Figure 2B, the ratio of TFA/DCM is 1:2, and when the ratio of DCM is higher, the fibers cannot be completely stretched because the electric field force can not overcome the excessive surface tension of the solution, resulting in beading defects in the fibers and extremely non-uniform fiber distribution. When the ratio of solvent increases, as shown in Figure 2C, it leads to a decrease in the surface tension of the solution, and the phenomenon of Taylor cone instability and uneven fiber diameter distribution occurs during the spinning process. Figure 2D,E shows the micrographs under 10 wt% and 14 wt% PET. As shown in Figure 2D, a lower concentration resulted in the polymer droplets not being fully stretched in the needle, and the droplets dropped on the fiber membrane without being fully stretched by the electric field force to form beading defects. When the PET concentration was further increased, the solution surface tension was subsequently increased, leading to a decrease in the solution spinning and splitting ability, and the fiber diameter was subsequently increased, as shown in Figure 2E [39,40]. The control at different voltages is shown in Figure 2F,G. At 14 kV, due to the small electric field force, the speed of the spinning jet is insufficient, and the solvent evaporates slowly, resulting in the phenomenon of fiber adhesion and aggregation, which is mainly because the electric field force is insufficient to stretch the solution jet sufficiently at this voltage, which leads to the failure of the solvent to evaporate completely, resulting in the spinning defects described above [41]. When the voltage was further increased to 18 kV, the Taylor cone angle was observed to become smaller and jittery during the spinning process, and its microscopic morphology is shown in Figure 2G. Figure 2H,I shows the microscopic morphology under different flow rate conditions. Under the condition of 0.8 mL/h, the interruption of the Taylor cone due to insufficient solution was observed during the spinning process. While increasing to 1.2 mL/h, the droplets at the needle could not be stretched to the Taylor cone in time, resulting in droplet falling. Both sets of samples had larger diameters and were unevenly distributed compared to sample A. The results showed that the droplets were not uniformly distributed.
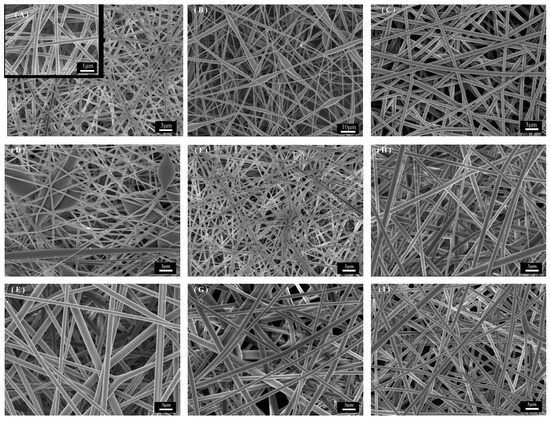
Figure 2.
SEM images of PET fiber membranes with different parameters: (A) better spinning parameters, (B,C) TFA/DCM ratio control, (D,E) PET mass fraction control, (F,G) voltage control, (H,I) flow rate control.
3.1.2. Post-Processing PET Fiber Morphology Study
In this experiment, non-solvent-induced phase separation of PET recrystallization in the choice of solvent is the key to the success of the experiment. There are mainly the following requirements: one is to ensure that the experimental process of PET fiber swelling rather than dissolution by controlling the solvent system on the PET solubility and immersion time to ensure the solvent system into the interior of the fiber, without dissolving the fiber structure, and the other requirement is to select a good solvent that is denser than the poor solvent, such that the poor solvent is relatively hydrophilic and the good solvent is relatively hydrophilic. In this experiment, the solvent system of NMP and ethanol was chosen as the solvent system for non-solvent-induced phase separation solvation and recrystallization, taking into account the Hildebrand solubility parameter, density, volatility, and hydrophilicity. The Hildebrand solubility parameter is a widely recognized theoretical model for assessing the solubility between polymers and solvents, and its value, δ, approximates the dispersion (dD), polarity (dP), and hydrogen bonding (dH) vector sums in the Hansen solubility parameter [42]. As the δ values of the polymer and the solvent are closer, it is easier for the polymer to dissolve. Table 2 shows the physicochemical parameters of the solutions used in the experiment [43].
Table 2.
Comparison of physicochemical properties between NMP and EtOH.
The solvent ratio is an important parameter that directly affects the degree of swelling and the phase separation process. Figure 3 shows the SEM control images under different solvent ratios, and Figure 3a,b demonstrates the SEM images when the EtOH ratio is high, which show that the fiber is slightly rougher compared with the original PET fiber, but there are no voids or pores, which may be due to the low ratio of NMP as a good solvent; the solvent system has a low solubility for PET. This may be due to the low solubility of NMP as a good solvent; in the solvent system with PET, the solution did not penetrate the fiber. When the proportion of NMP increases, as shown in Figure 3c,d the fiber has a completely different surface morphology, and the surface roughness increases dramatically, with voids and pores and other structures and with a superior surface morphology. However, with the further increase in the proportion of NMP, the fiber surface morphology changes more drastically, but on top of the fiber fracture, this seriously affects the mechanical properties of the fiber: due to the increase in the proportion of NMP and the increase in the solvent system solubility of PET, the PET fiber swelling degree is too high and nearly dissolved, and the remaining PET is not enough to support the complete fiber. In summary, the solvent ratio of NMP/EtOH is crucial to the process of non-solvent-induced phase separation PET recrystallization; as the proportion of NMP increases, the degree of swelling increases and the fiber phase changes are more dramatic, but they are also accompanied by the risk of fiber dissolution breakage, so the 1:1 ratio was chosen to prepare the dissolved and recrystallized PET fibers for subsequent experiments.

Figure 3.
SEM images of PET fibers treated with different NMP/EtOH ratio solutions: (a,b) 2:3, (c,d) 1:1, (e,f) 3:2.
The soaking treatment time is also an important parameter that affects the surface morphology of solution-recrystallized PET fibers. Under the solvent ratio of NMP/EtOH of 1:1, Figure 4 shows the SEM images of PET fibers under different time conditions of immersion treatment, from which it can be learned that the roughness of the fibers does not change much with the increase in immersion time. Figure 4b,d,f shows the local fiber enlargement SEM image, where the different soaking times under the fiber surface morphology changes are not large and the void and pore structures are similar; this is due to the void and pore structures being mainly affected by the process of phase separation, which is mainly affected by the proportion of solvent. The formation of voids and pores occurs in the drying stage of the fiber after the immersion; therefore, the soaking time has little effect on the fiber surface void and pore structure. Observation of Figure 4a,c,e reveals that in 30 min and 45 min of immersion time, each fiber remains independent of the other, and the overall morphology of the fiber membrane is better. When the immersion time increased to 60 min, as shown in Figure 4e, the fiber appeared to be sticky and collapsed, which may be because with the increase of the immersion time, the degree of swelling of the fibers deepens, and the mixture of solutions penetrates deeper into the fiber, and during the immersion process, the fiber surface is not affected by the formation of voids and pores; therefore, there is no significant effect on the void and pore structure of the fiber surface. This may be because with the increase of soaking time, the degree of fiber swelling deepens, the mixed solution penetrates the fiber, and the fiber collapses during the soaking process, and due to the deepening of the degree of swelling, the residual NMP solution inside the fiber in the subsequent EtOH cleaning process results in a sticky phenomenon in the drying process. In summary, 45 min was chosen as the parameter for the preparation of swelling recrystallization. The subsequent steps of the experiment were carried out.

Figure 4.
SEM images of PET fibers with different treatment times under NMP/EtOH of 1:1: (a,b) 1:2, (c,d) 1:1, (e,f) 2:1.
3.1.3. CuBTC@PET Morphology Study
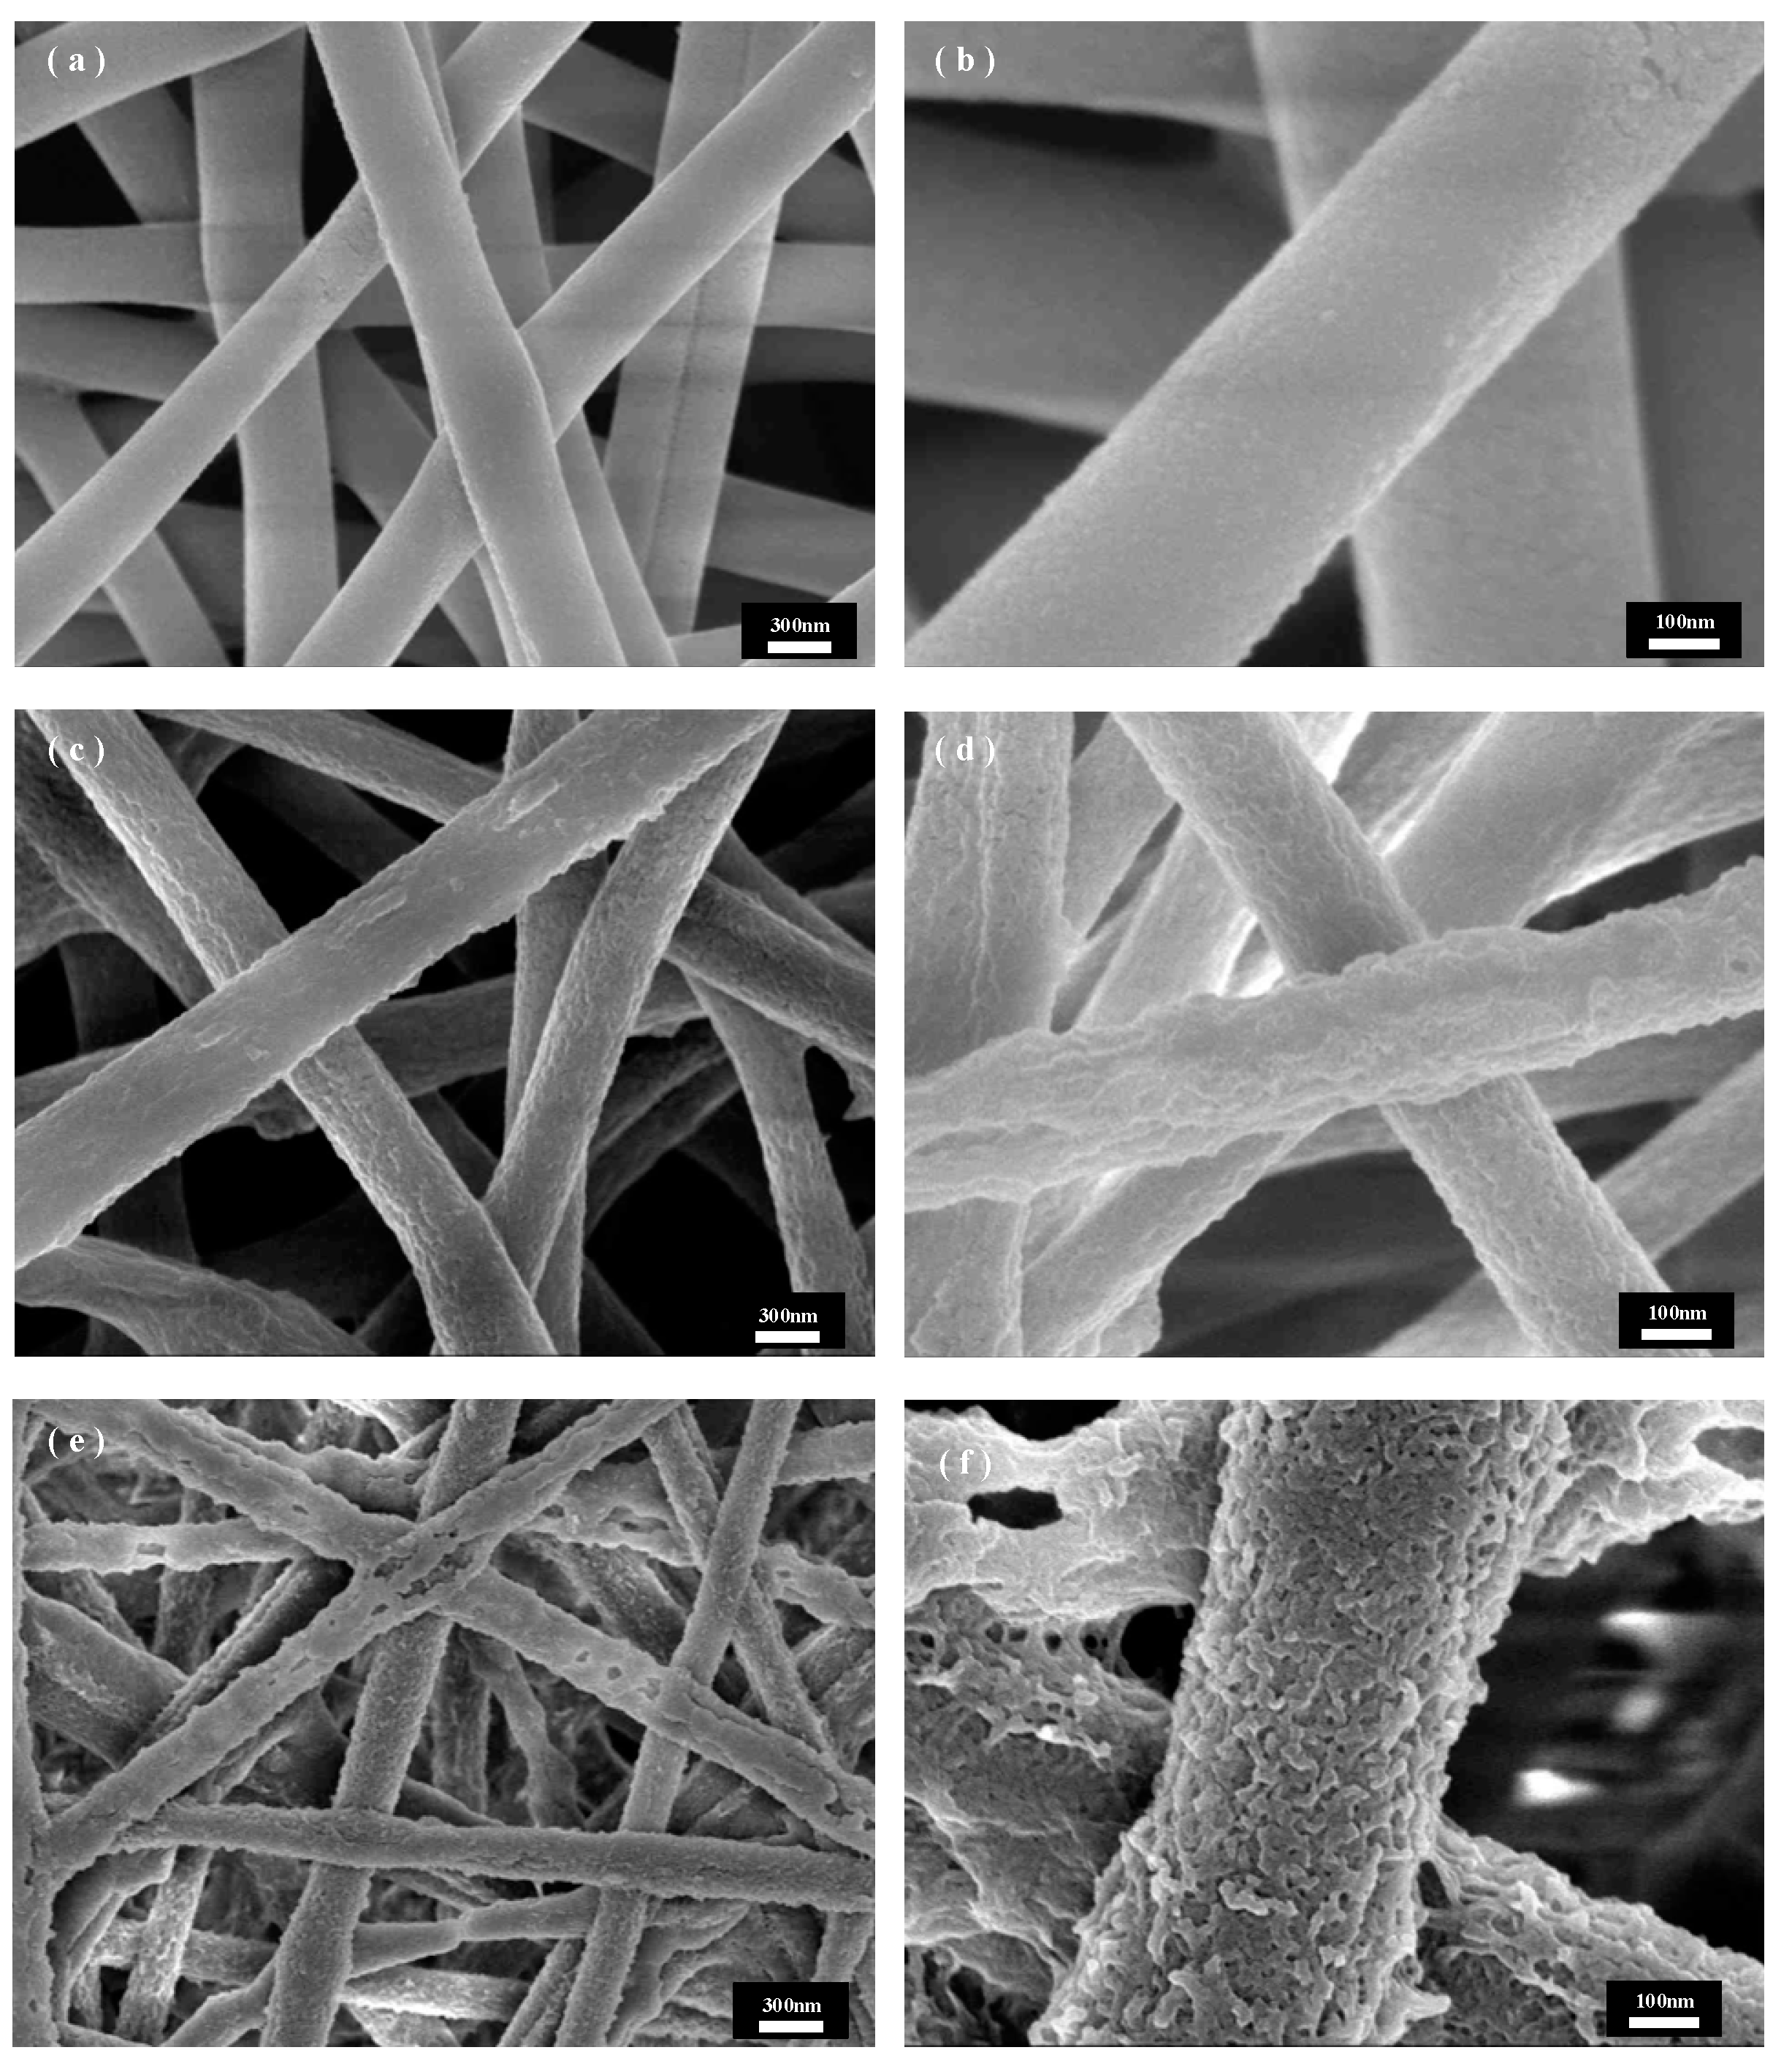
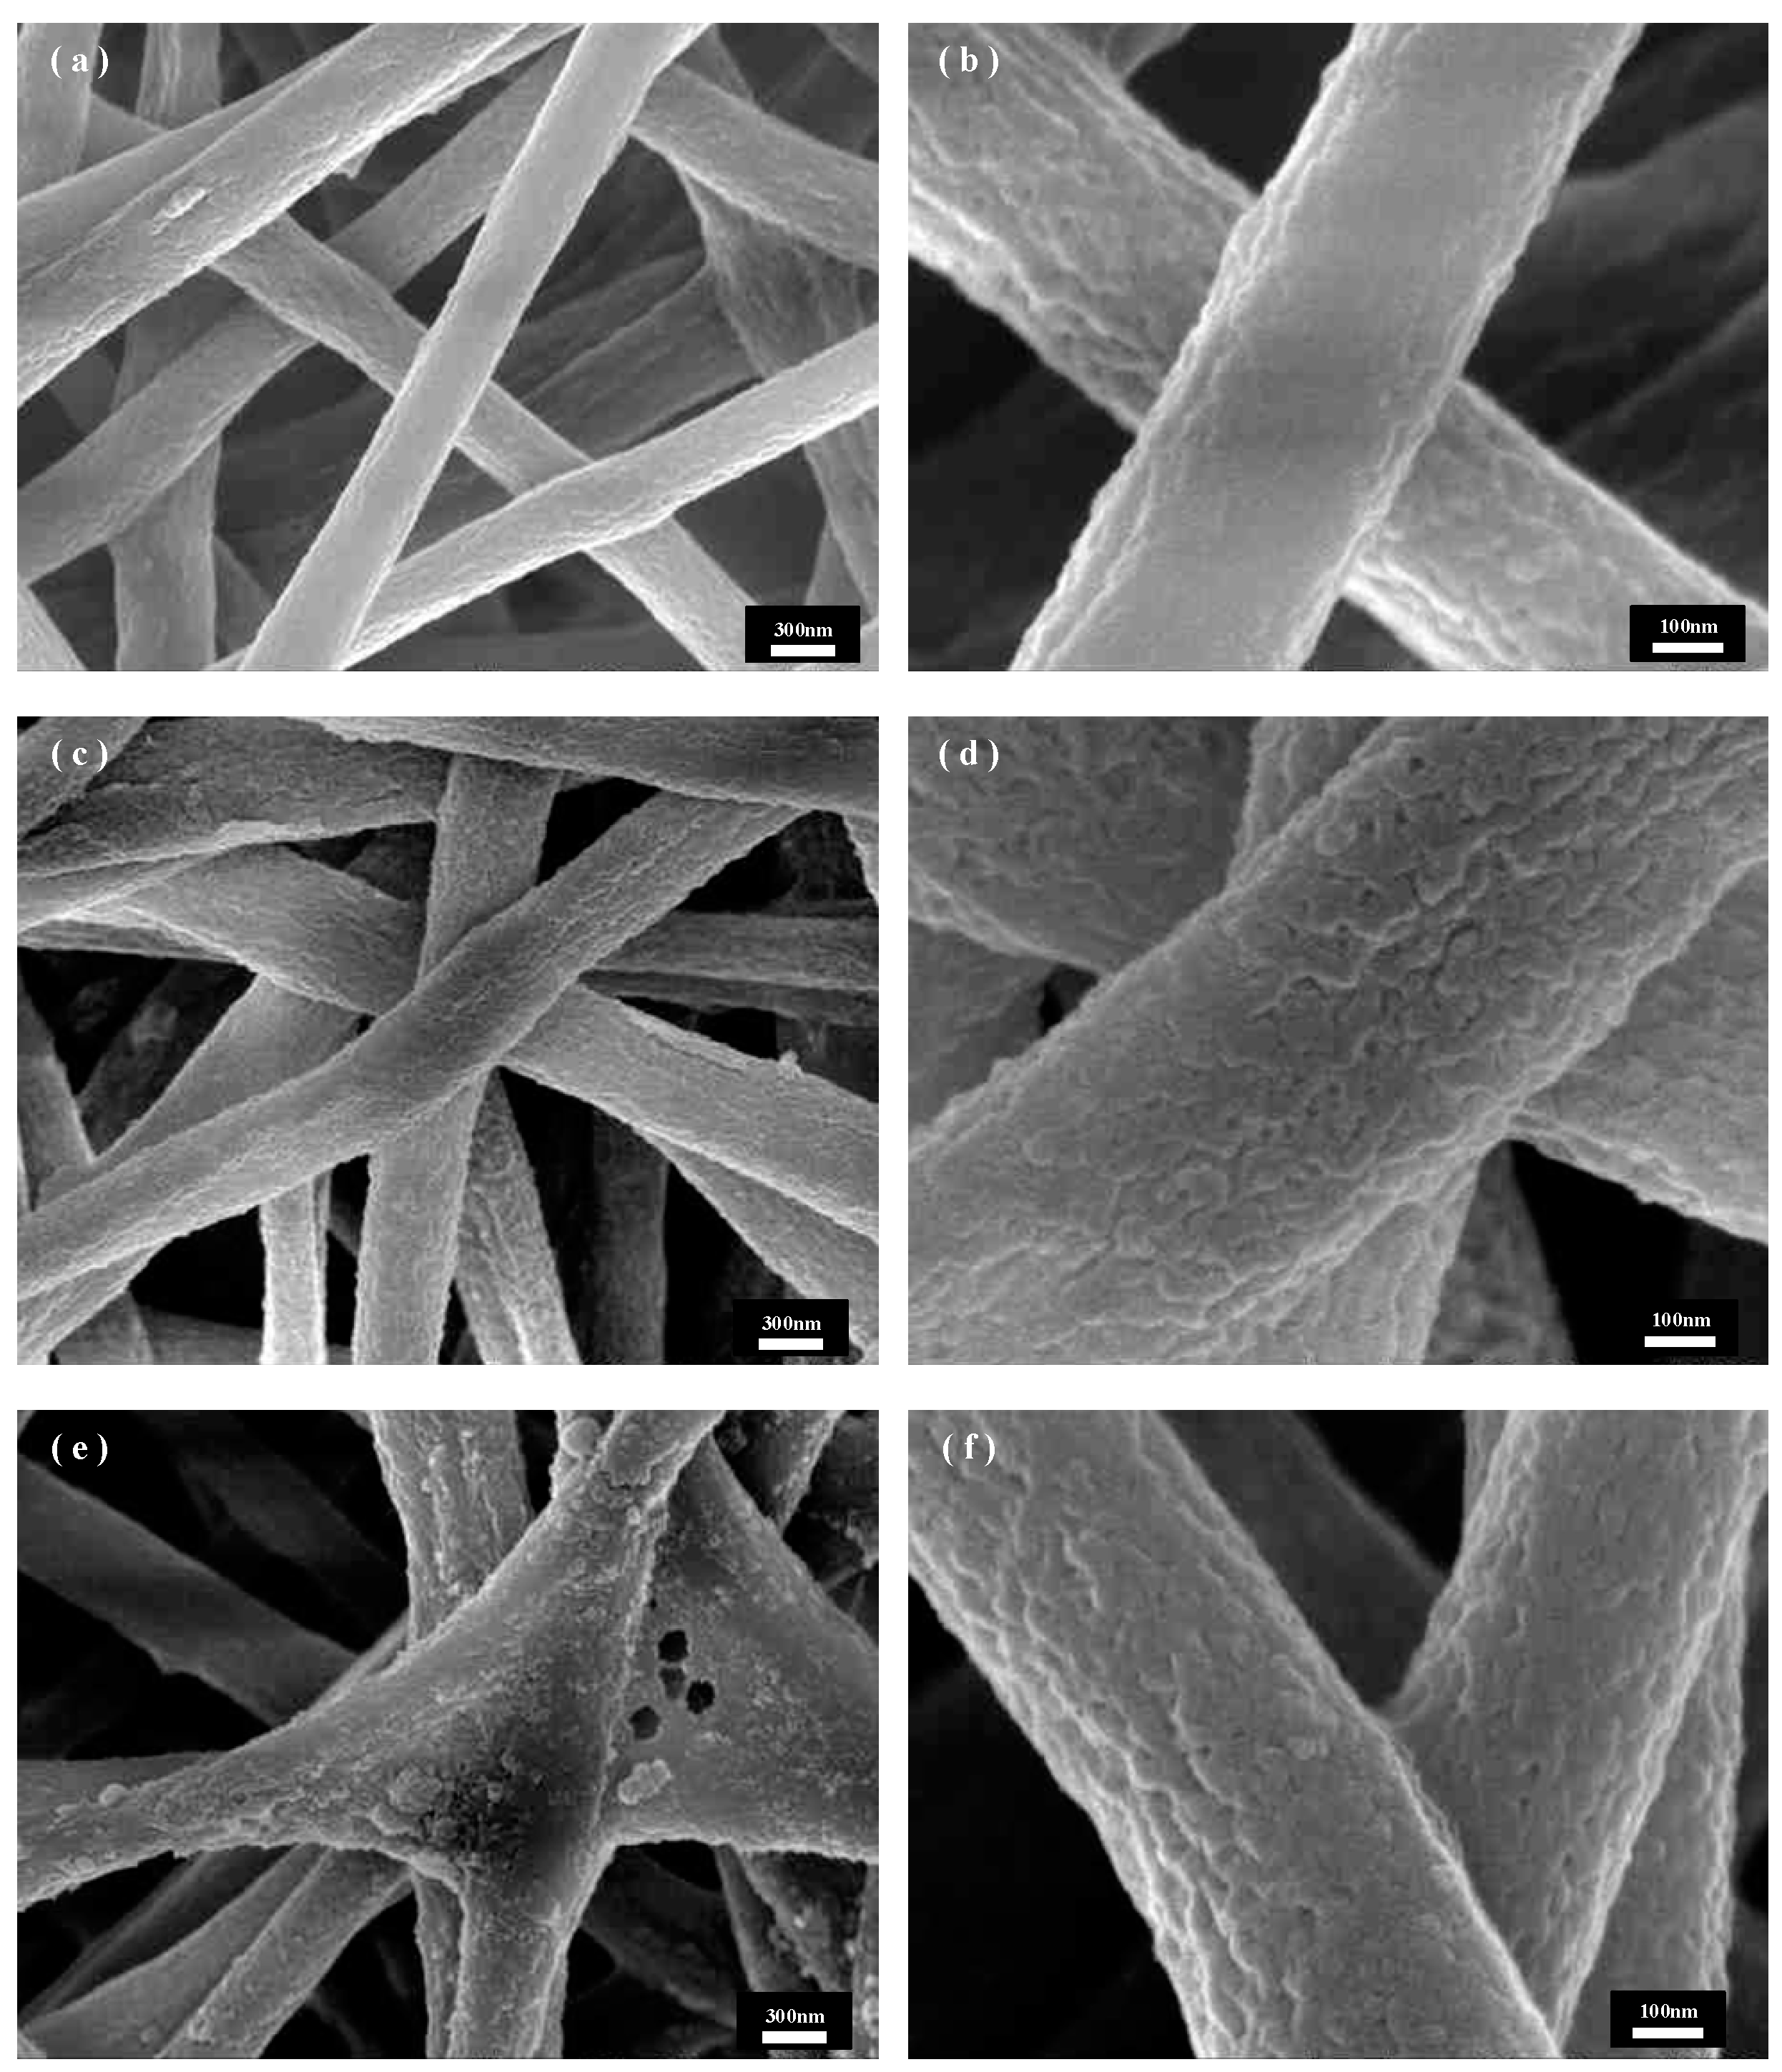
Figure 5 shows SEM images of PET@CuBTC composite fiber membranes under different growth cycles of PET fiber membranes, where CuBTC is produced by bonding Cu2+ with three -COOH groups above the ligand BTC to produce a regularly arranged metal–organic skeleton. During the layer-by-layer growth of CuBTC on the surface of PET fibers, the Cu2+ is bonded with the -COOH groups at the ends of the PET molecular chains first, followed by a further increase in the size of the skeleton in subsequent cycles. COOH is followed by a layer-by-layer bonding arrangement of Cu2+ with the ligand in subsequent cycling cycles, and the skeleton size is further increased. Figure 5a shows that the CuBTC crystals grow more uniformly in size on the fiber surface at three cycles, but there are still many vacancies on the fiber surface where the crystal layer does not grow. The size of the skeleton gradually increases as the growth cycle increases. Figure 5b shows that in five cycles, when the crystal growth is uniform, the PET fiber surface is covered by the crystal layer, the skeleton size is moderate, and the PET fiber size is more compatible, and the overall fiber morphology is maintained. In Figure 5b, when increased to seven cycles, the skeleton size increases, the skeletons stack on top of each other to grow, the fiber gap is gradually filled by the skeleton, and the crystal size does not match the size of the fiber, resulting in the composite fiber stacking being too dense. Figure 5b shows that when the growth cycle is further increased to nine cycles, the skeleton size is too large and extremely mismatched with the fiber size. The PET fiber substrate was exposed to only a small amount of crystal growth embedded between the fibers, which may be due to the gradual growth of the skeleton on different fibers into one, where the chemical bond between PET and CuBTC could not withstand the shear force generated by its gravity and the relative motion between the fibers, which resulted in the shedding of the skeleton and the exposure of part of the fiber surface. In summary, for the in situ growth of CuBTC on PET fibers in this study, the CuBTC@PET composite fibers under the five-cycle condition have excellent surface morphology.
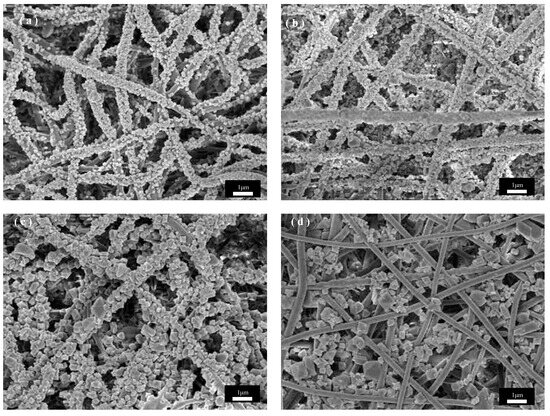
Figure 5.
SEM images of CuBTC@PET composite fibers under different growth cycles: (a) three cycles, (b) five cycles, (c) seven cycles, (d) nine cycles.
Figure 6 shows the SEM images of the unswollen recrystallized PET fibers under the same in situ growth parameters. As can be seen from Figure 6a, the CuBTC crystals are unevenly distributed and small in size under the three-cycle condition, which is because the anchoring of Cu2+ to the PET substrate determines the subsequent growth of CuBTC, and thus the contact area of the fiber with the solution determines the growth density of CuBTC. Without recrystallization, the fibers have a smaller specific surface area, providing fewer binding sites for Cu2+, and the binding of Cu2+ to PET is relatively poor, so there is not enough Cu2+ and ligand to achieve a larger distribution of more homogeneous CuBTC crystals for nucleation. By observing Figure 6b,c, it can be seen that the crystal size further increases as the growth period increases to five and then seven cycles, and the size distribution becomes non-uniform compared to that under the same period in Figure 5. This is because CuBTC crystals have different nucleation rates, and in different cycles, some fresher nuclei are formed on the fiber surface in the subsequent cycles due to the uneven and insufficient bonding of Cu2+ to the PET surface in the previous cycles, so different sizes of CuBTC particles grow, resulting in an uneven coating after the first five cycles, and the trend with the increase in the number of cycles becomes more and more obvious. Observation of Figure 6d shows that when the cycle number is increased to seven cycles, the gap in the crystal size distribution on the fiber surface is further increased, which may be attributed to the fact that, in the previous cycle number, due to the non-uniform distribution of CuBTC crystals, fewer nuclei are formed. Compared with the recrystallized CuBTC@PET fibers, the crystal growth in the cycling solution is faster, which leads to the shedding of oversized occurrences and the formation of new crystal nuclei in the subsequent cycles. In summary, the in situ growth of CuBTC crystals from PET fibers treated with solution recrystallization was more uniform, with narrower size distribution, better fiber surface morphology, and easier control of crystal size morphology.
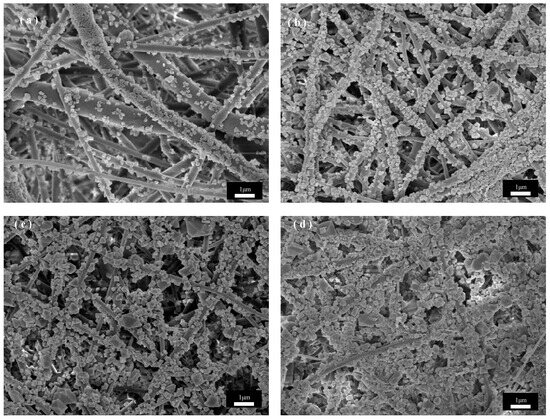
Figure 6.
SEM images of CuBTC@PET composite fibers without recrystallization post-treatment at different growth cycles: (a) three cycles, (b) five cycles, (c) seven cycles, (d) nine cycles.
3.2. CuBTC@PET Characterization Analysis
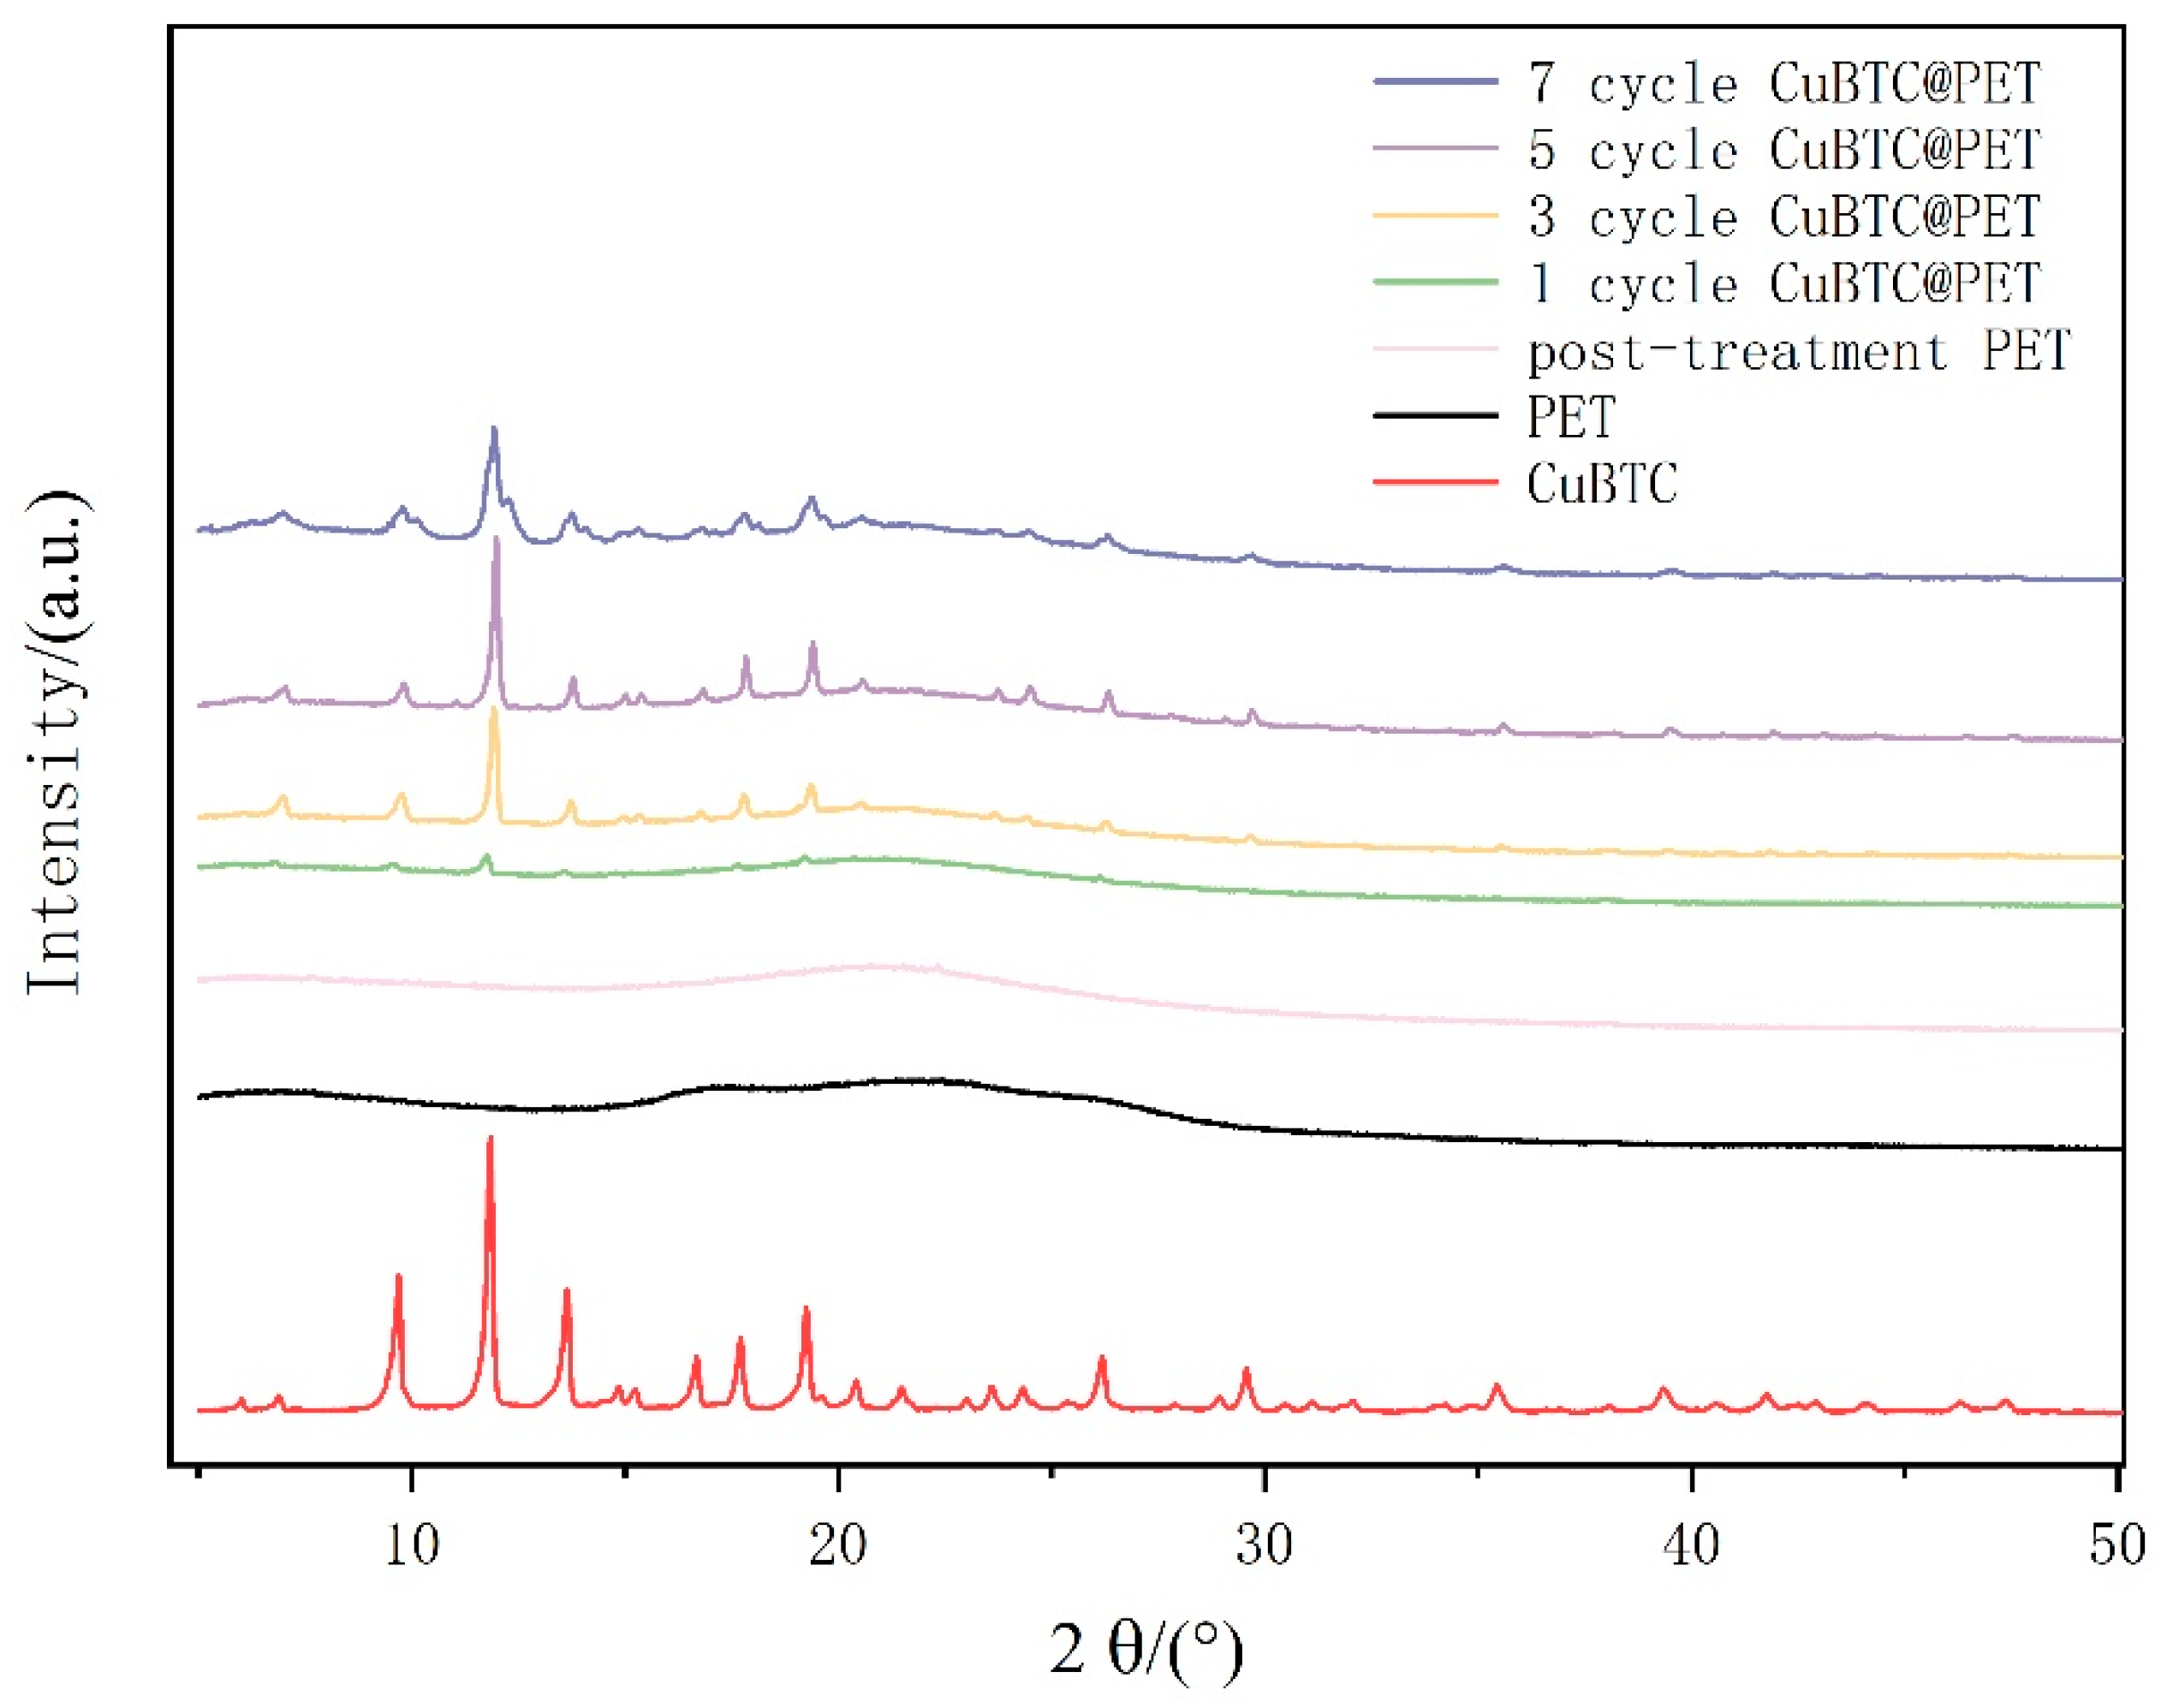
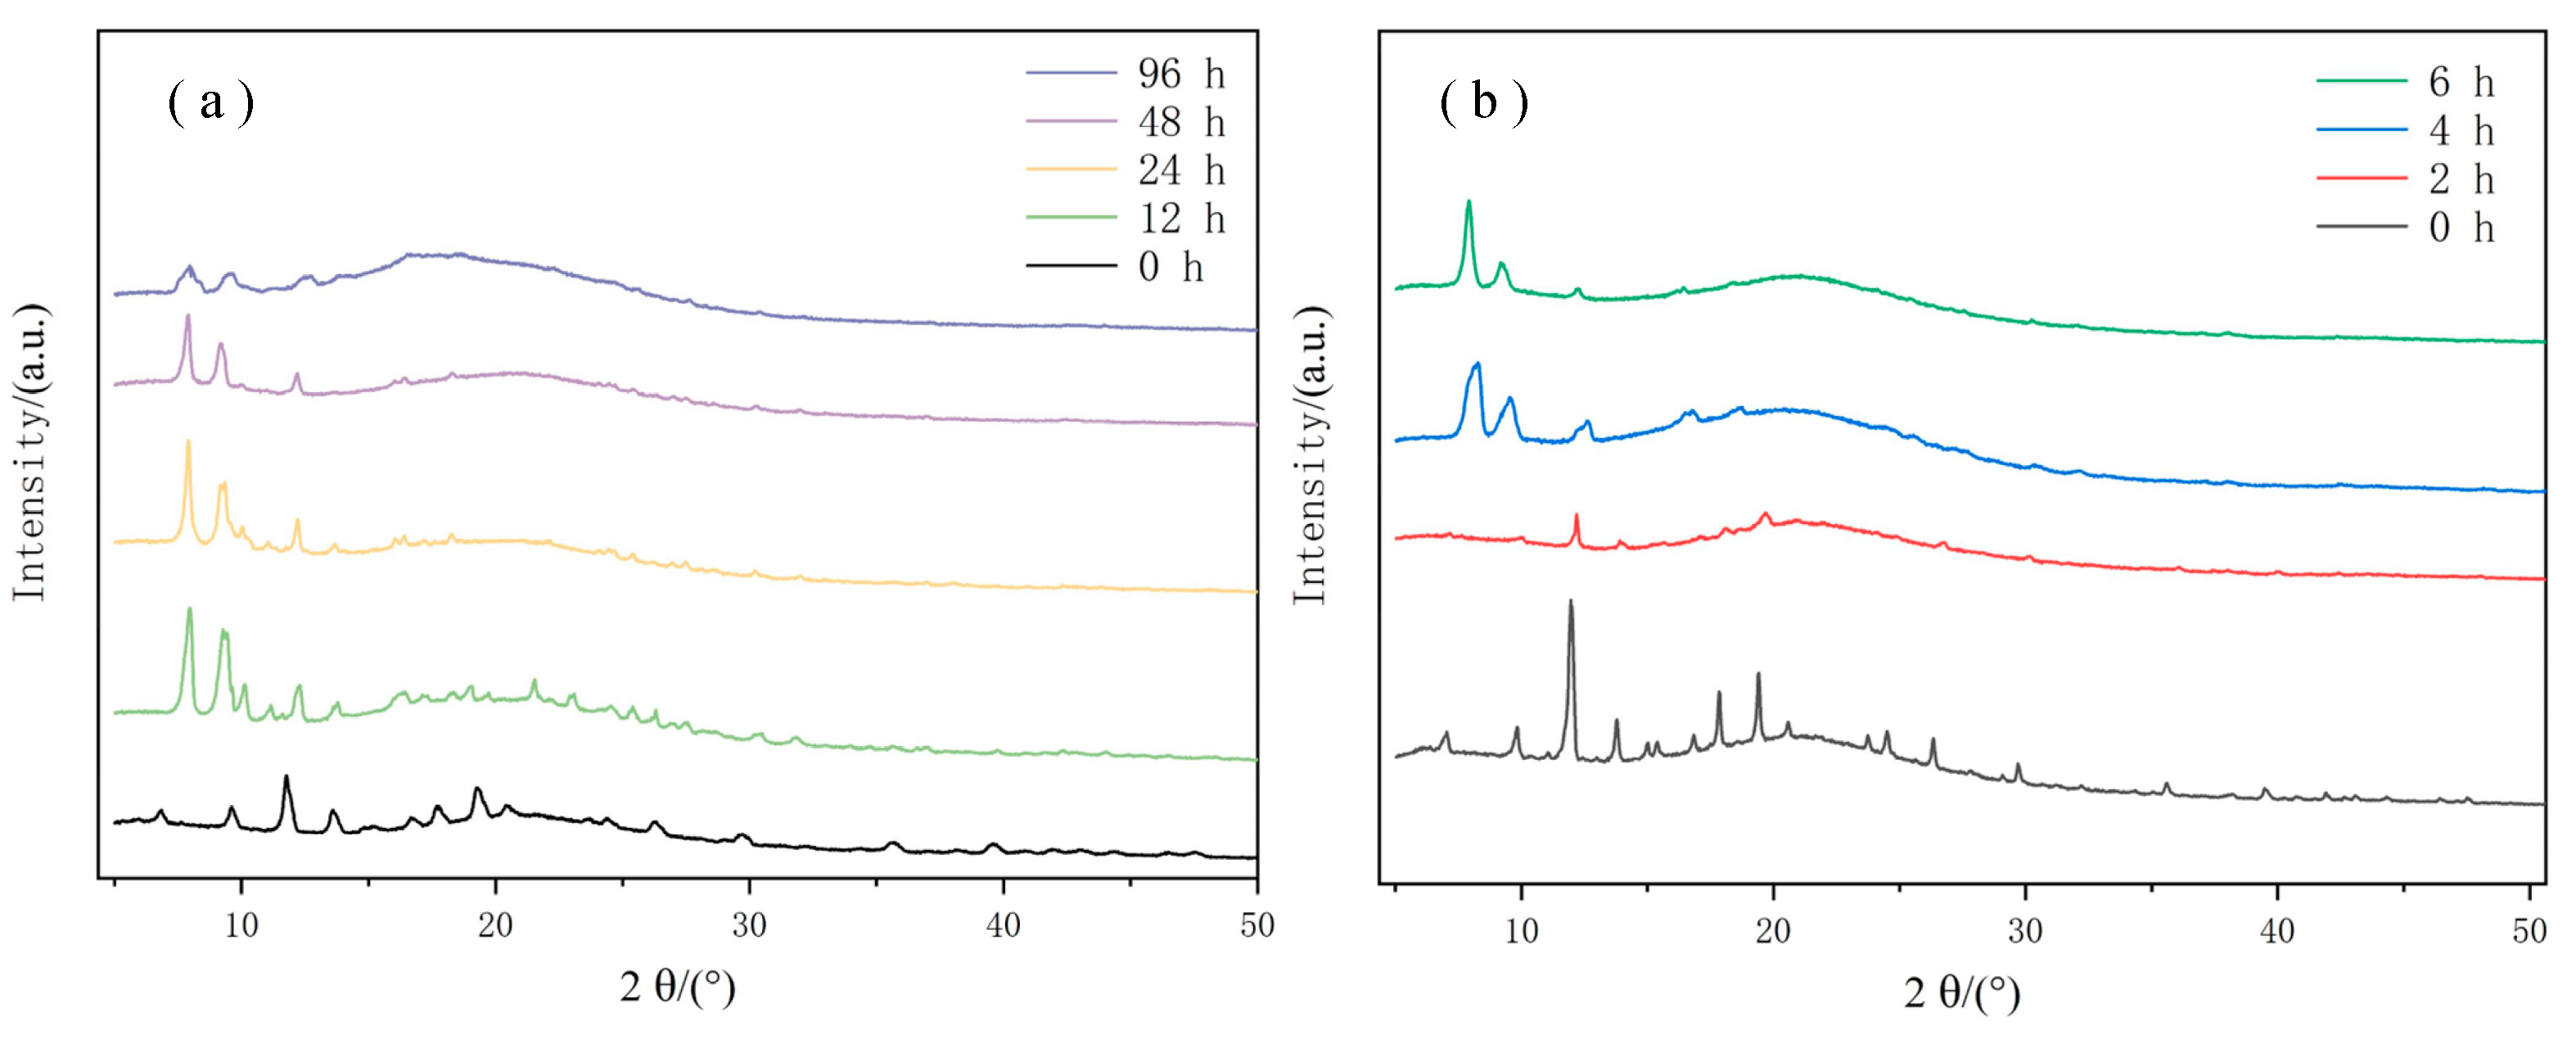
Figure 7 shows the XRD patterns of each fiber membrane specimen by X-ray diffraction, which is a common method to confirm the crystal structure of MOFs. Comparing the XRD patterns of PET fibers before and after swelling and recrystallization, the PET fibers after swelling are smoother compared with the original PET fibers, indicating that swelling makes the PET molecular chains less crystalline. It can be proven that the swelling and recrystallization treatment can provide carboxymethyl binding sites for Cu2+ and improve the density of CuBTC crystal growth due to the uniformity. PET@CuBTC composite fibers were found to be in the range of 2θ = 6.61°, 9.42°, 11.50°, 13.30°, 14.55°, 14.90°, 16.35°, and 17.36°, compared with PET fibers with 2θ = 18.90°, 20.10°, 24.01°, 25.83°, 29.20°, 35.13°, and 39.09°. They also showed new diffraction peaks, which corresponded to the CuBTC characteristic peaks [34], which preliminarily proved the in situ growth of CuBTC on the PET surface. Comparing the XRD patterns of different growth cycles, it can be seen that the intensity of the characteristic peaks of CuBTC increases with the growth cycle, and its diffraction peaks are strong, sharp, and symmetric at five cycles, crystallizing complete crystals with larger grains and more regular internal plasmonic arrangement, which proves that the degree of crystallinity is high under the cyclic conditions and the grains are larger, with more regular internal plasmonic arrangement. When the growth cycle reaches seven cycles, CuBTC diffraction peaks show a tendency to broaden, which may be due to the further growth of the crystal. The size increases, and the skeletons at different growth points squeeze each other, which affects the continuation of the crystallization process of CuBTC or leads to the growth of different crystals merging and the irregular arrangement of the internal plasmodesmata.
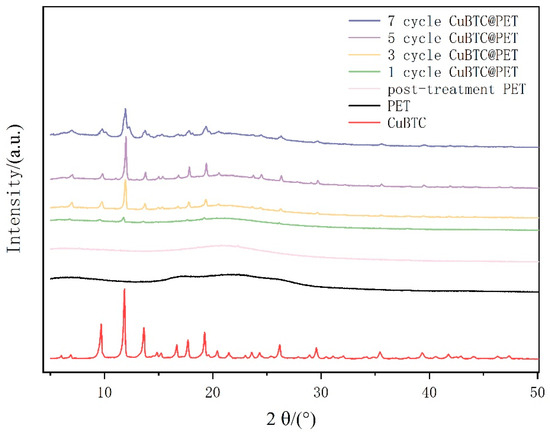
Figure 7.
XRD patterns of different fiber membranes.
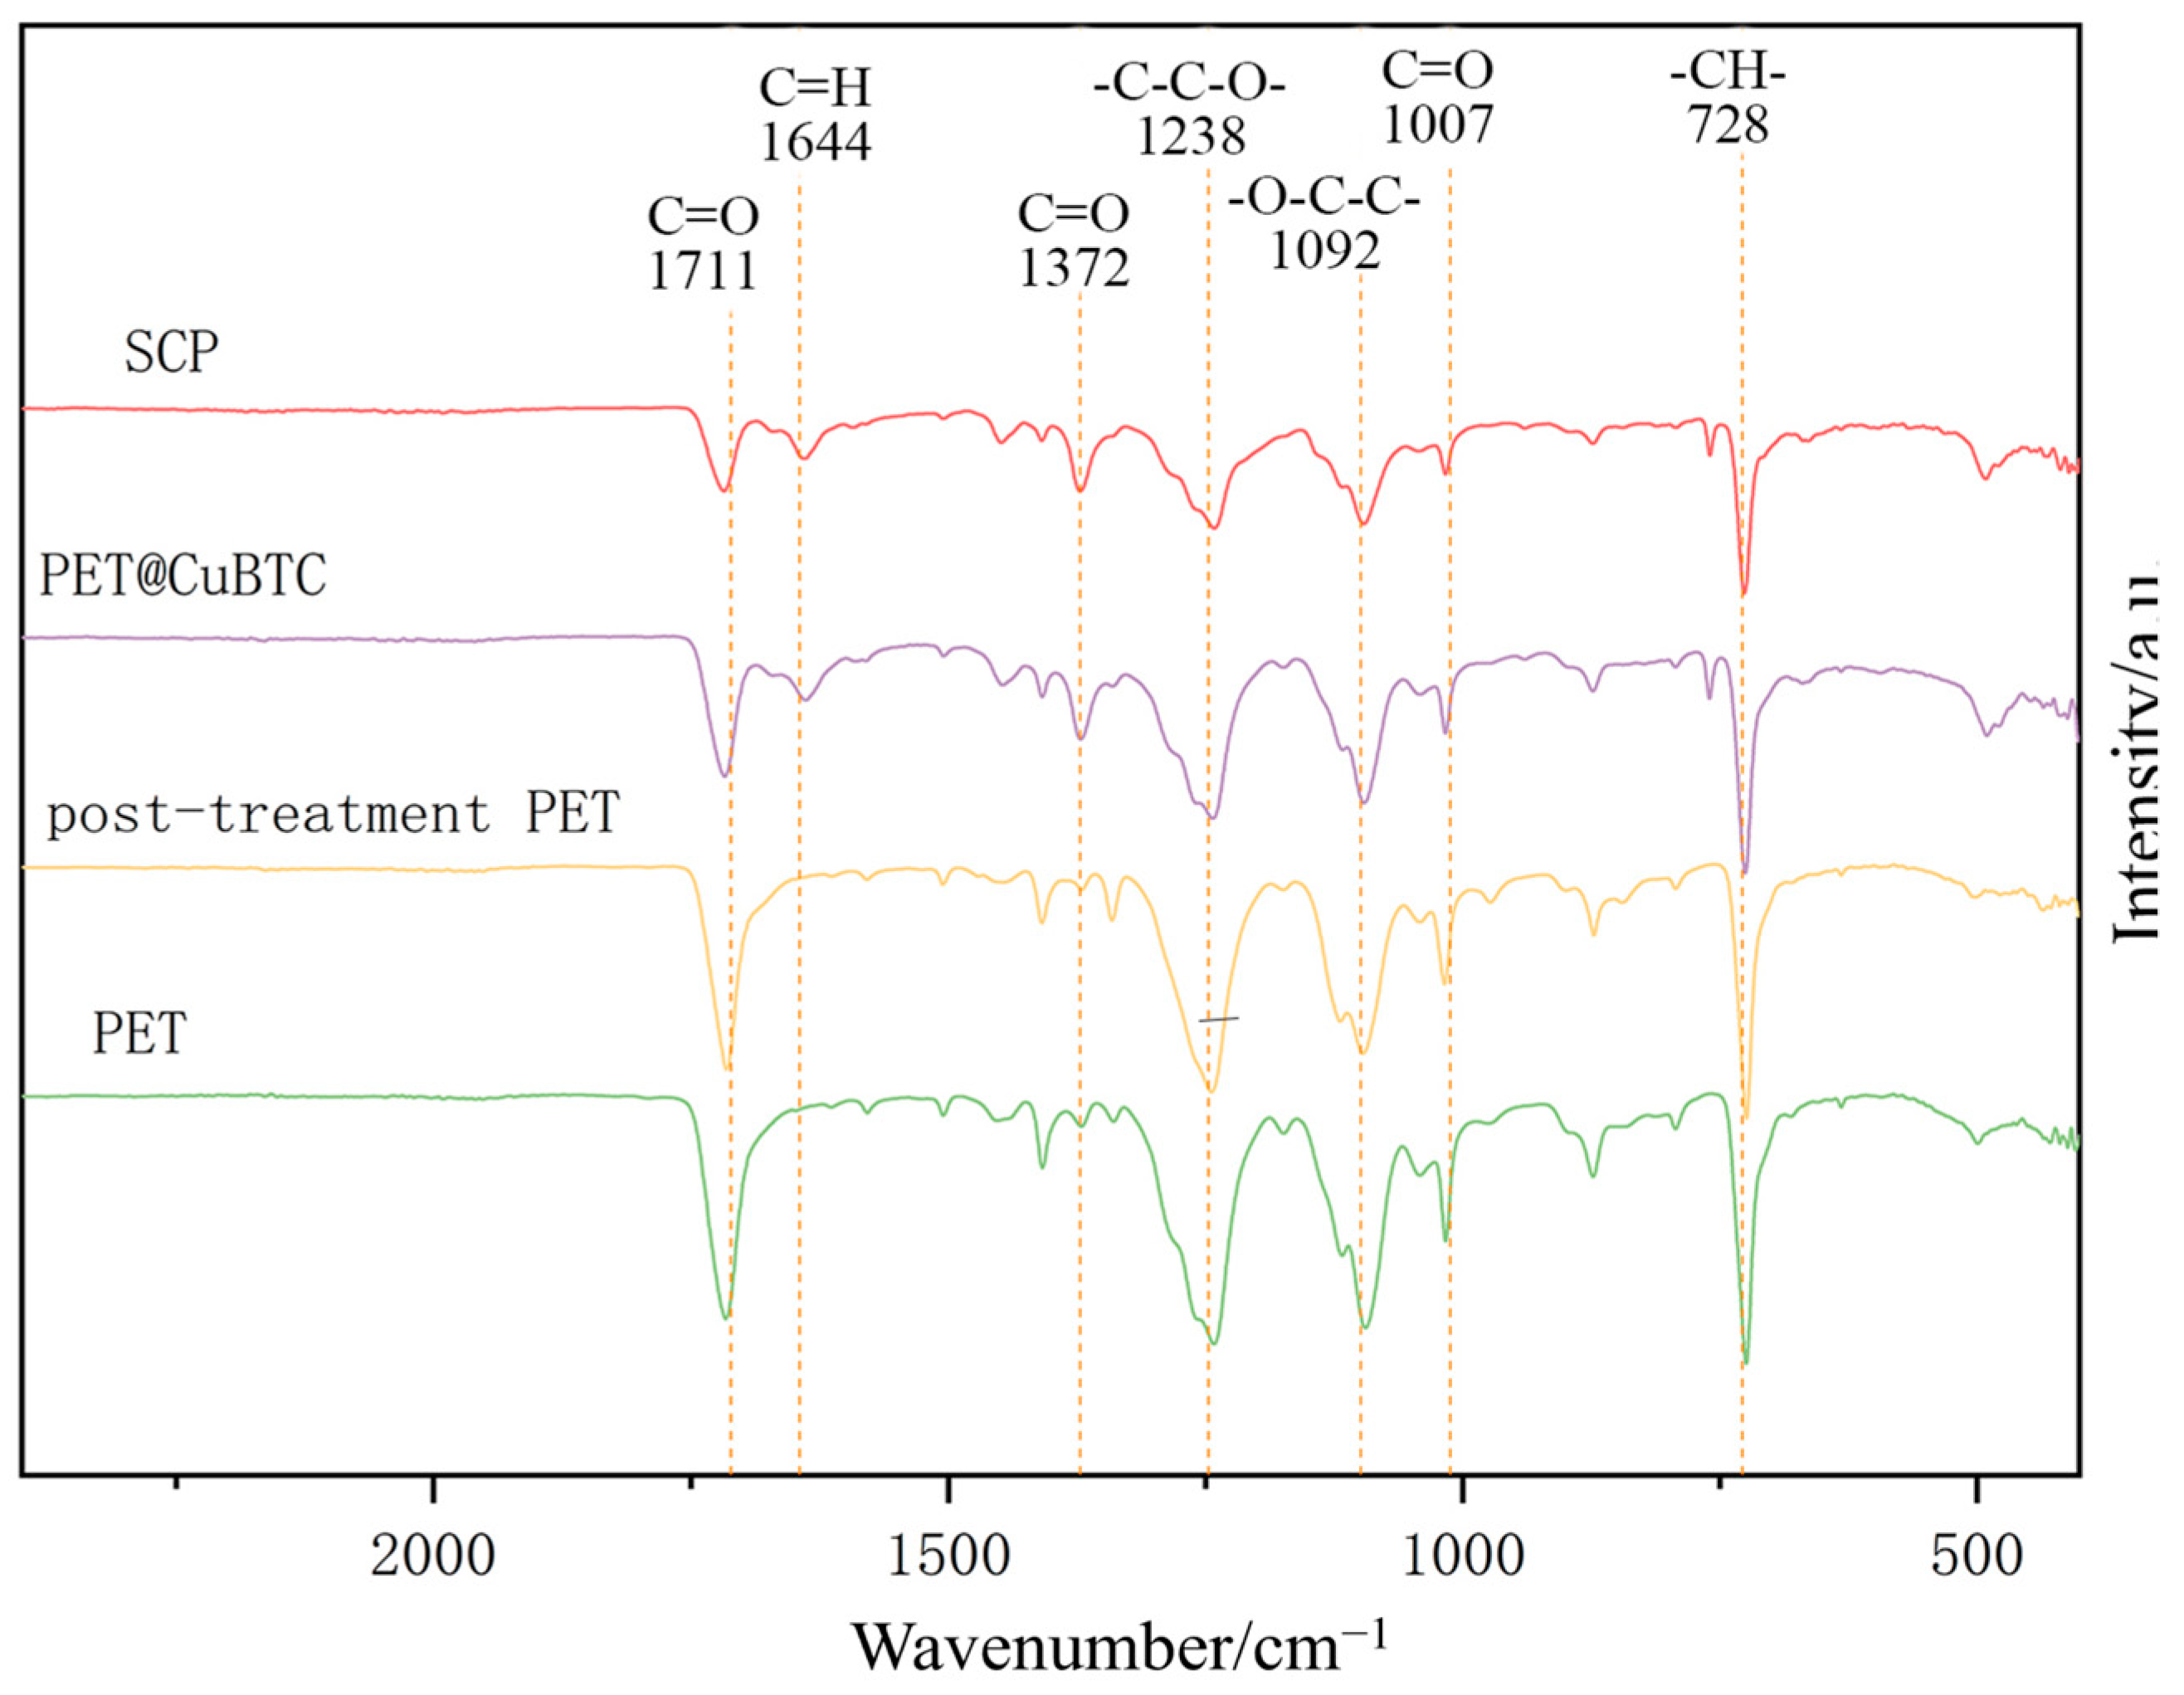
The FTIR profiles of the fiber membranes at different treatment stages are shown in Figure 8, where PET functional groups can be determined by specific peaks, such as terephthalate C=O at 1711 cm−1; asymmetric vibrational -C-C-O- at 1238 cm−1; stretching vibrational -O-C-C- at 1092 cm−1; and -CH- at 728 cm−1 [44]. By comparing the absorption peaks before and after post-treatment, it can be determined that there is no NMP residue in the fiber, and the PET molecular chain structure is maintained. The coordination of the ligand BTC and Cu2+ in CuBTC can be determined by the following peaks: COO- asymmetric vibration at 1644 cm−1; COO- symmetric vibration at 1372 cm−1; and -CH- aromatic out-of-plane vibration at 728 cm−1. It can be initially determined that the functional structure of CuBTC has appeared in PET@CuBTC fibers, Cu2+ is bonded to PET fibers mainly through the carboxyl group at both ends of the PET molecular chain, the intensity of the absorption peaks is weakened with the observation of the C=O stretching vibration at 1007 cm−1 and 1711 cm−1, and the C=O bonding is weakened with the growth of CuBTC occupying the -COOH group at the ends of the PET molecular chain. The intensity of the absorption peak is weakened, and it can be determined that the Cu2+ is attached to the PET by bonding. Comparing the PET@CuBTC fibers before and after hydrophobic modification, the FTIR spectra of PET@CuBTC fibers were unchanged, and it can be determined that the POTS hydrophobically modified coating did not change the functional group structure of PET and CuBTC.
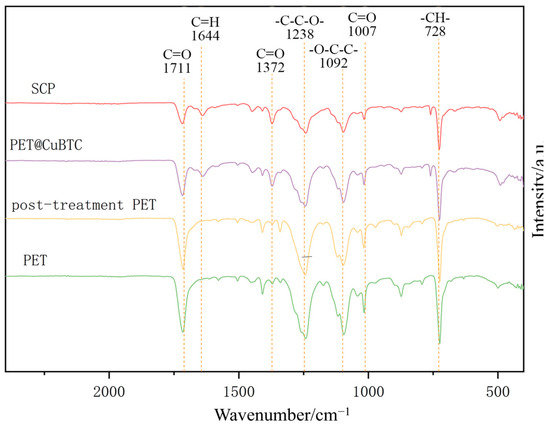
Figure 8.
FTIR patterns of different fiber membranes.
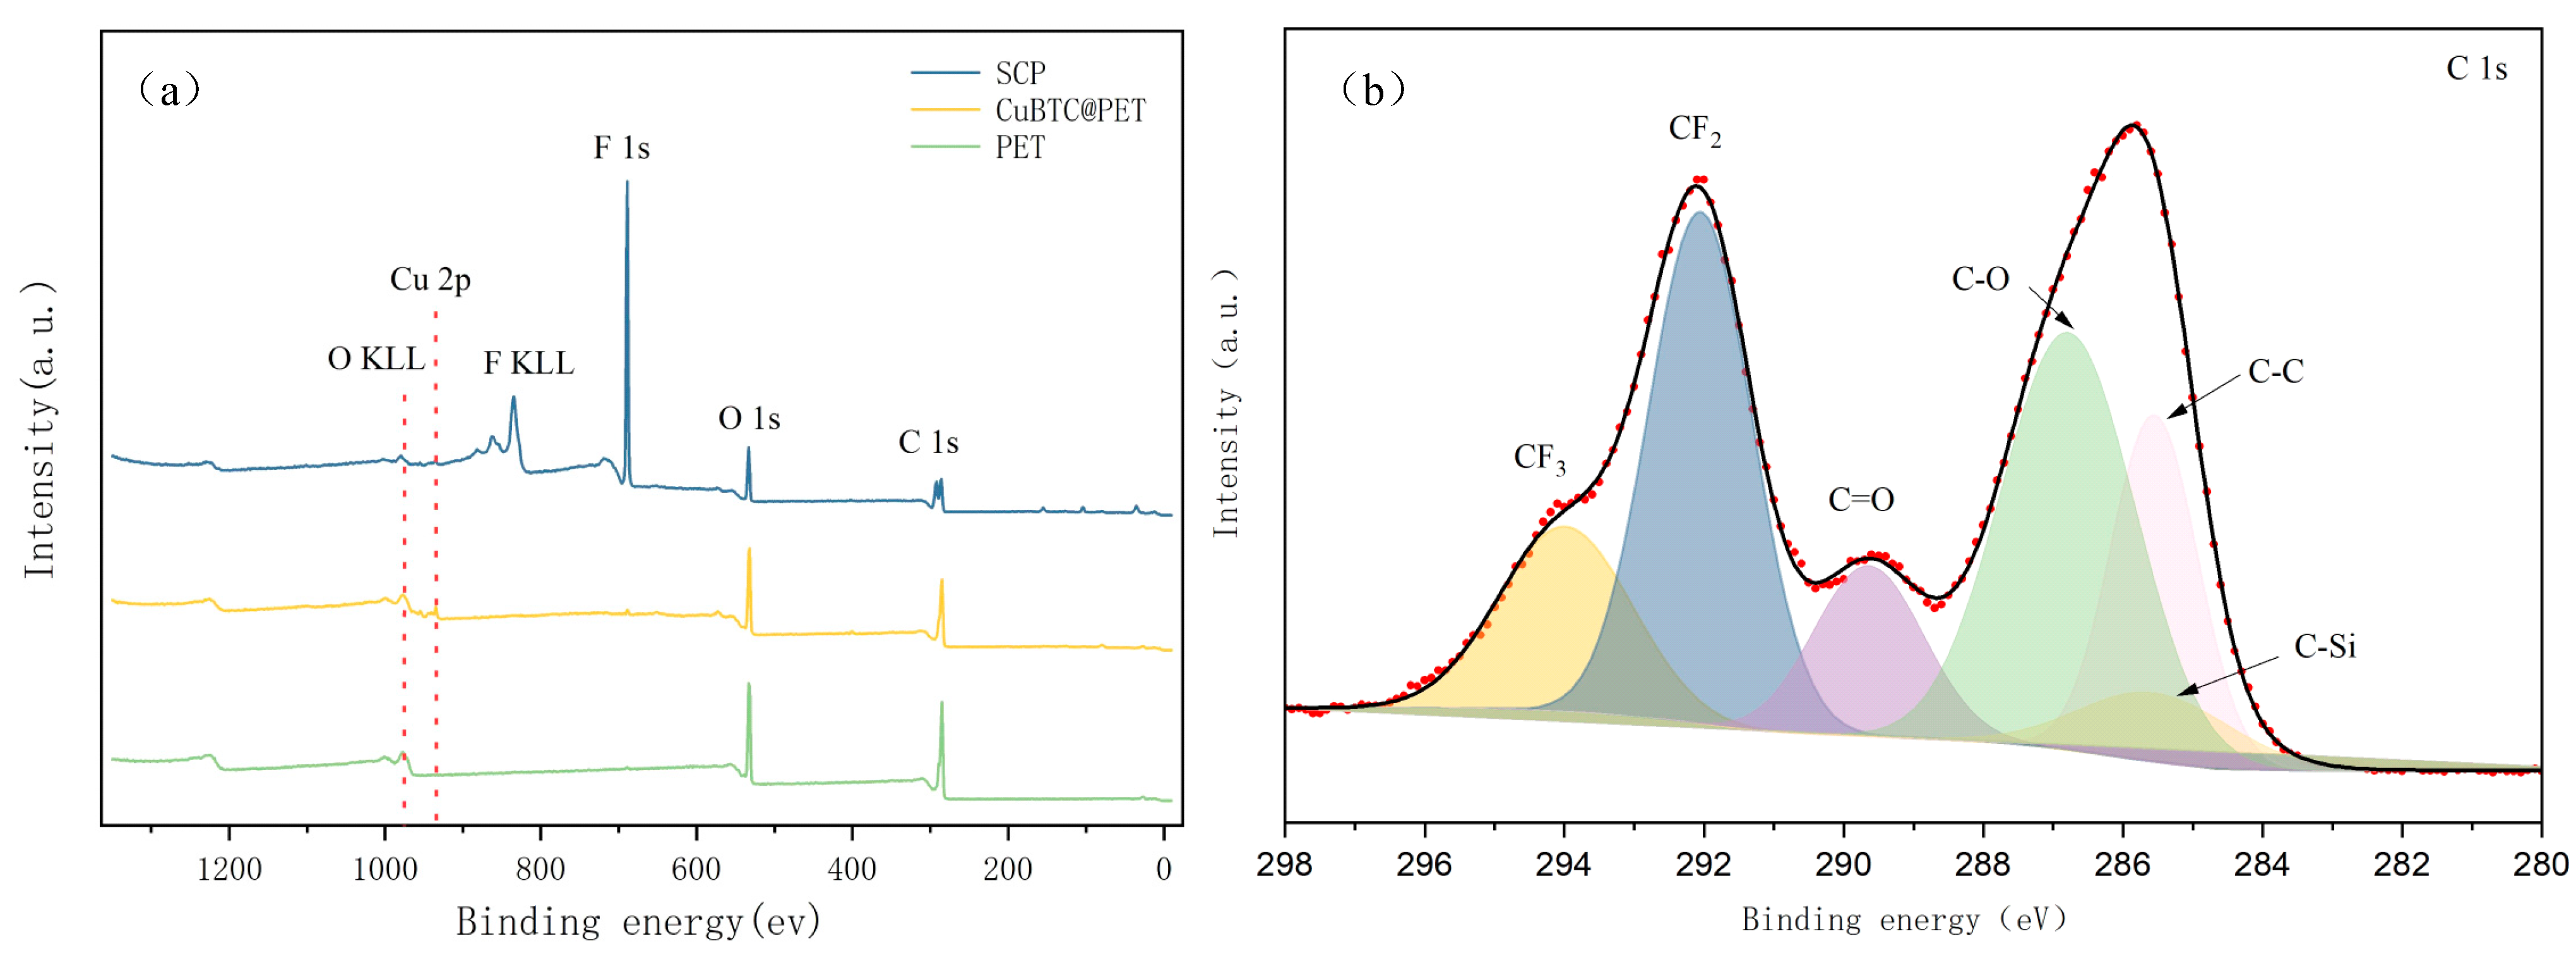
The XPS results for CuBTC@PET composite fiber membranes at different treatment stages are shown in Figure 9, and Cu 2p, F 1s, O 1s, C 1s, F KLL, and O KLL peaks appeared in the XPS spectra of POTS-PET. This was attributed to the in situ growth of CuBTC bonded to POTS. To further confirm the chemical structure of SCP, peak splitting was fitted to the C 1s narrow spectrum. As shown in Figure 9, the spectra of C 1s fitted to six peaks appearing at 294.1 eV, 291.8 eV, 285.3 eV, 282.1 eV, 289.4 eV, and 286.3 eV, which is attributed to the combination of POTS with CF3, CF2, CC, C-Si, C=O, and C in CuBTC. -O. From the above, it can be demonstrated that the low-surface-energy material POTS has successfully formed a hydrophobic coating layer by immersion.
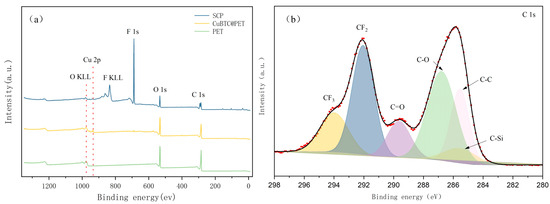
Figure 9.
(a) XPS spectra of different fiber membranes, (b) C 1s spectra of SCP.
3.2.1. Superhydrophobic CuBTC@PET Water Stability Analysis
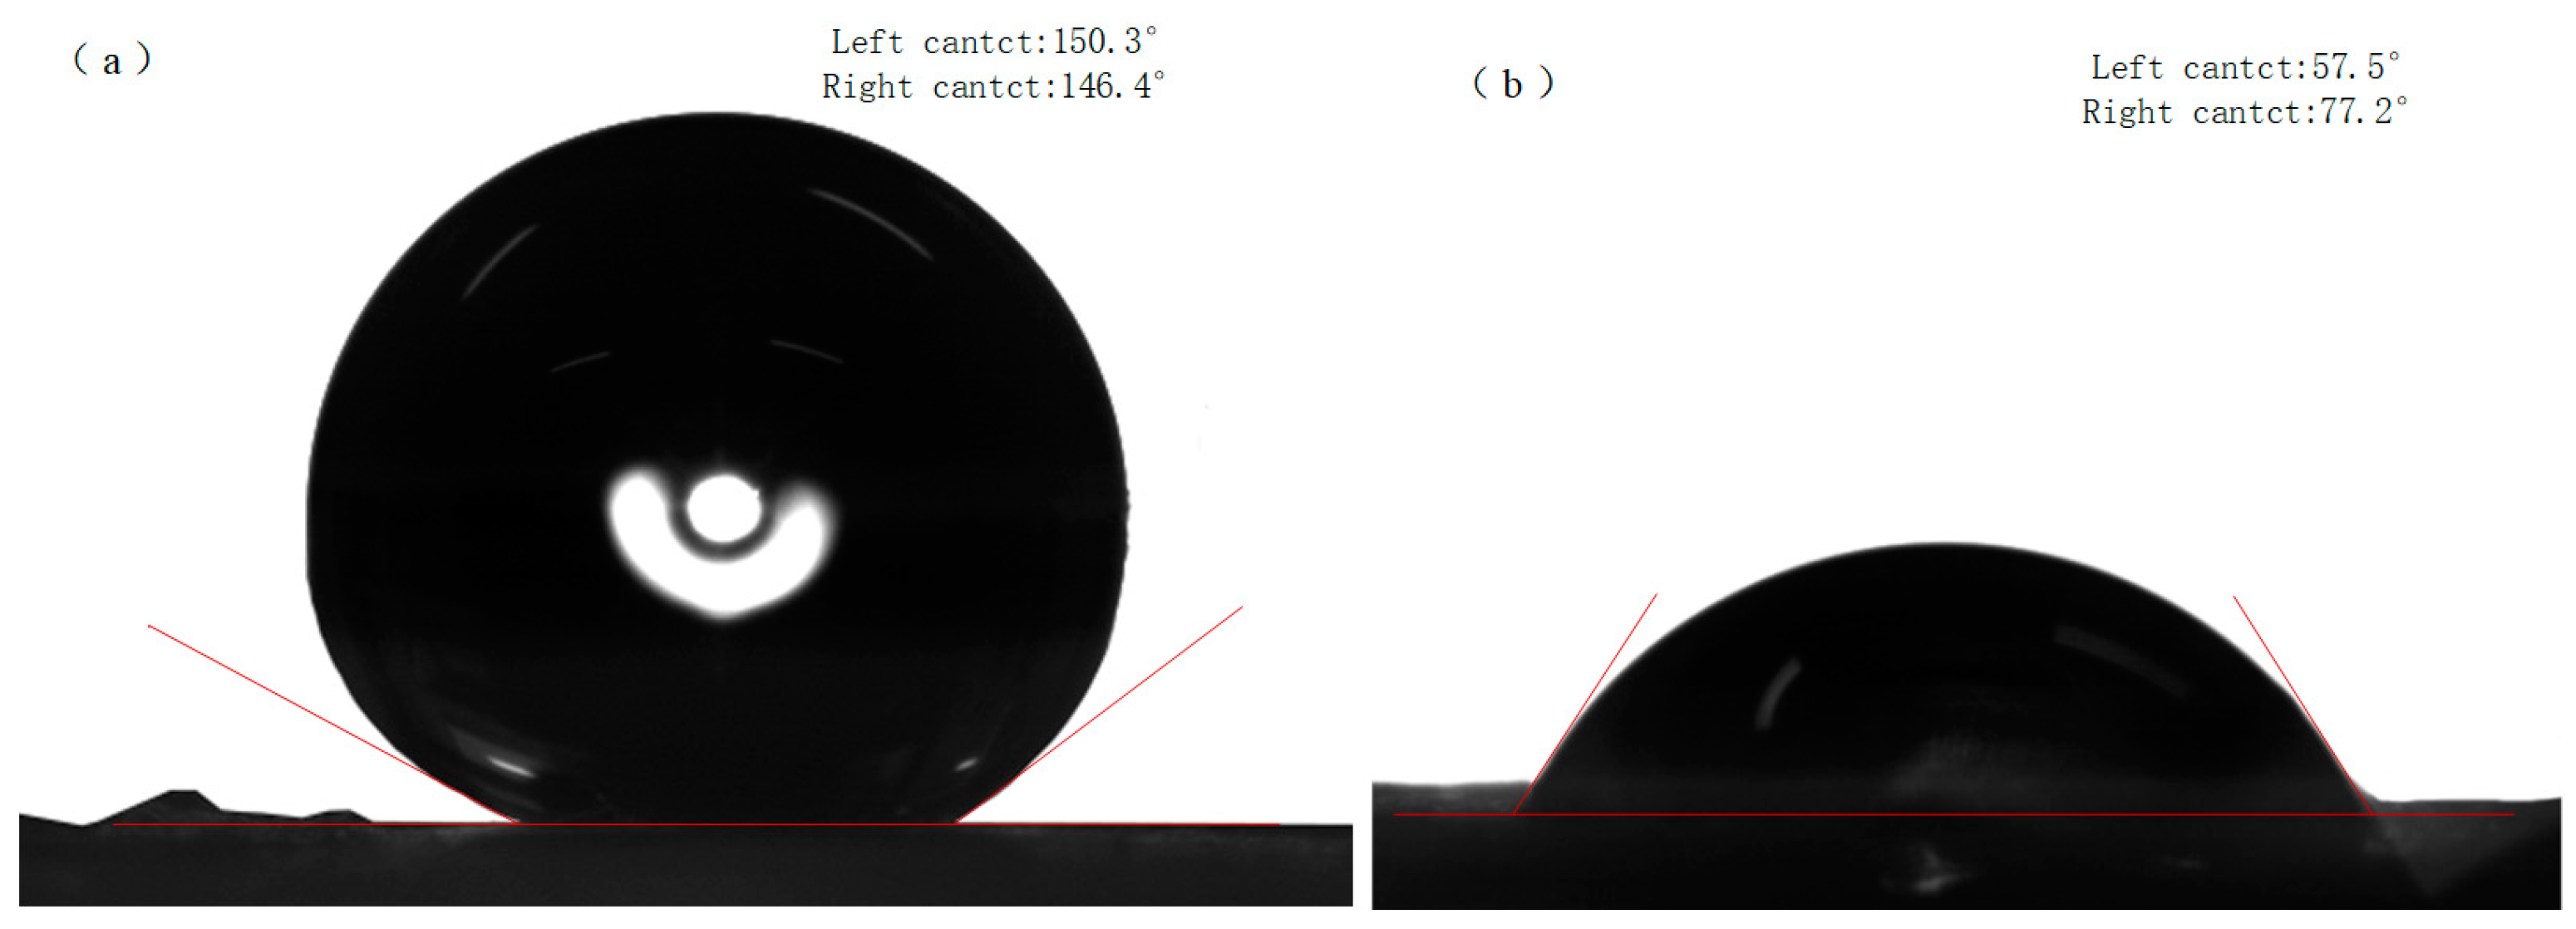
Figure 10b shows the CuBTC@PET water contact angle of 77.2°. When the water droplets stayed on the composite fibers for one minute, it was observed that the water was gradually absorbed by the CuBTC@PET composite fibers. This phenomenon may be attributed to the porous structure of CuBTC, which promotes the absorption of water molecules. Figure 10a shows that the hydrophobicity of SCP is significantly improved, and the water contact angle reaches 146.4°. The water droplets remained intact off the fiber surface after one minute, and no water absorption by CuBTC was observed.
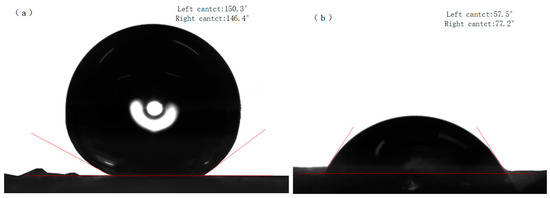
Figure 10.
Water contact angles: (a) SCP, (b) CuBTC@PET.
Figure 11 shows the XRD spectrum before and after hydrophobic modification at different immersion times. Through Figure 11a, it can be seen that the initial CuBTC@PET fiber membrane has diffraction peaks at 2θ = 6.61°, 9.42°, 11.50°, 13.30°, 14.55°, 14.90°, 16.35°, 17.36°, 18.90°, 20.10°, 24.01°, 25.83°, 29.20°, 35.13°, and 39.09°, which correspond to the characteristic peaks of CuBTC [34], and the characteristic peaks appeared at 2θ = 7.82° and 9.04° with the increase in immersion time, which may be the low-angle diffraction characteristics of the large-size pore structure of Cu-based MOFs [45]; the characteristic peaks at 2θ = 7.82° and 9.04° also tend to disappear when the immersion time was further increased up to 6 h. The characteristic peaks at 2θ = 7.82° and 9.04° also tend to disappear. It can be proven that the crystal structure of MOFs is completely decomposed after 6 h of immersion. Figure 11b shows the XRD patterns of the hydrophobically modified composite fiber membranes soaked for different times, and it can be seen that the composite fibers after hydrophobic modification by POTS still retained the characteristic peaks of the crystal structure of CuBTC after soaking for 24 h. After 96 h of immersion, the characteristic peaks at 2θ = 7.82° and 9.04° showed a trend of broadening, which may be due to the hydrolysis of CuBTC crystals, resulting in the non-uniformity of the crystal microstructure and grain size.

Figure 11.
XRD spectrum at different immersion times; (a) SCP, (b) CuBTC@PET.
3.2.2. CuBTC@PET Thermal Stability Analysis
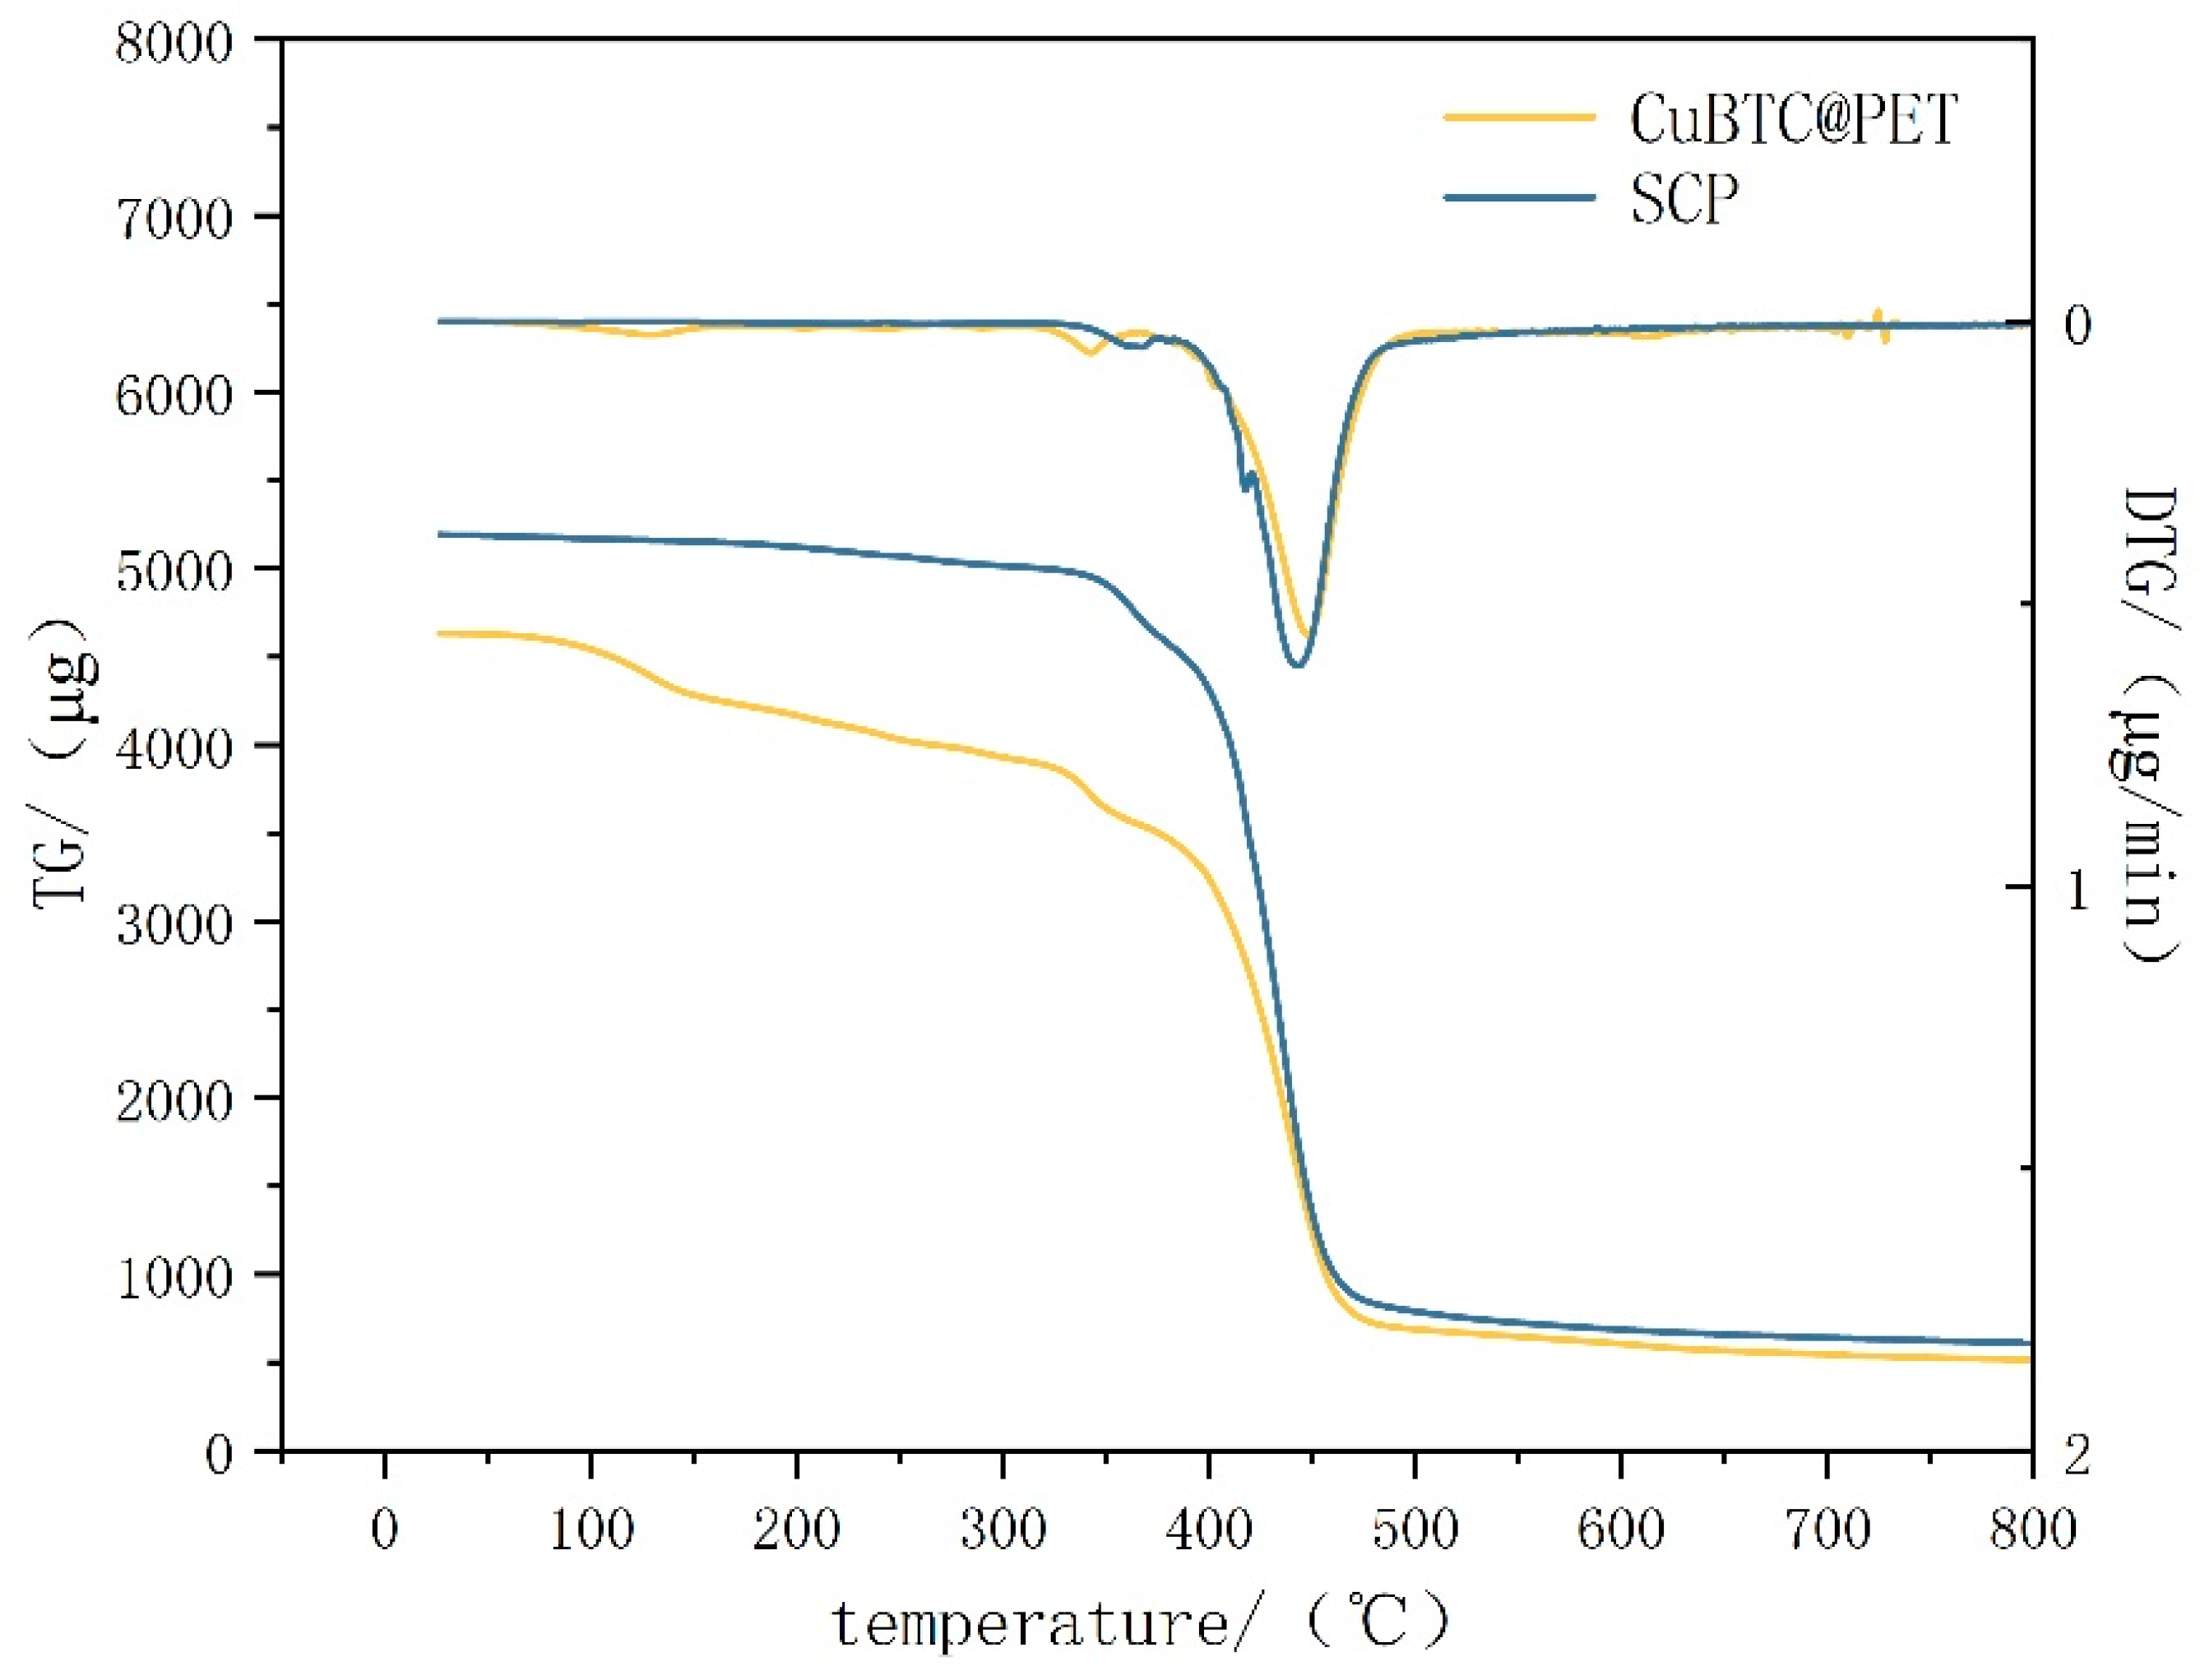
Figure 12 shows the thermogravimetric–differential thermal curves before and after hydrophobic modification. From the figure, we can see that the thermogravimetric–differential thermal curves of CuBTC@PET composite fibers before hydrophobic modification have the following phases: the quality of the fibers remains stable at 0–100 °C, and there is no trend of quality loss; the low-temperature dehydration phase occurs at 100–200 °C, which is mainly due to the adsorption of water molecules in the pore structure of CuBTC, and the water molecules adsorbed in the pore structure of CuBTC are removed by evaporation in the heating; the preliminary thermal decomposition phase occurs at 200–300 °C. At 300 °C, the preliminary thermal decomposition stage, the mass loss in this stage is mainly the breakage of PET chains and the thermal decomposition of the CuBTC organic ligand BTC [34]; at the 300–400 °C thermal stabilization zone, in which CuBTC shows relatively high thermal stability, further decomposition or desorption of small molecules of the remaining organic components in the framework occurs. Above 400 °C, the complete thermal decomposition stage, the PET with the CuBTC begins significant thermal decomposition, leading to the collapse of the structural framework. By comparison, it can be concluded that the TG–DTG curves of SCP fibers are more stable and fluctuation-free before 350 °C. In summary, the POTS coating effectively prevents CuBTC from adsorbing water in the air, prevents its hydrolysis under high-humidity air filtration conditions, and effectively improves the thermal stability before 350 °C.
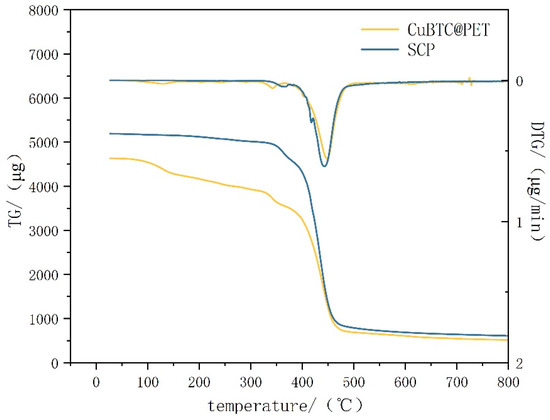
Figure 12.
Thermogravimetric–differential scanning calorimetry for different samples.
3.3. Filtration Performance Analysis
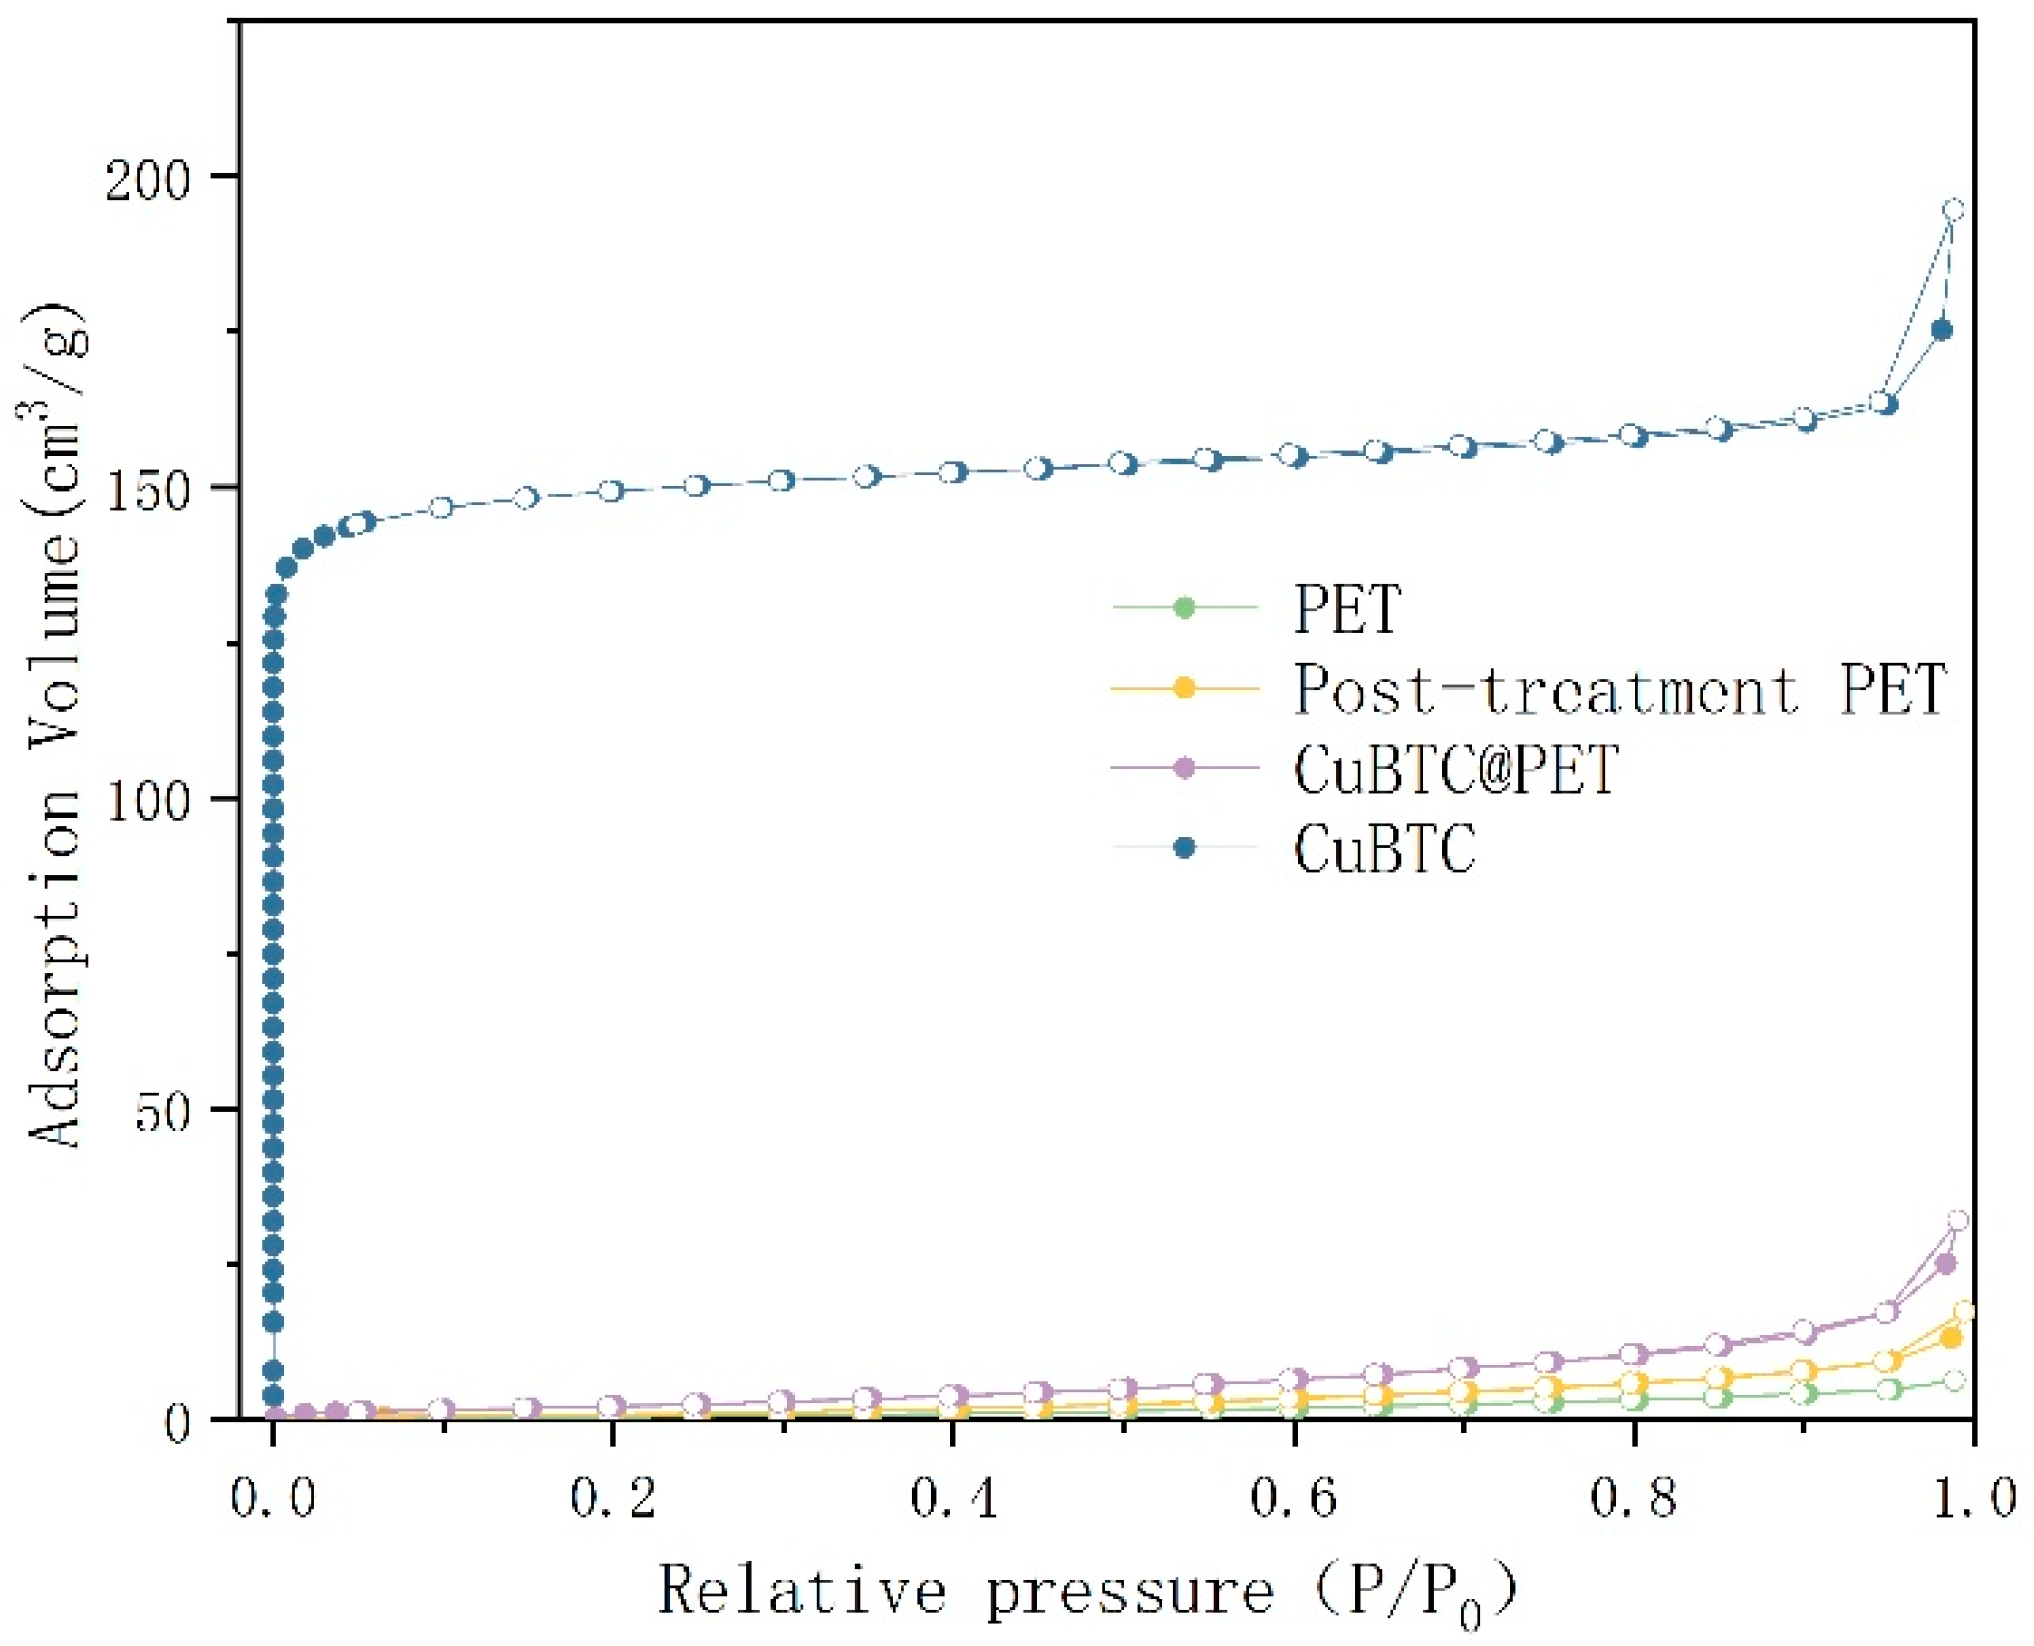
Figure 13 shows the N2 adsorption–desorption isotherms; compared with the classification of gas adsorption isotherms defined by the International Union of Theoretical and Applied Sciences (IUPAC), it can be seen that the N2 adsorption–desorption isotherms of PET fibers is a type III curve, and its specific surface area is 1.175 m2/g, which indicates that there is no microporous structure in the PET fibers. The N2 adsorption–desorption isotherms of the CuBTC powders show a typical type I shape of microporous materials with a specific surface area of 600.639 m2/g, which is consistent with the data published by Chui et al. [34]. The N2 adsorption–desorption isotherm of the solubilized recrystallized PET was determined as a type IV shape with an H2-type mesoporous hysteresis loop and a specific surface area of 3.093 m2/g, indicating the presence of a large number of irregular mesopores on top of the composite fibers. The N2 adsorption–desorption isotherm of CuBTC@PET was determined as a type IV shape with an H2-type mesoporous hysteresis loop and a specific surface area of 10.524 m2/g, suggesting that CuBTC@PET is a typical microporous material. The results showed that the micropores and mesopores of CuBTC@PET fibers were derived from the structures of CuBTC and solution-recrystallized PET, respectively. In summary, the dissolution-recrystallized PET fibers showed a mesoporous structure in the N2 adsorption–desorption isotherm, while the specific surface density of CuBTC@PET fibers after CuBTC in situ growth decreased compared to that of CuBTC powder but increased substantially compared to that of PET fibers and dissolution-recrystallized PET fibers, which was about 10 times of that of PET fibers and 3.5 times of that of dissolution-recrystallized PET fibers. It is about 10 times that of PET fiber and 3.5 times of solubilized recrystallized PET fiber.
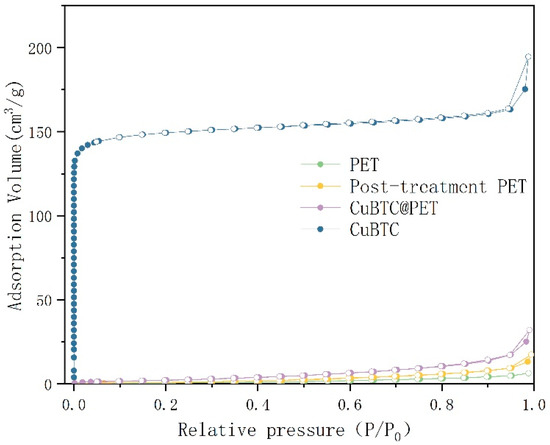
Figure 13.
N2 adsorption–desorption isotherms for different samples.
In this paper, the fiber membrane thickness was too low for accurate measurement, so it was determined by weighing the calculated fiber membrane g/m2 with an electronic balance. The thickness of the fiber membrane is an important factor affecting its filtration efficiency. When the fiber membrane is thicker, the pore path in the filtration medium is more complex, and it can intercept small particles more effectively, thus improving the filtration efficiency, but overly thick fibers will also increase the resistance to fluid flow, resulting in a decline in filtration performance. By optimizing the thickness of the fiber membrane, a higher filtration efficiency can be achieved while maintaining a lower filtration resistance, achieving the best balance of filtration performance. Figure 14a shows the control of fiber film thickness by spinning time. The filtration efficiency of fiber membranes with different thicknesses is improved with the increase in particle size, and the change curves are similar. As the thickness of the fiber membrane increased from 2.4 g/m2 to 5.4 g/m2, the filtration efficiency was significantly improved, but when the thickness of the fiber membrane increased to 8.3 g/m2, the filtration efficiency was not significantly improved, so 5.4 g/m2 was selected for the subsequent experiments, and the filtration efficiency was measured.
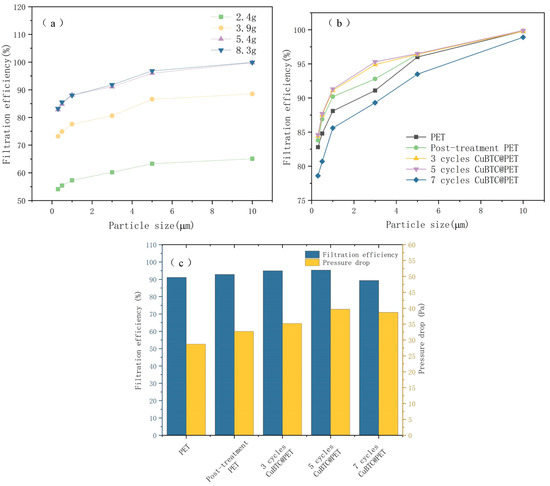
Figure 14.
Filtration efficiency for different samples: (a) filtration efficiency of different PET fiber membrane thicknesses, (b) filtration efficiency of different treatment stages, (c) relationship between filtration efficiency and filtration resistance of 3 μm NaCl particles.
By observing Figure 14b, the filtration efficiency of the PET fibers after the swelling and recrystallization treatment was significantly improved compared to that of the initial PET fibers. This may be attributed to the porous structure and high specific surface area of the fiber surface after swelling. After three and five cycles of in situ growth of the metal skeleton, the filtration efficiency was not significantly improved, which may be due to the increase in the diameter of the composite fibers after the growth of the metal skeleton; although they have a higher specific surface area, the adsorption and filtration efficiency of particles did not exhibit a large improvement. When the growth cycle increased to seven cycles, the filtration efficiency curve decreased significantly; the reason for this phenomenon may be that the metal skeleton size was too large, resulting in the filtration process of the fiber surface CuBTC crystals falling off, which was recorded by the laser particle counter, resulting in the experimental results showing a decline in filtration efficiency.
Figure 14c shows the relationship between the filtration efficiency and filtration resistance of 3 μm NaCl particles at different stages of fiber membrane treatment. The reason for choosing 3 μm for separate analysis is that the filtration efficiency of 3 μm particles is the main test for aluminum masks in various countries, and according to the related research, it shows the relationship between NaCl aerosol filtration efficiency and typical bacterial and viral filtration efficiency [10,46]. After five cycles, CuBTC@PET filtration efficiency is 95.3%, and the pressure drop is only 40 Pa; bacterial and viral filtration efficiencies are also standardized.
3.4. Antibacterial Analysis
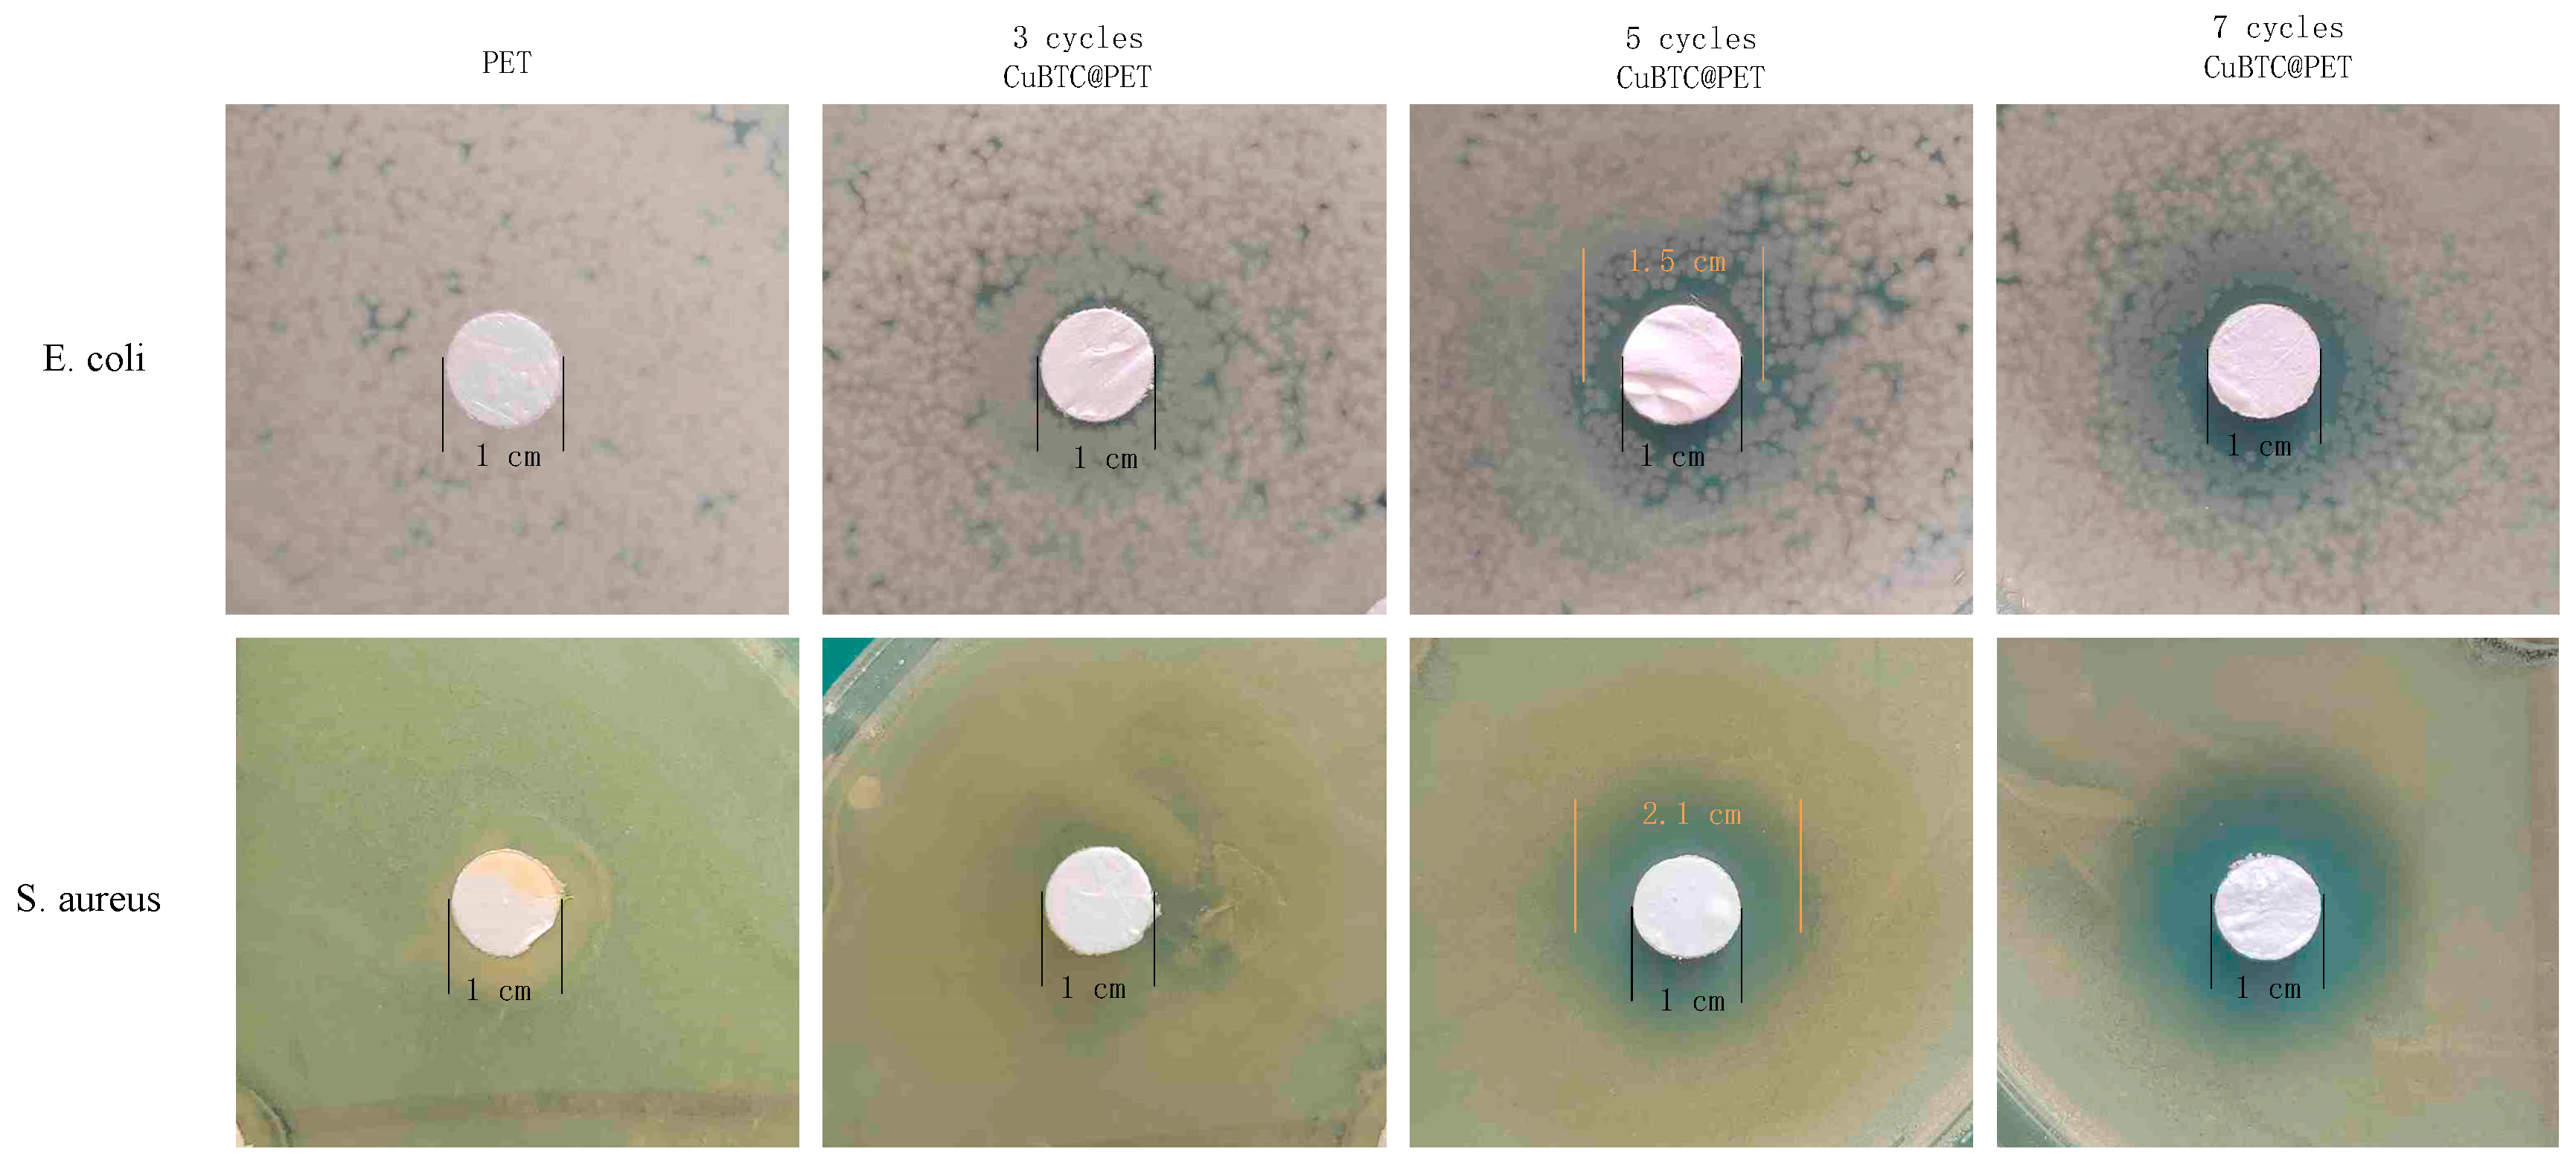
Figure 15 shows that the initial PET fiber has a 0 cm circle of inhibition against E. coli and Staphylococcus aureus, indicating that PET fiber does not have antibacterial activity. Compared to PET fibers, CuBTC@PET fibers showed an increase in the size of the zone of inhibition with the increase in the growth cycle. The zone of inhibition of the SCP was 0.25 cm for E. coli and 0.55 cm for S. aureus. For the difference in the antimicrobial performance of the two strains, current research suggests that there are two main reasons:

Figure 15.
Zone of inhibition test of CuBTC@PET fibers with different growth cycles.
(1) Differences in the cell wall structure of the two. In Gram-negative bacteria (Staphylococcus aureus), the cell wall of the outer membrane component is a lipopolysaccharide, and lipopolysaccharides have a strong toxicity and can resist the invasion of metal ions and other substances, while the inhibitory mechanism of CuBTC through the destruction of the DNA structure and the important enzyme interferes with the signaling, accumulates in the cell wall and reduces its permeability, and induces the leakage of substances in the cell, which in turn inhibits bacterial growth or kills the bacterium directly. So, it is not likely that Gram-positive bacteria (E. coli) are susceptible to killing by copper ions [47].
(2) Metal ion chargeability effect. CuBTC consists of Cu2+ ions and benzotrizoic acid, and CuBTC@PET can slow the release of copper ions and provide an antibacterial effect based on metal ions. Cu2+ ions can interact with cell wall proteins to disrupt the structure of the cell, and cellular internalization triggers the leakage of cellular contents, which in turn react with enzymes and DNA to block cellular functions and inhibit the growth of bacteria. The bactericidal effect against E. coli is mainly attributed to the substantial cell damage caused by copper ions. In contrast, the efficient antibacterial effect against Staphylococcus aureus is attributed to the fact that positively charged Cu2+ ions tend to attach to the surface of negatively charged Gram-positive bacteria, binding tightly and then leading to the rupture of the cell [48]. This also explains the higher antibacterial activity of CuBTC@PET against Staphylococcus aureus than E. coli. This is a physical killing mechanism that does not involve chemicals or antibiotics.
4. Conclusions
In summary, in this study, superhydrophobic CuBTC@PET composite nanofibers with graded porous structures with uniform size and good morphology were successfully prepared, providing a new solution for MOFs and electrostatically spun fiber composites. The average diameter of the fiber membrane was 374.22 ± 70.56 nm, the test results proved that its water contact angle of 146.4° effectively prevented its hydrolysis under high-humidity air filtration conditions, it was highly thermally stable before 350 °C, its filtration efficiency of particulate matter against 3 μm NaCl aerosol under 32 L/min air flux reached 95.3%, the filtration resistance was 39.7 Pa, and it was also highly effective against Gram-positive bacteria. It has a certain inhibitory effect on Gram-positive and Gram-negative bacteria. It provides a new strategy for the development of bacteriostatic and efficient filtration materials and is expected to be mass produced and applied to personal protective masks in the future.
Author Contributions
Conceptualization, K.T. and P.T.; methodology, K.T. and P.T.; validation, P.T., X.L., and W.Z.; formal analysis, X.Z.; investigation, K.T.; resources, K.T.; data curation, K.T.; writing—original draft preparation, K.T.; writing—review and editing, P.T., X.L., and W.Z.; visualization, X.Z.; supervision, X.L.; project administration, K.T.; funding acquisition, K.T. All authors have read and agreed to the published version of the manuscript.
Funding
This research received no external funding.
Institutional Review Board Statement
Not applicable.
Informed Consent Statement
Not applicable.
Data Availability Statement
The raw data supporting the conclusions of this article will be made available by the authors on request.
Conflicts of Interest
The authors declare no conflicts of interest.
References
- Peleg, A.Y.; Hooper, D.C. Hospital-acquired infections due to gram-negative bacteria. N. Engl. J. Med. 2010, 362, 1804–1813. [Google Scholar] [CrossRef] [PubMed]
- Magill, S.S.; O’Leary, E.; Janelle, S.J.; Thompson, D.L.; Dumyati, G.; Nadle, J.; Wilson, L.E.; Kainer, M.A.; Lynfield, R.; Greissman, S.; et al. Changes in prevalence of health care–associated infections in US hospitals. N. Engl. J. Med. 2018, 379, 1732–1744. [Google Scholar] [CrossRef] [PubMed]
- Magill, S.S.; Edwards, J.R.; Bamberg, W.; Beldavs, Z.G.; Dumyati, G.; Kainer, M.A.; Lynfield, R.; Maloney, M.; McAllister-Hollod, L.; Nadle, J.; et al. Multistate point-prevalence survey of health care–associated infections. N. Engl. J. Med. 2014, 370, 1198–1208. [Google Scholar] [CrossRef] [PubMed]
- Marchetti, A.; Rossiter, R. Economic burden of healthcare-associated infection in US acute care hospitals: Societal perspective. J. Med. Econ. 2013, 16, 1399–1404. [Google Scholar] [CrossRef] [PubMed]
- Siegel, J.D.; Rhinehart, E.; Jackson, M.; Chiarello, L. 2007 guideline for isolation precautions: Preventing transmission of infectious agents in health care settings. Am. J. Infect. Control 2007, 35, S65–S164. [Google Scholar] [PubMed]
- Zhang, G.H.; Zhu, Q.H.; Zhang, L.; Yong, F.; Zhang, Z.; Wang, S.L.; Wang, Y.; He, L.; Tao, G.H. High-performance particulate matter including nanoscale particle removal by a self-powered air filter. Nat. Commun. 2020, 11, 1653. [Google Scholar] [CrossRef] [PubMed]
- Dizaj, S.M.; Lotfipour, F.; Barzegar-Jalali, M.; Zarrintan, M.H.; Adibkia, K. Antimicrobial activity of the metals and metal oxide nanoparticles. Mater. Sci. Eng. C 2014, 44, 278–284. [Google Scholar] [CrossRef] [PubMed]
- Zhang, S.; Liu, H.; Yin, X.; Yu, J.; Ding, B. Anti-deformed polyacrylonitrile/polysulfone composite membrane with binary structures for effective air filtration. ACS Appl. Mater. Interfaces 2016, 8, 8086–8095. [Google Scholar] [CrossRef] [PubMed]
- Zhang, S.; Tang, N.; Cao, L.; Yin, X.; Yu, J.; Ding, B. Highly integrated polysulfone/polyacrylonitrile/polyamide-6 air filter for multilevel physical sieving airborne particles. ACS Appl. Mater. Interfaces 2016, 8, 29062–29072. [Google Scholar] [CrossRef] [PubMed]
- Jeong, S.B.; Ko, H.S.; Seo, S.C.; Jung, J.H. Evaluation of filtration characteristics and microbial recovery rates of commercial filtering facepiece respirators against airborne bacterial particles. Sci. Total Environ. 2019, 682, 729–736. [Google Scholar] [CrossRef]
- Dong, Q.; Yoon, S.J.; Zhang, J.; Yoon, H.S.; Kim, T.G. Research on Thermal Conductivity of Electrospun Polyacrilonitrile-Multi-Walled Carbon Nanotubes Composite Carbon Nanofiber Papers. J. Nanosci. Nanotechnol. 2018, 18, 7095–7099. [Google Scholar] [CrossRef] [PubMed]
- Chigome, S.; Torto, N. A review of opportunities for electrospun nanofibers in analytical chemistry. Anal. Chim. Acta 2011, 706, 25–36. [Google Scholar] [CrossRef]
- Jiang, X.; Bai, Y.; Chen, X.; Liu, W. A review on raw materials, commercial production and properties of lyocell fiber. J. Bioresour. Bioprod. 2020, 5, 16–25. [Google Scholar] [CrossRef]
- Wang, F.; Dai, J.; Huang, L.; Si, Y.; Yu, J.; Ding, B. Biomimetic and superelastic silica nanofibrous aerogels with rechargeable bactericidal function for antifouling water disinfection. ACS Nano 2020, 14, 8975–8984. [Google Scholar] [CrossRef]
- Crilley, L.R.; Angelucci, A.A.; Malile, B.; Young, C.J.; VandenBoer, T.C.; Chen, J.I. Non-woven materials for cloth-based face masks inserts: Relationship between material properties and sub-micron aerosol filtration. Environ. Sci. Nano 2021, 8, 1603–1613. [Google Scholar] [CrossRef]
- Huang, C.; Thomas, N.L. Fabrication of porous fibers via electrospinning: Strategies and applications. Polym. Rev. 2020, 60, 595–647. [Google Scholar] [CrossRef]
- Laity, P.R.; Glover, P.M.; Hay, J.N. Composition and phase changes observed by magnetic resonance imaging during non-solvent induced coagulation of cellulose. Polymer 2002, 43, 5827–5837. [Google Scholar] [CrossRef]
- Lu, Z.; Zhang, B.; Gong, H.; Li, J. Fabrication of hierarchical porous poly (l-lactide)(PLLA) fibrous membrane by electrospinning. Polymer 2021, 226, 123797. [Google Scholar] [CrossRef]
- Lu, Y.; Liu, C.; Mei, C.; Sun, J.; Lee, J.; Wu, Q.; Hubbe, M.A.; Li, M.C. Recent advances in metal organic framework and cellulose nanomaterial composites. Coord. Chem. Rev. 2022, 461, 214496. [Google Scholar] [CrossRef]
- Liu, X.; Yan, Z.; Zhang, Y.; Liu, Z.; Sun, Y.; Ren, J.; Qu, X. Two-dimensional metal–organic framework/enzyme hybrid nanocatalyst as a benign and self-activated cascade reagent for in vivo wound healing. ACS Nano 2019, 13, 5222–5230. [Google Scholar] [CrossRef]
- Rodríguez, H.S.; Hinestroza, J.P.; Ochoa-Puentes, C.; Sierra, C.A.; Soto, C.Y. Antibacterial activity against Escherichia coli of Cu-BTC (MOF-199) metal-organic framework immobilized onto cellulosic fibers. J. Appl. Polym. Sci. 2014, 131. [Google Scholar] [CrossRef]
- Emam, H.E.; Darwesh, O.M.; Abdelhameed, R.M. In-growth metal organic framework/synthetic hybrids as antimicrobial fabrics and its toxicity. Colloids Surf. B Biointerfaces 2018, 165, 219–228. [Google Scholar] [CrossRef] [PubMed]
- Yang, X.; Lan, L.; Zheng, C.; Kang, K.; Song, H.; Zhou, S.; Bai, S. Fabrication of Hierarchically Porous CuBTC@ PA-PEI Composite for High-Efficiency Elimination of Cyanogen Chloride. Molecules 2023, 28, 2440. [Google Scholar] [CrossRef] [PubMed]
- Liu, J.; Wang, Y.; Benin, A.I.; Jakubczak, P.; Willis, R.R.; Levan, M.D. CO2/H2O adsorption equilibrium and rates on metal− organic frameworks: HKUST-1 and Ni/DOBDC. Langmuir 2010, 26, 14301–14307. [Google Scholar] [CrossRef] [PubMed]
- Mazani, M.; Aghapour Aktij, S.; Rahimpour, A.; Tavajohi Hassan Kiadeh, N. Cu-BTC metal−organic framework modified membranes for landfill leachate treatment. Water 2019, 12, 91. [Google Scholar] [CrossRef]
- Hu, J.; Cai, H.; Ren, H.; Wei, Y.; Xu, Z.; Liu, H.; Hu, Y. Mixed-matrix membrane hollow fibers of Cu3(BTC)2 MOF and polyimide for gas separation and adsorption. Ind. Eng. Chem. Res. 2010, 49, 12605–12612. [Google Scholar] [CrossRef]
- Zhang, K.; Kirlikovali, K.O.; Le, Q.V.; Jin, Z.; Varma, R.S.; Jang, H.W.; Farha, O.K.; Shokouhimehr, M. Extended metal–organic frameworks on diverse supports as electrode nanomaterials for electrochemical energy storage. ACS Appl. Nano Mater. 2020, 3, 3964–3990. [Google Scholar] [CrossRef]
- Xiao, B.; Wheatley, P.S.; Zhao, X.; Fletcher, A.J.; Fox, S.; Rossi, A.G.; Megson, I.L.; Bordiga, S.; Regli, L.; Thomas, K.M.; et al. High-capacity hydrogen and nitric oxide adsorption and storage in a metal−organic framework. J. Am. Chem. Soc. 2007, 129, 1203–1209. [Google Scholar] [CrossRef] [PubMed]
- Zhu, L.; Zong, L.; Wu, X.; Li, M.; Wang, H.; You, J.; Li, C. Shapeable fibrous aerogels of metal–organic-frameworks templated with nanocellulose for rapid and large-capacity adsorption. ACS Nano 2018, 12, 4462–4468. [Google Scholar] [CrossRef] [PubMed]
- Yao, X.; Cordova, K.E.; Zhang, Y.B. Flexible Metal–Organic Frameworks as CO2 Adsorbents en Route to Energy-Efficient Carbon Capture. Small Struct. 2022, 3, 2100209. [Google Scholar] [CrossRef]
- Wang, H.L.; Yeh, H.; Chen, Y.C.; Lai, Y.C.; Lin, C.Y.; Lu, K.Y.; Ho, R.-M.; Li, B.-H.; Lin, C.-H.; Tsai, D.-H. Thermal stability of metal–organic frameworks and encapsulation of CuO nanocrystals for highly active catalysis. ACS Appl. Mater. Interfaces 2018, 10, 9332–9341. [Google Scholar] [CrossRef] [PubMed]
- Hanikel, N.; Prévot, M.S.; Fathieh, F.; Kapustin, E.A.; Lyu, H.; Wang, H.; Diercks, N.J.; Glover, T.G.; Yaghi, O.M. Rapid cycling and exceptional yield in a Metal-Organic Frameworks water harvester. ACS Cent. Sci. 2019, 5, 1699–1706. [Google Scholar] [CrossRef] [PubMed]
- Zhang, B.; Chen, H.; Hu, Q.; Jiang, L.; Shen, Y.; Zhao, D.; Zhou, Z. CelluMOFs: Green, facile, and flexible metal-organic frameworks for versatile applications. Adv. Funct. Mater. 2021, 31, 2105395. [Google Scholar] [CrossRef]
- Chui, S.S.Y.; Lo, S.M.F.; Charmant, J.P.; Orpen, A.G.; Williams, I.D. A chemically functionalizable nanoporous material [Cu3 (TMA)2 (H2O)3]n. Science 1999, 283, 1148–1150. [Google Scholar] [CrossRef] [PubMed]
- Benavides, P.T.; Dunn, J.B.; Han, J.; Biddy, M.; Markham, J. Exploring comparative energy and environmental benefits of virgin, recycled, and bio-derived PET bottles. ACS Sustain. Chem. Eng. 2018, 6, 9725–9733. [Google Scholar] [CrossRef]
- Awaja, F.; Pavel, D. Recycling of PET. Eur. Polym. J. 2005, 41, 1453–1477. [Google Scholar] [CrossRef]
- de Oliveira Santos, R.P.; Rodrigues, B.V.M.; dos Santos, D.M.; Campana-Filho, S.P.; Ruvolo-Filho, A.C.; Frollini, E. Electrospun recycled PET-based mats: Tuning the properties by addition of cellulose and/or lignin. Polym. Test. 2017, 60, 422–431. [Google Scholar] [CrossRef]
- Strain, I.N.; Wu, Q.; Pourrahimi, A.M.; Hedenqvist, M.S.; Olsson, R.T.; Andersson, R.L. Electrospinning of recycled PET to generate tough mesomorphic fibre membranes for smoke filtration. J. Mater. Chem. A 2015, 3, 1632–1640. [Google Scholar] [CrossRef]
- Bian, Y.; Wang, S.; Zhang, L.; Chen, C. Influence of fiber diameter, filter thickness, and packing density on PM2. 5 removal efficiency of electrospun nanofiber air filters for indoor applications. Build. Environ. 2020, 170, 106628. [Google Scholar] [CrossRef]
- Zhu, M.; Han, J.; Wang, F.; Shao, W.; Long, R.; Zhang, Q.; Pan, H.; Yang, Y.; Samal, S.K.; Zhang, F.; et al. Electrospun nanofibers membranes for effective air filtration. Macromol. Mater. Eng. 2017, 302, 1600353. [Google Scholar] [CrossRef]
- Veleirinho, B.; Rei, M.F.; Lopes-DA-Silva, J.A. Solvent and concentration effects on the properties of electrospun poly (ethylene terephthalate) nanofiber mats. J. Polym. Sci. Part B Polym. Phys. 2008, 46, 460–471. [Google Scholar] [CrossRef]
- Tamizifar, M.; Sun, G. Control of surface radical graft polymerization on polyester fibers by using Hansen solubility parameters as a measurement of the affinity of chemicals to materials. RSC Adv. 2017, 7, 13299–13303. [Google Scholar] [CrossRef]
- Tamizifar, M.; Sun, G. Surface modification of poly (ethylene terephthalate) fibers via controlled radical graft polymerization. J. Appl. Polym. Sci. 2018, 135, 45990. [Google Scholar] [CrossRef]
- Chen, Z.; Hay, J.N.; Jenkins, M.J. FTIR spectroscopic analysis of poly (ethylene terephthalate) on crystallization. Eur. Polym. J. 2012, 48, 1586–1610. [Google Scholar] [CrossRef]
- Li, W.; Zhang, Y.; Yu, Z.; Zhu, T.; Kang, J.; Liu, K.; Li, Z.; Tan, S.C. In situ growth of a stable metal–organic framework (MOF) on flexible fabric via a layer-by-layer strategy for versatile applications. ACS Nano 2022, 16, 14779–14791. [Google Scholar] [CrossRef] [PubMed]
- Serrano-Aroca, Á. Antiviral characterization of advanced materials: Use of bacteriophage phi 6 as surrogate of enveloped viruses such as SARS-CoV-2. Int. J. Mol. Sci. 2022, 23, 5335. [Google Scholar] [CrossRef] [PubMed]
- Yang, Y.; Zhang, Y.; Wang, L.; Miao, Z.; Zhou, K.; Yang, Q.; Yu, J.; Li, X.; Zhang, Y. Antibacterial Property of Oxygen-Terminated Carbon Bonds. Adv. Funct. Mater. 2022, 32, 2200447. [Google Scholar] [CrossRef]
- Baker, J.; Sitthisak, S.; Sengupta, M.; Johnson, M.; Jayaswal, R.K.; Morrissey, J.A. Copper stress induces a global stress response in Staphylococcus aureus and represses sae and agr expression and biofilm formation. Appl. Environ. Microbiol. 2010, 76, 150–160. [Google Scholar] [CrossRef]


Disclaimer/Publisher’s Note: The statements, opinions and data contained in all publications are solely those of the individual author(s) and contributor(s) and not of MDPI and/or the editor(s). MDPI and/or the editor(s) disclaim responsibility for any injury to people or property resulting from any ideas, methods, instructions or products referred to in the content. |
© 2024 by the authors. Licensee MDPI, Basel, Switzerland. This article is an open access article distributed under the terms and conditions of the Creative Commons Attribution (CC BY) license (https://creativecommons.org/licenses/by/4.0/).