Article

The Influence of Cooking Methods and Muscle on Beef Aroma Profile and Consumer Satisfaction: Insights from Volatile Compound Analysis

by
Iwona Wojtasik-Kalinowska
1,*,
Linda J. Farmer
2,
Terence D. J. Hagan
2,
Alan W. Gordon
2,
Rod Polkinghorne
3,
Grzegorz Pogorzelski
4,
Agnieszka Wierzbicka
1 and
Andrzej Poltorak
1
1
Department of Technique and Food Development, Faculty of Human Nutrition and Consumer Sciences, University of Life Sciences, 159 c Nowoursynowska, 02-776 Warsaw, Poland
2
Agri-Food and Biosciences Institute, Newforge Lane, Belfast BT9 5PX, UK
3
Birkenwood Pty Ltd., 461 Timor Rd., Murrurundi, NSW 2338, Australia
4
Institute of Genetics and Animal Biotechnology of the Polish Academy of Sciences, Jastrzebiec, 05-552 Magdalenka, Poland
*
Author to whom correspondence should be addressed.
Appl. Sci. 2024, 14(11), 4477; https://doi.org/10.3390/app14114477
Submission received: 19 April 2024 / Revised: 20 May 2024 / Accepted: 21 May 2024 / Published: 24 May 2024

Abstract

:

Featured Application

The findings of this study shed light on the intricate relationship between the cooking techniques, volatile compound formation, and consumer acceptance of beef meat. By employing Solid-Phase Microextraction (SPME) and gas chromatography–mass spectrometry (GC-MS) methods to analyze volatile “marker” compounds, the study delineates significant disparities in flavor profiles arising from roasting versus stewing methods.

Abstract

The objective of this study is to determine the effect of two distinct cooking techniques, namely roasting and stewing, on the formation of volatile compounds in various beef muscles (Semimembranosus, Biceps femoris, and Rectus femoris) and how this relates to consumer acceptance. The research employs the concept of volatile “marker” compounds to discern the influence of cooking techniques on the flavor profile of beef. Eighteen “marker compounds” were selected to represent a number of the mechanisms of formation and quantified in beef subjected to two different cooking methods. While no statistically significant differences were observed in consumer evaluations between the two cooking methods, notable disparities emerged in the consumer assessments of specific muscle cuts. Notably, the Rectus femoris muscle received the highest ratings (p < 0.05) among other evaluated muscles. The utilization of Solid-Phase Microextraction (SPME) and gas chromatography–mass spectrometry (GC-MS) methods for the analysis of volatile “marker compounds” in beef proved effective in highlighting significant differences in flavor compound classes between cooking methods, and these differed between muscles. The main effect was of the cooking method with stewed beef aroma having approximately 39× more dimethyl trisulphide, 9× more dimethyl disulphide, 7× more pentanal, 3× more hexanal, and twice as much benzaldehyde and 2-methylthiophene. Dimethyldisulphide, dimethyltrisulphide, hexanal, and heptanal, therefore, emerged as characteristic volatile compounds associated with the stewing cooking technique, suggesting their potential as markers for lipid and other oxidation reactions. This work indicates that certain lipid oxidation compounds, Strecker aldehydes, and sulfur compounds can be markers for the undesirable and/or desirable flavors of cooked beef, but that this depends on the cooking method chosen. It shows that flavor differences may be understood through the analysis of volatile flavor compounds in association with palatability and other chemical measurements.

1. Introduction

The quality of meat, as perceived by consumers when eating, encompasses factors such as tenderness, color, and flavor [1,2]. This sensory aspect plays a crucial role in the overall acceptability of meat [3]. While the tenderness of beef is one of the most crucial factors influencing its palatability [4,5], consumer satisfaction with beef steaks tends to be more influenced by the perceptions of beef flavor and juiciness as tenderness increases [4].
Researchers [5] have reported that flavor liking makes a larger contribution than tenderness to Polish beef eating quality compared to approximately equal contributions reported for Australian consumers. Various factors contribute to meat flavor, including the breed of animals, feeding system, sex, conditions of slaughter and storage, aging process, pH, and meat composition [6]. The combined influence of meat origin and chosen cooking methodology has been reported to be a key factor affecting the perceived eating quality of meat products [7]. The flavor of the beef is formed by taste and aroma compounds in the cooked meat and their release from the meat during eating. Taste compounds comprise amino acids, sugars, ribonucleotides, acids, salts, and peptides present naturally in raw meat. Amino acids and peptides, along with reducing sugars, play key roles in flavor formation [8,9] through the reaction of amino acids and peptides with reducing sugars to give Maillard reaction products such as carbonyls, sulfur, and nitrogen-containing compounds, which can further react with each other or interact with other reactive compounds to yield nitrogen- and sulfur-containing aroma compounds such as pyrazines, thiophenes, and thiazoles [10]. The sulfur-containing amino acids such as cysteine and methionine are especially important substrates in reactions leading to the formation of key volatile compounds responsible for meaty flavor [11]. Both five-carbon and six-carbon sugars contribute to flavor development by forming volatile compounds through reactions with amino acids. For instance, glucose forms pyrazines with lysine, while ribose forms sulfur compounds with cysteine [12]. Peptides and oligopeptides formed during meat ripening also act as meat flavor enhancers [13,14]. Thiamine, a vitamin naturally occurring in meat, undergoes thermal degradation, leading to the formation of volatile compounds with meaty, earth-like, burnt, and green flavor notes, influencing the overall flavor profile of meat products [15]. Additionally, fatty tissue undergoes transformations, yielding reactive substances like acids, alcohols, aldehydes, and ketones, enriching flavor complexity [16]. Lipids, particularly phospholipids, are crucial for imparting specific flavors to different meat species due to differences in fatty acid profiles [8,17]. The thermal oxidation of lipids gives a wide range of aldehydes, ketones, and related aliphatic compounds. During the heat treatment, the lipids melt and are released from the meat. Some lipid-related volatile compounds are volatilized, contributing to the flavor of the cooked meat [18]. The presence of liquid fat also influences the release of flavor compounds during eating. The method, time, and temperature of cooking is, therefore, expected to influence flavor formation [19].
Some research has shown a direct relationship between cooking methods and the formation of specific volatile compounds which could influence consumer acceptance [20]. The conditions of meat cooking strongly determine the resulting transformations, i.e., modifications in the structure and composition of meat [21,22]. Temperatures above 140 °C promote Maillard reactions, which are essential for the development of volatile compounds, related to roasted and meaty flavors [16]. However, higher cooking temperatures are also associated with increased lipid oxidation and the reduction of essential fatty acids compared to milder treatments [23].
Relatively little information is available on the relationship between volatile compounds and flavor scores by the consumers of beef. Such studies are made more difficult because the aroma compounds responsible for beef flavor are present at very low concentrations, which causes them to be difficult to determine. However, it has been demonstrated that the related classes of aroma compounds respond together to factors affecting beef quality and that some classes of compounds are positively and negatively associated with the consumer liking of flavor [24]. It was proposed to monitor these “marker compounds”, which have been shown to be associated with desirable or undesirable flavor characteristics. The determination of “marker compounds” may help to explain differences between the flavors of different muscles prepared by different cooking methods.
The roasting and stewing of beef are extensively practiced cooking methods in Poland. Their widespread use is attributed to their alignment with culinary culture, the utilization of more economical cuts of meat, adherence to culinary knowledge traditions, adaptation to climatic conditions, and the preservation of nutritional value. These factors collectively contribute to the popularity of these cooking methods in Polish cuisine, forming integral elements of the culinary heritage of the country.
Meat Standards Australia (MSA) is a grading system used in Australia to provide a grade for beef cuts based on their predicted eating quality [2]. The MSA protocols for assessing beef cooked by various methods, outlined by Watson, Gee et al. [25], were applied to evaluate the quality of Polish beef in the study described in this manuscript, which is part of a broader project (POIG.01.03.01-00-204/09 Optimizing Beef Production in Poland According to “from Fork to Farm”). The ProOptibeef project conducted in Poland to improve the eating quality of Polish beef used the MSA methodology to evaluate the consumer acceptance of a wide range of beef muscles and cooking methods [5].
The aim (and novelty) of the study was to elucidate the relationship between consumers’ scores for beef flavor and the volatile compounds that contribute to it. A variety of methods, including the monitoring of marker compounds for different compound classes, was used to evaluate the effect of two different cooking techniques (roasting and stewing) on the volatile compounds collected from three different muscles and to identify any relationship between these volatiles and the flavor liking scores from consumer panels.

2. Materials and Methods

2.1. Materials and Meat Sample Preparation

The carcasses providing the samples used in this research were obtained from young bulls of the Holstein–Friesian breed (20–27 months) characterized by similar quality parameters including European Union Ruling on the Classification of Carcasses (EUROP) muscle scores from O- to O, EUROP fatness scores from −2 to 2, carcass weight from 278 kg to 366 kg, ultimate loin pH from 5.50 to 5.88, meat color from 1B to 4 (Australian Meat Industry Standards and Quality Assurance Program (AUS-MEAT)), marbling (United States Department of Agriculture (USDA)) from 270 to 420, and ossification (USDA) from 130 to 180. The chilling rate of the carcasses was monitored to ensure that the correct drop in pH was observed in relation to the temperature drop and that the risk of cold shortening was excluded. The suspension method used post-mortem was the Achilles tendon method. Three muscles (M. Semimembranosus (SM), M. biceps femoris (BF), and M. rectus femoris (RF)) were collected. The cattle were slaughtered under European Union requirements following the Polish industry practice. The carcasses were selected by trained staff who assessed the amount of visual intramuscular fat of the ribeye face at the 12th and 13th rib along with lean color and skeletal ossification [26].
The meat was aged at 4 °C for 21 days post-mortem prior to production. The cutting of roasts and cubes for stewing and cooking methods was conducted according to the MSA protocols [5]. The samples were frozen and held at −20 °C prior to consumer panels, conducted in Poland, or after frozen transport to Northern Ireland where they were held at −80 °C prior to flavor analyses.
The samples were transferred from frozen storage to a refrigerator set at 4 °C 24 h before testing to facilitate thawing. Subsequently, they were taken out of the refrigerator and allowed to reach an approximate temperature of 20 °C within the hour preceding the cooking process.
Two different cooking methods (roasting and stewing) were applied. The cooking methods were the same both for the consumer panels and volatile compound analysis. Roasts were prepared as a single “block” of approximately 80 mm × 80 mm × 150 mm whereas a stew sample comprised 22 cubes of 21 mm on each axis.
The roast samples for sensory evaluation were prepared in a convection-steam oven (model CPE 110, Kuppersbuch, Großkuchentechnik, Galsen-kirchen, Germany). The oven was set to dry heat and preheated to 160 °C prior to loading the roast blocks. The blocks were paired for weight and placed in the oven in a designated arrangement related to relative weight and size. The 20 roasts at the front of each pair were fitted with a thermocouple inserted in their geometric center. All the roasts had an ovenproof identification tag pinned to the rear to maintain sample identification (ID) during cooking and carving. The oven temperature was maintained at 160 °C throughout the cooking period. Each roast was removed from the oven when an internal temperature of 65 °C was reached. This temperature was confirmed with a calibrated thermometer for all the roasts with the paired non-thermocoupled samples tested at the time of the removal of their matched pair. On removal, the roasts were placed in a bain-marie steamer pan and allowed to stand for a minimum of 5 min prior to further preparation.
The stewing samples were browned and cooked prior to delivery to the sensory testing venue. Browning was achieved by heating in a stainless steel frying pan on full heat with olive oil. The cubes from each sample were added and removed as designated by a pre-printed timing control sheet referenced against an elapsed timer (according to MSA standards). The cubes were sprayed liberally with an olive oil spray (Napolina, olive oil, Liverpool, UK) and stirred to ensure all the sides were browned. Each sample was browned for 90 s and then transferred to a Gastronorm 1/9th 100 mL deep bain-marie steamer pan (Vogue, Birmingham, UK) containing 300 mL of liquor capacity. The liquor was made up of 15 liters of boiling water and a commercial vegetable mix consisting of 1200 g of defrosted sliced frozen onion, 1200 g of defrosted sliced frozen carrot, 400 g of chopped celery (Hortex, Warsaw, Poland), and 4 level metric tablespoons of fine salt. The pans with liquor were placed in bain-maries with lids and held at a rolling boil for 30 min prior to adding the browned cubes. The cubes were then simmered at 93 °C to 95 °C for 2 h.

2.2. Consumer Panels

A total of 360 consumers evaluated stewed and roasted beef, and 180 consumers assessed each cooking method. The samples were presented to the consumers following the protocol for Meat Standards Australia (MSA) beef assessment described previously [2,25]. The experiment was conducted in “picks” each involving 60 consumers, served in a single setting of 60 for roasts, and divided into three sessions of 20 people for stewed beef (Figure S1). Each consumer evaluated 7 samples. The first sample assessed was a “starter” or “link” sample (of mid-quality) to familiarize the assessor with the procedures and remove any bias due to the first sample tasted. Each consumer was then presented with six test samples, expected to differ in quality. Ten consumers evaluated each sample. Assignment to each consumer was regulated by a software utilizing a 6 × 6 Latin square that ensured each test sample was served the same number of times before and after each other product. The composition of these consumer panels is provided in Table 1. The detailed method and some data related to this experiment were reported previously by Pogorzelski, Woźniak, Polkinghorne, Poltorak, and Wierzbicka [5].
In order to provide an overall measure for the comparison of the different production and processing factors, a combined meat quality score based on 4 variables (MQ4) has been derived from the consumer scores for tenderness, juiciness, flavor liking, and overall liking and satisfaction scores, as described previously by Watson et al. [25]. The formula for MQ4 is as follows:
LMQ4 = 0.3 × TE + 0.1 × JU + 0.3 × FL + 0.3 × OL
where TE, JU, FL, and OL are tenderness, juiciness, flavor liking, and overall liking scores, respectively.

2.3. Basic Composition Analysis

A portion of raw meat was homogenized and placed on a Petri dish, forming a layer of 0.5 cm. Fat, moisture, protein, ash, and connective tissue were analyzed by a near-infrared (NIR) spectrometer NIRFlex N-500 (Büchi Labortechnik AG, Flawil, Switzerland). The measurement was performed three times for each sample [27].

2.4. Volatile Compound Analysis

Volatile compounds were collected from the portions of the same muscles that were roasted and stewed and served during consumer panels and gas chromatography–mass spectrometry analysis was conducted on the collected volatiles.
The headspace volatiles were collected from the cooked meat using manual Solid-Phase Microextraction (SPME). Samples for the volatile collection were obtained from the specified blocks removed from the oven for roasting and cubes without juice (removed by draining immediately before collection) taken from the bain-marie steamer pan (prepared as described in Section 2.1). The volatile compounds arising from olive oil alone were examined by the GC-MS analysis of the volatiles from 2 ml of the olive oil spray (Napolina, olive oil, Liverpool, UK) heated for 90 s in the electric frying pan. Subsequently, four cores of 0.75 cm diameter were extracted and placed into a 15 mL clear glass vial (Supelco, Bellefonte, PA, USA; pre-conditioned in an oven maintained at 95 °C). Preheated vials (60 °C) and screw caps containing a polytetrafluoroethylene septum were then sealed. The vial was immersed in a water bath set at 65 °C (Thermo Scientific, Waltham, MA, USA) and allowed to equilibrate for 5 min. Volatile compounds were extracted via SPME using a 75 μm film thickness carboxen polydimethylsiloxane fiber within a manual SPME needle and holder (Supelco, Bellefonte, PA, USA). The samples were held at room temperature for a maximum of 15 min between collection and analysis. The samples were injected manually onto an HP 6890 Series GC System Detector (Agilent Technologies, Santa Clara, CA, USA) equipped with a 5973 Mass Selective Detector (Agilent Technologies, Santa Clara, CA, USA) used for the separation and detection of volatile compounds. The extracted volatile compounds were analyzed and the selected volatiles quantified by an HP 6890 Series GC-MS System. Volatile Organic Compounds (VOCs) were desorbed from the fibers in the GC-MS inlet at 250 °C. The GC column was placed into a bed of dry ice. After 5 min, the column was removed from the dry ice and the oven method was started. The SPME fiber was left within the inlet for the first 3 min of the oven program to ensure all VOCs had desorbed.
A BPX-5-capillary column (25 m × 0.32 mm, 0.25 µm film thickness; SGE, Austin, TX, USA) was used. Helium was the carrier gas (1 mL/min). The oven program included an initial 5 min at 35 °C, followed by an 8 °C per min ramp to 220 °C, then a 20 °C per min ramp to 290 °C, and finally a 5 min hold period at 290 °C.
On each day of analysis, a solution of n-alkanes (C8–C22, Supelco, Bellefonte, PA, USA; 1 ng/μL) was run. The linear retention indices (LRI) (calculated with reference to the n-alkanes) were used to evaluate the retention times of the VOCs. Compound identity was confirmed by the comparison of the ion fragmentation patterns and the LRI with that of the authentic compounds.
For quantitation, a single-point external standard method was applied. External standard reference compounds (Sigma Aldrich, Saint Louis, MO, USA) were delivered in solutions (1 ng/μL) of pentane or toluene. The quantitative ion abundances of sample runs were compared with the quantitative ion abundances of standard runs of known concentration [28]. After analysis eighteen, “marker compounds” were selected to represent a number of the mechanisms of formation and quantified (ng/g cooked sample) from the headspace of beef subjected to two different cooking methods.2.5. Statistical Analysis
An individual muscle was the experimental unit. The physicochemical characteristics and volatile compounds were analyzed using the General Linear Model (GLM) procedure with a fixed effect of cooking method (roasting vs. stewing) and muscle type (SM, BF, and RF). Random terms included batches. Each treatment was triplicated (three independent batches) with three observations for each analysis. The results were analyzed by a two-way analysis of variance together with their interaction (cooking method × muscle type). Tukey’s test was used at the 5% level to make comparisons between sample means when significant differences were found. All the results are presented as mean values with their standard error of mean (SEM).
External preference mapping was conducted on the volatile data and the consumer and compositional data were correlated to the resulting principal components using GenStat version 18.1.

3. Results and Discussion

3.1. Composition of Meat Samples

The percentages of chemical fat, moisture, protein, ash, and connective tissue in the three raw muscles highlight the important characteristics of these muscle types (Table 2).
The observed increase in fat content alongside a decrease in moisture, protein, and ash in RF compared with SM and, in most cases, BF, aligns with previous research findings [29]. This trend suggests variations in the composition of different muscle types, likely influenced by factors such as muscle function and anatomical location. These differences may have implications for meat quality, cooking characteristics, and nutritional value. Moreover, the variation in protein content among the muscles, with the RF muscle exhibiting the lowest protein content and the SM muscle showing slightly higher levels, corroborates previous studies indicating heterogeneity in protein distribution within different muscle groups [30]. This finding underscores the importance of considering muscle-specific protein content when assessing nutritional profiles and dietary recommendations. The observed difference in ash content, with the RF muscle demonstrating the lowest value, reflects the mineral composition of the muscle tissue, which can influence its nutritional value and suitability for various culinary applications [31]. Connective tissue plays a crucial role in determining meat texture and tenderness [32]. The higher connective tissue content observed in the BF muscle aligns with its anatomical location and function, as this muscle is typically involved in supporting and stabilizing joints.

3.2. Consumers’ Palatability Scores

There were no statistically significant main effects due to the cooking method but there were significant differences between the muscles for all attributes (Table 3). Interactions between the muscle and cooking method were significant for flavor liking and juiciness (p < 0.01) and for tenderness, overall liking, MQ4, and satisfaction (p < 0.001; Figure 1).
Consumers scored the muscle RF (both stewed and roasted) significantly higher than SM and BF for all sensory characteristics (p < 0.05; Table 3). These eating quality differences between the muscles were greater for the roasted meat than the stewed meat (Figure 1a,b). Average flavor liking for RF was scored 11–15 points higher than the other two muscles. It should be noted that the beef from these two cooking methods was assessed at different times by different consumer panels, so the consumers were comparing the qualities of one or the other cooking method, and a direct comparison of the two cooking methods was not attempted. The potential effect of different consumers was mitigated by the large number of assessors, evidenced by the fact that the scores for individual muscles cooked by the different cooking methods were not significantly different.
The RF muscle exhibited the lowest protein, fat, and connective tissue content compared to the other muscles (Table 2). RF received much higher scores for tenderness than SM and BF which received very low scores, with similar but lesser effects on the other attributes (Table 3). The impact of the connective tissue on tenderness may explain the difference between RF and BF but not the low scores for SM, suggesting that factors beyond basic nutritional composition are influencing meat quality perception. This may include sarcomere length, proteolysis, or the generation of flavor. Further investigations using physicochemical methods such as those referred to by Chen et al. [33] may help to clarify these differences.
Zhu et al. [34] explored the influence of different cooking methods on meat quality perception. Roasting emerges as the most highly recommended cooking method for yak meat since it induces great consumer acceptability. Their research revealed that variations in cooking techniques can significantly affect the sensory characteristics of meat, independent of its chemical composition.

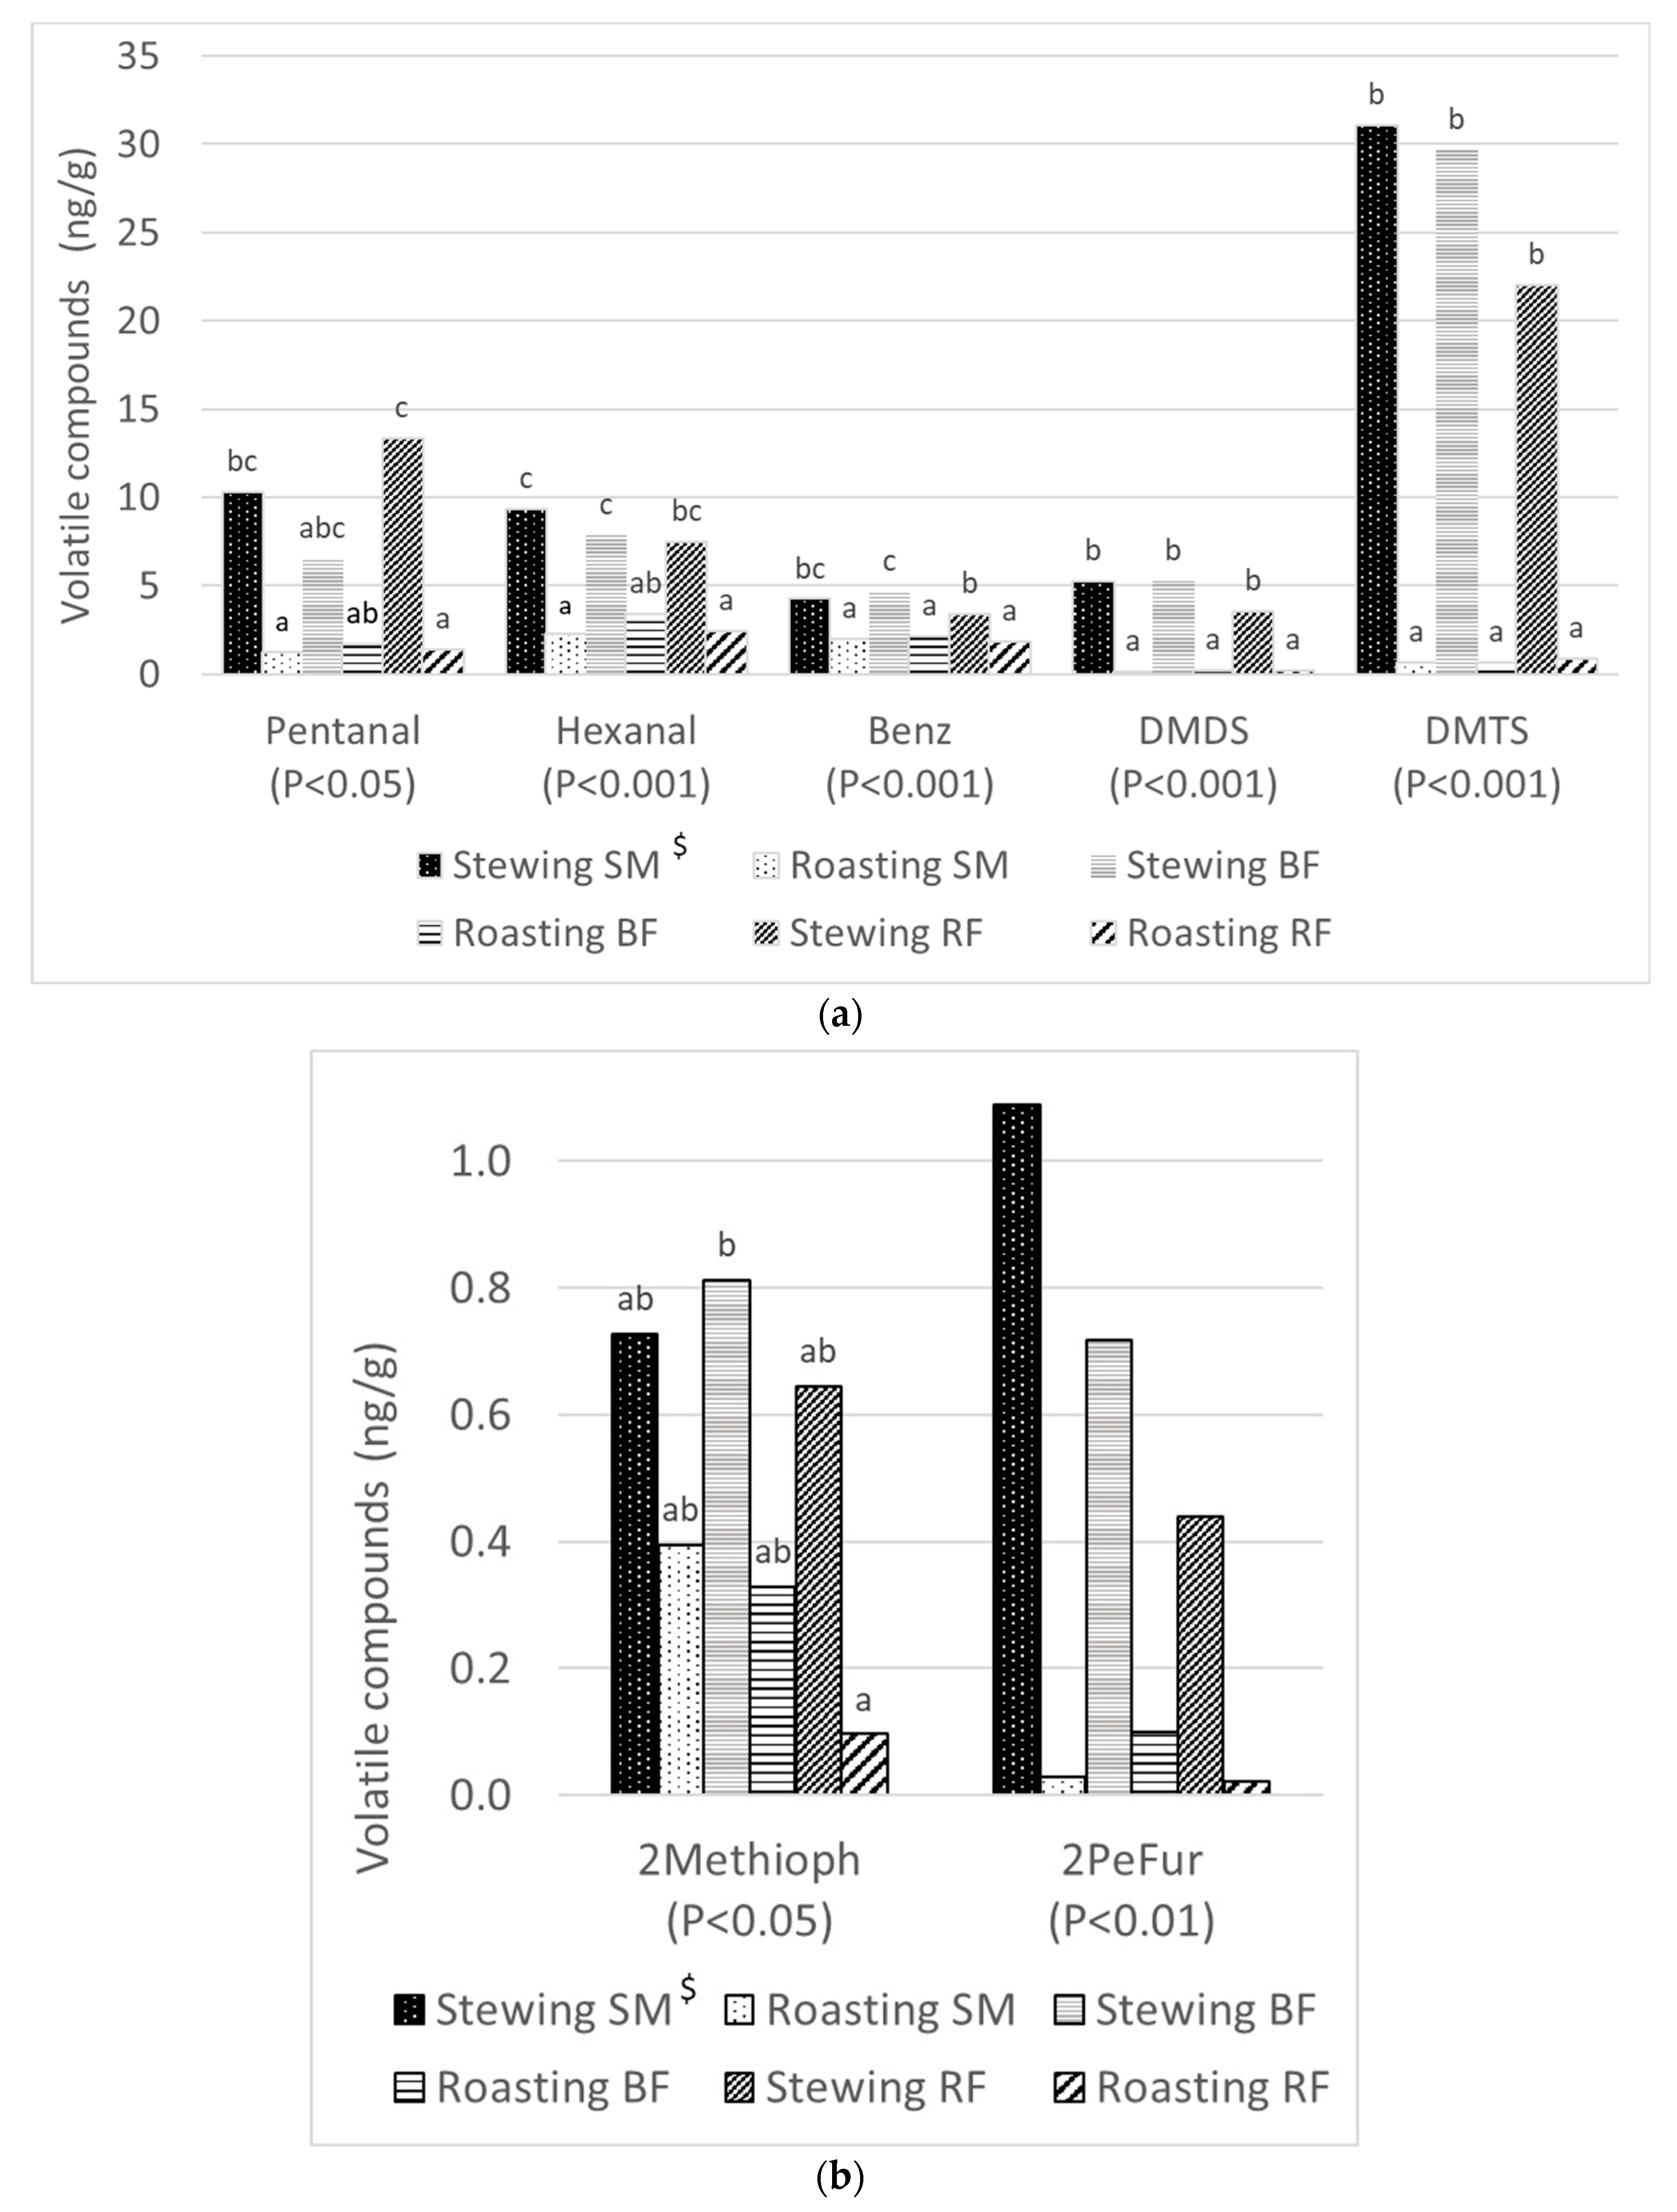
3.3. Volatile Compounds

Eighteen volatile “marker compounds” were selected to represent a number of mechanisms of formation and were quantified (ng/g cooked sample) in beef subjected to two different cooking methods. The compounds were categorized into eight groups: aldehydes, Strecker aldehydes, thiophenes, ketones, sulfides, furans, alcohols, and acids. Many aldehydes, alcohols, and ketones are formed from the thermal oxidation of fatty acids and are known for their distinctive aroma profiles, encompassing notes of butter, sweetness, florals, toastiness, or green nuances [35]. The degradation of specific amino acids—alanine, isoleucine, leucine, methionine, phenylalanine, and valine—results in the formation of Strecker aldehydes such as acetaldehyde, 2-methylbutanal, 3-methylbutanal, 3-methyl-butanal, 3-(methylthio)propanal, and phenylacetaldehyde, respectively. Furthermore, 2,3-butanedione is produced through the degradation of carbohydrates [36].
The impact of the cooking method on these volatile compounds for the three distinct muscles is detailed in Table 4. Significantly lower amounts of volatile compounds were observed in the case of the roasted muscles compared to the stewed ones. No statistically significant main effects (p ≥ 0.05) were observed due to the type of muscle. However, there were significant cooking x muscle interactions, as illustrated in Figure 2a,b.
Higher levels of the following individual volatile compounds were observed in the case of the stewing compared to the roasting: pentanal, hexanal, benzaldehyde, 2-methyl thiophene, dimethyl disulfide, dimethyl trisulfide, and 2-pentyl furan (Table 4). There were significant interactions between the muscles and cooking methods for all of these compounds. The predominant effect was an increase in the quantity of these compounds collected from the stewed beef compared with the roasted meat, with the effect most marked in SM and RF for pentanal, hexanal, and 2-pentylfuran; in SM and BF for benzaldehyde, DMDS, and DMTS; and in RF for 2-methylthiophene (Figure 2). These relatively small effects of the muscle cannot be explained by the differences in gross composition (Table 1). Differences due to cooking method will have been influenced by the MSA cooking protocols, which were designed to simulate normal practice in Australia; the stewed beef was first browned in olive oil and then stewed, while the roasted meat was trimmed of outer browned surfaces. However, the fact that the remaining eleven compounds showed no significant effects of the cooking method (Table 4) suggests that other factors are playing a part. Utama et al. [37] compared the volatiles from oven-roasted brisket and boiled meat (without trimming or browning steps) and reported that, in this case, most volatiles were higher from the roasted beef.
Dimethyl disulphide (DMDS), dimethyl trisulphide (DMTS), 3- and 2-methylbutanal, 2-methylthiophene, and benzaldehyde were included as markers for different pathways of the Maillard reaction, a complex chemical reaction between amino acids and reducing sugars that occurs at high temperatures. 2-Methylthiophene may be formed from the Maillard reaction of giving 1,4-diketones, with further reactions with, for example, H2S from cysteine [38]. The compounds 3-methylbutanal and 2-methylbutanal are formed from the Strecker degradation of leucine and isoleucine [39]. Benzaldehyde may be formed by the same mechanism as the rare amino acid phenylglycine, but its abundance in meat suggests that there are alternative routes of formation. DMDS and DMTS are formed through the Strecker degradation of methionine to release methanethiol, followed by an oxidation reaction to form DMDS and DMTS. DMDS and DMTS were more than 20× higher in the stewed meat, while the other products of Strecker degradation, such as the methyl butanal isomers, were unchanged. This may have been due to the presence of onions in the stewing mix giving rise to additional sulfur-containing precursors. Their formation has been shown to be inhibited by the presence of anti-oxidants or Maillard-produced thiols [40]. In wine, disulphide and trisulphide formation may be catalyzed by the presence of CuII and FeIII [41]. Investigations into the effect of water on volatile Maillard reaction products showed that both quantitative and qualitative changes occurred in the volatile profile of a meat flavor model system with different moisture levels [42]. The maximum amount of volatiles was observed at an aw of 0.72. The kind of major volatiles also differed: higher amounts of both DMDS and DMTS were present in the high-water system (p < 0.05). Thus, it may be that the presence of pro-oxidant metal ions from the beef in the cooking juices favored the further reactions of methanethiol from the Strecker degradation of methionine. In our research, no effect of the type of heat treatment on the content of 2- and 3-Methyl butanal was observed (p > 0.05).
Hexanal, pentanal, and 2-pentylfuran are derived from lipid oxidation reactions. Consideration was given to whether their higher levels in the stewed meat could be from the oil used for frying. These compounds are characteristic of the breakdown of linoleic acid [43]. Oleic acid is the main fatty acid in olive oil and accounts for 55–83% of the total fatty acid content but variable amounts of linoleic acid (3–21%) and linolenic acid (<1%) may also be present [44], and these latter are more subject to lipid oxidation than oleic acid. The analysis of the heated frying oil alone gave some hexanal but at very much lower levels than those obtained from the meat samples. Octanal and nonanal, which are the characteristic products of the oxidation of oleic acid [43] were unaffected by the cooking method, suggesting that this was not the primary cause of the observed differences. All the observed n-aldehydes are the products of the thermal degradation of linoleic acid but pentanal and hexanal may also be derived from arachidonic acid [43]. It is possible that the greater comminution of the stewed meat allows a greater breakdown of the very long chain fatty acids in the phospholipids.
The increases in some Maillard and lipid oxidation products suggest that stewing provides an environment conducive to both certain oxidation reactions and the facilitation of subsequent chemical transformations. This may be influenced not only by the greater access of oxygen to the surface of the stewed meat during browning, but also by the presence of free radical intermediates from the heated oil, contact with aqueous pro-oxidants, anti-oxidants, or other components from the meat and vegetables, and the role of water and extended time in facilitating further reactions of the primary volatile products. Further study of each stage of the cooking process would be needed to elucidate the mechanisms concerned.
Similar results have been reported by other researchers. Legako et al. investigated the volatile compounds and consumer palatability scores for four beef muscles (Longissimus lumborum, Psoas major, Semimembranosus, and Gluteus medius) and five USDA quality grades (Prime, Upper 2/3 Choice, Low Choice, Select, and Standard), demonstrating that these measures of meat quality did not have a direct impact on consumer ratings or volatile compounds. However, significant interactions between muscle type and quality were identified, along with differences in ratings and volatile compounds among muscles.

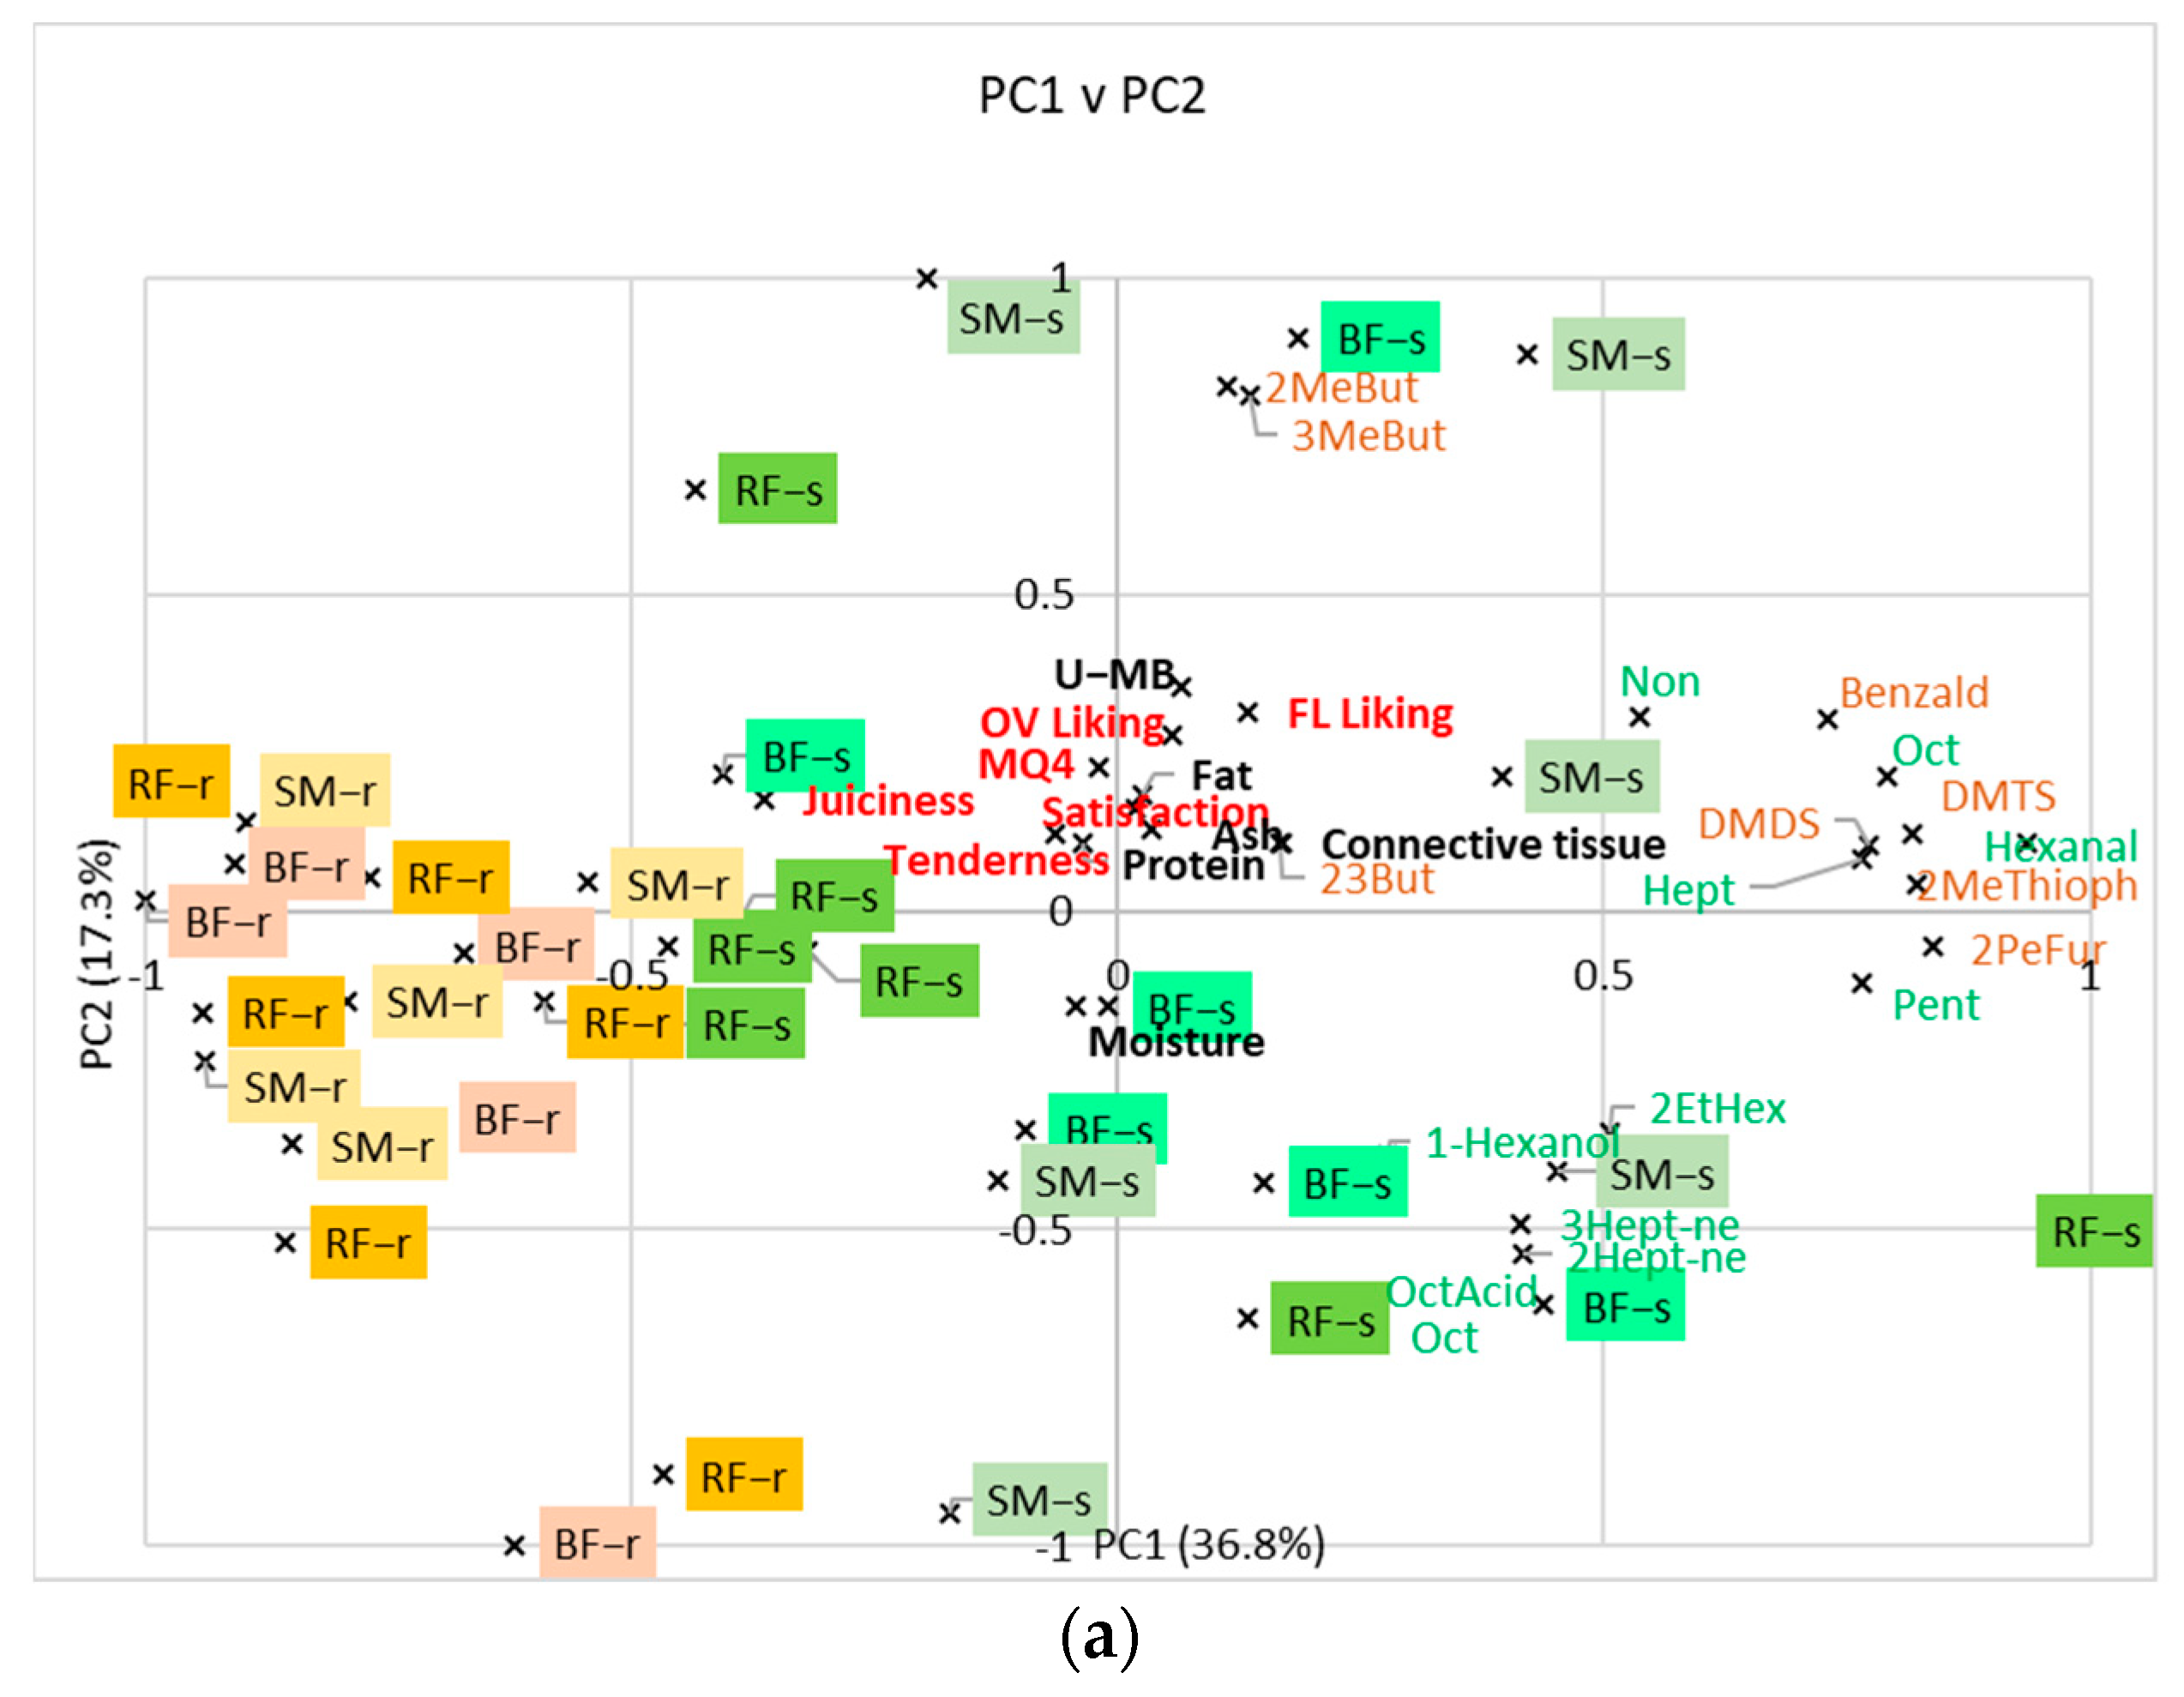
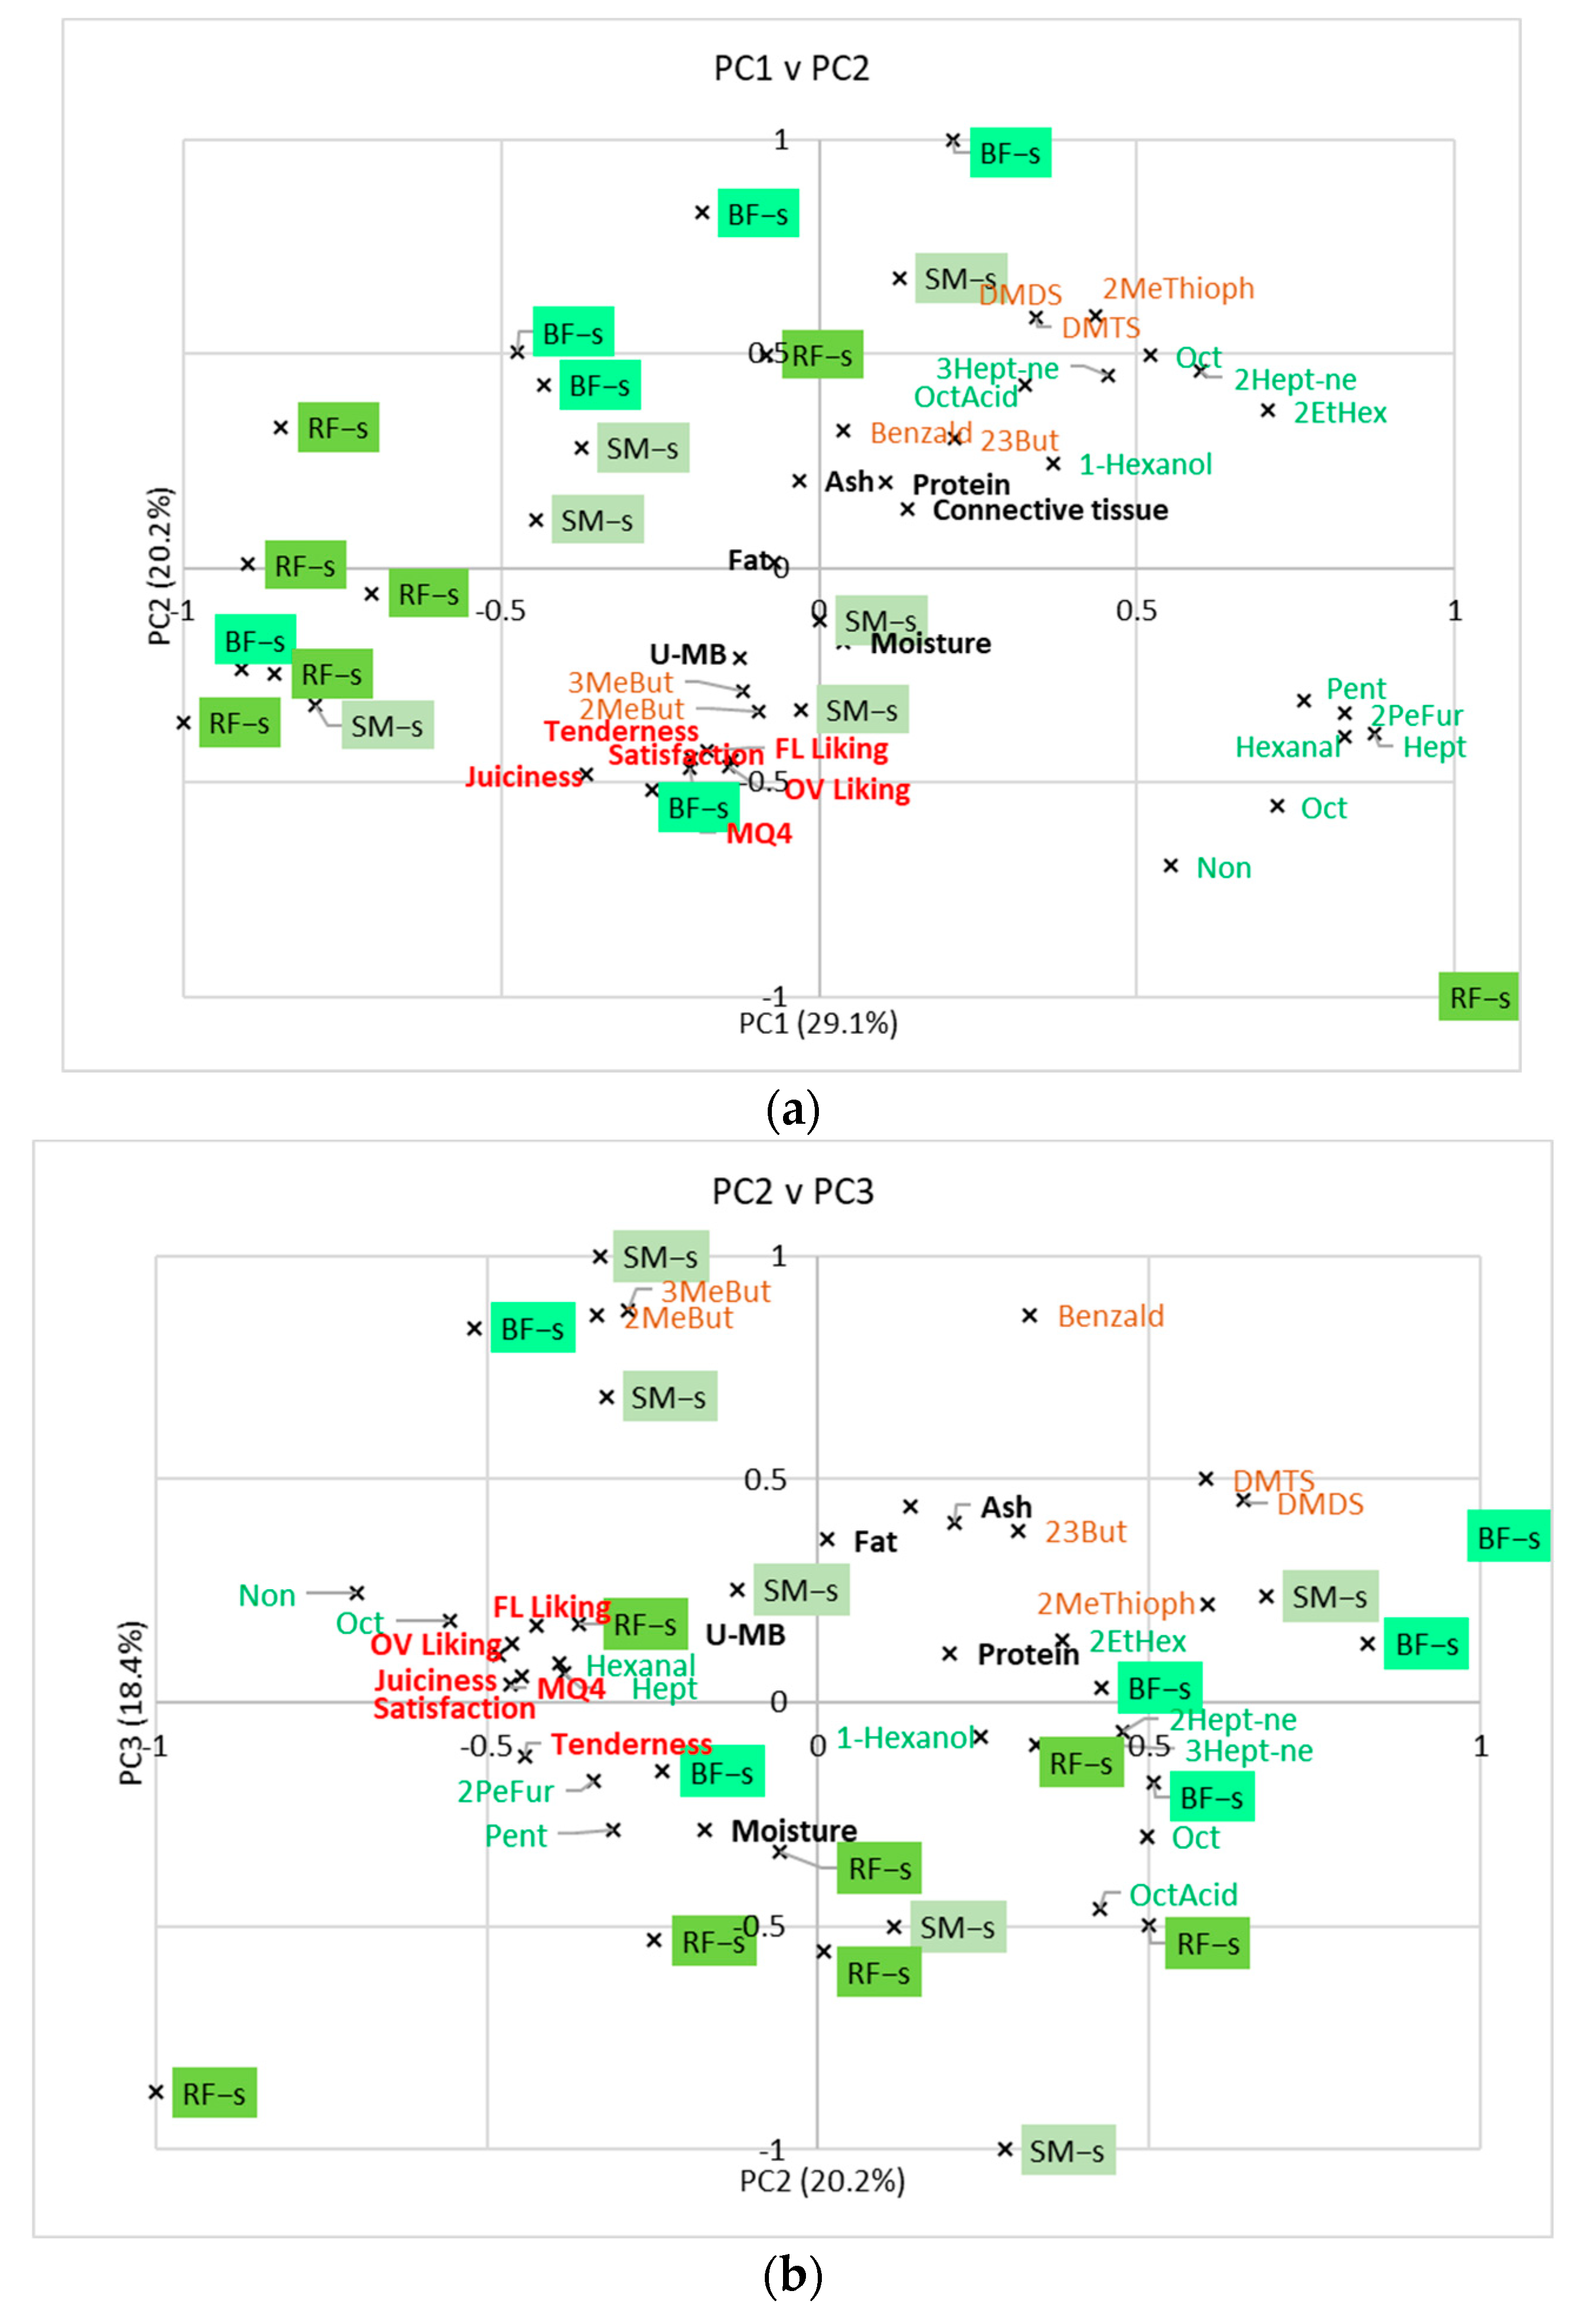
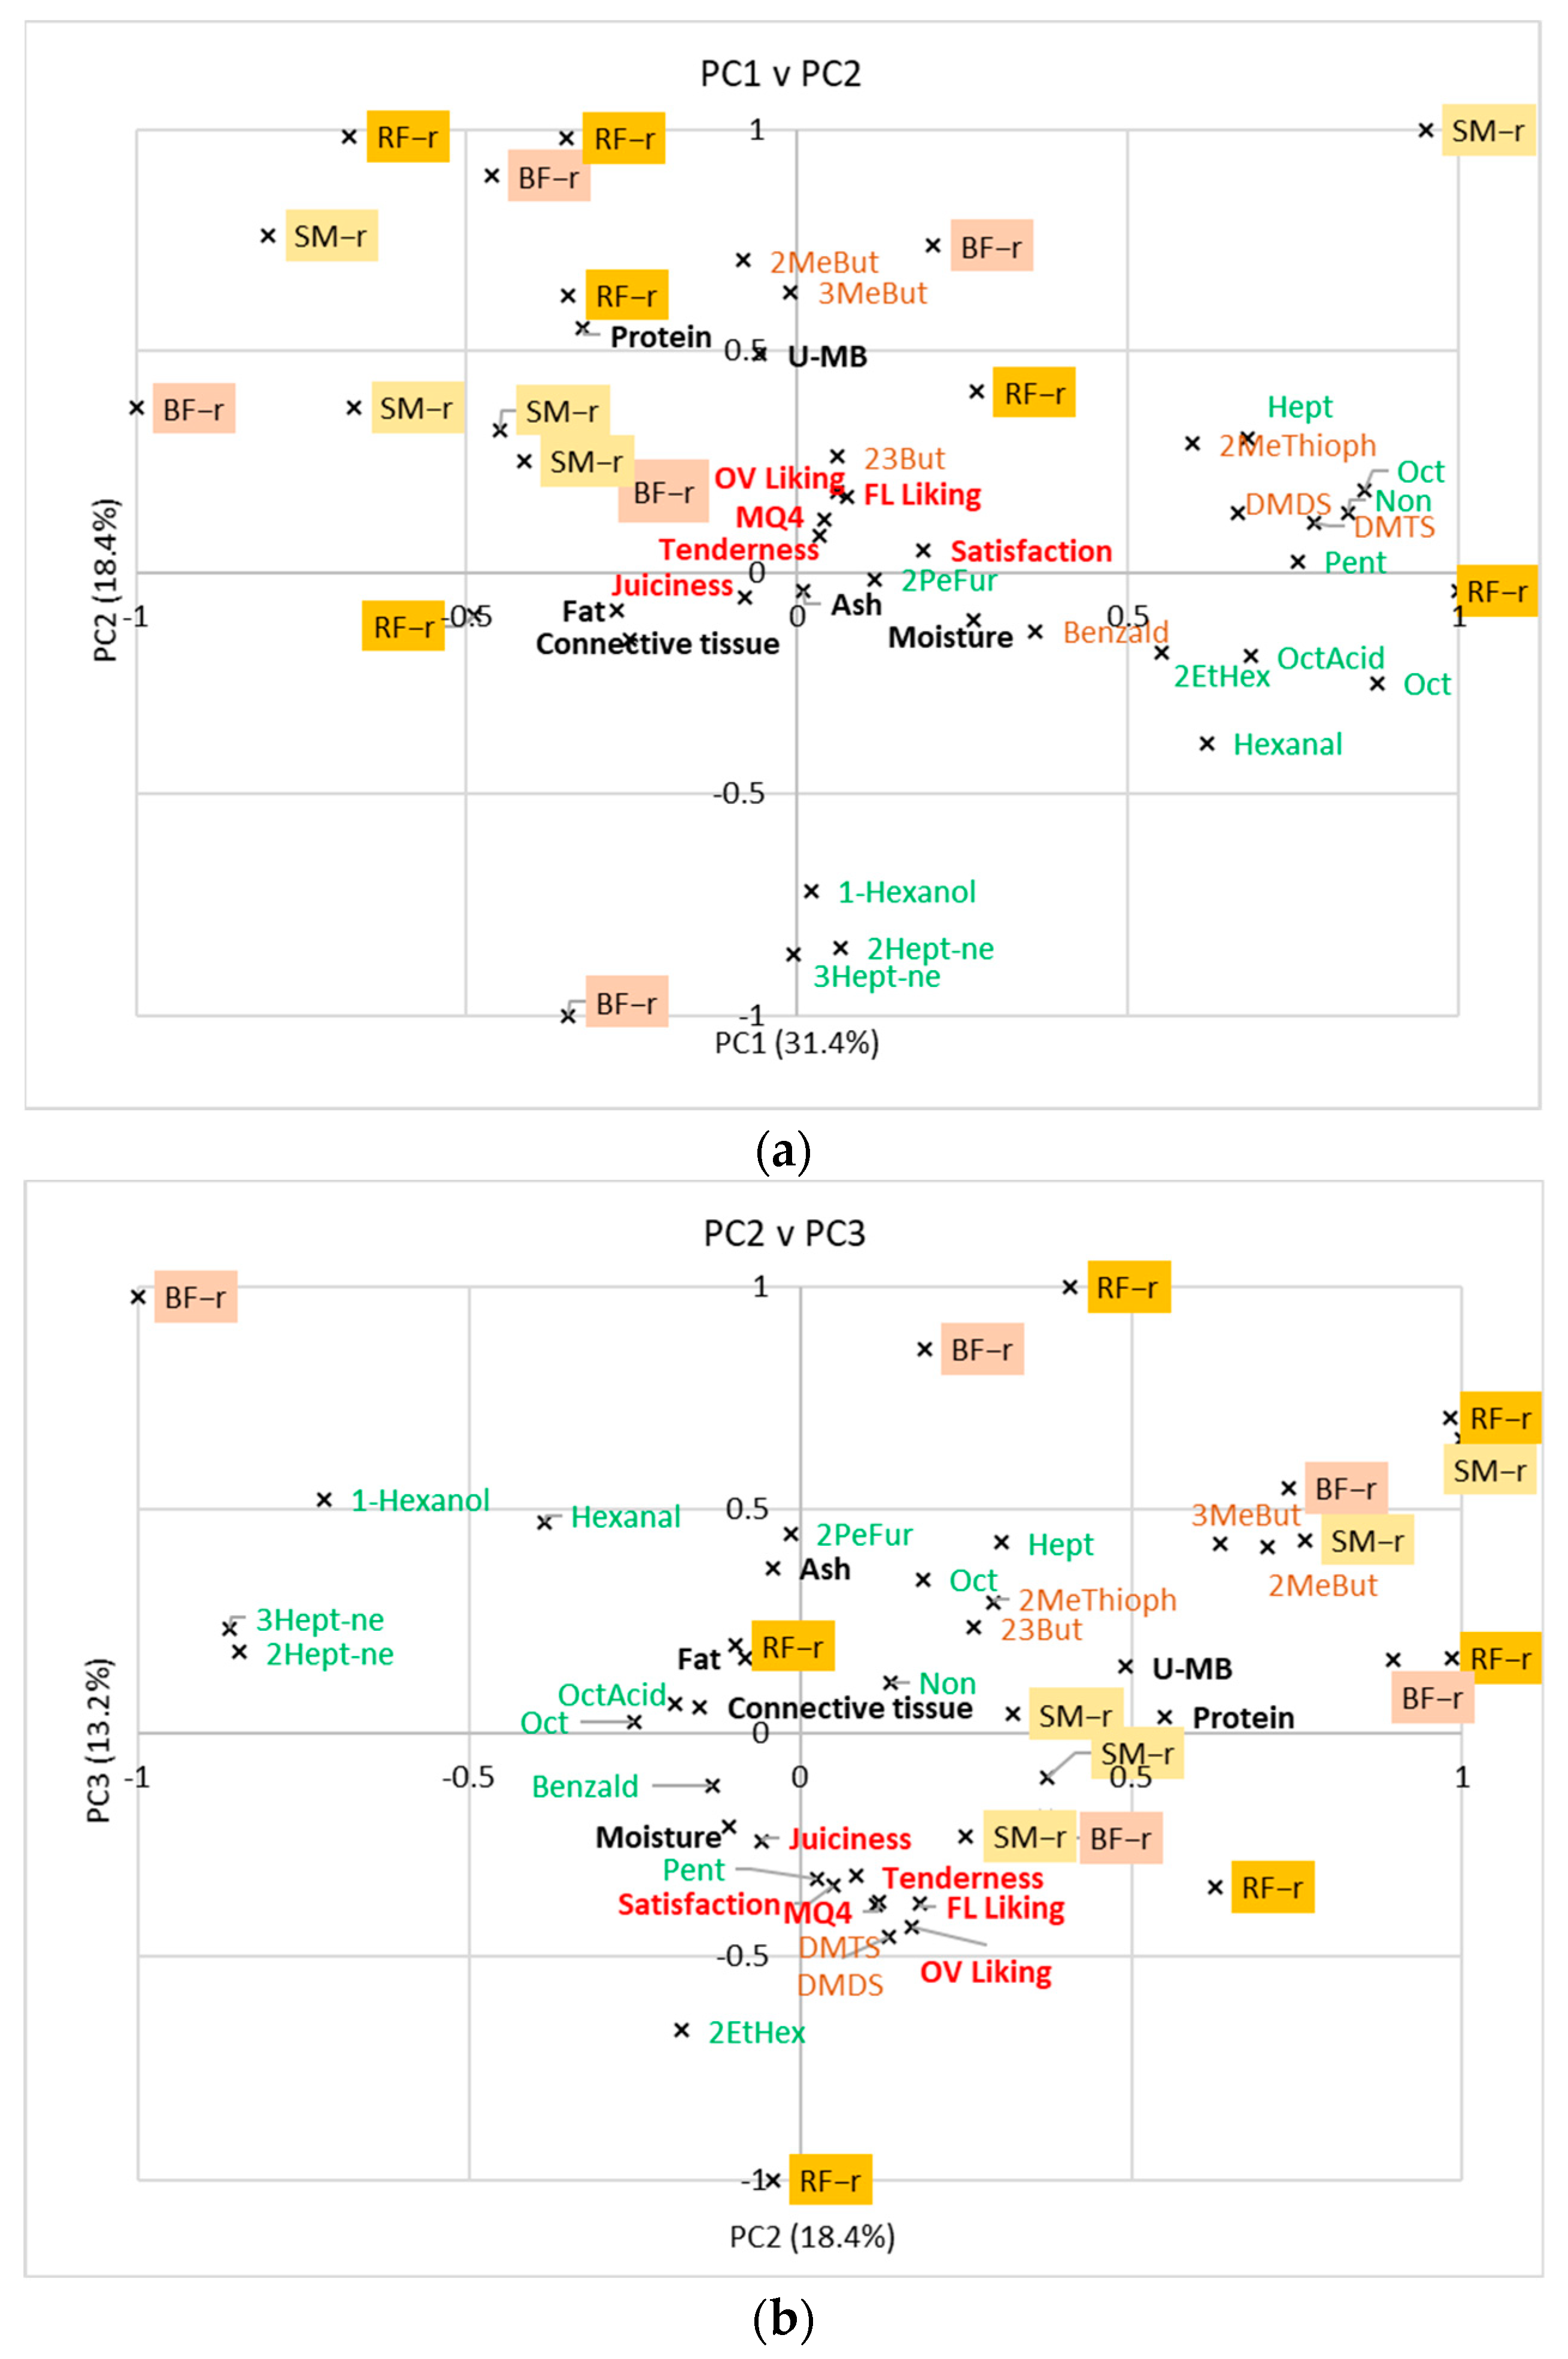
3.4. Relationship between Volatile Compounds, Consumer Scores, and Compositional Analyses

External preference maps were created to visualize the relationships between the groups of volatile compounds, sensory quality, and other measurements (Figure 3, Figure 4 and Figure 5). An external preference map for volatile compounds in all cook x muscle treatments (excluding one outlier) explained 66.5% of the variation in the first three principal components (PC; Figure 3a,b). PC1 (36.8%; Figure 3a) differentiates mainly between the two cooking methods on the basis of the quantity of volatiles detected, with most compounds detected to the right of the plot indicating that they were higher in the stewed beef. PC2 and 3 (17.3% and 12.4%, Figure 3b) separate the samples on the basis of the classes of volatile compounds, with most lipid oxidation products (green) to the bottom left and most Maillard products (brown) to the top right of the plot. The stewed beef rather than the roasted beef was associated with Maillard products due to the preparation and sampling methods; the stewed beef was browned before stewing, so some high-temperature compounds would have formed, and the high-temperature Maillard products generated at the surface of the roasted meat would have been lost due to the trimming of the outer surfaces. Flavor liking and overall liking tend to be located to the right side of Figure 3b (to the positive side of PC2), with UMb (USDA marbling score), and are not clearly associated with either of the cooking methods.
There is very little separation of muscles and Figure 3 is dominated by the large differences between the two cooking methods. For this reason, the preference maps were also conducted for the stewed and roasted beef separately (Figure 4 and Figure 5), with three PCs accounting for 68% and 63% of the variation, respectively. Again, PC1 (Figure 4a and Figure 5a) separates the samples mainly on the basis of the overall quantities of volatiles, while PC2 v PC3 (Figure 4b and Figure 5b) separate samples on the basis of the compound group (Maillard products versus lipid oxidation products). Even considering the cooking methods individually, there is no clear separation of muscles and there are no consistent associations between compositional analytes and volatiles. However, the Maillard products (brown) tend to be distinct from the lipid oxidation products (green) in Figure 3b, Figure 4b and Figure 5b. This tendency for compounds from similar reaction pathways to be associated confirms previous results [15,18,34] and is the basis of using marker compounds to represent the different compound classes.
The relationship of the volatile compounds with consumer scores and physicochemical characteristics will be considered by compound class:
  • n-aldehydes
Surprisingly, the significantly higher levels of pentanal and hexanal in the stewed beef were not mirrored by heptanal, octanal, and nonanal, which showed no significant differences (Table 3). The formation of all these n-aldehydes involves the thermal and oxidative degradation of lipids [45]. Hexanal and pentanal are located at a distance from the consumer liking scores on PC1 for stewed and roasted beef (Figure 4a and Figure 5a). This is consistent with the fact that hexanal and pentanal flavors are perceived as unpleasant, rancid, and similar to the aroma of green leaves or vegetables [46]. Jiang [47] noted that pentanal concentration was positively correlated with the intensity of off-flavor in grilled ground beef. Heptanal, octanal, and nonanal, derived from the oxidation of linoleic acid, tend to have green, fatty aromas but not especially low thresholds. However, they have been shown to be associated with other products of this pathway such as 2,4-decadienal, 1-octen-3-ol [28,48], and with off-flavors believed to arise from minor volatile components of the same pathway [48]. Thus, these n-aldehydes generally act as characteristic markers for a range of odor compounds and less desirable flavors.
  • Strecker aldehydes
Three volatile Strecker aldehydes were reported as follows: 3-methylbutanal, 2-methylbutanal, and benzaldehyde, though this last may also be formed by other pathways. In the case of benzaldehyde, statistically significantly higher levels (p < 0.05) were observed in the stewed than in the roasted beef. In previous studies, a relationship between Strecker aldehydes and acceptability scores for grilled beef was observed [24]. Both 3-methylbutanal and 2-methylbutanal were located to the right of Figure 3b, in the same direction as flavor liking and overall liking, suggesting that a relationship between these compounds and desirable flavor occurs, albeit weakly. A comparison of Figure 4 and Figure 5 confirms that this relationship is only evident for the stewed and not the roasted beef. As mentioned above, this is likely due to the sampling method for the roast beef in which the high temperature-treated surface layers, where the formation of Strecker aldehydes would be favored, were discarded. Thus, these data show that Strecker aldehydes are good markers for flavor liking for grilled and stewed meat, where browning has occurred, as reported previously for grilled steaks [24,28], but not for the center meat of roasted cuts. Additional marker compounds need to be identified for this meat.
  • Ketones
Heptan-2-one and heptan-3-one were located at the opposite sides of the preference maps to the liking scores for both the stewed and roasted meat (Figure 4 and Figure 5). These compounds were not significantly affected by either the muscle or cooking method but may be differentiating different flavor qualities. These compounds are formed from lipid oxidation pathways and, while they have relatively high odor thresholds and are unlikely to contribute substantially to meat flavor [39], they may be acting as markers for other oxidation products conferring undesirable flavors. 2,3-butanedione does not show any consistent relationship with sensory scores.
  • Sulfur compounds
Sulfur compounds possess low odor thresholds [48] and are important contributors to the flavor profile of cooked beef [49]. Dimethyl disulfide and dimethyl trisulfide were associated with a dislike of flavor by the consumers in Figure 4a,b and Figure 5a. This effect was considerably greater in the stewed meat, presumably due to the very much higher concentrations of these compounds from this cooking method. Dimethyl trisulfide (cabbage-like/sour) and dimethyl disulfide (hay-like) play an important role in meaty and fatty flavor [48]. The sources of dimethyl disulfide and dimethyltrisulphide are sulfur-containing amino acids such as methionine and cysteine [50]. These flavor precursors are also one source of key odor impact compounds in beef such as 2-methyl-3-furanthiol and related compounds [28], which confer a roasted meaty flavor. These compounds are present at very low concentrations and are difficult to detect using standard GC-MS methods. However, their common origin may explain the apparent positive relationship between dimethyl disulfide, dimethyl trisulfide, and flavor liking for the roasted samples, where the levels are quite low (Figure 5b). However, recent research has found that dimethyldisulphide and dimethyltrisulphide may be decreased by the presence of Maillard-derived thiols such as 2-methyl-3-furanthiol [40] and this may explain the partial association with consumer flavor liking here and in other studies [28]. For the stewed samples, the very much higher concentrations of dimethyl disulfide and dimethyl trisulfide may confer an off-flavor and have a detrimental effect (Figure 4b).

4. Conclusions

The cooking method has distinct effects on the volatile compounds formed in beef meat, with greater quantities formed in the stewed beef than in the inner part of the roast beef. The analysis of marker compounds may suggest the compound groups responsible for perceived flavor differences caused by cooking. Hexanal, pentanal, and 2-pentylfuran can be perceived as markers for certain lipid oxidation compounds while dimethyl disulphide, dimethyl trisulphide, 3- and 2-methylbutanal, and benzaldehyde are markers for the different pathways of the Maillard reaction. Greater quantities of both compound groups appear to be characteristic of stewing rather than roasted beef. Consumer panels differentiated clearly between muscles, while the differences in volatiles were less clear. It is possible that texture attributes and taste compounds also play a part in the sensory differentiation of muscles. The highest consumer scores for tenderness, MQ4, satisfaction, and flavor were noted for RF muscle in the case of both the stewed and roasted beef. Lipid oxidation compounds such as heptanones appear to be markers for disliked flavor, while Strecker aldehydes can be associated with the desirable flavor of beef cooking methods involving browning but not the center meat of roast beef. Dimethyl disulphide and dimethyl trisulphide are associated with desirability in roasted meat but undesirability in stewed meat. This work shows that it is possible to understand flavor differences between cooking techniques through the analysis of volatile flavor compounds in association with palatability and other chemical measurements. A more detailed study of the factors affecting precursors, taste compounds, and other meat components affecting flavor, together with textural parameters, may help to elucidate further the role of muscle and cooking methods on flavor formation.

Supplementary Materials

The following supporting information can be downloaded at: https://www.mdpi.com/article/10.3390/app14114477/s1, Figure S1: Consumer Research Plan Chart.

Author Contributions

Conceptualization, I.W.-K.; methodology, I.W.-K., L.J.F. and R.P.; software, I.W.-K.; formal analysis, I.W.-K., L.J.F. and A.W.G.; investigation, I.W.-K., T.D.J.H. and G.P.; writing—original draft preparation, I.W.-K. and L.J.F.; writing—review and editing, I.W.-K. and L.J.F.; visualization, I.W.-K.; supervision, I.W.-K., A.W. and A.P. All authors have read and agreed to the published version of the manuscript.

Funding

The research was financed by the Polish Ministry of Science and Higher Education with funds from the Department of Technique and Food Development, Warsaw University of Life Sciences (WULS) for scientific research. The research was performed within the project no WND-POIG.01.03.01-00-204/09 Optimizing Beef Production in Poland According to “From Fork to Farm” strategy co-financed by the European Regional Development Fund under the Innovative Economy Operational Programme 2007–2013.

Institutional Review Board Statement

Not applicable.

Informed Consent Statement

Not applicable.

Data Availability Statement

The data presented in this study are available upon request from the corresponding author. The data are not publicly available due to privacy.

Conflicts of Interest

Author Rod Polkinghorne was employed by the company Birkenwood Pty Ltd. The remaining authors declare that the research was conducted in the absence of any commercial or financial relationships that could be construed as a potential conflict of interest.

References

  1. Barbin, D.F.; Elmasry, G.; Sun, D.; Allen, P. Non-Destructive Determination of Chemical Composition in Intact and Minced Pork Using near-Infrared Hyperspectral Imaging. Food Chem. 2013, 138, 1162–1171. [Google Scholar] [CrossRef] [PubMed]
  2. Polkinghorne, R.A.; Thompson, J.M.B.; Watson, R.C.; Gee, A.D.; Porter, M.E. Evolution of the Meat Standards Australia (MSA) Beef Grading System. Aust. J. Exp. Agric. 2008, 48, 1351–1359. [Google Scholar] [CrossRef]
  3. Huffman, K.L.; Miller, M.F.; Hoover, L.C.; Wu, C.K.; Brittin, H.C.; Ramsey, C.B. Effect of Beef Tenderness on Consumer Satisfaction with Steaks Consumed in the Home and Restaurant. J. Anim. Sci. 1996, 74, 8778116. [Google Scholar] [CrossRef]
  4. Miller, M.F.; Carr, M.A.; Ramsey, C.B.; Crockett, K.L.; Hoover, L.C. Consumer Thresholds for Establishing the Value of Beef Tenderness. J. Anim. Sci. 2001, 79, 3062–3068. [Google Scholar] [CrossRef] [PubMed]
  5. Pogorzelski, G.; Woźniak, K.; Polkinghorne, R.; Półtorak, A.; Wierzbicka, A. Polish Consumer Categorisation of Grilled Beef at 6 Mm and 25 mm Thickness into Quality Grades, Based on Meat Standards Australia Methodology. Meat Sci. 2020, 161, 107953. [Google Scholar] [CrossRef] [PubMed]
  6. Domínguez, R.; Gómez, M.; Fonseca, S.; Lorenzo, J.M. Influence of Thermal Treatment on Formation of Volatile Compounds, Cooking Loss and Lipid Oxidation in Foal Meat. LWT—Food Sci. Technol. 2014, 58, 439–445. [Google Scholar] [CrossRef]
  7. Chiavaro, E.; Rinaldi, M.; Vittadini, E.; Barbanti, D. Cooking of Pork Longissimus Dorsi at Different Temperature and Relative Humidity Values: Effects on Selected Physico-Chemical Properties. J. Food Eng. 2009, 93, 158–165. [Google Scholar] [CrossRef]
  8. Meinert, L.; Andersen, L.T.; Bredie, W.L.P. Chemical and Sensory Characterisation of Pan-Fried Pork Flavour: Interactions between Raw Meat Quality, Ageing and Frying Temperature. Meat Sci. 2007, 75, 229–242. [Google Scholar] [CrossRef]
  9. Meinert, L.; Schäfer, A.; Bjergegaard, C.; Aaslyng, M.D.; Bredie, W.L.P. Comparison of Glucose, Glucose 6-Phosphate, Ribose, and Mannose as Flavour Precursors in Pork; the Effect of Monosaccharide Addition on Flavour Generation. Meat Sci. 2009, 81, 419–425. [Google Scholar] [CrossRef] [PubMed]
  10. Van Ba, H.; Amna, T.; Hwang, I. Significant in Fl Uence of Particular Unsaturated Fatty Acids and PH on the Volatile Compounds in Meat-like Model Systems. Meat Sci. 2013, 94, 480–488. [Google Scholar] [CrossRef]
  11. Majcher, M.A.; Jeleń, H.H. Effect of Cysteine and Cystine Addition on Sensory Profile and Potent Odorants of Extruded Potato Snacks. J. Agric. Food Chem. 2007, 55, 5754–5760. [Google Scholar] [CrossRef] [PubMed]
  12. Cerny, C.; Davidek, T. Formation of Aroma Compounds from Ribose and Cysteine during the Maillard Reaction. J. Agric. Food Chem. 2003, 51, 2714–2721. [Google Scholar] [CrossRef] [PubMed]
  13. Claeys, E.; De Smet, S.; Balcaen, A.; Raes, K.; Demeyer, D. Quantification of Fresh Meat Peptides by SDS—PAGE in Relation to Ageing Time and Taste Intensity. Meat Sci. 2004, 67, 281–288. [Google Scholar] [CrossRef] [PubMed]
  14. Ogasawara, M.; Katsumata, T.; Egi, M. Taste Properties of Maillard-Reaction Products Prepared from 1000 to 5000 Da Peptide. Food Chem. 2006, 99, 600–604. [Google Scholar] [CrossRef]
  15. Gerber, N.; Scheeder, M.R.L.; Wenk, C. The Influence of Cooking and Fat Trimming on the Actual Nutrient Intake from Meat. Meat Sci. 2009, 81, 148–154. [Google Scholar] [CrossRef] [PubMed]
  16. Mottram, D.S. Flavour Formation in Meat and Meat Products. Food Chem. 1998, 62, 415–424. [Google Scholar] [CrossRef]
  17. Soncin, S.; Chiesa, L.M.; Cantoni, C.; Biondi, P.A. Preliminary Study of the Volatile Fraction in the Raw Meat of Pork, Duck and Goose. J. Food Compos. Anal. 2007, 20, 436–439. [Google Scholar] [CrossRef]
  18. Sitz, B.M.; Calkins, C.R.; Feuz, D.M.; Umberger, W.J.; Eskridge, K.M. Consumer Sensory Acceptance and Value of Domestic, Canadian, and Australian Grass-Fed Beef Steaks 1. J. Anim. Sci. 2005, 83, 2863–2868. [Google Scholar] [CrossRef]
  19. Chevance, F.F.; Farmer, L.J. Release of Volatile Odor Compounds from Full-Fat and Reduced-Fat. J. Agric. Food Chem. 1999, 47, 5161–5168. [Google Scholar] [CrossRef]
  20. Domínguez, R.; Gómez, M.; Fonseca, S.; Lorenzo, J.M. Effect of Different Cooking Methods on Lipid Oxidation and Formation of Volatile Compounds in Foal Meat. Meat Sci. 2014, 97, 223–230. [Google Scholar] [CrossRef]
  21. Dubost, A.; Micol, D.; Picard, B.; Lethias, C.; Andueza, D.; Bauchart, D.; Listrat, A. Structural and Biochemical Characteristics of Bovine Intramuscular Connective Tissue and Beef Quality. Meat Sci. 2013, 95, 555–561. [Google Scholar] [CrossRef] [PubMed]
  22. Li, C.B.; Zhou, G.H.; Xu, X.L. Dynamical Changes of Beef Intramuscular Connective Tissue and Muscle Fiber during Heating and Their Effects on Beef Shear Force. Food Bioprocess Technol. 2010, 3, 521–527. [Google Scholar] [CrossRef]
  23. Rasinska, E.; Rutkowska, J.; Czarniecka-Skubina, E.; Tambor, K. Effects of Cooking Methods on Changes in Fatty Acids Contents, Lipid Oxidation and Volatile Compounds of Rabbit Meat. LWT—Food Sci. Technol. 2019, 110, 64–70. [Google Scholar] [CrossRef]
  24. Farmer, L.; Hagan, T.D.J.; Devlin, Y.; Gordon, A.; Oltra, O. Relationships between Beef Aroma Compounds and Other Quality Attributes. In Proceedings of the International Congress on Meat Science and Technology, Montreal, QC, Canada, 12–17 August 2012; p. 2012. [Google Scholar]
  25. Watson, R. Consumer Assessment of Eating Quality—Development of Protocols for Meat Consumer Assessment of Eating Quality—Development of Protocols for Meat Standards Australia (MSA) Testing. Aust. J. Exp. Agric. 2008, 48, 1360–1367. [Google Scholar] [CrossRef]
  26. USDA United States Standards for Grades of Carcass Beef; Agricultural Marketing Service (Ed.) U.S. Department of Agriculture: Washington, DC, USA, 2017. [Google Scholar]
  27. Wyrwisz, J.; Moczkowska; Kurek, M.; Stelmasiak, A.; Półtorak, A.; Wierzbicka, A. Influence of 21 Days of Vacuum-Aging on Color, Bloom Development, and WBSF of Beef Semimembranosus. Meat Sci. 2016, 122, 48–54. [Google Scholar] [CrossRef]
  28. Legako, J.F.; Brooks, J.C.; Quinn, T.G.O.; Hagan, T.D.J.; Polkinghorne, R.; Farmer, L.J.; Miller, M.F. Consumer Palatability Scores and Volatile Beef Flavor Compounds of Five USDA Quality Grades and Four Muscles. Meat Sci. 2015, 100, 291–300. [Google Scholar] [CrossRef]
  29. Modzelewska-Kapituła, M.; Dąbrowska, E.; Jankowska, B.; Kwiatkowska, A.; Cierach, M. The Effect of Muscle, Cooking Method and Final Internal Temperature on Quality Parameters of Beef Roast. Meat Sci. 2012, 91, 195–202. [Google Scholar] [CrossRef]
  30. Jeremiah, L.E.; Dugan, M.E.R.; Aalhus, J.L.; Gibson, L.L. Assessment of the Chemical and Cooking Properties of the Major Beef Muscles and Muscle Groups. Meat Sci. 2003, 65, 985–992. [Google Scholar] [CrossRef]
  31. Offer, G.; Knight, P. The Structural Basis of Water-Holding in Meat. Part 2: Drip Loss; Lawrie, R., Ed.; Elsevier Applied Science: London, UK, 1988; Volume 4. [Google Scholar]
  32. Huff-Lonergan Elisabeth, L.S.M. Mechanisms of Water-Holding Capacity of Meat: The Role of Postmortem Biochemical and Structural Changes. Meat Sci. 2005, 71, 194–204. [Google Scholar] [CrossRef]
  33. Chen, J.; Stokes, J.R. Rheology and Tribology: Two Distinctive Regimes of Food Texture Sensation. Trends Food Sci. Technol. 2012, 25, 4–12. [Google Scholar] [CrossRef]
  34. Zhu, X.; Yang, C.; Song, Y.; Qiang, Y.; Han, D.; Zhang, C. Changes Provoked by Altitudes and Cooking Methods in Physicochemical Properties, Volatile Profile, and Sensory Characteristics of Yak Meat. Food Chem. X 2023, 20, 101019. [Google Scholar] [CrossRef] [PubMed]
  35. Stahnke, L.H. Aroma Components from Dried Sausages Fermented with Staphylococcus Xylosus. Meat Sci. 1994, 38, 39–53. [Google Scholar] [CrossRef] [PubMed]
  36. Granvogl, M.; Beksan, E.; Schieberle, P. New Insights into the Formation of Aroma-Active Strecker Aldehydes from 3-Oxazolines as Transient Intermediates. J. Agric. Food Chem. 2012, 60, 6312–6322. [Google Scholar] [CrossRef] [PubMed]
  37. Utama, D.T.; Baek, K.H.; Jeong, H.S.; Yoon, S.K.; Joo, S.; Lee, S.K. Effects of Cooking Method and Final Core-Temperature on Cooking Loss, Lipid Oxidation, Nucleotide-Related Compounds and Aroma Volatiles of Hanwoo Brisket. Asian-Australas. J. Anim. Sci. 2018, 31, 293. [Google Scholar] [CrossRef] [PubMed]
  38. Vernin, G.; Parkanyi, C. Mechanisms of Formation of Heterocyclic Compounds in Maillard and Pyrolysis Reactions. In Chemistry of Heterocyclic Compounds in Flavors and Aromas; Vernin, G., Ed.; Ellis Horwood: Chichester, UK, 1982; pp. 151–207. [Google Scholar]
  39. Mottram, D.S. Meat In Volatile Compounds in Foods and Beverages; Dekker, M., Ed.; Imprint Routledge: New York, NY, USA, 1991. [Google Scholar]
  40. Zhang, Z.; Wang, B.; Cao, Y. Effect of Maillard Reaction Products Derived From Cysteine On the Formation of Dimethyl Disulfide and Dimethyl Trisulfide During Storage. J. Agric. Food Chem. 2023, 71, 13043–13053. [Google Scholar] [CrossRef] [PubMed]
  41. Kreitman, G.Y.; Danilewicz, J.C.; Jeffery, D.W.; Elias, R.J. Copper (II) Mediated Hydrogen Sulfide and Thiol Oxidation to Disulfides and Organic Polysulfanes, and Their Reductive Cleavage in Wine: Mechanistic Elucidation and Potential Applications Copper (II) Mediated Hydrogen Sulfide and Thiol Oxidation to D. J. Agric. Food Chem. 2017, 65, 2564–2571. [Google Scholar] [CrossRef] [PubMed]
  42. Hartman, G.J.; Scheide, J.D.; Ho, C.-T. Effect of Water Activity on the Major Volatiles Produced in a Model System Approximating Cooked Meat. J. Food Sci. 1984, 49, 607–613. [Google Scholar] [CrossRef]
  43. Grosch, W. Lipid Degradation Products and Flavour in Food Flavours; Morton, I.D., Mac-Lend, A.J., Eds.; Elsevier Science: Amsterdam, The Netherlands, 1982. [Google Scholar]
  44. Hernández, M.L.; Sicardo, M.D.; Belaj, A. The Oleic/Linoleic Acid Ratio in Olive (Olea europaea L.) Fruit Mesocarp Is Mainly Controlled by OeFAD2-2 and OeFAD2-5 Genes Together With the Different Specificity of Extraplastidial Acyltransferase Enzymes. Front. Plant Sci. 2021, 12, 653997. [Google Scholar] [CrossRef] [PubMed]
  45. Shi, H.; Ho, C.T. The Flavour of Poultry Meat. In Flavor of Meat and Meat ProductsMeat Products; Shahidi, F., Ed.; Blackie Academic and Professional: Glasgow, UK, 1994; pp. 52–69. [Google Scholar]
  46. Górska, E.; Nowicka, K.; Jaworska, D.; Przybylski, W.; Tambor, K. Relationship between Sensory Attributes and Volatile Compounds of Polish Dry-Cured Loin. Asian-Australas. J. Anim. Sci. 2017, 30, 720–727. [Google Scholar] [CrossRef]
  47. Jiang, S.; Xia, D.; Wang, X.; Zhu, Y.; Chen, G.; Liu, Y. Analysis of Aroma-Active Compounds in Four Chinese Dry-Cured Hams Based on GC-O Combined with AEDA and Frequency Detection Methods. LWT—Food Sci. Technol. 2022, 153, 112497. [Google Scholar] [CrossRef]
  48. Farmer, L.; Hagan, T.D.J.; Oltra, O.R.; Devlin, Y.; Gordon, A. Relating Beef Aroma Compounds to Flavour Precursors and Other Measures of Quality. In Current Topics in Flavor Chemistry & Biology, Proceedings of the Wartburg Flavour Symposium Wartburg Symposium on Flavor Chemistry and Biology, Eisenach, Germany, 16–19 April 2013; Hofmann, T., Krautwurst, D., Schieberle, P., Eds.; Deutsche Forschungsanstalt für Lebensmittelchemie: Garching, Germany, 2013. [Google Scholar]
  49. Manley, C.H. Progress in the Science of Thermal Generation of Aromas: A Review. In Thermal Generation of Aromas; Parliment, T.H., McGorrin, R.J., Ho, C.T., Eds.; American Chemical Society: Washington, DC, USA, 1989; Volume 409, pp. 12–22. ISBN 9780841216822. [Google Scholar]
  50. Insausti, K.; Gon, V.; Petri, E.; Gorraiz, C.; Beriain, M.J. Effect of Weight at Slaughter on the Volatile Compounds of Cooked Beef from Spanish Cattle Breeds. Meat Sci. 2005, 70, 83–90. [Google Scholar] [CrossRef] [PubMed]
Figure 1. (a) Mean consumer score for FL—flavor, TE—tenderness, JU—juiciness, L—overall flavor, and MQ—MQ4 depending on the applied heat treatment. (b) Mean consumer score for SAT—satisfaction depending on the applied heat treatment. $ SM—Semimembranosus; BF—Biceps femoris; RF—Rectus femoris. a,b,c Values within an attribute that do not share a common superscript are significantly different (p < 0.05).
Applsci 14 04477 g001aApplsci 14 04477 g001b
Figure 2. (a) Volatile compound content (ng/g) in the muscles depending on the applied heat treatment for Benz—Benzaldehyde, DMDS—dimethyl disulphide, and DMTS—dimethyl trisulfide. (b) Volatile compound content (ng/g) in the muscles depending on the applied heat treatment for 2Methioph—2-Methyl thiophene and 2PeFur—2-Pentyl furan. $ SM—Semimembranosus; BF—Biceps femoris; RF—Rectus femoris. a,b,c Values for one compound that do not share a common superscript are significantly different (p < 0.05).
Applsci 14 04477 g002
Figure 3. (a) External preference map of stewed and roasted beef samples based on quantities of volatile compounds collected, with consumer scores and compositional analyses plotted on the same axes (PC1 vs. PC2). Abbreviations: SM-s—Semimembranosus, stewed; BF-s—Biceps femoris, stewed; RF-s—Rectus femoris, stewed; SM-r—Semimembranosus, roasted; BF-r—Biceps femoris, roasted; RF-r—Rectus femoris, roasted; DMDS—Dimethyl disulfide; DMTS—Dimethyl trisulfide; 2MeBut—Butanal. 2-methyl; 3MeBut—Butanal. 3-methyl; 23But—2.3-butandione; Pent—Pentanal; 2MeThioph—2-methyl thiophene; 3Hept-ne—3-Heptanone; 2Hept-ne;—2-heptanone; Hept—Heptanal; Benz—benzaldehyde; 2PeFur—2-Pentyl furan; Oct—Octanal; 2EtHex—2 ethyl hexanol; Non—nonanal; Oct—octanal; OctAcid—Octanoic acid; Fl liking—flavor liking; UMb—USDA marbling score. (b) External preference map of stewed and roasted beef samples based on quantities of volatile compounds collected, with consumer scores and compositional analyses plotted on the same axes (PC2 vs. PC3). Abbreviations: see Figure 3a.
Applsci 14 04477 g003aApplsci 14 04477 g003b
Figure 4. (a) External preference map of stewed beef samples only (PC1 vs. PC2). Abbreviations: see Figure 3a. (b) External preference map of stewed beef samples only (PC2 vs. PC3). Abbreviations: see Figure 3a.
Applsci 14 04477 g004
Figure 5. (a) External preference map of roasted beef samples only (PC1 vs. PC2). Abbreviations: see Figure 3a. (b) External preference map of roasted beef samples only (PC2 vs. PC3). Abbreviations: see Figure 3a.
Applsci 14 04477 g005
Table 1. Composition of consumer panelists assessing stewed and roasted beef (% distribution).
Cooking Method:StewingRoasting
Total number of consumers180180
Gender [%]
Women5754
Men4346
Age [%]
<20106
20–255045
26–301312
31–391115
40–50109
>50613
Professions [%]
Students1919
Office worker2331
Laboratory technicians67
Sales/Services127
Worker96
Teacher105
Trader34
Housewives13
Other occupational1616
Unemployed12
Eating beef frequency [%]
Daily10
4–5 per week02
2–3 per week1312
Once a week3324
Once two weeks1924
Once per month3235
Never23
Preferred degree of doneness [%]
Blue33
Rare21
Medium rare24
Medium3223
Medium well4751
Well done1418
Table 2. Mean concentrations # of the main components of the three muscles (% of raw weight), analyzed by ANOVA.
MuscleSM $BFRFSEMp-Value
Fat2.3 b 2.8 b1.1 a0.16<0.001
Moisture73.3 a 73.2 a75.4 b0.22<0.001
Protein23.8 b 23.2 ab22.9 a0.12<0.05
Ash1.4 b 1.5 b1.0 a0.05<0.001
Connective tissue1.3 a1.6 b1.1 a0.05<0.001
ab—values in a row lacking a common superscript differ significantly (p < 0.05). $ SM—Semimembranosus; BF—Biceps femoris; RF—Rectus femoris; SEM—standard error of the mean. # the totals do not sum to exactly 100 because connective tissue also includes protein, and because each of these analyses was conducted independently.
Table 3. Mean consumer scores for palatability attributes for three muscles using two different cooking methods with analysis by ANOVA.
FactorsCooking Method (C)Muscle (M)C×M
StewingRoastingSEMp-vSM $ BFRFSEMp-vp-v
Flavor liking53.147.61.770.12047.8 a43.8 a59.2 b1.81<0.001<0.01
Tenderness45.643.62.870.72935.4 a33.3 a64.3 b2.89<0.001<0.001
Juiciness45.653.42.410.10342.8 a43.3 a61.8 b2.46<0.001<0.01
Overall liking52.047.91.930.29146.6 a41.6 a61.5 b1.97<0.001<0.001
MQ449.847.12.070.51943.2 a40.0 a61.7 b2.10<0.001<0.001
Satisfaction3.02.90.080.5762.8 a2.6 a3.5 b2.10<0.001<0.001
ab—means within a row lacking a common superscript differ (p < 0.05). $ SM—Semimembranosus; BF—Biceps femoris; RF—Rectus femoris. SEM—standard error of the mean; p-v = probability value; MQ4—meat quality, 4 variables.
Table 4. Means amounts of volatile marker compounds (ng/g) collected from three muscles using two different cooking methods, analyzed by ANOVA.
FactorsCooking Method (C)Muscle (M)C.M
StewingRoastingSEMp-vSM $BFRFSEMp-vp-v
n-Aldehydes
Pentanal10.2 b1.5 a1.37<0.0015.83.97.81.370.505<0.05
Hexanal8.2 b2.7 a0.60<0.0015.85.55.20.600.909<0.001
Heptanal0.20.50.100.2300.40.50.20.100.496NS
Octanal0.20.20.000.3780.20.20.20.030.857NS
Nonanal4.63.80.020.3894.04.24.40.410.941NS
Strecker aldehydes
2-Methyl butanal15.915.91.420.98816.318.213.21.420.355NS
3-Methyl butanal28.127.32.230.85728.932.222.22.230.167NS
Benzaldehyde4.1 b2.0 a0.20<0.0013.13.32.70.200.431<0.001
Thiophenes
2-Methyl thiophene0.7 b0.3 a0.07<0.0010.60.60.40.070.572<0.01
Ketones
2.3-Butanedione35.635.54.420.99136.840.829.34.420.563NS
2-Heptanone3.93.20.200.0863.13.93.50.200.366NS
3-Heptanone1.41.60.120.6231.61.61.30.120.569NS
Sulfides
Dimethyl disulfide4.6 b0.2 a0.41<0.0012.72.52.00.410.786<0.001
Dimethyl trisulfide27.3 b0.7 a2.42<0.00115.914.012.22.420.839<0.001
Furans
2-Pentyl furan0.9 b0.1 a0.12<0.0010.60.40.50.120.837<0.01
Alcohols
1-Hexanol0.30.30.040.6250.30.40.20.050.203NS
2-Ethyl hexanol0.00.40.150.1760.30.40.00.150.615NS
Acids
Octanoic acid0.20.20.020.8760.20.20.10.020.798NS
a,b—means within a row lacking a common superscript differ (p < 0.05). $ SM—Semimembranosus; BF—Biceps femoris; RF—Rectus femoris. SEM—standard error of the mean; p-v = probability value; NS—not significant.
Disclaimer/Publisher’s Note: The statements, opinions and data contained in all publications are solely those of the individual author(s) and contributor(s) and not of MDPI and/or the editor(s). MDPI and/or the editor(s) disclaim responsibility for any injury to people or property resulting from any ideas, methods, instructions or products referred to in the content.

