Article

DIC-Based Hydration Absorption Detection and Displacement Field Evolution of Outcrop Porous Sandstone

1
State Key Laboratory for Geomechanics and Deep Underground Engineering, China University of Mining and Technology (Beijing), Beijing 100083, China
2
School of Mechanics and Civil Engineering, China University of Mining and Technology (Beijing), Beijing 100083, China
3
Research Institute for Deep Underground Science and Engineering, China University of Mining and Technology (Beijing), Beijing 100083, China
4
State Key Laboratory for Fine Exploration and Intelligent Development, China University of Mining and Technology (Beijing), Beijing 100083, China
*
Author to whom correspondence should be addressed.
Appl. Sci. 2024, 14(11), 4490; https://doi.org/10.3390/app14114490
Submission received: 8 March 2024 / Revised: 11 May 2024 / Accepted: 14 May 2024 / Published: 24 May 2024
(This article belongs to the Section Earth Sciences)

Abstract

:
In order to study the hydration absorption behaviors and characteristics of sandstone in Mogao Grottoes in China, the pressure-less hydration absorption experiment on the outcrop porous sandstone of Mogao Grottoes was carried out by using the self-developed real-time monitoring experimental system. The hydration absorption was measured and the curve of hydration absorption with time was drawn. At the same time, the digital image correlation method (DIC) was used to measure the full-field deformation, and the speckle pattern of the sample was analyzed using Match ID, and the displacement field and strain field of the sandstone sample at different hydration absorption moments were computed. Moreover, the sparse area and dense area of sandstone are used as regions of interest (ROI) for DIC analysis. According to the test results, it is concluded that the hydration absorption of sandstone increases rapidly in the initial stage, and gradually tends to be stable with the change of time. This corresponds well with the deformation characteristics of sandstone analyzed using DIC. In the initial stage, the deformation of sandstone increases rapidly. With the change in time, the deformation of sandstone samples gradually slows down. When the hydration adsorption reaches saturation, the sandstone continues to deform for a period of time before stopping hydration absorption. The results of the mercury injection test and the XRD test show that the porosity of the sparse area is larger than that of the dense area and the particle content of the dense area is lower. When the sandstone is saturated with water, the liquid is immersed in the pores between the solid particles, which makes the sparse area more prone to stress concentration, and the deformation in the sparse area is larger. Therefore, when analyzing the hydration absorption deformation of sandstone, the porosity should be considered.

1. Introduction

Rock is a typical porous medium, and its hydration absorption is an important factor affecting the physical and mechanical properties of rock masses. Under severe hydration, rock masses may induce failure and dynamic disaster [1,2]. Mogao Grottoes is a famous historical and cultural heritage in China, which has important artistic, historical, and cultural value. The sandstone and murals of Mogao Grottoes are susceptible to the influence of water and rock materials and environment, and are prone to hydration reactions. It is of great significance for the protection of Mogao Grottoes to study the hydration absorption and deformation characteristics of Mogao Grottoes sandstone and understand the deformation mechanism of sandstone.
The hydration absorption of rock has been conducting some mechanical behaviors and mechanism researches. Yu et al. [3] have carried out macroscopic and microscopic studies on the water swelling characteristics and deformation mechanism of rocks, and carried out multi-scale studies on the physical and mechanical properties of rocks, and reached certain conclusions. Yao et al. [4] studied the physical and mechanical characteristics of sandstone under the dry–wet cycle, and concluded that the change of mineral composition and microstructure is the main reason for the deterioration of sandstone strength. Fan et al. [5] used an indoor uniaxial compression test to study the coupling law of water swelling and creep of mudstone under different initial water content, water gushing mode, and loading mode. It is concluded that the creep deformation increases with the increase in hydration absorption area. Lin et al. [6] used nuclear magnetic resonance (NMR) technology to measure the porosity and pore size distribution of sandstone samples in different chemical solutions. It is concluded that the porosity of sandstone increases after hydration and absorption of chemical solution, and the weakening law of compressive and tensile strength of sandstone under static and dynamic conditions is similar, which is exponentially related to the damage variable. Sun et al. [7,8] studied the strength softening and microscopic mechanism of sandstone strata under different water content or temperature conditions. Yuan et al. [9] conducted dynamic uniaxial compression tests on sandstone specimens after dry–wet cycle treatment under the same loading conditions, and studied the influence of water temperature and dry–wet cycle coupling on the dynamic mechanical properties of sandstone. At present, most of the related researches on the hydration absorption characteristics of rocks focus on the microscopic or macroscopic characteristics of rocks, and there is a lack of research on the hydration absorption characteristics of sandstone under pressure-less hydration absorption.
Studying the deformation behavior of rock is an important step to understand the properties of rock. At present, the direct contact method is mostly used to study the deformation characteristics of rock. Digital image correlation (DIC) is a non-contact strain analysis technology based on digital image processing, which has become one of the important means to study the mechanical properties and deformation characteristics of materials. In laser speckle measurement, DIC is used to measure the surface displacement component, and an image scanner connected to a computer records the laser speckle pattern of the object and is stored in the memory in a reference and deformation configuration. The subset and reference of the formed image are numerically used as a measure of surface displacement [10,11]. Yang et al. [12] studied the delayed behavior of unsaturated argillaceous rocks using the DIC technique, and discussed the time-dependent behavior observed at different scales. Based on the DIC non-destructive optical technique, Zhang et al. [13] measured the full-field displacement of the sandstone surface and determined the crack initiation and crack length evolution. Wang et al. [14,15,16] studied the mechanical behavior of mudstone at the composite microstructure scale by using environmental scanning electron microscopy (ESEM) imaging and DIC technology, and found some irreversible phenomena in the drying and wetting process of mudstone at the micron scale. Luo et al. [17] studied the deformation behavior of soft and hard interbedded rock using DIC, and studied the deformation and failure characteristics of horizontal soft and hard interbedded rock samples under uniaxial compression. Ji et al. [18] used the DIC experimental platform of coal rock deformation damage to carry out the surface deformation observation test of coal rock around the borehole during the progressive damage process. Yang et al. [19] studied the multi-dimensional non-uniform deformation and failure characteristics of siltstone through linear differential transformer (LVDT), DIC, computational tomography (CT), acoustic emission (AE), and ultrasonic velocity. Xin et al. [20] analyzed the evolution of the strain field on the surface of the sample through DIC, and initially gave the relationship between the proposed stress–strain curve and the strain field. Yao et al. [21] studied the effect of inclusions on the fracture evolution and mechanical properties of mortar structure, and analyzed the deformation characteristics using DIC technology. Based on the multi-fractal of high-speed digital image correlation (HS-DIC) technology and quality screening method, Jin et al. [22] investigated the evolution trend of surface cracks during crushing and the distribution characteristics of sample fragments after crushing from the perspective of a fractal. Martin et al. [23] analyzed the effect of four different tension levels on the strain/stress of the hole specimen based on the DIC system calibration procedure. Yan et al. [24] carried out uniaxial compression experiments on red sandstone samples, analyzed the slow deformation waves under different loading rates, and combined them with DIC technology for microscopic characterization. However, when measuring rock deformation, there are few methods using non-contact measurement technology, and the research on using the DIC method to analyze the hydration absorption process of rock is not sufficient.
Through the above research status, it is found that the current research on the hydration adsorption characteristics of rocks mainly focuses on the macroscopic and microscopic characteristics of rocks, and the hydration absorption characteristics of sandstone under pressure-less hydration absorption are not clear. In the measurement of rock deformation, there are few methods using non-contact measurement technology, and the research on the analysis of rock hydration absorption process using the DIC method is not sufficient.
In order to study the hydration absorption characteristics of sand and rock in Mogao Grottoes and the deformation of rock during hydration, the structure of this paper is as follows. Section 2 introduces the test results of the mercury injection test and the XRD test of sandstone samples, and the principle and detection scheme of pressure-less hydration absorption of sandstone samples. The results and analysis of pressure-less hydration absorption characteristics of sandstone are introduced in detail. Section 3 introduces the measurement principle of DIC and the automatic shooting detection device and detection scheme, and introduces the results and analysis of sandstone pressure-less hydration absorption deformation characteristics in detail. Section 4 summarizes the conclusions and future research directions.

2. Pressure-Less Hydration Absorption Characteristics of Outcrop Porous Sandstone

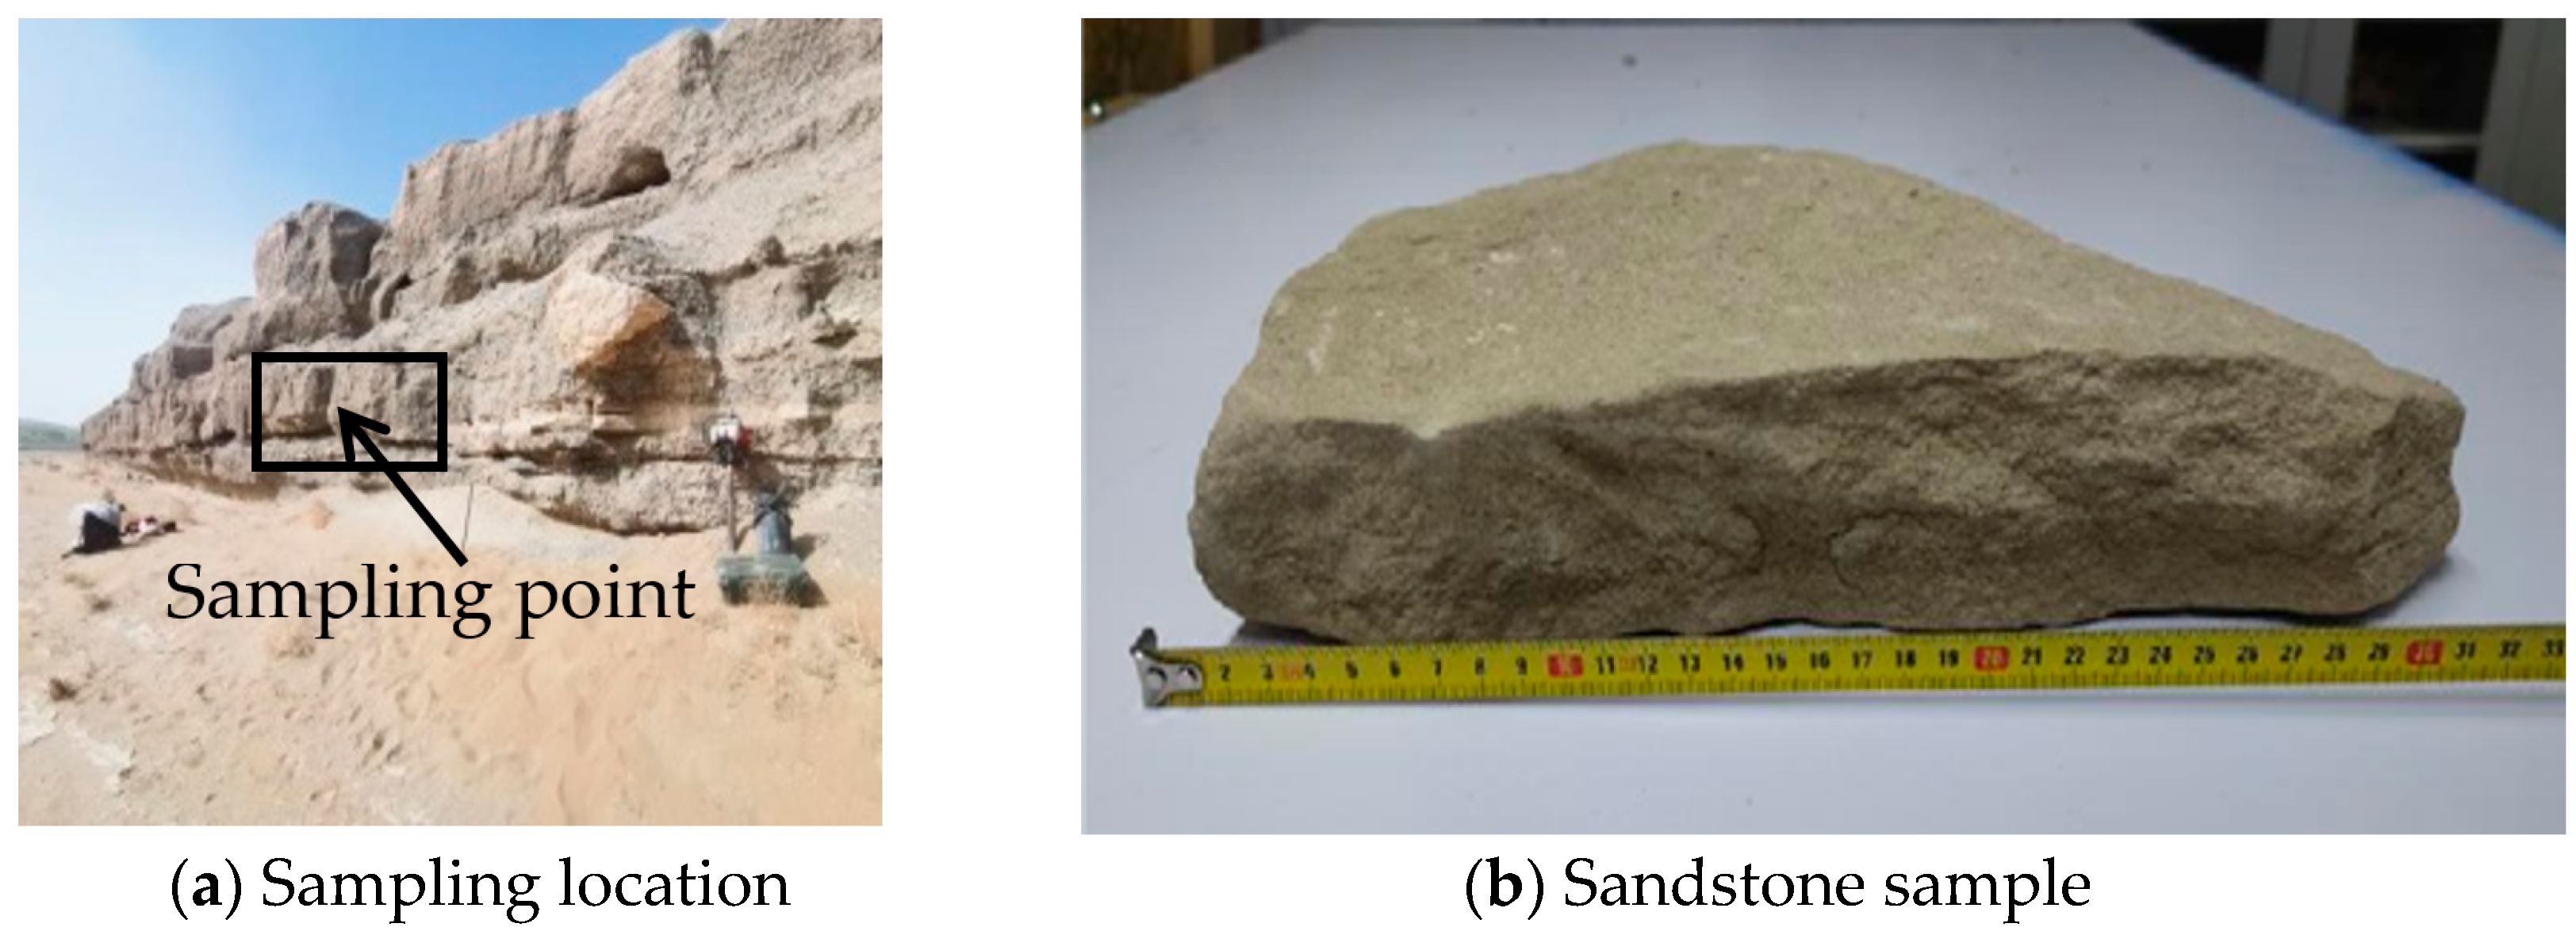
2.1. Preparation of Outcrop Porous Sandstone Samples

Sandstone samples are collected from the northern zone of Mogao Grottoes, where the surface appears rough and has a grey-white hue and the sample is composed of massive sandstone. Figure 1 shows the distinctive features of the sandstone surface, which displays smooth bedding, homogeneous particles, a refined texture, and relaxed structure.
In order to make the pressure-less hydration absorption detection more scientific and referenceable, the sandstone with clear surface density area is selected for processing. The sandstone samples obtained using the wire cutting method are shown in Figure 2. A cuboid samples of rock with a size of were prepared, and the basic parameters of the sandstone rock samples are shown in Table 1.

2.2. Mercury Intrusion Porosimetry Test Results and XRD Test Results of the Sandstone Samples

2.2.1. Mercury Intrusion Porosimetry Test Results

The pore structure parameters of sandstone samples were analyzed using mercury intrusion porosimetry (MIP). This method uses the MicroActive AutoPore V 9600 instrument produced by Micromerics Instrument Corporation in the Norcross, GA, USA. The pore structure parameters of sandstone samples obtained through MIP experiments are shown in Table 2. The relationship curves between cumulative intrusion and mercury pressure is shown in Figure 3. The cumulative intrusion and probability density curves of the pore size are shown in Figure 4. The relationship curve between the cumulative pore area and pore size is shown in Figure 5.

2.2.2. XRD Test Results

The phases and their relative content of the sample were determined through X-ray diffraction (XRD) experiments using the Rigaku SmartLab X-ray diffractometer. The X-ray diffraction patterns of the whole rock minerals and clay minerals are shown in Figure 6 and Figure 7. The mineral content of the whole rock and the relative content of clay minerals are shown in Table 3 and Table 4.

2.3. Pressure-Less Hydration Absorption Principle and Detection Scheme of Sandstone Samples

2.3.1. Principle of Pressure-Less Hydration Absorption

According to the field test, the analysis shows that the water in the sandstone of Mogao Grottoes mainly migrates in the rock mass through capillary action. The change law of physical and mechanical properties of sandstone under water capillary action was simulated by pressure-less hydration absorption detection. The schematic diagram of the real-time monitoring experimental system for the pressure-less hydration absorption detection is shown in Figure 8, and its mechanisms have been introduced in the previous literature [2].
The system mainly uses the principle of U-tube, that is, the water surface in the storage bucket is kept flat with the water contactor. The sandstone sample is placed on the annular support surface on the upper side of the water contactor. To address water evaporation in the sandstone samples, an aluminum mold with equivalent specifications was positioned in a separate chamber. This setup facilitates the real-time measurement of water evaporation. Sandstone samples absorb water through capillary action, and the amount of water in the bucket will decrease. The reduction in water in the bucket is recorded in real time using the electronic balance below it, and is stored in real time through the data acquisition system, but the aluminum mold will not absorb water. The actual hydration absorption is the amount of water reduction in the bucket minus the amount of water evaporation at the same time.

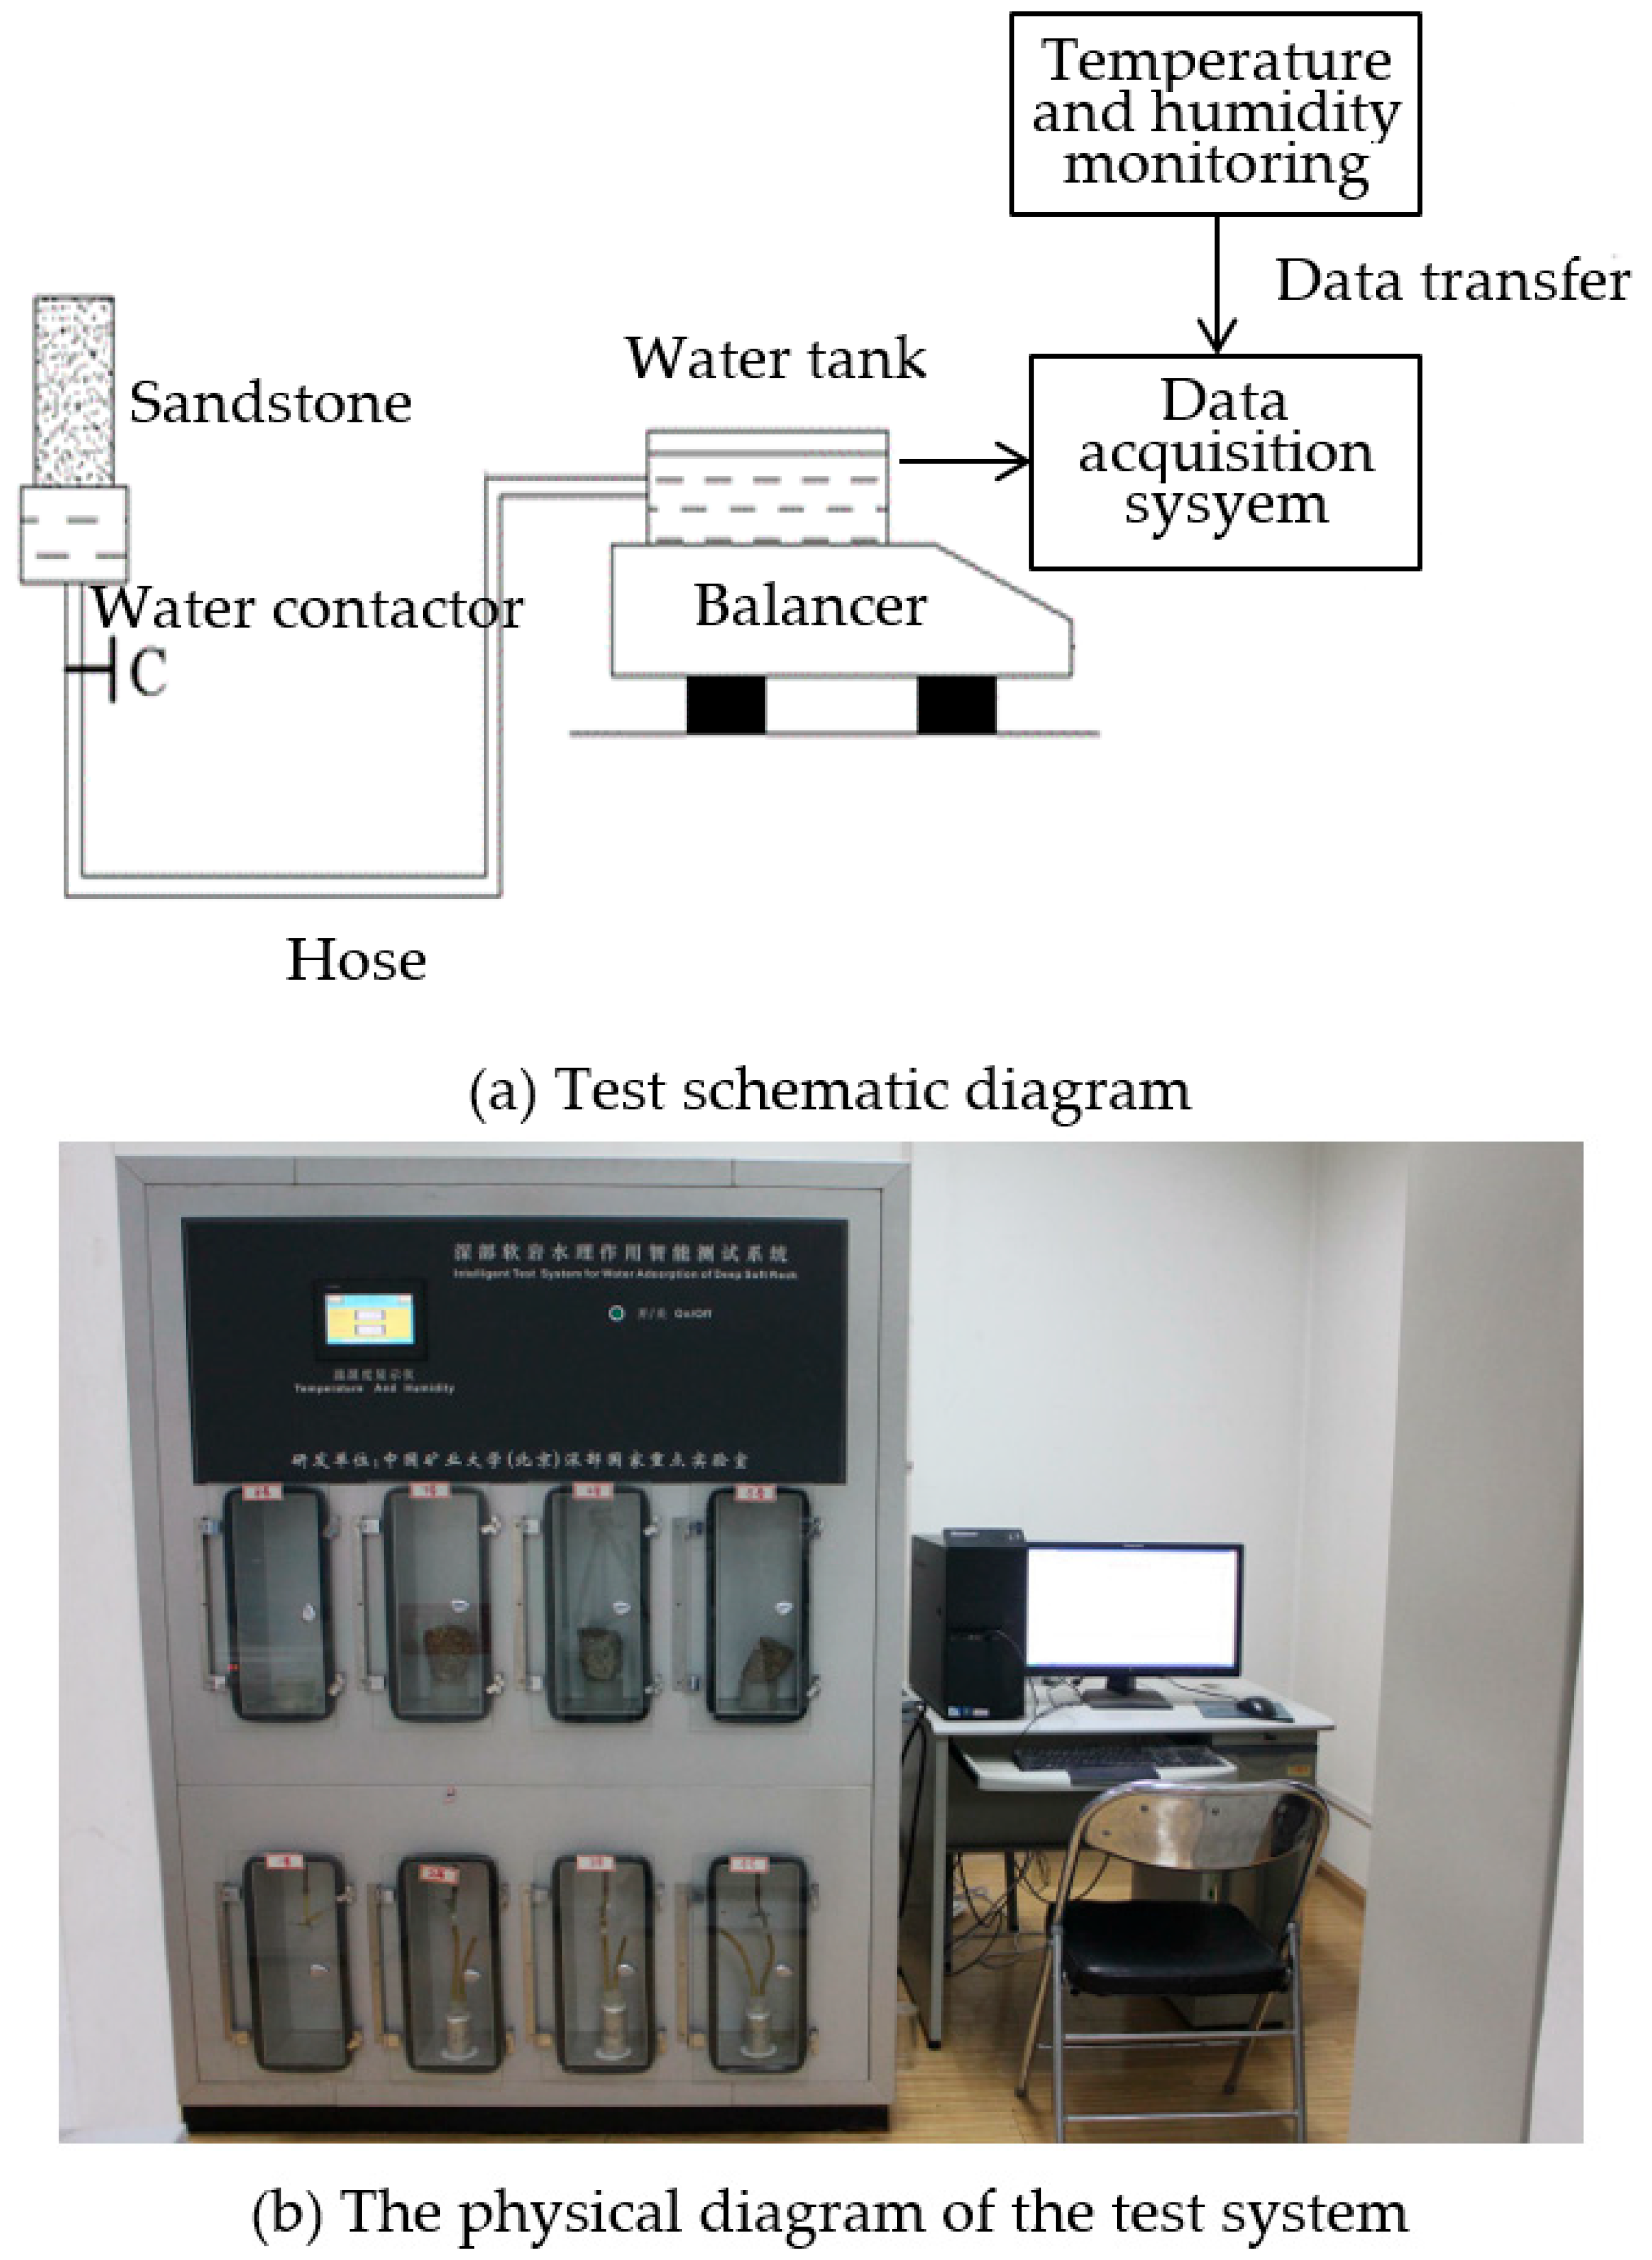
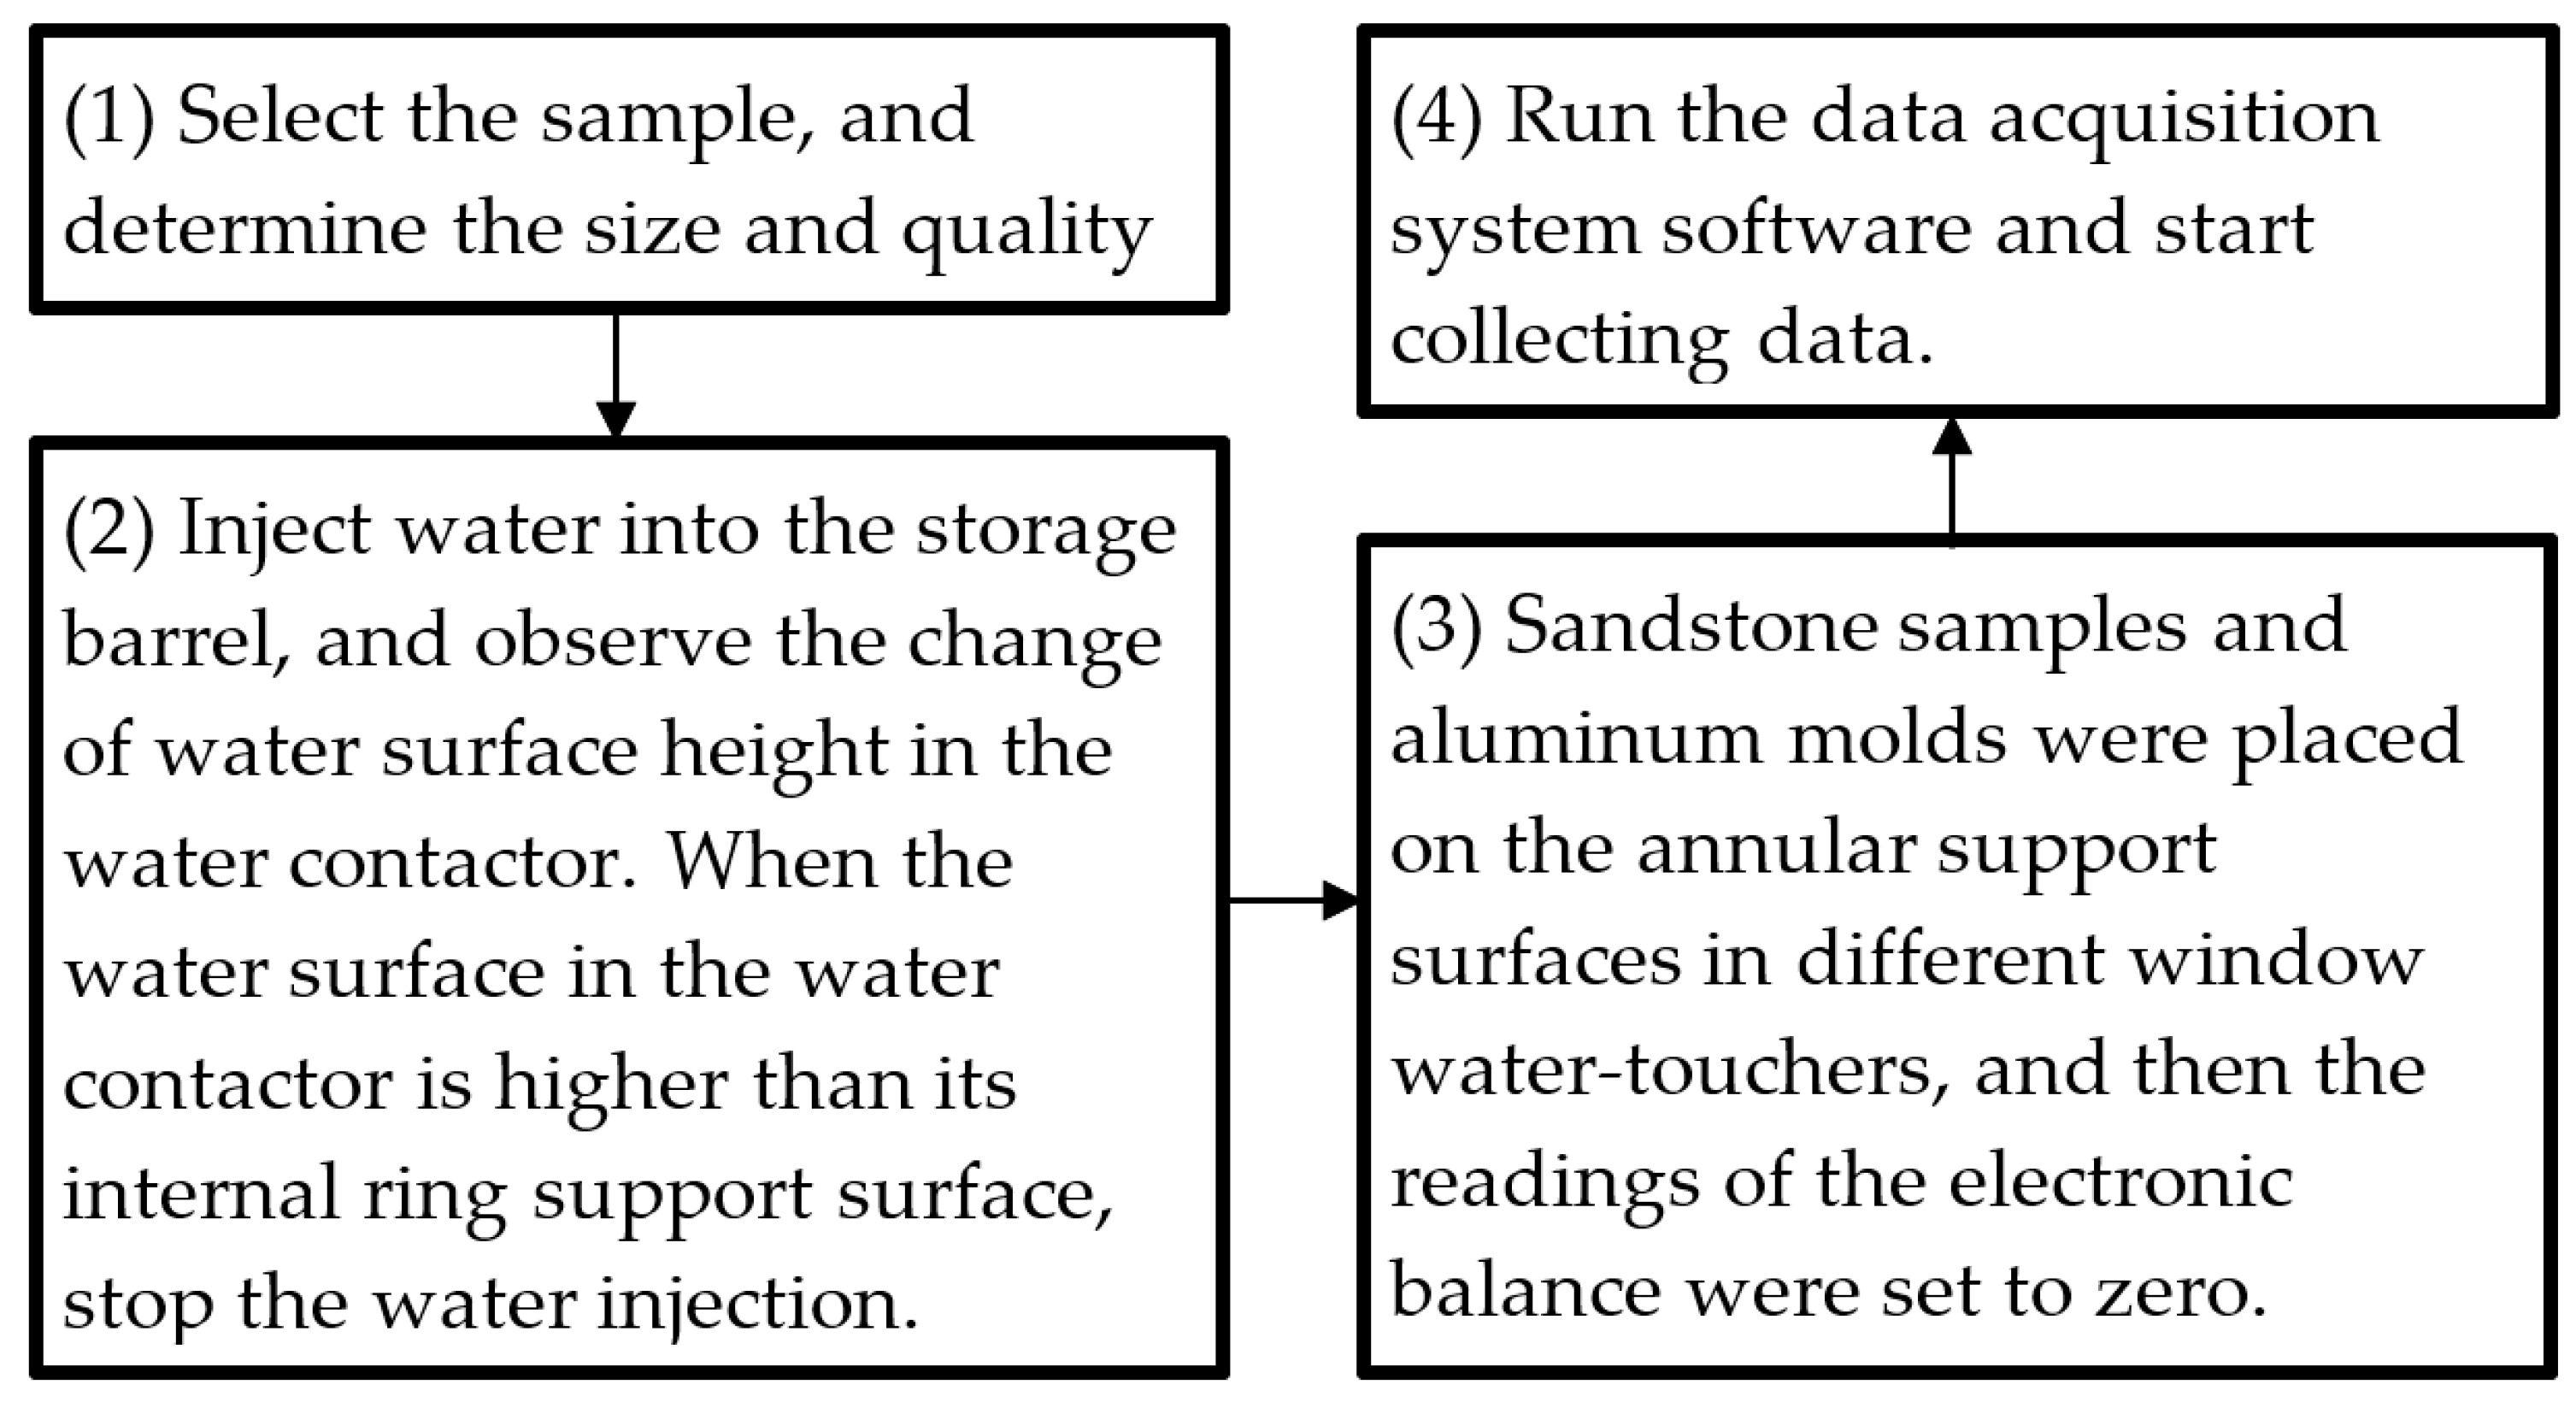
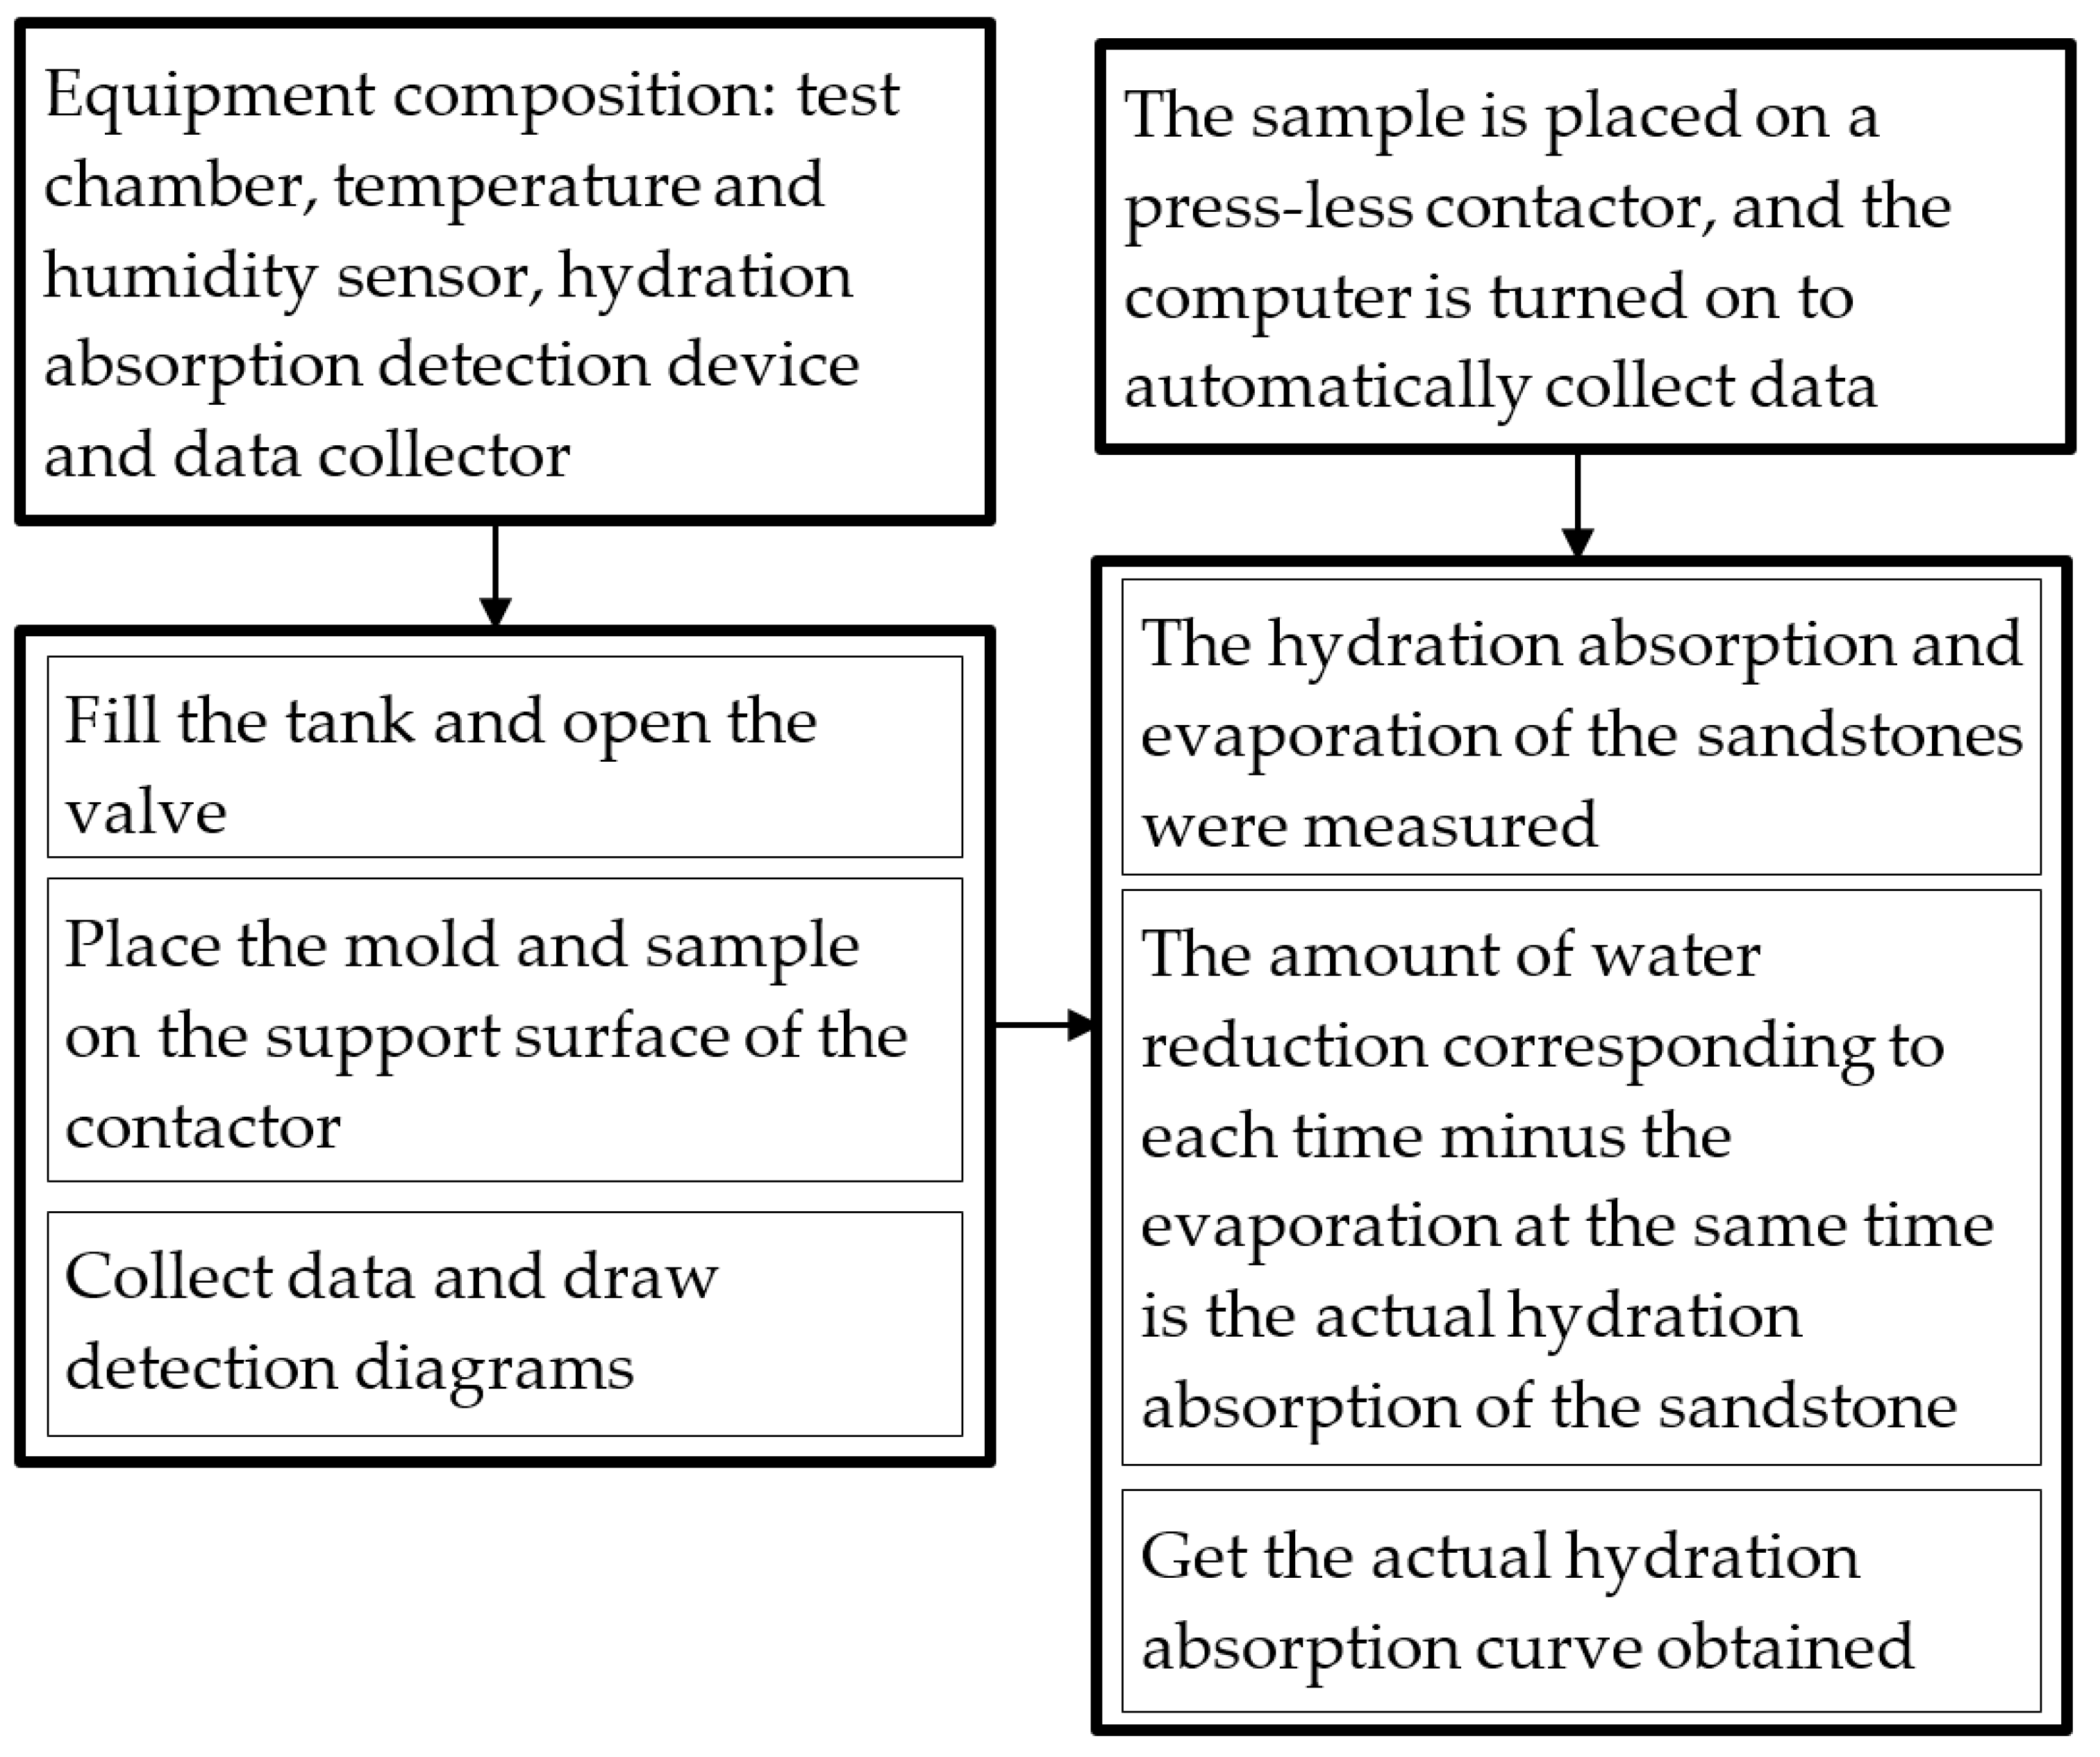
2.3.2. Pressure-Less Hydration Absorption Detection Scheme

The pressure-less hydration absorption detection is carried out by using the above test system to analyze the hydration absorption characteristics of sandstone. The detection scheme can be divided into four main steps, as shown in Figure 9, and the program diagram of the intelligent test system is shown in Figure 10. The details can be found in these procedures.

2.4. Results and Analysis for Pressure-Less Hydration Absorption Characteristics of Sandstone

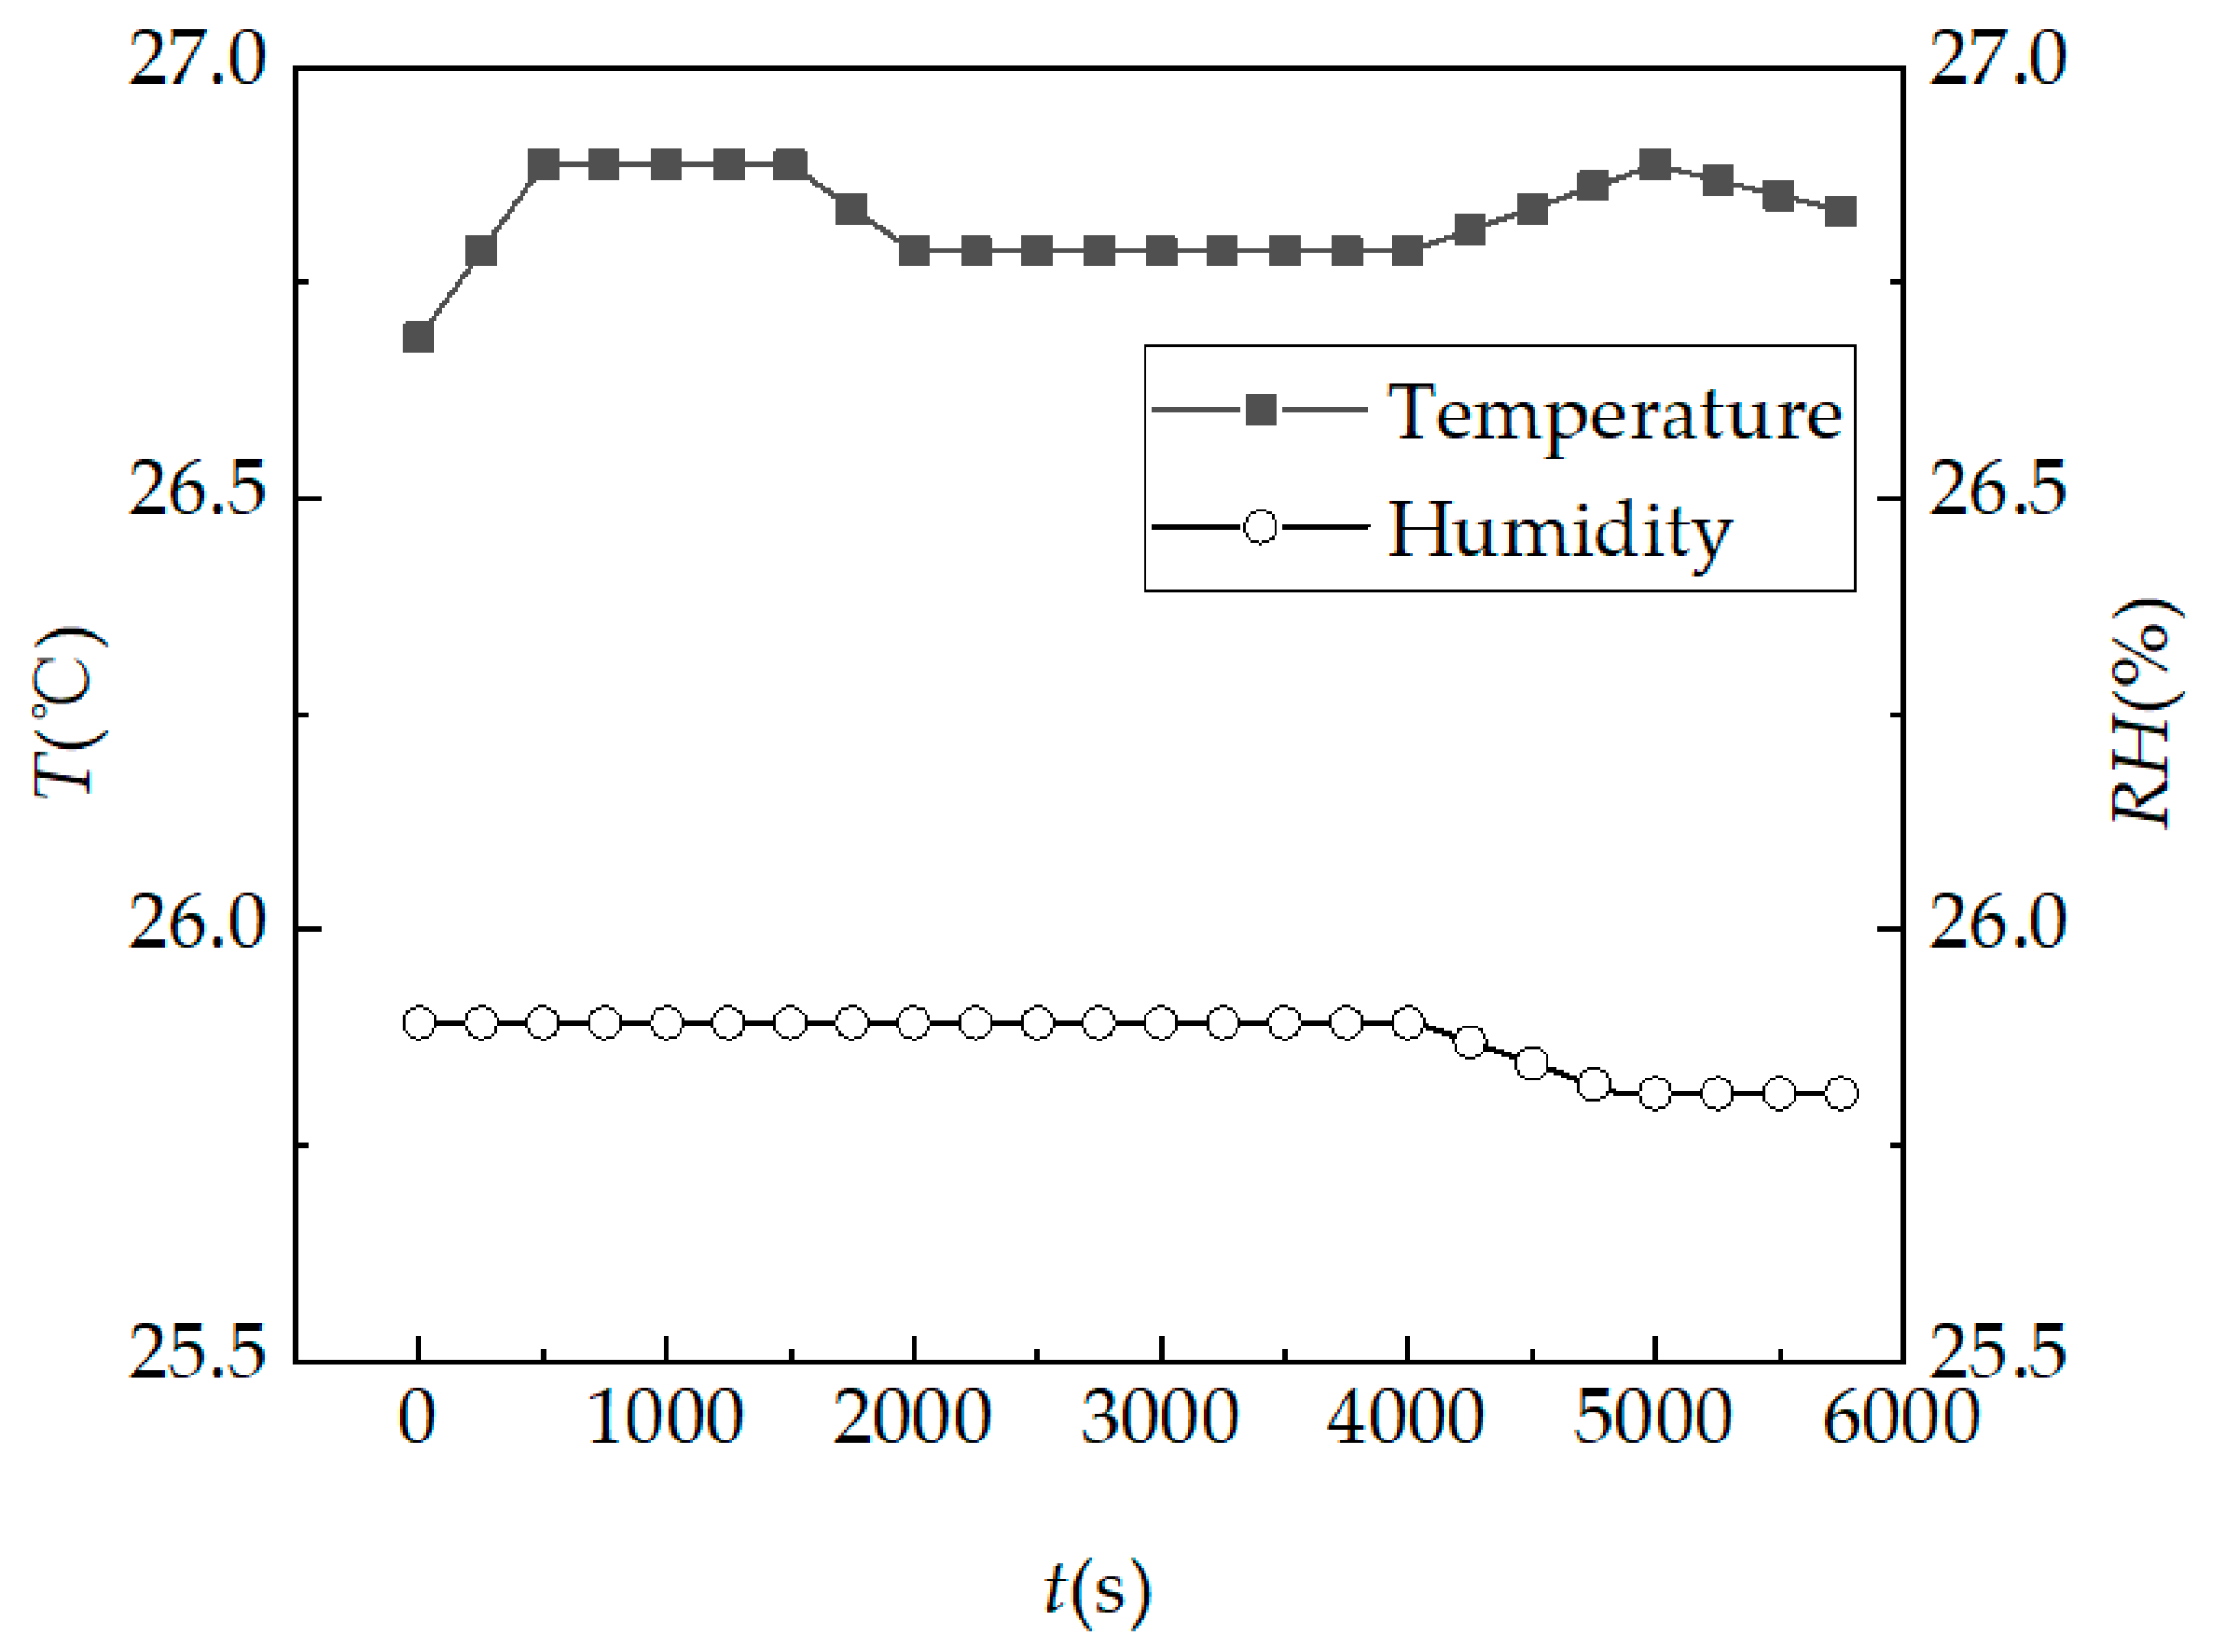
2.4.1. Environmental Temperature and Humidity Curve

In the intelligent detection system, the ambient temperature and humidity during the pressure-less hydration absorption detection are shown in Figure 11. During the whole detection, the ambient temperature (T (°C)) is basically maintained at 26.8 °C and the Relative humidity (RH (%)) is basically maintained at 25.9%, and the detection time is expressed by t (s).

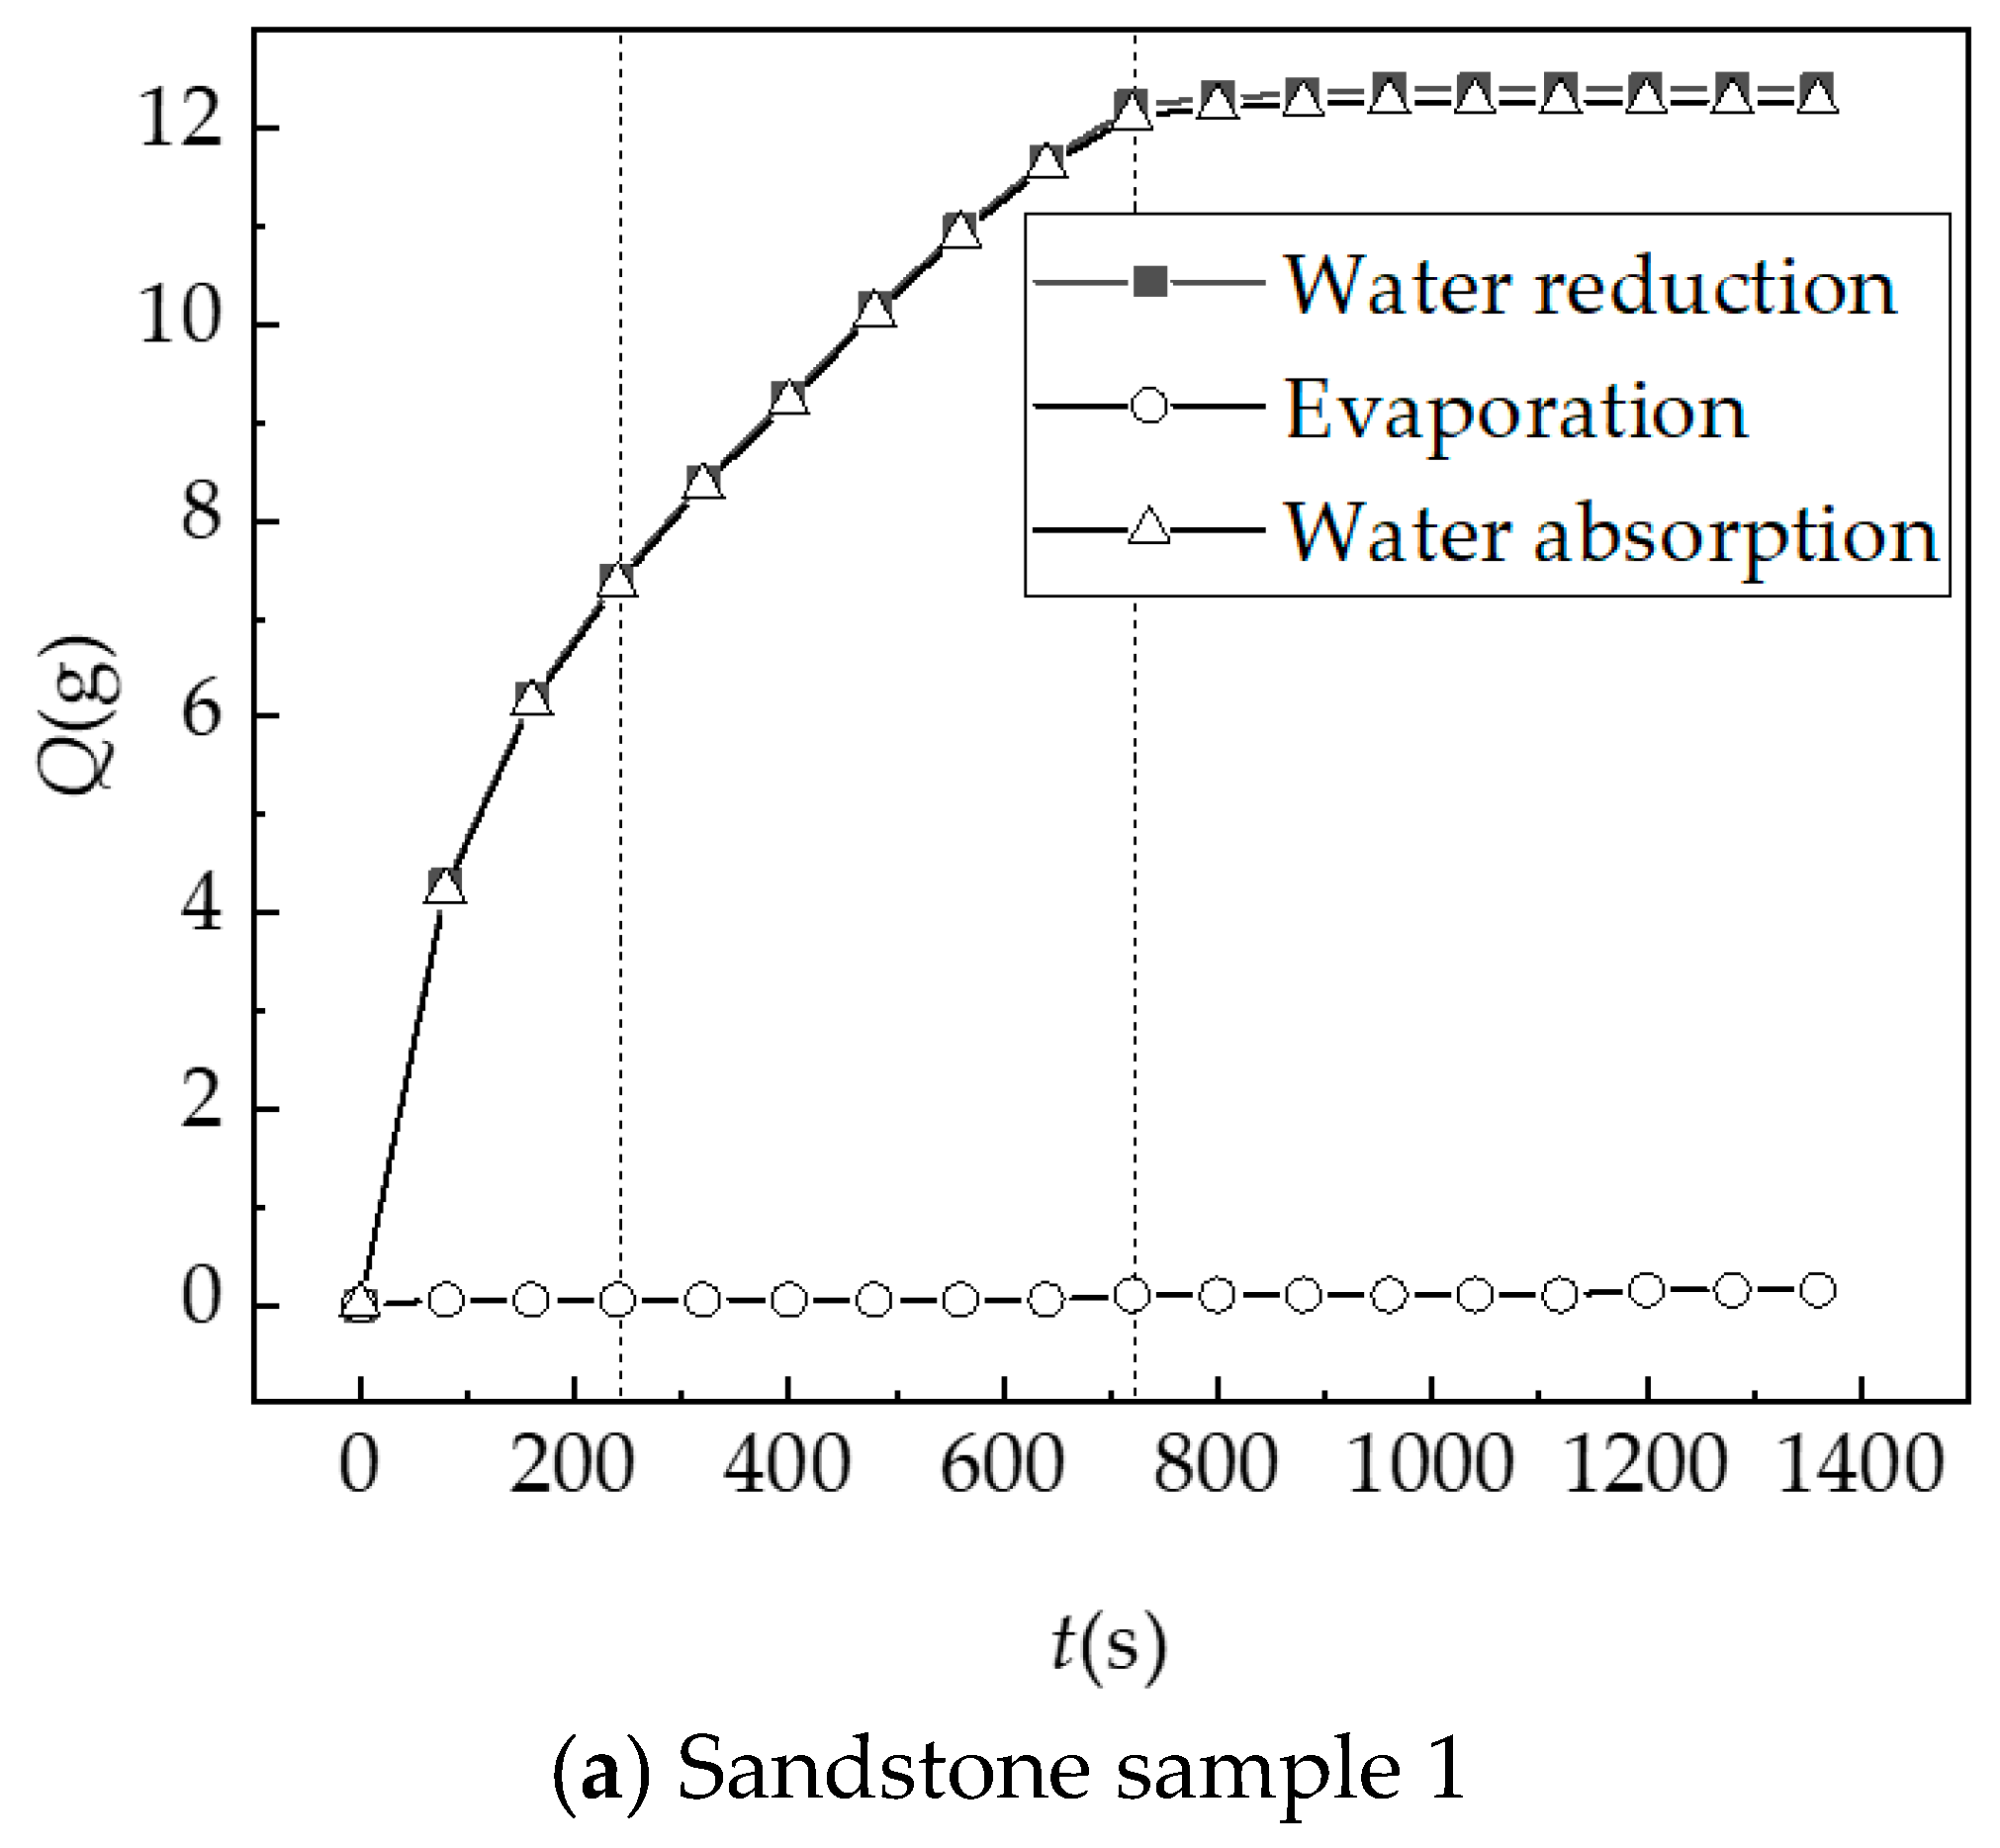
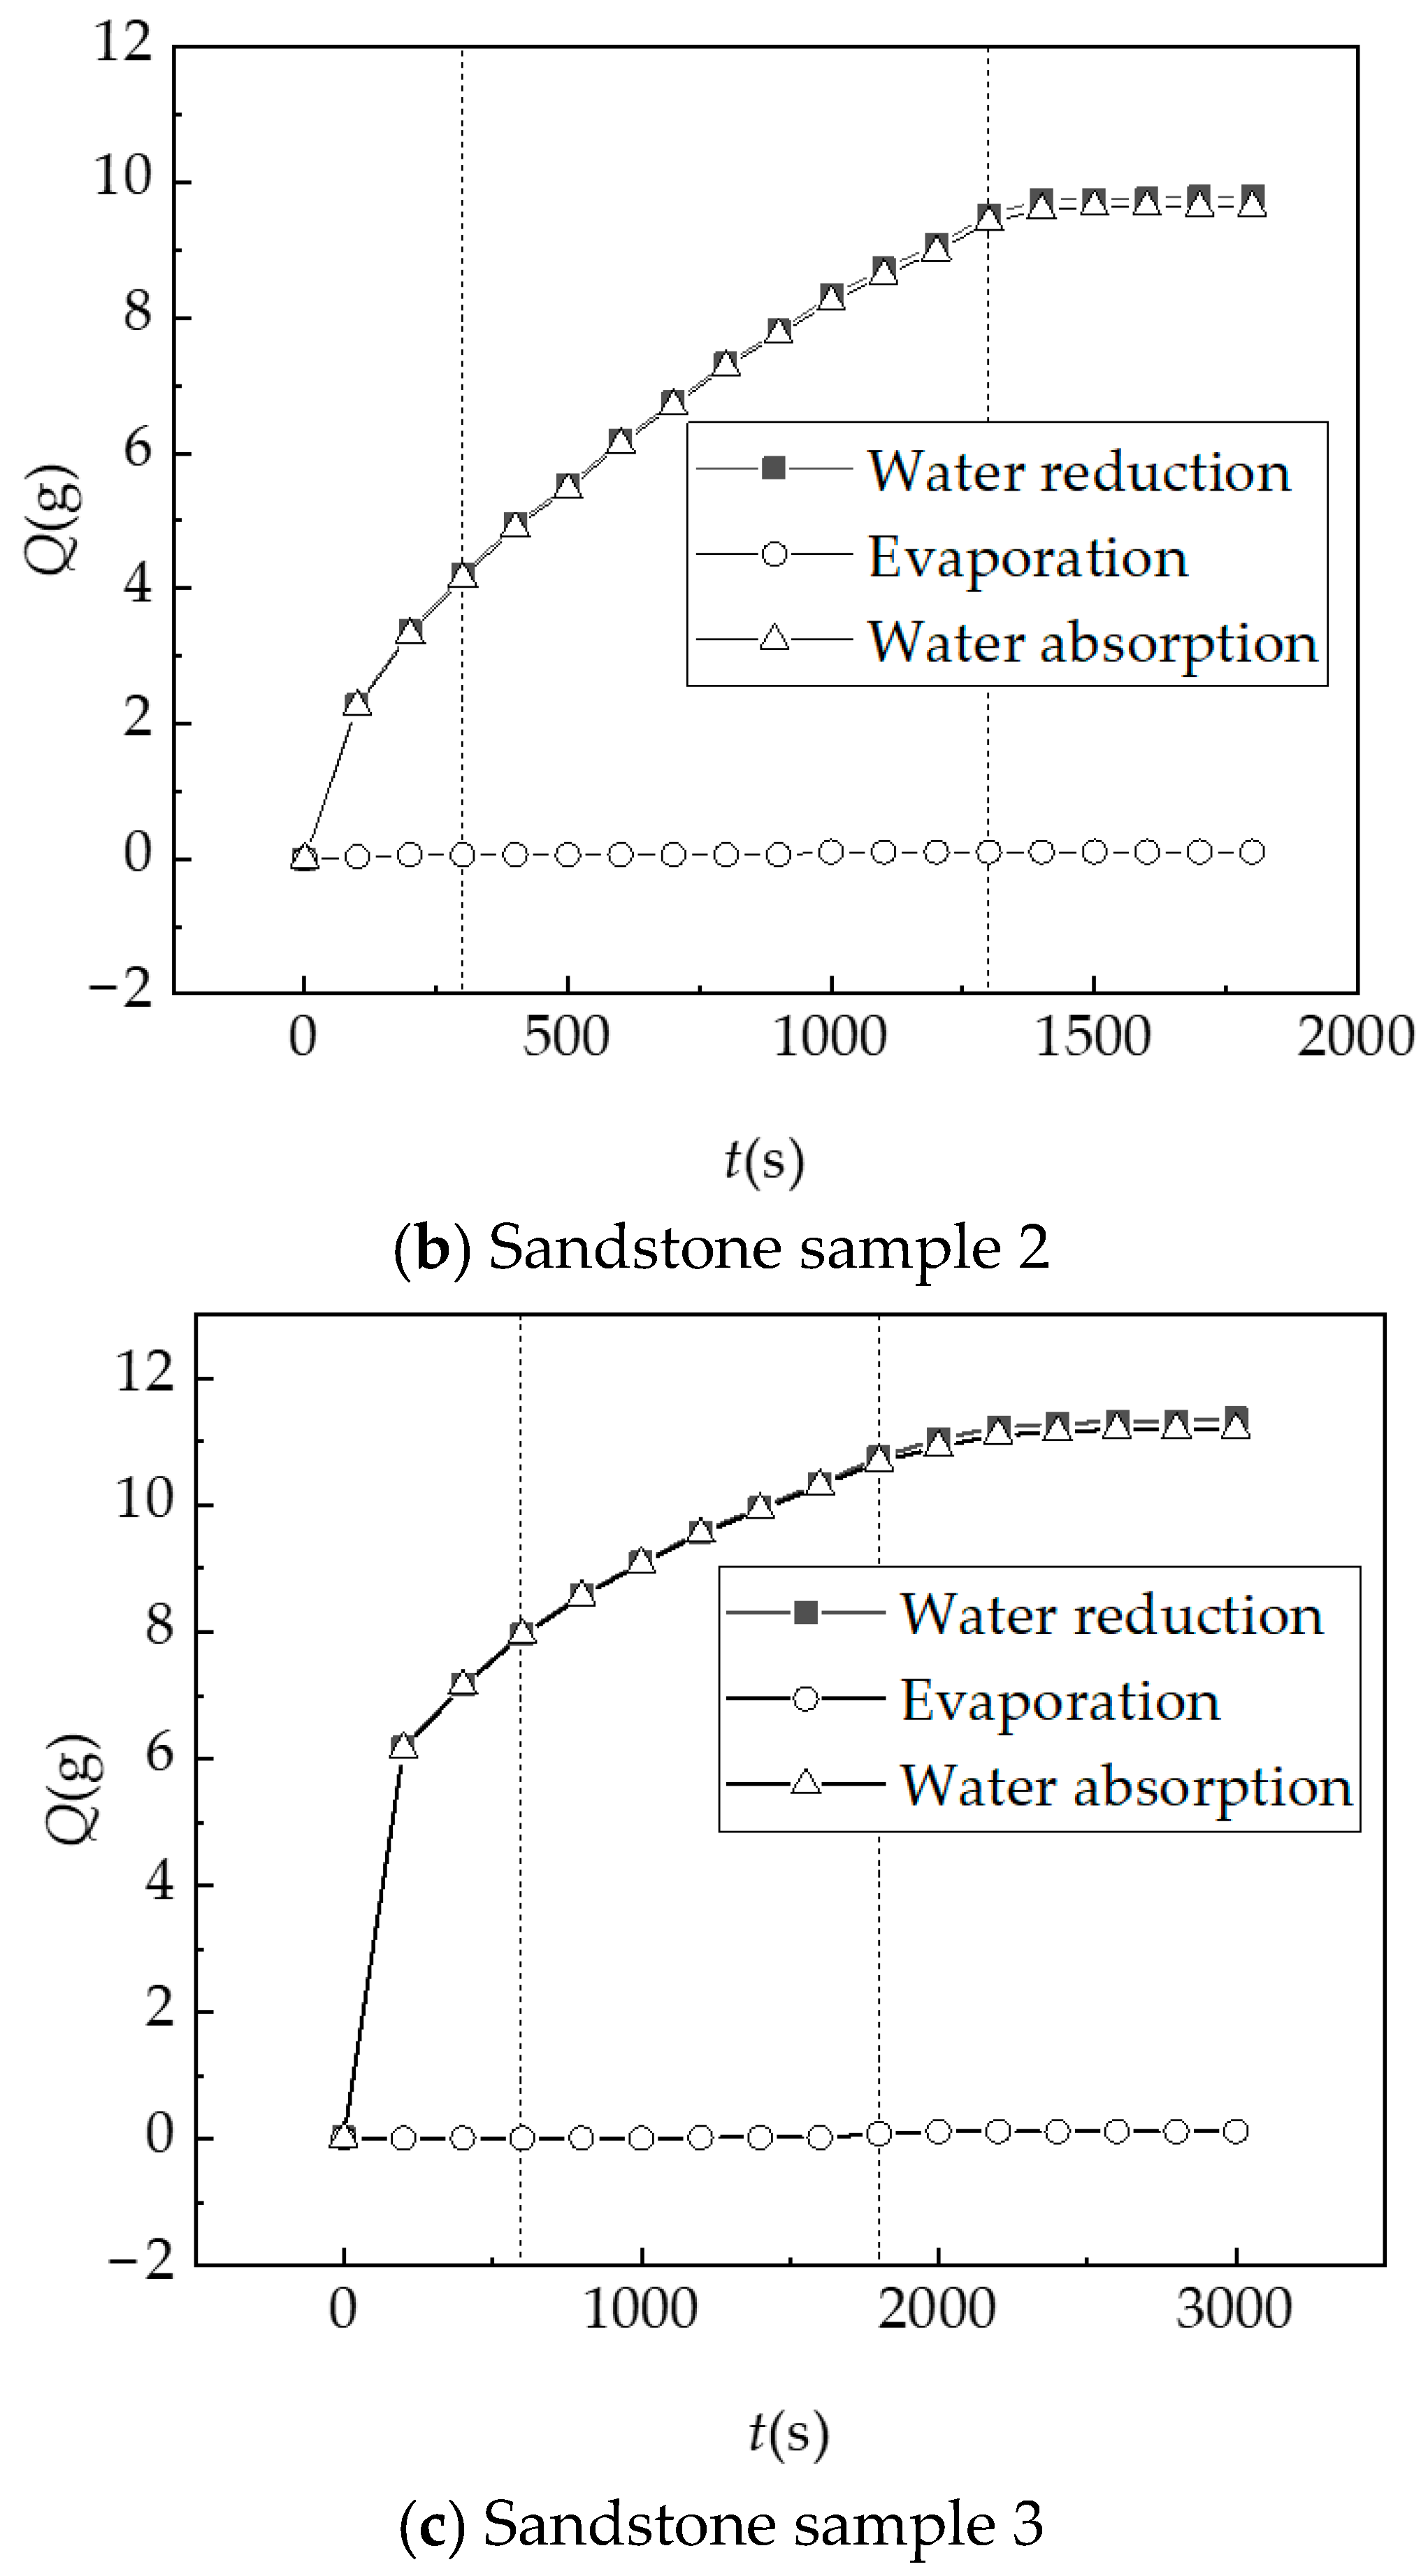
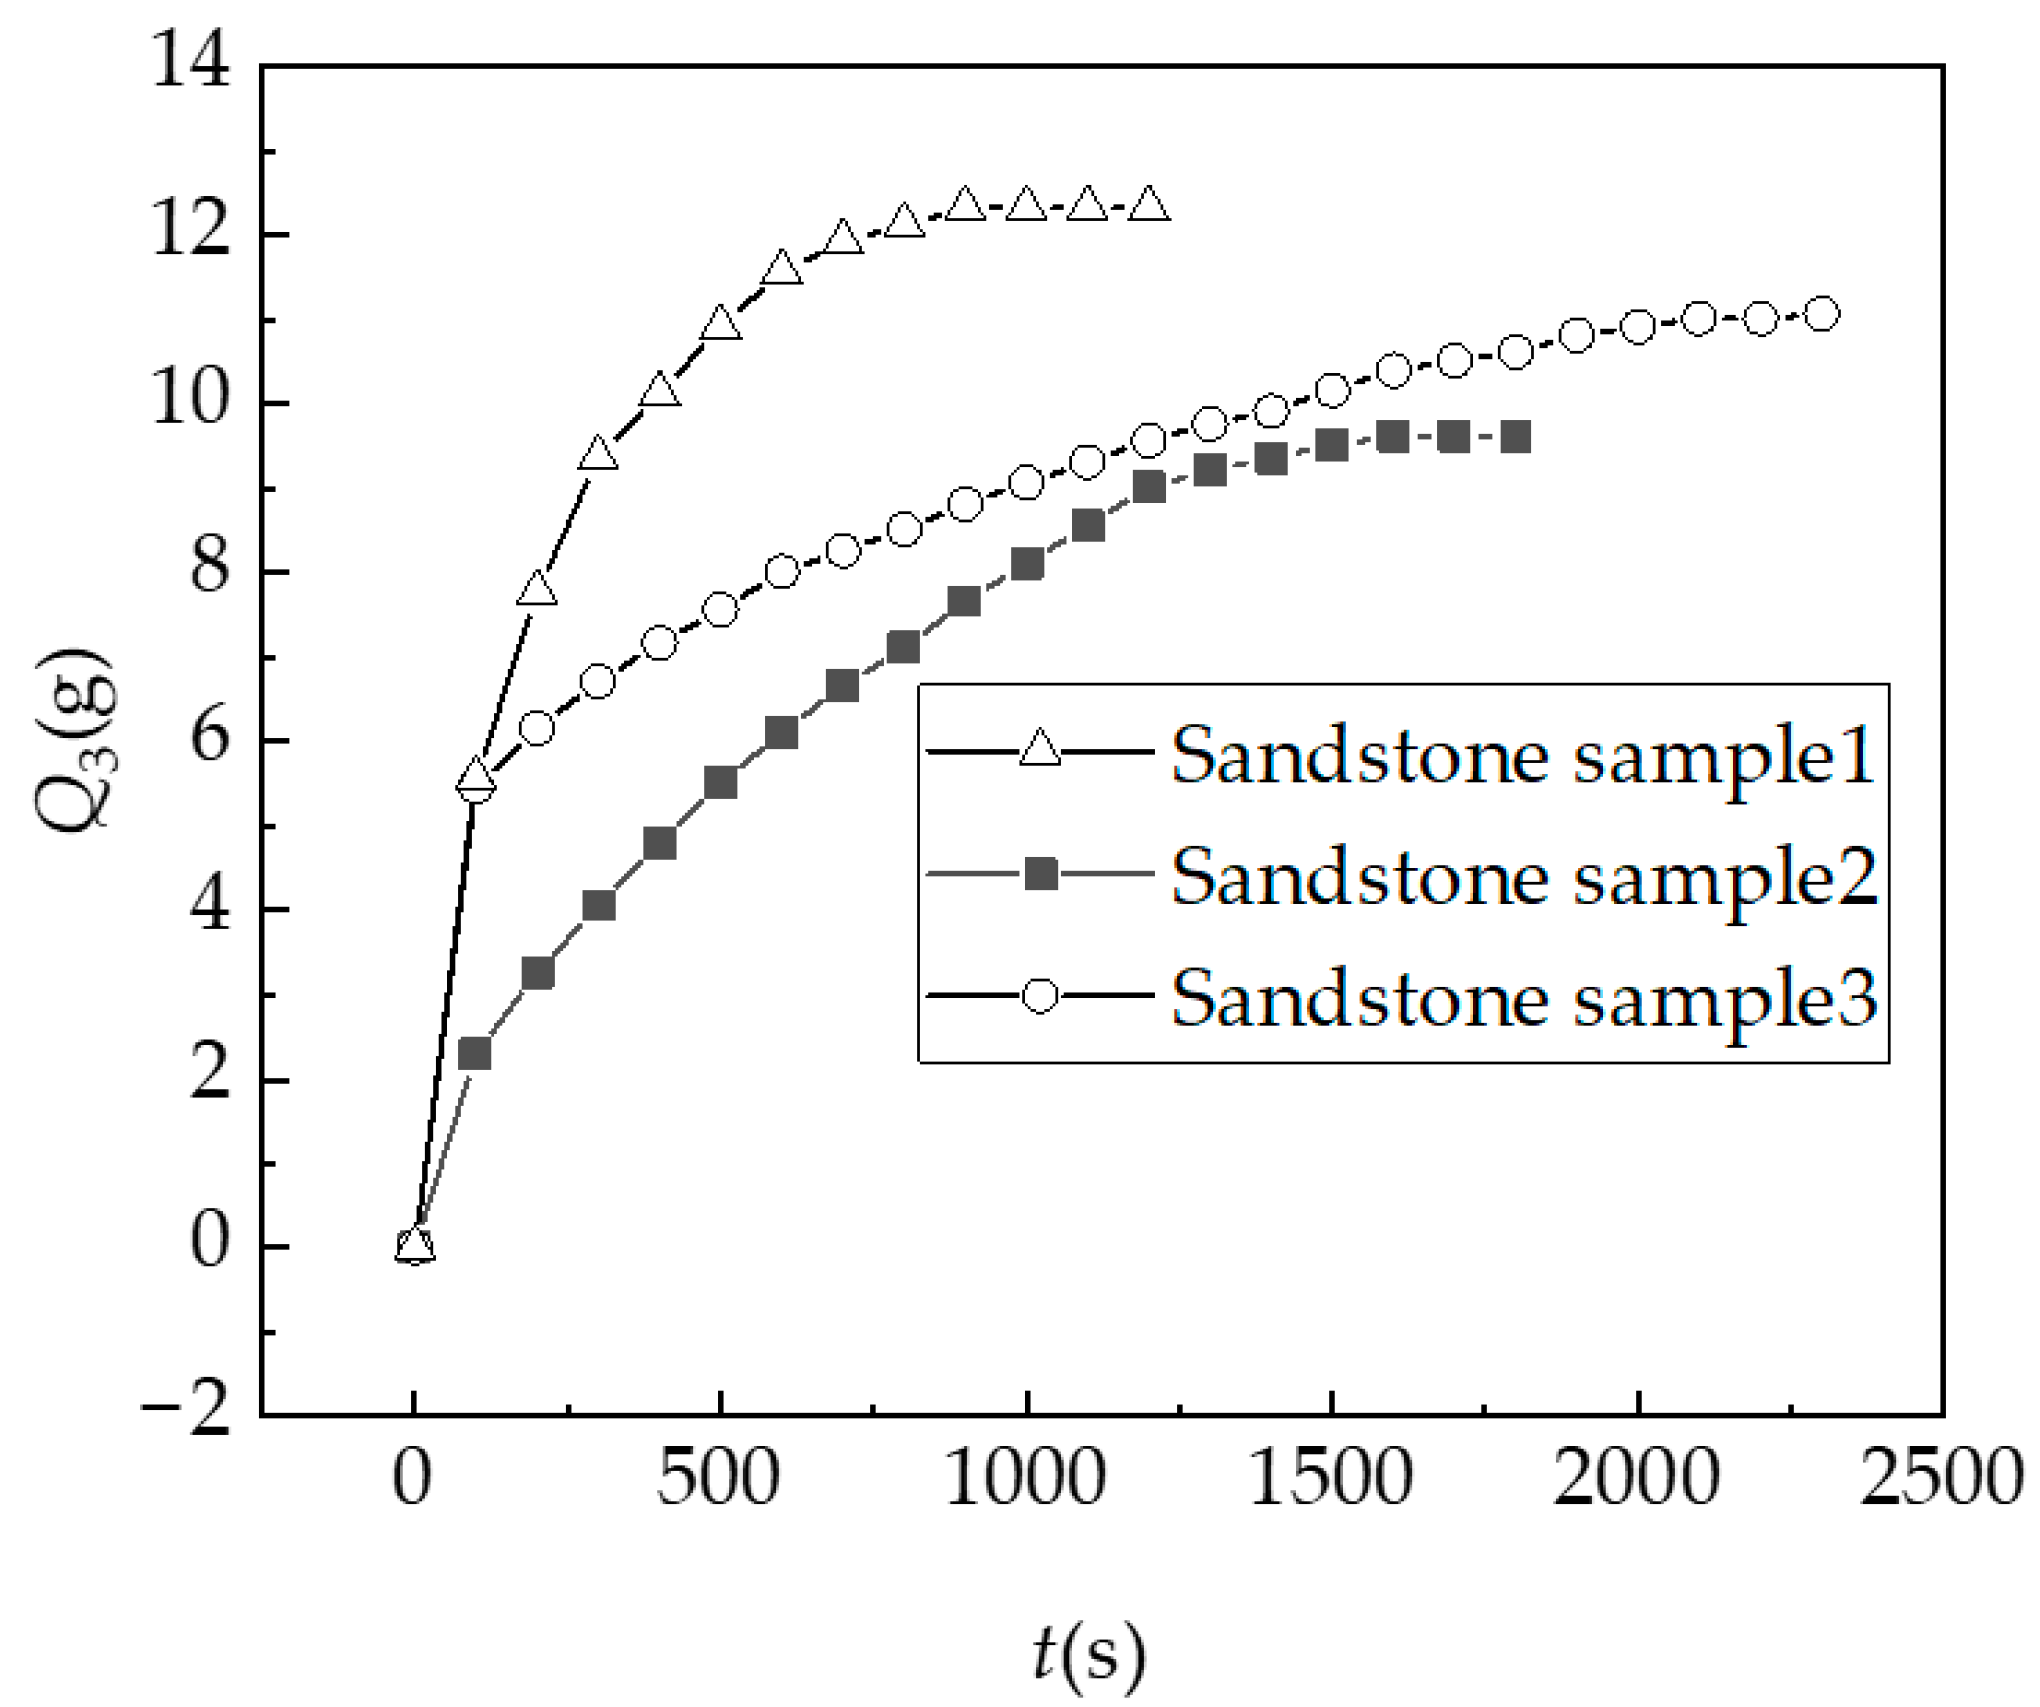
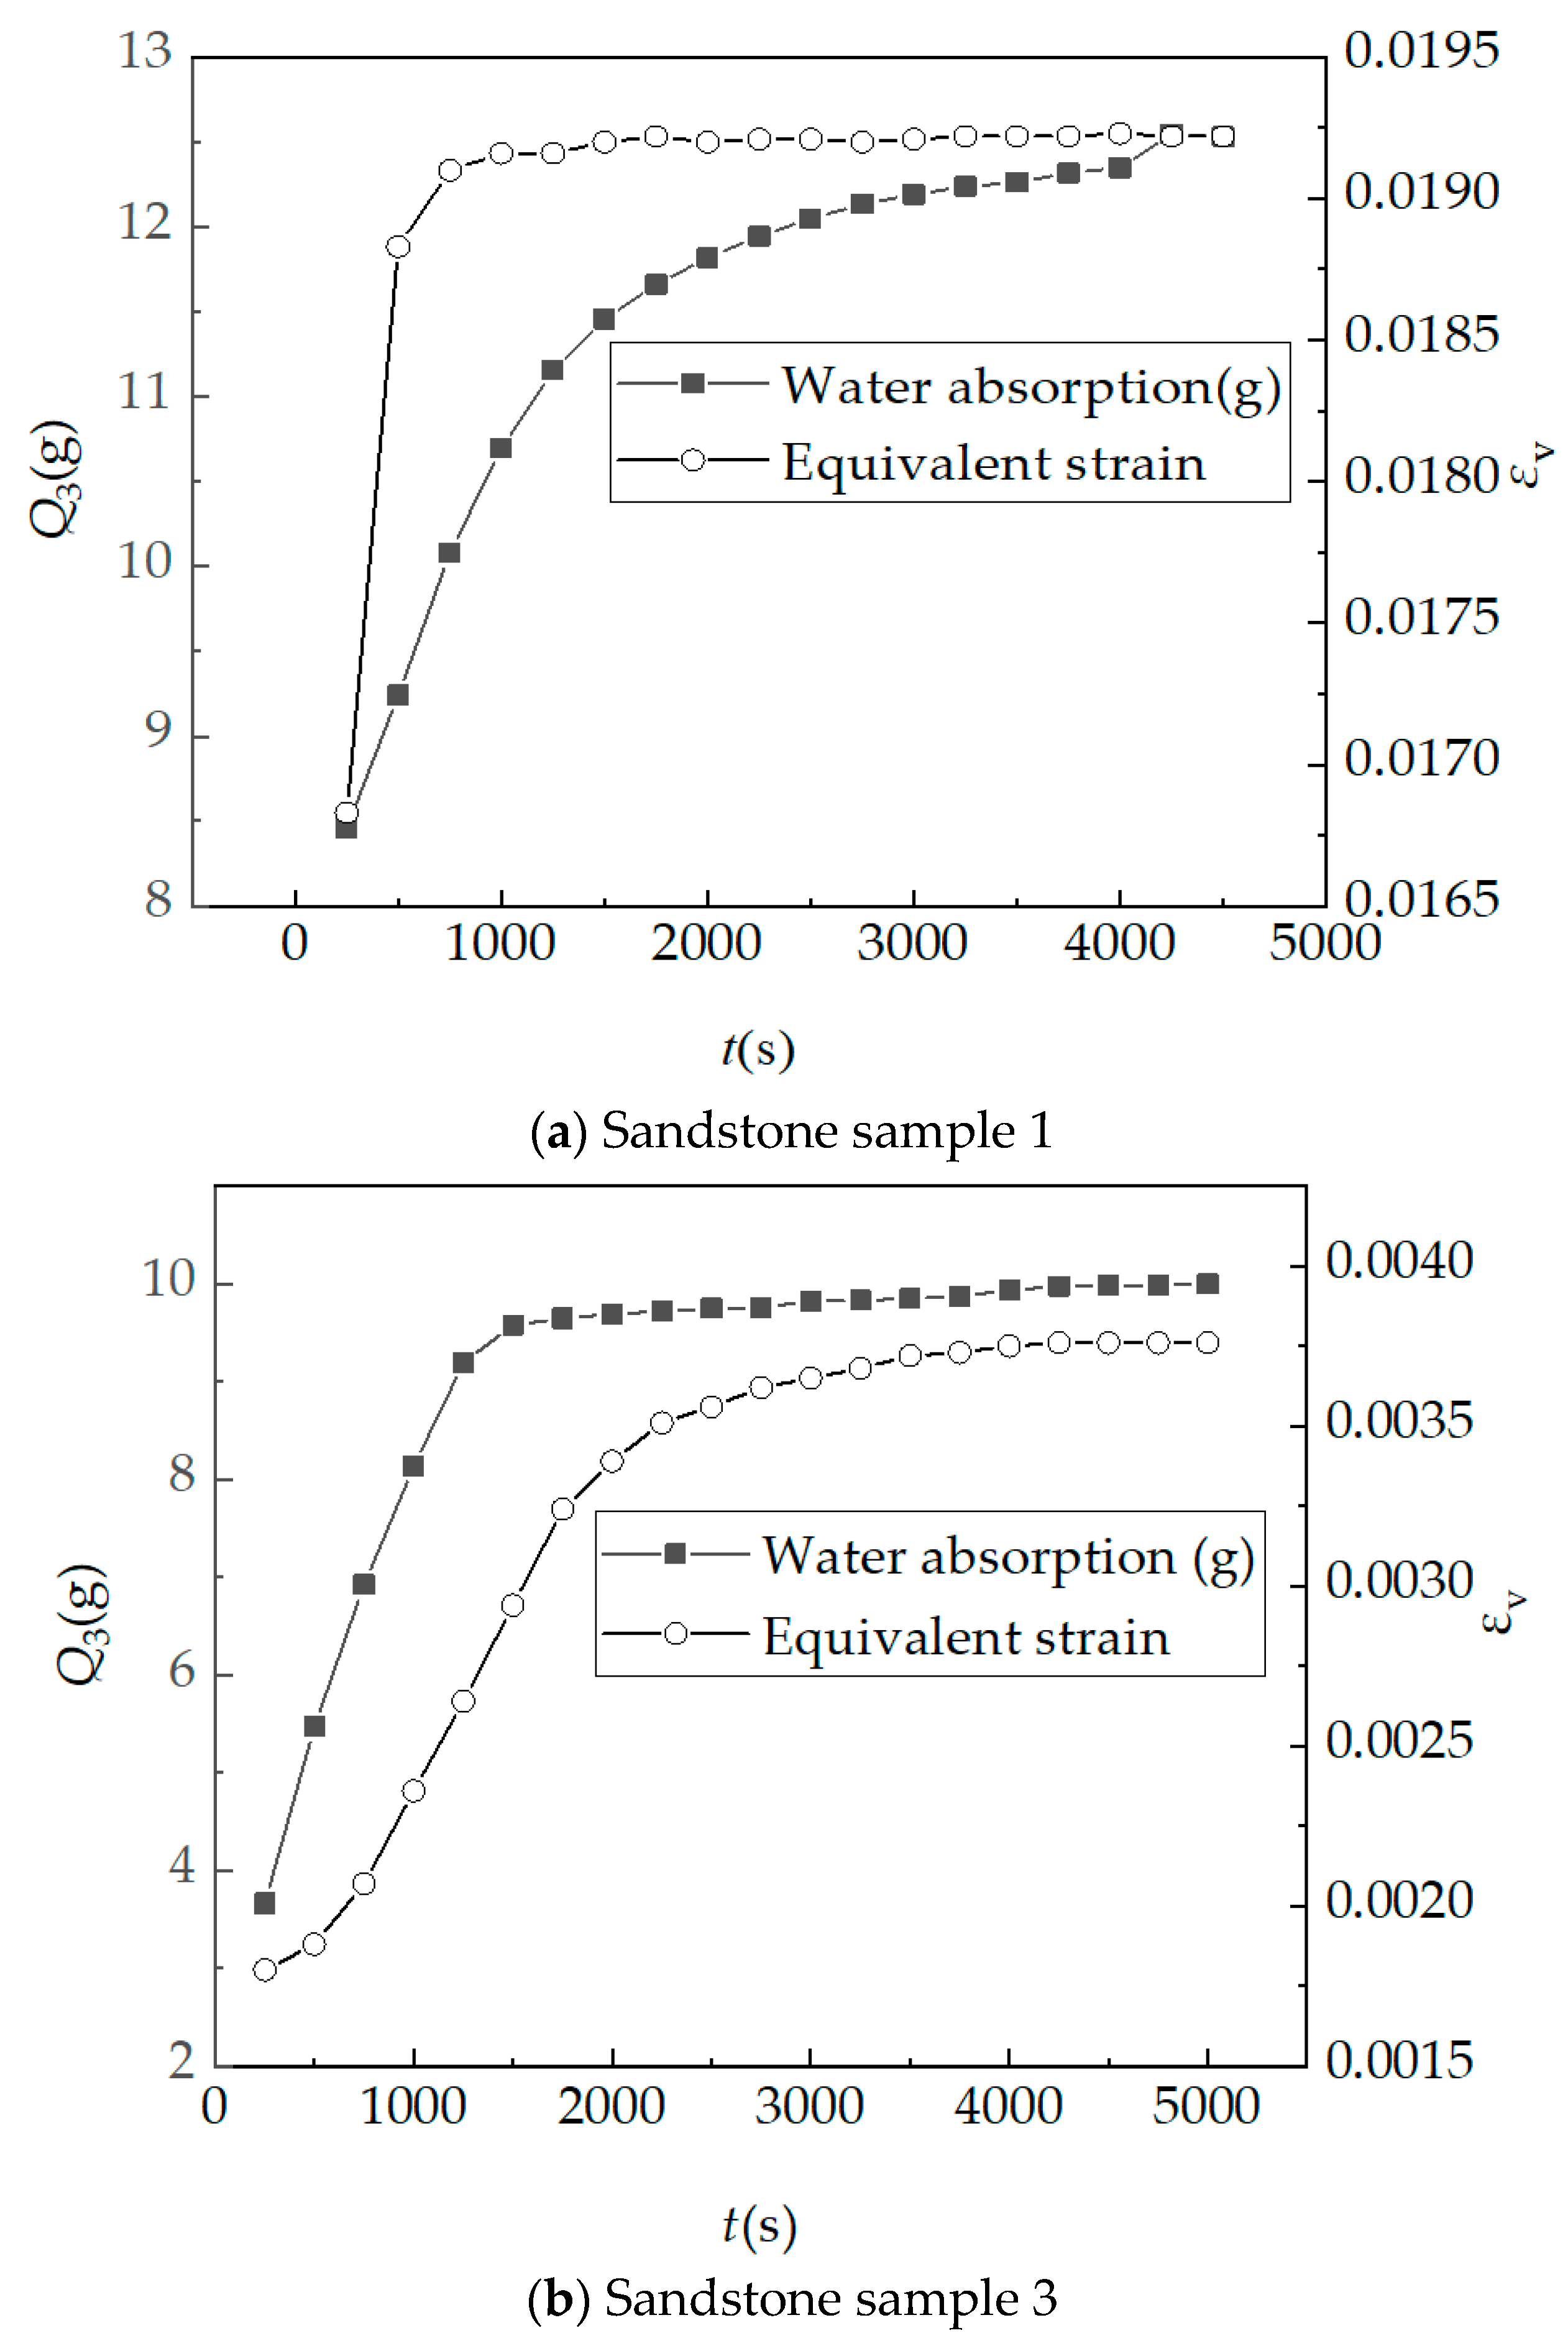
2.4.2. Relationship between Sandstone Hydration Absorption and Time

In the pressure-less hydration absorption detection, the relationship between the hydration absorption of sandstone and time is shown in Figure 12. The measured value of the water reduction of the measured water storage bucket is Q 1 (measured water reduction), which is expressed by a curve connected by some square points. The water evaporation Q 2 (measured evaporation) is represented by a curve connected by some circular points, and the actual hydration absorption Q 3 (actual hydration absorption) of the rock sample is represented by a curve connected by some triangular points. From Figure 12, the relationship between the three quantities can be expressed as:
Q 3 = Q 1 Q 2
As shown in Figure 12, the hydration absorption of sandstone sample 1, 2, and 3 tend to be stable in 946s, 1613s, and 1990s. In order to compare the relative size of the hydration absorption of the sandstone samples, the actual hydration absorption curve is drawn, as shown in Figure 8. The index function shown in Equation (2) is used to fit the hydration absorption data points, and the results of the fitting curve parameters are shown in Table 5.
y = y 0 + A 1 ( 1 exp ( x / t 1 ) ) + A 2 ( 1 exp ( x / t 2 ) )
where y 0 , A 1 , A 2 are parameters, t 1 , t 2 are time.
It can be seen from Figure 13 and Table 5 that the hydration absorption of the three sandstone samples have the consistent trend: in the initial stage, the water absorption and hydration of the rock mass are significant; in the later stage, the water absorption and hydration of the rock mass tend to be stabilized. The quality changes in sandstone samples before and after hydration absorption are counted, as shown in Table 6. Automatic measurement of hydration absorption is the mass of water reduction in the tank minus the mass of water evaporation. Artificial measurement of hydration absorption refers to the mass of sandstone samples after hydration absorption saturation minus the drying mass of sandstone samples before hydration absorption. It can be seen that the actual hydration absorption mass of automatic measurement is close to that of manual measurement after considering water evaporation.

3. Hydration Absorption Deformation Characteristics of Outcrop Porous Sandstone

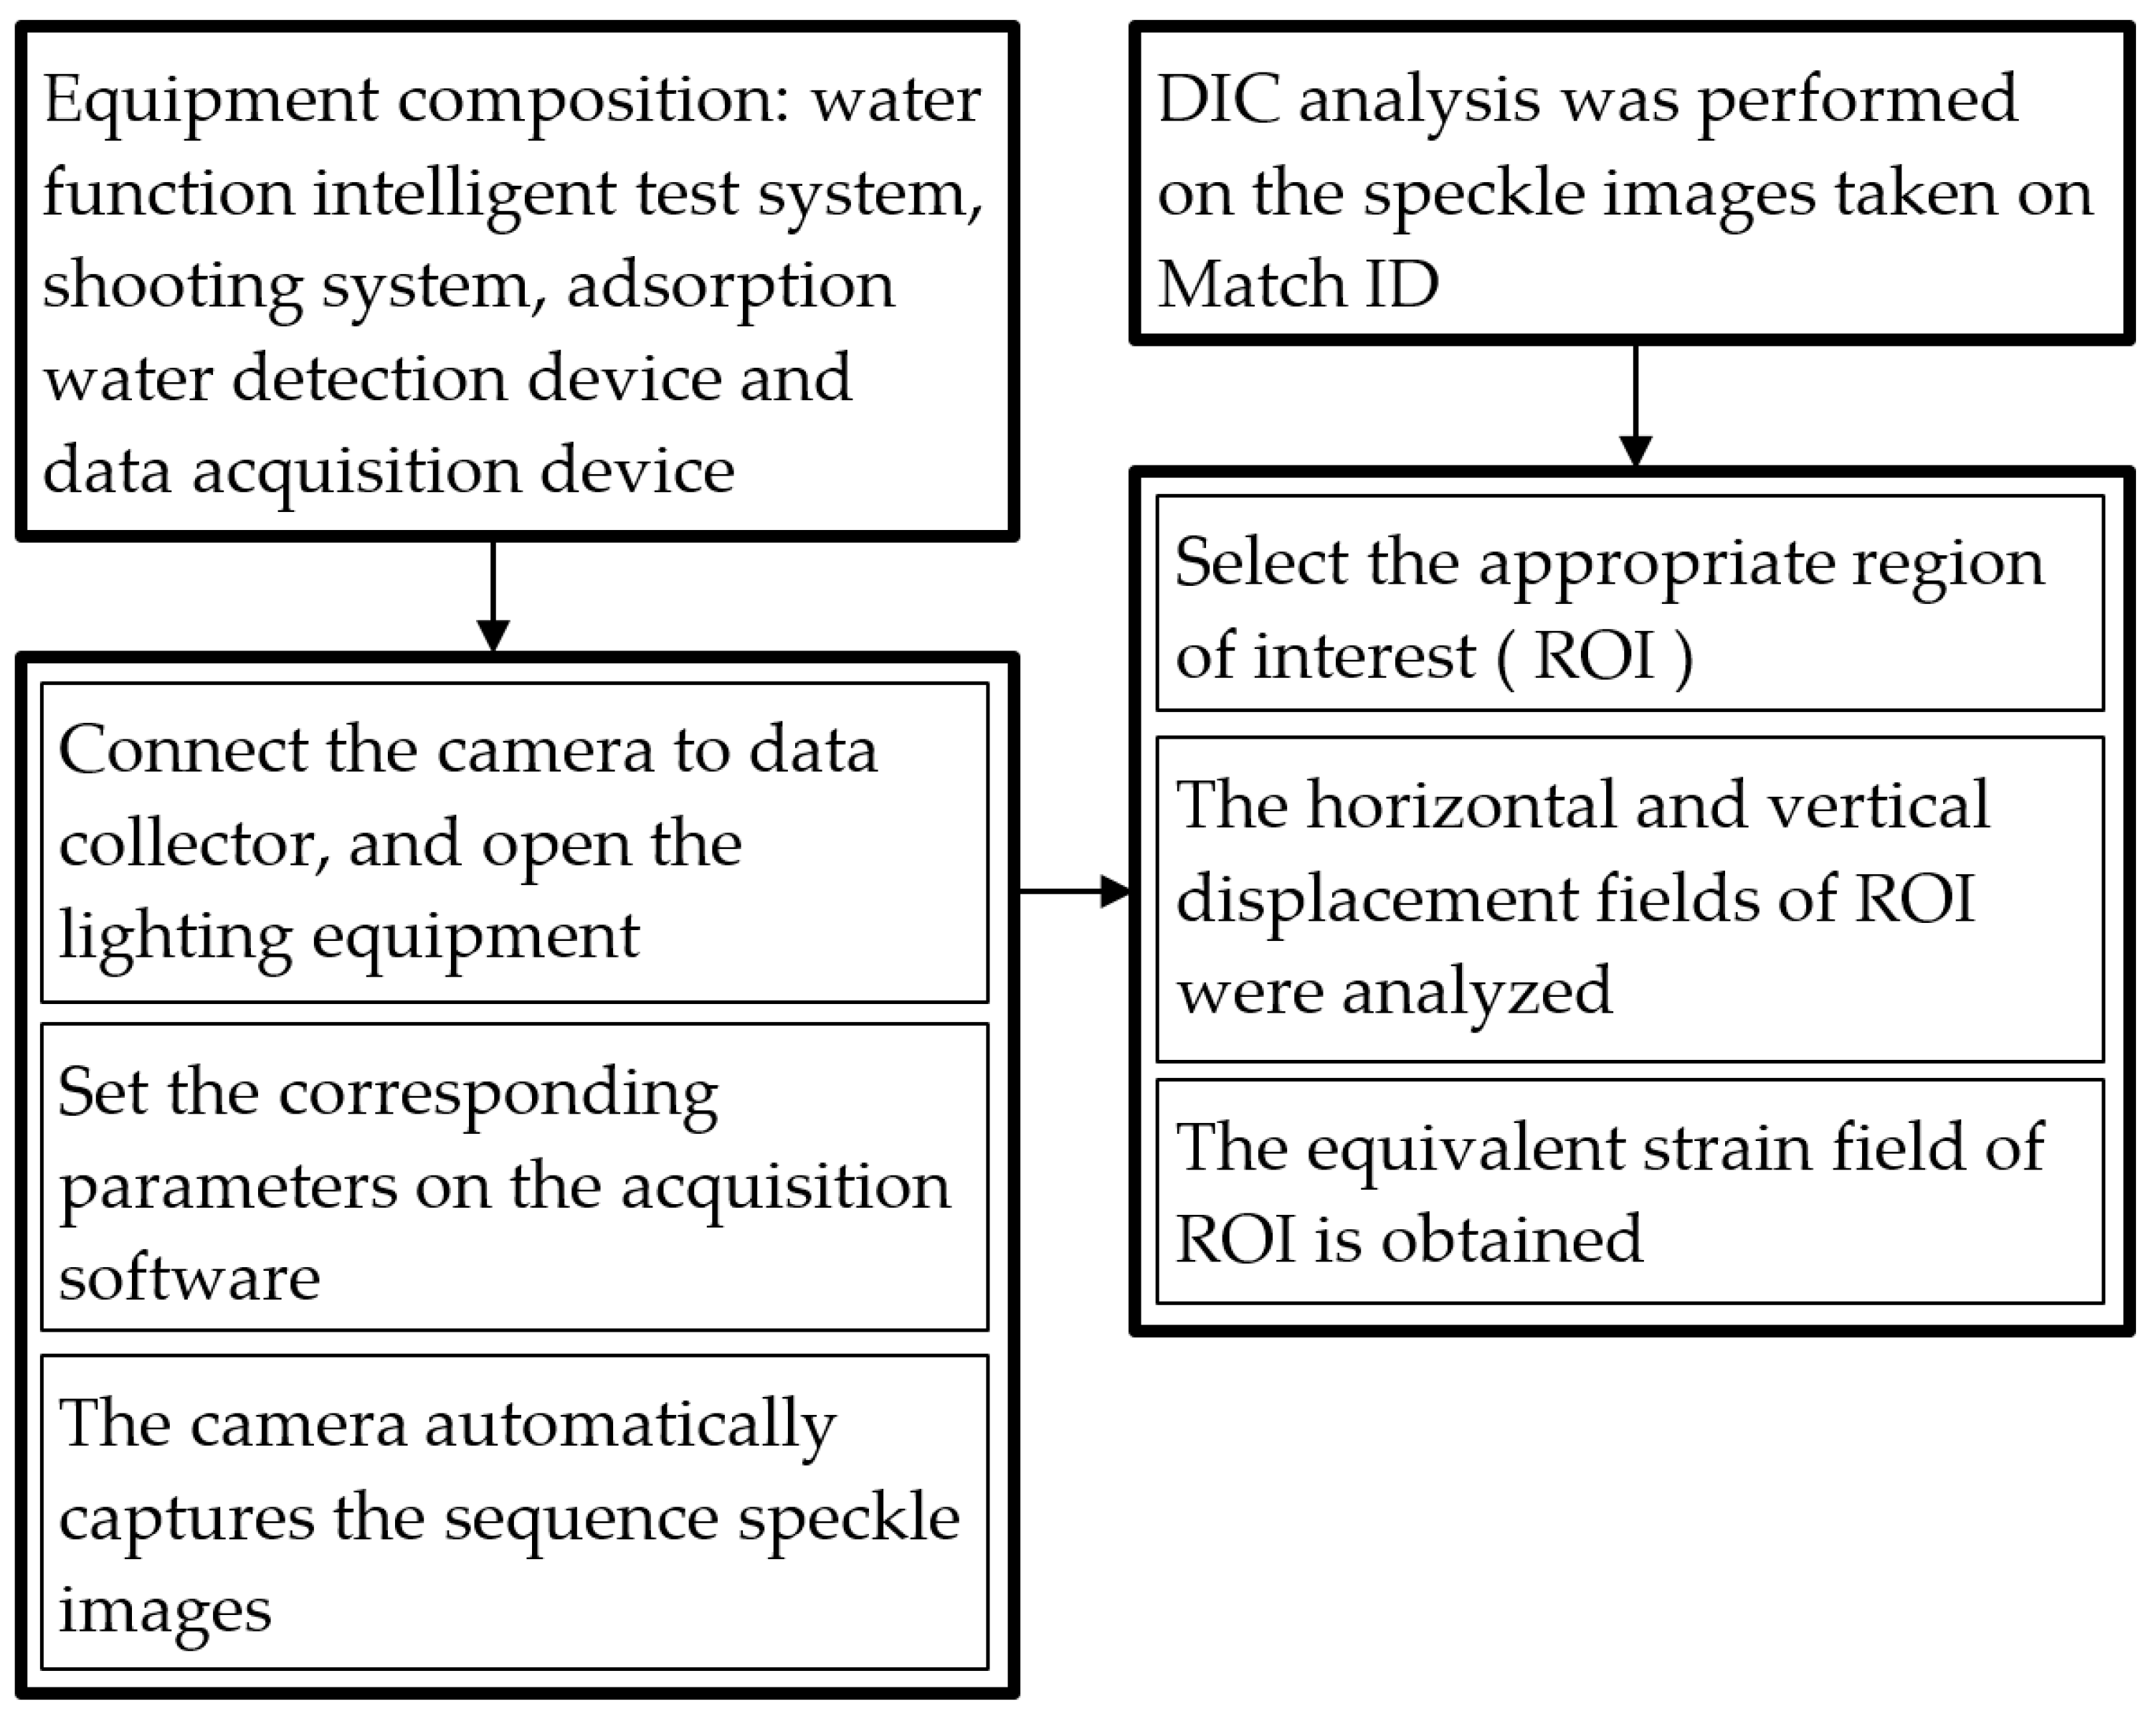
3.1. DIC Measurement Principle

The basic principle of DIC technology is to calculate the relative displacement and deformation between images at different times or under different loads by comparing the grayscale images of the object surface. The basic steps of DIC algorithm include image preprocessing, image matching, deformation calculation, and error analysis. Specifically, DIC technology needs to mark the experimental samples to identify and match them in the captured image sequences. The marking method can be used in a variety of ways such as powder marking, paint spraying marking, and sticker marking. It is usually necessary to distribute it evenly on the surface of the sample to ensure accurate matching at different positions.
DIC technology was used to analyze the collected photos and measure the full-field displacement and strain. Based on the principle of gray conservation, DIC can associate the same matching subset between some reference images (initial position X) and deformed images (current position x). Once the correlation is completed, the deformation gradient can be approximately evaluated by averaging the infinitesimal gradients on a surface D (, given by tensor representation). According to Green’s theorem, the area integral of the deformation gradient is equal to the contour integral of the displacement [11,16]:
F i j ( X ) 1 D D x i X j d w = 1 D D x i n j d s
where ∂D is the boundary between D and the outer unit normal n. When D is the entire region of interest, the global strain is evaluated; when D is defined by the first eight neighbors of a given matching subset, the local strain is determined. Finally, the Green Lagrange strain E is determined to be:
E = 1 2 ( F T F I )
where the superscript T is the transpose of the tensor, and I is the unit tensor. During the experiment, it is necessary to use a high-resolution camera to photograph the surface of the sample and ensure that the distance and angle between the camera and the sample remain unchanged. To avoid the influence of light conditions on the experimental results, it is usually necessary to use a constant light and a constant background and use filters or baffles to reduce the reflection and interference of light. The collected image sequence needs to be preprocessed, including image denoising, smoothing, brightness, and contrast adjustment. Then, the DIC algorithm is used to match the images at different times or under different loads, and the relative displacement and deformation between the images are obtained. Finally, the parameters such as strain distribution of the sample are calculated.

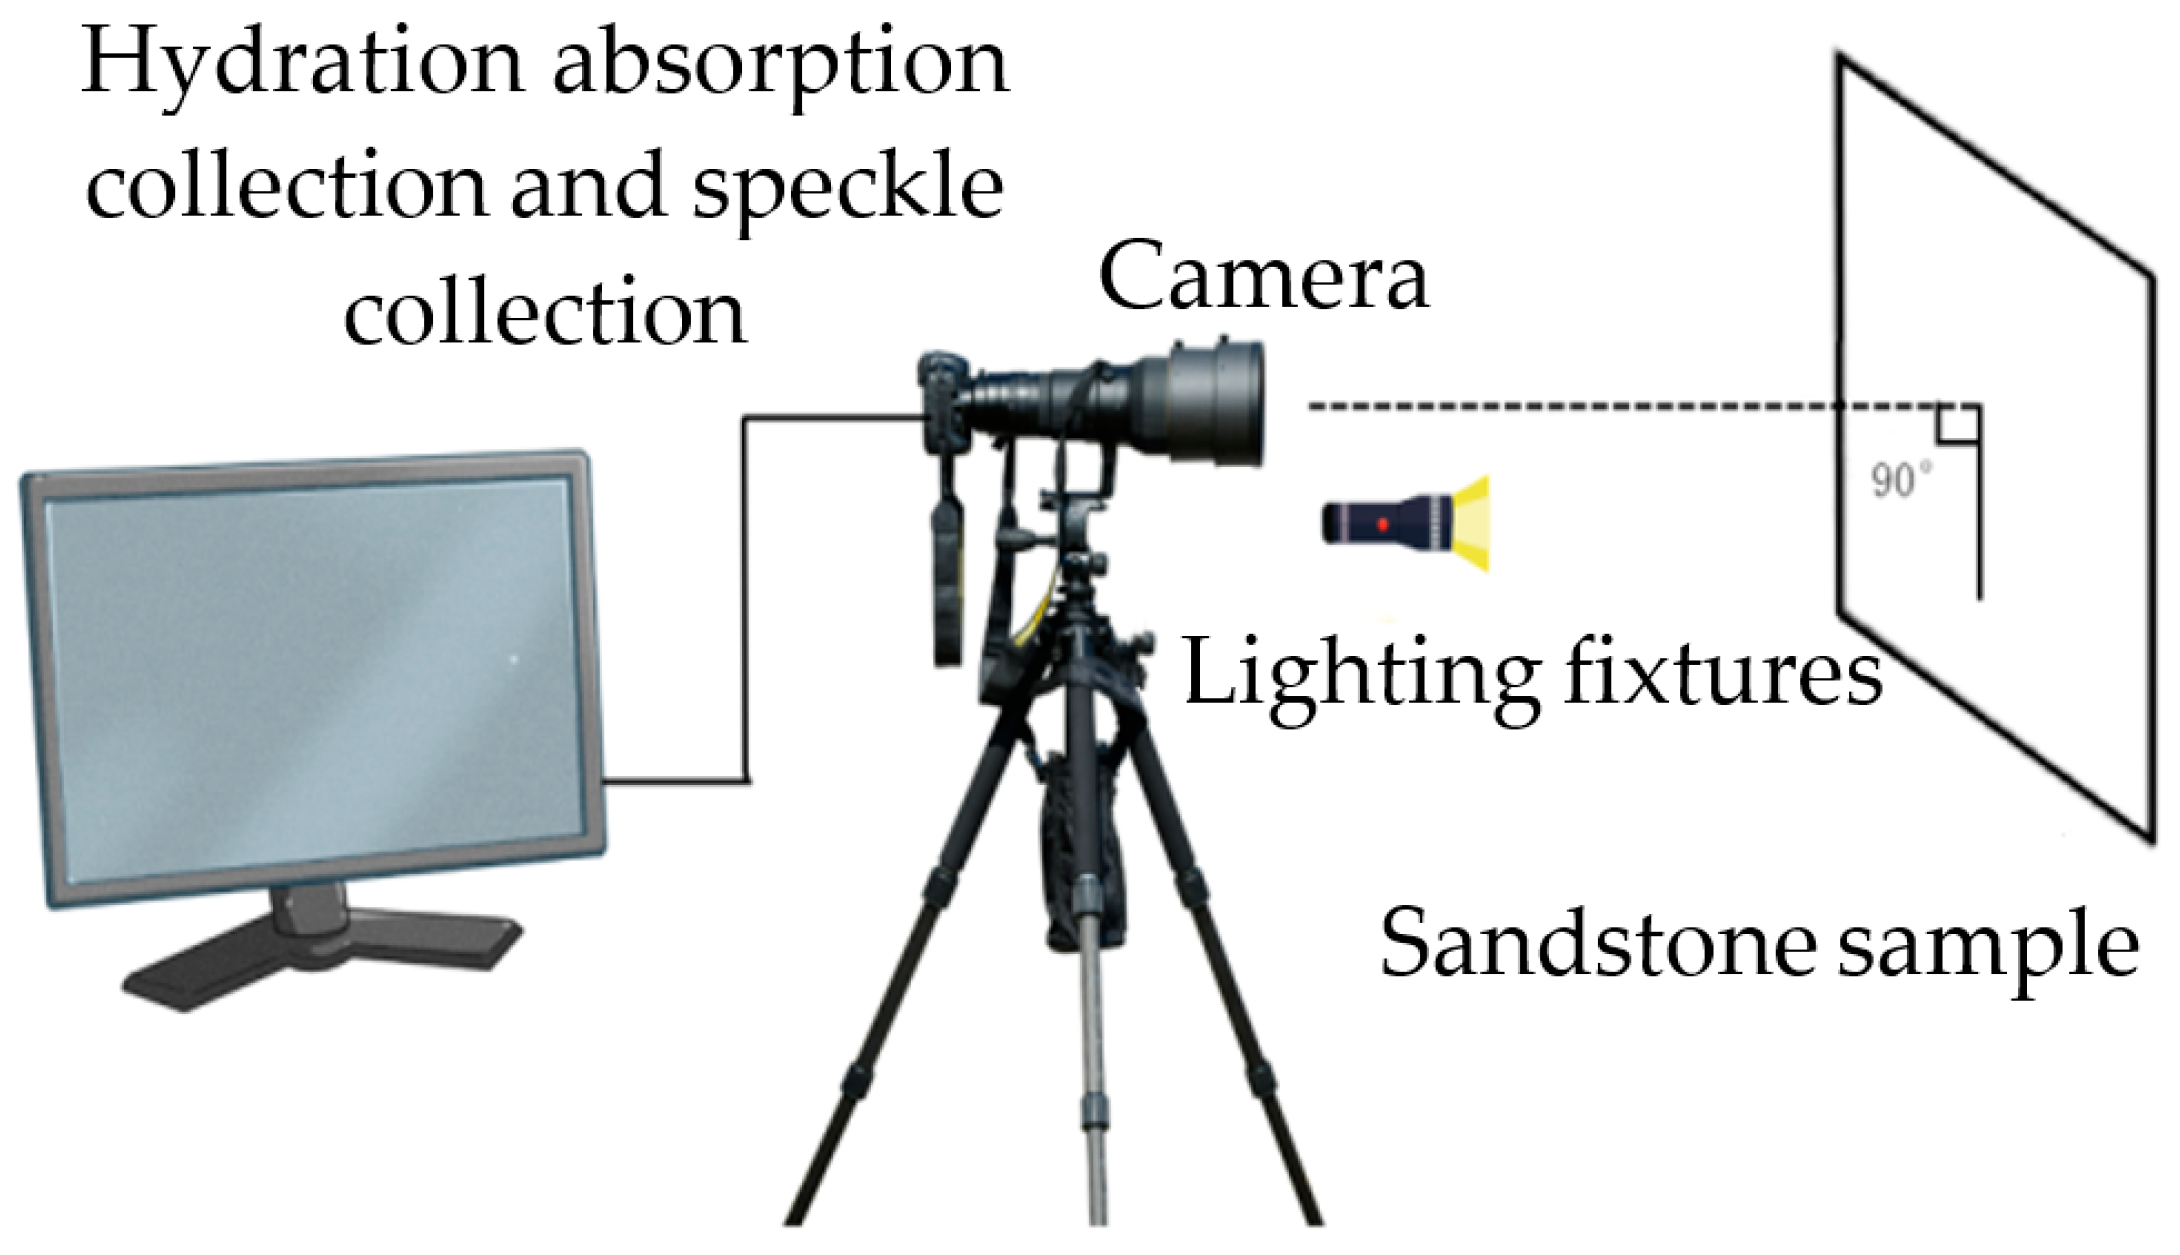
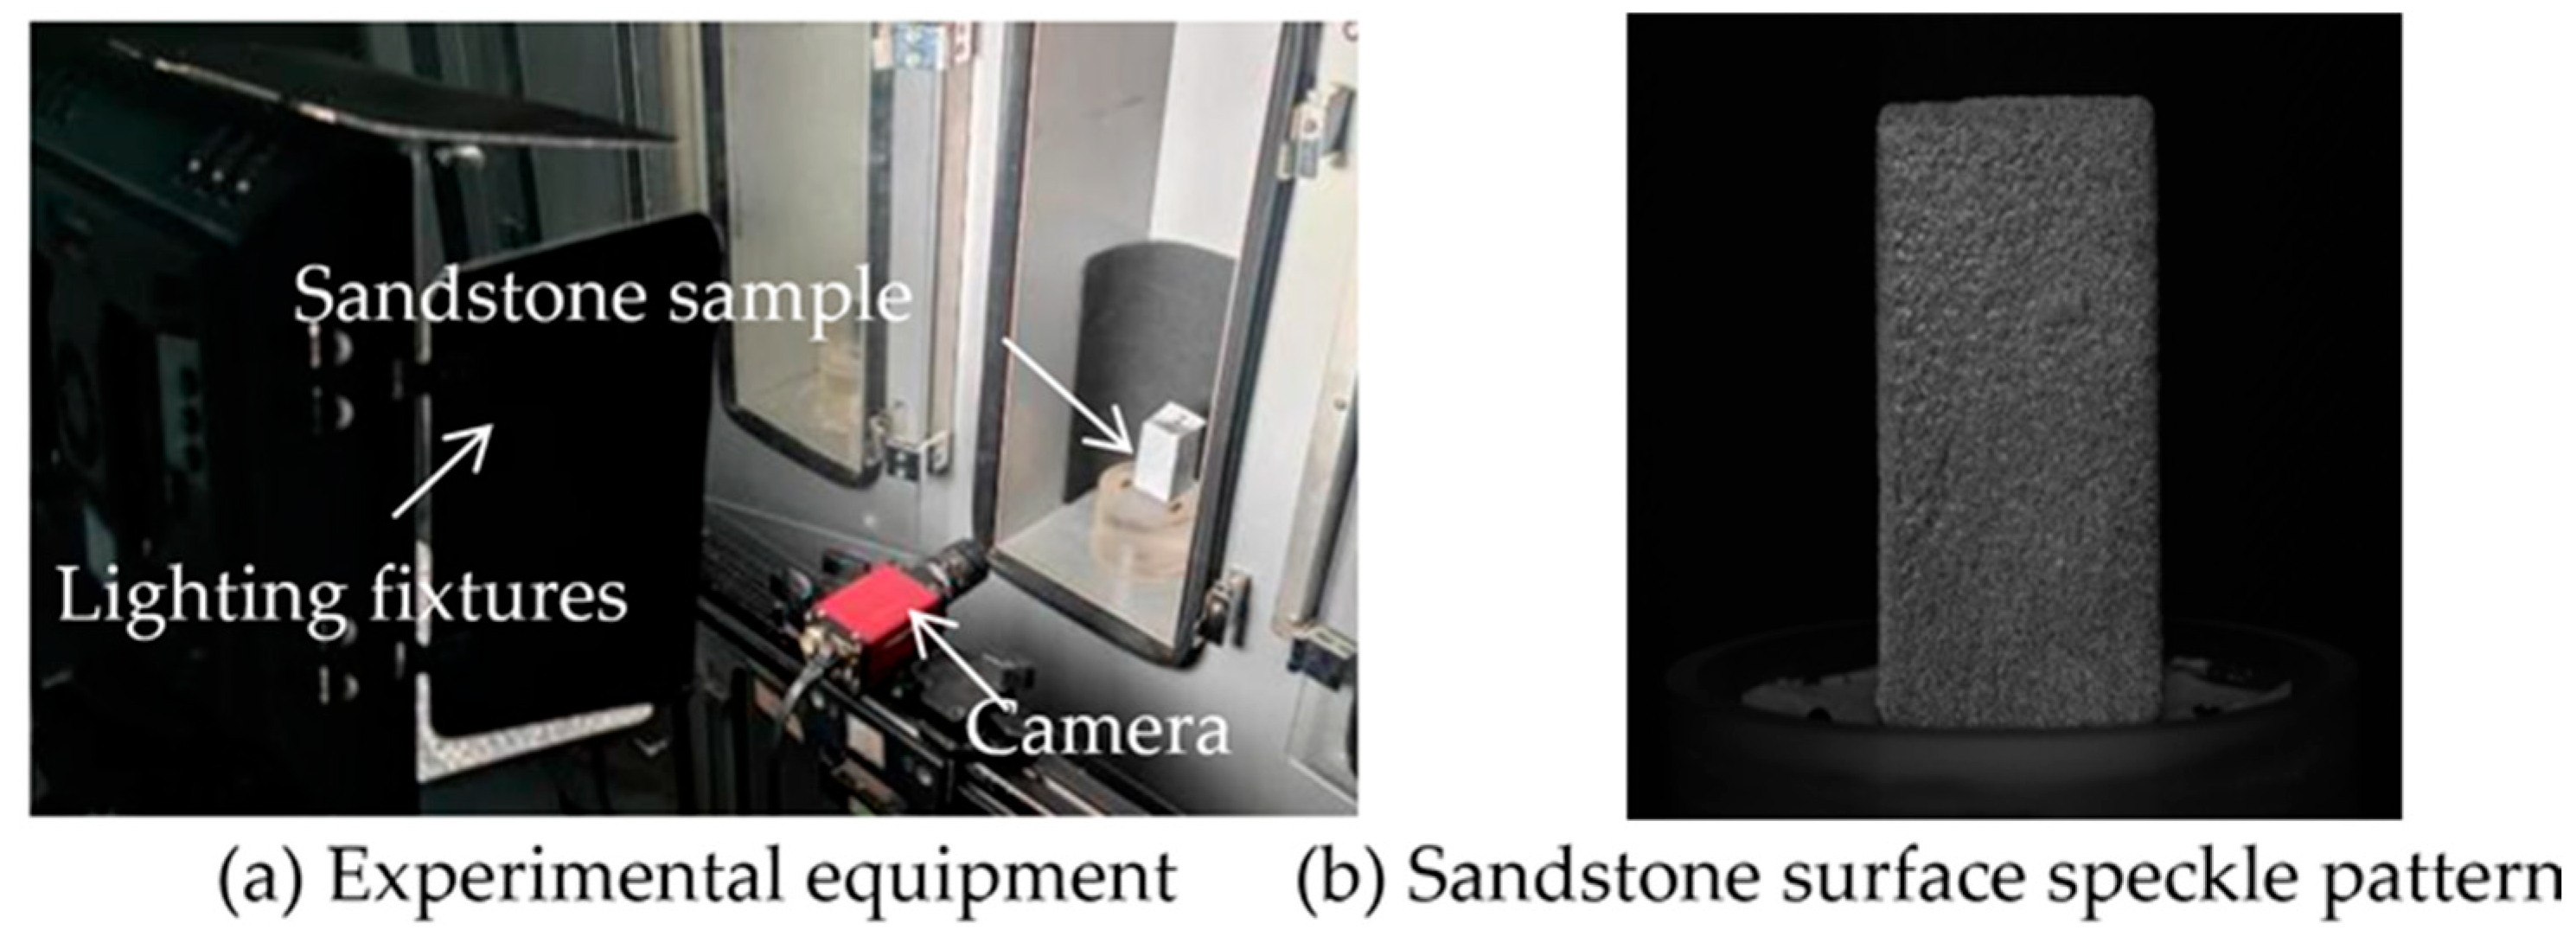
3.2. Automatic Shooting Detection Device and Detection Scheme

3.2.1. Automatic Shooting Detection Device

The automatic shooting detection device schematic diagram is shown in Figure 14. The composition of the whole automatic shooting experimental device includes an intelligent detection system for deep soft rock water physical action, a shooting system, one or more sets of adsorption water detection devices, and data collectors. The shooting system includes a camera, a tripod, a shading cloth, and a lighting device. The camera is mounted on a bracket with the lens directed towards the sandstone sample. The lighting equipment is aligned with the lens direction, and the tripod bracket allows for height adjustment. The data collector consists of a computer equipped with relevant software, which is connected to the camera through a data line to receive captured photos.

3.2.2. Detection Scheme

The deformation measurement program of the pressure-less hydration absorption detection and the steps and schemes of the experimental operation of this study are summarized in Figure 15 and Figure 16.
In the practical application of DIC, because the speckle pattern is the carrier of the deformation information of the specimen, these speckle patterns must have a random gray distribution. There are mainly three kinds of speckle patterns commonly used in analysis. (1) Natural speckle pattern: the speckle pattern composed of the natural texture on the surface layer of the specimen. (2) Laser speckle pattern: speckle pattern formed by laser irradiation on the surface of the sample. (3) Artificial speckle pattern: the artificial speckle pattern formed by randomly spraying white paint and black paint on the surface of the specimen.
To make the data obtained by the experiment more reliable and the error smaller, we decided to improve the speckle spraying method to obtain a better speckle pattern. Dozens of reference images are averaged, and the image noise is reduced by averaging the grayscale images. The matte white paint is sprayed on the surface of the sample to form a white base, and then the black paint is randomly sprayed on the white base to obtain a more detailed black-and-white speckle effect. The speckle images were taken while the pressure-less hydration absorption detection were carried out, and the DIC analysis of the sequence images was carried out after the test. The sandstone sample and test images are shown in Figure 17.

3.3. Results and Analysis for Pressure-Less Hydration Absorption Deformation Characteristics of Sandstone

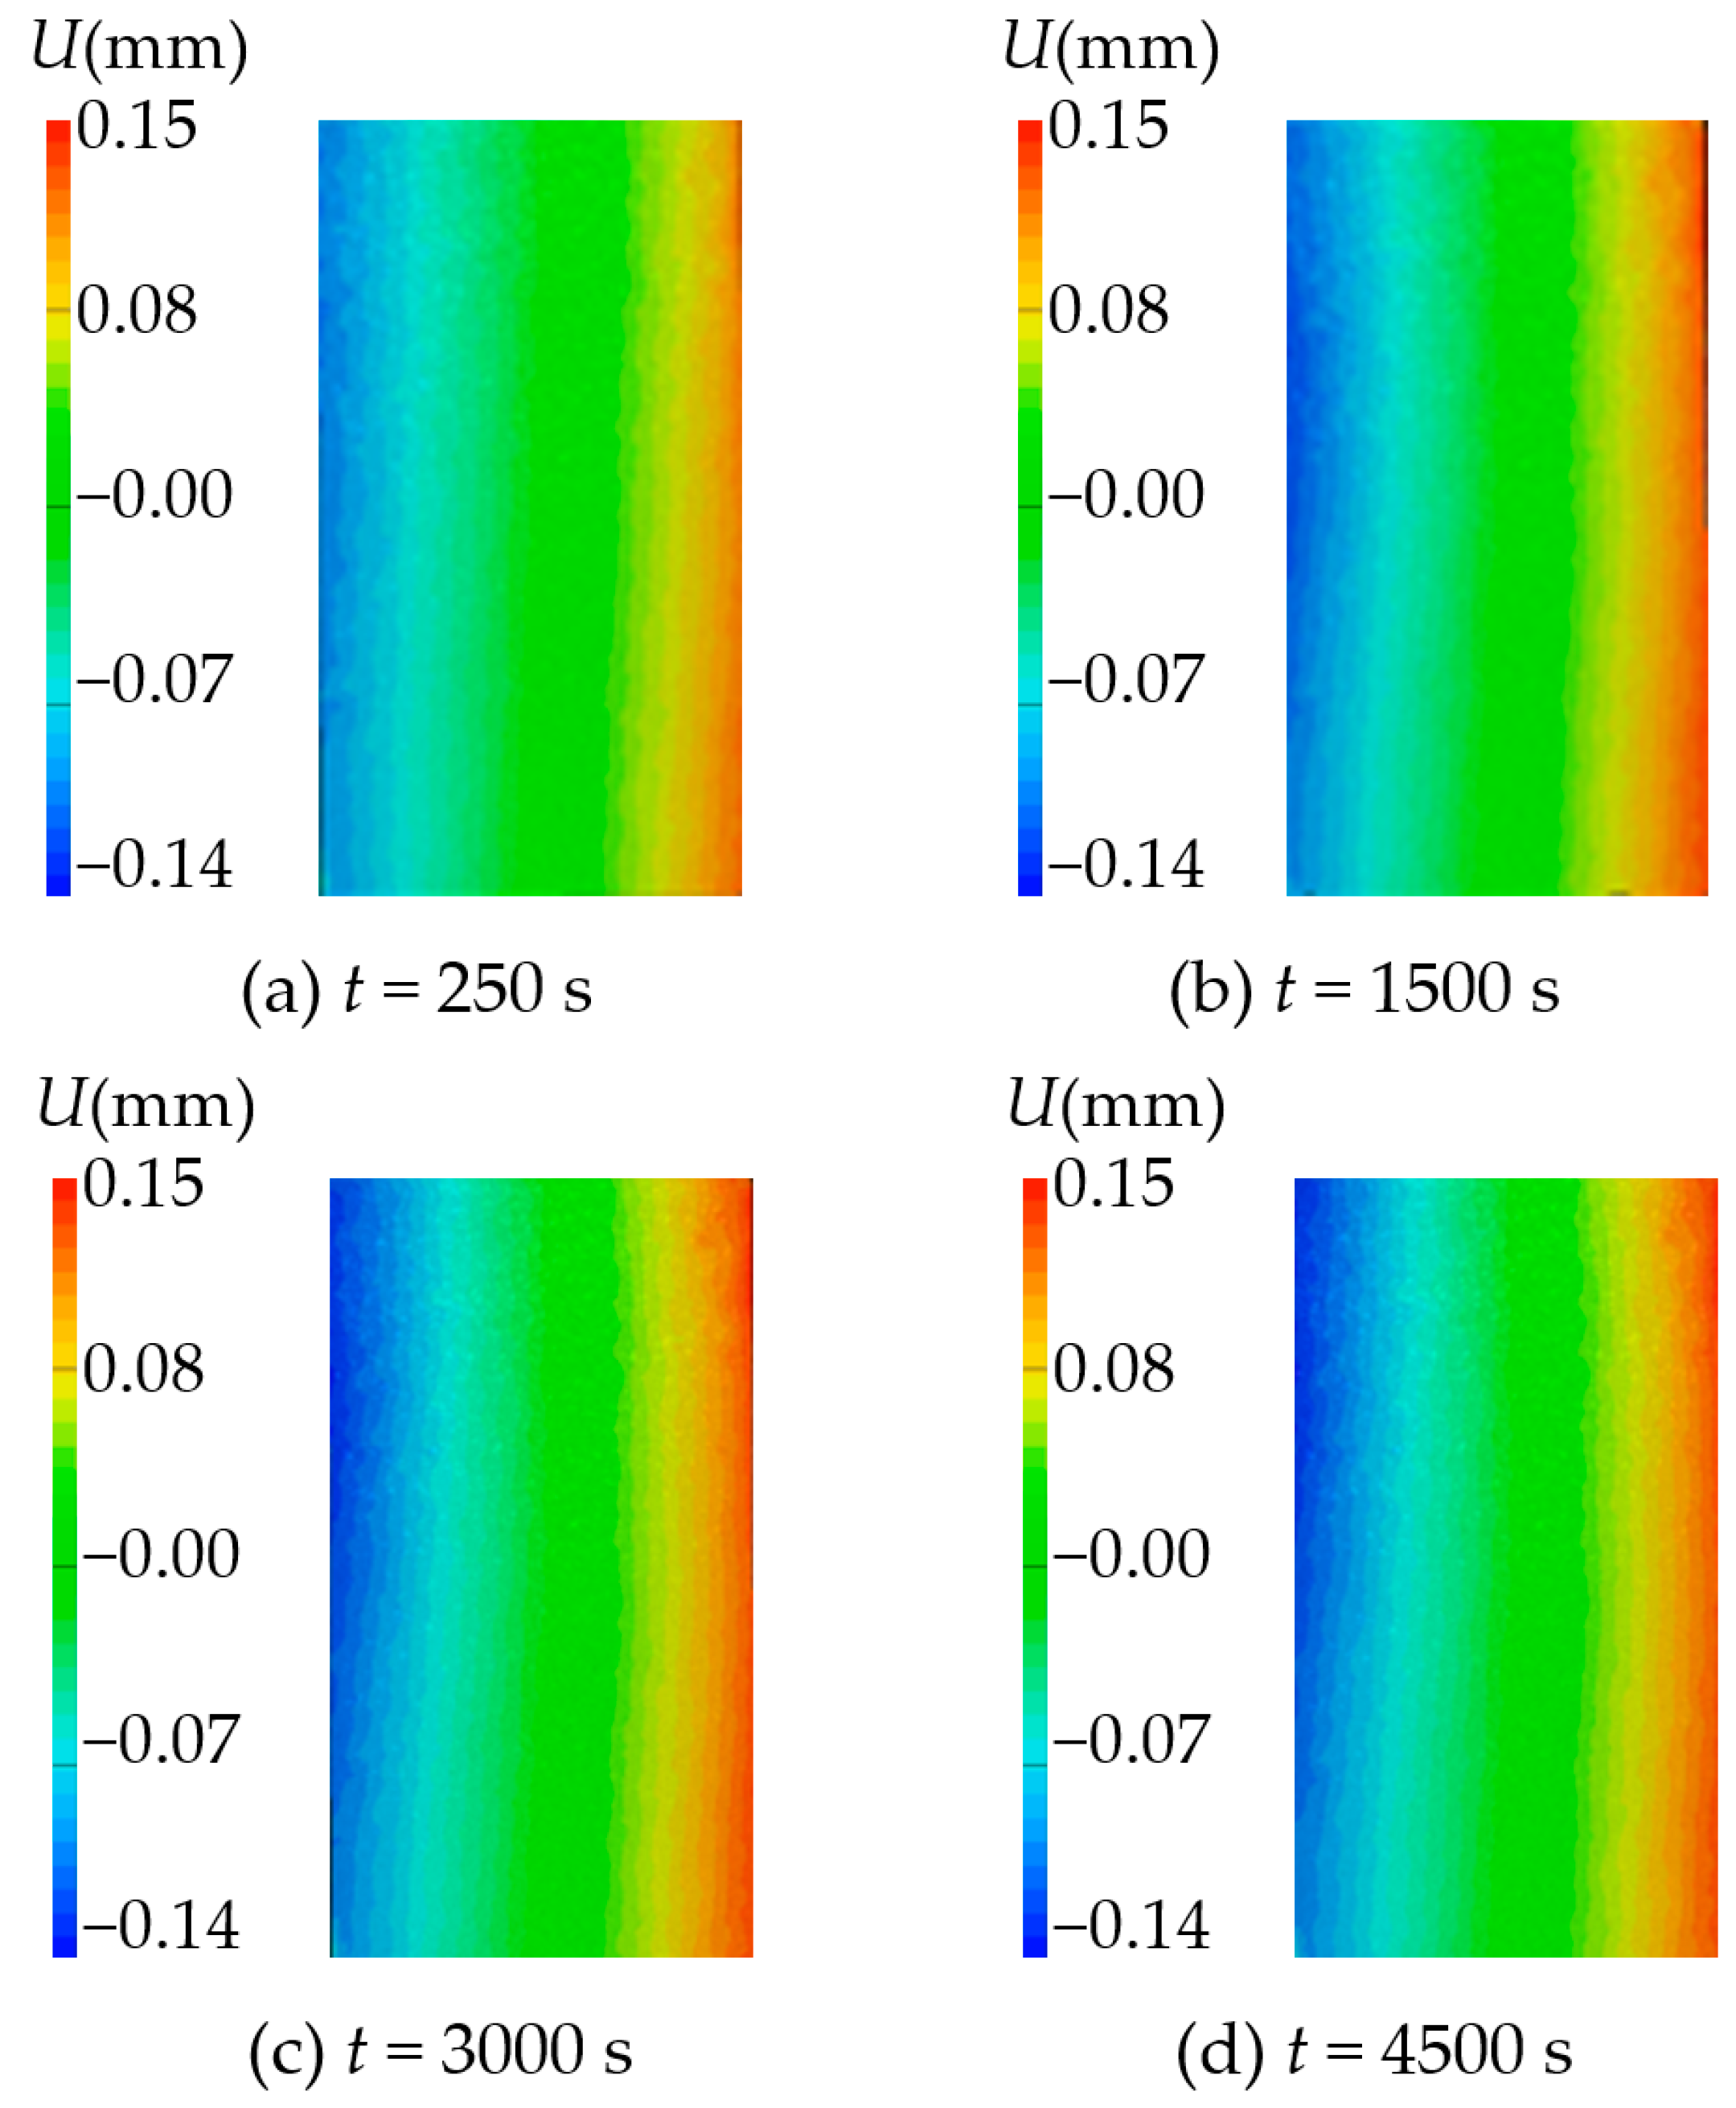
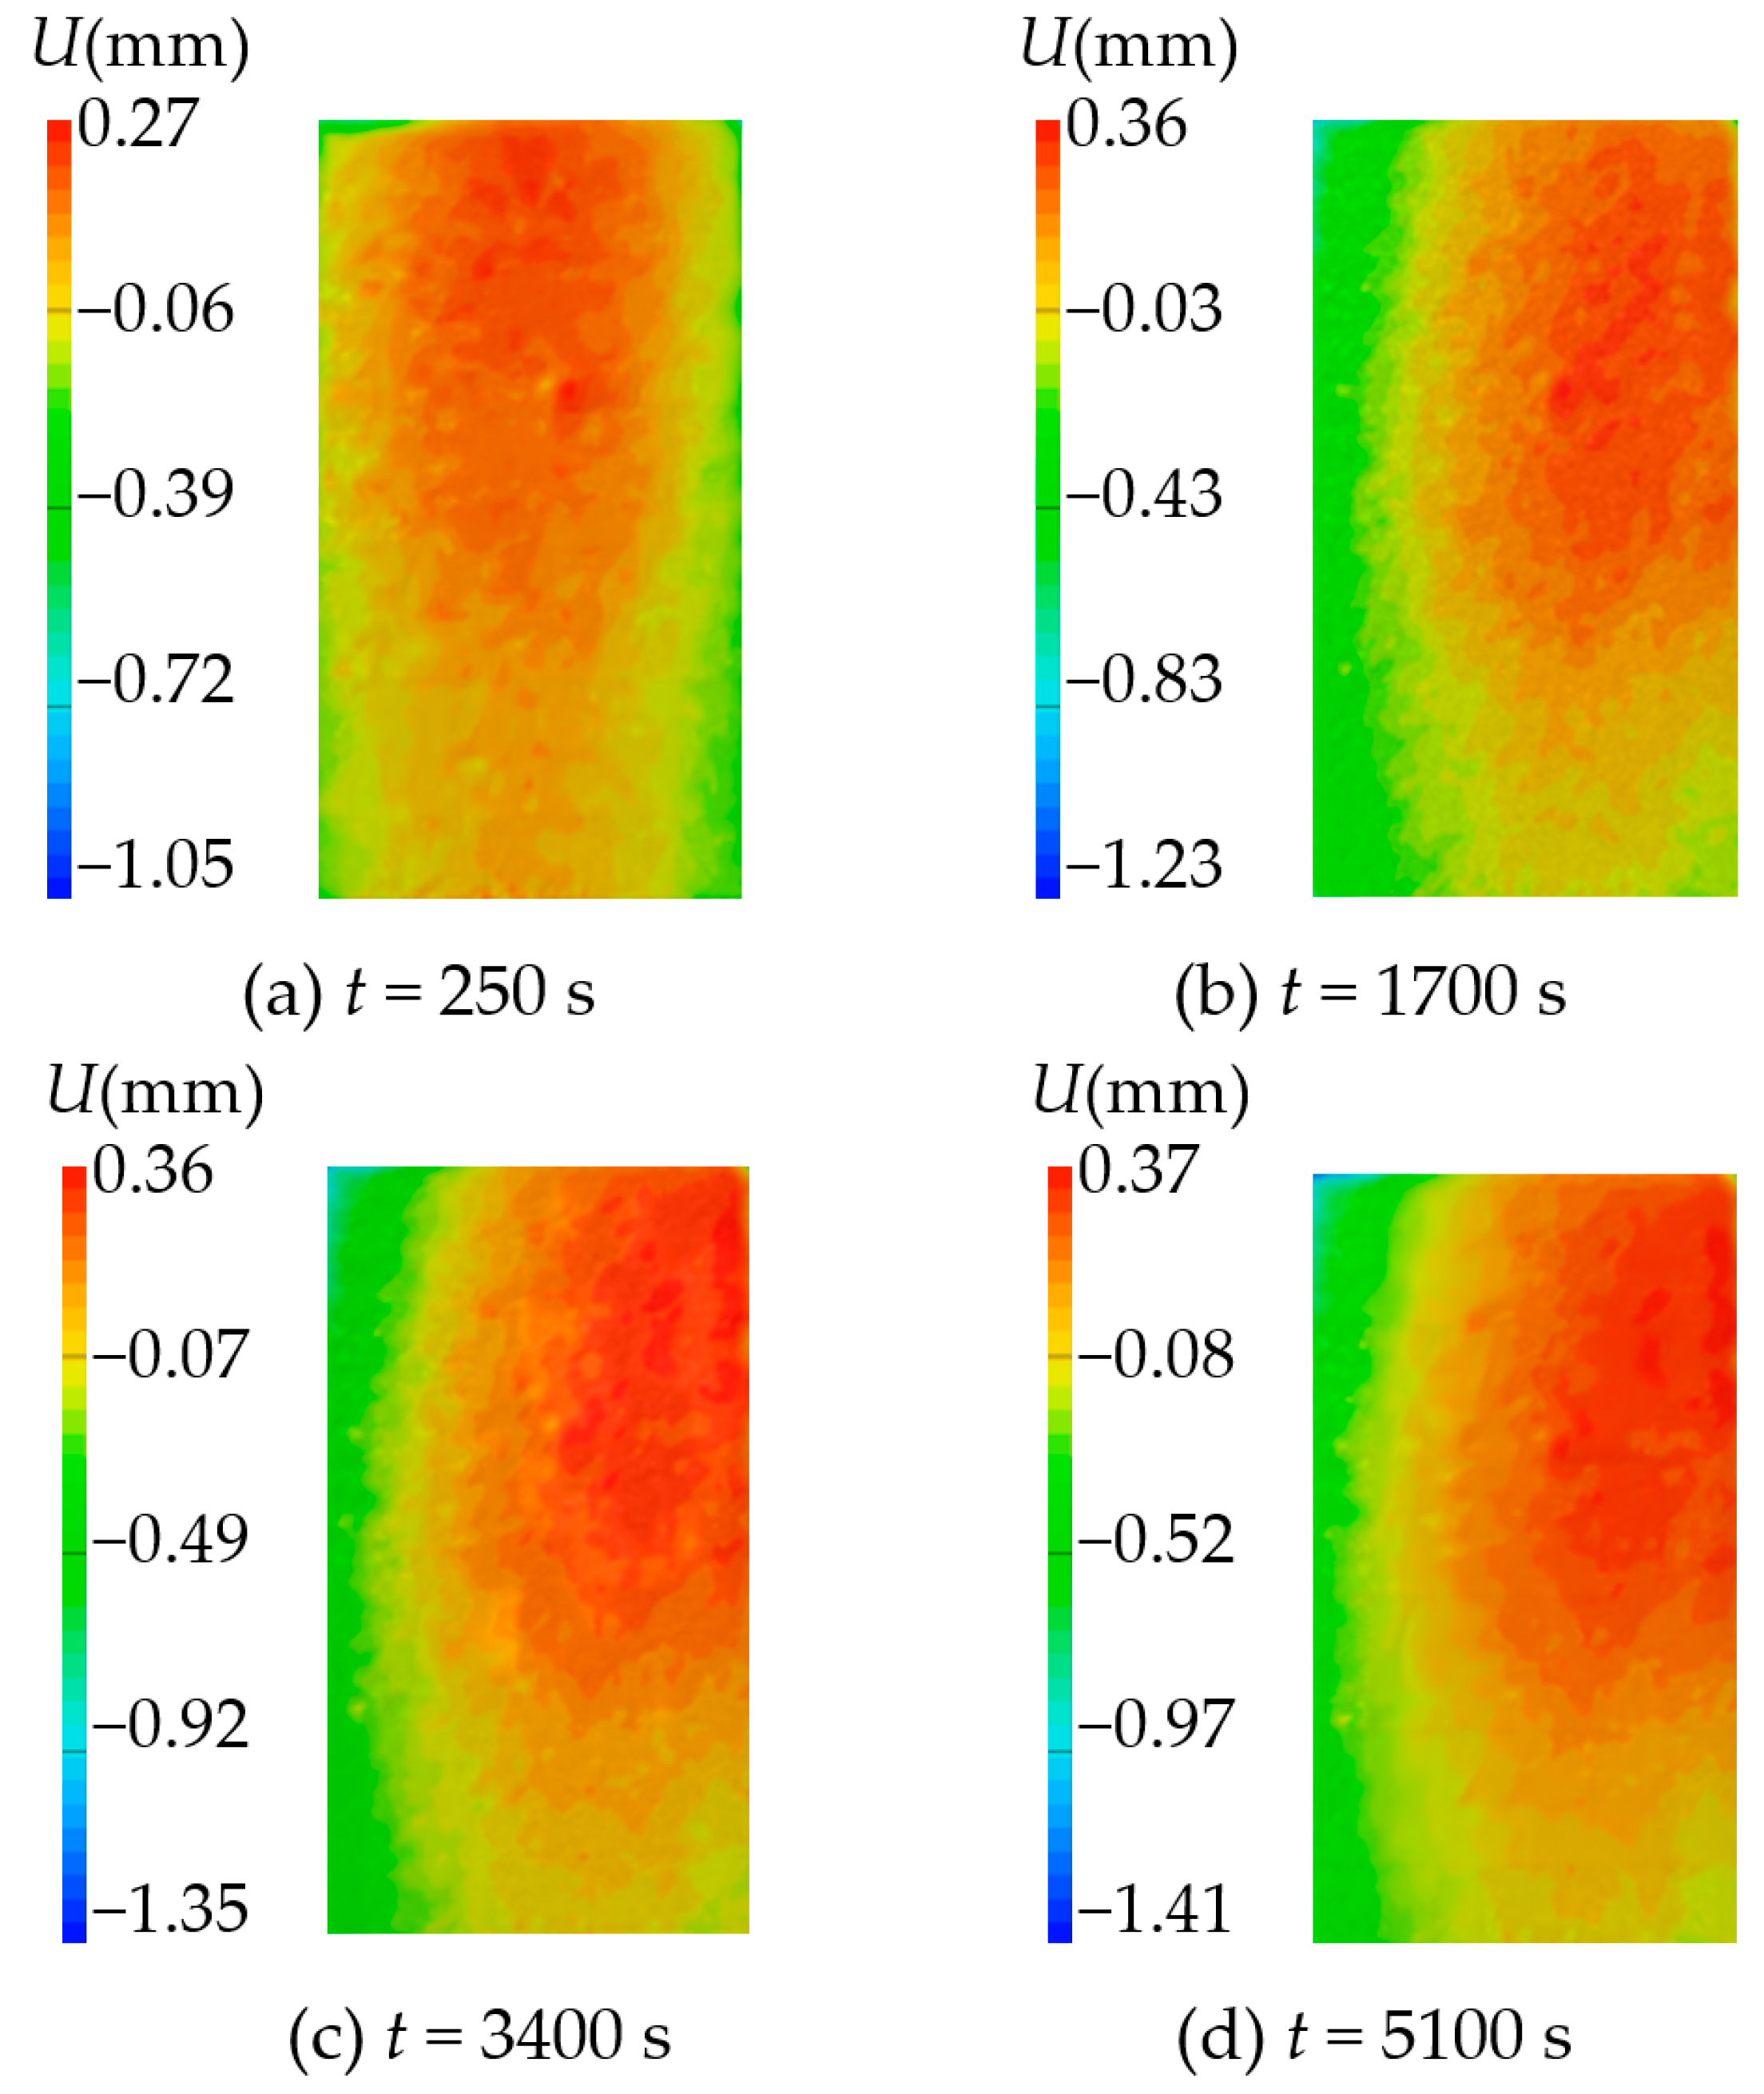
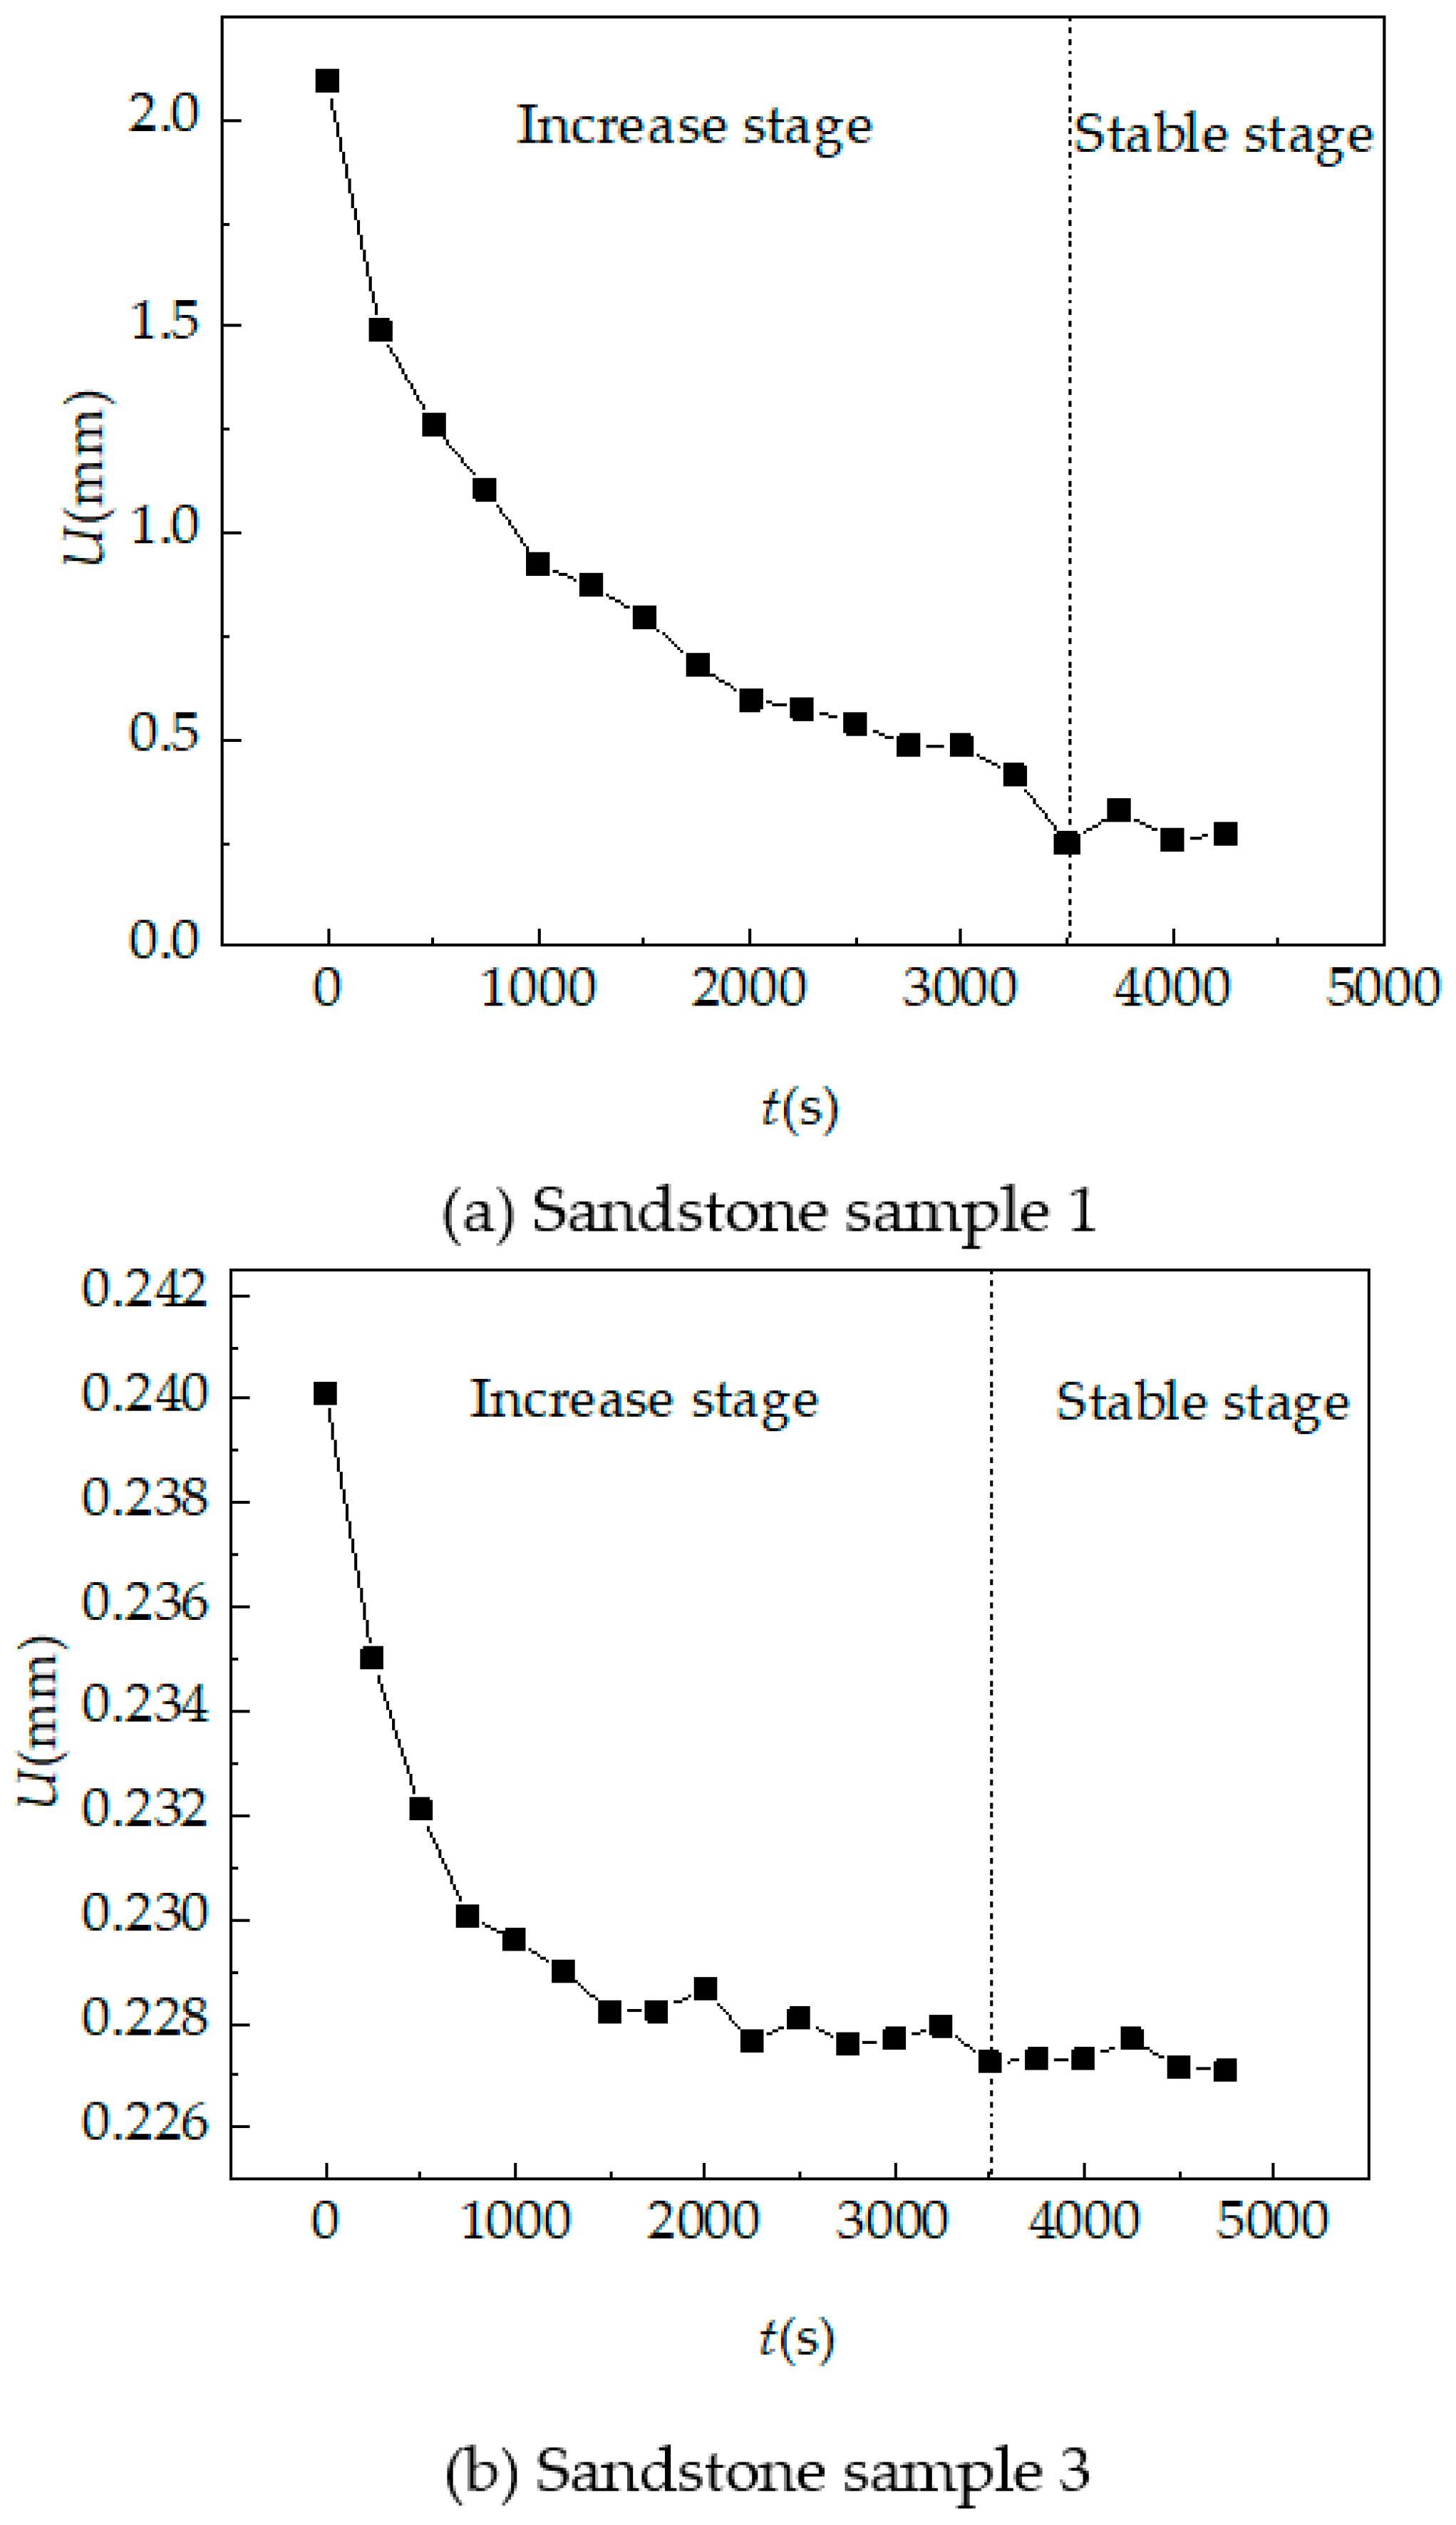
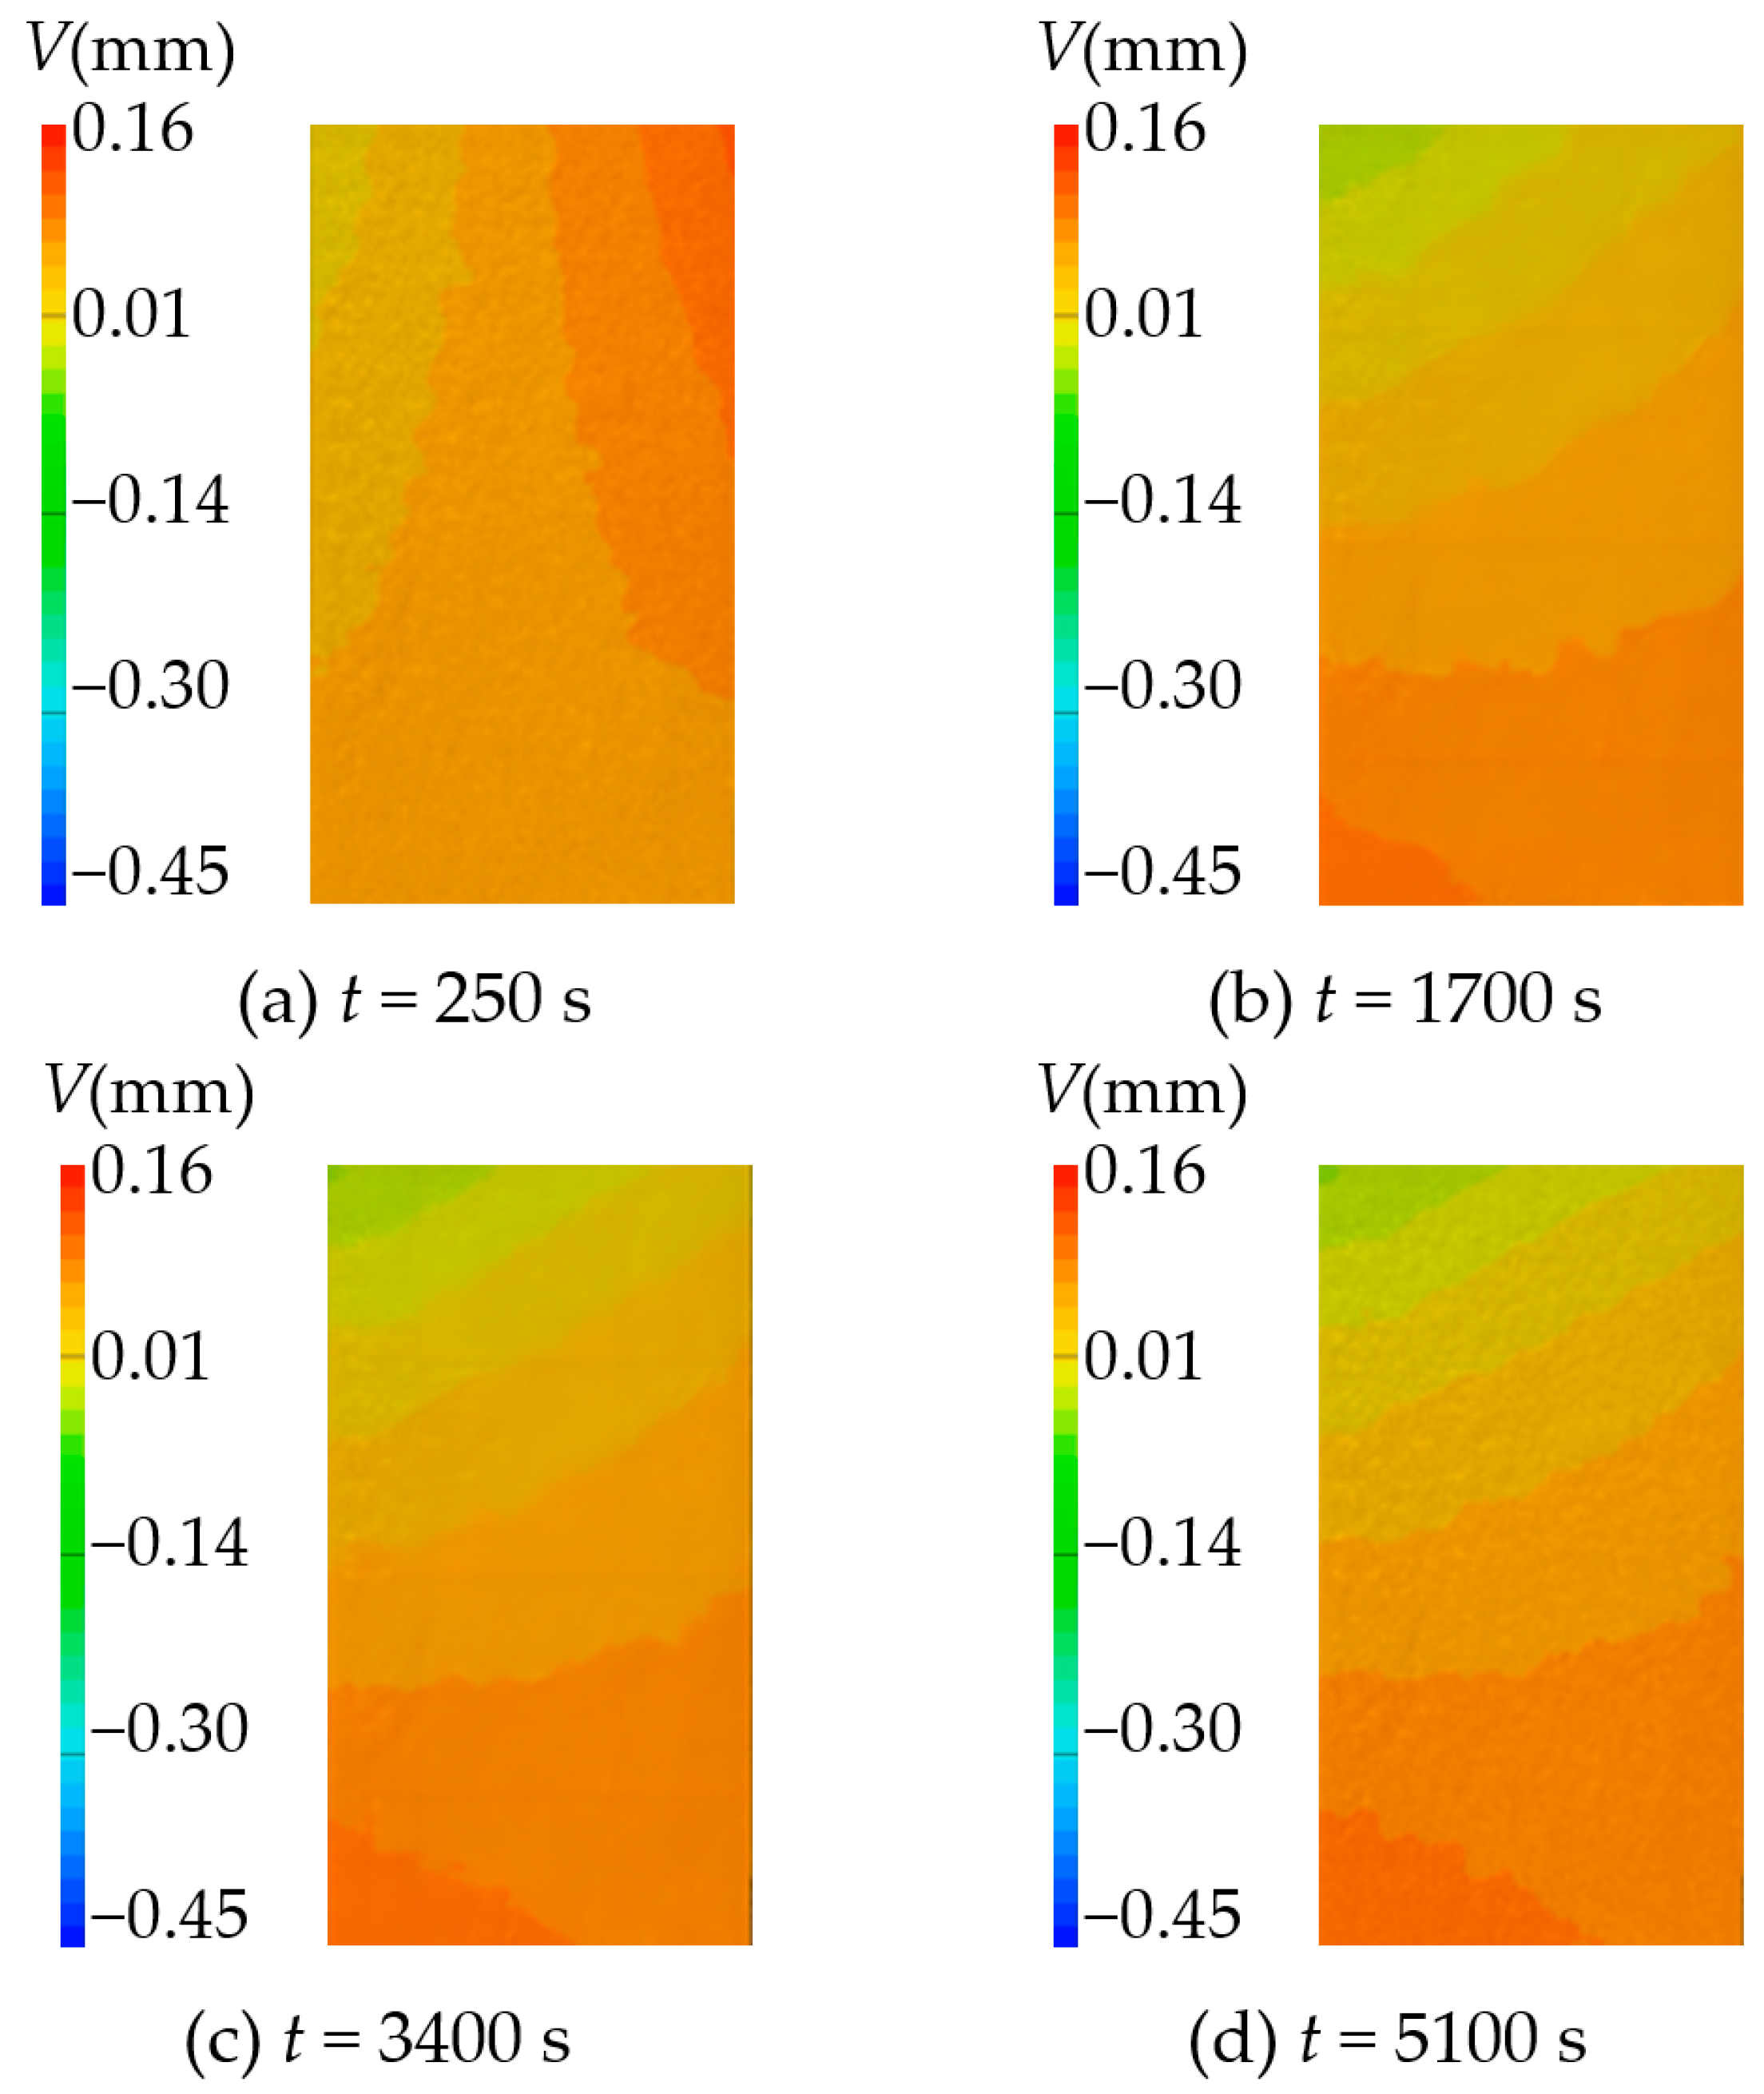
3.3.1. Displacement Field and Variation Curve

Sandstone samples 1 and 3 were used for analysis, and the displacement field of the sample surface at different hydration absorption times was obtained. The samples produced horizontal displacement (U(mm)) and vertical displacement (V(mm)) after hydration absorption, which is caused by the expansion of pore hydration absorption. The horizontal displacement field at a different time is shown in Figure 18 and Figure 19. By observing the displacement cloud diagram of sandstone sample 1, it was found that the horizontal displacement of the sample after hydration absorption is not uniform. The specific performance is that the displacement of the upper half is larger than that of the lower half, and the left half is dominated by negative displacement, while the right half domain is dominated by positive displacement. There is almost no displacement in the middle domain, which is due to the constraint effect in the middle of the sample. The displacement cloud diagram of sandstone sample 3 reveals a notable disparity between the upper and lower halves, with greater displacement observed in the former. Negative displacement prevails in the left domain, while the middle and right domains predominantly exhibit positive displacement. The analysis shows that the horizontal displacement cloud diagram of sandstone sample 1 is more in line with the actual situation of sandstone hydration absorption and expansion.
The horizontal average displacement curve at a different time is shown in Figure 20. It can be seen that the sample will have a large displacement at the beginning, and with the increase in time, the horizontal displacement of the sample increases gradually, and finally tends to be constant. The two curves better reflect the horizontal average displacement characteristics of sandstone after hydration absorption and expansion.
The vertical displacement fields at different moments are shown in Figure 21 and Figure 22. By observing the displacement cloud diagram of sandstone sample 1, it is found that the vertical displacement of the sample after hydration absorption is not uniform. The specific performance is that the displacement of the upper half is larger than that of the lower half. The upper half is dominated by negative displacement, and the lower half is dominated by positive displacement. There is almost no displacement in the middle-down regions. The displacement cloud diagram of sandstone sample 3 shows that the inhomogeneity of vertical displacement is low. In the initial stage, the displacement of the upper right corner surpasses that of the upper left corner. In subsequent stages, the displacement of the lower left corner surpasses that of the upper right corner, indicating that the displacement of the upper part of the whole is greater than that of the lower part.
The vertical average displacement curve is shown in Figure 23. It can be seen that the sandstone sample 3 will produce a large displacement at the beginning. With the increase in time, the vertical displacement of the sample gradually flattens out, and finally tends to be constant, which better reflects the characteristics of the vertical average displacement of sandstone after hydration absorption and expansion. The vertical average displacement curve of sandstone sample 1 is tortuous and the error is large, so the law cannot be obtained. It is believed that the error is caused by the poor sample speckle quality.

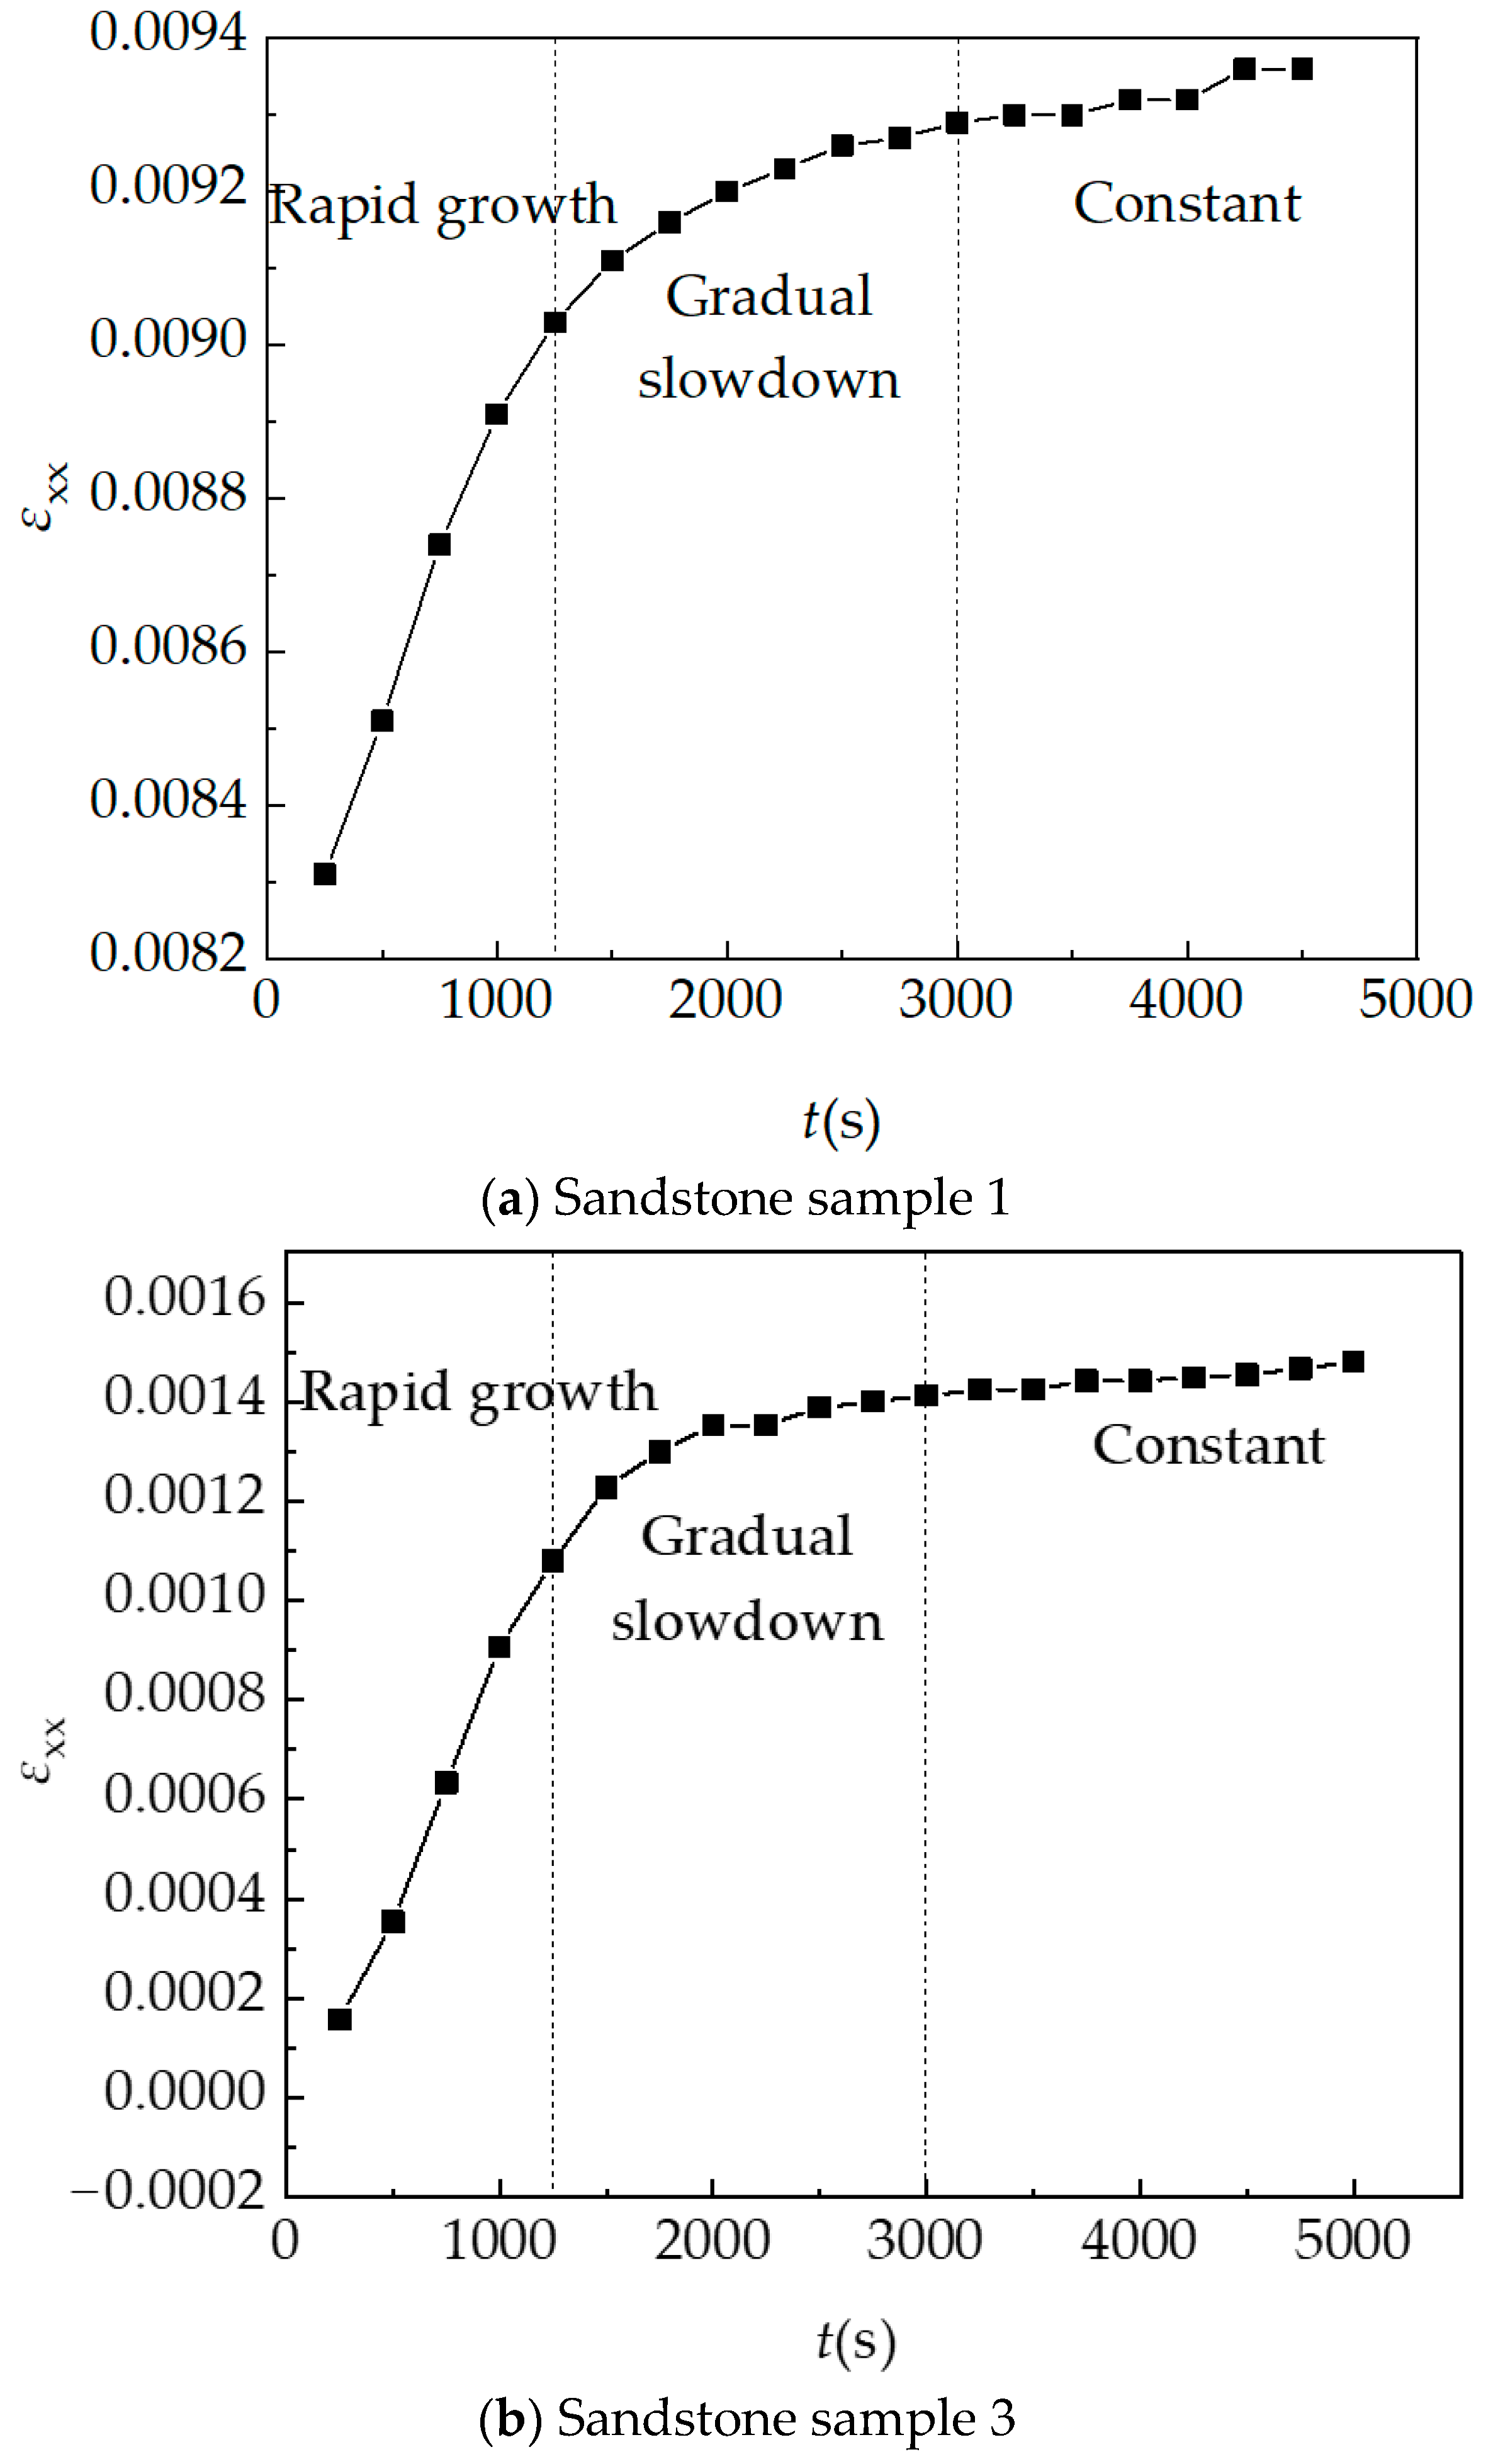
3.3.2. Strain Field and Strain Variation Curve

Through the displacement field and the horizontal strain field (), the strain field of the sandstone sample surface at a different hydration absorption time is obtained, as shown in Figure 24 and Figure 25. The strain cloud diagram of sandstone sample 1 shows that the horizontal strain generated in the whole region of the sample after hydration absorption increases with time, and the change is relatively uniform. The overall change trend of the strain cloud diagram of sandstone sample 3 is the same as that of sandstone sample 1. During the hydration absorption detection, the horizontal strain of the whole domain increases with time, but the deformation is not uniform. The strain in the left domain is larger than that in the right domain, so we speculate that it is caused by the uneven bedding of sandstone.
The horizontal strain curve is shown in Figure 26. With the change of time, the horizontal strain curve of the sample experienced three stages: rapid growth, gradual slowdown, and constant. It is considered that these two curves can better reflect the horizontal strain characteristics of sandstone after hydration absorption and expansion.
The vertical strain field () at different time is shown in Figure 27 and Figure 28. By analyzing the strain cloud diagram of sandstone sample 1, it can be found that the vertical strain throughout the sample domain exhibited irregular growth following hydration absorption. This observation indicated that the strain in the upper half exceeded that in the lower half. The overall change trend of the strain cloud diagram of sandstone sample 3 is the same as that of sandstone sample 1. The vertical strain of the whole domain increases with time during the hydration absorption detection, and the change is more uniform.
The vertical strain curve is shown in Figure 29. With the change of time, the vertical strain curve of the sample experienced three stages: rapid growth, gradual slowdown, and constant. It is considered that these two curves can better reflect the vertical strain characteristics of sandstone after hydration absorption and expansion.
The von Mises equivalent strain field () at a different time is shown in Figure 30 and Figure 31. By observing the strain cloud diagram of sandstone sample 1, it is found that the equivalent strain of the whole domain of the sample increased with the increase in time after hydration absorption, and the change is more uniform. In the strain cloud diagram of sandstone sample 3, the equivalent strain generated in the sample after hydration absorption is not uniform. The equivalent strain in the left and middle regions gradually increases with time, while the equivalent strain in the right region gradually decreases with time.
The equivalent strain curve is shown in Figure 32. With the change in time, the equivalent strain curve of the sample experienced three stages: rapid growth, gradual slowdown, and constant. It is considered that these two curves can better reflect the equivalent strain characteristics of sandstone after hydration absorption and expansion.

3.3.3. Relationship between Hydration Absorption and Deformation

To study the effect of hydration absorption on the deformation of the sandstone sample, the hydration absorption–strain curve is plotted. As shown in Figure 33, it can be seen that the deformation of the sample increases rapidly while the hydration absorption increases rapidly in the initial stage. With the change of time, the hydration absorption gradually decreases to saturation, and the deformation of the sample gradually slows down. After saturation, the interaction between water and sandstone continues, and the deformation stops after a period of time.

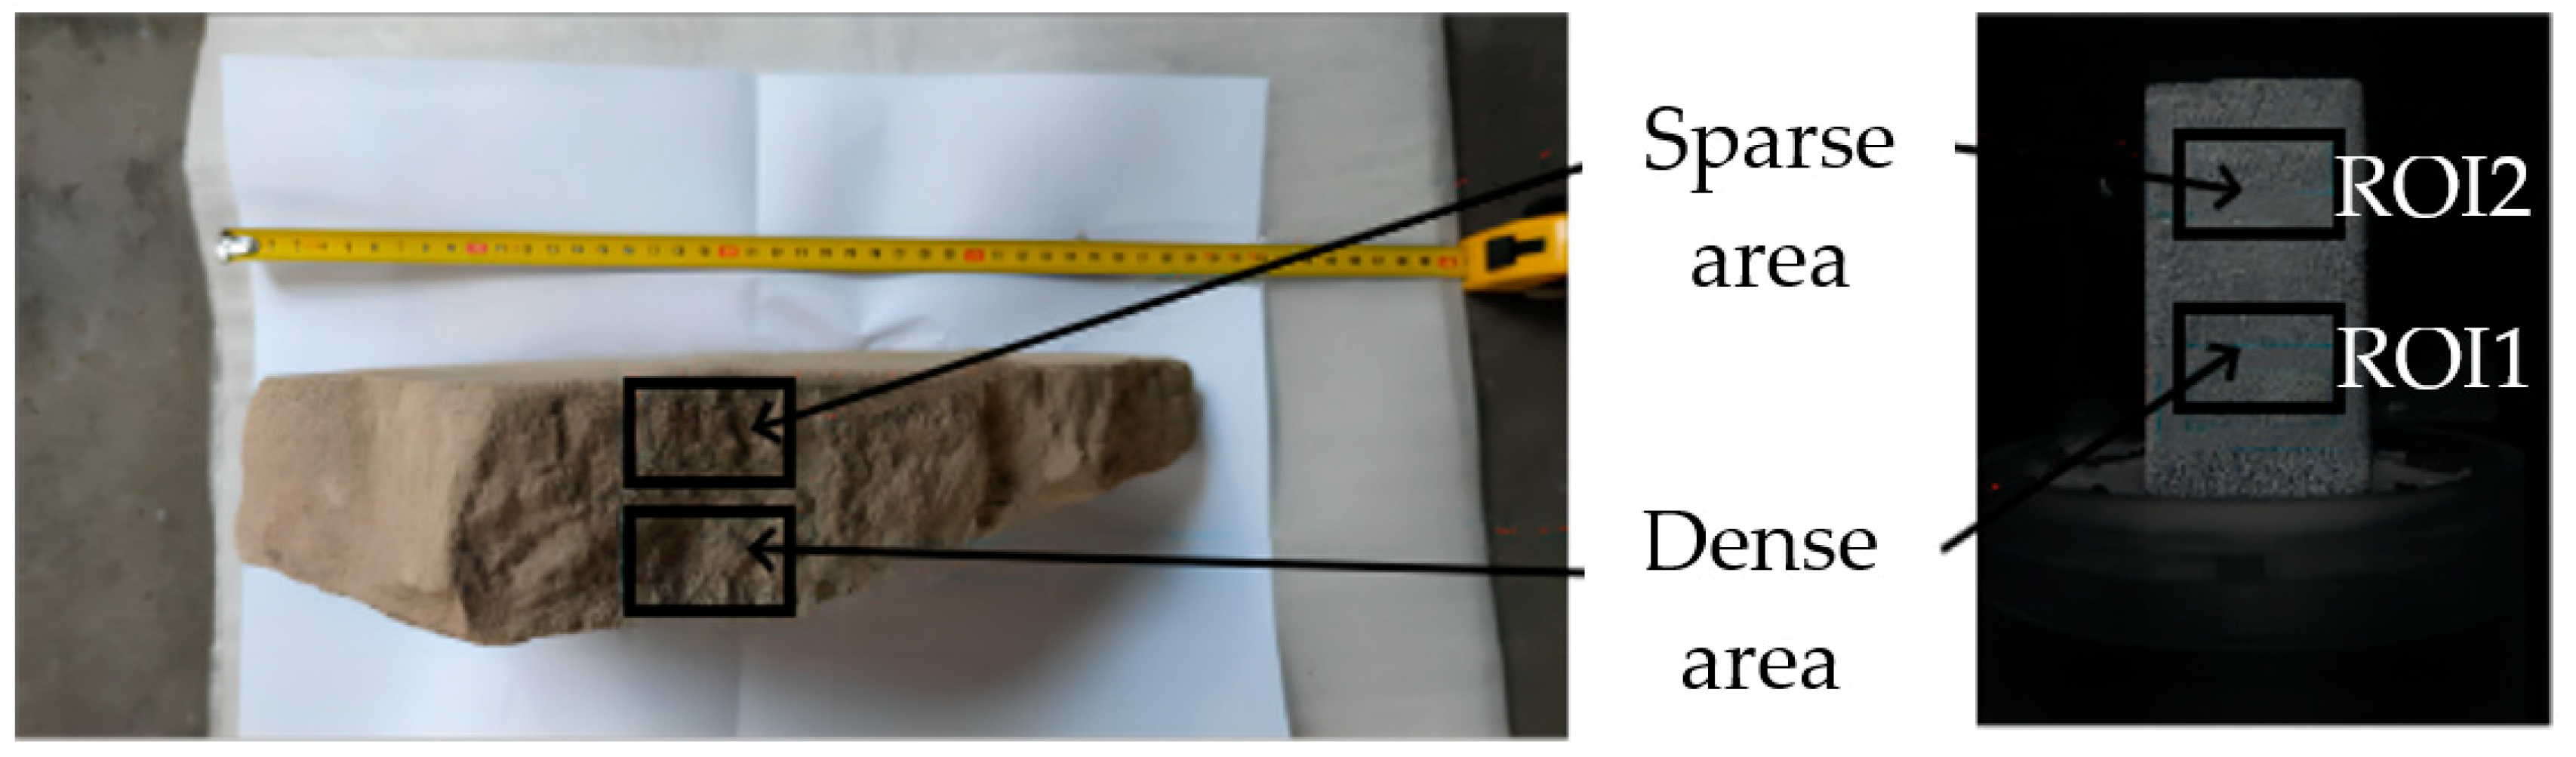
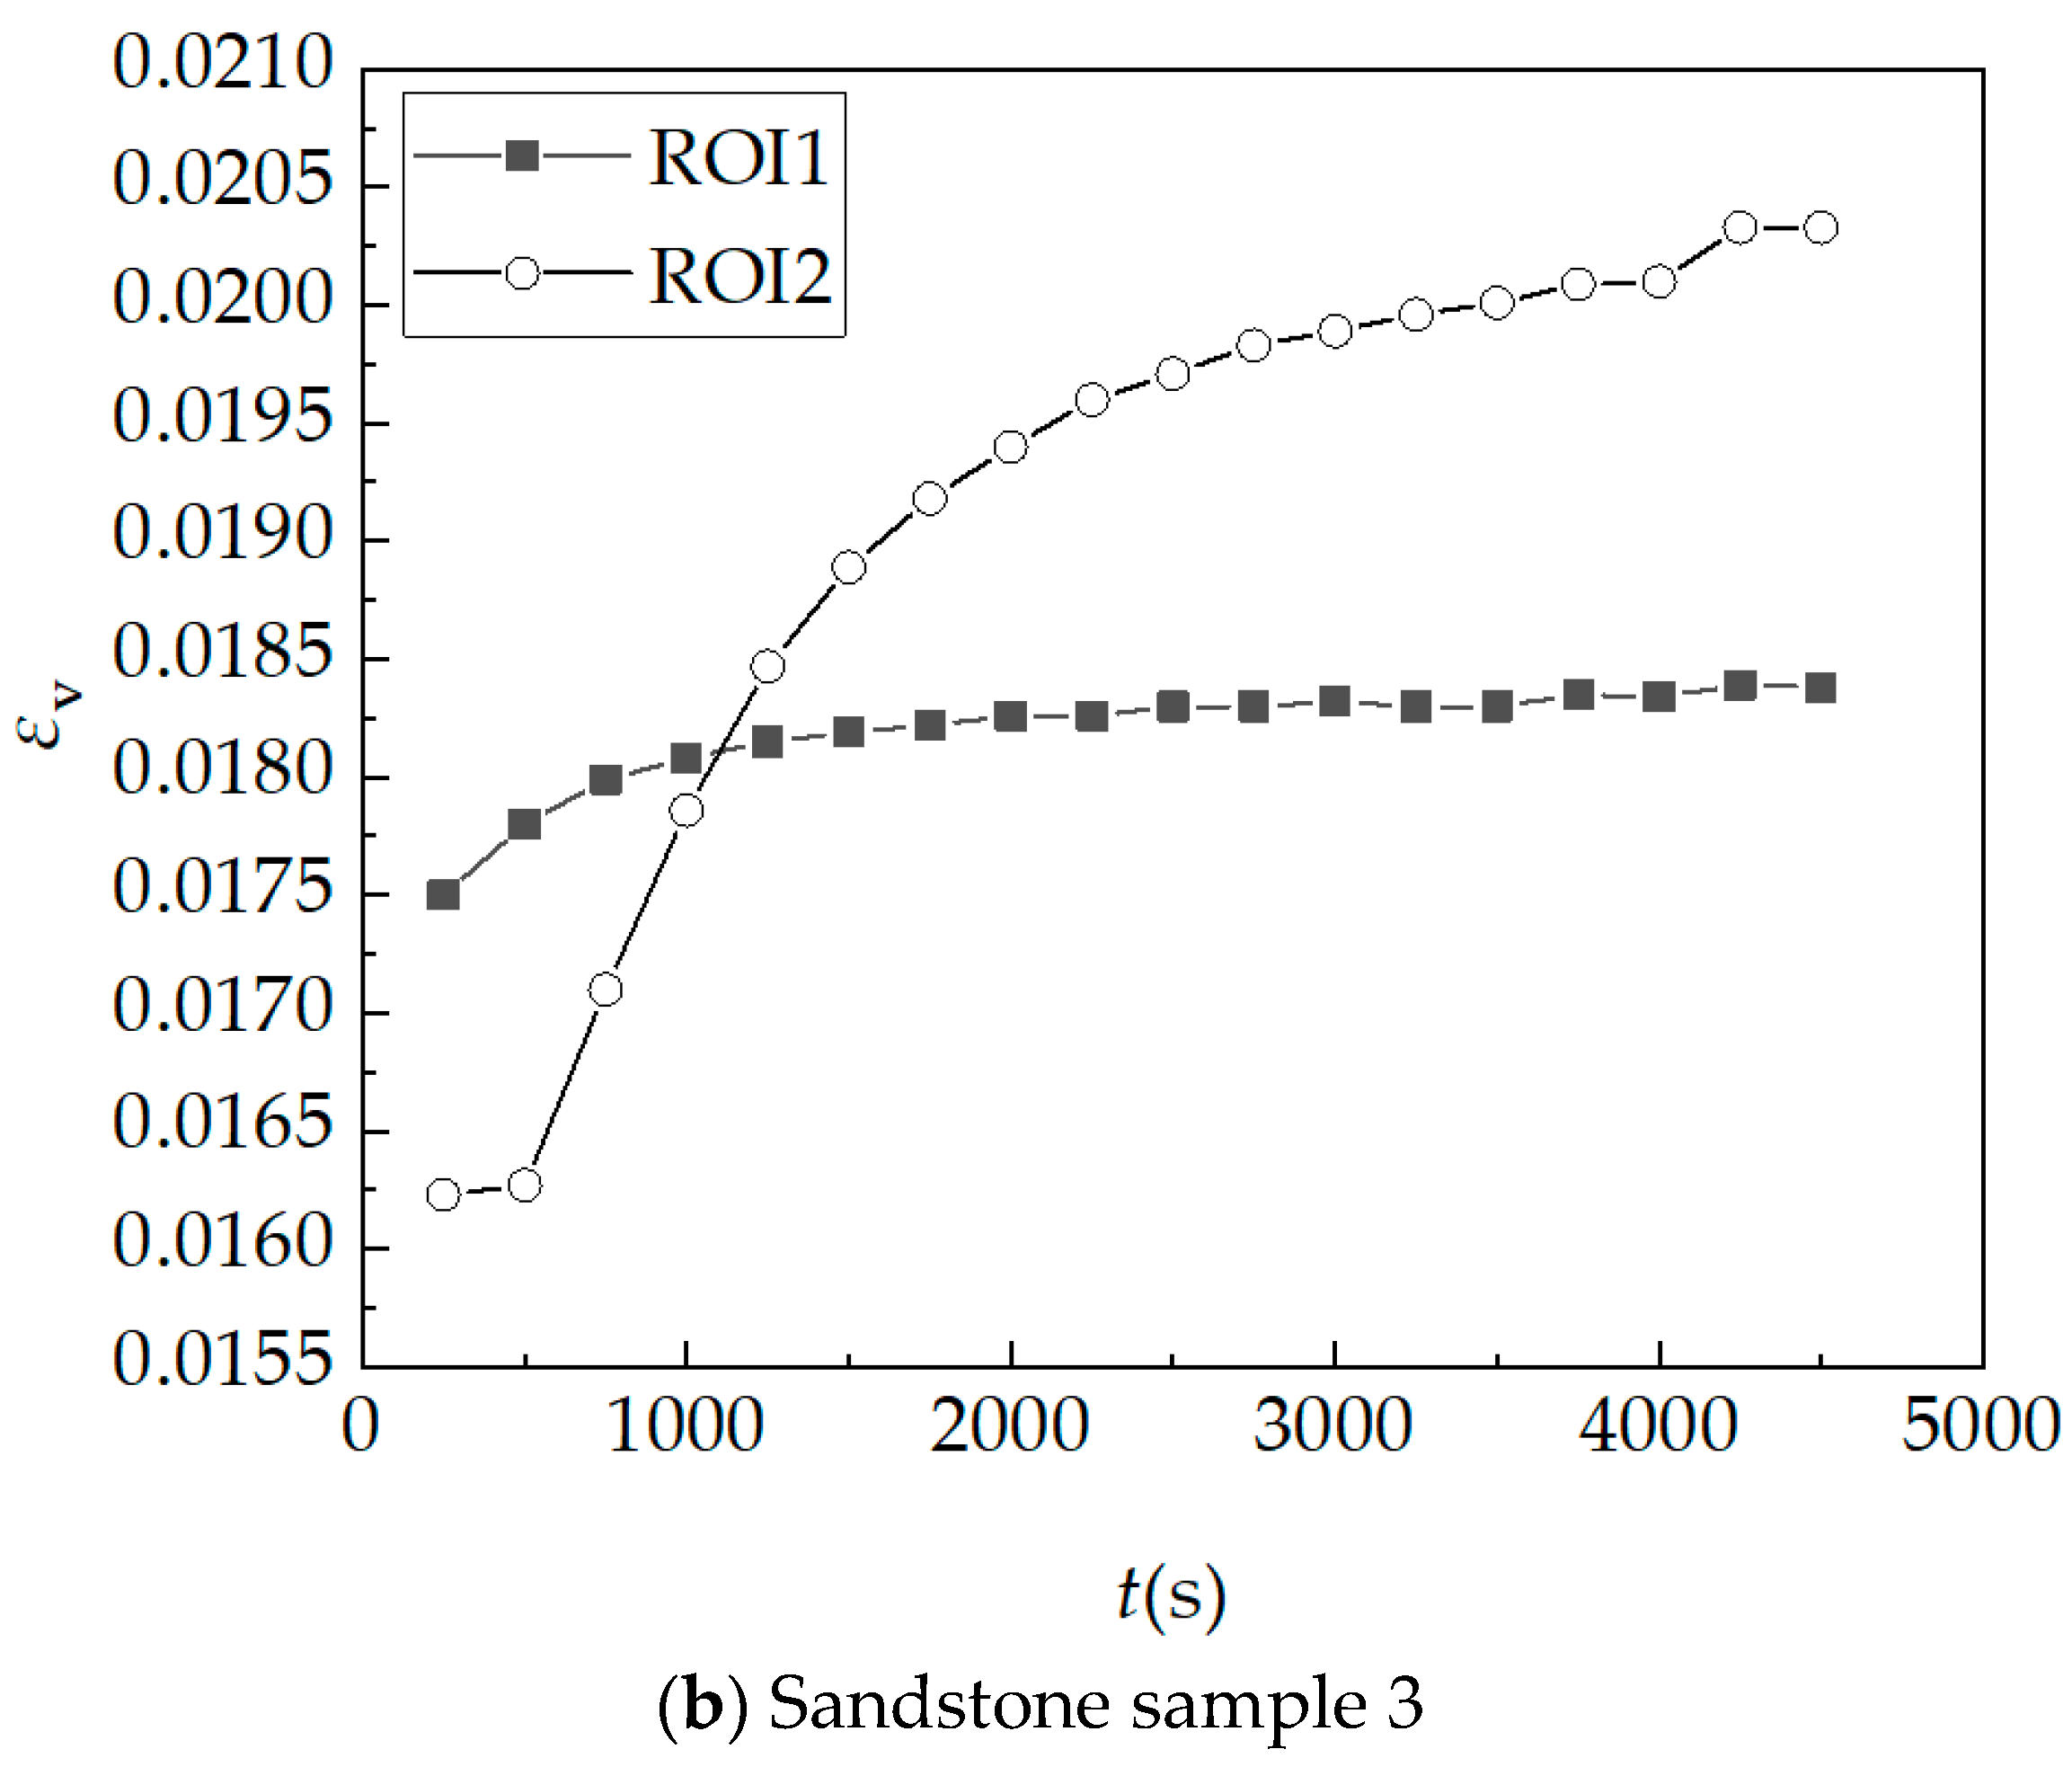
3.3.4. Deformation Curve in Different Density Areas

During the test, an interesting phenomenon was found, namely that the horizontal displacement of the sample surface in Figure 23 shows a trend of large upper and small lower. It is speculated that this result is due to the fact that the upper layer of the original sandstone is a sparse area, and the lower layer is a dense area, forming an uneven bedding of the original sandstone. In order to further study this non-uniformity, the sandstone samples were kept in the sparse area on the top and the dense area on the bottom throughout the test process, and the specific situation is shown in Figure 34.
The two regions of sandstone sample 1 and sandstone sample 3 are studied as regions of interest (ROI), where ROI1 represents the dense area, and ROI2 represents the sparse area. The equivalent strain–time curves of the two areas are shown in Figure 35. Through observation, it is found that the equivalent strain of the two areas increased with time after the sample absorbed water. In the initial stage of hydration absorption, ROI1 deforms first. With the increase in time, ROI2 begins to deform, and the equivalent strain of it increases rapidly, which soon exceeds and is greater than that of ROI1, and the two curves tend to be gentle in the end. It is speculated that the reason why the difference between the two curves is so large is that there are more pores in the sparse area and the deformation after hydration absorption is also greater. At the same time, due to the contact between the dense area and the water surface during the experiment, the deformation of the dense area is greater than that of the sparse area in the initial stage, and the sparse area is deformed after a period of time. It is believed that for the Mogao Grottoes sandstone, the sparse area with larger pores will produce much larger deformation than the dense area after hydration absorption. When protecting the Mogao Grottoes sandstone, the sandstone layer with sparse bedding should be paid more attention and needs further and more in-depth research.

4. Conclusions

This paper studies the water absorption evolution behaviors of sandstone in Mogao Grottoes in China using real-time experimental monitoring and using DIC methods to analyze the deformation characteristics of sandstone hydration absorption, and the conclusions can be summarized as follows:
(1)
Through the real-time monitoring system, the pressure-less hydration absorption experiment of Mogao Grottoes sandstone under capillary action was carried out, and the water absorption curve of sandstone was obtained. The curve results show that the hydration absorption of sandstone can be divided into three stages: the initial stage increases rapidly, the intermediate stage increases slowly, and the final stage tends to be stable. The actual hydration absorption curve of sandstone can be well fitted using the exponential function.
(2)
The deformation characteristics of sandstone in the process of hydration absorption were analyzed using the DIC method, and the relationship between the pressure-less hydration absorption and deformation of sandstone was obtained. The deformation of sandstone increases rapidly in the initial stage, and the deformation of sandstone gradually slows down in the middle stage. When the water absorption reaches saturation, the interaction between water and sandstone still exists, and the sample continues to deform for a period of time before stopping. The bedding structure and particle composition of sandstone will affect the deformation of sandstone, resulting in uneven changes in sandstone.
(3)
The sandstone samples are divided into sparse and dense areas. The results of the mercury intrusion test and the XRD test show that the porosity of the sparse area is larger than that of the dense area, and the particle content of the dense area is lower. When the sandstone is saturated with water, the liquid is immersed in the pores between the solid particles, which makes the sparse area more prone to stress concentration, and the deformation in the sparse area is larger. Therefore, when analyzing the water absorption deformation of sandstone, the porosity should be considered.
In this paper, the pressure-less hydration absorption experiment of sandstone is carried out to describe the hydration absorption process of sandstone. The deformation characteristics of sandstone in the process of hydration absorption are analyzed using the DIC method, and the harmful behavior related to water migration is analyzed from the perspective of the hydration absorption deformation of rock. On the basis of this paper, more accurate water–rock interaction and mechanism results can be obtained by considering temperature, humidity, and multi-field coupling. Therefore, the experimental system and procedure used in this study can also be extended to the analysis of water–rock interaction. However, the microstructure of the sample was not measured using scanning electron microscopy in this paper. The speckles actually did not reach the ideal conditions, and the quality of the speckles determined the success or failure of the deformation experiment. The hydration of surrounding rock and salt damage of murals caused by water–salt migration are very complex processes. The water–rock interaction behavior and deformation characteristics under different temperature, humidity, and multi-field coupling conditions are important research topics in the future.

Author Contributions

N.H.: Conceptualization, Methodology, Resources, Funding acquisition. Y.W.: Conceptualization, Methodology, Resources, Writing—Reviewing and Editing, Supervision, Project administration, Funding acquisition. Y.Z. and W.J.: Methodology, Software, Formal analysis, Investigation, Data Curation, Writing—Original draft preparation, Visualization. P.L. and N.L.: Formal analysis, Investigation, Data Curation. All authors have read and agreed to the published version of the manuscript.

Funding

This research was funded by the State Key Laboratory for GeoMechanics and Deep Underground Engineering, China University of Mining and Technology (Beijing) (grant SKLGDUEK202209), Fundamental Research Funds for the Central Universities, Ministry of Education of China (grant 2023ZKPYSB01, 2023JCCXLJ04), Innovation Training Program for College Students, China University of Mining and Technology (Beijing) (grants 202206005, 202206024 and 202306058), Beijing Natural Science Foundation (grant L212016), China National Petroleum Corporation (CNPC) Innovation Found (grant 2022DQ02-0204).

Data Availability Statement

Data is contained within the article.

Conflicts of Interest

The authors declare that they have no known competing financial interests or personal relationships that could have appeared to influence the work reported in this paper.

References

  1. Wang, Y. Adaptive Analysis of Damage and Fracture in Rock with Multiphysical Fields Coupling; Springer Press: Berlin/Heidelberg, Germany, 2021. [Google Scholar]
  2. Hao, N.; Wang, Y.; Wu, X.; Duan, Y.; Li, P.; He, M. Real-Time Experimental Monitoring for Hydration absorption Evolution Behaviors of Sandstone in Mogao Grottoes, China. Energies 2022, 15, 8504. [Google Scholar] [CrossRef]
  3. Yu, F.; Tong, K.; Dai, Z.; Feng, G.; Zhou, Z.; Chen, S. Macro and Micro research on Swelling Characteristics and Deformation Mechanism of Red-Bed Mudstone in Central Sichuan, China. Geofluids 2022, 2022, 6431590. [Google Scholar] [CrossRef]
  4. Yao, W.; Li, C.; Zhan, H.; Zhou, J.; Criss, R.; Xiong, S.; Jiang, X. Multiscale study of physical and mechanical properties of sandstone in three Gorges reservoir region subjected to cyclic wetting–drying of yangtze river water. Rock Mech. Rock Eng. 2020, 53, 2215–2231. [Google Scholar] [CrossRef]
  5. Fan, Q.; Wang, M.; Li, X.; Zhang, B. Experimental Research on Coupling of Swelling Rock between Swelling and Creep. Appl. Mech. Mater. 2013, 353–356, 293–302. [Google Scholar] [CrossRef]
  6. Lin, Y.; Zhou, K.; Li, J.; Ke, B.; Gao, R. Weakening laws of mechanical properties of sandstone under the effect of chemical corrosion. Rock Mech. Rock Eng. 2020, 53, 1857–1877. [Google Scholar] [CrossRef]
  7. Sun, X.; Shi, F.; Ding, J.; Tao, Z.; Zhang, Y.; Miao, C.; Cui, L. Study on Microscopic Mechanism and Failure Mode of Water–Rock Coupling in Fine Sandstone Under Uniaxial Compression. Rock Mech. Rock Eng. 2023, 56, 6823–6842. [Google Scholar] [CrossRef]
  8. Lu, Y.; Wang, L.; Sun, X.; Wang, J. Experimental study of the influence of water and temperature on the mechanical behavior of mudstone and sandstone. Bull. Eng. Geol. Environ. 2017, 76, 645–660. [Google Scholar] [CrossRef]
  9. Yuan, P.; Wei, N.; Ma, Q.; Chang, J. Coupled effect of water temperature and cyclic wetting and drying on dynamic mechanical characteristics of sandstone. Adv. Civ. Eng. 2019, 2019, 8167651. [Google Scholar] [CrossRef]
  10. Peters, W.; Ranson, W. Digital imaging techniques in experimental stress analysis. Opt. Eng. 1982, 21, 427–431. [Google Scholar] [CrossRef]
  11. Sutton, M.; Orteu, J.; Schreier, H. Image Correlation for Shape, Motion and Deformation Measurements: Basic Concepts, Theory and Applications; Springer Science & Business Media: Berlin/Heidelberg, Germany, 2009. [Google Scholar]
  12. Yang, D.; Bornert, M.; Chanchole, S.; Wang, L.; Valli, P.; Gatmiri, B. Experimental investigation of the delayed behavior of unsaturated argillaceous rocks by means of digital image correlation techniques. Appl. Clay Sci. 2011, 54, 53–62. [Google Scholar] [CrossRef]
  13. Zhang, H.; Huang, G.; Song, H.; Kang, Y. Experimental investigation of deformation and failure mechanisms in rock under indentation by digital image correlation. Eng. Fract. Mech. 2012, 96, 667–675. [Google Scholar] [CrossRef]
  14. Wang, L.; Bornert, M.; Héripré, E.; Yang, D.; Chanchole, S. Irreversible deformation and damage in argillaceous rocks induced by wetting/drying. Appl. Geophys. 2014, 107, 108–118. [Google Scholar] [CrossRef]
  15. Wang, L.L.; Bornert, M.; Héripré, E.; Chanchole, S.; Pouya, A.; Halphen, B. The mechanisms of deformation and damage of mudstones: A micro-scale study combining ESEM and DIC. Rock Mech. Rock Eng. 2015, 48, 1913–1926. [Google Scholar] [CrossRef]
  16. Wang, L.; Yang, R.; Chanchole, S.; Zhang, G. The time-dependent swelling of argillaceous rock under resaturated conditions. Appl. Clay Sci. 2017, 146, 186–194. [Google Scholar] [CrossRef]
  17. Luo, P.; Wang, L.; Li, D.; Yang, J.; Lv, X. Deformation and failure mechanism of horizontal soft and hard interlayered rock under uniaxial compression based on digital image correlation method. Eng. Fail. Anal. 2022, 142, 106823. [Google Scholar] [CrossRef]
  18. Ji, X.; Zhang, T.; Ji, B.; Zhang, L.; Pang, M.; Pan, H.; Ji, B. Gray characteristics analysis of strain field of coal and rock bodies around boreholes during progressive damage based on digital image. Rock Mech. Rock Eng. 2023, 56, 5607–5620. [Google Scholar] [CrossRef]
  19. Yang, P.; Miao, S.; Ma, Y.; Yu, W.; Shang, X. Multi-dimensional non-uniform deformation and failure of siltstone determined using acoustic, 3D-digital image correlation, and computed tomography. Theor. Appl. Fract. Mech. 2023, 125, 103800. [Google Scholar]
  20. Xin, C.; Yang, Y.; Yang, M.; Liang, P.; Sun, Y.; Shen, H. Study on Strain Field Evolution of Uniaxial Compression Sandstone Based on Digital Image Correlation Technology. Appl. Sci. 2022, 12, 11939. [Google Scholar] [CrossRef]
  21. Yao, G.; Wang, G.; Tan, L.; Zhang, Y.; Wang, R.; Yang, X. Fracture Evolution and Mechanical Properties of Mortar Containing Different Inclusions. Appl. Sci. 2024, 14, 3166. [Google Scholar] [CrossRef]
  22. Jin, T.; Sun, X.; Liu, K.; Lin, S.; Yang, S.; Xie, J. Experimental Study of the Multiple Fractalisation of Coal and Rock Failure Subjected to the Coupled Effects of Water, Temperature and Dynamic Loads. Appl. Sci. 2023, 13, 13004. [Google Scholar] [CrossRef]
  23. Hagara, M.; Huňady, R.; Lengvarský, P.; Vocetka, M.; Palička, P. The Calibration Process and Setting of Image Brightness to Achieve Optimum Strain Measurement Accuracy Using Stereo-Camera Digital Image Correlation. Appl. Sci. 2023, 13, 9512. [Google Scholar] [CrossRef]
  24. Yan, F.; Qi, C.; Shan, R. Spatial-Temporal Heterogeneity in the Deformation and Damage of Rock Samples: Experimental Study Using Digital Image Correlation Analysis. Appl. Sci. 2022, 12, 1364. [Google Scholar] [CrossRef]
Figure 1. Outcrop porous sandstone samples sample at North Mogao Grottoes.
Applsci 14 04490 g001
Figure 2. Before and after processing of sandstone in the north of Mogao Grottoes.
Applsci 14 04490 g002
Figure 3. The relationship curves of cumulative intrusion and pressure.
Applsci 14 04490 g003
Figure 4. The relationship curves of cumulative intrusion, log differential intrusion, and pore size.
Applsci 14 04490 g004
Figure 5. The relationship curve between cumulative pore area and pore size.
Applsci 14 04490 g005
Figure 6. X-ray diffraction pattern of non-clay minerals.
Applsci 14 04490 g006
Figure 7. X-ray diffraction pattern of clay minerals.
Applsci 14 04490 g007
Figure 8. Intelligent test system.
Applsci 14 04490 g008
Figure 9. Steps of the pressure-less hydration absorption detection.
Applsci 14 04490 g009
Figure 10. Intelligent detection system program.
Applsci 14 04490 g010
Figure 11. Environment temperature and humidity.
Applsci 14 04490 g011
Figure 12. Relationship between hydration absorption and time of sandstone sample.
Applsci 14 04490 g012aApplsci 14 04490 g012b
Figure 13. Relationship between actual hydration absorption and time.
Applsci 14 04490 g013
Figure 14. Automatic shooting detection device schematic diagram.
Applsci 14 04490 g014
Figure 15. Sandstone hydration absorption deformation detection steps.
Applsci 14 04490 g015
Figure 16. Measurement program of pressure-less hydration absorption detection.
Applsci 14 04490 g016
Figure 17. The equipment conditions and images taken using the camera of Test 3.
Applsci 14 04490 g017
Figure 18. Horizontal displacement field of sandstone sample 1 at a different time.
Applsci 14 04490 g018
Figure 19. Horizontal displacement field of sandstone sample 3 at a different time.
Applsci 14 04490 g019
Figure 20. Horizontal average displacement curve.
Applsci 14 04490 g020
Figure 21. Vertical displacement field of sandstone sample 1 at different time.
Applsci 14 04490 g021aApplsci 14 04490 g021b
Figure 22. Vertical displacement field of sandstone sample 3 at a different time.
Applsci 14 04490 g022
Figure 23. Vertical average displacement curve of sandstone samples 1 and 3.
Applsci 14 04490 g023
Figure 24. Horizontal strain field of sandstone sample 1 at a different time.
Applsci 14 04490 g024
Figure 25. Horizontal strain field of sandstone sample 3 at a different time.
Applsci 14 04490 g025
Figure 26. Horizontal strain curve of sandstone samples 1 and 3.
Applsci 14 04490 g026
Figure 27. The vertical strain field of sandstone sample 1 at a different time.
Applsci 14 04490 g027
Figure 28. The vertical strain field of sandstone sample 3 at a different time.
Applsci 14 04490 g028
Figure 29. The vertical strain curve of sandstone samples 1 and 3.
Applsci 14 04490 g029
Figure 30. von Mises equivalent strain field of sandstone sample 1 at a different time.
Applsci 14 04490 g030
Figure 31. von Mises equivalent strain field of sandstone sample 3 at a different time.
Applsci 14 04490 g031
Figure 32. von Mises equivalent strain curve of sandstone samples 1 and 3.
Applsci 14 04490 g032
Figure 33. Hydration absorption von Mises equivalent strain curve of rock sample.
Applsci 14 04490 g033
Figure 34. The location of the dense area and the selection of ROI.
Applsci 14 04490 g034
Figure 35. Equivalent strain–time curve of different density areas.
Applsci 14 04490 g035aApplsci 14 04490 g035b
Table 1. Basic parameters of sandstone samples.
Sandstone SamplesLength/mmWidth/mmHeight/mmDry Quality/g
129.5029.0051.9083.87
229.6029.0052.0083.49
329.7029.5051.8083.53
Average29.6029.2051.9083.63
Table 2. Intrusion data summary and pore structure parameters.
ParameterValueUnits
Total intrusion volume at 57,958.05 psia0.1842mL/g
Total pore area at 57,958.05 psia 0.548m2/g
Median pore diameter (volume) at 8.26 psia and 0.092 mL/g 21,890.11nm
Median pore diameter (area) at 4045.16 psia and 0.274 m2/g 44.71nm
Average pore diameter (4 V/A) 1344.78nm
Bulk density at 0.52 psia 1.7817g/mL
Apparent (skeletal) density at 57,958.05 psia 2.6525 g/mL
Porosity 32.8271%
Table 3. X-ray diffraction analysis results of whole rock minerals.
Mineral Content (%)
QuartzPotassium FeldsparPlagioclaseCalciteDolomiteHornblendeClay Mineral
29.0 4.1 31.9 12.3 7.6 4.9 10.2
Table 4. X-ray diffraction analysis results of clay minerals.
Relative Content of Clay Minerals (%)Mixed Layer Ratio (S,%)
SI/SItKaoCC/SI/SC/S
//65629///
Note: S—smectite. I/S—illite-smectite mixed layer. It—illite. K—kaolinite. C—chlorite. C/S—chlorite-smectite mixed layer.
Table 5. Fitting results of pressure-less hydration absorption detection parameters (is the correlation coefficient).
Sandstone
Sample
Fitting Parameters
10.00611.3301.777250.75411.6180.994
211.644−5.812−4.793901.03831.2620.994
312.318−5.272−7.20421.5831230.4420.999
Table 6. Results of pressure-less hydration absorption detection.
Sandstone
Sample
TimeMoisture Reduces QualityEvaporation Water QualityAutomatic Measurement of Hydration Absorption QualityInitial Quality before
Detection
Saturated Mass after DetectionArtificial Measurement of Hydration Absorption QualityHydration Absorption Error
194612.610.2012.4183.8795.9812.112.47
216139.760.149.6283.4994.4010.91−11.80
3199011.390.2811.1183.5394.2010.673.46
Disclaimer/Publisher’s Note: The statements, opinions and data contained in all publications are solely those of the individual author(s) and contributor(s) and not of MDPI and/or the editor(s). MDPI and/or the editor(s) disclaim responsibility for any injury to people or property resulting from any ideas, methods, instructions or products referred to in the content.

