Article

Research on the Capillary Filling Behavior of Liquid Solder Al-12Si under the Action of Electromagnetic Ultrasonic Wave

School of Mechanical Science and Engineering, Northeast Petroleum University, Daqing 163318, China
*
Author to whom correspondence should be addressed.
Appl. Sci. 2024, 14(11), 4557; https://doi.org/10.3390/app14114557
Submission received: 13 April 2024 / Revised: 24 May 2024 / Accepted: 24 May 2024 / Published: 25 May 2024
(This article belongs to the Special Issue Advanced Welding and Soldering Technologies for Metals and Alloys)

Abstract

:
To address the issues of high cost, low welding efficiency, and complex processes in vacuum brazing, we proposed a method of electromagnetic ultrasonic (EU)-assisted brazing with Al-12Si solder to join SiC ceramic and TC4 alloy. The results showed that the maximum magnetic induction strength (MIS) on the surface of the liquid solder was 0.629 T when subjected to a static and alternating magnetic field (MF). Additionally, the combined action of MF and eddy current generated a downward Lorentz force (LF) in the liquid solder, with the maximum LF in the horizontal and vertical directions being 48.91 kN m−3 and 60.93 kN m−3, respectively. Under the influence of an EU wave, the liquid solder exhibited capillary filling (CF) behavior. At 26 ms, the maximum length of CF was 12.21 mm.

1. Introduction

SiC ceramics are widely used in armor materials of protective equipment such as tanks and armored vehicles because of their high temperature resistance, high hardness, high compressive strength, and strong oxidation resistance [1,2]. However, SiC ceramics have low ductility and poor toughness, and are easily broken when impacted. Therefore, they cannot be used alone, but need to be welded with metal materials to form composite armor to improve impact toughness and strength [3,4]. Titanium alloy has the characteristics of high strength, excellent toughness and tensile properties, and good corrosion resistance [5,6,7]. Therefore, the composite structure plate composed of the two can avoid the brittleness of SiC ceramics and give full play to the armor protection characteristics of SiC ceramics [8]. At present, vacuum brazing technology is one of the most potential technologies for welding SiC ceramics and metal materials.
Vacuum brazing is a welding method in which the brazing filler metal is melted by heating in a vacuum or inert gas environment, so that it penetrates into the surface of the base metal and solidifies, and finally forms a solid connection. Due to the advantages of high quality and strong corrosion resistance, the welded joints prepared by this method have received extensive attention in recent years [9,10]. Ma et al. [11] inserted a 3D-SiO2 fiber interlayer between SiC and TC4 alloy (with a nominal composition of Ti-6Al-4V), and then performed vacuum brazing. The results showed that the welded joints contained abundant and dispersed TiSi2, TiCu2, TiSi, and α-Ti particles, which effectively reduced residual stresses. The shear strength of the welded joints reached 40 MPa. Wang et al. [12] used Cu foam as a liquid solder to join ZrB2-SiC ceramics and TC4 alloy by vacuum brazing. They found that the shear strength of the welded joints reached 435 MPa when the holding time was 20 min. However, with an increase in holding time, the content of Ti2Cu compounds increased, which was detrimental to the mechanical properties of the welded joints. Gao et al. [13] also used liquid solder AgCuTi-Al to braze Cf/SiC composites and TC4 titanium alloy in vacuum brazing. The welded joint contained the intermetallic compound Ti3Al, which effectively reduced the residual thermal stress and resulted in a maximum shear strength of 149 MPa.
However, vacuum brazing has several disadvantages, including high welding equipment costs, a complex process, and low welding efficiency [14,15,16]. In addition, the application of an EU wave in liquid metal can also refine the grains and improve the mechanical properties of the metal, and can effectively solve these problems [17,18]. At present, the application of electromagnetic field in the field of welding is mainly combined with other welding processes as an auxiliary means. Farhang et al. [19] used electromagnetic field-assisted laser welding technology to connect NiTi/316L stainless steel joints. The results showed that compared with the traditional laser welding, the Ti-Fe-based intermetallic compounds in the welding area were suppressed, and the strength and toughness of the welded joints were increased by 28% and 137%, respectively. Bachmann et al. [20] analyzed the influence of an external transverse electromagnetic field on the flow phenomenon of molten pool by establishing a three-dimensional steady-state laminar numerical model. The results showed that the application of a transverse electromagnetic field during laser welding of aluminum alloy could significantly inhibit the metal flow in the molten pool. In summary, the current application of electromagnetic field in the field of welding was mainly to prepare better welded joints by affecting the arc or molten pool generated by other welding processes in the working process. However, there were few studies on the LF generated by electromagnetic field as the main welding method. Therefore, a new welding method of EU-assisted brazing was proposed. The method generated an LF with a vibration frequency of 20 kHz inside the liquid solder by means of an electromagnetic field, which controlled the CF behavior of the liquid solder within the gap of the substrate. This method did not require contact with materials, and has the advantages of low cost, simple process control, and low pollution. As a continuation and expansion of research by Ref. [21], the CF behavior of liquid solder Al-12Si on the surface of SiC ceramic and TC4 alloy under the action of an EU wave is studied in this paper. Firstly, this article establishes the CF model of liquid solder under the influence of an EU wave by COMSOL Multiphysics software. Then, it analyzes the generation of the MF and its mechanism of action on the liquid solder, thereby improving the relevant theoretical system of EU-assisted brazing.

2. Physical Model

2.1. Governing Equation

Under the action of the EU wave, the essence of the CF behavior of the liquid solder is the forced movement of the fluid, that is, the flow of the liquid solder is fundamentally caused by the pressure change. Because the pressure measurement inside the liquid solder is extremely difficult to obtain, it is necessary to use the computational fluid dynamics method for calculation and analysis. Computational fluid dynamics is based on the basic theory of fluid mechanics. According to Newton’s fluid mechanics theory, the flow of any particle or system follows the law of conservation of mass, energy, and momentum. The basic equations describing the fluid are the continuity equation, momentum equation, and energy equation [22].
According to the theory of fluid mechanics, the basic governing equations describing the flow field can be expressed as follows [23,24]:
(1) Continuity equation:
ρ t + ρ v = 0
(2) Momentum equation:
ρ v t + ρ v v = ρ F + p
(3) Energy equation:
E t + E + p v = ρ F v + τ v + k T
where ρ is the density of liquid solder, v is the velocity vector, ∇ is the Hamiltonian operator, F is the source term, p is the pressure, E is the internal energy, τ is the stress tensor, T is the temperature, k is the thermal coefficient.

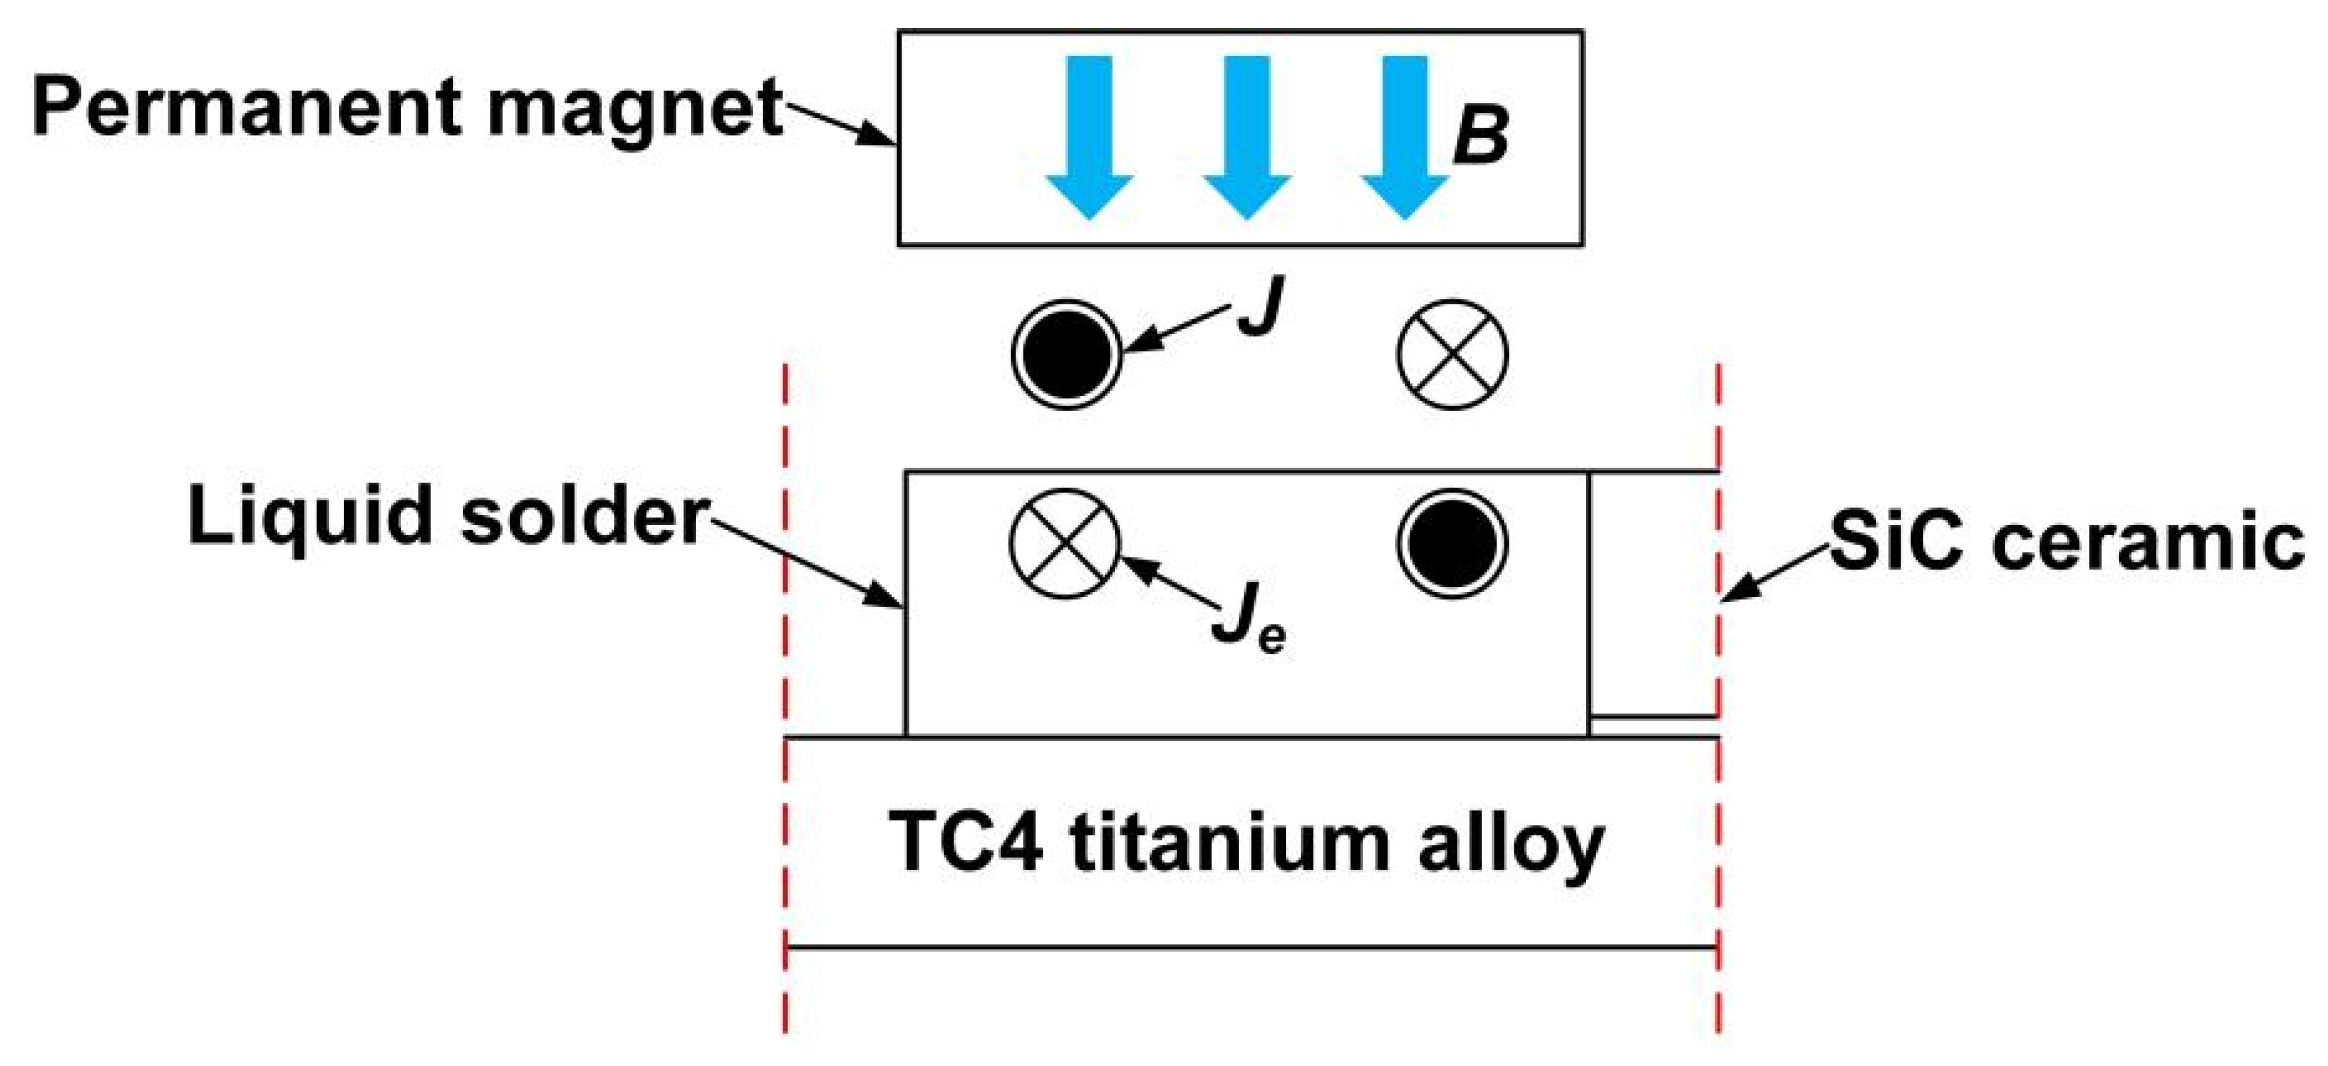
2.2. Establishment of the Model

In order to analyze whether composite components could be formed from SiC ceramic and metal material under the influence of the EU wave, the SiC ceramic and TC4 alloy were chosen as the substrates. The size of TC4 alloy was 60 × 3 mm, and the size of SiC ceramic was 30 × 3 mm. The surface roughness of both was 10 μm. Because Al could form effective metallurgical bonding with SiC and TC4 alloys, and the presence of Si could inhibit the formation of Al4C3 metal compounds at the Al/SiC interface and the chemical reaction between Ti/Al, therefore, Al-12Si was selected as the liquid solder. The physical properties of the substrate and the liquid solder are shown in Table 1 and Table 2, respectively. In this paper, a two-dimensional plane model of CF behavior was established using COMSOL Multiphysics software, as depicted in Figure 1.
At the beginning, the SiC ceramic was placed on the top of the TC4 alloy with a gap of 0.2 mm, and the liquid solder Al-12Si was placed at the edge of the substrate gap. Subsequently, the coil and the permanent magnet were placed on the top of the liquid solder. The alternating current flowing into the coil can be given by the following:
I = A × sin 2 π f t
where A is the peak current, f is the current frequency. The model’s initial parameters are as shown in Table 3. According to previous studies, the peak current and the static MF strength had a great influence on the LF generated in the liquid solder; therefore, they play a key role in the flow behavior of the liquid solder. To achieve the coupling of the magnetic and flow fields, the analysis modules “MF”, “MF, no current”, and “two-phase flow, level set” were used. Finally, the model was divided into 138,862 free triangular meshes, and the transient solver was used to solve the flow process of the liquid solder.

3. Results

3.1. MIS and Distribution

Figure 2 shows the distribution of the alternating MF near the liquid solder. When the strength of the field was between 1/6 period and 3/6 period, the field induced clockwise and counterclockwise rotation around the left and right sides of the coil, respectively. The MIS first increased and then decreased, with the maximum value of 0.529 T near the coil. Between 4/6 period and 6/6 period, the MF directions were reversed, and the MIS again increased and then decreased, with a maximum value of 0.526 T.
Figure 3 indicates the magnetic induction distribution near the liquid solder at a static MF strength of 1 T. The static MF direction received by the liquid solder under the permanent magnet was mainly vertical, while the edge part of the solder received a static MF direction that tended to deflect outwards.
The M point and N point at the top of the liquid solder were extracted from Figure 3, and the MIS on the surface of the liquid solder was analyzed, as shown in Figure 4. It could be seen that the MIS of the liquid solder below the coil was larger, and the maximum MIS in the horizontal and vertical directions was 0.629 T and 0.342 T, respectively. The liquid solder at the edge was less affected by the alternating magnetic field due to the distance from the coil. This indicates that the liquid solder located below the coil would produce a large LF.

3.2. CF Process of Liquid Solder

Figure 5 shows the CF process of liquid solder under the action of the EU wave. The contact angles between the liquid solder and the upper and lower substrate surfaces were denoted as θ1 and θ2, respectively. At 5 ms, the liquid solder in contact with the substrate surface first began to move and the top began to collapse. Then, the liquid solder continued to fill the gap, and the gap was filled to 9.85 mm at 17 ms. At this time, a small amount of splash occurred. At 26 ms, the CF length of liquid solder reached the maximum value of 12.21 mm.

4. Discussion

4.1. Driving Force Analysis of Liquid Solder CF Process

For the analysis of the LF production mechanism in liquid solder, a 2D theoretical model of the EU wave production was constructed, as shown in Figure 6. The AC flowing J into the coil can be given by the following:
J = 2 J A cos ω t
where JA is the effective current density. At present, an alternating MF Be was induced in the surrounding air, which in turn induced an eddy current Je of the same magnitude and frequency as the AC but in the opposite direction in the liquid solder. Due to the Je and the static MF B, the LF F1 was generated inside the liquid solder, which can be expressed by the following formula [31]:
F 1 = J e B = 2 J e B exp x δ cos x δ + ω t
F2 was produced by a combination of the Je and Be in the air as given by the following:
F 2 = J e B e = 2 J e B e exp x δ cos x δ + ω t
The distribution of the LF in the liquid solder is shown in Figure 7. The LF as a whole was outwardly directed, with a right to left direction on the left coil and an opposite direction on the right. The presence of an alternating MF resulted in a macroscopic vertical downward repulsion, which was attributed to the vertical component of the LF.
The LF on the surface of the liquid solder in all directions is shown in Figure 8, since the LF in Figure 7 had horizontal and vertical components. The liquid solder under the coil was subjected to a high LF, and the maximum horizontal and vertical values were 48.91 kN·m−3 and 60.93 kN·m−3, respectively. This indicates that the liquid solder under the coil plays a major role in the CF process of the liquid solder.
Under the influence of LF F1 and F2, the liquid solder occurred periodic vibration, extrusion, and stretching when the AC frequency was 20 kHz. This resulted in a change in the density state in the liquid solder, ultimately forming the EU wave. According to Refs. [32,33], ultrasonic vibration could produce pressure in the liquid, that is, sound pressure. In addition, according to Newton’s second law, when the liquid only receives the action of sine or cosine pressure, it will perform a reciprocating motion with the initial position as the center. Therefore, in order to analyze the mechanism of an EU wave on liquid solder, it is necessary to analyze the variation law of sound pressure in the liquid solder.
Figure 9 shows the sound pressure distribution in the liquid solder under the influence of the EU wave. In the first half of the cycle, the top and bottom were dominated by negative pressure and positive pressure, respectively. When the time was 60 μs, the maximum sound pressure value in the liquid solder was 0.309 MPa. Subsequently, the direction of the alternating current changed, and the positive and negative pressures in the liquid solder were converted to each other. The maximum sound pressure value in the second half of the cycle was 0.227 MPa.
To analyze the sound pressure change of the liquid solder entering the substrate gap, micro-points F, G, and H were taken at the bottom of the liquid solder. Figure 10 shows the sound pressure change analysis of three micro-points.
The sound pressure variation curve for each micro-point is shown in Figure 11. The curve for each micro-point exhibited a sinusoidal periodic change. The sound pressure value was highest at point F, followed by point G, and lowest at point H, which was far from the coil.
The sound pressure change curve in Figure 11 was fitted, and the corresponding expression of the data can be given by the following:
P = P 0 × sin 2 π f t t 0 + P s
where P is the pressure on the micro-point, P0 is the sound pressure amplitude, f is the sound pressure frequency, t is the action time of the EU wave; t0 is the initial phase, Ps is the half-wave offset. According to Refs. [34,35], the half-wave offset is the offset resulting from the fact that when the acoustic energy density is high, the sound pressure within the liquid solder no longer varies ideally linearly.
Table 4 shows the sorted parameter values of the sound pressure function expression for each micro-point. The absolute value of the sound pressure difference between the micro-points was |PFPG| = 0.051 MPa and |PGPH| = 0.031 MPa, respectively. Since the half-wave offset of each micro-point was positive, and the sound pressure difference was |PFPG| > |PGPH|, it follows that the repulsion between the FG points was greater than that between the GH points, indicating that the liquid solder near the coil pushed the right part to fill the gap.

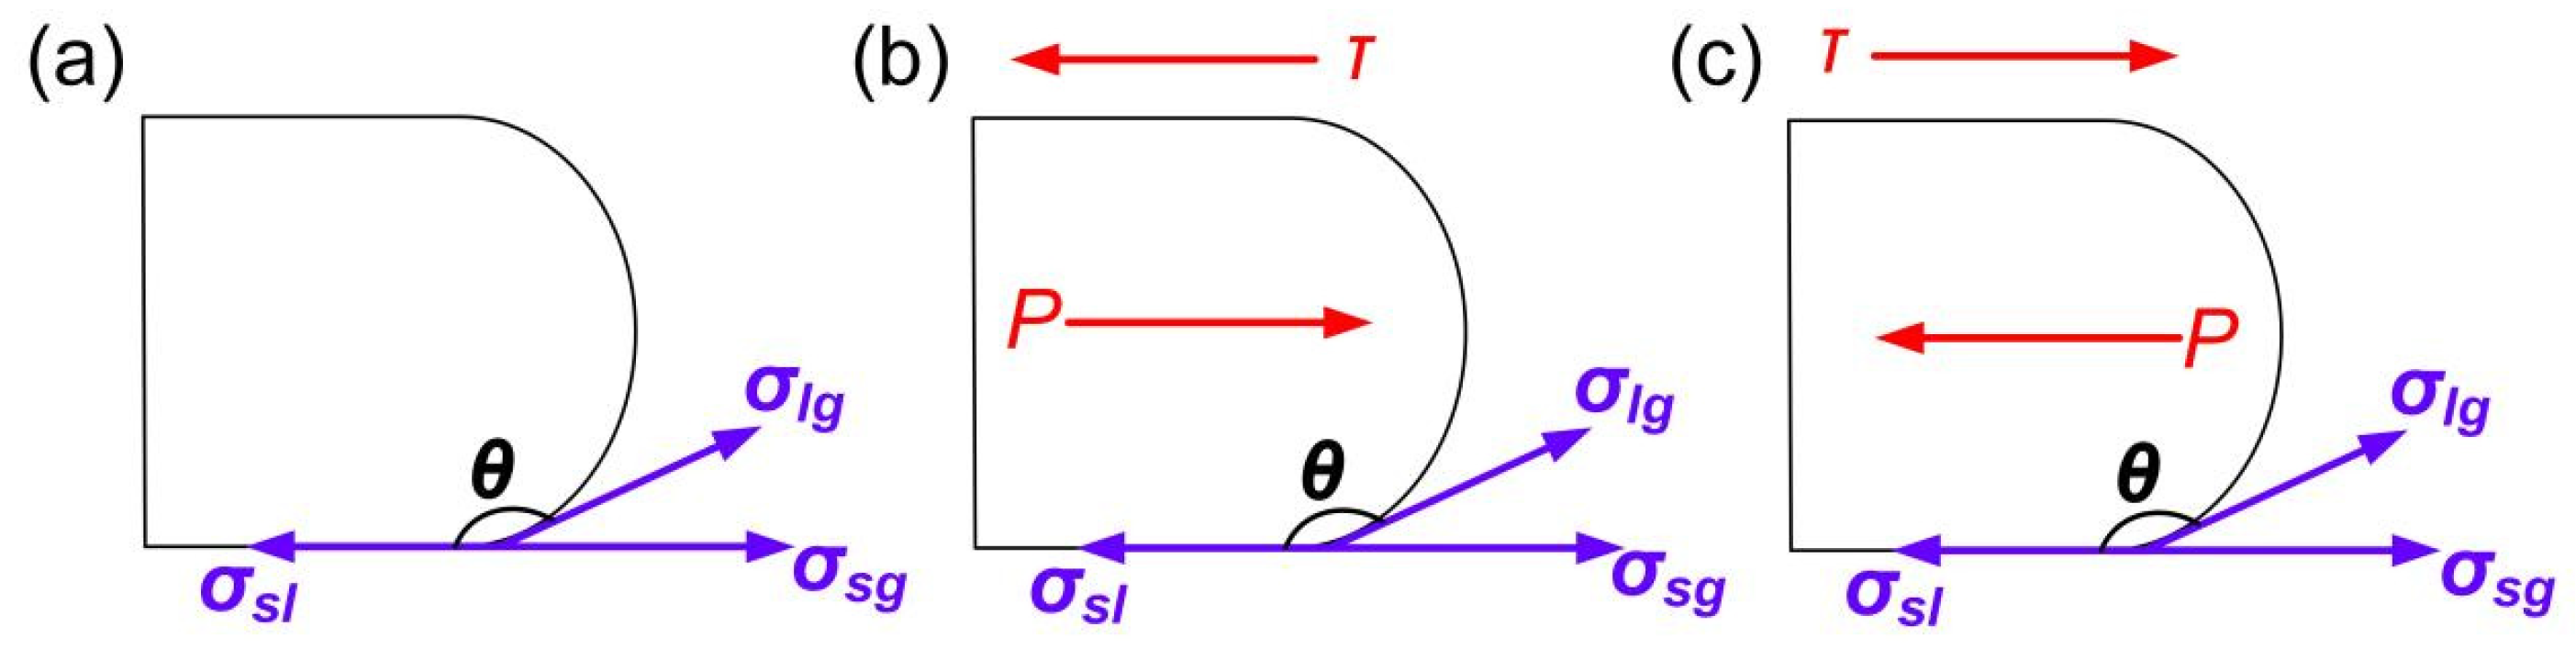
4.2. Interface Mechanical Analysis of Liquid Solder CF Process

Figure 12 displays the physical model of the liquid solder’s front-end during the CF process. This model included surface tension values at the interfaces between liquid and solid, gas and solid, and gas and liquid, which were represented by symbols σsl, σsg, and σlg, respectively. The surface tension caused the three-phase interface to balance at the front-end of the liquid solder before the EU wave was applied. When the EU wave was applied, the sound pressure difference was generated inside the liquid solder. When the sound pressure difference was greater than 0 and greater than the surface tension σ and friction τ, the liquid solder had a tendency to move forward. When the acoustic pressure difference was less than 0 and greater than the surface tension σ and friction τ, the liquid solder was hindered from moving forward. Due to the friction force and half-wave offset, the liquid solder could not be retracted to its original position. Over time, the liquid solder was able to fill the gap.
To analyze the driving force of the liquid solder from the microscopic point of view, it is necessary to extract a micro-element in the liquid solder and establish a mathematical model, as shown in Figure 13. Before the EU wave was applied, the micro-element was subjected to gravity and the static pressure PA with equal direction. After the EU wave was applied, it was subjected to the sound pressure p and the viscous resistance τ when the micro-element moves.
During the CF process of liquid solder, the micro-element motion in the gap of the substrate still satisfies Newton’s law. The two-dimensional Newton’s motion equation can be expressed as follows [36,37]:
ρ d u d t = Δ P u x η d u d y σ lg cos θ σ s l + σ s g / S
where Pux is the sound pressure difference in the X direction, η is the viscosity of the liquid solder, and S is a cross-sectional area of the micro-element. Extending the analysis to a liquid layer consisting of continuous microelements with all cross-sectional areas S, the overall equation of motion can be given by the following:
ρ d u d t = Δ P u l P σ 0 d η u y d x
where Pul is the sound pressure difference in the X direction of the liquid layer with a length of l and a thickness of d. Pσ is the surface additional pressure formed by the surface tension pointing to the inside of the liquid solder, which can be expressed as follows:
P σ = σ lg l = 2 σ lg cos θ d
According to Equation (8), the general expression of the sound pressure gradient on the liquid layer during the CF process of the liquid solder can also be expressed as follows:
Δ P u = P 0 × sin 2 π f t t 0 + P s
According to Equation (12), it could be concluded that the sound pressure gradient changed with time, so it could explain why the liquid solder had an instantaneous process of repeated forward and contraction motion during the CF process. According to Equation (10), it could be concluded that if the liquid layer moved in the X direction, the sound pressure gradient satisfied the following equation:
Δ P u > P σ + 0 d η u y d x
Equation (13) indicated that the positive sound pressure gradient was greater than the surface tension additional pressure and friction resistance. In summary, the continuous forward and contraction movement finally realized the CF process of the liquid solder because of the asymmetry of the positive and negative half waves, and there was an offset Ps, so that the forward degree of the liquid solder in a cycle was greater than the degree of contraction.

4.3. Interface Mechanical Analysis of Liquid Solder CF Process

During the movement of the liquid solder, the change of the front contact angle also played a role in promoting and hindering. Assuming that the surface of the substrate was smooth and uniform, the contact angle θ can be expressed by Young’s equation [38,39,40]:
cos θ = σ s g σ s l σ lg
When the contact angle was less than 90°, the liquid solder could easily wet the substrate surface. Conversely, the liquid solder was difficult to wet the substrate surface when the contact angle was greater than 90°.
Since the actual substrate surface was not smooth, it was more in line with the corrected wetting equation proposed by Wenzel. The expression can be expressed as follows [41,42,43]:
r = cos θ e cos θ
where θe is the contact angle between the actual contact surface and the liquid solder, r is the roughness factor, which represents the ratio of the actual flux contact surface to the ideal contact surface, where r must be greater than or equal to 1.
When θe < θ < 90°, the liquid solder could also wet the rough substrate surface. However, in the actual CF process, the contact angle was still greater than 90° for most of the time, which hindered the forward movement of the liquid solder, as shown in Figure 5. When the liquid solder passed through the surface of the substrate in the concave part, it underwent a small amount of CF behavior due to the force of gravity, in addition to the driving force of the EU wave. In Figure 14, it can be observed that as the liquid solder flowed to the convex part of the substrate, θ and θe increased, resulting in an increased resistance to move forward. However, the EU wave facilitated the movement of the liquid solder to the next concave part surface.
In future research, the effect of EU-assisted brazing on liquid solder can be improved by changing the shape of the coil and the size of the permanent magnet. Furthermore, the flow state of the liquid solder can be regulated by adjusting the number of turns of the coil and the spacing between the permanent magnet, the coil, and the liquid solder.

5. Conclusions

In order to solve the problems of high cost, low welding efficiency, and complex process in vacuum brazing, the welding method of EU-assisted brazing was proposed, and the CF behavior of liquid solder Al-12Si in the gap between SiC ceramic and TC4 alloy under the action of an EU wave was analyzed. The following findings were revealed:
(1) After the alternating current was introduced, a periodically rotating alternating magnetic field was induced in the air near the coil. The static MF generated by the permanent magnet was directed vertically downwards. Under the combined action of the two MFs, the maximum MIS of the liquid solder in the horizontal and vertical directions was 0.629 T and 0.342 T, respectively.
(2) The eddy current generated in the liquid solder interacts with both the alternating and static MFs, resulting in a downward deflection trend of the LF inside the liquid solder. The maximum LF in the horizontal and vertical directions was 48.91 kN m−3 and 60.93 kN m−3, respectively.
(3) Under the influence of the LF with a frequency of 20 kHz, an EU wave was generated in the liquid solder, resulting in sinusoidal sound pressure at multiple positions within the liquid solder. The liquid solder moved due to the combined effect of the acoustic pressure difference and positive half-wave offset between different positions. At 26 ms, the maximum CF length of the liquid solder was 12.21 mm. These results indicate that applying a high-frequency MF to the liquid solder could make the liquid solder undergo macroscopic fluid movement, and then complete the connection between dissimilar materials.

Author Contributions

Conceptualization, G.C. and M.Z.; methodology, G.C.; software, M.Z.; validation, Q.G.; formal analysis, M.Z.; investigation, Q.G.; data curation, Q.G.; writing—original draft preparation, G.C.; writing—review and editing, M.Z.; visualization, Q.G.; supervision, H.Y.; project administration, H.Y.; funding acquisition, H.Y. All authors have read and agreed to the published version of the manuscript.

Funding

This research received no external funding.

Institutional Review Board Statement

Not applicable.

Informed Consent Statement

Not applicable.

Data Availability Statement

Data are contained within the article.

Conflicts of Interest

The authors declare no conflicts of interest.

References

  1. Shevchenko, V.Y.; Dolgin, A.S.; Sychov, M.M.; Makogon, A.I.; Perevislov, S.N. Ideal: A promising diamond-silicon carbide composite for enhanced ceramic armor. Ceram. Int. 2024, 50, 4264–4273. [Google Scholar] [CrossRef]
  2. Thakur, N.; Kumar, P.; Bharj, R.S.; Bahl, S.; Singh, O.; Sharma, P. A numerical study on high-velocity impact behaviour of ceramic composite laminates. Phys. Scr. 2023, 98, 115031. [Google Scholar] [CrossRef]
  3. Luo, Z.; Wang, G.; Zhao, Y.; Tan, C.; He, R. Brazing SiC ceramics and Zr with CoCrFeNiCuSn high entropy alloy. Ceram. Int. 2022, 48, 23325–23333. [Google Scholar] [CrossRef]
  4. Zhang, Z.; Cai, Y.; Liu, Y.; Feng, K. Study on Brazing of SiC Ceramics with Zr-Cu-Nb Filler Metal. J. Mater. Eng. Perform. 2023, 7, 1–11. [Google Scholar] [CrossRef]
  5. Aghdam, M.M.; Morsali, S.; Hosseini, S.; Sadighi, M. Mechanical behavior of unidirectional SiC/Ti composites subjected to off-axis loading at elevated temperatures. Mater. Sci. Eng. 2017, 688, 244–249. [Google Scholar] [CrossRef]
  6. Pei, Y.T.; Ocelik, V.; Hosson, J.T. SiCp/Ti6Al4V functionally graded materials produced by laser melt injection. Acta Mater. 2002, 50, 2035–2051. [Google Scholar] [CrossRef]
  7. Li, Z.; Shi, H.; Zhao, Y.; Gu, J.; Zhang, P.; Yu, Z.; Wang, B.; Song, N.; Sun, T. Microstructure and mechanical properties of vacuum brazed joints of TC4 waveform structure fabricated by 3D printed technology. Weld. World 2023, 67, 2049–2065. [Google Scholar] [CrossRef]
  8. Xie, Y.; Wang, T.; Wang, L.; Yang, Y.; Shang, X. Numerical investigation of ballistic performance of SiC/TC4/UHMWPE composite armor against 7.62 mm AP projectile. Ceram. Int. 2022, 48, 24079–24090. [Google Scholar] [CrossRef]
  9. Huang, C.D.; Hwang, J.R.; Huang, J.Y. Optimization of Vacuum Brazing Process Parameters in Ti-6Al-4V Alloy. Metals 2022, 12, 974. [Google Scholar] [CrossRef]
  10. Basude, A.; Kumar, A.; Rajasingh, G.; Mugada, K.K. Dissimilar joining of Titanium alloy to Aluminium using Al-Si based filler alloy by vacuum brazing technique. Proc. Inst. Mech. Eng. Part L 2022, 236, 1724–1737. [Google Scholar] [CrossRef]
  11. Ma, Q.; Pu, J.; Li, S.G.; Chen, Y.W.; He, P. Introducing a 3D-SiO2-fiber interlayer for brazing SiC with TC4 by AgCuTi. J. Adv. Join. Process. 2022, 5, 100082. [Google Scholar] [CrossRef]
  12. Wang, G.; Wang, Z.; Wang, W.; He, R.; Gui, K.; Tan, C.; Cao, W. Microstructure and shear strength of ZrB2-SiC/Ti6Al4V joint by TiCuZrNi with Cu foam. Ceram. Int. 2019, 45, 10223–10229. [Google Scholar] [CrossRef]
  13. Gao, L.; Cai, C.; Xiong, J.; Huang, J.; Zhao, X. Research on brazing joints of Cf/SiC and TC4 using AgCuTi-Al filler materials. Trans. China Weld. Inst. 2011, 32, 35–38. [Google Scholar]
  14. Way, M.; Willingham, J.; Goodall, R. Brazing filler metals. Int. Mater. Rev. 2020, 65, 257–285. [Google Scholar] [CrossRef]
  15. Xu, R.; Chen, M.; Ji, G.; Xin, L.; Wu, F. Microstructure and Mechanical Properties of Ti-Based Amorphous Solder Vacuum Brazing Joint for Stainless Steel. J. Mater. Eng. Perform. 2024, 1, 1–6. [Google Scholar] [CrossRef]
  16. Sypien, A. Microstructural and Mechanical Characterization of Interfacial Phenomena Occurring in Brazing Ti-6Al-4V Alloy Using TiZrCuPd Amorphous Ribbons. J. Mater. Eng. Perform. 2023, 32, 5731–5740. [Google Scholar] [CrossRef]
  17. Bai, G.; Liu, Z.; Lin, J.; Yu, Z.; Hu, Y.; Wen, C. Effects of the addition of lanthanum and ultrasonic stirring on the microstructure and mechanical properties of the in situ Mg2Si/Al composites. Mater. Des. 2016, 90, 424–432. [Google Scholar] [CrossRef]
  18. Chen, X.; Jia, Y.; Liao, Q.; Jia, W.; Le, Q.; Ning, S.; Yu, F. The simultaneous application of variable frequency ultrasonic and low frequency electromagnetic fields in semi continuous casting of AZ80 magnesium alloy. J. Alloys Compd. 2019, 774, 710–720. [Google Scholar] [CrossRef]
  19. Farhang, B.; Tanrikulu, A.A.; Ganesh, A.; Jain, A.; Amerinatanzi, A. Electromagnetic field-assisted laser welding of NiTi to stainless steel: Towards a lightweight, high-strength joint with preserved properties. J. Mater. Process. Technol. 2023, 314, 117888. [Google Scholar] [CrossRef]
  20. Bachmann, M.; Avilov, V.; Gumenyuk, A.; Rethmeier, M. Numerical assessment and experimental verification of the influence of the Hartmann effect in laser beam welding processes by steady magnetic fields. Int. J. Therm. Sci. 2016, 101, 24–34. [Google Scholar] [CrossRef]
  21. Zhang, M.; Ma, Z.; Geng, D.; Xia, F.; Yu, X. Capillary filling ability of Sn-Zn solder on SiC ceramic surface under electromagnetic ultrasonic action. J. Mater. Res. Technol. 2023, 23, 2836–2851. [Google Scholar] [CrossRef]
  22. Cifuentes, G.; Manríquez, J.; Sepulveda, G. Fluid dynamics and simulation study of particles inside of a hydrocyclone using comsol. Chem. Eng. Trans. 2017, 57, 1291–1296. [Google Scholar]
  23. Kumar, R.; Jha, P.K. Effect of electromagnetic stirring on the transient flow, solidification and inclusion movements in the continuous casting slab mold. Int. J. Numer. Methods Heat Fluid Flow 2023, 33, 3716–3733. [Google Scholar] [CrossRef]
  24. Yue, P.; Xiao, J.; Xu, K.; Li, M.; Jiang, F.; Lu, Y.; Peng, D. Mathematical model and analysis method for flowfield separation and transition. Phys. Fluids 2021, 33, 044116–044132. [Google Scholar] [CrossRef]
  25. Zhou, B.; Zeng, Z.; Cai, Y.; Feng, K. FEM Simulation and Verification of Brazing SiC Ceramic with Novel Zr-Cu Filler Metal. Materials 2019, 12, 3380. [Google Scholar] [CrossRef] [PubMed]
  26. Song, S.; Gao, Z.; Lu, B.; Bao, C.; Zheng, B.; Wang, L. Performance optimization of complicated structural SiC/Si composite ceramics prepared by selective laser sintering. Ceram. Int. 2020, 46, 568–575. [Google Scholar] [CrossRef]
  27. Li, H.; Hou, H.; Sun, Z. Relationship Between Effect of Hydrogen on Physical and Mechanical Properties and Its Machinability for TC4 Titanium Alloy. Aeronaut. Manuf. Technol. 2008, 20, 80–83. [Google Scholar]
  28. Ankudinov, V.; Gordeev, G.A.; Kharanzhevskiy, E.V.; Krivilyov, M.D. Numerical Simulation of Thermal Conductivity of Stainless Steel and Al-12Si Powders for Additive Manufacturing. J. Heat Transf. 2022, 144, 052201–052209. [Google Scholar] [CrossRef]
  29. Li, P.; Guo, J.; Jia, J.; Li, Q.; Ri, K. Physical Properties and Solidification Structure of Al-Si Eutectic Alloy Melt with Cerium Modification. J. Rare Earths 1996, 2, 140–144. [Google Scholar]
  30. Wang, W.; Zhang, Y.; Yue, C.; Kong, X.; Hao, Z.; Wang, T.; Li, T. Processing defect, microstructure evolution and mechanical properties of laser powder bed fusion Al-12Si alloys. J. Mater. Res. Technol. 2023, 26, 681–696. [Google Scholar] [CrossRef]
  31. Wang, Q.; He, J.; Kawai, S.; Iwai, K.; Asai, S. Effect of magneto-acoustic waves on solidification structures of metal. Acta Metall. Sin. 2002, 9, 961–965. [Google Scholar]
  32. Xu, H.; Han, Q.; Meek, T.T. Effects of ultrasonic vibration on degassing of aluminum alloys. Mater. Sci. Eng. 2008, 473, 96–104. [Google Scholar] [CrossRef]
  33. Li, Y.; Wu, C.; Chen, M. Numerical analysis of the heat-pressure characteristics in ultrasonic vibration assisted plasma arc. J. Appl. Phys. 2020, 128, 114903. [Google Scholar] [CrossRef]
  34. Elsayed, D.; Afza, S.; Wedad, R.A.; Hasson, S. Simulation of electric field response of horizontal circular electric half wave dipole antenna for seabed logging. Alex. Eng. J. 2023, 66, 421–431. [Google Scholar]
  35. Marting, L.H.; Karatsu, K.; Endo, A.; Baselmans, J.A.; Laguna, A.P. Directional Filter Design and Simulation for Superconducting On-Chip Filter-Banks. J. Low Temp. Phys. 2024, 5, 1–10. [Google Scholar] [CrossRef]
  36. Yao, M.; Xue, J.; Huang, H.; Su, F.; Zhang, A.; Gong, J.; Yu, X.; Yang, J. Study on the effect of ultrasonic treatment for fabricating nodular cast iron with improved mechanical properties. J. Mater. Res. Technol. 2024, 29, 5295–5303. [Google Scholar] [CrossRef]
  37. Meliani, M.; Nikolić, V. Mixed approximation of nonlinear acoustic equations: Well-posedness and a priori error analysis. Appl. Numer. Math. 2024, 198, 94–111. [Google Scholar] [CrossRef]
  38. Butt, H.J.; Liu, J.; Koynov, K.; Straub, B.; Hinduja, C.; Roismann, I.; Berger, R.; Li, X.M.; Vollmer, D.; Steffen, W.; et al. Contact angle hysteresis. Curr. Opin. Colloid Interface Sci. 2022, 59, 101574–101610. [Google Scholar] [CrossRef]
  39. Moustavi, S.M.; Jarrahbashi, D.; Jik, L.B.; Karimi, N.K.; Faroughi, S.A. Impact of hybrid surfaces on the droplet breakup dynamics in microgravity slug flow: A dynamic contact angle analysis. Phys. Fluids 2023, 35, 072003–072010. [Google Scholar] [CrossRef]
  40. Vukovic, T.; Rostad, J.; Farooq, U.; Torsaeter, O.; Net, A. Systematic Study of Wettability Alteration of Glass Surfaces by Dichlorooctamethyltetrasiloxane Silanization—A Guide for Contact Angle Modification. ACS Omega 2023, 40, 36662–36676. [Google Scholar] [CrossRef]
  41. Vigdorowitsch, M.; Tsygankova, L.E.; Ostrikov, V.V.; Rodionova, L.D. Beyond the Wenzel and Cassie-Baxter world: Mathematical insight into contact angles. Math. Methods Appl. Sci. 2022, 45, 11479–11497. [Google Scholar] [CrossRef]
  42. Wang, J.; Wu, Y.; Cao, Y.; Li, G.; Liao, Y. Influence of surface roughness on contact angle hysteresis and spreading work. Colloid Polym. Sci. 2020, 298, 1107–1112. [Google Scholar] [CrossRef]
  43. Jiang, Y.; Xu, Z.; Li, B.; Li, J.; Guan, D. Soft Wetting: Droplet Receding Contact Angles on Soft Superhydrophobic Surfaces. Langmuir 2023, 43, 15401–15408. [Google Scholar] [CrossRef] [PubMed]
Figure 1. Schematic diagram of CF model.
Applsci 14 04557 g001
Figure 2. MF distribution near liquid solder under alternating MF in (a) 1/6 period, (b) 2/6 period, (c) 3/6 period, (d) 4/6 period, (e) 5/6 period, and (f) 6/6 period.
Applsci 14 04557 g002
Figure 3. Distribution of static MF near liquid solder.
Applsci 14 04557 g003
Figure 4. Distribution of alternating MF on the surface of liquid solder.
Applsci 14 04557 g004
Figure 5. CF process of liquid solder at (a) 5 ms, (b) 11 ms, (c) 17 ms, and (d) 26 ms.
Applsci 14 04557 g005
Figure 6. Theoretical model of EU wave generation.
Applsci 14 04557 g006
Figure 7. Distribution of LF inside the liquid solder.
Applsci 14 04557 g007
Figure 8. LF distribution on the surface of liquid solder in (a) horizontal direction and (b) vertical direction.
Applsci 14 04557 g008
Figure 9. Internal sound pressure distribution of liquid solder at (a) 50 ms, (b) 60 ms, (c) 70 ms, (d) 80 ms, (e) 90 ms, and (f) 100 ms.
Applsci 14 04557 g009
Figure 10. Positions of the internal micro-points of the liquid solder.
Applsci 14 04557 g010
Figure 11. Variation curve of sound pressure of micro-point in liquid solder.
Applsci 14 04557 g011
Figure 12. Force model of liquid solder front-end in (a) the initial state, (b) moving forward state, and (c) retraction state.
Applsci 14 04557 g012
Figure 13. Stress analysis of a micro-element in liquid solder.
Applsci 14 04557 g013
Figure 14. The change of front contact angle during the flow of liquid solder.
Applsci 14 04557 g014
Table 1. Physical parameters of substrates [25,26,27].
SubstrateElastic Modulus (GPa)Poisson RatioDensity (g/cm3)
SiC4500.1423.1
TC41100.314.44
Table 2. Physical parameters of Al-12Si [28,29,30].
SolderMelting (°C)Viscosity (mPa·s)Density (g/cm3)
Al-12Si5770.88 (700 °C)2.654
Table 3. Model’s initial parameters.
Parameter NameValue
Peak current50 A
Current frequency20 kHz
Number of coils30
Static MF1 T
Table 4. The sound pressure expression parameters of each micro-point.
Micro-PointSound Pressure Amplitude (MPa)Sound Pressure Frequency (kHz)Initial Phase (μs)Half-Wave Offset (MPa)
F0.1212013.5010.092
G0.072013.0250.031
H0.0392013.1150.018
Disclaimer/Publisher’s Note: The statements, opinions and data contained in all publications are solely those of the individual author(s) and contributor(s) and not of MDPI and/or the editor(s). MDPI and/or the editor(s) disclaim responsibility for any injury to people or property resulting from any ideas, methods, instructions or products referred to in the content.

