Article

Machine Learning-Based Fatigue Level Prediction for Exoskeleton-Assisted Trunk Flexion Tasks Using Wearable Sensors

by
Pranav Madhav Kuber
1,
Abhineet Rajendra Kulkarni
2 and
Ehsan Rashedi
1,*
1
Department of Industrial and Systems Engineering, Rochester Institute of Technology, Rochester, NY 14623, USA
2
Department of Computer & Information Science & Engineering, University of Florida, Gainesville, FL 32611, USA
*
Author to whom correspondence should be addressed.
Appl. Sci. 2024, 14(11), 4563; https://doi.org/10.3390/app14114563
Submission received: 28 April 2024 / Revised: 24 May 2024 / Accepted: 24 May 2024 / Published: 26 May 2024
(This article belongs to the Special Issue Advances in Digital Technology Assisted Industrial Design)

Abstract

:
Monitoring physical demands during task execution with exoskeletons can be instrumental in understanding their suitability for industrial tasks. This study aimed at developing a fatigue level prediction model for Back-Support Industrial Exoskeletons (BSIEs) using wearable sensors. Fourteen participants performed a set of intermittent trunk-flexion task cycles consisting of static, sustained, and dynamic activities, until they reached medium-high fatigue levels, while wearing BSIEs. Three classification algorithms, Support Vector Machine (SVM), Random Forest (RF), and XGBoost (XGB), were implemented to predict perceived fatigue level in the back and leg regions using features from four wearable wireless Electromyography (EMG) sensors with integrated Inertial Measurement Units (IMUs). We examined the best grouping and sensor combinations by comparing prediction performance. The findings showed best performance in binary classification of leg and back fatigue with 95% (2 EMG + IMU sensors) and 82% (single IMU sensor) accuracy, respectively. Tertiary classification for back and leg fatigue level prediction required four sensor setups with both EMG and IMU measures to perform at 79% and 67% accuracy, respectively. The efforts presented in our article demonstrate the feasibility of an accessible fatigue level detection system, which can be beneficial for objective fatigue assessment, design selection, and implementation of BSIEs in real-world scenarios.

1. Introduction

Neuromuscular fatigue can compromise the execution of physiological functions of bodily systems, necessitating the development of interventions to prevent/delay the onset of fatigue. Fatigue and its incomplete recovery have been linked to longer reaction time, impaired concentration, coordination, and information processing, and poor judgment [1]. This can adversely affect task performance and increase the risk of suffering an injury [2]. The prevalence of fatigue costs U.S. employers ~$130 billion annually in lost productive time, with ~38% of workers reporting fatigue in their previous 2 weeks of work [3]. Consequently, measuring fatigue levels can be beneficial in developing interventions that promote workplace safety. Fatigue is measured by recording perceived exertion or by measuring decreases in physical ability, such as the inability to maintain force generation, and the cognitive capacity to perform tasks [4]. While localized fatigue, or muscle fatigue, is typically measured by measuring impacts on muscle activity (e.g., an increase in the peak amplitude of the signal) [5,6], perceived fatigue, or global fatigue, is usually measured using subjective approaches [7,8]. There is a growing need for developing quantitative approaches of measuring perceived fatigue. Recent developments in sensors have enabled the in-depth recording of physiological signals. Earlier studies have demonstrated a direct correlation of changes in such signals (heart rate, muscle activity, and body movement) to fatigue, enabling objective fatigue level detection [9,10,11]. Monitoring fatigue levels can be helpful in designing task cycles, providing optimum work–rest ratios, and accounting for individual differences, leading to a personalized and effective approach to minimize fatigue in industrial environments.
Machine learning classification algorithms have emerged as powerful tools to categorize data into distinct predefined classes. Common types of such algorithms include decision trees, support vector machines, and ensemble methods. Decision trees incorporate a hierarchical tree form with structured nodes (root, decision, and leaf nodes) to categorize datapoints into subsets [12,13,14], while Support Vector Machines (SVM) aim to establish a boundary between predefined sets of datapoints [15,16,17]. Meanwhile, ensemble methods like Random Forests combine multiple decision trees to improve predictive performance and robustness [18,19,20]. Prior studies have implemented these algorithms for detecting fatigue. Common algorithms used for fatigue detection include SVM, Artificial Neural Networks, k-Nearest Neighbors, Random Forest (RF), and Decision Trees [21,22,23,24]. Controlled lab-based studies have been conducted to generate and develop training datasets and evaluate the performance of machine learning models for predicting level of fatigue [25]. To develop objective fatigue detection, models that utilize physiological signals obtained from sensors have been developed. Previous studies have used features calculated from motion data [11,21,23,25], muscle activity [26], balance [22], and variability in heart rate [11,21]. The accuracy of these machine learning models in correctly classifying the state of an individual as fatigued or non-fatigued has been reported in the range of ~70–90%. Thus, machine learning-based systems can be implemented to accurately detect the level of fatigue at workplaces.
Exoskeletons (EXOs) are wearable devices that augment the physical capabilities of their wearers using mechanical (passive) or electromechanical (active) actuation and an external structure [27,28,29,30]. Within the past decade, EXOs have risen as promising interventions to improve human performance and safety in the military [31], healthcare [32,33], and industry [34]. These devices are often categorized based on the body region they support, with common types being those supporting the upper body (back, shoulder, arm, wrist) or lower body (knee, ankle) regions. The industrial variants of EXOs aim to reduce the risk of injury due to overexertion [35]. For instance, the low back stands out as a particularly vulnerable region of the human body, and the annual rate of injury in workplaces has been reported to be ~17% across the U.S [36,37,38]. Back-Support Industrial Exoskeletons (BSIEs) belong to upper-body EXOs that support the wearer’s torso while they perform trunk-bending activities, aiming to decrease muscle activity in the low back muscles [39,40,41,42,43,44]. Controlled lab-based and field evaluations of EXOs are conducted by recruiting human subjects, which assists in their design and development [45,46,47]. Findings from laboratory evaluations demonstrate decreases in back muscle activity (~8–50%) with the use of BSIEs while performing static bending [39,40,43,48,49] and dynamic lifting tasks [43,50,51,52,53,54]. However, when these devices are implemented in field scenarios, their effects are reported as mixed [55]. To check whether these devices are providing their intended benefits to wearers, there is a need for developing approaches for detecting and monitoring physical demands. Monitoring fatigue during EXO-assisted tasks can be beneficial in such cases.
In our earlier study, we developed a model to detect medium-high level of fatigue in the back region during repeated trunk bending/retraction using optoelectronic motion capture, force plates, and muscle activity detection systems [56]. This article builds upon our past work by utilizing a dataset consisting of a range of fatigue values (from 0–7 in a scale of 10) in both low back and leg regions to predict levels of fatigue (e.g., low, medium, high). In addition, we considered intermittent trunk flexion task sequences involving static, dynamic, and sustained trunk flexion; these were performed in both symmetric and asymmetric postures. Furthermore, the inputs used for developing the models were sourced from four wearable sensors (muscle activity and inertial motion sensors), to consider the accessibility of real-world evaluations. As being assisted with an EXO while performing tasks may affect both local and global fatigue progression, the models proposed here may perform better in contrast to generic fatigue prediction models (without EXOs). Thus, the purpose of this study is to develop a model that can assist in evaluating the overall demands on BSIE users by monitoring their fatigue level as they perform routine trunk flexion tasks. Subsequently, the novelty of this study is that the developed models incorporate features while performing EXO-supported tasks, making the model specific to similar wearable assistive devices like BSIEs. Our secondary objectives were to determine the most effective grouping of fatigue levels for optimal model performance and to minimize the number of sensors for accessible evaluation. We hypothesized that features obtained from a combination of muscle activity and motion would yield the highest model performance. We also anticipated that binary grouping of back fatigue levels would yield superior model performance to tertiary grouping. The presented efforts in this study can be utilized for designing guidelines on using BSIEs based on the progression of global (perceived) fatigue levels of their users.

2. Materials and Methods

2.1. Study Participants

We recruited a participant pool of 14 male adults from university population with the inclusion criteria of: (a) range of height between 5 and 6 ft. and weight between 120 and 200 lbs., (b) at a minimum, two exercise sessions per week, and (c) lack of disorders of the musculoskeletal system in the past six months. Participant pool in this study was same as our earlier work [56]. Anthropometric dimensions of participants, as measured in terms of mean (SD), consisted of age in years: 20.2 (2.6), height in cm: 179.1 (3.7), weight in kg: 72.9 (6.2), body mass index in kg/m2: 22.7 (2.4), chest circumference in cm: 89.5 (3.9), and hip circumference in cm: 86.6 (6.0). Written informed consent was obtained from all participants prior to data collection, as approved by the university’s Review Board (Approval number: HSRO#01113021) with experimental protocols that were aligned with the tenets of the Declaration of Helsinki.

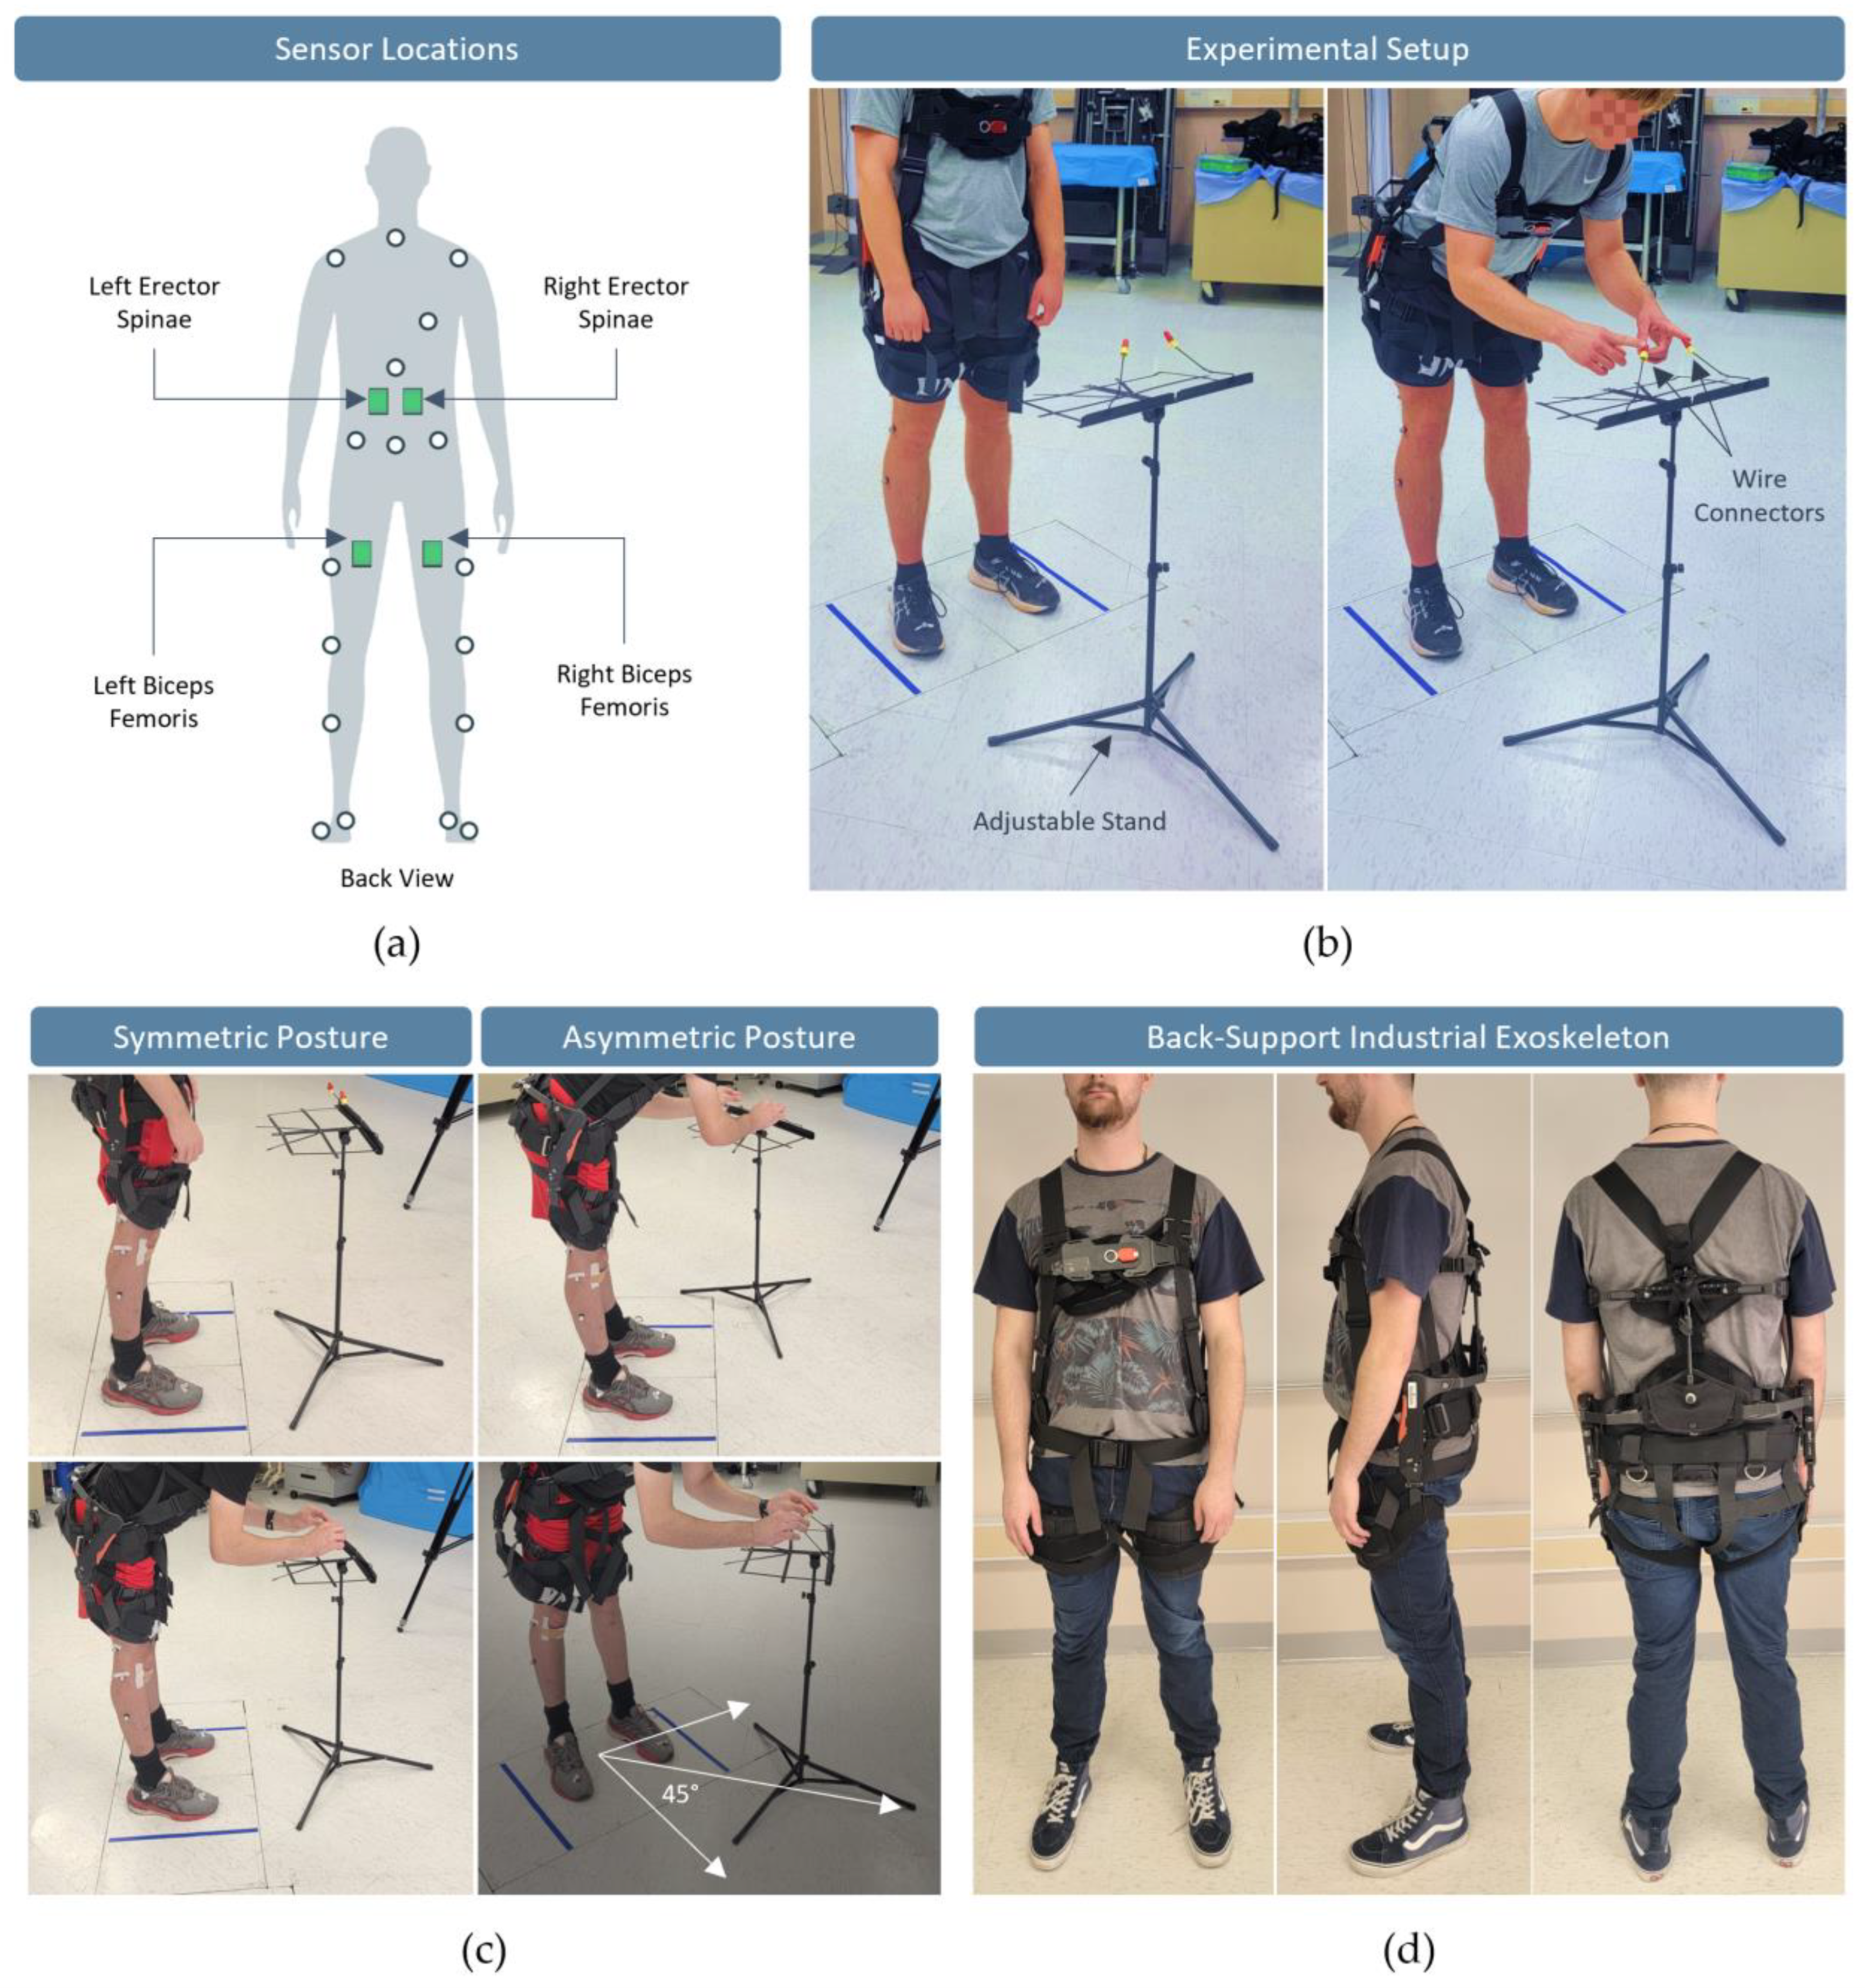
2.2. Experimental Tasks, Apparatus, and Equipment

To simulate intermittent tasks, we considered a task cycle that included 30 s periods of sustained trunk flexion (~45° sagittal flexion angle) and 15 s intervals of standing-still tasks before and after sustained bending, performed intermittently with 15 s relaxation breaks. As shown in Figure 1, awkward postures were simulated by considering asymmetric trunk flexion (~45° transverse flexion angle) as an additional experimental condition. Thus, participants performed intermittent tasks, once with ~45° asymmetry and then without. The apparatus consisted of a height and tilt adjustable stand with wire connectors spaced approximately 10 inches apart. Placement of the stand was adjusted based on the trunk flexion angle of each participant and depending on participants’ posture (asymmetric/symmetric).
We selected a passive rigid BSIE, BackX Model AC (SuitX, Emeryville, CA, USA), which uses two pseudo-mechanically operated actuators and a chest pad to support the trunk during trunk flexion. Assistance was set at a medium level (~25 lbs.) and was kept consistent throughout the study. This device has been reported to primarily reduce muscle activity in the low back region [57]. Our pilot studies showed potential benefits in both the low back and thigh regions. Thus, the muscle groups of interest included left/right erector spinae longissimus (LES/RES) and the biceps femoris muscles (LBF/RBF). These muscle groups are known to undergo significant contraction during trunk flexion, as they are responsible for stabilizing the torso. To collect muscle activity data, we placed four Electromyography (EMG) sensors on each of these muscles using the Trigno Wireless EMG system (Delsys, Natick, MA, USA, 1200 Hz). Each sensor also included an Inertial Measurement Unit (IMU) sensor, which provided acceleration of the sensor along x, y, and z axes. Perceived fatigue was measured in the back and leg regions using the Borg Ratings of Perceived Exertion (RPE) CR-10 scale [58,59].

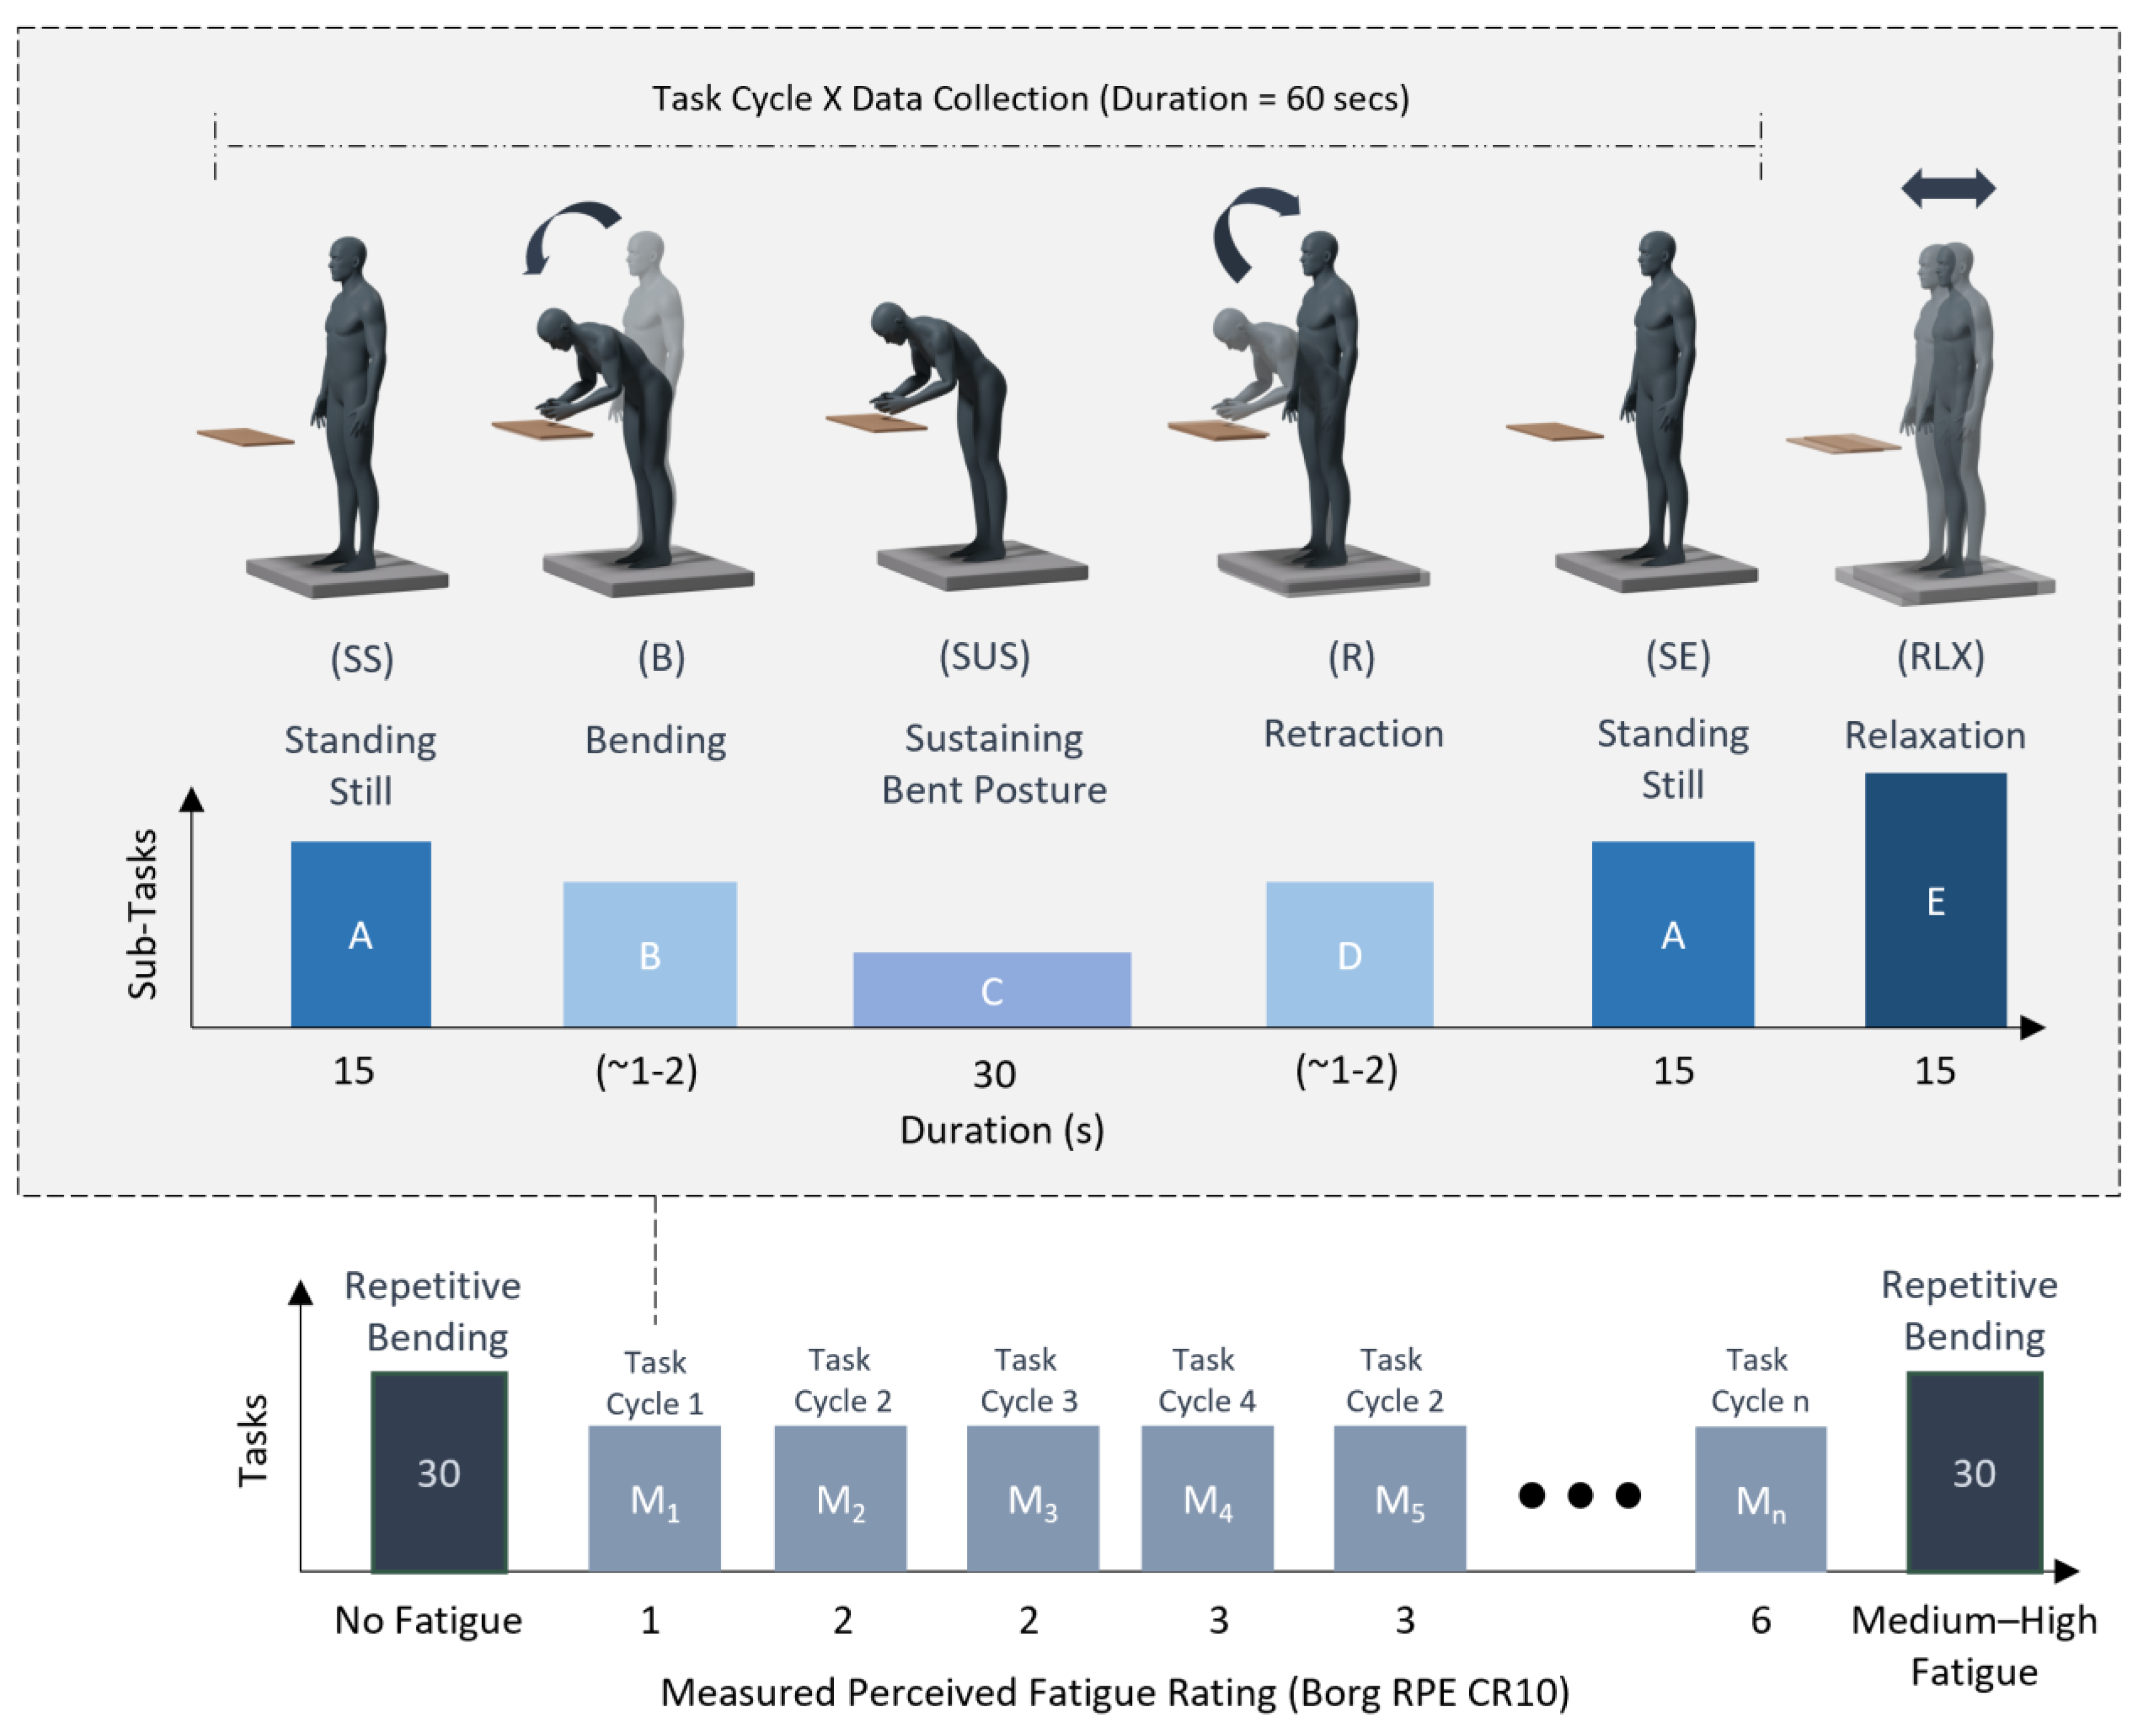
2.3. Experimental Protocol

Complete experiment comprised of three sessions (training/session-1, session-2, session-3) with ~48 h break between each session for recovery. The first session consisted of training/familiarization, as well as calibration of equipment. Participants performed a wall-sit task for calibrating their perceived exertion ratings on the Borg scale. We measured Maximum Voluntary Contractions (MVC) of each muscle by restricting motion. Each of the two subsequent experimental sessions included performing bending tasks with/without the BSIE, once with asymmetry and once without asymmetry, with a 15 min break between the posture conditions. Protocol for experimental tasks in each condition consisted of intermittent task cycles with 30 s sustained bending and two 15 s standing-still activities performed with 15 s relaxation breaks, with task cycles repeated until participants reached a medium-high fatigue level (Figure 2). As this study utilized data collected during the same experiment as our prior work, a more comprehensive description of the experiment can be found in our recent publication [56].
Intermittent task cycles were preceded and followed by 30 repetitions of trunk bending/retraction at a similar trunk angle as the condition (with/without ~45° asymmetry). RPE ratings in the back and leg regions were obtained from participants on the RPE scale after each task cycle for both asymmetry and symmetry conditions. Simultaneously, objective data from equipment was collected, with each exported Excel file corresponding to a 60 s task cycle labelled according to the RPE ratings of both low back and leg regions.

2.4. Feature Engineering and Model Development

We developed a custom MATLAB code to import data, segment based on type of activity, and calculate features. A list of features generated is displayed in Table 1. For each task cycle shown in Figure 2, portions of the task were segmented, and measures were calculated from raw EMG and accelerometer signals from each of the four wearable sensors placed on low back and thighs. The EMG signal was filtered using a Butterworth filter in the 30 Hz and 300 Hz bands [39,60]. Features from EMG sensors included the peak and mean amplitude of muscle activity recorded by each of the four sensors on LES, LBF, RES, and RBF for each activity portion. All peak values were normalized for each EMG sensor on the back and legs obtained from MVC trials. Time-series data were converted to the frequency domain to calculate the median frequency of the signal. Each EMG sensor was accompanied by an Inertial Measurement Unit (IMU) sensor. Data from IMU were filtered using a 2nd-order lowpass digital Butterworth filter with a normalized cutoff frequency of 10 Hz. We calculated mean, standard deviation, and variance of the norm of acceleration from each IMU sensor over each portion of the task. In addition, all features were normalized for the entire condition based on the values for the first task cycle and were added as additional features. All features were calculated for each activity within each task cycle, including standing still at start/end, sustained bending, bending, and retraction (Figure 2). Overall, three separate datasets were prepared with all features representing (a) kinematics (160 features), (b) muscle activity (280), and (c) kinematics and muscle activity (440).
Machine learning classification algorithms, namely Support Vector Machine (SVM), Random Forest (RF), and XGBoost (XGB), were applied to detect fatigue level. Figure 3 depicts a flowchart showing the complete procedure of model development. Testing of models varied according to factors of sensors (four sensors placed on low back and leg on each side), measures (muscle activity, kinematics), fatigue region (low back and legs), level and grouping style (binary or tertiary). Obtained fatigue level values in the range of 0 (no fatigue) to 7 (medium-high fatigue) were categorized based on three separate arrangement methods. Specifically, three grouping styles for labelling RPE levels were adopted for binary and tertiary grouping of both back and leg ratings (0–7), as depicted in Table 2. We also utilized three classification algorithms (SVM, RF, XGB), each with three model tuning techniques of baseline, SMOTE, and GRID. All these factors were varied to determine the best-performing models considering metrics (such as accuracy, recall, and precision) and accessibility (number of sensors required for prediction).

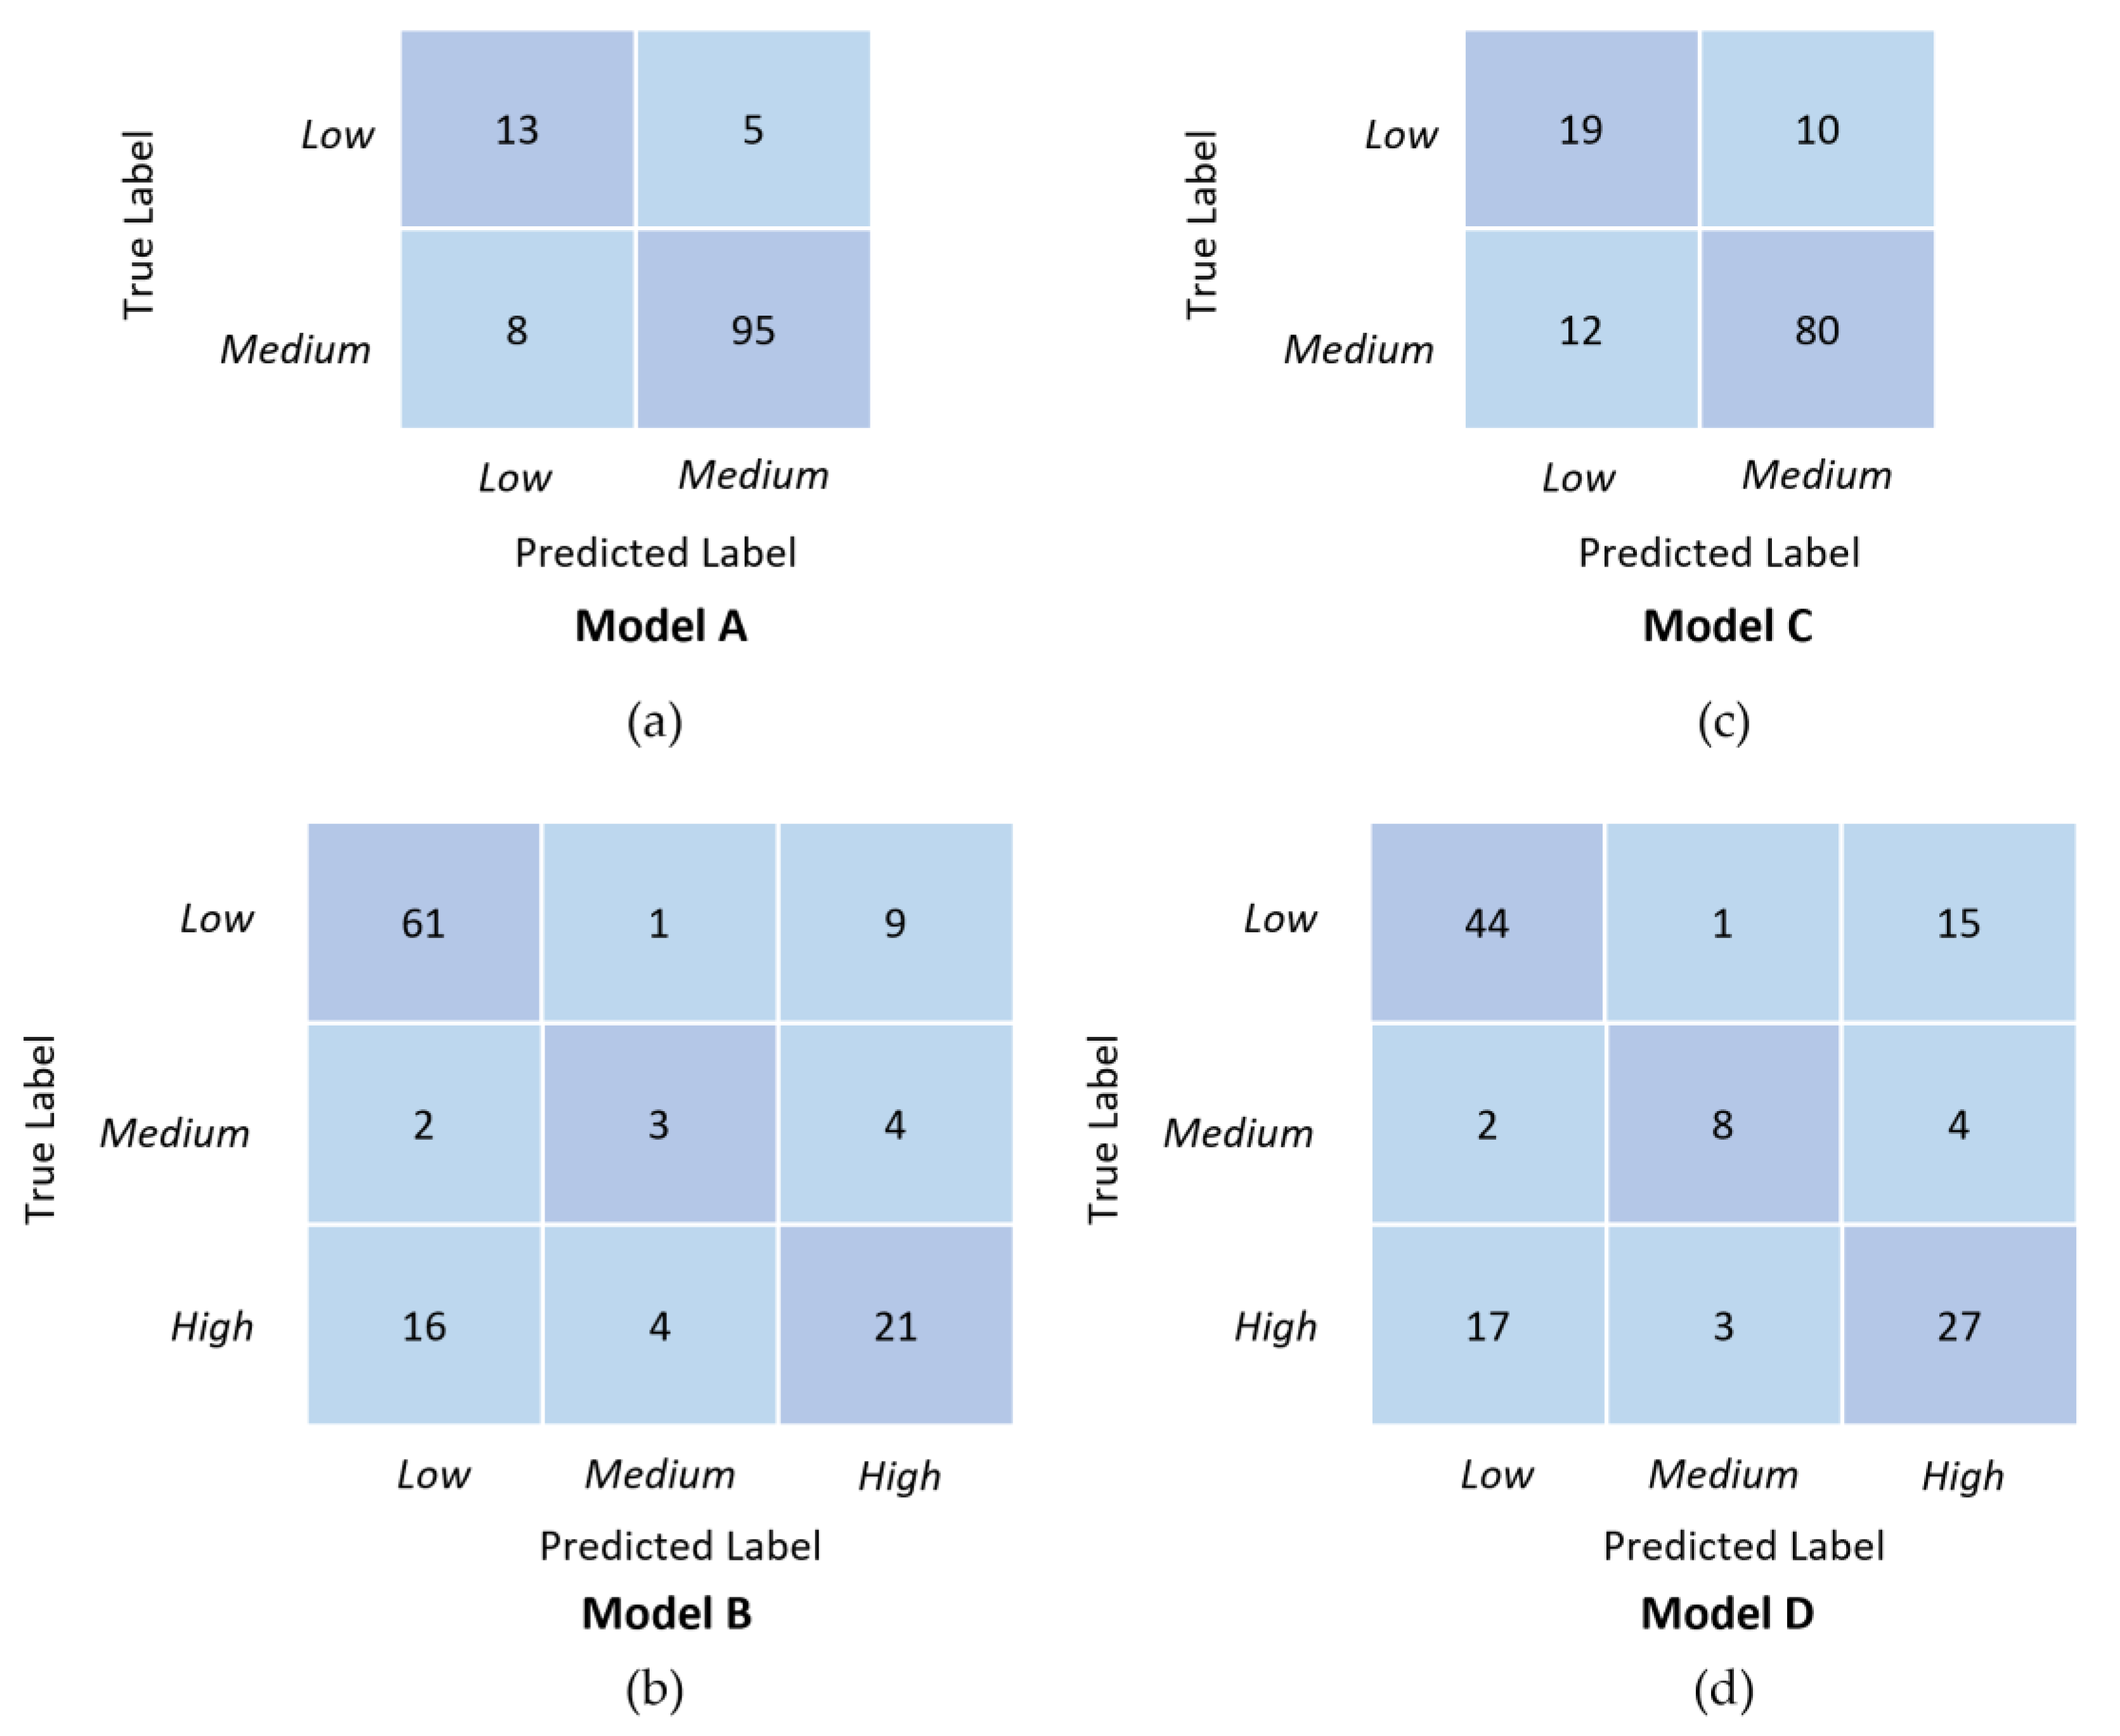
2.5. Performance Evaluation and Validation

We used the train–test split method to assess the performance of machine learning models. All the data were divided into two sets: (a) training set, which was used to train the model for detecting the patterns across the datapoints, and (b) test set, which was used to evaluate the model. Performance metrics were calculated by making predictions on the unseen data (test set) using the model trained on training set.
Metrics for assessing model performance included accuracy (A), sensitivity/recall (R), specificity (S), precision (P), F1-score (F1), and G-index (G) and were calculated in a similar manner as our prior study [56]. For calculating performance metrics, we first divided the data into two separate sets using the train–test split technique. Based on the predictions and the actual labels of the test data, we generated a confusion matrix for each model, with rows and columns corresponding to each class in our model. A confusion matrix represents four variables, as described below:
  • True Positive (TP): The number of instances correctly predicted as positive.
  • True Negative (TN): The number of instances correctly predicted as negative.
  • False Positive (FP): The number of instances incorrectly predicted as positive.
  • False Negative (FN): The number of instances incorrectly predicted as negative.
In this study, true positives (TP) represent activities correctly labeled as belonging to the fatigue level, while true negatives (TN) are activities correctly labeled as not belonging to the fatigue level. False positives (FP) occur when activities are incorrectly labeled as belonging to the fatigue level, and false negatives (FN) occur when activities are incorrectly labeled as not belonging to the fatigue level. This can be further generalized for multi-class classification as well. Accuracy reflects the model’s ability to correctly detect the fatigue level of activities. Sensitivity and specificity indicate the model’s ability to recognize different fatigue levels, while precision measures the reliability of the model’s predictions of fatigue levels. The F1-score and G-index were calculated similar to our recently published study [56].
The main drawback of the train–test split method is that the performance estimates can vary widely because they depend on a single random split, indicating that different splits can result in widely varying performance. Another drawback is that if the random split is not representative of the distribution, it can lead to model overfitting or underfitting. Thus, we implemented cross-validation technique for better verification of our results. This involved partitioning the data into multiple subsets, training the model on subsets, and validating the remaining subset. For instance, in the k-fold cross-validation method, the model is trained on (k − 1) subsets and validated on the remaining subset. This process is repeated k times, each time with a different fold as the validation set. The results are averaged to produce a single performance estimate. Performance metrics are then averaged across multiple folds, which provides a more reliable and stable estimate of a model’s performance compared to a single train–test split. This study implemented 5-fold cross-validation. Each model was tested using three methods, first on the testing dataset, then applying SMOTE (Synthetic Minority Over-sampling Technique) on the training dataset to balance the number of observations across fatigue levels. Finally, feature importances were computed for high-performing scenarios to identify the contributions of specific features to the overall model performance.

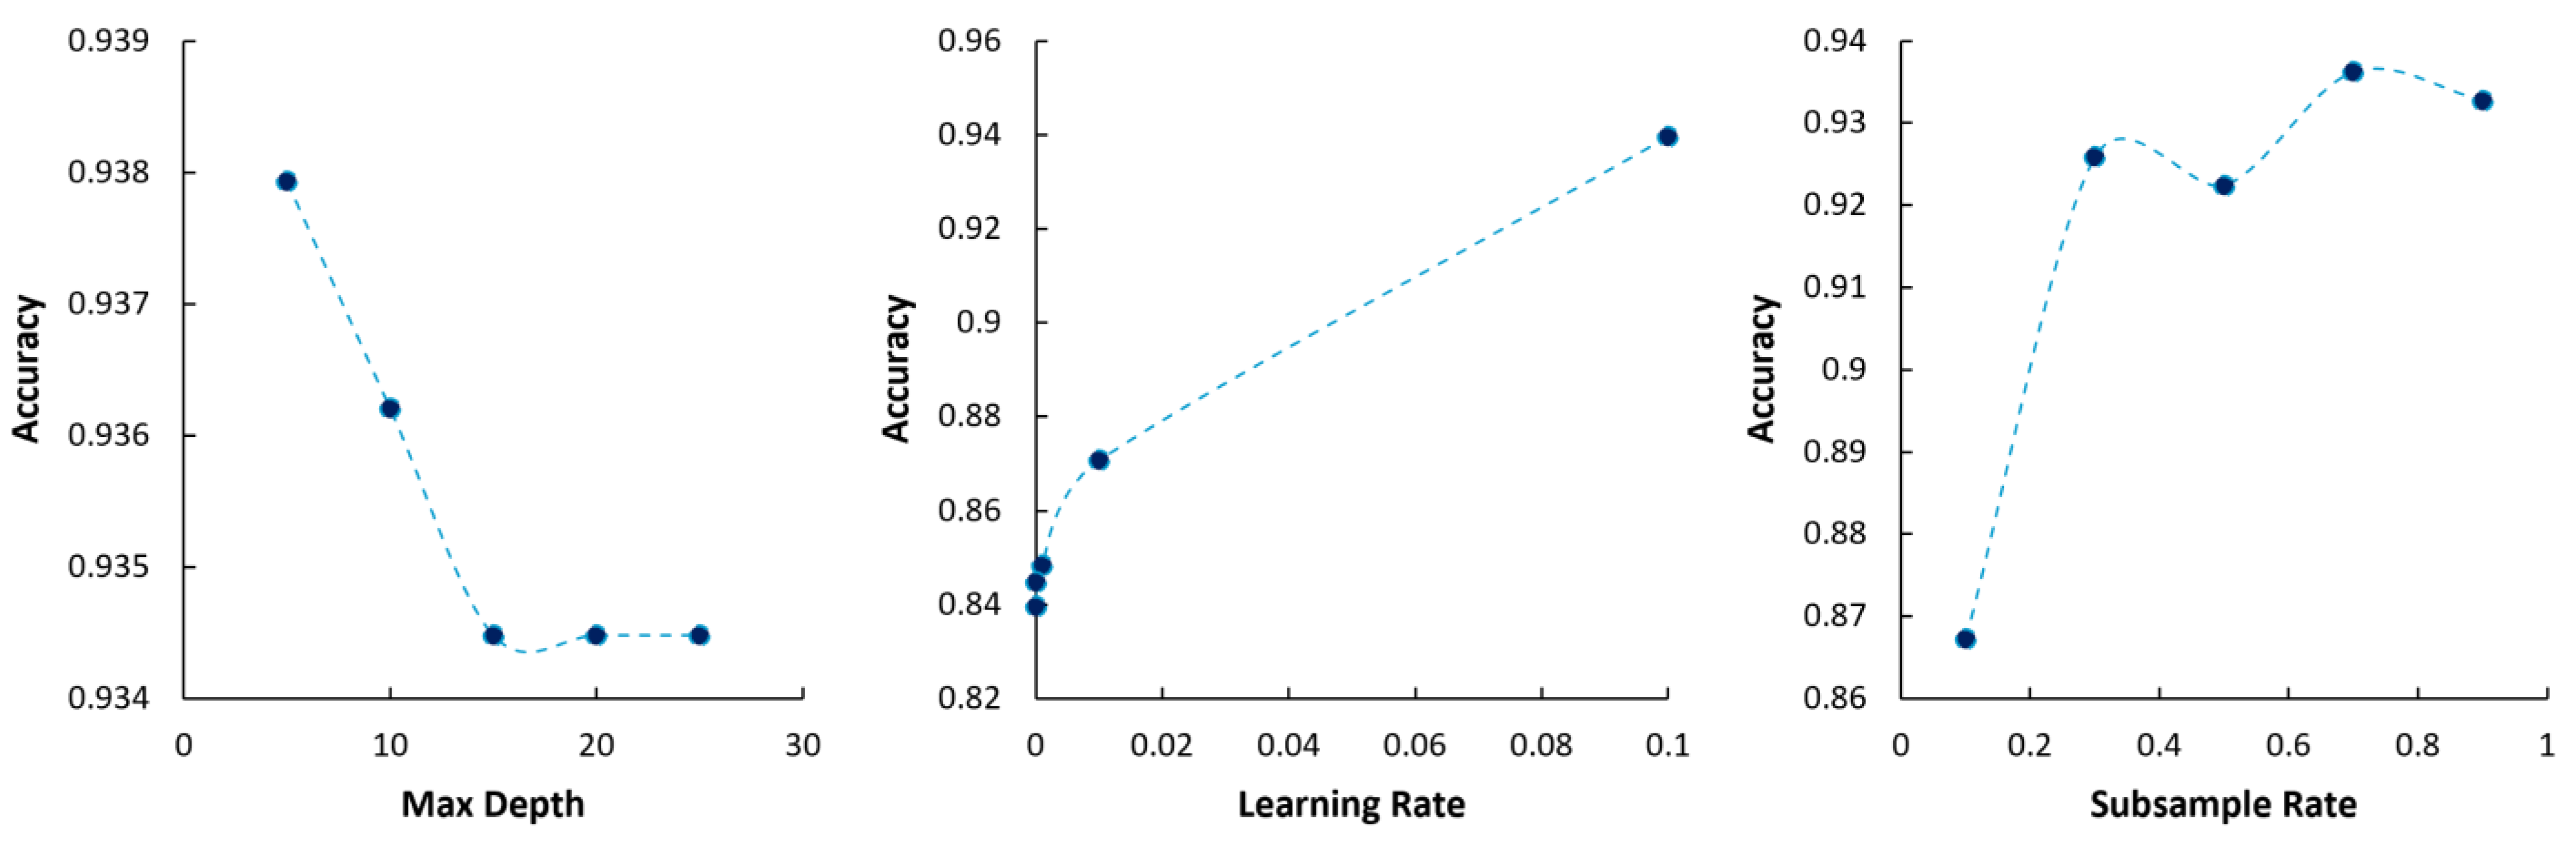
2.6. Determining Optimal Model Parameters

Finding the optimum value of the parameters for classification settings, known as hyperparameter tuning, is a critical step in developing a high-performing machine learning model [61]. Grid search is a methodical approach to hyperparameter tuning in machine learning that involves defining a grid of hyperparameter values and exhaustively searching through all possible combinations to find the optimal set of hyperparameters for a given model. Hyperparameters are the parameters that are not learned by the model during training but are set prior to the training process. We then create a grid for all the values of the different hyperparameters we want to search for. For each combination of hyperparameters, we perform k-fold cross-validation to evaluate the model’s performance on the chosen metric. The final step involves identifying the combination of hyperparameters that result in the highest possible value for the chosen performance metric. This combination is considered the optimal set of hyperparameters.

3. Results

The top models for binary and tertiary classification of fatigue levels, identified through performance evaluation of iterative testing by varying model factors and their levels, are depicted in Table 3. The outcomes indicate the FL2G2 grouping method, representing binary grouping into low (0–2) and medium (3–6) levels, led to the highest performance in predicting leg fatigue level. The best performance (A: 95%, P: 97%, S: 83%, R: 97%) was seen from the model using EMG and Kinematics features from two sensors placed on the left back and leg regions. A similar grouping method, but based on perceived exertion ratings in the back, FB2G2 demonstrated the highest performance in predicting leg fatigue level. Considering accessibility, a single IMU sensor on the thigh (LBF) was able to perform binary classification of leg fatigue with an accuracy of 88%. Performance was ~5–20% lower in tertiary vs. binary classification. Similarly, leg prediction performance was better compared to back prediction, with performance decreasing even more considering tertiary grouping in terms of low, medium, and high levels. However, a single IMU sensor on either side of the low back region was able to predict low or medium fatigue levels with similar performance (A: 82%, P: 89%, S:66%, R: 87%).

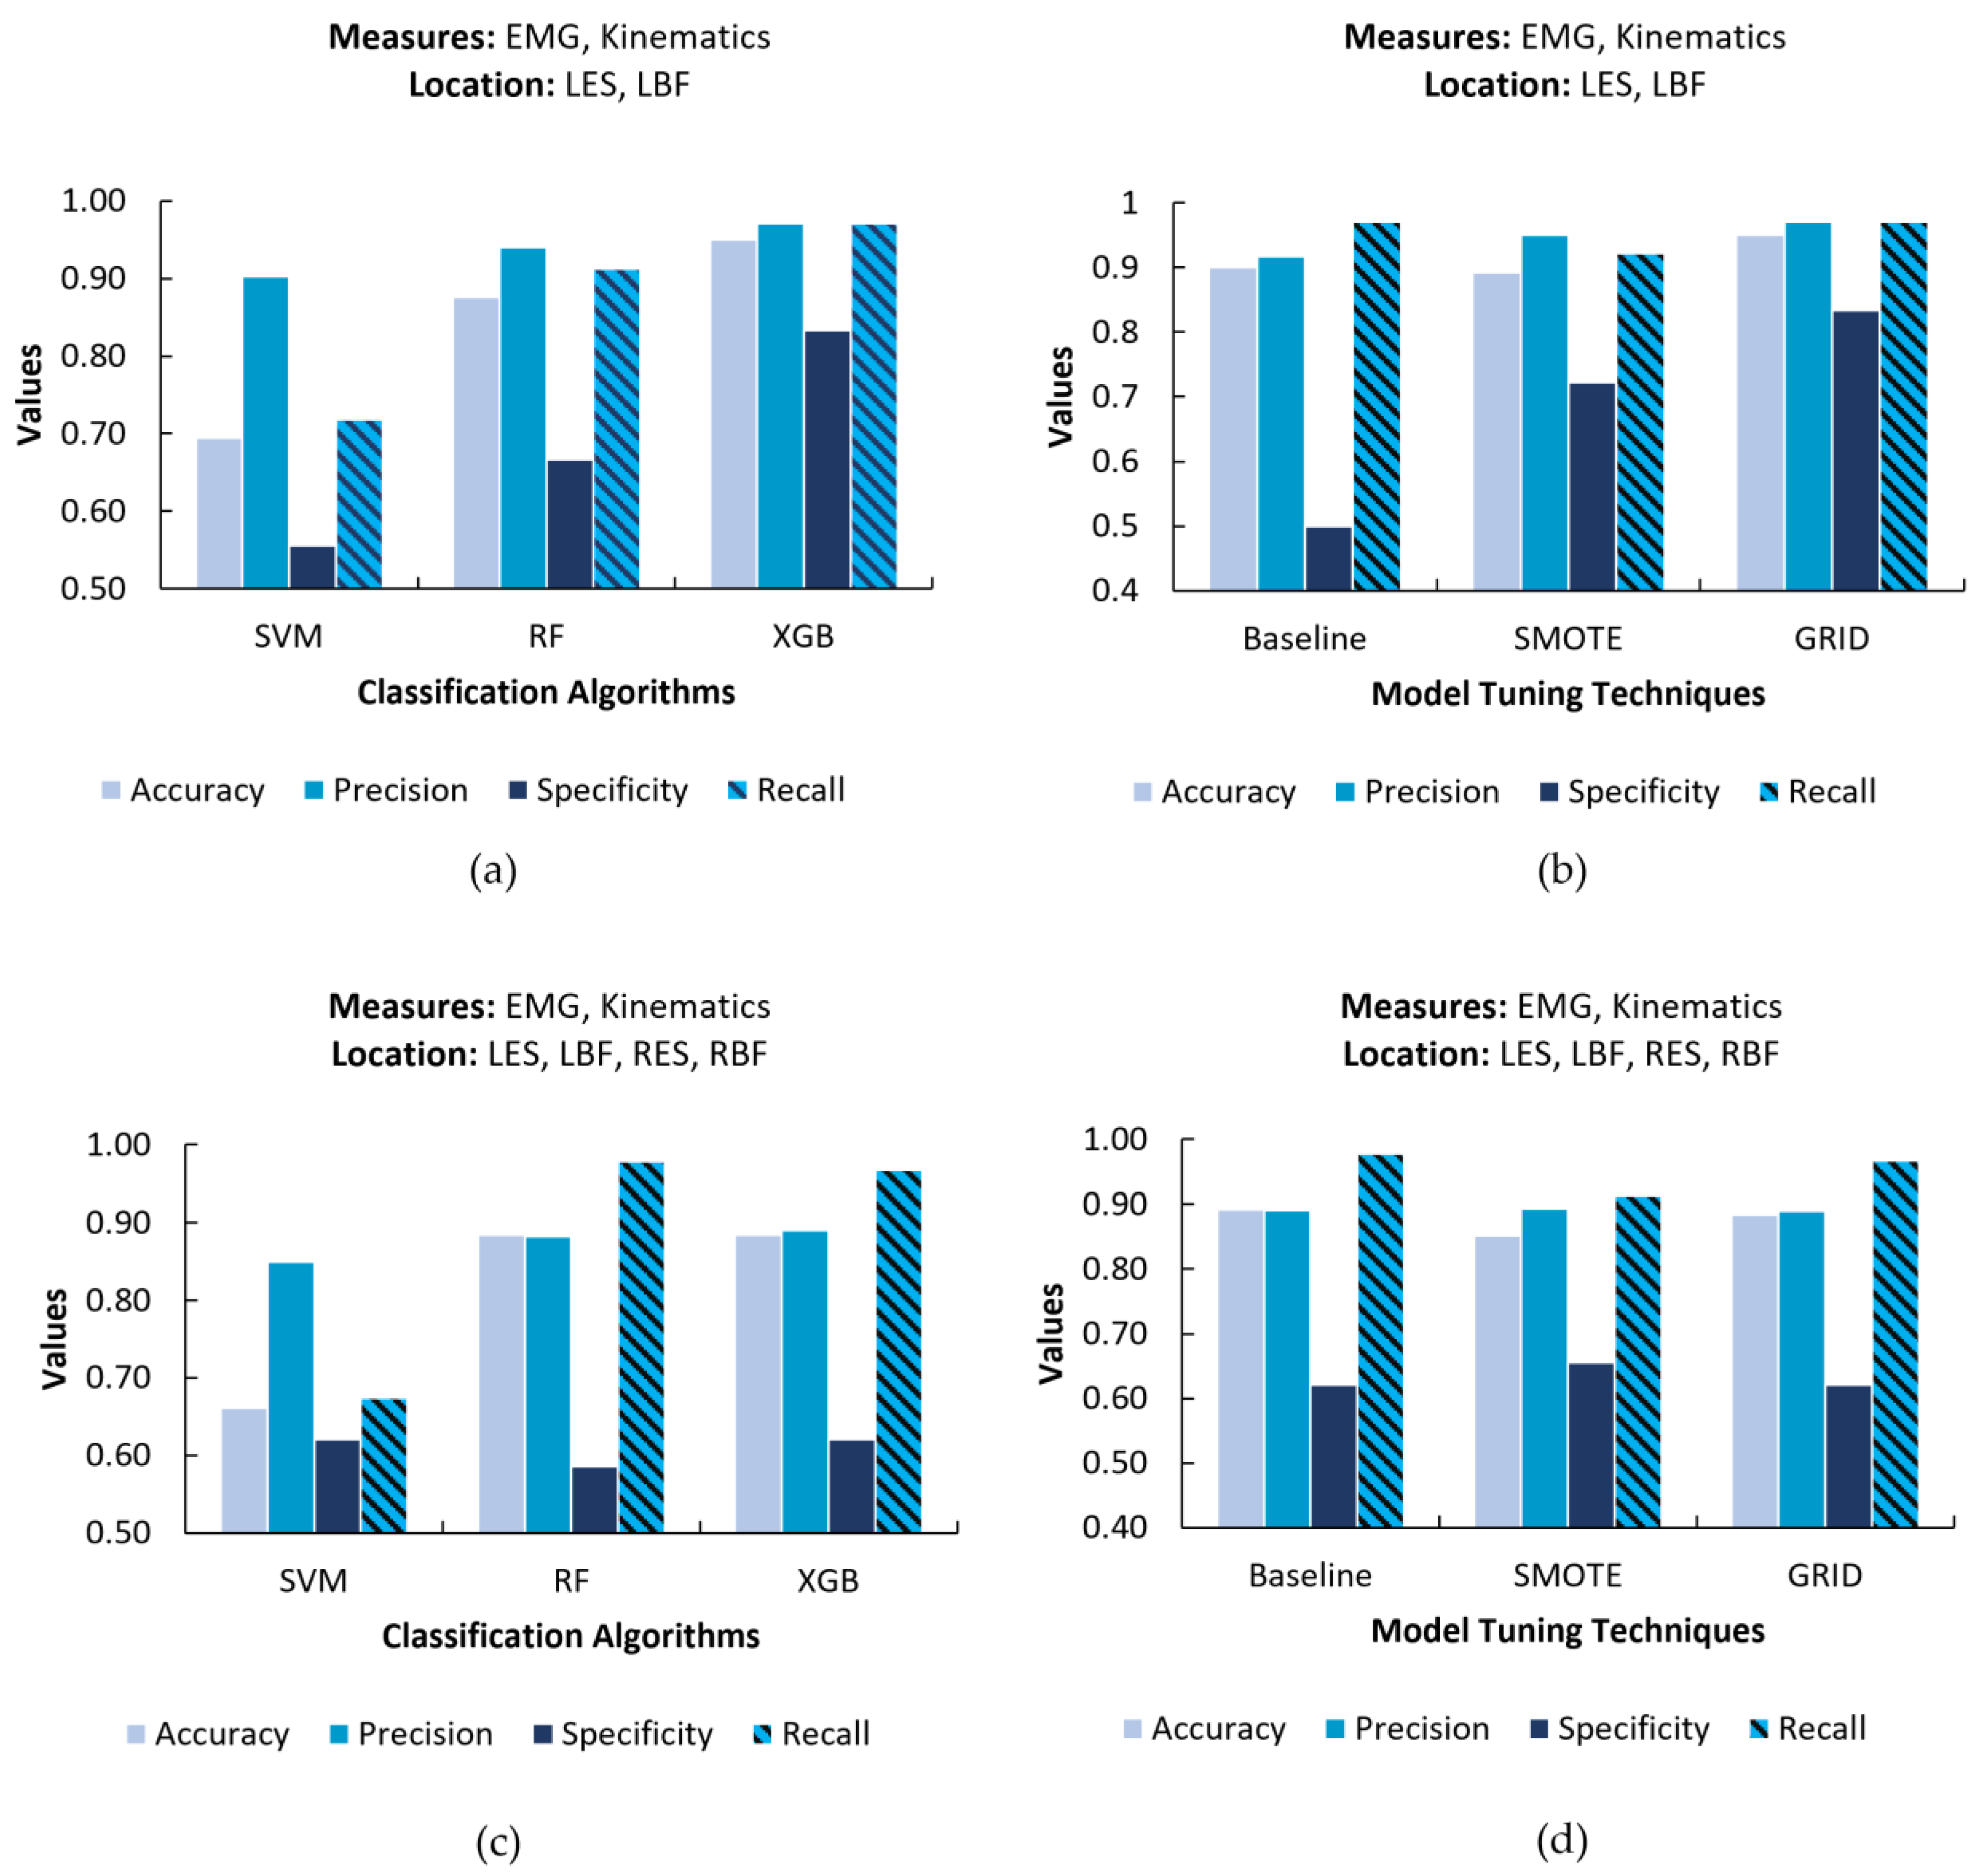
3.1. Effects of Performance with Variation in Model Factors and Parameters

Variation of performance values across levels of classification algorithms (SVM, RF, XGB) and model tuning techniques (Baseline, SMOTE, GRID) are shown in Figure 4. The highest performance was observed when using the XGB algorithm and when using the Grid search tuning technique. Among the classification algorithms, SVM demonstrated the lowest performance values. Performance improved after using SMOTE to balance the number of datapoints between groups of different fatigue levels, and even higher performance was achieved after performing hyperparameter tuning using Grid search. Performance of predicting the fatigue level across the six different grouping methods is depicted in Figure 5. The highest performance was seen in the second grouping method for the binary classification of back fatigue (FB2G2) as well as leg fatigue (FL2G2) levels. On the other hand, the FB2G3 grouping method demonstrated the lowest performance. Table 4 shows the variation in model performance with a reduction in sensors for a model utilizing EMG and Kinematics measures with the XGB algorithm (GRID). Using both sensors on the low back resulted in an accuracy of 95%, which dropped if either only LES or RES was used.
We investigated the sensitivity of hyperparameters on the metric of accuracy by varying the levels of three parameters: maximum depth (values: 5, 10, 15, 20, 25), learning rate (0.00001, 0.0001, 0.001, 0.01, 0.1), and subsample rate (0.1, 0.3, 0.5, 0.7, 0.9), as shown in Figure 6. Higher values of model accuracy were obtained with lower values of max depth and higher values of learning rate and subsample rate. Based on the plotted graphs, a set of levels for each of the three hyperparameters was selected to determine the best combination of these model parameters using the Grid search model tuning technique.

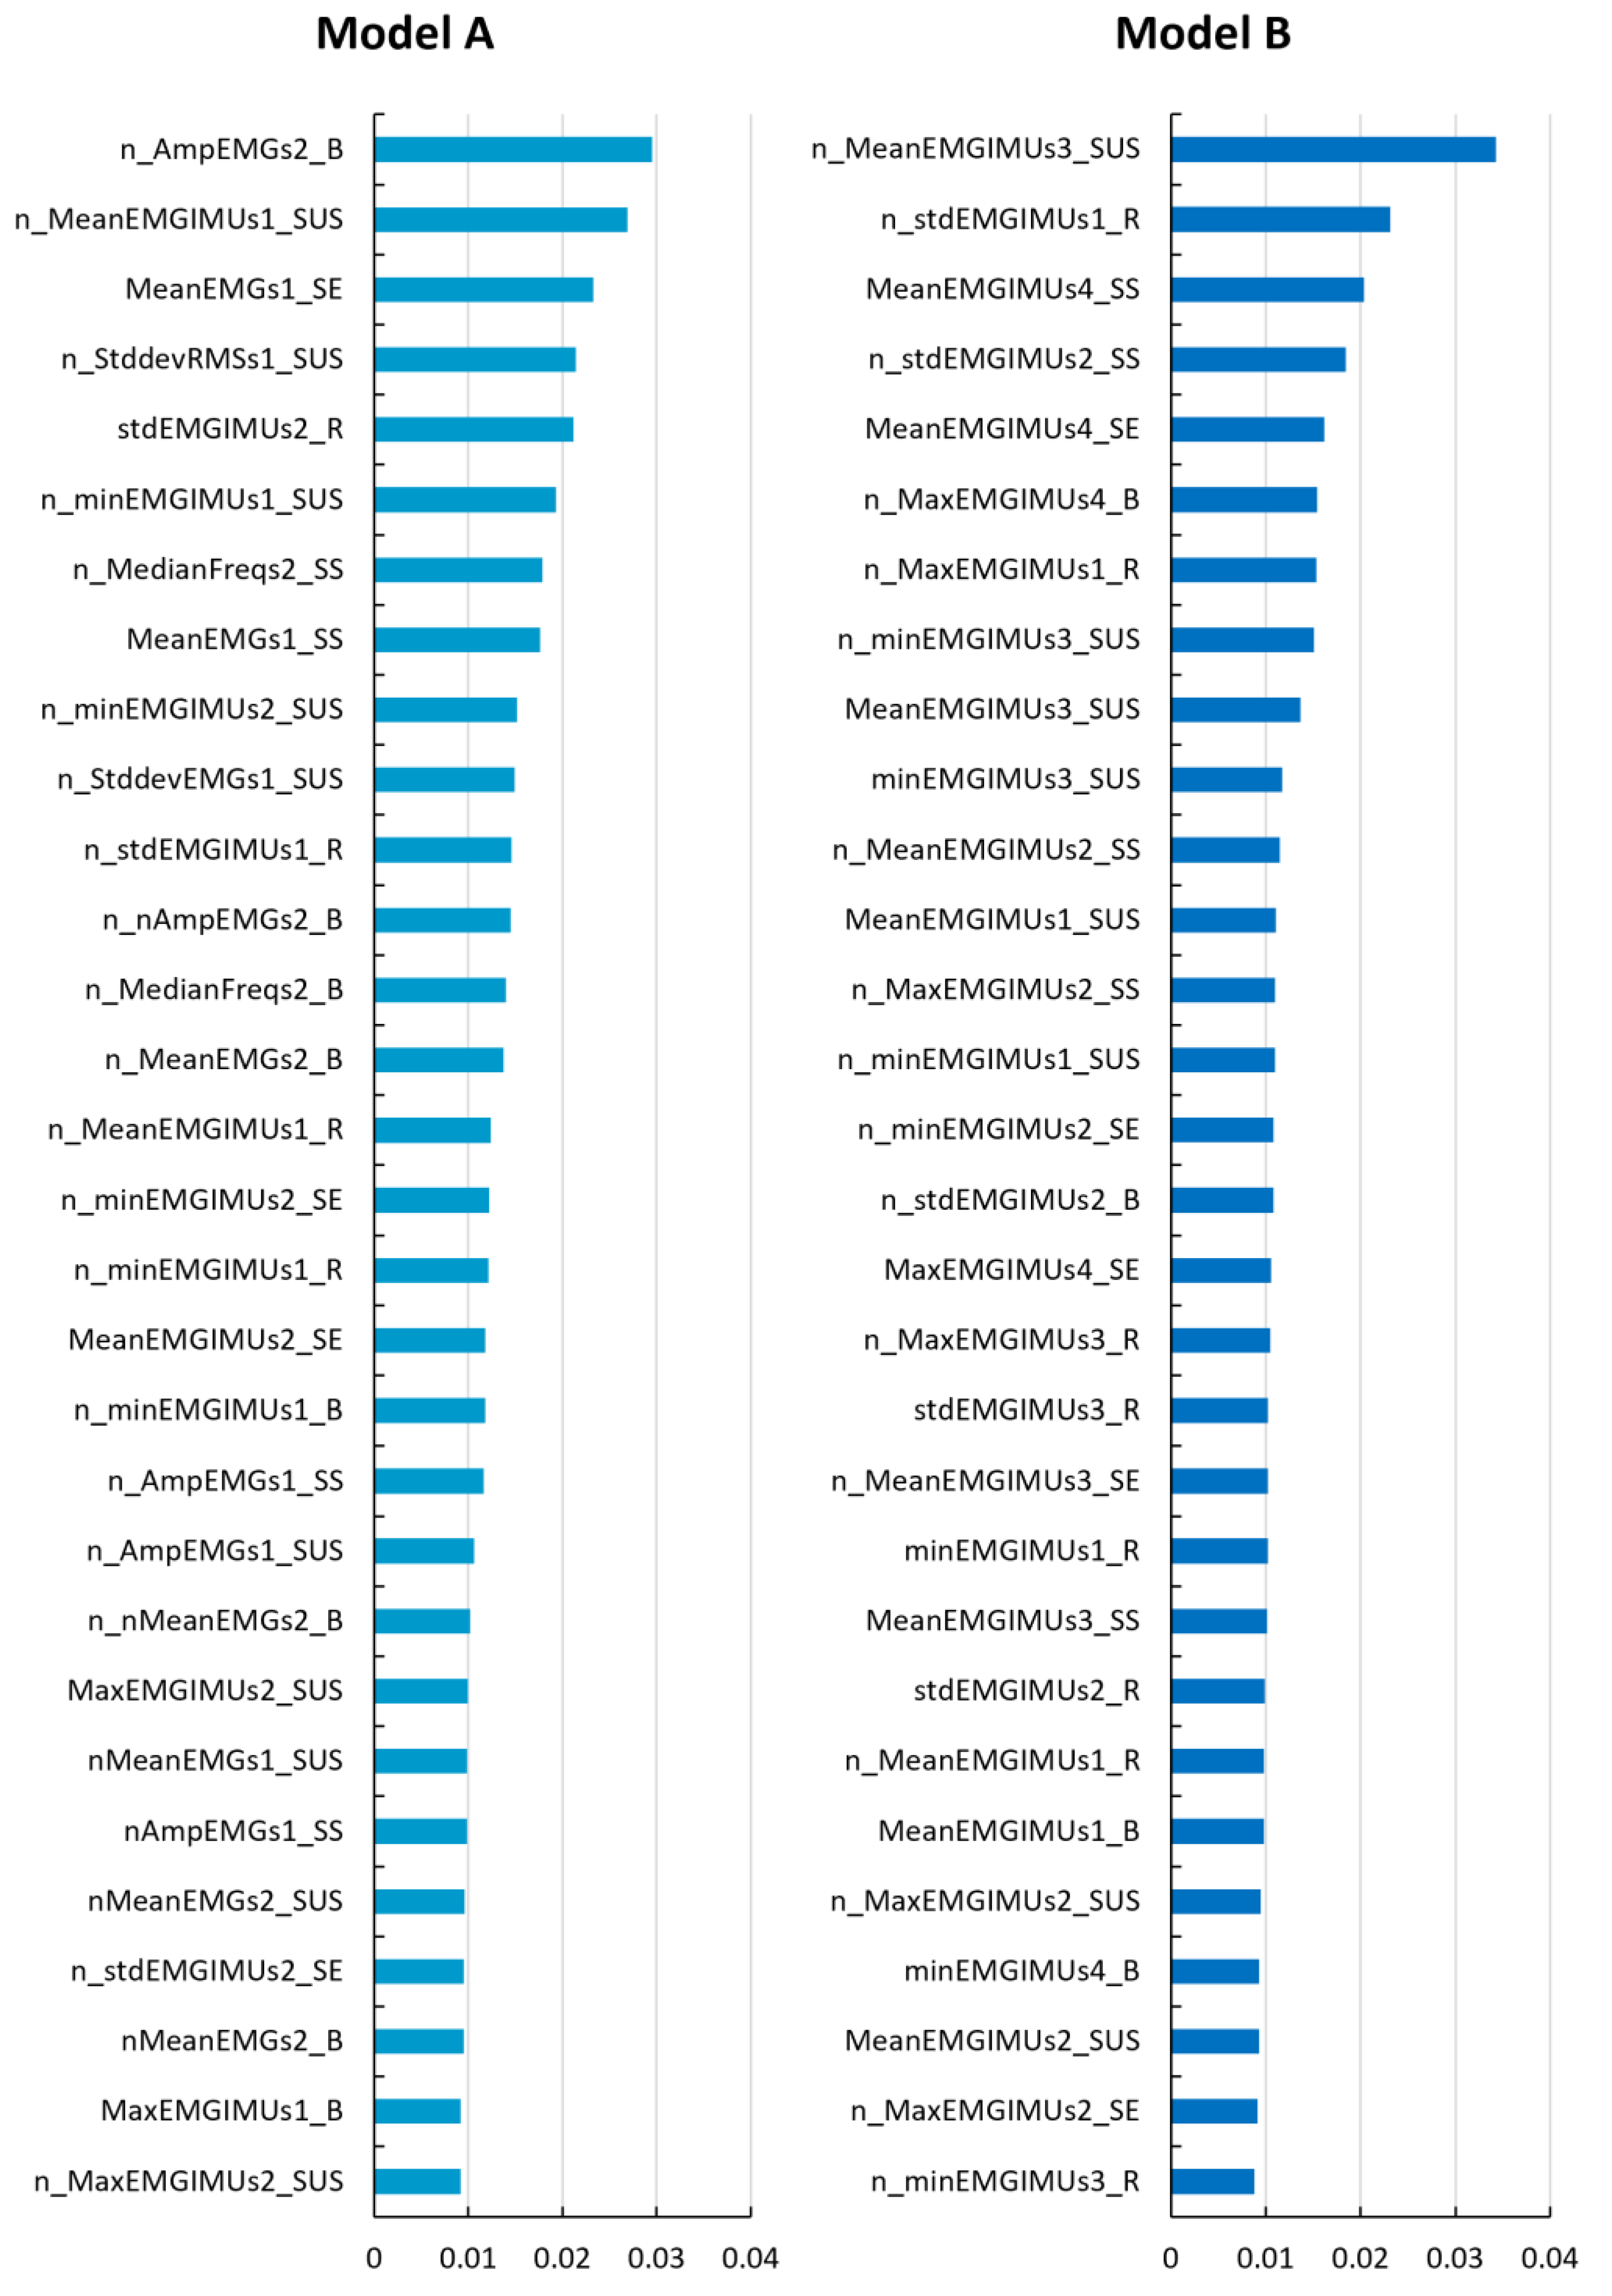
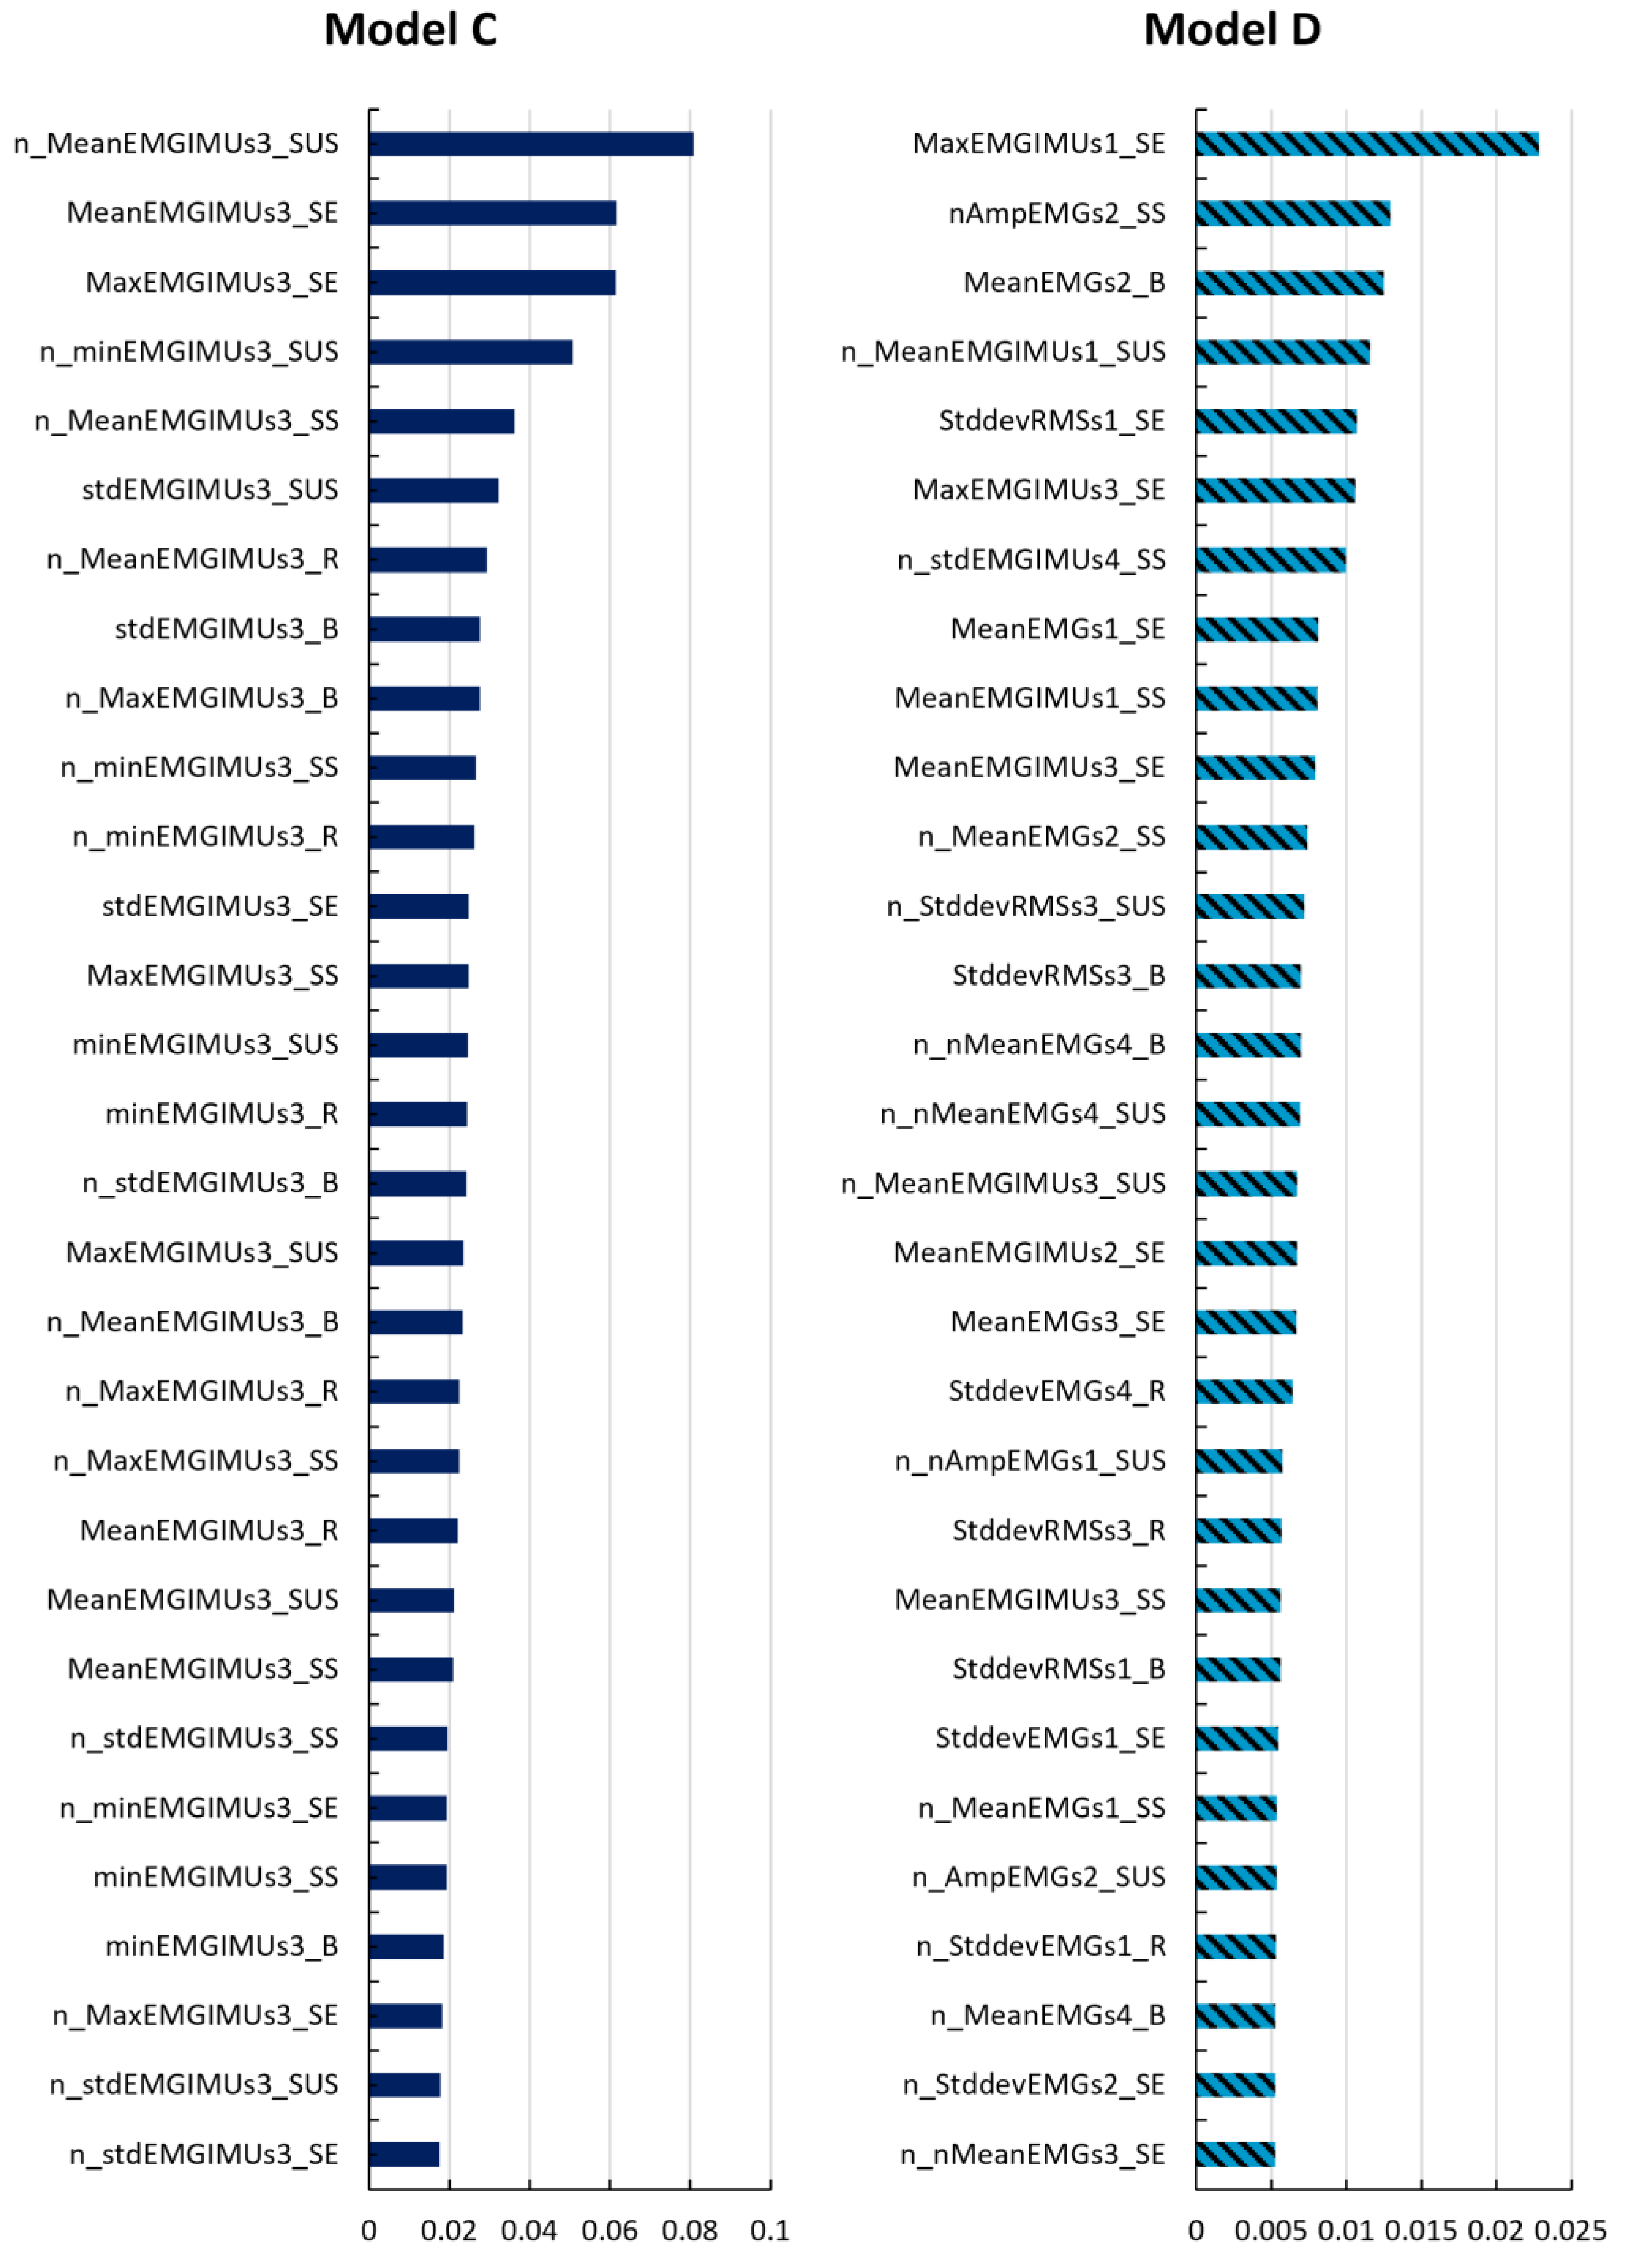
3.2. Model Selection and Feature Importances

For both the binary and tertiary grouping methods, a single model was chosen for predicting back and leg fatigue based on performance and accessibility (number of sensors), as depicted in Table 5. To explore model performance, confusion matrices (Figure 7) were plotted. Values in the left–right diagonal elements were better for binary models as compared to tertiary classification models, which were not as effective in distinguishing between low and high fatigue levels.
In both binary models, the number of samples correctly classified as medium fatigue (True Positives) were much higher than the number of samples correctly identified as low fatigue. On the other hand, considering tertiary models, the number of samples correctly identified as low and high fatigue were much higher compared to medium fatigue class. In both models B and C, 16 and 17 samples belonged to high fatigue levels but were predicted to be a low level.
For each of the selected models, we examined feature importance (Figure 8 and Figure 9) to determine the most prominent features. Looking at feature importances, a lack of clear pattern was seen in the top 30 features for all models, and features from all portions contributed to overall performance. Overall, the normalized mean value of the norm of acceleration from the sensor placed on the RES during the sustained bending portion was one of the most prominent features in all models. Models A and D used features from both EMG and kinematics measures, while models B and C relied solely on kinematics measures. For models A, B, and C, features from EMG measures that represented changes in value (‘n_’) were among the most prominent features.

4. Discussion

EXOs are engineered to assist in physically demanding tasks by providing torque assistance to alleviate muscular strain in vulnerable areas, such as the low back. However, their efficacy in real-world settings varies, necessitating objective methods to assess their advantages and limitations in complex industrial environments. The efforts in this study showcase one such method: a fatigue level prediction model. By employing a minimal number (<4) of wearable sensors (integrated EMG and IMUs), we demonstrated that a portable and accessible sensor system can offer an objective means of predicting levels of fatigue in the back and leg regions. Previous studies have explored fatigue prediction using physiological signals [11,21,22,23,25,26]. We developed a fatigue level prediction model specific to BSIEs (Back-Support Industrial Exoskeletons), incorporating realistic conditions such as intermittent task cycles with a diverse range of activities and awkward postures.

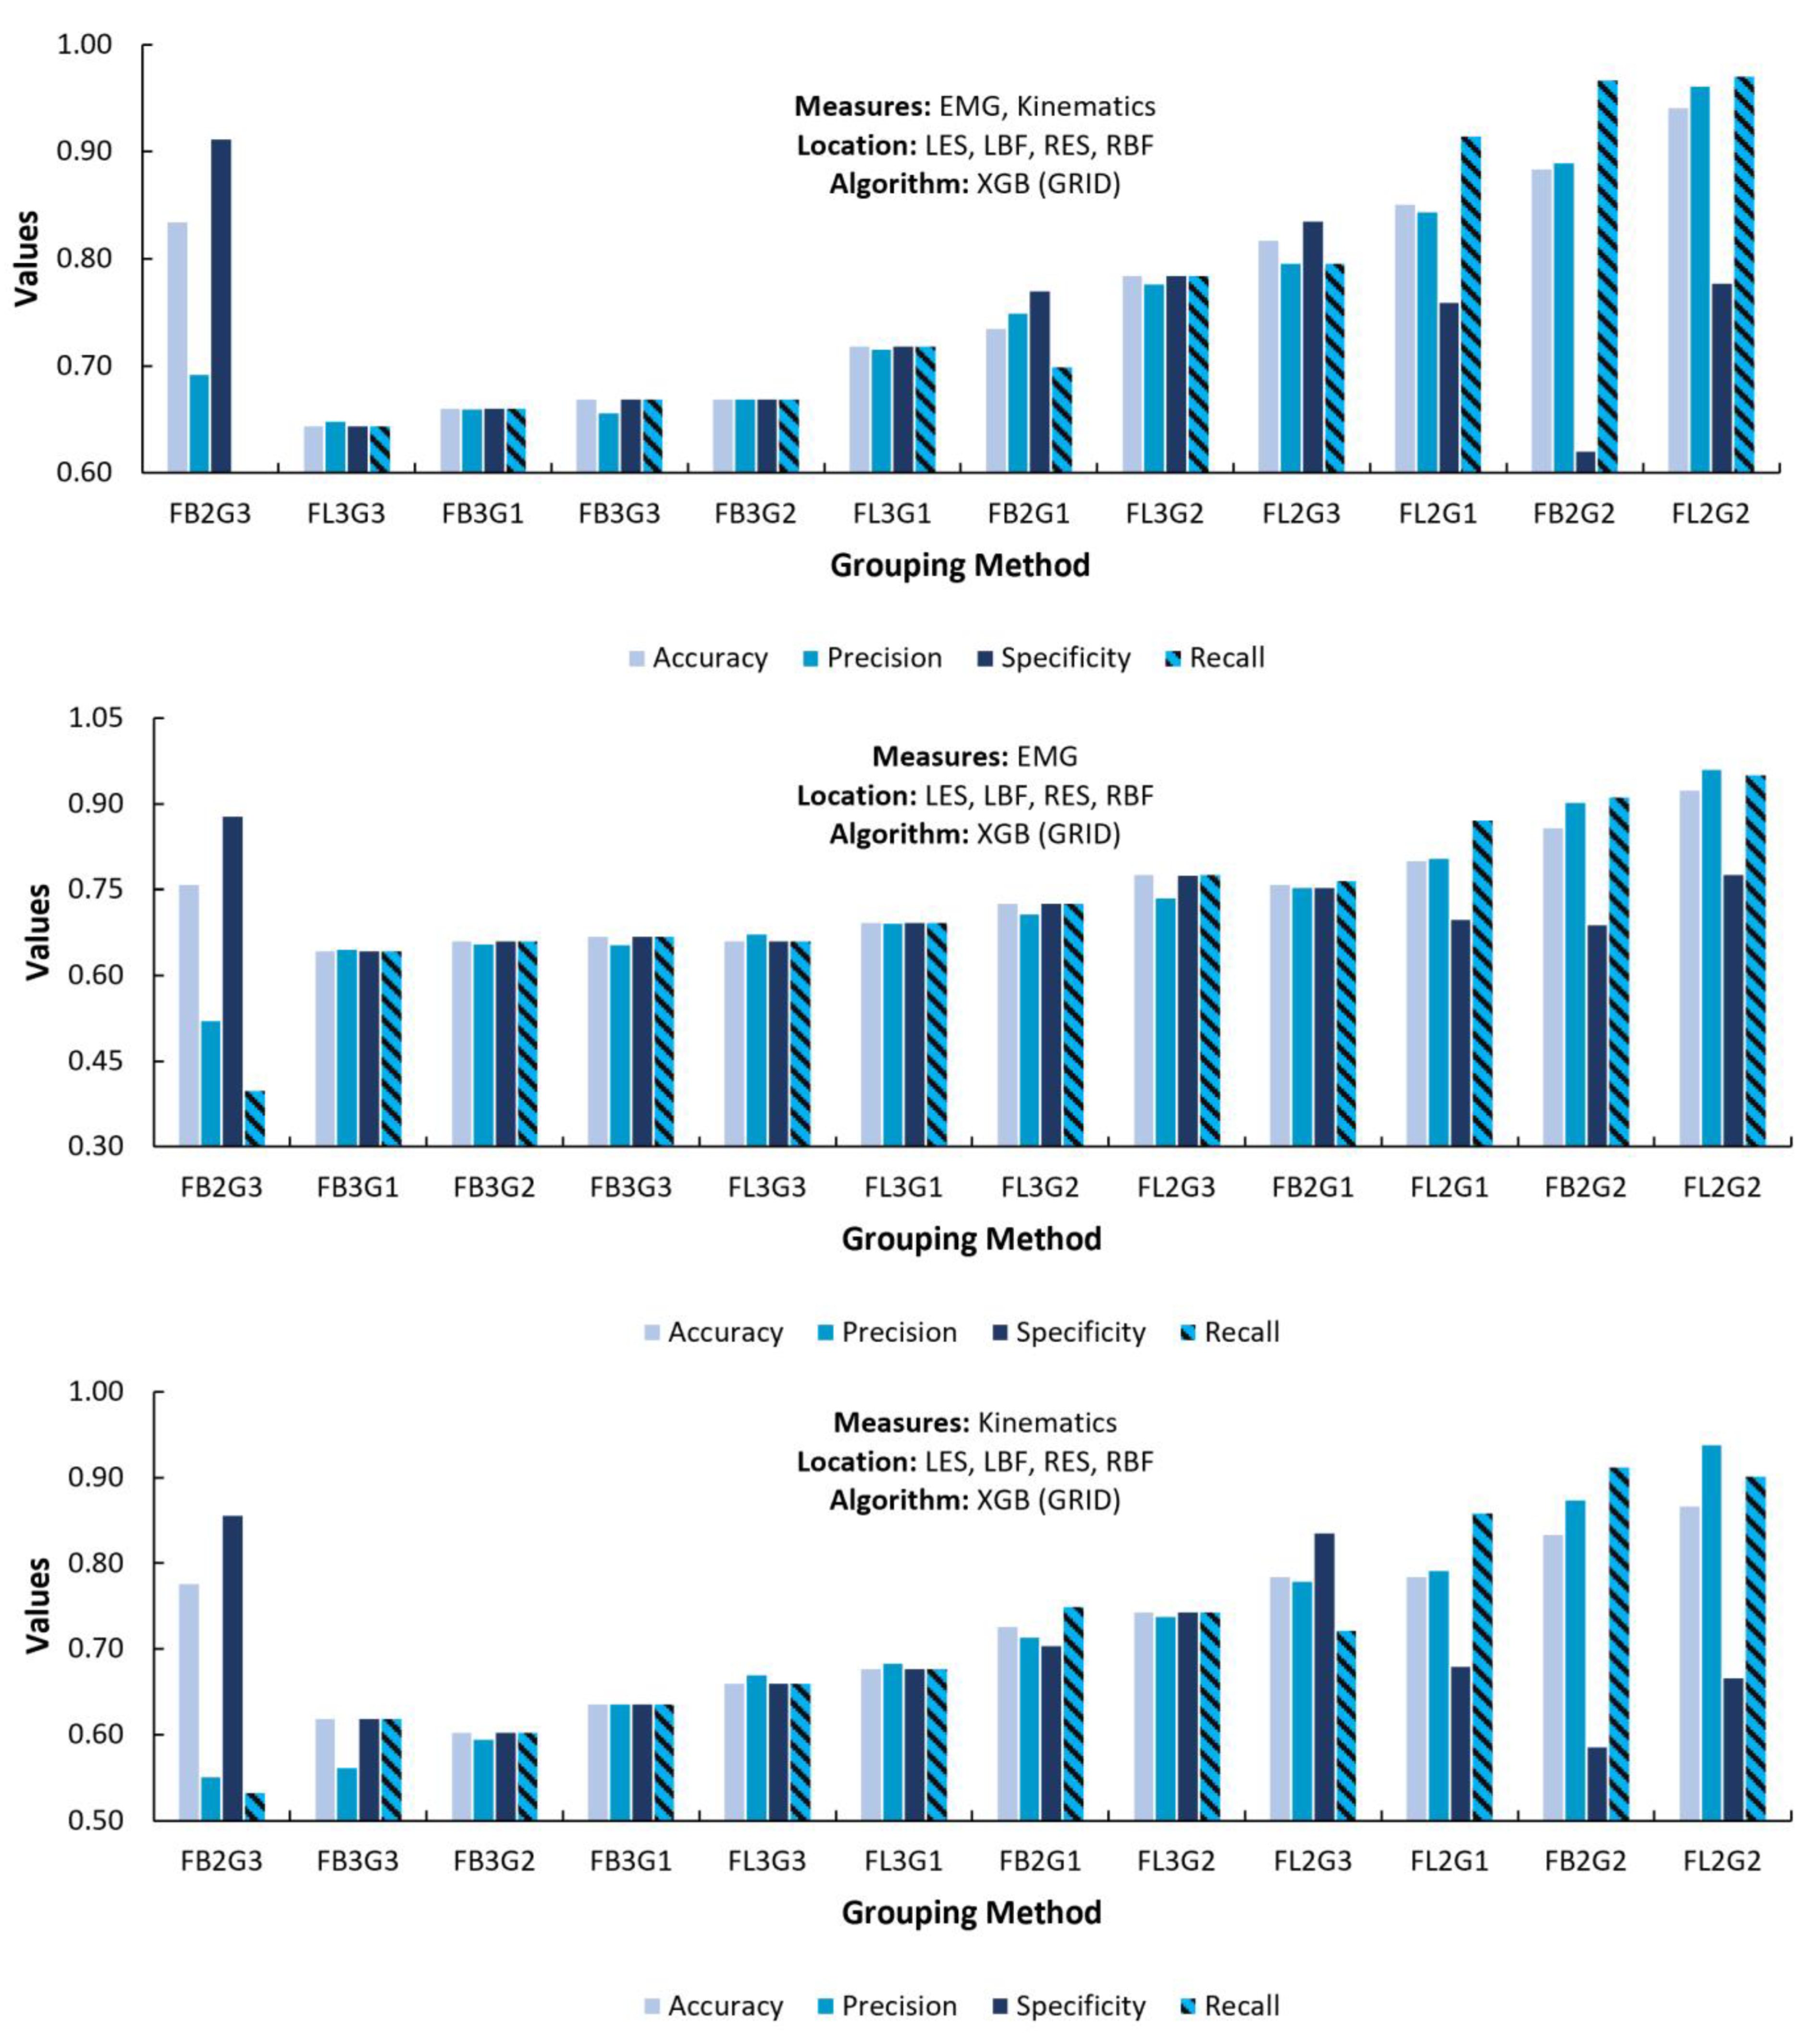
4.1. Performance Variation across Fatigue Level Grouping Methods

The literature shows variation in fatigue prediction accuracy using wearable sensors depending highly on evaluated tasks and the type of classification algorithm utilized. For instance, one study demonstrated accuracy up to ~95% using polynomial kernel-based SVM in predicting low and high fatigue during repetitive lifting, push/pull, and carrying tasks [21]. Similarly, fatigued states (no fatigue vs. fatigue) while walking were detected at an accuracy of 90% [25], while tertiary fatigue levels (low, medium, high) were detected during sit-to-stand tasks at an accuracy of 82% [11]. Thus, the prediction accuracy for binary fatigue-level classification in our study was 3% higher in the best performing model (Model A), while the same for tertiary classification was ~8% lower when compared to a similar prior work [11]. However, differences in task, equipment, and application need to be considered when directly comparing the outcomes with earlier studies. Analysis of the models in our study shows that performance decreased with tertiary vs. binary classification. Specifically, our selected models (Table 5) show ~15–20% difference in accuracy between top performance models between tertiary and binary grouping.
We observed that the selection of fatigue levels (low/medium/high) based on RPE ratings varied in the literature. For instance, one study assigned 1–3 (low), 4–6 (medium), and 7–9 (high) on a CR-10 scale [11], while another selected <6 (no fatigue), 7–11 (low), 12–16 (medium), and >17 (high) on a CR-20 scale [22]. In addition to using the default grouping of 1–3 (low) and 4–6 (medium), we also explored the effects of variation in the fatigue level grouping method on prediction outcomes. Findings indicate that grouping method 2, which included <2 (low) and 2–6 (medium), led to the highest prediction performance for both the back and leg regions (Figure 5). This indicates that differences in objectively collected data were greater between low and medium fatigue levels when they were pooled together, according to FB2G2/FL2G2 methods vs. other methods. This also means that a fatigue level of 3 corresponded more to a medium fatigue than a low fatigue level. Such differences may have occurred due to subjective bias in reported fatigue levels, possibly caused by wearing the BSIE (such as perceiving a lower fatigue level than actual).
The fatiguing tasks chosen for this study comprised intermittent trunk-flexion cycles with sustained bending and short relaxation breaks (15 s intervals), reflecting the typical pattern of real-world tasks involving static, sustained, and dynamic activities. Our analysis revealed prediction accuracies of 95%, 82%, and 74% for the binary grouping of leg fatigue and back fatigue and the tertiary grouping of leg and back fatigue, respectively, indicating the feasibility of the top-performing models in detecting fatigue levels. A detailed examination of the models revealed that both binary models were more effective in predicting medium fatigue levels (see Figure 5). These findings align with the study’s objectives, as detecting medium fatigue is critical and its presence may necessitate intervention to prevent further fatigue escalation. Conversely, tertiary models exhibited larger samples of the high fatigue class being predicted as low fatigue, which could be detrimental. Therefore, preference should be given to binary grouping models, with caution exercised when using tertiary grouping models.

4.2. Performance Variation between Measures for Selected Models

EMG and kinematics data were collected from each of the four wearable sensors positioned on the low back and leg regions. Among the four selected models, models A and D necessitate both EMG and kinematics inputs, whereas models B and C only require kinematic inputs (refer to Table 5). However, due to challenges associated with obtaining accurate EMG data in real-world settings [55], alternatives to model A that rely solely on kinematics data may be more practical, albeit with slightly lower accuracy (~88%) (Table 4). Furthermore, our model encompasses features derived from various activities, including standing still (start/end), sustaining a bent posture, bending, and retracting activities. Hence, a pivotal component of our proposed fatigue detection system involves event detection for each activity to calculate features, necessitating trunk motion data like the segmentation approach employed in this study (utilizing acceleration data from the low back sensor). We selected models with this consideration, and each of the four proposed models incorporates kinematics measures from a low back sensor. The fatigue level prediction model introduced in this study can serve as a tool to monitor changes in physical demands when employing a BSIE.
The BSIE was designed to assist the wearer during the sustained bending portion of the activity. Interestingly, the feature of normalized mean value of the norm of acceleration from the sensor placed on the RES during the sustained bending portion was among the most prominent in the models (Figure 8, Figure 9). This indicates that as perceived fatigue level changes, there is a change in body movement while sustaining the posture. Model C incorporated kinematic features from a single sensor on the RES, which shows that features denoting movement from sustained bending and standing at the end are more prominent compared to other portions representing dynamic activities of bending and retraction. One possibility is that as subjects becoming fatigued may cause more sway while performing static and sustained activities. A more detailed comparative analysis of specific features between different study conditions will be conducted in our future studies.

4.3. Performance Variation between Levels of Fatigue Grouping Methods

Outcomes of our study showed that the developed models performed better in predicting medium vs. low fatigue for binary classification, as depicted in the confusion matrices in Figure 5. For instance, the model for the FL2G2 and FB2G2 groupings correctly predicted 82 and 61 more samples at medium fatigue vs. low fatigue, respectively. One reason for this difference could be the lower proportion of datapoints at low fatigue compared to medium fatigue levels in our dataset. We expected lower low fatigue level samples, as the selected binary grouping method consisted of categorizing RPE levels <2 as low fatigue and levels of 3–6 as medium fatigue, leading to a higher number of task cycles. While our current model showed better performance for predicting medium fatigue levels, prediction for low fatigue levels can be further improved by adding a greater number of datapoints for low fatigue levels.
After implementing SMOTE, which uses existing observations to generate synthetic data, performance did not substantially improve as variation across features did not increase [61]. Nonetheless, the practical implications of our study imply higher importance in detecting medium fatigue levels, as interventions would be needed for fatigue levels exceeding RPE >7. Considering this, we selected our models based on recall performance for medium fatigue levels in binary classification. Meanwhile, considering tertiary grouping methods, both FL3G2 and FB3G2 were able to predict low fatigue better than medium and high levels. However, looking at the confusion matrices, the samples at medium fatigue were much lower than the other two levels, potentially affecting the classification of the data into three groups. Specifically, due to lower samples of medium fatigue level, the model was not able to perform classification between low vs. high fatigue level correctly, as seen from the high values in the bottom-left boxes. One practical deficiency in our experiment was that an equal number of task cycles were not performed for each fatigue level, as study participants demonstrated varying levels of capacity. To resolve this, we recommend that studies include separate data collection sessions for each fatigue grouping to ensure equal datapoints in each grouping method (such as 100: low level (RPE of 1–2) and 100: medium level (RPE of 3–6)).

5. Study Limitations and Future Directions

To develop the model, we generated a dataset through experimental studies involving both symmetric and asymmetric trunk flexion activities, as asymmetry has been known to elevate physical demands [62,63]. One limitation of our study is that we solely considered asymmetric bending towards the left side, potentially resulting in slightly different or interchangeable model predictions (left vs. right) depending on the evaluated task. Back sensors were positioned approximately 2 inches apart, and similar outcomes can be anticipated for kinematics measures. However, outcomes may vary for leg muscles, as asymmetry can significantly alter demands on either leg, particularly if features extracted solely from EMG are considered. Therefore, we advise caution when selecting a model presented in this study with a single sensor on either leg (LBF/RBF). In our controlled experiment, participants performed tasks and subjectively reported their fatigue levels while wearing sensors as well as the BSIE. There may be an effect of experimental procedures and sensor placement on the reported perceived fatigue ratings. Future steps can include recording data while performing more complex, real-world activities. Furthermore, future studies should consider a larger as well as a more diverse and inclusive pool of participants, as gender and anthropometric variations can provide a generalizable model.
Wearable sensors were positioned on the erector spinae and biceps femoris muscles, as previous studies have highlighted the beneficial effects of BSIEs in reducing activity in these muscles [64,65]. Both regions have also been observed to experience motion alterations due to the structural design of the device [43,57]. However, it is plausible that the effects of performing tasks with BSIEs can be more pronounced in other regions, such as the extremities (e.g., upper back of the trunk) when considering the kinematics measures, and future studies could evaluate the most prominent sensor locations. Furthermore, although our experiment was centered on back fatigue levels, we did not achieve an equal distribution of datapoints per level, as the rate of fatigue increase varied among individuals. Moreover, the developed model and the experiment conducted in our study involved unloaded activities. However, real-world tasks involving the lifting of items, even lighter loads, can affect body movement and muscle activity measures, which were used as inputs to our developed models. Thus, future work can incorporate more diverse industrial activities.
We utilized features from all activities within the task cycles, but future work may consider feature reduction by identifying the most prominent activities (static, sustained, dynamic). Additionally, future studies could explore alternative sensor placements, a different set of measures (e.g., whole-body stability, ground reaction forces), and simulate tasks considering asymmetry on the left and right sides. Moreover, it is worth noting that our experiment only encompassed RPE levels from 0 (no fatigue) to 7 (medium-high fatigue), as tasks performed at exertion levels exceeding 7 are unlikely in real-world scenarios. Including RPE levels up to level 10 according to the Borg Scale could have potentially enhanced the outcomes presented in this study. Lastly, owing to the controlled nature of our experiment, we recruited participants representing an average adult male. Future studies could involve incorporating a larger and more diverse pool of participants to ensure the generalizability of our fatigue level prediction model to real-world settings.

6. Conclusions

This study contributes to the advancement of evaluation methodologies for assessing EXO effectiveness in real-world settings. We developed a fatigue level prediction model tailored specifically for BSIEs employing wearable sensors. Our approach involved an experiment to generate a dataset representative of real-world conditions, encompassing intermittent task cycles, awkward postures, and a diverse array of activities involving static, dynamic, and sustained trunk flexion. The results demonstrate that the XGBoost (XGB) classification algorithm can effectively predict fatigue levels in both the back and legs of BSIE wearers utilizing wearable sensors. The selected models exhibited accuracies of up to 95% in the binary classification of leg fatigue using both EMG and IMU sensors and 82% for back fatigue prediction employing a single inertial sensor. This sensor could potentially be substituted with a smartphone or smartwatch for more accessible evaluations. However, tertiary grouping yielded comparatively lower accuracies (legs: 79%, back: 67%) and necessitated four-sensor setups. Overall, further improvements in the outcomes could be achieved by collecting real-world data, refining model parameters, incorporating additional statistical features, and employing a larger, more diverse, and inclusive sample size for dataset generation. Subsequent studies could focus on testing the performance of these models’ using data collected in industrial environments. The presented outcomes in this article can be instrumental in designing guidelines for the implementation of BSIEs in real-world scenarios, ultimately enhancing workplace safety and performance.

Author Contributions

Conceptualization, P.M.K. and E.R.; methodology, P.M.K., A.R.K. and E.R.; software, P.M.K. and A.R.K.; validation, P.M.K. and A.R.K.; formal analysis, P.M.K. and A.R.K.; investigation, P.M.K. and A.R.K.; resources, E.R.; data curation, P.M.K.; writing—original draft preparation, P.M.K.; writing—review and editing, P.M.K. and A.R.K.; visualization, P.M.K. and A.R.K.; supervision, E.R.; project administration, P.M.K. All authors have read and agreed to the published version of the manuscript.

Funding

This study did not receive any external funding.

Institutional Review Board Statement

The study was conducted in accordance with the Declaration of Helsinki and approved by the Institutional Review Board of Rochester Institute of Technology (HSRO #01113021 approved on 1 April 2022).

Informed Consent Statement

Informed consent was obtained from all subjects involved in the study.

Data Availability Statement

The raw data supporting the conclusions of this article will be made available by the corresponding authors on reasonable request.

Conflicts of Interest

The authors declare no conflicts of interest.

References

  1. Sadeghniiat-Haghighi, K.; Yazdi, Z. Fatigue Management in the Workplace. Ind. Psychiatry J. 2015, 24, 12. [Google Scholar] [CrossRef] [PubMed]
  2. Butkeviçiüte, E.; Erinš, M.; Bikulçiene, L. An Adaptable Human Fatigue Evaluation System. Procedia Comput. Sci. 2021, 192, 1274–1284. [Google Scholar] [CrossRef]
  3. Ricci, J.A.; Chee, E.; Lorandeau, A.L.; Berger, J. Fatigue in the U.S. Workforce: Prevalence and Implications for Lost Productive Work Time. J. Occup. Environ. Med. 2007, 49, 1–10. [Google Scholar] [CrossRef] [PubMed]
  4. Williams, N. The Borg Rating of Perceived Exertion (RPE) Scale. Occup. Med. 2017, 67, 404–405. [Google Scholar] [CrossRef]
  5. Garcia, G.; Arauz, P.G.; Alvarez, I.; Encalada, N.; Vega, S.; Martin, B.J. Impact of a Passive Upper-Body Exoskeleton on Muscle Activity, Heart Rate and Discomfort during a Carrying Task. PLoS ONE 2023, 18, e0287588. [Google Scholar] [CrossRef]
  6. Duan, S.; Wang, C.; Li, Y.; Zhang, L.; Yuan, Y.; Wu, X. A Quantifiable Muscle Fatigue Method Based on SEMG during Dynamic Contractions for Lower Limb Exoskeleton. In Proceedings of the 2020 IEEE International Conference on Real-time Computing and Robotics (RCAR), Asahikawa, Japan, 28–29 September 2020; pp. 20–25. [Google Scholar]
  7. Zamunér, A.R.; Moreno, M.A.; Camargo, T.M.; Graetz, J.P.; Rebelo, A.C.S.; Tamburús, N.Y.; da Silva, E. Assessment of Subjective Perceived Exertion at the Anaerobic Threshold with the Borg CR-10 Scale. J. Sports Sci. Med. 2011, 10, 130–136. [Google Scholar] [PubMed]
  8. Aryal, A.; Ghahramani, A.; Becerik-Gerber, B. Monitoring Fatigue in Construction Workers Using Physiological Measurements. Autom. Constr. 2017, 82, 154–165. [Google Scholar] [CrossRef]
  9. Chai, G.; Wang, Y.; Wu, J.; Yang, H.; Tang, Z.; Zhang, L. Study on the Recognition of Exercise Intensity and Fatigue on Runners Based on Subjective and Objective Information. Healthcare 2019, 7, 150. [Google Scholar] [CrossRef]
  10. Völker, I.; Kirchner, C.; Bock, O.L. On the Relationship between Subjective and Objective Measures of Fatigue. Ergonomics 2016, 59, 1259–1263. [Google Scholar] [CrossRef]
  11. Aguirre, A.; Pinto, M.J.; Cifuentes, C.A.; Perdomo, O.; Díaz, C.A.R.; Múnera, M. Machine Learning Approach for Fatigue Estimation in Sit-to-Stand Exercise. Sensors 2021, 21, 5006. [Google Scholar] [CrossRef]
  12. Matijevich, E.S.; Volgyesi, P.; Zelik, K.E. A Promising Wearable Solution for the Practical and Accurate Monitoring of Low Back Loading in Manual Material Handling. Sensors 2021, 21, 340. [Google Scholar] [CrossRef]
  13. Agrawal, D.K.; Usaha, W.; Pojprapai, S.; Wattanapan, P. Fall Risk Prediction Using Wireless Sensor Insoles With Machine Learning. IEEE Access 2023, 11, 23119–23126. [Google Scholar] [CrossRef]
  14. Qiu, H.; Rehman, R.Z.U.; Yu, X.; Xiong, S. Application of Wearable Inertial Sensors and A New Test Battery for Distinguishing Retrospective Fallers from Non-Fallers among Community-Dwelling Older People. Sci. Rep. 2018, 8, 16349. [Google Scholar] [CrossRef] [PubMed]
  15. Ramos, G.; Vaz, J.R.; Mendonça, G.V.; Pezarat-Correia, P.; Rodrigues, J.; Alfaras, M.; Gamboa, H.; Zou, L. Fatigue Evaluation through Machine Learning and a Global Fatigue Descriptor. J. Healthc. Eng. 2020, 2020, 6484129. [Google Scholar] [CrossRef]
  16. Serpen, G.; Khan, R.H. Real-Time Detection of Human Falls in Progress: Machine Learning Approach. Procedia Comput. Sci. 2018, 140, 238–247. [Google Scholar] [CrossRef]
  17. Jiang, Y.; Duan, J.; Deng, S.; Qi, Y.; Wang, P.; Wang, Z.; Zhang, T. Sitting Posture Recognition by Body Pressure Distribution and Airbag Regulation Strategy Based on Seat Comfort Evaluation. J. Eng. 2019, 2019, 8910–8914. [Google Scholar]
  18. Scherpereel, K.L.; Bolus, N.B.; Jeong, H.K.; Inan, O.T.; Young, A.J. Estimating Knee Joint Load Using Acoustic Emissions During Ambulation. Ann. Biomed. Eng. 2021, 49, 1000–1011. [Google Scholar] [CrossRef] [PubMed]
  19. Abdollahi, M.; Rashedi, E.; Jahangiri, S.; Kuber, P.M.; Azadeh-Fard, N.; Dombovy, M. Fall Risk Assessment in Stroke Survivors: A Machine Learning Model Using Detailed Motion Data from Common Clinical Tests and Motor-Cognitive Dual-Tasking. Sensors 2024, 24, 812. [Google Scholar] [CrossRef]
  20. Le Minh, T.; Van Tran, L.; Dao, S.V.T. A Feature Selection Approach for Fall Detection Using Various Machine Learning Classifiers. IEEE Access 2021, 9, 115895–115908. [Google Scholar] [CrossRef]
  21. Liu, G.; Dobbins, C.; D’Souza, M.; Phuong, N. A Machine Learning Approach for Detecting Fatigue during Repetitive Physical Tasks. Pers. Ubiquitous Comput. 2023, 27, 2103–2120. [Google Scholar] [CrossRef]
  22. Antwi-Afari, M.F.; Anwer, S.; Umer, W.; Mi, H.Y.; Yu, Y.; Moon, S.; Hossain, M.U. Machine Learning-Based Identification and Classification of Physical Fatigue Levels: A Novel Method Based on a Wearable Insole Device. Int. J. Ind. Ergon. 2023, 93, 103404. [Google Scholar] [CrossRef]
  23. Pinto-Bernal, M.J.; Cifuentes, C.A.; Perdomo, O.; Rincón-Roncancio, M.; Múnera, M. A Data-Driven Approach to Physical Fatigue Management Using Wearable Sensors to Classify Four Diagnostic Fatigue States. Sensors 2021, 21, 6401. [Google Scholar] [CrossRef] [PubMed]
  24. Liew, B.X.W.; Pfisterer, F.; Rügamer, D.; Zhai, X. Strategies to Optimise Machine Learning Classification Performance When Using Biomechanical Features. J. Biomech. 2024, 165, 111998. [Google Scholar] [CrossRef] [PubMed]
  25. Baghdadi, A.; Megahed, F.M.; Esfahani, E.T.; Cavuoto, L.A. A Machine Learning Approach to Detect Changes in Gait Parameters Following a Fatiguing Occupational Task. Ergonomics 2018, 61, 1116–1129. [Google Scholar] [CrossRef] [PubMed]
  26. Karthick, P.A.; Ghosh, D.M.; Ramakrishnan, S. Surface Electromyography Based Muscle Fatigue Detection Using High-Resolution Time-Frequency Methods and Machine Learning Algorithms. Comput. Methods Programs Biomed. 2018, 154, 45–56. [Google Scholar] [CrossRef] [PubMed]
  27. Onose, G.; Cârdei, V.; Craciunoiu, S.T.; Avramescu, V.; Opris, I.; Lebedev, M.A.; Constantinescu, M.V. Mechatronic Wearable Exoskeletons for Bionic Bipedal Standing and Walking: A New Synthetic Approach. Front. Neurosci. 2016, 10, 343. [Google Scholar] [CrossRef] [PubMed]
  28. De Bock, S.; Ghillebert, J.; Govaerts, R.; Tassignon, B.; Rodriguez-Guerrero, C.; Crea, S.; Veneman, J.; Geeroms, J.; Meeusen, R.; De Pauw, K. Benchmarking Occupational Exoskeletons: An Evidence Mapping Systematic Review. Appl. Ergon. 2022, 98, 103582. [Google Scholar] [CrossRef] [PubMed]
  29. de Looze, M.P.; Bosch, T.; Krause, F.; Stadler, K.S.; O’Sullivan, L.W. Exoskeletons for Industrial Application and Their Potential Effects on Physical Work Load. Ergonomics 2016, 59, 671–681. [Google Scholar] [CrossRef] [PubMed]
  30. Kuber, P.M.; Rashedi, E. Product Ergonomics in Industrial Exoskeletons: Potential Enhancements for Workforce Safety and Efficiency. TheoreTical Issues Ergon. Sci. 2020, 22, 729–752. [Google Scholar] [CrossRef]
  31. Crowell, H.P.; Park, J.-H.; Haynes, C.A.; Neugebauer, J.M.; Boynton, A.C. Design, Evaluation, and Research Challenges Relevant to Exoskeletons and Exosuits: A 26-Year Perspective From the U.S. Army Research Laboratory. IISE Trans. Occup. Ergon. Hum. Factors 2019, 7, 199–212. [Google Scholar] [CrossRef]
  32. Romanato, M.; Spolaor, F.; Beretta, C.; Fichera, F.; Bertoldo, A.; Volpe, D.; Sawacha, Z. Quantitative Assessment of Training Effects Using EksoGT® Exoskeleton in Parkinson’s Disease Patients: A Randomized Single Blind Clinical Trial. Contemp. Clin. Trials Commun. 2022, 28, 100926. [Google Scholar] [CrossRef] [PubMed]
  33. Morone, G.; Paolucci, S.; Cherubini, A.; De Angelis, D.; Venturiero, V.; Coiro, P.; Iosa, M. Robot-Assisted Gait Training for Stroke Patients: Current State of the Art and Perspectives of Robotics. Neuropsychiatr. Dis. Treat. 2017, 13, 1303–1311. [Google Scholar] [CrossRef] [PubMed]
  34. Hoffmann, N.; Prokop, G.; Weidner, R. Methodologies for Evaluating Exoskeletons with Industrial Applications. Ergonomics 2022, 65, 276–295. [Google Scholar] [CrossRef] [PubMed]
  35. Cho, Y.K.; Kim, K.; Ma, S.; Ueda, J. A Robotic Wearable Exoskeleton for Construction Worker’s Safety and Health. In Proceedings of the Construction Research Congress 2018: Safety and Disaster Management, New Orleans, LA, USA, 2–4 April 2018. [Google Scholar] [CrossRef]
  36. Bureau of Labor Statistics. 2016 Survey of Occupational Injuries & Illnesses. 2016. Available online: https://www.bls.gov/iif/nonfatal-injuries-and-illnesses-tables/soii-summary-historical/soii-charts-2016.pdf (accessed on 20 April 2024).
  37. Jia, B.; Kim, S.; Nussbaum, M.A. An EMG-Based Model to Estimate Lumbar Muscle Forces and Spinal Loads during Complex, High-Effort Tasks: Development and Application to Residential Construction Using Prefabricated Walls. Int. J. Ind. Ergon. 2011, 41, 437–446. [Google Scholar] [CrossRef]
  38. Shojaei, I.; Salt, E.G.; Hooker, Q.; Van Dillen, L.R.; Bazrgari, B. Comparison of Lumbo-Pelvic Kinematics during Trunk Forward Bending and Backward Return between Patients with Acute Low Back Pain and Asymptomatic Controls. Clin. Biomech. 2017, 41, 66–71. [Google Scholar] [CrossRef] [PubMed]
  39. Bosch, T.; van Eck, J.; Knitel, K.; de Looze, M. The Effects of a Passive Exoskeleton on Muscle Activity, Discomfort and Endurance Time in Forward Bending Work. Appl. Ergon. 2016, 54, 212–217. [Google Scholar] [CrossRef] [PubMed]
  40. Graham, R.B.; Agnew, M.J.; Stevenson, J.M. Effectiveness of an On-Body Lifting Aid at Reducing Low Back Physical Demands during an Automotive Assembly Task: Assessment of EMG Response and User Acceptability. Appl. Ergon. 2009, 40, 936–942. [Google Scholar] [CrossRef] [PubMed]
  41. Yap, H.K.; Ng, H.Y.; Yeow, C.-H. High-Force Soft Printable Pneumatics for Soft Robotic Applications. Soft Robot. 2016, 3, 144–158. [Google Scholar] [CrossRef]
  42. Ali, A.; Fontanari, V.; Schmoelz, W.; Agrawal, S.K. Systematic Review of Back-Support Exoskeletons and Soft Robotic Suits. Front. Bioeng. Biotechnol. 2021, 9, 765257. [Google Scholar] [CrossRef]
  43. Kermavnar, T.; de Vries, A.W.; de Looze, M.P.; O’Sullivan, L.W. Effects of Industrial Back-Support Exoskeletons on Body Loading and User Experience: An Updated Systematic Review. Ergonomics 2021, 64, 685–711. [Google Scholar] [CrossRef]
  44. Toxiri, S.; Näf, M.B.; Lazzaroni, M.; Fernández, J.; Sposito, M.; Poliero, T.; Monica, L.; Anastasi, S.; Caldwell, D.G.; Ortiz, J. Back-Support Exoskeletons for Occupational Use: An Overview of Technological Advances and Trends. IISE Trans. Occup. Ergon. Hum. Factors 2019, 7, 237–249. [Google Scholar] [CrossRef]
  45. Stirling, L.; Kelty-Stephen, D.; Fineman, R.; Jones, M.L.H.; Daniel Park, B.K.; Reed, M.P.; Parham, J.; Choi, H.J. Static, Dynamic, and Cognitive Fit of Exosystems for the Human Operator. Hum. Factors 2020, 62, 424–440. [Google Scholar] [CrossRef] [PubMed]
  46. Garrec, P. Design of an Anthropomorphic Upper Limb Exoskeleton Actuated by Ball-Screws and Cables. Bull. Acad. Sci. Ussr-Phys. Ser. 2010, 72, 23–34. [Google Scholar]
  47. Langlois, K.; Rodriguez-Cianca, D.; Serrien, B.; De Winter, J.; Verstraten, T.; Rodriguez-Guerrero, C.; Vanderborght, B.; Lefeber, D. Investigating the Effects of Strapping Pressure on Human-Robot Interface Dynamics Using a Soft Robotic Cuff. IEEE Trans. Med. Robot. Bionics 2021, 3, 146–155. [Google Scholar] [CrossRef]
  48. Kang, S.H.; Mirka, G.A. Effect of Trunk Flexion Angle and Time on Lumbar and Abdominal Muscle Activity While Wearing a Passive Back-Support Exosuit Device during Simple Posture-Maintenance Tasks. Ergonomics 2023, 66, 2182–2192. [Google Scholar] [CrossRef]
  49. Kazerooni, H.; Tung, W.; Pillai, M. Evaluation of Trunk-Supporting Exoskeleton. Proc. Hum. Factors Ergon. Soc. Annu. Meet. 2019, 63, 1080–1083. [Google Scholar] [CrossRef]
  50. Poliero, T.; Sposito, M.; Toxiri, S.; Di Natali, C.; Iurato, M.; Sanguineti, V.; Caldwell, D.G.; Ortiz, J. Versatile and Non-Versatile Occupational Back-Support Exoskeletons: A Comparison in Laboratory and Field Studies. Wearable Technol. 2021, 2, e12. [Google Scholar] [CrossRef]
  51. Baltrusch, S.J.; van Dieën, J.H.; Bruijn, S.M.; Koopman, A.S.; van Bennekom, C.A.M.; Houdijk, H. The Effect of a Passive Trunk Exoskeleton on Metabolic Costs during Lifting and Walking. Ergonomics 2019, 62, 903–916. [Google Scholar] [CrossRef]
  52. Schmalz, T.; Colienne, A.; Bywater, E.; Fritzsche, L.; Gärtner, C.; Bellmann, M.; Reimer, S.; Ernst, M. A Passive Back-Support Exoskeleton for Manual Materials Handling: Reduction of Low Back Loading and Metabolic Effort during Repetitive Lifting. IISE Trans. Occup. Ergon. Hum. Factors 2022, 10, 7–20. [Google Scholar] [CrossRef]
  53. Koopman, A.S.; Toxiri, S.; Power, V.; Kingma, I.; van Dieën, J.H.; Ortiz, J.; de Looze, M.P. The Effect of Control Strategies for an Active Back-Support Exoskeleton on Spine Loading and Kinematics during Lifting. J. Biomech. 2019, 91, 14–22. [Google Scholar] [CrossRef]
  54. Abdoli-E, M.; Stevenson, J.M. The Effect of On-Body Lift Assistive Device on the Lumbar 3D Dynamic Moments and EMG during Asymmetric Freestyle Lifting. Clin. Biomech. 2008, 23, 372–380. [Google Scholar] [CrossRef] [PubMed]
  55. Kuber, P.M.; Abdollahi, M.; Alemi, M.M.; Rashedi, E. A Systematic Review on Evaluation Strategies for Field Assessment of Upper-Body Industrial Exoskeletons: Current Practices and Future Trends. Ann. Biomed. Eng. 2022, 50, 1203–1231. [Google Scholar] [CrossRef] [PubMed]
  56. Kuber, P.M.; Godbole, H.; Rashedi, E. Detecting Fatigue during Exoskeleton-Assisted Trunk Flexion Tasks: A Machine Learning Approach. Appl. Sci. 2024, 14, 3563. [Google Scholar] [CrossRef]
  57. Poon, N.; van Engelhoven, L.; Kazerooni, H.; Harris, C. Evaluation of a Trunk Supporting Exoskeleton for Reducing Muscle Fatigue. Proc. Hum. Factors Ergon. Soc. Annu. Meet. 2019, 63, 980–983. [Google Scholar] [CrossRef]
  58. Rashedi, E.; Kim, S.; Nussbaum, M.A.; Agnew, M.J. Ergonomic Evaluation of a Wearable Assistive Device for Overhead Work. Ergonomics 2014, 57, 1864–1874. [Google Scholar] [CrossRef] [PubMed]
  59. Hefferle, M.; Snell, M.; Kluth, K. Influence of Two Industrial Overhead Exoskeletons on Perceived Strain—A Field Study in the Automotive Industry; Springer International Publishing: Berlin/Heidelberg, Germany, 2021; Volume 1210, ISBN 9783030517571. [Google Scholar]
  60. Chowdhury, R.H.; Reaz, M.B.I.; Bin Mohd Ali, M.A.; Bakar, A.A.A.; Chellappan, K.; Chang, T.G. Surface Electromyography Signal Processing and Classification Techniques. Sensors 2013, 13, 12431–12466. [Google Scholar] [CrossRef] [PubMed]
  61. Zheng, W.; Jin, M. The Effects of Class Imbalance and Training Data Size on Classifier Learning: An Empirical Study. SN Comput. Sci. 2020, 1, 71. [Google Scholar] [CrossRef]
  62. Madinei, S.; Alemi, M.M.; Kim, S.; Srinivasan, D.; Nussbaum, M.A. Biomechanical Evaluation of Passive Back-Support Exoskeletons in a Precision Manual Assembly Task: “Expected” Effects on Trunk Muscle Activity, Perceived Exertion, and Task Performance. Hum. Factors 2020, 62, 441–457. [Google Scholar] [CrossRef] [PubMed]
  63. Kuber, P.M.; Rashedi, E. Towards Reducing Risk of Injury in Nursing: Design and Analysis of a New Passive Exoskeleton for Torso Twist Assist. Proc. Int. Symp. Hum. Factors Ergon. Health Care 2021, 10, 217–222. [Google Scholar]
  64. Bär, M.; Luger, T.; Seibt, R.; Rieger, M.A.; Steinhilber, B. Using a Passive Back Exoskeleton During a Simulated Sorting Task: Influence on Muscle Activity, Posture, and Heart Rate. Hum. Factors 2024, 66, 40–55. [Google Scholar] [CrossRef] [PubMed]
  65. Goršič, M.; Song, Y.; Dai, B.; Novak, V.D. Short-Term Effects of the Auxivo LiftSuit during Lifting and Static Leaning. Appl. Ergon. 2022, 102, 103765. [Google Scholar] [CrossRef]
Figure 1. (a) An illustration depicting placement location of surface Electromyography sensors; (b) apparatus in the study showing an adjustable stand with wire connectors; (c) exoskeleton-assisted trunk flexion tasks in symmetric and asymmetric postures; and (d) the back support exoskeleton used during experimentation.
Applsci 14 04563 g001
Figure 2. Illustration depicting experimental tasks of repetitive and intermittent trunk flexion task cycles and activities of standing still (SS), bending (B), sustaining bent posture (SUS), retraction (R), and relaxation performed within each task. (Note: procedure shown in this illustration was repeated for asymmetric as well as symmetric postures.).
Applsci 14 04563 g002
Figure 3. A flowchart depicting model development and testing procedure involving steps of data acquisition, feature engineering, dataset generation, performance evaluation/validation, and model selection based on optimal hyperparameters. Prior to model selection, feature importances were assessed and sensor reduction was performed.
Applsci 14 04563 g003
Figure 4. Graphs depicting variation of performance with (a,c) classification algorithms of Support Vector Machine (SVM), Random Forest (RF), and XGBoost (XGB); and (b,d) model tuning techniques of Baseline, Synthetic Minority Over-sampling Technique (SMOTE), and Grid search (GRID) using the XGBoost algorithm. Higher performance was observed using XGB classification algorithm and using Grid search tuning technique.
Applsci 14 04563 g004
Figure 5. Graphs depicting variation of performance across binary and tertiary fatigue level grouping methods for XGBoost algorithm using Grid search (GRID) using data from four wearable sensors on locations of left/right erector spinae (LES/RES) and biceps femoris (LBF/RBF). Higher values were observed for binary vs. tertiary fatigue level grouping methods.
Applsci 14 04563 g005
Figure 6. Sensitivity analysis showing impact of variation in model parameters of max depth, learning rate, and subsample rate on the overall model accuracy. Accuracy improved with lower values of max depth and with higher values of learning rate and subsample rate. (Note: model used for this example consisted of two sensors placed on left erector spinae (LES) and left biceps femoris (LBF) muscle groups with classification performed using XGBoost (XGB) classification algorithm based with Grid search (GRID) on kinematics measures.).
Applsci 14 04563 g006
Figure 7. Confusion matrices for (a,c) binary and (b,d) tertiary fatigue level grouping methods for the four selected models using XGBoost with Grid search (GRID) classification algorithm (Model A: FL2G2— EMG, Kinematics—LES, LBF; Model B: FL3G2—Kinematics—LES, LBF, RES, RBF; Model C: FL2G2—Kinematics—RES; Model D: FB3G2—EMG, Kinematics—LES, LBF, RES, RBF).
Applsci 14 04563 g007
Figure 8. Feature importances for binary and tertiary fatigue level grouping methods for the four selected models using XGBoost (GRID) classification algorithm (Model A: FL2G2—EMG, Kinematics—LES, LBF; Model B: FL3G2—Kinematics—LES, LBF, RES, RBF). (Note: format for features is in the form ‘feature name’, ’sensor’, and ’_portion’. Sensor represents location as s1: LES, s2: LBF, s3: RES, s4: RBF. Portion represents activity as B: bending, SS: standing at start, SUS: sustained bending, R: retraction, and SE: standing at end. In features, ‘n_’ stands for normalization or change in the value of the parameter over time.).
Applsci 14 04563 g008
Figure 9. Feature importances for binary and tertiary fatigue level grouping methods for the four selected models using XGBoost (GRID) classification algorithm (Model C: FL2G2—Kinematics—RES; Model D: FB3G2—EMG, Kinematics—LES, LBF, RES, RBF). (Note: format for features is in the form ‘feature name’, ’sensor’, and ’_portion’. Sensor represents location as s1: LES, s2: LBF, s3: RES, s4: RBF. Portion represents activity as B: bending, SS: standing at start, SUS: sustained bending, R: retraction, and SE: standing at end. In features, ‘n_’ stands for normalization or change in the value of the parameter over time.).
Applsci 14 04563 g009
Table 1. Outcomes of feature engineering showing the type of measure extracted from the wearable sensors located on left/right erector spinae and on left/right biceps femoris muscles; the total number of features extracted from the data and a list of all the features included in the generated dataset for building machine learning models. (Note: activities within each task cycle included B: bending, SS: standing at start, SUS: sustained bending, R: retraction, and SE: standing at end.).
Type of Measure from SensorNumber of FeaturesList of Features
Low Back and Leg Movement (Inertial Sensors)160Mean (MeanEMGIMU), maximum (maxEMGIMU), minimum (minEMGIMU), standard deviation (stdEMGIMU), and variance (varEMGIMU) of the norm of acceleration, change in mean (n_meanEMGIMU), maximum (n_maxEMGIMU), minimum (n_minEMGIMU), standard deviation (n_stdEMGIMU), and variance (n_varEMGIMU) of the norm of acceleration.
(for each activity within task cycle from all four sensors)
Muscle Activity
(Electromyography)
280Peak amplitude (AmpEMG), mean amplitude (MeanEMG), median frequency (MedianFrequency), standard deviation (stddevRMS), change in peak amplitude (n_AmpEMG), change in mean amplitude (n_AmpEMG), change in median frequency (n_MedianFrequency), change in standard deviation (n_stddevRMS).
(for each activity within task cycle from all four sensors)
Table 2. List of factors with their levels that were varied during performance evaluation for model selection.
FactorLevelDescription
Sensorss1Sensor on Left Erector Spinae (LES)
s2Sensor on Left Biceps Spinae (LBF)
s3Sensor on Right Erector Spinae (RES)
s4Sensor on Right Biceps Femoris (RBF)
MeasuresMuscle ActivitySurface Electromyography
KinematicsAcceleration
Muscle Activity and KinematicsCombination of Surface Electromyography and Acceleration
Fatigue RegionFBFatigue in Back
FLFatigue in Legs
Grouping Method
(X = B/L)
Binary (FX)FX2G1IF(Fatigue Level ≤ 3,”L”,”M”)
FX2G2IF(Fatigue Level ≤ 2,”L”,”M”)
FX2G3IF(Fatigue Level ≤ 4,”L”,”M”)
Tertiary (FX)FX3G1IF(Fatigue Level ≤ 2,”L”,(IF(Fatigue Level ≤4,”M”,”H”)))
FX3G2IF(Fatigue Level≤1,”L”,(IF(Fatigue Level ≤ 3,”M”,”H”)))
FX3G3IF(Fatigue Level ≤ 3,”L”,(IF(Fatigue Level ≤ 5,”M”,”H”)))
Classification AlgorithmsSVMSupport Vector Machine
RFRandom Forest
XGBXGBoost
Model-Tuning TechniquesBaseline-
SMOTESynthetic Minority Over-sampling Technique (SMOTE)
GRIDFinding best hyperparameters with cross validation using grid search along with SMOTE
Table 3. Models selected based on performance and accessibility for binary grouping of leg fatigue levels in low and medium levels along with the values of accuracy (A), precision (P), specificity (S), sensitivity/recall (R), F1 score (F1), and G-index (GI) with classification algorithm (C), categorized according to the type of measures, number of sensors, their location, fatigue region, and grouping method. (Note: All models selected were tested using Grid search.).
Fatigue RegionGrouping MethodMeasureSensorsLocationCAPSRF1GI
Leg
(Binary)
FL2G2EMG, Kinematics2LES, LBFXGB0.950.970.830.970.970.04
FL2G2EMG, Kinematics4LES, LBF, RES, RBFXGB0.940.960.780.970.970.05
FL2G2EMG4LES, LBF, RES, RBFRF0.930.950.720.960.960.06
FL2G2EMG, Kinematics2LBF, RBFRF0.930.950.720.960.960.06
FL2G2EMG, Kinematics1RESRF0.930.960.780.950.960.06
FL2G2Kinematics1LBFRF0.880.940.670.910.930.11
Leg
(Tertiary)
FL3G2EMG, Kinematics4LES, LBF, RES, RBFXGB0.790.780.790.790.780.31
FL3G2EMG4LES, LBF, RES, RBFRF0.770.760.770.770.760.33
FL3G2Kinematics4LES, LBF, RES, RBFXGB0.740.740.740.740.740.37
FL3G2EMG, Kinematics4LES, LBF, RES, RBFRF0.740.730.740.740.730.37
FL3G1EMG, Kinematics4LES, LBF, RES, RBFRF0.740.730.740.740.730.38
FL3G1EMG4LES, LBF, RES, RBFRF0.720.720.720.720.710.40
Back
(Binary)
FB2G2EMG, Kinematics4LES, LBF, RES, RBFXGB0.880.890.620.970.930.11
FB2G2EMG4LES, LBF, RES, RBFXGB0.860.900.690.910.910.13
FB2G2Kinematics4LES, LBF, RES, RBFRF0.860.890.620.930.910.13
FB2G2EMG, Kinematics1RESXGB0.850.890.660.910.900.14
FB2G2Kinematics1RESXGB0.820.890.660.870.880.17
FB2G2Kinematics1LESXGB0.820.890.660.870.880.17
Back
(Tertiary)
FB3G2EMG, Kinematics4LES, LBF, RES, RBFXGB0.670.670.670.670.670.47
FB3G3EMG, Kinematics4LES, LBF, RES, RBFXGB0.670.660.670.670.650.48
FB3G3EMG4LES, LBF, RES, RBFXGB0.670.650.670.670.660.48
Table 4. Variation in the values of accuracy (A), precision (P), specificity (S), sensitivity/recall (R), F1 score (F1), and G-index (GI) with number of sensors for XGB model using Grid search with both EMG and Kinematics measures, categorized according to grouping method of FL2G2.
SensorsLocationAPSRF1GI
2LES, RES0.950.970.830.970.970.04
4LES, LBF, RES, RBF0.940.960.780.970.970.05
1RBF0.920.970.830.930.950.07
2LBF, RES0.920.970.830.930.950.07
2LBF, RBF0.910.960.780.930.950.08
1RES0.910.970.830.920.950.08
2LES, RBF0.900.970.830.910.940.09
1LBF0.880.940.670.920.930.10
1LES0.850.920.560.900.910.13
Table 5. Selected models for each grouping method for back and leg (A), precision (P), specificity (S), sensitivity/recall (R), F1 score (F1), and G-index (GI). (Note: All models utilized XGB classification algorithm with Grid search (GRID) tuning technique.).
ModelGrouping MethodMeasureSensorsLocationAPSRF1GI
AFL2G2EMG, Kinematics2LES, LBF0.950.970.830.970.970.04
BFL3G2Kinematics4LES, LBF, RES, RBF0.740.740.740.740.740.37
CFB2G2Kinematics1RES0.820.890.660.870.880.17
DFB3G2EMG, Kinematics4LES, LBF, RES, RBF0.670.670.670.670.670.47
Disclaimer/Publisher’s Note: The statements, opinions and data contained in all publications are solely those of the individual author(s) and contributor(s) and not of MDPI and/or the editor(s). MDPI and/or the editor(s) disclaim responsibility for any injury to people or property resulting from any ideas, methods, instructions or products referred to in the content.

