Abstract
Deep learning offers significant advancements in the accuracy of prostate identification and classification, underscoring its potential for clinical integration. However, the opacity of deep learning models presents interpretability challenges, critical for their acceptance and utility in medical diagnosis and detection. While explanation methods have been proposed to demystify these models, enhancing their clinical viability, the efficacy and acceptance of these methods in medical tasks are not well documented. This pilot study investigates the effectiveness of deep learning explanation methods in clinical settings and identifies the attributes that radiologists consider crucial for explainability, aiming to direct future enhancements. This study reveals that while explanation methods can improve clinical task performance by up to 20%, their perceived usefulness varies, with some methods being rated poorly. Radiologists prefer explanation methods that are robust against noise, precise, and consistent. These preferences underscore the need for refining explanation methods to align with clinical expectations, emphasizing clarity, accuracy, and reliability. The findings highlight the importance of developing explanation methods that not only improve performance but also are tailored to meet the stringent requirements of clinical practice, thereby facilitating deeper trust and a broader acceptance of deep learning in medical diagnostics.
1. Introduction
Recent studies have shown that deep learning algorithms have become increasingly ubiquitous in our modern society, and they have demonstrated their efficacy in an array of domains, ranging from image segmentation to robotics and speech translation, among others. These algorithms are known for their exceptional performance for cancer detection, achieving remarkable results in terms of accuracy that surpass those of traditional machine learning methods [1,2,3]. However, despite their success, deep learning algorithms are often opaque and difficult to interpret. The complexity and depth of these models make it challenging to decipher their inner workings, leaving users unsure of how decisions are made or how data are processed.
This lack of transparency hinders the trust in the algorithms, which can limit their adoption in areas where these characteristics are essential. In fields where the consequences of a flawed decision or an inaccurate prediction can be severe, users must have confidence in the algorithm’s accuracy and consistency. In such domains, like healthcare, finance, or criminal justice, the lack of interpretability of deep learning models can be a significant obstacle to their acceptance and deployment.
Furthermore, the black-box nature of deep learning algorithms can also raise ethical and legal concerns. For instance, if an algorithm makes a biased decision, it can lead to discrimination against certain groups or individuals, perpetuating systemic inequality. Therefore, the lack of transparency of deep learning models can create significant challenges for their adoption and limit their potential benefits, emphasizing the need for greater interpretability and explainability in these models.
The healthcare industry requires trust and transparency, making it challenging to adopt deep learning algorithms that are often opaque. Legislation such as GDPR requires these algorithms to provide explanations [4]. Ethical concerns arise when the deep learning model’s classification differs from that of a clinician. Explanation methods can aid by providing visualizations and potential performance benefits by flagging specific components of the input for further inspection. Incorporating explanation methods can enable clinicians to make informed decisions by gaining greater insights into the model’s decision-making process.
Explanation methods have been postulated to potentially alleviate these concerns around trust and transparency [5,6]. An explanation method in the context of images refers to techniques or approaches used to make the content, features, and meaning of an image understandable. These methods can include visual annotations, descriptive narratives, highlighting key elements, or using visual aids such as arrows and labels to elucidate the components and significance of the image. For instance, in medical imaging, an explanation method might involve marking areas of interest and providing text-based interpretations to help viewers comprehend what the image represents and its implications. To this end, there has been increased research interest in creating methods that provide explanations for block-box algorithms [7,8,9] as well as creating deep learning methods that are inherently explainable [10,11]. However, it is still uncertain which methods are most effective in a clinical setting, and which characteristics of explanation methods are important to clinicians. This has led to a growing interest in this area of research.
Explanation methods have been found to be insufficient for clinical tasks, and clinicians have identified other important characteristics of these methods. In addition to providing explanations, clinicians have emphasized the need for feature importance measures, demonstrating where the model falls short, and quantifying uncertainty [12]. Quantifying uncertainty is particularly vital in healthcare due to the high-stakes nature of clinical decision making. Clinicians need to be aware of which parts of the explanation are less certain, as this can help reduce diagnostic errors and improve the overall diagnosis process. To address these concerns, researchers have started to evaluate explanation methods that incorporate uncertainty quantification. These methods provide a more comprehensive and nuanced understanding of how deep learning models make decisions, accounting for the inherent uncertainty involved in these models.
Although much research has focused on developing explanation methods for deep learning models, there is limited research regarding their clinical effectiveness. To address this issue, this paper aims to investigate the clinical effectiveness of deep learning explanation methods, specifically focusing on prostate lesion classification in MRI images. This study evaluated the effectiveness of post hoc explanation methods and uncertainty-based explanation method quantification in this context. By doing so, this study aimed to fill the gap in research related to the clinical impact of explanation methods and provide insights into their effectiveness in the context of medical imaging. While this study focused on MRI algorithms, particularly in the context of prostate examinations using multiparametric MRI imaging, the results could also be valuable in other non-MRI clinical modalities or MRI-based examinations. The underlying principles of explanation methods, which highlight key areas of interest in medical images, are broadly applicable. For instance, these methods could be adapted to enhance the interpretability of CT scans, ultrasound images, or X-rays by marking relevant regions. Additionally, the use of these explanation methods in other MRI-based examinations, such as brain or cardiac MRI, could similarly assist clinicians in identifying and diagnosing abnormalities, thus extending the benefits observed in prostate imaging to a wider range of medical fields.
The primary objective of this study was to identify which explanation methods are beneficial for radiological performance and which ones are not. Additionally, this study aimed to evaluate the effectiveness of uncertainty-based explanations and determine what characteristics radiologists consider explainable. To achieve these goals, this study employed an exploratory pilot design and involved a group of radiologists. Specifically, this study sought to (1) assess whether post hoc and uncertainty-based explanation methods improve lesion detection accuracy, (2) determine whether post hoc and uncertainty-based explanations align with radiologists’ explanations, and (3) gain insights into what features radiologists consider explainable.
2. Related Work
Several studies have investigated explanation methods for clinical tasks and translating machine learning to clinical practice. For instance, one study conducted a similar investigation on explanation methods [13], while another explored the characteristics of explanation methods that increase clinician trust [12]. Additionally, researchers have evaluated the interpretability of additive models and found that doctors were able to accurately interpret them [14]. Another study developed a sepsis risk model for an emergency room setting [15], and a pilot study focused on mortality prediction using electronic medical records [16]. Furthermore, a study assessed the relationship between task demands and workload during physician–computer interaction in a simulated environment [17], while another proposed a visualization system for electronic health records and evaluated its accuracy and confidence in treatment decisions using a clinical cohort [18].
Furthermore, other studies have investigated explanation methods in a general population. For instance, one study evaluated explanation methods for text classifications using a human study and found that LIME (Local Interpretable Model-Agnostic Explanations), which generates locally faithful explanations for individual predictions, LRP (Layer-wise Relevance Propagation), which decomposes predictions to highlight relevant features, and DeepLIFT (Deep Learning Important FeaTures), which attributes the importance of each input feature by comparing activation to a reference, performed the best overall [7,8,19,20]. It is also important to note that the study found that using these methods to describe model behavior was difficult and none of the methods achieved impressive results. Meanwhile, another study investigated explanation methods for multiple data modalities using a Mechanical Turk-powered human study and found that prototype methods like ExMatchina were the preferred explanation [21,22].
3. Research Design
A study was planned to investigate whether explanation methods can improve radiologists’ decision making for lesion treatments in radiology. The research question was divided into two parts, each consisting of two questions. The first part aimed to determine if post hoc explanation methods and uncertainty-based explanation methods can enhance radiologists’ ability to detect prostate lesions. The second part aimed to identify the preferred explanation method among radiologists and the reasons behind their choice. This study involved a group of radiologists who examined a dataset of prostate images with and without explanation methods. We did not include the deep learning prediction with the explanation methods to prevent bias. The explanations were generated using a modeling approach, and the radiologists’ lesion detection performance was compared with and without these explanations. Additionally, this study conducted a survey to gather feedback from radiologists on their preferred explanation method and the rationale behind their selection.
3.1. Radiology Cohort
Ten radiologists were selected for this study, all of whom were certified radiologists. Table 1 shows that the radiologists had an average of 12.1 years of clinical radiology experience, with a standard deviation of 4.43, ranging from 6 to 20 years. None of the radiologists had prior experience with machine learning or deep learning explanation methods. To address this issue, a learning period was provided to each radiologist before the study began. During the learning period, each radiologist was presented with the MRI input image, corresponding explanation technique, and a ground truth label and segmentation. After the learning period, a standardized interview was conducted with each radiologist, providing an overview of the experiment and each method used in the study. Each radiologist participated in the evaluation within two weeks in a controlled online environment.

Table 1.
Statistics on the radiologist cohort used in this study.
3.2. Study Design and Procedure
In this study, we devised a task to detect lesions in MRI images and administered a questionnaire about the explanation methods used during the task. Each radiologist was presented with a random MRI image and an accompanying explanation method. To ensure fairness, we balanced this study so that each radiologist saw four samples for each explanation method. We also included a control case where the radiologist was shown an MRI image without any explanation method. Our hypothesis was that the incorporation of an explanation method would lead to improved diagnostic accuracy in comparison to the absence of an explanation method.
Each of the ten radiologists who participated in the study was provided with twenty unique samples that were randomly selected from the PROSTATEx testing split. For each sample, a corresponding explanation method was also provided. To ensure that the evaluation was fair, each radiologist was presented with four samples for each explanation technique, and the order of presentation was randomized within each subject. Additionally, five unique MRI images were presented to each radiologist without any corresponding explanation method to serve as a baseline for comparison. For all 25 samples, the radiologists were asked to determine whether a lesion was present after each MRI and explanation technique was shown to them. After completing this task, the radiologists were given a questionnaire that requested them to rate each explanation method on a 5-point Likert scale and provide feedback on the aspects they preferred and did not prefer for each explanation method. For the five MRI samples without any corresponding explanation method, the radiologists were only asked to indicate if there was a lesion present or not.
The researchers did not obtain approval from an Institutional Review Board (IRB) for this study because the data used in the research were publicly available and de-identified; therefore, IRB approval was not required. The IRB states that the analysis of such data does not meet the criteria for human subjects research, as outlined in the Code of Federal Regulations, and therefore, this analysis was not subject to IRB review.
3.3. Questionnaire Development
As part of this study, a questionnaire was developed to gather feedback on the effectiveness of each explanation method used in the experiment. The objective was to collect qualitative data and gain insight into the features that make an explanation method more effective according to the radiologist cohort. As no validated survey for explanation methods existed in the literature, we developed our own questionnaire. To ensure its validity and comprehensibility, a team consisting of a machine learning researcher, a clinical radiologist with an MD, and a radiology researcher with both a PhD and an MD developed the questionnaire. We used a previously published study on questionnaire design for inspiration [23]. After the questionnaire was created, it was reviewed and approved by two radiologists to confirm its clarity and effectiveness. We ensured that the questionnaire was easy for the radiologist cohort to understand. Following multiple rounds of feedback and revisions, the questionnaire was ultimately approved by each member of our multidisciplinary team.
Our team evaluated the effectiveness of the explanation methods using a 5-point Likert scale. During the experiment, a 5-point Likert scale ranging from 1 to 5 was employed to rate each method, where 1 indicated “strongly disagree” and 5 indicated “strongly agree”. Subsequently, each radiologist was asked to elucidate their rationale for their rating in a text field. This was to determine if perceived effectiveness is related to actual effectiveness. For each MRI image and its interpretation visualization, radiologists were asked the following questions: Is there a lesion present (Yes/No)? How helpful is this interpretation method at showing why the model made its decision on a scale from 1 to 5? They were also asked to provide reasoning for their rating. For interpretation and uncertainty visualization, the additional questions included the following: Does the visualization help understand the model’s classification? Does it inspire confidence in the classification? Does it justify the classification? Radiologists were also asked to list strengths and weaknesses of the visualizations and suggest improvements. Finally, additional comments were requested, including lesion presence in further images and optional feedback.
3.4. Data Preprocessing and Learning Model
The PROSTATEx dataset [24] was utilized in this paper, which comprises 330 lesions from 204 subjects. The dataset includes T2 transverse, sagittal, and coronal MRI images, as well as ADC, BVAL, and KTRANS. In this section, the T2 images were preprocessed by cropping them to 120 × 120 pixels around the prostate centroid and then normalizing them. The dataset also provides lesion centroid coordinates and a label indicating whether the lesion is clinically significant. Recently, ground truth masks for the lesion and prostate zones [25] have been made available, and these were used during the learning phase (as illustrated in Figure 1) before the experiment to identify whether there is a lesion. The dataset was split into training and testing sets in a 70/30 ratio, with the training set used to train the model and the testing set used to assess performance and provide images for the paper cohort during the experiment. During the learning phase, MRI images with and without lesions were shown to the radiologists with randomized explanation methods. The classification was not provided to prevent biased results.
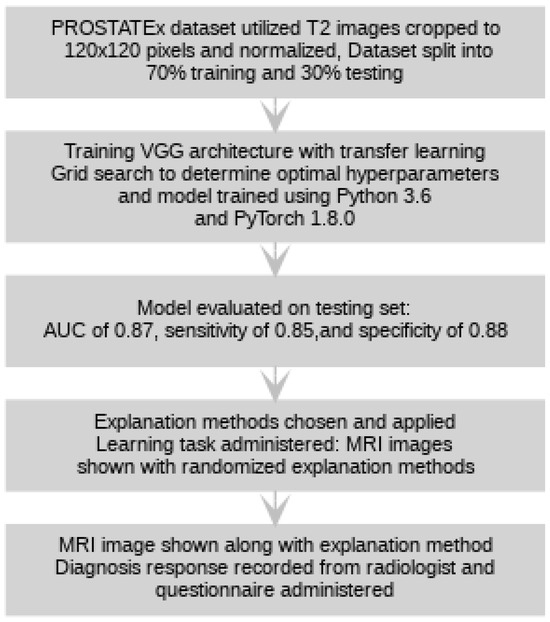
Figure 1.
A high-level representation of the protocol for this study is shown above.
To map T2-weighted MRI images to a binary variable that indicates the presence or absence of a lesion in the image, a Convolutional Neural Network (CNN) was trained. The model was based on the VGG architecture [26], and transfer learning with ImageNet weights was employed. Grid search, a hyperparameter selection method that tests various combinations of hyperparameters and selects the best parameters based on the model’s performance, was employed to determine the optimal parameters for the model. The training set discussed previously was utilized to train the model using Python 3.6 and PyTorch 1.8.0, and the resulting model was evaluated on the testing set, achieving an AUC of 0.87, sensitivity of 0.85, and specificity of 0.88, which are results quite similar to results in the literature [27,28,29].
3.5. Explanation Methods
Various explanation methodologies were chosen for this study, selected based on their prevalence in the literature and to assess the differences between types of post hoc explanation methods and visualization styles. The aim of this section was not to provide an exhaustive description of each method but rather to offer a brief overview. For more information on each method, the corresponding works were cited.
To start, let be a vector representing the input image, where w, h, and c are the width, height, and number of channels of the image. Each classification model maps the input vector to a class vector, , where k is the number of classes. An explanation for the input image is defined as , which maps the input image to a discrimative map of the same size as the input image. The discriminative map estimates the areas of an image that contribute the most to the classification result. In other words, it shows which parts of the image were most important in the decision made by the model.
3.5.1. Integrated Gradients
Integrated Gradients [30] aims to resolve an issue with vanilla gradients, which is gradient saturation. This method can be expressed as , where represents a baseline input representing the absence of a feature in the input x. This method calculates the integral of gradients between the input x and the baseline and multiplies it by the difference between the input and baseline. The purpose of this is to provide a more informative interpretation of the model’s predictions by highlighting the contributions of each feature to the output for individual samples.
3.5.2. SmoothGrad
SmoothGrad [31] is a method that attempts to reduce the amount of noise in the saliency maps by averaging over multiple copies of noisy input. This method can be defined as follows:
where is an i.i.d noise vector randomly sampled from a normal distribution, , and N is the number of noisy samples. This method adds noise to the input images and calculates the gradients with respect to each noisy input image. By averaging the gradients across multiple copies of the input with added noise, this method aims to reduce the impact of noisy pixels on the saliency map and provide a smoother and more reliable interpretation of the model’s predictions.
3.5.3. SHAP
SHAP [32] is an explanation method based on Shapley values, which utilizes game theory. SHAP can be defined as follows:
where represents the feature attribution of feature j, and M is the total number of features. The SHAP values represent the contribution of each feature to the difference between the model’s output for a given input and the expected output, averaged over all possible permutations of features. This method considers each possible combination of features and assigns a weight to each feature based on its contribution to the final prediction. This results in an explanation that is both locally accurate and globally consistent, allowing for a better understanding of the model’s decision-making process.
3.5.4. Grad-CAM
Grad-CAM [33] is an explanation method that computes the gradient of the model with respect to the feature map of the last convolutional layer of the model, denoted as f. This can be expressed as follows:
where represents the importance of feature map k for class c, and A is a feature map. Then, the explanation is generated as follows:
where ReLU is the Rectified Linear Unit function. This method produces a heatmap that highlights the most relevant regions of the input image for the model’s classification decision.
3.5.5. DeepLIFT
DeepLIFT [20] is an explanation method that attributes each input x to a value that represents a value being set to a reference value as opposed to its original value. This method utilizes a summation-to-delta property, which is expressed as follows:
where , and represents the difference between the model output of the input and the reference value. This property ensures that the sum of the DeepLIFT values of all inputs is equal to the difference between the output of the model for a given input and the output for the reference input. By comparing the DeepLIFT values of each input to the reference input, this method provides an interpretation of the model’s decision-making process for a given input.
Figure 2 shows an input image and corresponding explanation method for each explanation method used in this study. From left to right, the explanation methods included were Grad-CAM, SHAP, DeepLIFT, Integrated Gradients, and SmoothGrad. These methods commonly localize a lesion if one is present in the sample.
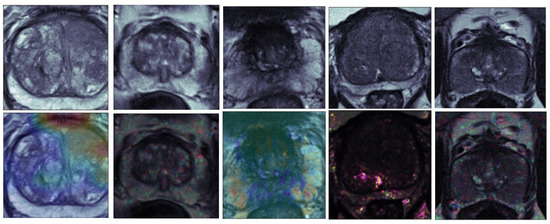
Figure 2.
An overview of the explanation methods without uncertainty estimations used in this study. From left to right, the explanation methods included were Grad-CAM, SHAP, DeepLIFT, Integrated Gradients, and SmoothGrad. The top row shows the original input image, and the bottom row shows the explanation methods’ results.
As mentioned, uncertainty-based explanation methods were also used in this study. Table 2 provides a brief summary of each method, and Figure 3 shows an example of each uncertainty-based explanation method. The top row of the figure shows input images, the middle row shows the explanation results, and the bottom row visualizes the uncertainty. For BLRP, the parameters of the middle and bottom row were and . These methods were utilized to evaluate their effectiveness in improving radiologists’ decision making for lesion treatments.
Table 2.
An overview of the methods evaluated in this work.
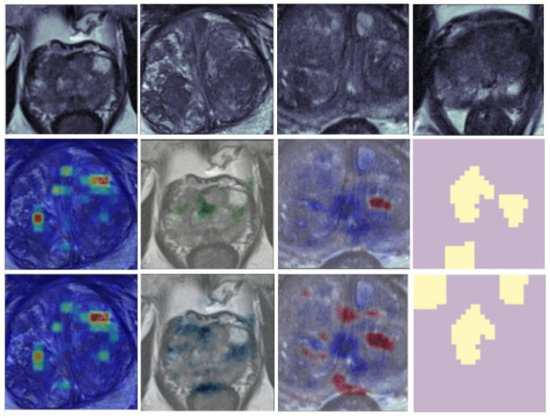
Figure 3.
An overview of the uncertainty-based explanation methods used in this study. From left to right, the methods are CXPlain, DistDeepSHAP, BLRP, and BayLIME. The first row shows the input image, the second row shows the explanation, and the third row shows the uncertainty estimate.
3.5.6. CXPlain
CXPlain [34] is an explanation method that frames the problem of providing deep learning explanations as a causal learning task. To achieve this, the authors trained causal explanation models to estimate the degree to which certain inputs cause outputs. CXPlain also enables uncertainty quantification with its feature importance via bootstrap ensembling. The authors empirically demonstrated that the uncertainty estimates are strongly correlated with their ability to accurately estimate feature importance on unseen data. This method provides an explanation for the model’s output by estimating the causal effect of each input feature on the output, allowing for a better understanding of the decision-making process of the model.
3.5.7. DistDeepSHAP
Distribution DeepSHAP (DistDeepSHAP) [35] provides uncertainty estimations for the SHAP explanation framework. DistDeepSHAP samples the references from a distribution and calculates Shapely values for these references. To estimate the uncertainty of SHAP explanations, the authors computed a confidence interval for each assigned Shapely value using the training dataset as a reference distribution. This method allows for the quantification of the uncertainty in the attribution scores provided by the SHAP framework, which can help to better understand the reliability of the model’s decision-making process.
3.5.8. BLRP
BLRP, or the Bayesian interpretation of Layer-wise Relevance Propagation [36], is a method that offers visual explanations for various levels of certainty. In this research, radiologists were shown alpha values of 5, 25, 50, 75, and 95. A lower value, such as 5, indicates the most dependable relevant pixels, while a higher alpha value, like 95, signifies less reliable relevant pixels. Radiologists were provided with an explanation of the meaning behind these alpha values during an initial learning phase in this study.
3.5.9. BayLIME
BayLIME [37] is a Bayesian adaptation of the well-known LIME (Local Interpretable Model-agnostic Explanations) framework. Instead of employing linear models as local surrogate models, as seen in the original LIME approach, BayLIME utilizes Bayesian regressors. The authors demonstrated that incorporating a Bayesian component enhances the consistency and fidelity of the explanations generated. Additionally, the Bayesian aspect of BayLIME allows for the visualization of uncertainty through the fluctuation of repeated explanations.
4. Results
4.1. Post Hoc Explanation Methods
The findings of this paper are split into two sections. The initial section assesses if post hoc explanations enhance radiologists’ ability to detect prostate lesions and investigates the preferred explanation technique and the reasons behind this preference. The latter section examines methods for quantifying uncertainty, a critical factor in high-risk clinical tasks, to minimize diagnostic errors and enhance the diagnostic process after evaluating explanation techniques in a similar manner. This study is among the first to explore quantification in explanation methodologies for clinical tasks. Explanation methods manifest on the image by color marking key areas. In our case, in an MRI prostate lesion image, the explanation method highlights regions of interest with a heatmap, assisting radiologists in identifying lesions.
Python was employed for this analysis, utilizing libraries such as SciPy and StatsModels to perform the necessary statistical calculations and derive the results presented. The F1 score, which measures a test’s accuracy by balancing precision (true positives divided by positive predictions) and recall (true positives divided by actual positives), is particularly useful for understanding the performance on imbalanced datasets:
Sensitivity measures the proportion of actual positives that are correctly identified by the test. It is defined as follows:
Accuracy measures the proportion of correctly identified instances among the total number of instances. It is defined as follows:
Additionally, a confidence interval CI provides a range that likely contains the true value of a population parameter with a specified confidence level (e.g., 95%), helping to understand the reliability and precision of the estimate:
A total of 250 responses were collected from ten radiologists, and the findings of both evaluations are reported. This part presents radiologists’ lesion detection performance and compares their results with and without the use of an associated explanation technique. Additionally, the performances were divided to examine potential differences among various explanation methods, aiming to establish their effectiveness and explore their specific advantages. The outcomes of these comparisons can be found in Table 3.
Table 3.
F1 score, sensitivity, and accuracy of each method.
Table 3 demonstrates the varying impact of individual explanation methods on diagnostic performance performed by the radiologist in tandem with the explanation method, with some methods enhancing the performance, while others impeded it. DeepLIFT and SHAP, for instance, contribute to improved diagnoses, while SmoothGrad hampers them. Integrated Gradients and Grad-CAM also seem to influence diagnostic outcomes. This suggests that the effect of each explanation method on diagnostic performance is method-dependent. One potential explanation could be that certain techniques introduce non-meaningful noise into the diagnostic process, which might distract the radiologist and reduce performance. On the other hand, methods that boost diagnostic outcomes may offer valuable insights that either confirm or encourage further investigation by the radiologist.
We also requested that radiologists evaluate the utility of each method using a Likert scale ranging from one to five, where one signifies ‘not useful’ and five denotes ‘extremely useful’. These data were employed to investigate any correlation between radiologists’ perceived usefulness and the actual effectiveness of these methods. Furthermore, we sought to identify the preferred method among radiologists and the reasons behind their preference. The questionnaire asked radiologists to assess the usefulness of each method in terms of its ability to demonstrate the rationale behind the model’s decision making. Table 4 showcases the outcomes of this evaluation.
Table 4.
Perceived usefulness reported by the cohort of radiologists.
What traits enhance explainability for radiologists?
This study incorporated a qualitative analysis of radiologists’ feedback to better comprehend the factors that enhance the model’s explainability. The goal is to offer insights into the characteristics of effective explanation methods, which can inform future development efforts. To analyze the textual responses, we employed thematic analysis and identified three recurring themes: Insight, Visualization Style, and Accuracy [38]. These themes were refined through discussion and chosen as the primary evaluation factors.
The first theme, Insight, emerged from radiologists’ comments on the value of explanation methods providing sufficient insights. Radiologists shared instances where, after reviewing the explanation method, they detected a lesion that they initially missed in the MRI image. This was especially helpful for small or challenging-to-detect lesions. Additionally, radiologists found it beneficial if the explanation method highlighted specific image areas for further analysis, and they gained confidence in their diagnosis when the method identified the same lesion they detected.
Visualization Style was the second theme identified, where radiologists found noisy methods distracting despite potentially offering useful insights. They relied on color information to determine the significance of various image areas, aiding their reasoning process. Moreover, radiologists favored overlay visualizations over non-overlay ones, a preference consistent across the group.
The third and final theme, Accuracy, emphasized the importance of explanation methods accurately localizing lesions. Radiologists expressed that accurate localization provided the most confidence in classifications. Highlighting the zone where a lesion was situated proved almost as useful as pinpointing the actual lesion. Accuracy was deemed essential, as inaccurate localization or highlighting could mislead radiologists and result in incorrect diagnoses.
While other explanation methods may be valuable for visualizing class-discriminative regions, DeepLIFT could offer more detailed and precise feature attributions that consider individual input features’ contributions. Radiologists’ feedback suggested that this makes DeepLIFT more suitable for identifying subtle differences in prostate lesion images. In other words, DeepLIFT can help radiologists better understand how individual features in the image contribute to the model’s decision-making process, which is crucial for detecting subtle differences in prostate lesion images.
4.2. Uncertainty-Based Explanation Methods
Explanation methods assist in identifying specific features or input values crucial for the model’s predictions, potentially emphasizing image regions particularly relevant for detecting or diagnosing a lesion. This helps radiologists comprehend the model’s decision-making process and recognize the most informative aspects of the image for lesion detection.
In contrast, uncertainty-based explanation methods such as BayLIME and BLRP provide a measure of the model’s confidence or uncertainty in its predictions. When the model exhibits high confidence in its predictions, the uncertainty-based explanation method may highlight the most important image regions for those predictions. Conversely, in cases of lower confidence, the uncertainty-based explanation method may display a more dispersed attribution map emphasizing multiple image regions.
In this portion of the results, lesion detection performance using the explanation methods was compared to two types of baselines. The first baseline involved two explanation methods that did not include uncertainty quantification to determine any potential benefits of incorporating uncertainty. The second baseline featured the MRI image without any explanation to examine whether the presence of explanation methods enhances lesion recognition.
Our results demonstrated that the improvement in sensitivity was not significant when using the explanation techniques compared to not using them. However, radiologists were more likely to misidentify lesions without the explanation techniques. By employing explanation techniques, radiologists more effectively detected true positive and true negative cases without negatively impacting the other. Moreover, radiologists reported that the uncertainty component was useful in situations where the explanation method emphasized multiple areas, as it assisted them in differentiating between relevant and irrelevant features in the image.
As per the findings in Table 4, BayLIME received the highest score of 3.8 for radiologists’ perceived usefulness, whereas BLRP scored 3.71. Radiologists emphasized the significance of clarity for understanding and regarded explanation methods with noise as less comprehensible.
4.2.1. How Do Explanations Contribute to Understanding, Confidence, and Justification?
We assessed the radiologists’ comprehension and trust in the explanation techniques provided alongside the MRI images. Each radiologist was shown a specific MRI image with its corresponding explanation method and asked to rate their perceived usefulness for the model’s given classification. Radiologists were asked to provide their rating on a scale of 1 to 5, with 5 representing high understanding, confidence, and justification, and 1 representing low understanding, confidence, and justification.
For understanding, they were asked to rate This visualization helped me understand why the model’s classification was made. For confidence, they rated This visualization makes me feel confident in the model’s classification. For justification, they assessed This visualization adequately justifies the classification. The results are presented in Table 5. Table 3 highlights the top-performing methods in terms of reported scores. BayLIME stood out with the highest score of 4.0 for understanding. In the confidence category, both BayLIME and BLRP were leading, each scoring 3.71. For justification, BayLIME, again, was the top scorer with 3.71. The radiologists emphasized that the clarity of the explanation significantly influenced their ratings for understanding, marking down methods that produced noisy explanations.
Table 5.
Results for perceived understanding, confidence, and justification.
In assessing confidence, radiologists noted that for confidence, it was vital for the explanation method to accurately identify and emphasize the lesion when present. If the method only partially highlighted the lesion, it received lower confidence ratings than the method that accurately highlighted the entire lesion. In other words, radiologists rated explanation methods higher for confidence when they could accurately segment the lesion. This suggests that the ability of an explanation method to precisely localize and emphasize lesions plays a crucial role in radiologists’ confidence in the model’s classification.
While justification ratings were closely aligned with those for confidence, the key distinction was the radiologists’ emphasis on the overall detection of the lesion by the explanation method, rather than its precise segmentation. In other words, even if the explanation method highlighted only half of the lesion, it was still deemed as justified as highlighting the entire lesion. Radiologists stressed the significance of examining the explanation method to verify the presence of a lesion. These findings imply that the perceived quality of the explanation is related to the lesion detection performance, and BayLIME delivered the highest lesion detection accuracy and perceived quality in terms of understanding, justification, and confidence.
4.2.2. What Traits Enhance Explainability for Radiologists?
We delve into the radiologists’ qualitative feedback to gain insights into which attributes enhance explainability. This understanding enriches our comprehension of explanation methods and could inform future development in this area. The textual feedback from the questionnaire was subjected to thematic analysis, as outlined in [38]. The research team categorized the radiologists’ responses into codified items, which were subsequently organized under shared themes. These themes laid the foundation for three key dimensions. Ultimately, the team identified four pivotal characteristics: (1) precision, (2) clarity, (3) presentation, and (4) consistency as illustrated in Figure 4.
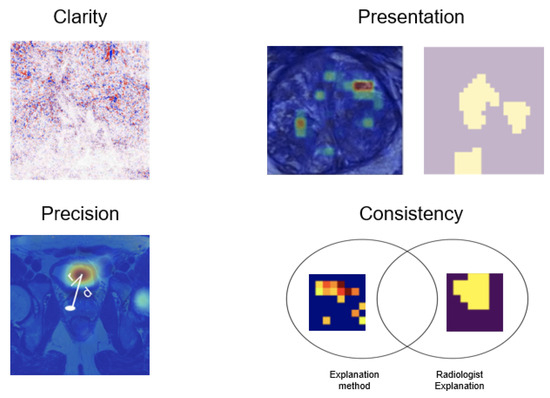
Figure 4.
Characteristics that improve explainability for radiologists.
Understanding
Understanding aimed to evaluate the usefulness of explanation methods in helping radiologists comprehend why a specific classification was made. Clarity of the explanation was crucial, and it was observed that a noisy heatmap could impede understanding. However, some noise was acceptable if it carried meaning, as it could assist the radiologist in identifying lesions that they might have initially missed. The presentation of the heatmap also played a significant role, with a gradient presentation like that of CXPlain preferred over a non-gradient presentation such as that of BayLIME. Radiologists used the colors of the gradient to determine which areas were more important.
Regarding clarity, radiologists mentioned the importance of clear methods; otherwise, they could be distracting. For presentation, it is essential to display either a heatmap or binary map. Precision refers to how accurately the heatmap localizes the lesion. Finally, consistency relates to the radiologists’ preference for a method that explains in a manner consistent with their own approach. This analysis provides valuable insights into the key factors that contribute to the effectiveness of explanation methods for medical imaging, which can inform the design of future techniques.
Precision was important, with radiologists stating that if a lesion was highlighted in the explanation, they could immediately understand why the classification was made. Consistency between the radiologist’s own explanations and those generated by the explanation method was also essential for understanding. This highlights the need for explanation methods to be clear, meaningful, precise, and consistent with radiologists’ own thought processes to effectively aid their understanding of classification decisions.
Confidence
We also aimed to assess the degree of confidence that the explanation methods instilled in the radiologists concerning the classification. Precision was crucial in this regard, with radiologists noting that observing the deep learning model classify the MRI as containing a lesion and having the explanation method highlight the same lesion gave them the most confidence. They found it reassuring to see the explanation method emphasize the same lesion they had identified themselves.
Consistency was also important; if the explanation method highlighted the zone where the lesion was located, it was almost as beneficial as highlighting the lesion itself. The radiologists desired to use the explanation method to verify the classification with confidence. These insights underscore the importance of precise and consistent explanation methods to bolster radiologists’ confidence in the deep learning model’s classifications.
Justification
Justification aimed to evaluate how well the explanation methods supported the classification. Radiologists noted that the presentation of the explanation was important for justification. They regarded the justification as stronger if the red part of the heatmap highlighted the lesion. If the lesion was highlighted by the heatmap but not the red part, they considered it less justified.
Precision was also crucial for justification, and radiologists found it most justified if the lesion was highlighted by the heatmap. However, it was noted that the explanation methods often highlighted Prostatitis instead of the lesion, which was considered poor justification. The radiologists preferred the justification to be presented similarly to how they justify their own diagnoses, for example, by highlighting the prostate zone along with the lesion. This emphasizes the need for accurate, precise, and consistent explanation methods that align with radiologists’ own justification processes to effectively support classification decisions.
5. Conclusions and Limitations
This paper aimed to investigate the effectiveness of explanation methods in improving the lesion detection performance in radiology and gain insights into what radiologists deem important for effective explanation methods. A pilot cohort of ten radiologists was presented with MRI images and corresponding explanation techniques, as well as MRI images without explanations for baseline comparison.
The results show that the effectiveness of explanation methods can vary depending on the specific technique used. The highest-rated method in terms of perceived usefulness was DeepLIFT, while the lowest-rated method was SHAP. Interestingly, DeepLIFT also resulted in the largest marginal increase in accuracy, while the lowest was SmoothGrad. The radiologists noted that insight, visualization style, and accuracy were important components of effective explanation methods.
Furthermore, we found that uncertainty-based explanation methods can increase the lesion detection performance by up to a 20% increase in the F1 score. We found that BayLIME had the highest justification score among the explanation methods, with radiologists noting that it effectively highlighted the lesion’s location. However, the BayLIME visualization style was the least preferred, with CXPlain being the preferred visualization style among the radiologists. CXPlain also had the highest confidence score, tied with BayLIME, but had the lowest understanding and justification scores. This was because CXPlain marked many areas of the prostate that did not include relevant information, resulting in many false positives.
The radiologists identified several components that they considered crucial in effective explanation methods, such as precise lesion highlighting, clarity, accurate localization, presentation style, consistency, and noise reduction. They found gradient-based presentation styles such as CXPlain to be more useful compared to BayLIME’s presentation style. The radiologists noted that noisy methods were difficult to use, but the uncertainty component helped them reason through the noise when present. They also stressed the importance of providing explanations that are consistent with their preferred method of explanation.
These findings highlight the potential of uncertainty-based explanation methods in improving lesion detection performance in radiology. However, the effectiveness of these methods can vary depending on the specific technique used, and it is important to consider multiple factors such as precision, clarity, presentation, consistency, insight, visualization style, and accuracy in designing effective explanation methods. These insights can guide future research efforts in developing effective and explainable AI models in radiology.
This study aimed to scrutinize the utility of various post hoc explanation methods in radiology, focusing on lesion detection in MRI images and understanding why certain methods were not favorably rated by radiologists. In engaging a specialized group of ten radiologists, this study presented them with MRI images annotated with different explanation techniques alongside unannotated images to establish a clear comparison and gauge the added value of these explanation methods.
DeepLIFT stood out significantly in this study, praised for enhancing the radiologists’ ability to detect lesions accurately. It offered not only high-quality insights but also provided visualizations that were clear and directly applicable to the diagnostic process, factors that contributed to its top utility rating. On the other end of the spectrum, SHAP and other lower-rated methods struggled to gain approval from the radiologists, primarily due to their failure to present clear, actionable insights that could be seamlessly integrated into the diagnostic workflow.
In delving deeper into uncertainty-based explanation methods, this study revealed a nuanced landscape of preferences among radiologists. While BayLIME scored well for its justification power, its presentation style detracted from its effectiveness, underscoring the importance of not just what is presented but how it is visually conveyed. CXPlain, preferred for its clarity, faced criticism for its lack of specificity, highlighting a key tension in the explanation method’s design between comprehensive coverage and targeted, relevant information.
The attributes that radiologists valued most in explanation methods were pinpointed with precision during this study. Beyond accuracy and specificity, the visual appeal and the ability to integrate seamlessly into existing diagnostic processes were highly prized. Consistency in explanation delivery and the avoidance of noisy, cluttered visualizations were also deemed essential, as they impact the ease with which radiologists can derive meaningful insights from the presented data.
Noise and visual clutter were especially highlighted as detrimental factors in the lower ratings for some post hoc explanation methods. Such elements can obscure critical details and lead to potential misinterpretations or oversight, undermining the radiologist’s confidence and effectiveness in lesion detection. Furthermore, methods that failed to align with radiologists’ analytical styles or did not meet their expectations for clarity and precision were marked down, indicating a clear preference for tools that are intuitive and align with professional norms and practices.
Moreover, this study’s findings suggest that the effectiveness of explanation methods is not solely dependent on the inherent technology or algorithm but also heavily reliant on the user experience. This includes how information is conveyed, the user interface, and the overall integration of the tool into the radiological workflow. As such, developers of these technologies need to consider these factors, adopting a user-centered design philosophy that prioritizes the needs and preferences of the end-users—in this case, the radiologists.
In summary, the varied ratings of the post hoc explanation methods by radiologists in this study shed light on the multifaceted nature of tool acceptance and effectiveness in a clinical setting. For a post hoc explanation method to be valued and effectively utilized, it must offer clear, accurate, and relevant insights in a visually appealing and user-friendly format. It should minimize noise and irrelevant information to avoid confusion and must align with the radiologists’ preferred modes of working and analytical methods. This comprehensive understanding of radiologist preferences and needs can significantly inform the development of future explanation methods, ensuring that they are not only technologically advanced but also practical, intuitive, and conducive to the critical work of medical diagnosis.
One limitation of this study is that it focuses solely on T2 MRI images for detecting prostate cancer. The performance and preferences of explanation methods may differ when other image modalities, such as ADC and diffusion images, are used. It is crucial to investigate the effectiveness of explanation methods on these image modalities as well. However, this study only considered T2 images to keep it manageable for the radiologists and to isolate the conclusions to this specific image modality.
Another limitation of this study is the small sample size. While this study was designed as a pilot study, a larger sample size would be necessary to obtain more robust conclusions. Nonetheless, this study provides valuable insights that can guide future studies with larger sample sizes and different image modalities. Future studies should consider a larger sample size and other image modalities to further investigate the effectiveness of explanation methods in radiology.
Author Contributions
Conceptualization, M.A.G., C.M.T. and M.K.; methodology, M.A.G. and C.M.T.; software, M.A.G. and C.M.T.; validation, M.A.G., C.M.T. and M.K.; formal analysis, M.A.G., C.M.T., M.K. and M.O.; investigation, M.A.G., C.M.T., M.O., E.E. and M.A.; resources, M.A.G. and C.M.T.; data curation, M.A.G. and C.M.T.; writing—original draft preparation, M.A.G. and C.M.T.; writing—review and editing, M.A.G.; visualization, M.A.G. and C.M.T.; supervision, M.K. All authors have read and agreed to the published version of the manuscript.
Funding
This research received no external funding.
Institutional Review Board Statement
Not applicable.
Data Availability Statement
The data presented in this study are publicly available and can be accessed from public databases.
Conflicts of Interest
The authors declare no conflicts of interest.
References
- Alkadi, R.; Taher, F.; El-Baz, A.; Werghi, N. A Deep Learning-Based Approach for the Detection and Localization of Prostate Cancer in T2 Magnetic Resonance Images. J. Digit. Imaging 2018, 32, 793–807. [Google Scholar] [CrossRef] [PubMed]
- Schelb, P.; Kohl, S.; Radtke, J.; Wiesenfarth, M.; Kickingereder, P.; Bickelhaupt, S.; Kuder, T.; Stenzinger, A.; Hohenfellner, M.; Schlemmer, H.-P.; et al. Classification of Cancer at Prostate MRI: Deep Learning versus Clinical PI-RADS Assessment. Radiology 2019, 293, 190938. [Google Scholar] [CrossRef] [PubMed]
- de Vente, C.; Vos, P.; Hosseinzadeh, M.; Pluim, J.; Veta, M. Deep Learning Regression for Prostate Cancer Detection and Grading in Bi-Parametric MRI. IEEE Trans. Biomed. Eng. 2021, 68, 374–383. [Google Scholar] [CrossRef] [PubMed]
- Selbst, A.D.; Powles, J. Meaningful Information and the Right to Explanation. Int. Data Priv. Law 2017, 7, 233–242. [Google Scholar] [CrossRef]
- Lim, Z.W.; Lee, M.L.; Hsu, W.; Wong, T.Y. Building Trust in Deep Learning System towards Automated Disease Detection. Proc. AAAI Conf. Artif. Intell. 2019, 33, 9516–9521. [Google Scholar] [CrossRef][Green Version]
- Salahuddin, Z.; Woodruff, H.; Chatterjee, A.; Lambin, P. Transparency of Deep Neural Networks for Medical Image Analysis: A Review of Interpretability Methods. Comput. Biol. Med. 2022, 140, 105111. [Google Scholar] [CrossRef] [PubMed]
- Ribeiro, M.; Singh, S.; Guestrin, C. “Why Should I Trust You?”: Explaining the Predictions of Any Classifier. In Proceedings of the NAACL 2016, San Diego, CA, USA, 12–17 June 2016. [Google Scholar]
- Binder, A.; Montavon, G.; Lapuschkin, S.; Müller, K.; Samek, W. Layer-Wise Relevance Propagation for Neural Networks with Local Renormalization Layers; ICANN: Los Angeles, CA, USA, 2016. [Google Scholar]
- Ribeiro, M.; Singh, S.; Guestrin, C. Anchors: High-Precision Model-Agnostic Explanations; AAAI: Washington, DC, USA, 2018. [Google Scholar]
- Saralajew, S.; Holdijk, L.; Rees, M.; Asan, E.; Villmann, T. Classification-by-Components: Probabilistic Modeling of Reasoning over a Set of Components. In Proceedings of the NeurIPS 2019, Vancouver, BC, Canada, 8–14 December 2019. [Google Scholar]
- Li, O.; Liu, H.; Chen, C.; Rudin, C. Deep Learning for Case-Based Reasoning through Prototypes: A Neural Network That Explains Its Predictions; AAAI: Washington, DC, USA, 2018. [Google Scholar]
- Tonekaboni, S.; Joshi, S.; McCradden, M.D.; Goldenberg, A. What Clinicians Want: Contextualizing Explainable Machine Learning for Clinical End Use. In Proceedings of the MLHC 2019, Ann Arbor, MI, USA, 9–10 August 2019. [Google Scholar]
- Gulum, M.A.; Trombley, C.M.; Kantardzic, M. A Review of Explainable Deep Learning Cancer Detection Models in Medical Imaging. Appl. Sci. 2021, 11, 4573. [Google Scholar] [CrossRef]
- Hegselmann, S.; Volkert, T.; Ohlenburg, H.; Gottschalk, A.; Dugas, M.; Ertmer, C. An Evaluation of the Doctor-Interpretability of Generalized Additive Models with Interactions. In Proceedings of the MLHC 2020, Durham, NC, USA, 7–8 August 2020. [Google Scholar]
- Elish, M.C. The Stakes of Uncertainty: Developing and Integrating Machine Learning in Clinical Care. Ethnogr. Prax. Ind. Conf. Proc. 2018, 2018, 364–380. [Google Scholar] [CrossRef]
- Escobar, G.J.; Turk, B.J.; Ragins, A.; Ha, J.; Hoberman, B.; LeVine, S.M.; Ballesca, M.A.; Liu, V.; Kipnis, P. Piloting electronic medical record-based early detection of inpatient deterioration in community hospitals. J. Hosp. Med. 2016, 11 (Suppl. S1), S18–S24. [Google Scholar] [CrossRef]
- Mazur, L.M.; Mosaly, P.R.; Moore, C.; Comitz, E.; Yu, F.; Falchook, A.D.; Eblan, M.J.; Hoyle, L.M.; Tracton, G.; Chera, B.S.; et al. Toward a better understanding of task demands, workload, and performance during physician-computer interactions. J. Am. Med. Inform. Assoc. JAMIA 2016, 23, 1113–1120. [Google Scholar] [CrossRef]
- Ghassemi, M.; Pushkarna, M.; Wexler, J.; Johnson, J.; Varghese, P. ClinicalVis: Supporting Clinical Task-Focused Design Evaluation. arXiv 2018, arXiv:1810.05798. [Google Scholar]
- Lertvittayakumjorn, P.; Toni, F. Human-grounded Evaluations of Explanation Methods for Text Classification. arXiv 2019, arXiv:1908.11355. [Google Scholar]
- Shrikumar, A.; Greenside, P.; Kundaje, A. Learning important features through propagating activation differences. In Proceedings of the 34th International Conference on Machine Learning—Volume 70 (ICML’17), Sydney, Australia, 6–11 August 2017; pp. 3145–3153. [Google Scholar]
- Jeyakumar, J.; Noor, J.; Cheng, Y.; Garcia, L.; Srivastava, M.B. How Can I Explain This to You? An Empirical Study of Deep Neural Network Explanation Methods. In Proceedings of the NeurIPS 2020, Online, 6–12 December 2020. [Google Scholar]
- Chen, C.; Li, O.; Barnett, A.; Su, J.; Rudin, C. This looks like that: Deep learning for interpretable image recognition. In Proceedings of the NeurIPS 2019, Vancouver, BC, Canada, 8–14 December 2019. [Google Scholar]
- Krosnick, J.A.; Presser, S. Question and Questionnaire Design. In Handbook of Survey Research, 2nd ed.; Stanford University: Stanford, CA, USA, 2009. [Google Scholar]
- Litjens, G.J.; Debats, O.; Barentsz, J.O.; Karssemeijer, N.; Huisman, H. PROSTATEx Challenge Data. Cancer Res. 2017, 77, e115–e118. [Google Scholar] [CrossRef] [PubMed]
- Cuocolo, R.; Stanzione, A.; Castaldo, A.; De Lucia, D.R.; Imbriaco, M. Quality Control and Whole-Gland, Zonal and Lesion Annotations for the PROSTATEx Challenge Public Dataset. Eur. J. Radiol. 2021, 138, 109647. [Google Scholar] [CrossRef] [PubMed]
- Simonyan, K.; Zisserman, A. Very Deep Convolutional Networks for Large-Scale Image Recognition. arXiv 2015, arXiv:1409.1556. [Google Scholar]
- Liu, S.; Zheng, H.; Feng, Y.; Li, W. Prostate Cancer Diagnosis using Deep Learning with 3D Multiparametric MRI. J. Magn. Reson. Imaging 2018, 47, 1029–1037. [Google Scholar] [CrossRef][Green Version]
- Wang, X.; Yang, W.; Weinreb, J.; Han, J.; Li, Q.; Kong, X.; Yan, Y.; Ke, Z.; Luo, B.; Liu, T.; et al. Searching for Prostate Cancer by Fully Automated Magnetic Resonance Imaging Classification: Deep Learning versus Non-Deep Learning. Sci. Rep. 2018, 8, 12070. [Google Scholar]
- Mehrtash, A.; Ghafoorian, M.; Pernelle, G.; Wells, W.M.; Goldenberg, S.L.; Abolmaesumi, P. Classification of Clinical Significance of MRI Prostate Findings Using 3D Convolutional Neural Networks. Proc. SPIE 2017, 10134, 101342Z. [Google Scholar] [CrossRef]
- Sundararajan, M.; Taly, A.; Yan, Q. Axiomatic Attribution for Deep Networks. In Proceedings of the 34th International Conference on Machine Learning—Volume 70, Sydney, NSW, Australia, 6–11 August 2017; pp. 3319–3328. [Google Scholar]
- Smilkov, D.; Thorat, N.; Kim, B.; Viégas, F.B.; Wattenberg, M. SmoothGrad: Removing Noise by Adding Noise. arXiv 2017, arXiv:1706.03825. [Google Scholar]
- Lundberg, S.M.; Lee, S.I. A Unified Approach to Interpreting Model Classifications. In Proceedings of the 31st International Conference on Neural Information Processing Systems (NIPS’17), Red Hook, NY, USA, 4–9 December 2017; Curran Associates Inc.: Red Hook, NY, USA, 2017; pp. 4768–4777. [Google Scholar]
- Selvaraju, R.R.; Das, A.; Vedantam, R.; Cogswell, M.; Parikh, D.; Batra, D. Grad-CAM: Visual Explanations from Deep Networks via Gradient-Based Localization. Int. J. Comput. Vis. 2020, 128, 336–359. [Google Scholar] [CrossRef]
- Schwab, P.; Karlen, W. CXPlain: Causal Explanations for Model Interpretation under Uncertainty. In Proceedings of the Advances in Neural Information Processing Systems, Vancouver, BC, Canada, 8–14 December 2019; Curran Associates, Inc.: Red Hook, NY, USA, 2019; Volume 32. [Google Scholar]
- Li, X.; Zhou, Y.; Dvornek, N.C.; Gu, Y.; Ventola, P.; Duncan, J.S. Efficient Shapley Explanation for Features Importance Estimation Under Uncertainty. In Medical Image Computing and Computer Assisted Intervention—MICCAI 2020; Martel, A.L., Abolmaesumi, P., Stoyanov, D., Mateus, D., Zuluaga, M.A., Zhou, S.K., Racoceanu, D., Joskowicz, L., Eds.; Springer International Publishing: Cham, Switzerland, 2020; pp. 792–801. [Google Scholar]
- Bykov, K.; Höhne, M.M.-C.; Müller, K.-R.; Nakajima, S.; Kloft, M. How Much Can I Trust You?—Quantifying Uncertainties in Explaining Neural Networks. arXiv 2020, arXiv:2006.09000. [Google Scholar]
- Zhao, X.; Huang, W.; Huang, X.; Robu, V.; Flynn, D. BayLIME: Bayesian Local Interpretable Model-Agnostic Explanations. In Proceedings of the Thirty-Seventh Conference on Uncertainty in Artificial Intelligence, Proceedings of Machine Learning Research, Virtual Event, 27–30 July 2021; Volume 161, pp. 887–896. [Google Scholar]
- Aronson, J.A. A Pragmatic View of Thematic Analysis. Qual. Rep. 1993, 2, 1–3. [Google Scholar] [CrossRef]


Disclaimer/Publisher’s Note: The statements, opinions and data contained in all publications are solely those of the individual author(s) and contributor(s) and not of MDPI and/or the editor(s). MDPI and/or the editor(s) disclaim responsibility for any injury to people or property resulting from any ideas, methods, instructions or products referred to in the content. |
© 2024 by the authors. Licensee MDPI, Basel, Switzerland. This article is an open access article distributed under the terms and conditions of the Creative Commons Attribution (CC BY) license (https://creativecommons.org/licenses/by/4.0/).