Article

Personalized Setup Optimization Strategies to Improve Clinical Workflow in Image-Guided Pediatric Particle Therapy

1
Bioengineering Unit, Clinical Department, National Centre for Oncological Hadrontherapy (CNAO), 27100 Pavia, Italy
2
Medical Physics Unit, Clinical Department, National Centre for Oncological Hadrontherapy (CNAO), 27100 Pavia, Italy
3
Radiotherapy Unit, Clinical Department, National Centre for Oncological Hadrontherapy (CNAO), 27100 Pavia, Italy
4
Pediatric Radiotherapy Unit, Fondazione IRCCS Istituto Nazionale dei Tumori (INT), 20133 Milan, Italy
5
Radiology Unit, Clinical Department, National Centre for Oncological Hadrontherapy (CNAO), 27100 Pavia, Italy
6
Department of Electronics, Information and Bioengineering, Politecnico di Milano (POLIMI), 20133 Milan, Italy
7
Department of Clinical, Surgical, Diagnostic and Pediatric Sciences, University of Pavia, 27100 Pavia, Italy
*
Author to whom correspondence should be addressed.
Affiliation at the time of the study.
Appl. Sci. 2024, 14(11), 4658; https://doi.org/10.3390/app14114658
Submission received: 5 March 2024 / Revised: 14 May 2024 / Accepted: 24 May 2024 / Published: 28 May 2024

Abstract

:

Featured Application

Setup optimization in pediatric particle therapy.

Abstract

The purpose of this retrospective study was to simulate a daily pre-alignment strategy to mitigate systematic positioning errors in image-guided pediatric hadron therapy. All pediatric patients (32 patients, 853 fractions) treated from December 2021 and September 2022 at our Institution were retrospectively considered. For all fractions, daily correction vectors (CVs) resulting from image registration for patient positioning were retrieved in the form of txt files from the hospital database. For each fraction, an adjusted correction vector (V′) was then computed as the difference between the actual one (V) and the algebraic average of the previous ones, as to simulate patient pre-alignment before imaging. The Euclidean norm of each V′ was computed and normalized with respect to that of the corresponding V to derive N. Pre-correcting all the coordinate values led to a 46% average reduction (min 20%, max 60%) in CVs, considering the first 27 fractions (average value in this cohort of patients). Such a potential improvement (N < 1) was observed for the most patients’ fractions (781/853, 91.6%). For the remaining 72/853 cases (8.4%), a remarkable worsening (N > 2) involved only 7/853 (0.82%) fractions. The presented strategy shows promising outcomes in order to ameliorate pediatric patient setup before imaging. However, further investigations to identify patients most likely to benefit from this approach are warranted.

1. Introduction

Globally, as many as 400,000 children receive a cancer diagnosis each year [1]. As in adults, radiation therapy (RT) represents a fundamental part of the multimodal treatment of pediatric malignancies [2]. In such a sensitive population, radiation-induced late effects should be minimized. This need is met by hadron therapy (HT), which represents a paradigm shift in the field of pediatric radiation oncology [3]. With a reduction in integral dose to normal tissues up to 60% compared to conventional photon RT due to its physical advantages, it holds the promise to reduce the incidence and severity of short-term and long-term toxicities [4]. If on the one hand the steep dose gradients allow for the greater sparing of healthy tissues, on the other, they make this treatment modality very sensitive to targeting uncertainties, arising when the position of the patient in the planning phase is not replicated identically in the treatment sessions [5,6]. Any deviation from the planned position could result in the underdosage of target or overdosage of the organs at risk (OARs), undermining the efficacy of treatment and toxicity outcomes [7]. The initial patient positioning based on laser alignment marks on the mask is not accurate enough to ensure setup consistency [8]. As dose conformity and gradients increase, accurate patient alignment is therefore mandatory, and image-guided RT (IGRT) becomes a prerequisite [9,10,11]. The image guidance systems currently available in particle therapy facilities consist mainly of 2D orthogonal X-ray imaging systems, in-room 3D-computed tomography (CT) or on-board cone-beam CT (CBCT) [12], which enable one to readily identify setup uncertainties and organ motion, and hence improve the quality of treatment [13]. Daily acquired in-room images and digital reconstructed radiographs (DRRs) from simulation CT (sCT) are registered (i.e., overlaid), and the output of such a registration procedure is a numerical transformation that aligns the position of the patient at the time of simulation with the one at the time of treatment, with respect to the treatment isocentre [14]. Practically, this is achieved by correcting the position of the couch accordingly. Specifically, if the couch has six degrees of freedom (DOF), a correction vector (CV) featuring six components (rotational and translational) will be the output of the registration procedure. In HT, as well as in photon RT, each treatment fraction is normally preceded by setup verification that allows one to compensate for positioning errors. In the literature, the separation of such positioning errors into a systematic and a random component is well-established [15,16]: the former refers to fact that the patient’s geometry at the time of sCT is not representative of anatomy displacement during treatment, while the latter represents the intra- or inter-fraction fluctuation around the systematic displacement. Specific protocols have been developed for photon RT that allow one to abolish in-room setup verification before selected treatment fractions by resetting the systematic component of positioning error by exploiting information from a few precedent fractions [16]. Although a similar approach alone is not easily replicable in HT due to the higher geometrical selectivity and hence increased risk of missing the target, a hybrid strategy that aims at diminishing the systematic positioning errors before image-based setup verification could be a game-changer in setup verification procedures, especially in pediatric patients. As a matter of fact, with smaller displacements, either automatic or semi-automatic registration procedures would be faster and more robust, and the need for a second imaging process to confirm setup would be reduced, with consequent benefits for the patients (decreased overall treatment time and imaging dose) and clinical throughput. Overall, faster setup procedures improve patients’ experiences, reduce intra-fractional movement, increase patients’ throughput and in principle reduce the frequency of imaging and related dose [17]. Given this rationale, the aim of this retrospective study was to evaluate the effectiveness of a patient pre-alignment protocol before planar kilovoltage (kV) imaging based on positioning information retrieved from previous fractions, in an attempt at reducing dose to patients and setup time. The envisaged benefit will be quantified in terms of reduction in the magnitude of the correction vectors, i.e., shifts of couch after imaging.

2. Materials and Methods

2.1. Patients Population

This retrospective study included a consecutive cohort of pediatric and young adult patients treated with HT between December 2021 and September 2022 at the National Center for Oncological Hadrontherapy (CNAO) in Pavia, Italy. To be eligible for the study, patients had to meet the following criteria: (1) Age < 30 year; (2) availability of clinical, imaging and positioning data; (3) written informed consent for use of data for clinical research and educational purposes. All anatomical districts treated were allowed. The administration of concomitant therapies and treatment in anaesthesia were allowed. The study was approved by the local Ethical Committee “Comitato Etico Territoriale Lombardia 6” under notification number 0052020/23, prot. CNAO OSS 57 2023.

2.2. Setup Verification Procedures in CNAO

CNAO is a synchrotron-based facility equipped with three treatment rooms, the central one (Room 2) with both vertical and horizontal fixed beam lines and the other two lateral (Room 1 and Room 3) with a horizontal beam only. Both proton and carbon ion species are delivered. Patients are immobilized using a solid thermoplastic mask fixed on an indexed base plate, together with head supports for cranial treatments and cushions and supports for knees and feet during pelvic treatments. A detailed description and representation of these systems is reported in [6]. Regarding Room 2, patients are prepared in a dedicated room and then transported into the treatment bunker, while regarding Room 1 and Room 3, patients are positioned directly inside. In-room lasers are used for initial patient positioning, which is verified using stereoscopic kV images. This is realized by means of a patient positioning system (PPS) and a patient verification system (PVS), which are installed in all treatment rooms [18]. In all rooms, the PPS is a robotic pantograph with 6 degrees of freedom and a positioning accuracy of 0.3 mm for translations and 0.1° for rotations. In the lateral rooms, the PVS is a rotating stereoscopic X-ray imaging system that allows for the simultaneous acquisition of two oblique projections at the treatment isocenter [19], which are then rigidly registered with DRRs of sCT (SOMATOM Sensation Open CT scanner, Siemens, Germany) by means of a commercial software (Verisuite® v1.8 MedCom GmbH, Darmstadt, Germany). In the central room, an in-house-developed robotic system allows for the acquisition, a few meters out of the treatment isocenter, of planar antero-posterior and latero-lateral kV images [20], which are rigidly registered by means of a custom software (XPPV v03). Such a system also allows for acquiring CBCTs to verify internal organs’ displacement, especially for pelvic treatments. In both cases, the output of the registration procedure, which is semi-automatic and based on bony landmarks, consists of a correction vector (CV) featuring 6 coordinates (3 translational and 3 rotational). Following registration, the magnitude of shifts is assessed: if they are within pre-determined tolerances, they are applied to align the couch to the beam isocenter and the treatment goes forward; otherwise, a proper intervention occurs based on clinical considerations (e.g., registration is re-assessed, the patient is repositioned, etc.).

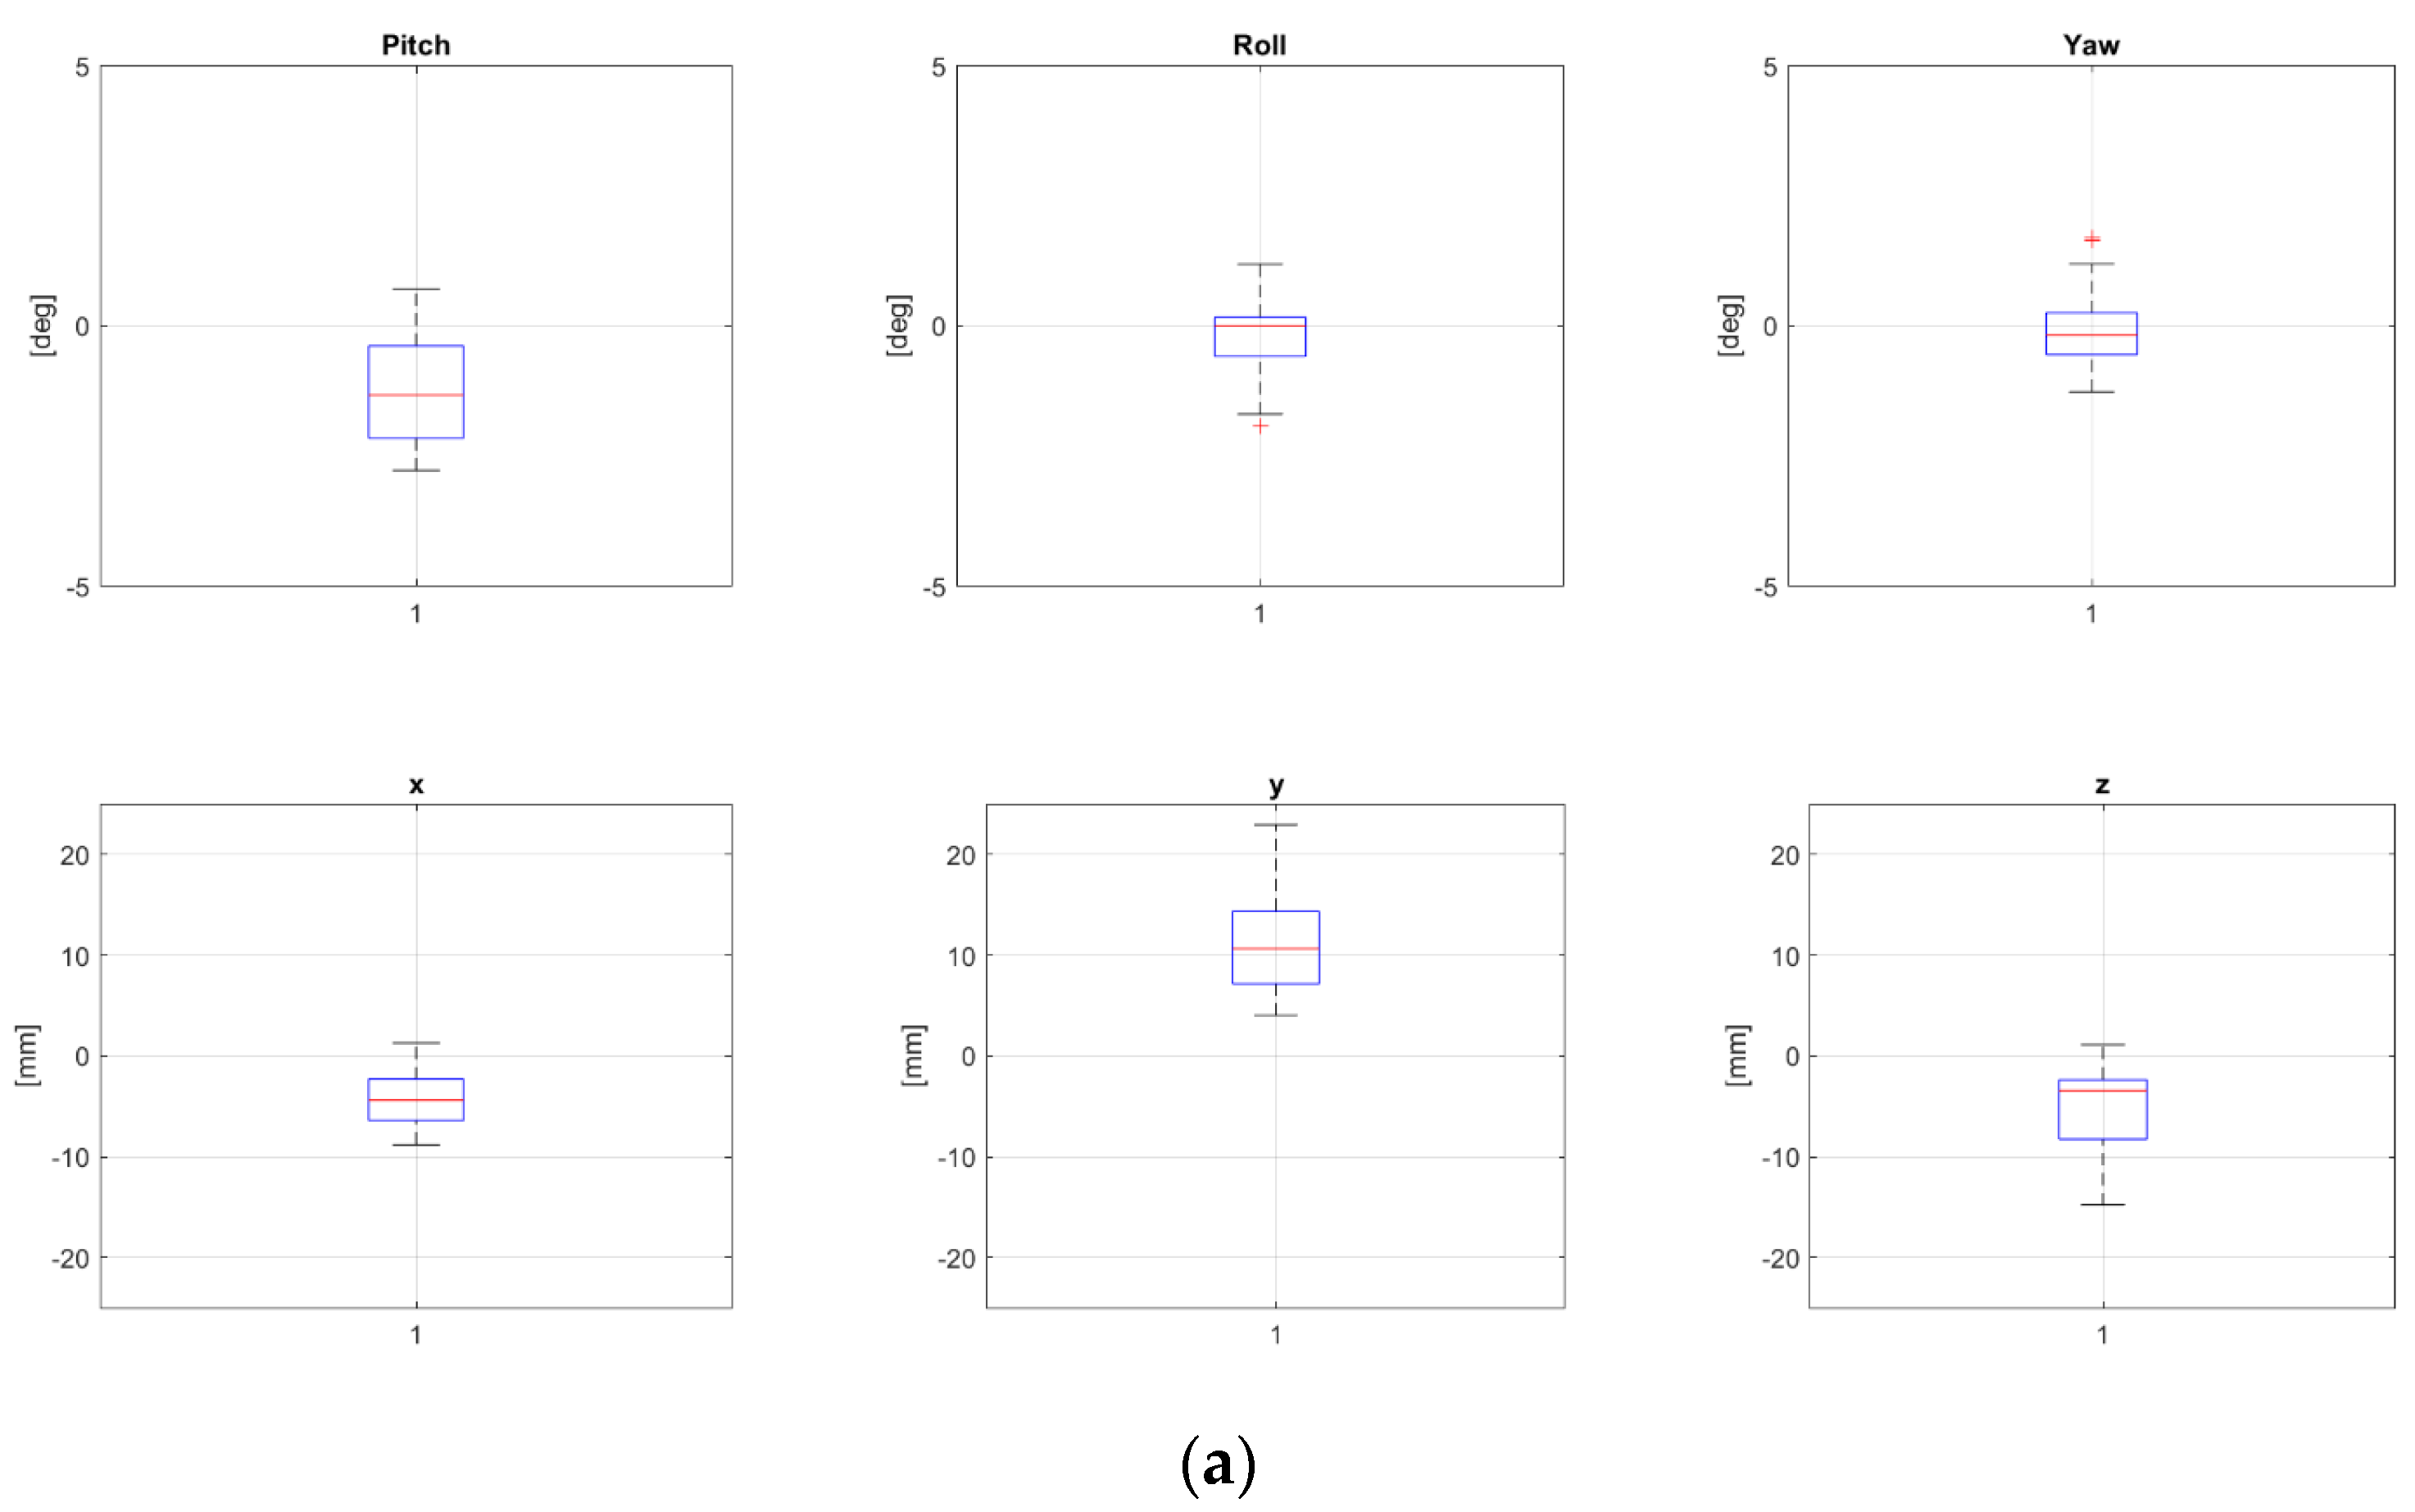
2.3. Random and Systematic Errors

As anticipated previously, the displacement in a specific fraction f of a patient p, namely, d(p,f), can be decomposed into a patient-specific systematic component s(p) and a random component dependent on patient and fraction r(p,f) [15] (Equation (1)).
d p , f = s p + r p , f
The systematic component can be reduced by means of averaging procedures, as previously described in the literature [15]. Instead of considering only a few initial fractions to compute an average correction vector to subtract from subsequent ones, in this study, the correction vector of each fraction depends on all preceding ones. The following section offers more details on the designed workflow based on this rationale.

2.4. Setup Data Collection

First of all, for each patient and treatment fraction, basic clinical and treatment information were collected. Secondly, CVs were retrieved from the log files of the treatment rooms by means of an in-house script developed with MATLAB (The MathWorks Inc., Natick, MA, USA). Each CV is composed of 6 components, half translational, namely, x, y and z, and half rotational, namely, pitch (P), roll (R), and yaw (Y). With respect to the patient, x, y and z represent the latero-lateral, cranio-caudal and antero-posterior directions, respectively. P, R and Y represent rotations around the x, y, and z axes, respectively. As a preliminary analysis, the average value and standard deviation of each coordinate for each patient, throughout the treatment fractions, were computed. Additionally, the mean value of the modules (across patients) of the average corrections (across fractions for each patient), as well as the standard deviation (SD) for each coordinate, was computed. These basic statistical indexes make it possible to estimate a priori the impact of a pre-correction strategy based on averaging procedures to dampen systematic errors (i.e., the higher the average values of corrections, the higher the likelihood that an algorithm that cuts off systematic errors succeeds). For those patients who underwent two or more setup verifications throughout treatment, only the first one was considered and analyzed.

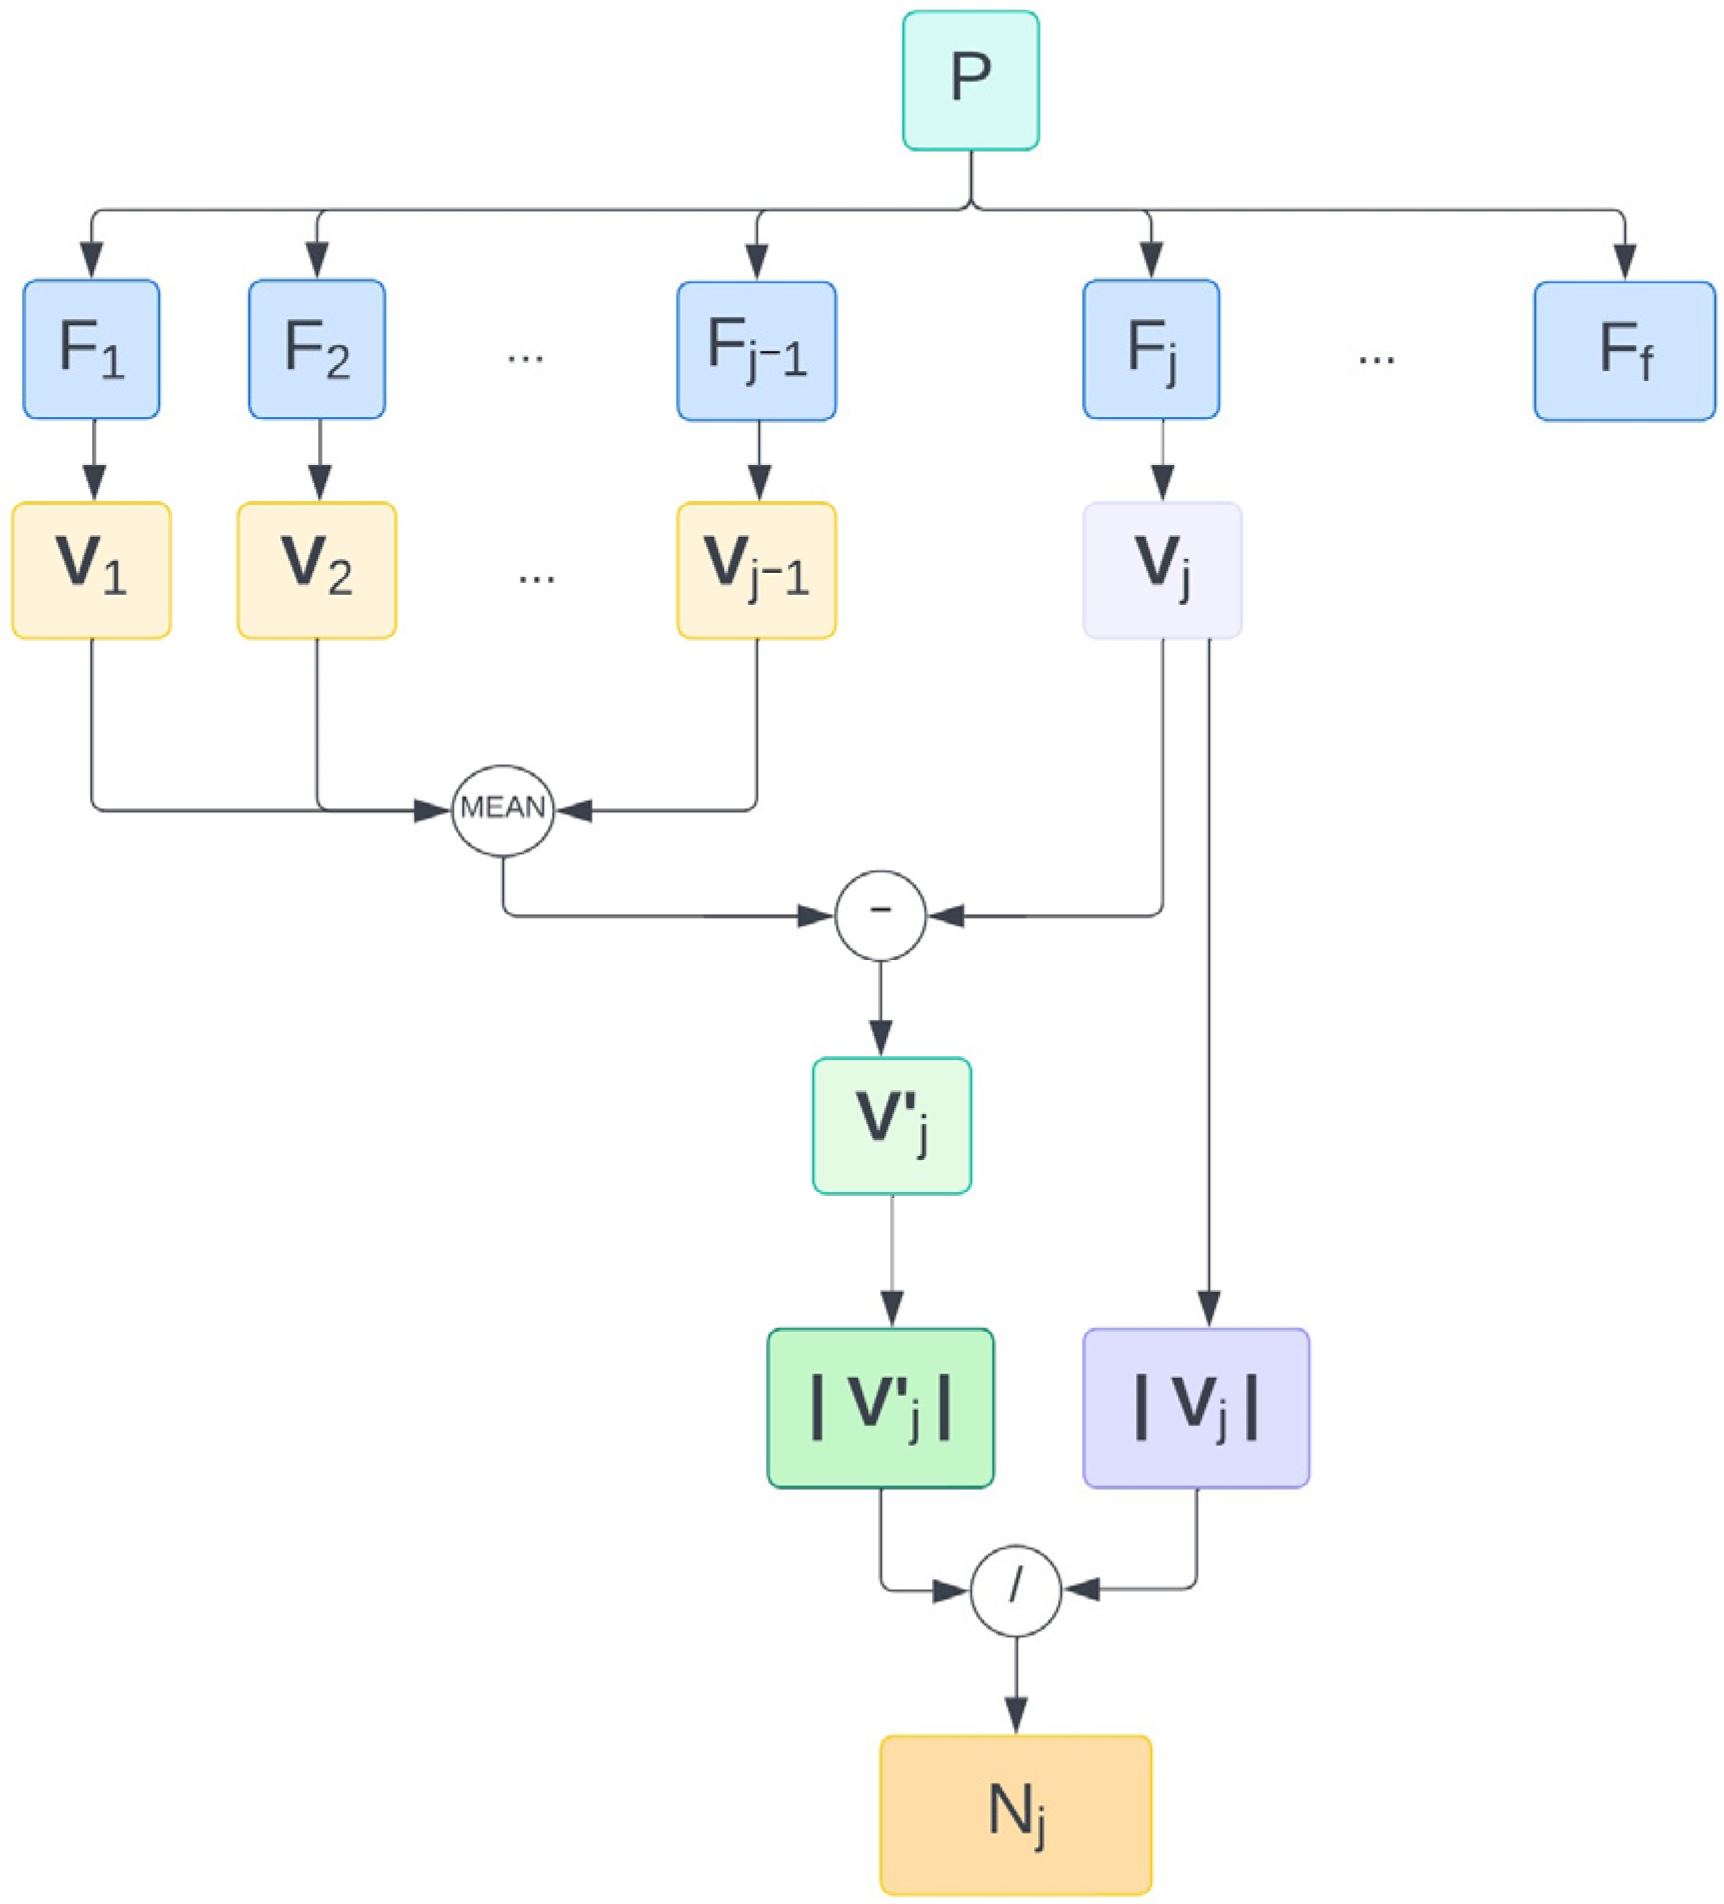
2.5. Workflow Design to Pre-Align Patient
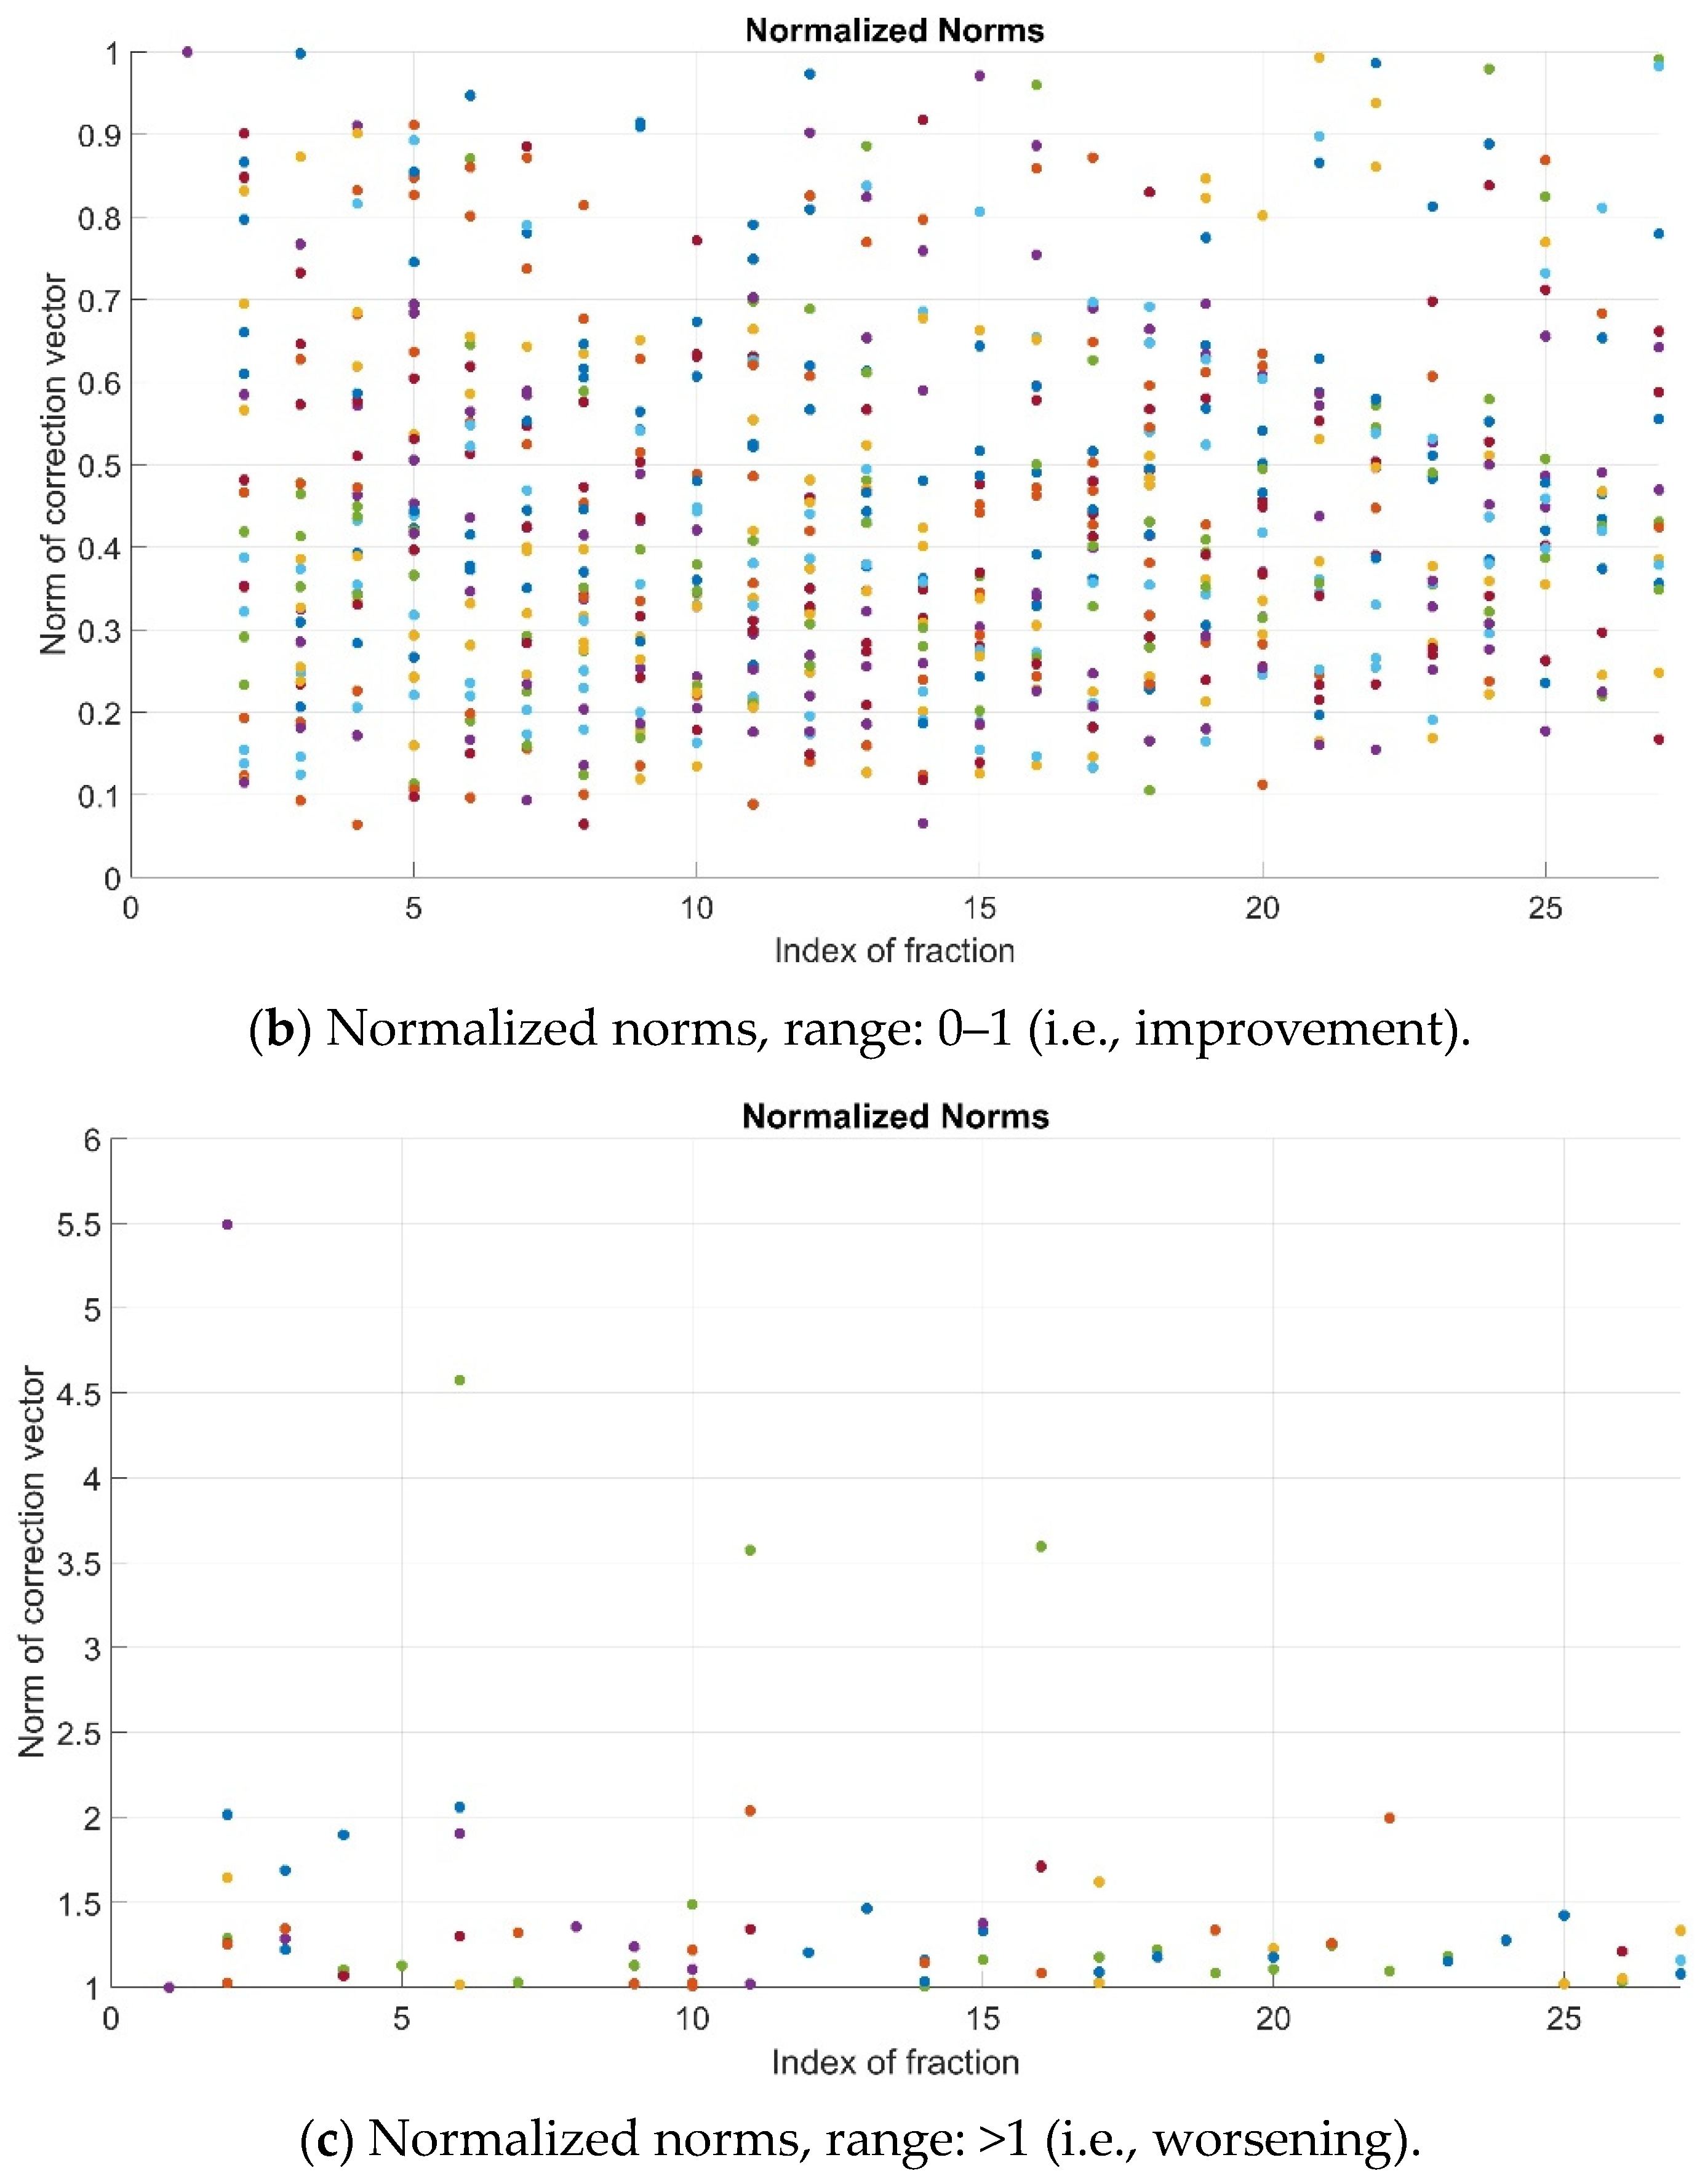
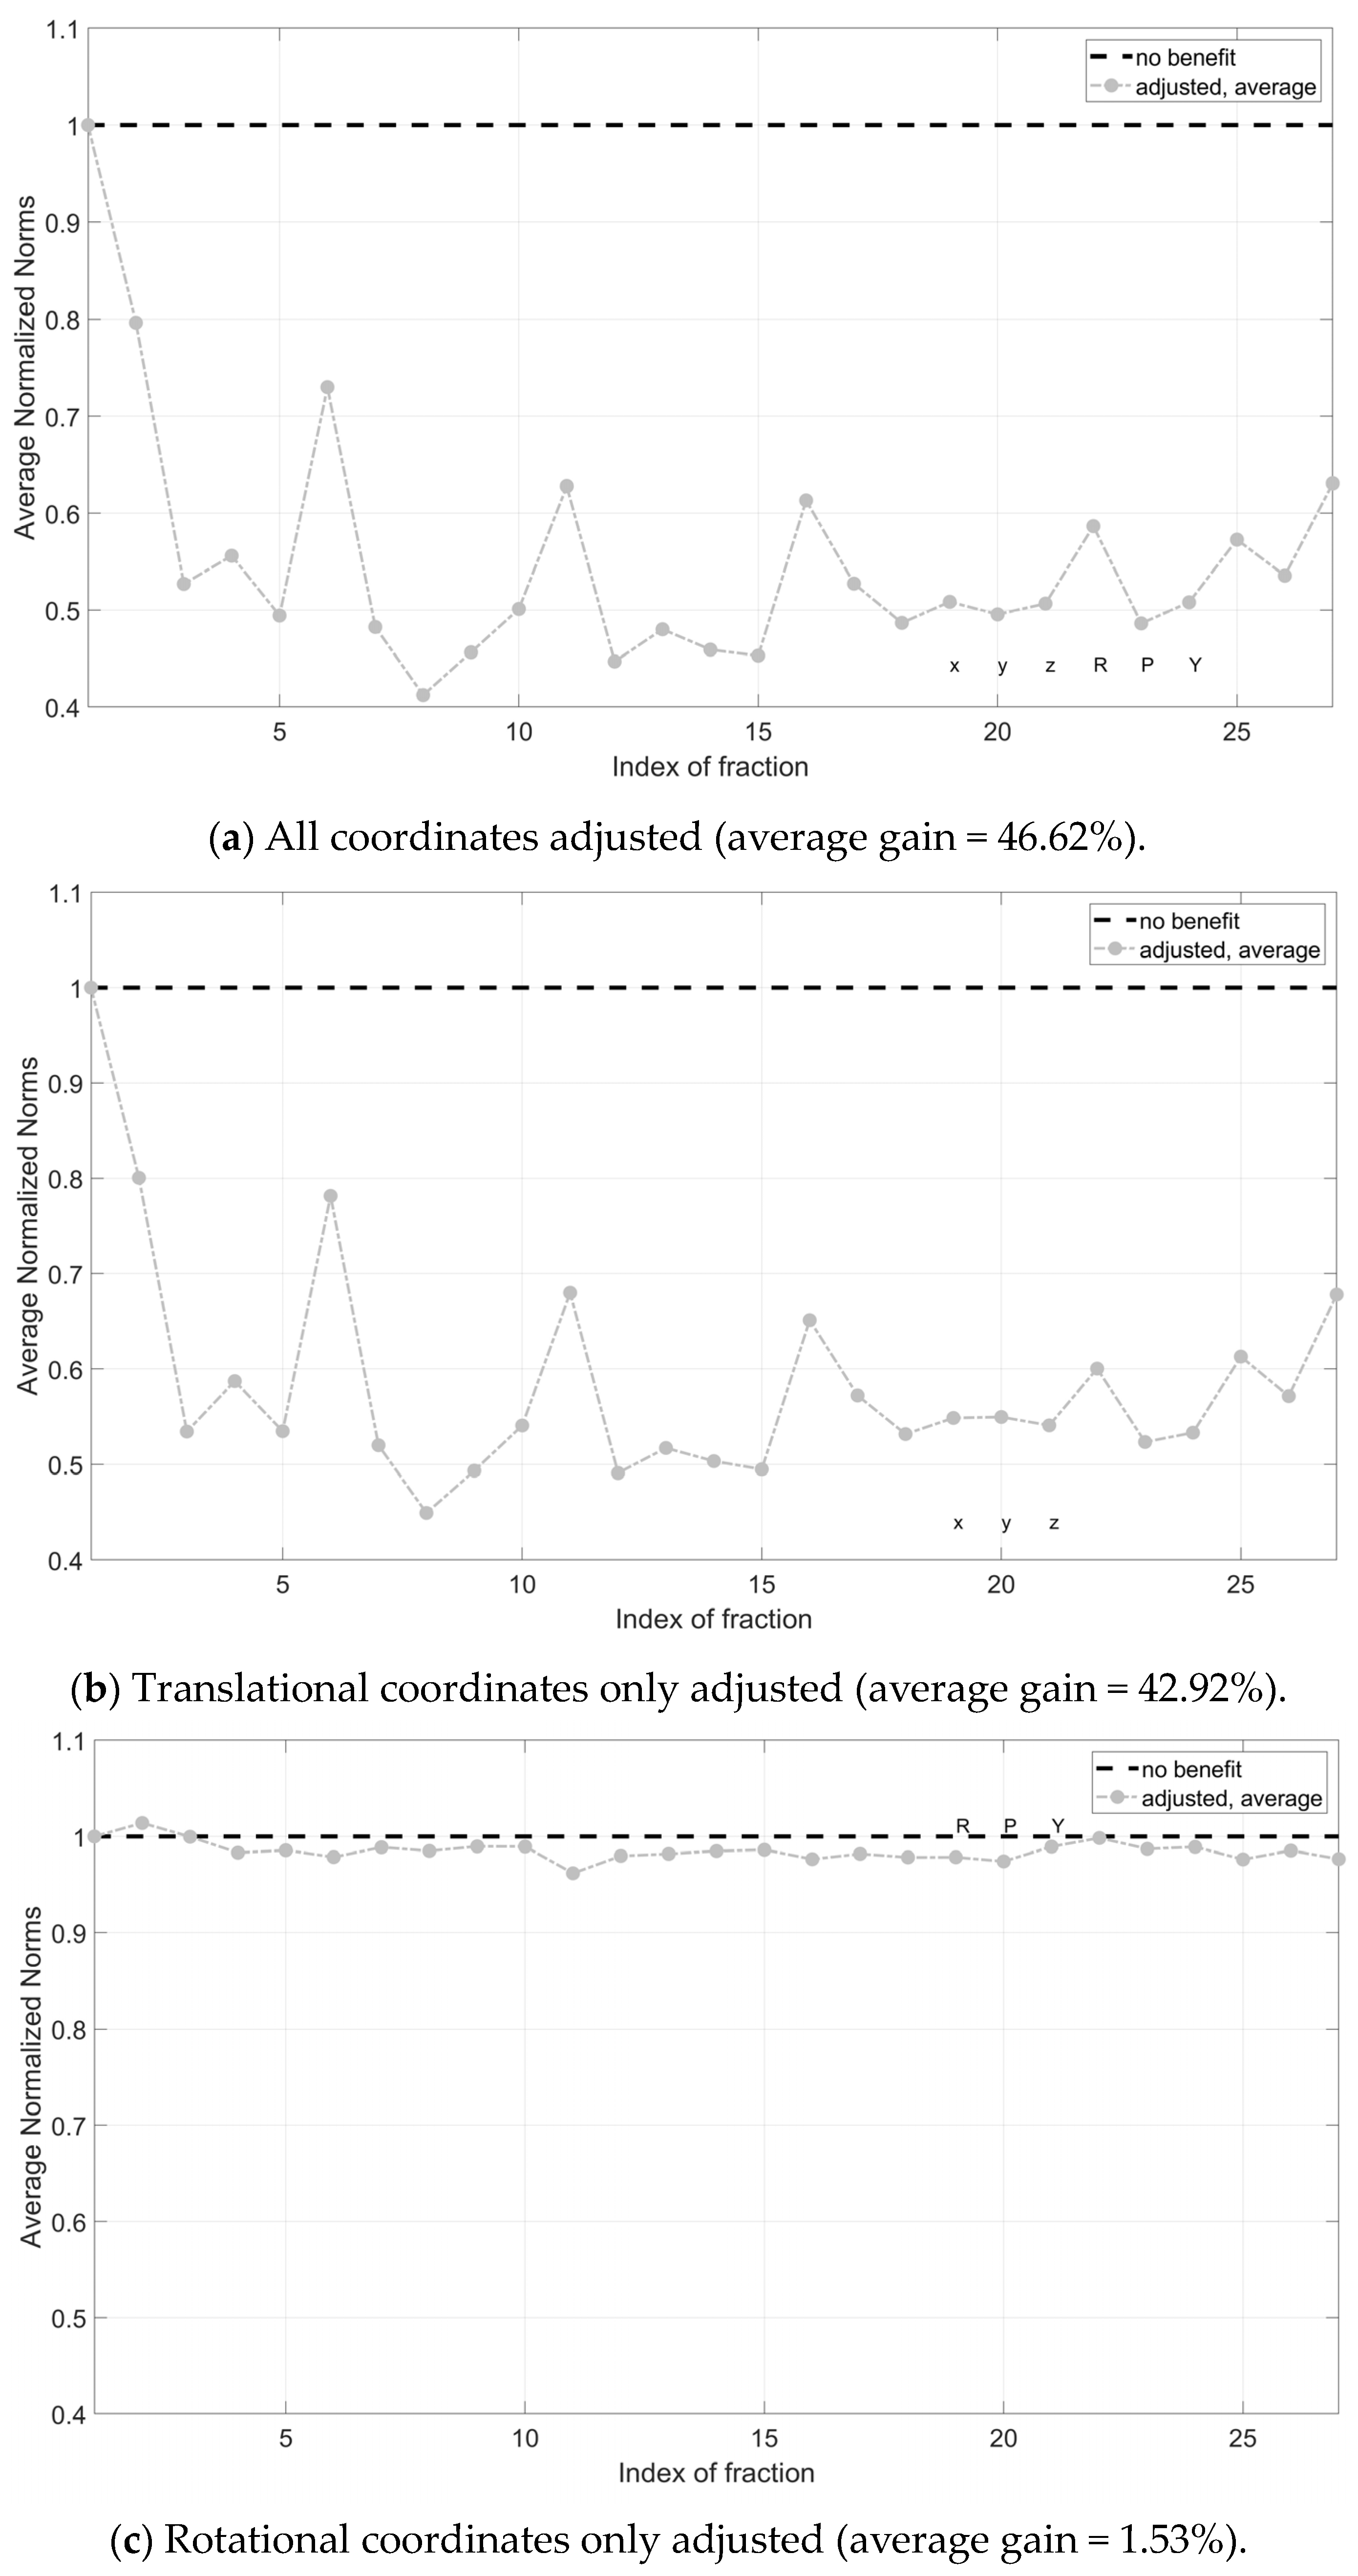
Considering the j-th fraction (j = 1, …, f; f = total number of fractions), for each patient, an adjusted CV (Vj) was computed as the coordinate-by-coordinate difference between the current one (Vj) and the algebraic average of the previous ones (Vj−1(ave)), as to simulate patient pre-alignment before imaging based on information from previous fractions (Equation (2)):
V j = V j V j 1 ( a v e ) = V j k = 1 j 1 V k j 1
In order to quantify the benefits of such procedures, the Euclidean norm of Vj and Vj was computed as in Equation (3). Rotations were expressed in degrees and translations in mm, but were treated as adimensional when the Euclidean norm was computed, to ensure mathematical consistency.
g i v e n   V = x ,   y ,   z ,   P ,   R ,   Y ,     V = x 2 + y 2 + z 2 + P 2 + R 2 + Y 2 2
The norm of V′ was then normalized with respect to that of the corresponding V to derive a normalized CV, namely, N (Equation (4)).
N j = | V j | | V j |
It follows from the definition that if 0 < N < 1 (i.e., |Vj| < |Vj|), pre-alignement is successful, as the magnitude of CV decreases; on the contrary, if N > 1 (i.e., |Vj| < |Vj|), pre-alignment fails, as the magnitude of CV increases. An average value for each fraction (up to the average number of fractions in the considered cohort) across all patients (Nave,j) was considered (Equation (5)). In the formula, p(j) is equal to the number of patients for which the j-th fraction does exist.
N a v e , j = h = 1 p ( j ) N h , j p ( j )
In order to estimate the relative role of rotational and translational components in the reduction in systematic errors, the whole procedure was repeated by pre-correcting rotations only and translations only. The overall workflow is depicted in Figure 1.

3. Results

As many as 32 pediatric patients met the inclusion criteria and were included in the study, for a total of 853 fractions, i.e., 27 per patient on average. The median age at treatment was 13.62 years (min—2.24; max—28.33). All patients but one, who received carbon ion therapy, were treated with protons. Three out of four patients (24/32, 75%) had head and neck malignancies; the remainder had extra-cranial tumours localized in the thorax (3/32, 9%), pelvis (4/32, 13%) or limbs (1/32, 3%).
By looking at the mean across patients of the absolute values of the average corrections across fractions for each patient, it is evident that translations contribute the most in the systematic component of the positioning error, especially in the posterior–anterior (z, 3.26 mm) and caudal–cranial (y, 1.91 mm) directions. Corrections in the z directions were mostly (30/32) negative, i.e., couch down, while in the y direction they were mostly (26/32) positive, i.e., couch towards beam nozzle. Shifts in the x direction were, on average, lower (1.53 mm) and approximately equally distributed between negative and positive values. Regarding rotations, average values oscillate around 0.5 degrees. No clear relationships between the entities of shifts and room, age, site of lesion and anaesthesia are evident from the data (Table 1).
Two patients, namely, “P8” and “P24” from Table 1, both treated for extra-cranial malignancies, had corrections above 4 mm for all translational components and have been selected as representative for the pelvic district. Boxplots representing corrections of these patients for all fractions are reported in Figure 2a and Figure 2b, respectively.
As previously explained, the pre-alignment strategy is successful if the normalized value of the norm, i.e., N, is lower than 1. In the studied cohort, such an improvement (N < 1) was observed for most patients’ fractions (781/853, 91.6%). For the remainder, 72/853 cases (8.4%), a remarkable worsening (N > 2) occurred involving only 7/853 (0.82%) fractions (Figure 3).
By averaging the single fraction values across all patients, a reduction in the magnitude of the correction vector was evident. Instead, no definitive trends were observed regarding Nave across the different treatment fractions, with values oscillating between higher and lower benefits. On average, the magnitude of the CV was reduced by 46% (Figure 4a). Correcting translational components only was proven to be significantly more effective than correcting rotational components only (42.92% vs. 1.53%) (Figure 4b,c).

4. Discussion

4.1. Main Findings

Our results show that the implementation of a personalized patient pre-alignment strategy based on information retrieved from previous treatment fraction could lead to a reduction of up to around 46% in the magnitude of the CVs needed to adjust the final patient position before treatment. It was also demonstrated that pre-correcting translational components has, on average, a higher benefit on the magnitude of the correction vector than correcting rotational ones.

4.2. Comparison with Previous Investigations

The statistics of the shifts herein presented are in line with the published literature and with the ones already reported by our group in a previous study [6], according to which extracranial treatments are associated with higher systematic errors and lower relative SD, making them the perfect candidates for such a pre-correction approach. The reported shifts highlight the need to improve the patient positioning procedures, even if corrections are overall quite modest and in line with the published literature. Accordingly, the first counteraction is to analyze the causes that contribute to the systematic error, in order to mitigate those related to human factors. Performing separate analyses on the dependence of results on inter-operator variability could help to shed a light on this aspect, provided that a larger cohort needs to be considered to derive robust and statistically significant results. Once one has minimized the human-related factors that contribute to setup errors, the described procedure can be streamlined in the clinical pipeline to assist positioning procedures. In the literature, several studies exist that explore the potential of such pre-alignment protocols to be used in the substitution of image-guidance in conventional photon RT [16]. As a matter of fact, in conventional RT, this strategy could represent an alternative to in-room image-based setup verification from a certain fraction on. On the contrary, the steep dose gradients that characterize HT make IGRT a prerequisite, and such a strategy cannot entirely replace daily imaging for patient verification. However, refining patient position before imaging is useful also in HT, because faster setup procedures improve patient’s experience, reduce intra-fractional movement, increase patients’ throughput and in principle reduce the frequency of imaging and related dose [17]. Therefore, although image-guided patient verification remains somewhat mandatory over the whole course of treatment due to the high geometric selectivity of particles, the implementation of such a strategy could help to improve the clinical workflow, by reducing overall treatment time and decreasing imaging dose to the patients. First of all, reducing significantly the entity of CV has the potential to decrease time associated with daily image registration procedures, the kV images being closer to the DRRs. Practically, in CNAO, the manual registration phase that precedes the automatic one could be skipped if the images to match are closer. Secondly, the application of smaller CVs makes the clinician more confident about the fact that the final position of the patient is reached correctly, and prevents further verification. As anticipated, significant shifts (i.e., rotations > 2 degrees) might affect setup and could require a second imaging or re-positioning based on clinical decision. The results demonstrate that, for most patients and treatment fractions, this pre-correction strategy would have been successful, as the magnitude of the CV was reduced. However in some cases, it led to a worsening of the situation, with the patient being virtually moved even farther from the treatment isocenter before imaging. Further investigations are therefore necessary to select the patient categories more likely to benefit from such an approach. One could expect later fractions to be associated with lower values of normalized norms, i.e., that the greater the number of fractions completed, the more information is available, and the more effective the pre-correction strategy. Instead, no clear trend can be observed in these data, and this can be explained by the inhomogeneity of the patients’ cohort in terms of age and the inter-observer variability intrinsic in the methodology. The proposed method could benefit from the identification of action levels, as described by De Boer and Colleagues [15]. In other words, to take into account the finite accuracy of the setup verification pipeline (accuracy of PPS, PVS, registration software, kV images and DRRs resolution, etc.), the proposed protocol could be modified by defining thresholds below which no pre-corrections are applied (e.g., 1 mm for translations and 0.5 degrees for translations). As long as the algorithm used is based on averaging procedures, such thresholds should take into account a combination of the average values of shifts as well as their SD. As a matter of fact, high values of SD mean high dispersion. As per the definition, this strategy is particularly successful if the systematic component markedly prevails over the random component of the error, that is, if SD is low. Analyzing the SD values of first fractions could therefore be useful to helping us understand whether to apply or not the pre-correction strategy. Alternatively, damping pre-correction based on population statistics is frequent and can prevent situations in which the strategy not only has no advantages, but also leads to an overall worsening.

4.3. Strenghts and Weaknesses

Several strengths can be acknowledged in this study. The most important of them is that, to the best of our knowledge, this is the first study investigating the feasibility of such an approach in synergy with and not in substitution for traditional image guidance procedures. Secondly, this approach has been tested in a cohort of pediatric patients treated with HT, for whom reduction in treatment time and imaging dose is of paramount importance.
Despite being innovative in nature, the study presents some limitations worth addressing. First of all, the sample size is relatively small, compared to other studies in the literature involving a higher number of patients. However, while these studies consider an adult population and conventional photon RT, the present investigation only selects pediatric patients treated with HT. Additionally, for each patient, an average of 27 fractions was available, meaning more than 850 fractions and 5000 coordinates, making the results robust enough from a statistical point of view. Another limitation is represented by the heterogeneity of the population in terms of age range. As a matter of fact, despite all patients included in the study being classified as pediatrics, some of them can be classified as adolescents and young adults (AYA), according to the definition of the European Society for Pediatric Oncology (SIOPE) (siope.eu), their age range being between 2 and 28 years old. Furthermore, some younger patients were treated in narcosis, others with thoracic malignancies in gating. Analogously, anatomical districts treated ranged widely, including head and neck, thorax and pelvis, and it is well-known that pelvic treatments are associated with much larger CVs compared to head and neck treatments, due to higher variability in patient’s anatomy.
Regarding narcosis, no evident and definitive conclusions can be drawn, as witnessed by the absence of a clear trend of CVs for these patients (Table 1). As anticipated, there should be systematic sources of misalignments along the treatment path. For instance, as reported by a previous investigation considering patients treated at our Institution [6], the observed trend in the antero-posterior (z) direction can be explained by the deformation of thermoplastic masks, patient relaxation between simulation and subsequent treatment fractions, and target movement with respect to bony landmarks for pelvic treatments. In addition, the treatment isocenter is defined relative to CT couch which, differently from the treatment couch, does not include weight compensation.
The increase in pediatric patients treated at our Institution will enable us to enlarge the cohort and stratify patients by age, pathology and narcosis. Besides this, the methodology can be easily tested considering also an adult population, so that the cohort can be further expanded. From a methodological standpoint, the performances of the algorithm were evaluated exclusively in terms of a reduction in the magnitude of the CV, which was computed as the Euclidean norm of the CV itself. Despite being a synthetic and complete index, the norm of a vector, per definition, does not allow us to discern variations of the single components. In other words, it is not straightforward to assess to which coordinate a reduction or an increase of the magnitude of the CV is imputable. Nevertheless, the study has demonstrated that correcting translational coordinates, especially in the posterior-anterior direction, is significantly more impactful than correcting rotational components only. Another aspect that should be carefully considered is the difference in the imaging system between the lateral rooms (rotating stereoscopic, isocentric) and the central one (robotic, off-iso). The limited dataset does not allow us to derive definitive conclusions on whether the difference in the imaging systems may cause variations in the performance of the algorithm. This suggests that the approach is very general and can be easily adapted to other centers employing different systems for patient positioning and verification, as well as different particles, including photons.

4.4. Future Directions

Regarding future developments, it is worth mentioning that in CNAO simulation, CT and treatment rooms are equipped with an optical tracking system (OTS), featuring three infrared cameras able to detect the position of reflective markers placed on the patient surface [21]. Our group has demonstrated that, after OTS-based positioning, corrections applied by the X-ray-based system were reduced to sub-millimetric and sub-gradual [19]. This supports the hypothesis that a pre-correction strategy, regardless of the specific method used, could be useful in reducing the magnitude of imaging-based CVs and thus the frequency of re-imaging and treatment time. In fact, according to our institutional protocols, if corrections exceed a certain linear and angular threshold, then the patient needs to be repositioned, and the entire setup verification workflow must be repeated.
The availability of an optical system also paves the way to synergistic approaches: OTS-based pre-positioning could be successfully coupled with the described methodology using a decision-based rule to make pre-correction even more robust and reliable.
As stated before, with only 32 treatment courses, more than 850 fractions and 5000 coordinates have been collected. By enlarging the cohort of patients considered, data can increase exponentially. The potential availability of such a large amount of data (i.e., big data), as well as the underlying concept herein adopted to find hidden patterns in data and learn from experience, could pave the way to the implementation of knowledge-based—e.g., artificial intelligence (AI)-based—solutions in substitution for the analytical algorithms herein used. Accordingly, future developments could also foresee the employment of AI to gain valuable insights into patients’ data and identify trends and proper strategies to improve setup. Finally, the study is retrospective and only simulates the impact of the described procedure on dampening systematic errors. Future developments could include the integration of such an approach prospectively in the clinical pipeline to assess the true advantage in terms of clinical throughput optimization and the consequent improvement of patients’ experience.

5. Conclusions

Children with cancer treated with HT represent a very sensitive population. Limiting imaging dose is crucial to minimize radiation-induced side effects in patients with a longer life expectancy and who are more sensitive to radiation compared to adults. Reducing treatment time is also beneficial for all pediatric patients, whether or not they are treated under general anaesthesia. In this context, the hybrid strategy to pre-align patients herein presented holds the promise to limit X-ray-based verifications, and in general reduce time related to setup procedures in the majority of cases. Further investigations on larger and better-stratified cohorts, possibly employing more advanced computational techniques such as AI, are warranted to better select patients and confirm these preliminary findings.

Author Contributions

Conceptualization, M.P., A.P. and A.M.; methodology, M.P., A.P. and A.M.; software, M.P., G.S. and F.G.; validation, C.P. and G.B.; formal analysis, M.P., A.P., A.M., F.C. and A.G.; investigation, M.P., A.P., A.M. and A.G.; resources, E.O. and G.B.; data curation, M.P.; writing—original draft preparation, M.P. and A.P.; writing—review and editing, all authors; visualization, all authors; supervision, S.V., S.I., A.I., M.C., C.P., E.O. and G.B.; project administration, M.P., A.P. and G.B.; funding acquisition, non applicable. All authors have read and agreed to the published version of the manuscript.

Funding

This research received no external funding.

Institutional Review Board Statement

The study was conducted in accordance with the Declaration of Helsinki, and approved by the local Ethical Committee “Comitato Etico Territoriale Lombardia 6” under notification number 0052020/23, prot. CNAO OSS 57 2023.

Informed Consent Statement

Informed consent was obtained from all subjects involved in the study.

Data Availability Statement

Data are unavailable due to privacy restrictions.

Conflicts of Interest

The authors declare no conflicts of interest.

References

  1. Steliarova-Foucher, E.; Colombet, M.; Ries, L.A.G.; Moreno, F.; Dolya, A.; Bray, F.; Hesseling, P.; Shin, H.Y.; Stiller, C.A.; IICC-3 contributors. International incidence of childhood cancer, 2001–2010: A population-based registry study. Lancet Oncol. 2017, 18, 719–731, Erratum in Lancet Oncol. 2017, 18, e301. [Google Scholar] [CrossRef]
  2. Rombi, B.; Vennarini, S.; Vinante, L.; Ravanelli, D.; Amichetti, M. Proton radiotherapy for pediatric tumors: Review of first clinical results. Ital. J. Pediatr. 2014, 40, 74. [Google Scholar] [CrossRef]
  3. Sujith, B.; Yock, T.I. Proton beam therapy in pediatric oncology. Curr. Opin. Pediatr. 2019, 31, 28–34. [Google Scholar] [CrossRef]
  4. Greenberger, B.A.; Yock, T.I. The role of proton therapy in pediatric malignancies: Recent advances and future directions. Semin. Oncol. 2020, 47, 8–22. [Google Scholar] [CrossRef]
  5. Liebl, J.; Paganetti, H.; Zhu, M.; Winey, B.A. The influence of patient positioning uncertainties in proton radiotherapy on proton range and dose distributions. Med. Phys. 2014, 41, 091711. [Google Scholar] [CrossRef]
  6. Ricotti, R.; Pella, A.; Tagaste, B.; Elisei, G.; Fontana, G.; Bonora, M.; Ciocca, M.; Valvo, F.; Orecchia, R.; Baroni, G. Long-time clinical experience in patient setup for several particle therapy clinical indications: Management of patient positioning and evaluation of setup reproducibility and stability. Br. J. Radiol. 2020, 93, 20190595. [Google Scholar] [CrossRef]
  7. Bell, K.; Licht, N.; Rübe, C.; Dzierma, Y. Image guidance and positioning accuracy in clinical practice: Influence of positioning errors and imaging dose on the real dose distribution for head and neck cancer treatment. Radiat. Oncol. 2018, 13, 190. [Google Scholar] [CrossRef]
  8. Qubala, A.; Schwahofer, A.; Jersemann, S.; Eskandarian, S.; Harrabi, S.; Naumann, P.; Winter, M.; Ellerbrock, M.; Shafee, J.; Abtehi, S.; et al. Optimizing the Patient Positioning Workflow of Patients with Pelvis, Limb, and Chest/Spine Tumors at an Ion-Beam Gantry based on Optical Surface Guidance. Adv. Radiat. Oncol. 2022, 8, 101105. [Google Scholar] [CrossRef]
  9. Bell, K.; Heitfeld, M.; Licht, N.; Rübe, C.; Dzierma, Y. Influence of daily imaging on plan quality and normal tissue toxicity for prostate cancer radiotherapy. Radiat. Oncol. 2017, 12, 7. [Google Scholar] [CrossRef]
  10. Dzierma, Y.; Mikulla, K.; Richter, P.; Bell, K.; Melchior, P.; Nuesken, F.; Rübe, C. Imaging dose and secondary cancer risk in image-guided radiotherapy of pediatric patients. Radiat. Oncol. 2018, 13, 168. [Google Scholar] [CrossRef]
  11. Stock, M.; Georg, D.; Ableitinger, A.; Zechner, A.; Utz, A.; Mumot, M.; Kragl, G.; Hopfgartner, J.; Gora, J.; Böhlen, T.; et al. The technological basis for adaptive ion beam therapy at MedAustron: Status and outlook. Z. Med. Phys. 2018, 28, 196–210. [Google Scholar] [CrossRef]
  12. Collings, E.W.; Lu, L.; Gupta, N.; Sumption, M.D. Accelerators, Gantries, Magnets and Imaging Systems for Particle Beam Therapy: Recent Status and Prospects for Improvement. Front. Oncol. 2022, 11, 737837. [Google Scholar] [CrossRef]
  13. Wall, V.; Marignol, L.; ElBeltagi, N. Image-Guided Radiotherapy in Paediatrics: A Survey of International Patterns of Practice. J. Med. Imaging Radiat. Sci. 2018, 49, 265–269. [Google Scholar] [CrossRef]
  14. Brock, K.K.; Mutic, S.; McNutt, T.R.; Li, H.; Kessler, M.L. Use of image registration and fusion algorithms and techniques in radiotherapy: Report of the AAPM Radiation Therapy Committee Task Group No. 132. Med. Phys. 2017, 44, e43–e76. [Google Scholar] [CrossRef]
  15. de Boer, H.C.; Heijmen, B.J. eNAL: An extension of the NAL setup correction protocol for effective use of weekly follow-up measurements. Int. J. Radiat. Oncol. Biol. Phys. 2007, 67, 1586–1595. [Google Scholar] [CrossRef]
  16. Kukolowicz, P.; Mietelska, M.; Kiprian, D. Effectiveness of the No action level protocol for head & neck patients—Time considerations. Rep. Pr. Oncol. Radiother. 2020, 25, 828–831. [Google Scholar] [CrossRef]
  17. Johnson, P.B.; Jackson, A.; Saki, M.; Feldman, E.; Bradley, J. Patient posture correction and alignment using mixed reality visualization and the HoloLens 2. Med. Phys. 2022, 49, 15–22. [Google Scholar] [CrossRef]
  18. Pella, A.; Riboldi, M.; Tagaste, B.; Bianculli, D.; Desplanques, M.; Fontana, G.; Cerveri, P.; Seregni, M.; Fattori, G.; Orecchia, R.; et al. Commissioning and quality assurance of an integrated system for patient positioning and setup verification in particle therapy. Technol. Cancer Res. Treat. 2014, 13, 303–314. [Google Scholar] [CrossRef]
  19. Desplanques, M.; Tagaste, B.; Fontana, G.; Pella, A.; Riboldi, M.; Fattori, G.; Donno, A. A comparative study between the imaging system the optical tracking system in proton therapy at, C.N.A.O. J. Radiat. Res. 2013, 54 (Suppl. 1), i129–i135. [Google Scholar] [CrossRef]
  20. Fattori, G.; Riboldi, M.; Pella, A.; Peroni, M.; Cerveri, P.; Desplanques, M.; Fontana, G.; Tagaste, B.; Valvo, F.; Orecchia, R.; et al. Image guided particle therapy in CNAO room 2: Implementation and clinical validation. Phys. Med. 2015, 31, 9–15. [Google Scholar] [CrossRef] [PubMed]
  21. Ciocca, M.; Mirandola, A.; Molinelli, S.; Russo, S.; Mastella, E.; Vai, A.; Mairani, A.; Magro, G.; Pella, A.; Donetti, M.; et al. Commissioning of the 4-D treatment delivery system for organ motion management in synchrotron-based scanning ion beams. Phys. Med. 2016, 32, 1667–1671. [Google Scholar] [CrossRef]
Figure 1. Workflow followed to derive a normalized norm of the adjusted correction vector for the j-th treatment fraction of one patient. Abbreviations. f: number of fractions. Fj: j-th fraction. N: |V′| normalized with respect to |V|. P: patient. Vj: current correction vector. Vj: adjusted correction vector of j-th fraction. |…|: Euclidean norm.
Applsci 14 04658 g001
Figure 2. Rotational and translational positioning error components for two representative patients, namely, P8 (a) and P24 (b) (cfr Table 1), across all treatment fractions. Both were 17 yo, treated for extra-cranial tumors, not in narcosis. NB The bottom and the top of each box represent the 25th and 75th percentiles of the samples, respectively. Their distance is the interquartile range. The red line inside the box is the sample median (skewness for the cases in which the red line is not centered inside the box). Black horizontal lines below and above the boxes are non-outlier minimum and maximum, respectively. Red crosses above maxima or below minima are outliers.
Applsci 14 04658 g002aApplsci 14 04658 g002b
Figure 3. Normalized norms (N) for all patients and fractions—full range (a), range 0–1 (b) and range > 1 (c). Color dots represent the values corresponding to the different patients’ fractions.
Applsci 14 04658 g003aApplsci 14 04658 g003b
Figure 4. Average normalized norms (Nave) across patients for all treatment fractions. Pre-correction is successful for all points below dotted line Nave = 1. In (a) all coordinates (rotational and translational) have been adjusted; in (b), translational coordinates only were corrected; in (c), rotational coordinates only were corrected. X, y and z are the translational components of the correction vector, while roll (R), pitch (P) and yaw (Y) are the rotational components.
Applsci 14 04658 g004
Table 1. Mean (M) and standard deviation (SD) of coordinates of correction vectors across fractions for each patient (P). Rotations (pitch, roll, yaw) are expressed in degrees (deg), and translations (x, y, z) in millimeters (mm). Rotations higher than 1 deg and translations higher than 4 mm are highlighted in bold. The average of the absolute value of the single coordinates for all patients is also reported.
PRAgeSNPitchRollYawXYZ
MSDMSDMSDMSDMSDMSD
1219EC-−0.480.320.280.880.240.73−3.772.494.733.49−1.391.48
229C-−0.350.470.270.760.080.55−2.930.96−0.500.591.340.61
31–34C-−1.540.66−1.320.46−0.400.380.320.640.520.70−2.821.33
41–323C-1.070.940.510.500.890.540.240.973.700.73−4.750.49
51–313C-−0.361.27−0.821.240.230.510.392.01−0.331.86−0.851.55
61–318C-0.090.340.680.470.190.341.360.721.530.95−3.410.27
71–312C-0.201.08−0.110.55−0.160.47−1.311.37−1.050.94−3.980.45
8217EC-−1.221.05−0.260.69−0.030.73−4.193.0210.904.61−4.844.03
91–315C-0.360.630.330.480.090.301.491.562.642.00−3.360.93
1022ECY−0.190.490.050.390.280.43−2.801.332.262.12−2.810.86
111–324C-−0.460.650.220.550.480.581.120.690.200.49−3.601.61
121–328C-−0.240.570.250.320.480.280.890.940.170.69−3.660.93
131–313C-−1.230.86−1.670.530.680.65−0.461.30−2.580.78−5.500.45
1422ECY−1.290.82−0.150.59−0.320.61−2.701.242.471.67−4.011.69
15214C-0.070.590.090.580.080.46−1.781.35−0.731.211.541.05
161–38C-0.230.360.270.460.490.321.521.030.910.79−4.311.23
171–313C-−1.170.730.070.18−0.500.54−0.740.570.141.10−4.190.31
181–32CY0.140.300.400.420.180.40−0.541.540.951.30−3.133.37
191–37CY1.520.85−0.620.750.340.461.210.782.011.41−3.601.53
201–316C-−0.280.660.050.550.160.440.581.050.751.39−3.430.46
211–38C-0.910.581.090.391.250.401.860.541.661.06−5.090.31
221–322C-0.530.580.280.43−0.320.290.132.572.571.93−3.930.89
2323ECY−0.430.74−0.410.91−0.100.56−2.581.260.212.79−3.191.35
24217EC-−0.820.66−0.510.66−0.340.60−4.611.895.517.41−5.962.07
251–314C-0.440.720.500.400.560.410.661.371.111.29−2.490.57
261–322C-0.140.260.240.310.860.22−0.790.652.060.85−2.290.22
271–316C-−0.270.380.270.400.130.24−0.121.25−1.220.92−2.400.66
28215EC-−0.610.69−0.441.000.071.050.171.552.472.70−3.991.31
291–314C-0.030.82−0.560.83−0.030.303.181.881.363.10−1.601.16
30214EC-−0.080.660.050.400.370.74−2.721.140.802.64−1.000.95
311–38C-−0.140.190.320.160.500.221.060.362.310.70−1.440.33
321–311C-0.040.380.210.270.540.190.770.330.920.81−4.500.26
MA 0.530.630.420.550.360.471.531.261.911.723.261.08
Abbreviations. R: room (1–3: Room 1 or Room 3, i.e., lateral rooms; 2: Room 2, i.e., central). C: cranial. EC: extracranial. M: mean. MA: mean of abs. N: narcosis. P: patient. S: site of lesion. SD: standard deviation. Y: yes.
Disclaimer/Publisher’s Note: The statements, opinions and data contained in all publications are solely those of the individual author(s) and contributor(s) and not of MDPI and/or the editor(s). MDPI and/or the editor(s) disclaim responsibility for any injury to people or property resulting from any ideas, methods, instructions or products referred to in the content.

