Abstract
Improving energy efficiency in manufacturing processes is a critical global concern for the industry. Manufacturers strive to enhance energy efficiency across all manufacturing operations to remain competitive globally, aiming to reduce production times without compromising product quality. While there has been significant research characterizing energy efficiency and surface roughness in conventional processes like turning or milling, studies on unconventional manufacturing techniques are limited. This study focuses on optimizing a wire electrical discharge machining (WEDM) process to minimize energy consumption while maintaining surface roughness. Various cutting parameters, such as pulse on-time, pulse off-time, servo voltage, wire tension, wire speed, and wire voltage, were evaluated. Experiments were conducted using Taguchi’s methodology with a orthogonal array, employing AISI D2 steel plates of 19 mm and 25 mm thickness as the machining material. The research identified that optimal parameters for reducing energy consumption and improving surface roughness included a pulse on-time of 10 s, pulse off-time of 11 s, servo voltage of 44 V, wire tension of 50 g-force, wire speed of 7 m per minute, and wire voltage of 9 volts. This combination led to an 8% reduction in energy consumption and a 1% enhancement in surface roughness compared to baseline values.
1. Introduction
Nowadays, wire electrical discharge machining (WEDM) has become a dominating non-conventional machining process in the field of manufacturing industries [1]. WEDM is one of the most popular non-traditional machining processes capable of machining difficult-to-machine materials of complex shapes [2]. It has been successfully applied to thin-walled components in the manufacture of aerospace manufacturing and medical devices. Its advantages include non-contact machining, non-macro cutting force, and the ability to machine high-hardness materials and geometries with high precision [3]. WEDM is considered a unique adaptation of the conventional EDM process, which uses an electrode to initialize the sparking process. However, WEDM uses a wire which is consumed continuously. This electrode can be thin copper, brass, or tungsten, with diameter sizes from 0.05 to 0.3 mm. The use of a wire allows this machining process to achieve minimal corner radii. The wire is kept in tension using a mechanical tensioning device, reducing the possibility of producing faulty parts [4]. During the WEDM process, the material is eroded ahead of the wire with no direct contact between the workpiece and the wire, eliminating mechanical tensions and vibrations during machining. Moreover, the WEDM process can handle machining materials of high strength and hardness [5].
Electrical Discharge Machining (EDM) processes are considered to require at least 1000 times more energy than conventional machining processes. This is due to the low material removal rates [6]. The rate of energy consumption in WEDM may vary depending on the construction of the machine and the machining parameters used during cutting. Supply power ranges from 5 to 8 kW for some machines when machining steel AISI P20 [7]. Very few works like [8,9,10] investigate the influence of process parameters in the energy efficiency of EDM.
Despite being an energy-intensive process, almost no research has been carried out regarding the total energy consumption of WEDM and how the different machining parameters affect it. The authors in [11,12] provide an extensive account of research conducted on WEDM. However, they do not report any work related to the use of the total energy consumption of the process as a response to being analyzed and optimized. This is surprising since electric discharge machining processes have been criticized for their high energy consumption [8].
In this work, we analyze the total energy consumption in WEDM and the surface roughness for two plate thicknesses, 19 mm and 25 mm, of AISI D2 steel. The experiments were performed on a Sodick VZ300L machine. A Taguchi orthogonal array was used to evaluate the influence that cutting parameters, namely, pulse on-time, pulse off-time, servo voltage, wire tension, wire speed, and voltage, have on the process. In addition to the energy consumption, the average roughness of the machined surface was used as a response to account for the quality of the machined part. A Taguchi “smaller-the-better” analysis [13] was used to find the optimal cutting parameters to reduce energy consumption and improve surface roughness.
2. Literature Review
Rubi et al. [12] provides a comprehensive review on wire electrical discharge machining. Their work examines the wide range of investigations that have been conducted, from WEDM through the EDM process’ spin-offs. It describes a WEDM investigation that requires variables’ optimization and an assessment of the many influences on machining efficiency and accuracy.
Many researchers have employed designed experiments to analyze and optimize process characteristics in wire electrical discharge machining (WEDM). Previous works have utilized full factorial, fractional factorial, response surface methods, and Taguchi designs to optimize responses like surface roughness or material removal rate. Some authors have also utilized artificial neural networks or genetic algorithms for similar optimization tasks. Table 1 presents a compilation of prior studies related to this topic, highlighting the optimization methods used, the control factors examined, and the responses targeted in each study.

Table 1.
Summary of methods for optimization, control factors, and responses used by selected authors to study WEDM processes.
The table clearly shows that Taguchi methods are widely used for identifying optimal parameter sets to optimize a desired response. The primary control variables chosen by researchers typically involve pulse on-time, pulse off-time, and wire speed. Surface roughness and material removal rate are the main responses of interest in most studies; however, the energy consumption aspect of the process is often overlooked or insufficiently explored.
In a recent work, Gupta et al. [14] used a fractional factorial experiment with pulse on-time, pulse off-time, spark voltage, peak current, wire speed, and workpiece thickness as control factors to study WEDM. The authors selected as responses the cutting rate, surface roughness, wire electrode temperature, and material removal rate to assess the best process values to machine armor steel. The modified crow search algorithm (MCSA) was used in that study for single- and multi-objective optimizations. Their research revealed that the pulse on-time and workpiece thickness had the most significant contributions to the cutting rate and surface roughness, and that pulse off-time and spark voltage were the major contributors to the wire electrode temperature.
Selvam et al. [15] investigated the impact of machining parameters on material removal rate in wire electrical discharge machining of MONEL 400 K. They identified wire feed, pulse on-time, and pulse off-time as key influential factors affecting MRR. The study revealed that increasing pulse off-time enhanced material removal rate while simultaneously reducing surface roughness, indicating effective material flushing and achieving high-quality machining outcomes. Additionally, the research emphasized the novelty of the parametric evaluation in the WEDM of MONEL 400 K and highlighted the effectiveness of the response surface methodology for optimizing material removal rate.
In the study conducted by Sadhana et al. [16], the focus was on optimizing wire electrical discharge machining (WEDM) parameters for machining AISI H13 tool steel. The study examined gap voltage, pulse on-time, pulse off-time, and wire feed as key factors, aiming to maximize material removal rate and minimize surface roughness. The research identified the gap voltage as the most influential factor impacting both material removal rate and surface roughness in the WEDM of AISI H13 tool steel.
In their investigation [17], Chary et al. explored optimization techniques for the wire electrical discharge machining (WEDM) of dual-phase steel (DP980) using a brass wire. The study focused on improving machining performance by varying process parameters such as pulse on-time, pulse off-time, and voltage. The authors identified that the interaction between voltage and pulse off-time significantly affected surface roughness, while pulse on-time emerges as the most influential factor impacting material removal rate in the WEDM of DP980 steel.
In their study [18], Paturi et al. used an orthogonal array to train an artificial neural network (ANN) for modeling and predicting surface roughness in the wire electrical discharge machining (WEDM) of Inconel 718. They demonstrated the effectiveness of the ANN in predicting output values. The ANN model utilized a multilayer perceptron with back-propagation (BPNN), and the dataset was divided into distinct groups for training, testing, and validation purposes.
Saif et al. [19] investigated the impact of wire electrical discharge machining parameters on surface roughness and material removal rate for aluminum alloys AA 6061 and AA 5083 using a single-objective optimization approach. The primary variables studied were pulse on-time, pulse off-time, and peak current. The results showed that for AA 6061, surface roughness was mainly affected by pulse on-time and pulse off-time, while for AA 5083, pulse off-time and peak current were significant factors influencing surface quality.
In the research conducted by Naik et al. [20], the study explored the effects of different machining parameters on surface roughness in the Wire Electrical Discharge Texturing (WEDT) of INCONEL 718 super alloy. The investigated parameters included rotational speed, pulse on-time, pulse off-time, servo voltage, wire feed rate, and flushing pressure. It was found that pulse on-time had a significant impact on the surface roughness of INCONEL 718 alloy during WEDT, where higher pulse on-times were associated with increased surface roughness.
Kumar et al. [21] focused on optimizing process parameters for D2 steel machining using WEDM. Wire speed, gap voltage, flushing pressure, and current were analyzed for their impact on surface roughness and material removal rate. Results indicated that MRR was predominantly influenced by current, with flushing pressure having the least impact, while surface roughness was most affected by wire speed and least affected by gap voltage during the WEDM process on D2 steel workpieces.
In the study by Kumar et al. [22], the focus was on a multi-objective optimization of the wire electrical discharge machining of Stellite to enhance surface roughness, material removal rate, and overcut. The Taguchi–Grey approach and single-objective optimization techniques were employed to analyze the effects of pulse on-time, pulse off-time, and wire tension at different levels. The authors highlighted that pulse on-time was the key variable influencing changes in all three responses (surface roughness, material removal rate, and overcut) in the WEDM of Stellite.
In the study by Manikandan et al. [23], the wire electrical discharge machining of Inconel 625 was investigated with a focus on optimizing process parameters including pulse on-time, pulse off-time, and peak current. The desired performance measures considered were material removal rate and overcut. The analysis showed that increasing all three parameters (pulse on-time, pulse off-time, and peak current) led to improved material removal rate. For minimizing the overcut, the optimal combination involved a high value for pulse on-time and low values for pulse off-time and peak current.
The aim of the study by Ramaswamy et al. [24] was to determine the optimal values of current, pulse on-time, pulse off-time, wire tension, and wire feed to achieve specific goals: minimizing surface roughness and wire consumption rate while maximizing material removal rate in wire electrical discharge machining. The findings showed that wire tension, current, and their interactions significantly influenced surface roughness, while pulse on-time and current had notable effects on material removal rate. Additionally, wire feed and the interaction between current and pulse off-time were found to significantly impact wire consumption rate. Ultimately, a desirability function approach was employed to optimize the process parameters and achieve the desired surface roughness along with a maximum material removal rate and minimum wire consumption rate.
In the study conducted by Muniappan et al. [25], the influence and improvement of machining parameters on cutting speed in wire electrical discharge machining (WEDM) operations were investigated, specifically focusing on a metal matrix composite material. Parameters such as pulse on-time, pulse off-time, gap voltage, wire tension, and wire feed were analyzed. The examination of parameter variations revealed that pulse off-time, gap voltage, pulse on-time, and discharge current significantly impacted WEDM and were identified as the most influential control parameters affecting cutting speed in WEDM.
In their work [26], Babu et al. focused on optimizing material removal rate and surface finish in the wire cut electric discharge machining of Inconel 750, considering four input factors: pulse on-time, pulse off-time, voltage, and current. To achieve optimization, they trained a feedforward artificial neural network model using a Taguchi orthogonal array and then utilized particle swarm optimization to optimize the weighting factors of the network within neural power software, aiming to enhance material removal rate and surface roughness.
In the study by Dayakar et al. [27], a Taguchi optimization method was employed for the wire electrical discharge machining (WEDM) of maraging steel 350, focusing on material removal rate and surface roughness as key output responses. The cutting parameters optimized included pulse on-time, pulse off-time, peak current, and spark gap voltage. Results revealed that surface roughness tended to increase with higher pulse on-time and peak current, while material removal rate was positively affected by increases in pulse on-time, spark gap voltage, and peak current. Notably, peak current emerged as the most influential factor impacting both material removal rate and surface roughness in the WEDM process.
3. Materials and Methods
3.1. Materials
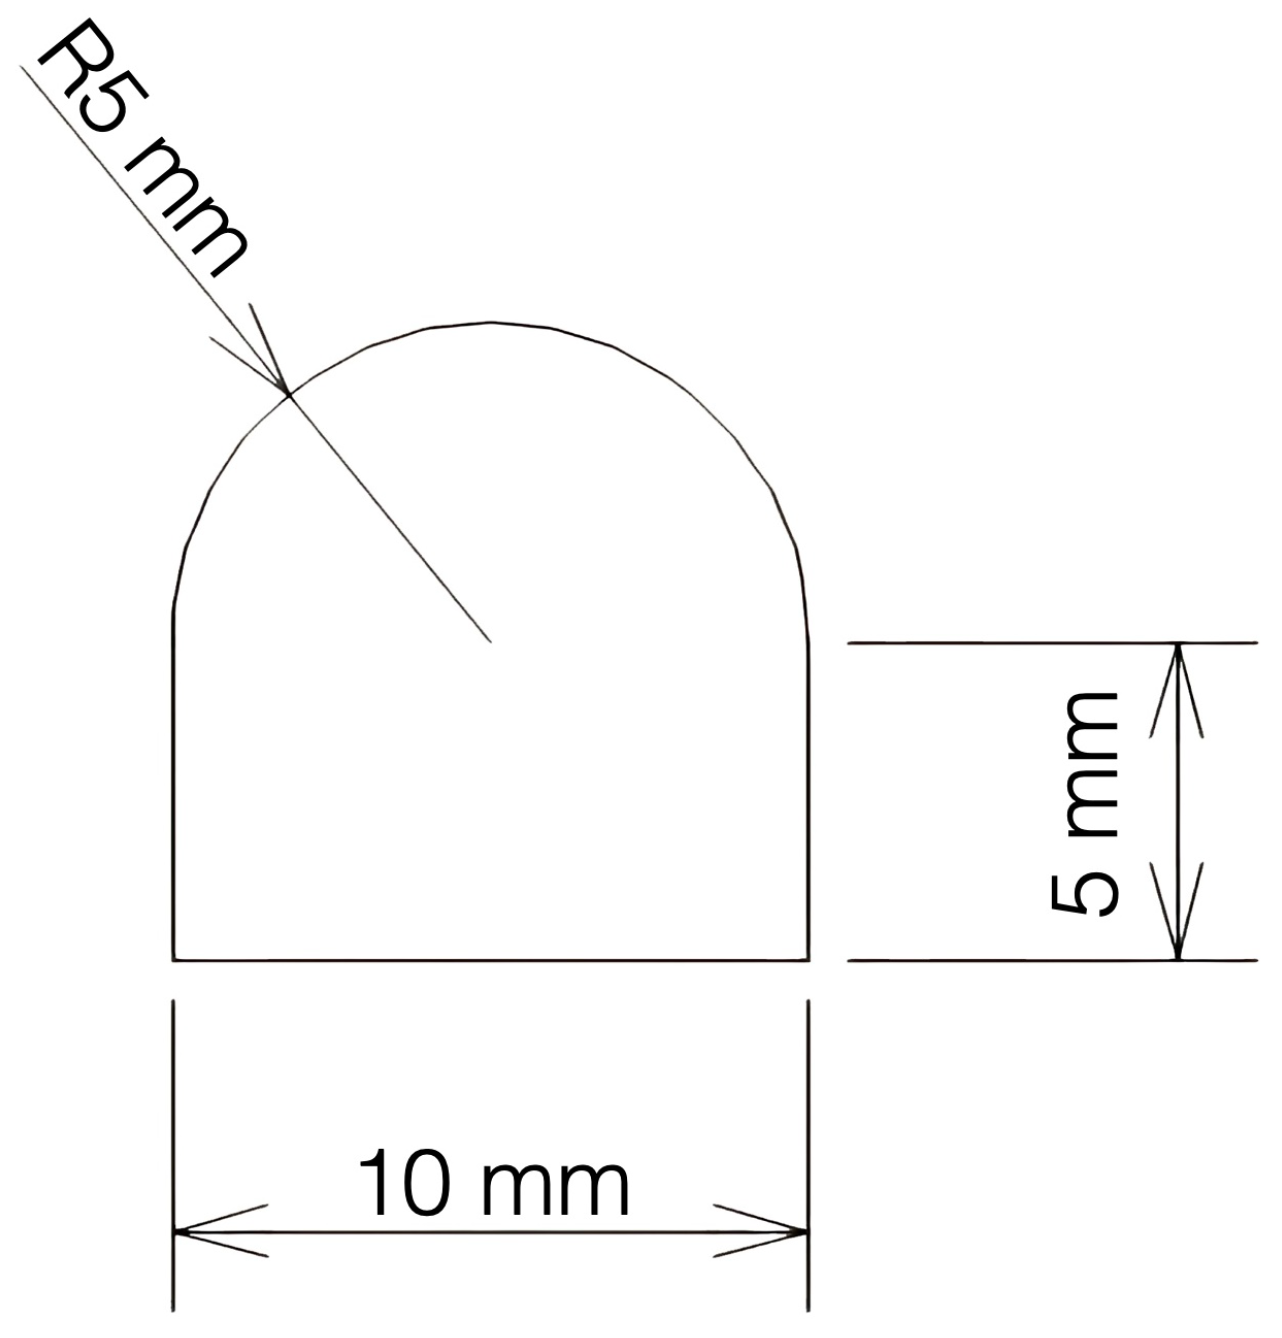
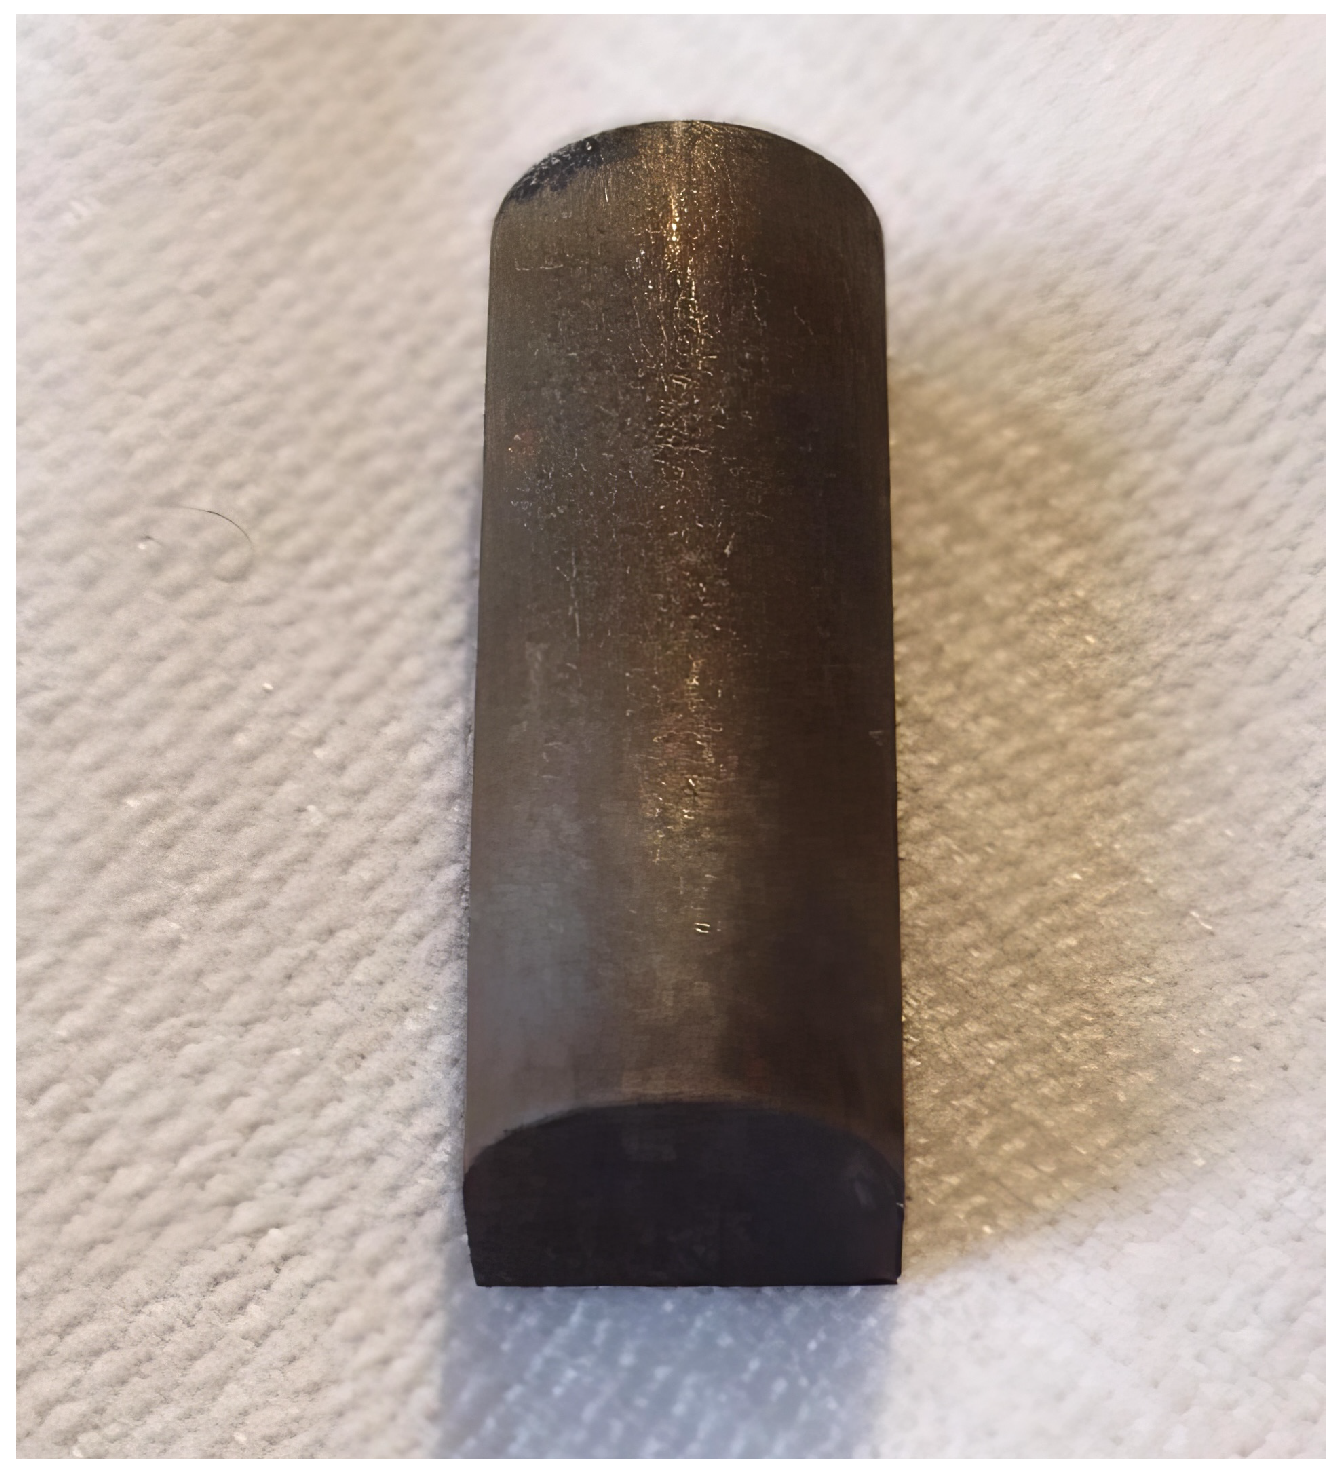
The experimentation was carried out using AISI D2 steel in two different plate thicknesses, 19 mm and 25 mm. The geometry machined is shown in Figure 1. Figure 2 shows one of the machined parts. D2 steel was selected for this study at it is known for its high hardness, wear resistance, and ability to maintain a sharp edge, which are essential characteristics for producing precision dies used in the manufacturing industry. Dies made from D2 steel are fundamental for cutting, stamping, and molding processes, where extreme durability and accuracy are required. WEDM allows for the cutting and shaping of D2 steel with great precision without generating mechanical forces that could deform or damage the piece, thereby ensuring the integrity and functionality of the dies.

Figure 1.
Geometry machined in WEDM.

Figure 2.
Example of machined part.
3.2. Taguchi Methodology
The Taguchi methodology [13] is a statistical approach used in engineering and manufacturing to improve product quality by minimizing variation and deviation from target values. At its core, the methodology focuses on the design of experiments with the aim of making products and processes more robust against variations without significantly increasing costs. The Taguchi method introduces several key concepts to achieve this, notably control factors, noise factors, and the signal-to-noise (S/N) ratio.
Control factors are the variables within a process that can be controlled or adjusted. By adjusting these factors, it is possible to optimize a desired output or performance measure. Noise factors, in contrast, represent environmental, material, and operating conditions that are difficult or impossible to control but can affect the performance or quality of a product. These could include humidity, material quality variations, or differences in how a product is used by customers. Taguchi’s approach designs experiments to vary control and noise factors to observe their effects on the response to identify settings that improve the desired response and minimize the impact of noise.
The signal-to-noise (S/N) ratio is a metric that quantifies how well a product or process performs relative to the variability or “noise” it is exposed to. The S/N ratio helps in identifying the level of control factors that maximize performance stability. Taguchi introduced specific types of S/N ratios for different kinds of objectives, such as the “smaller-the-better” type of response for processes where the goal is to minimize a characteristic, like defects or deviations from a target:
where S/N represents the signal-to-noise ratio for a smaller-the-better type of response, n is the number of observations or trials, and denotes the value of the ith observation.
3.3. Experimentation
Considering previous research reported in Section 2, six control factors were considered for the experiments: pulse on-time (Ton), pulse off-time (Toff), servo voltage (SV), wire tension (WT), wire speed (WS), and voltage (V). The six factors were expected to be able to model the machining process and explain most of the variation in the responses chosen: total energy consumption and surface roughness.
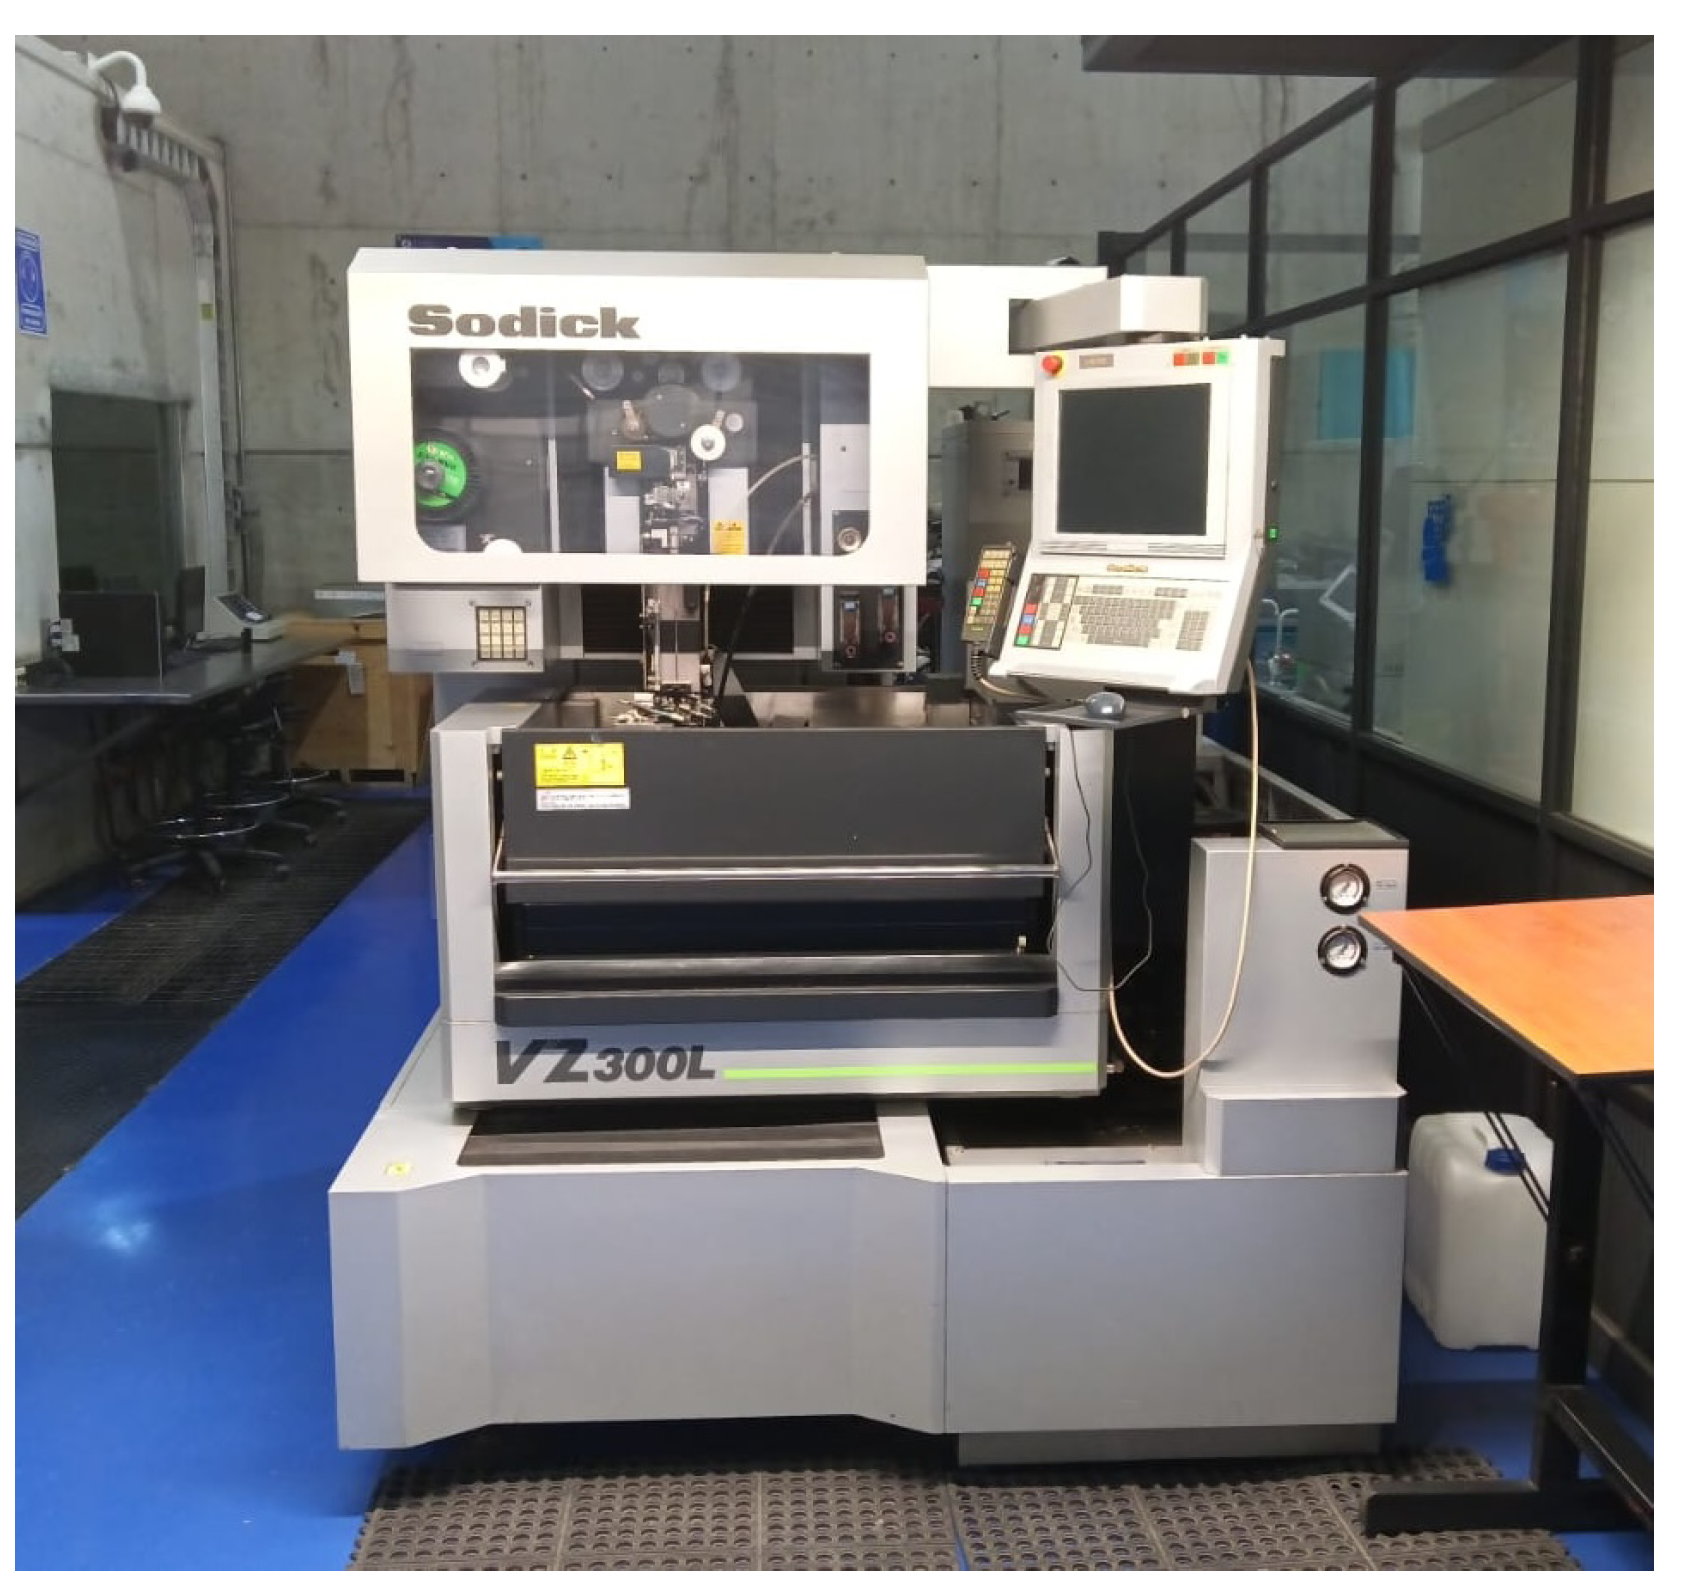
The experiments were performed on a WEDM Zodick VZ 300L machine like the one shown in Figure 3.

Figure 3.
Zodick VZ 300L Wire EDM machine used for the experiments.
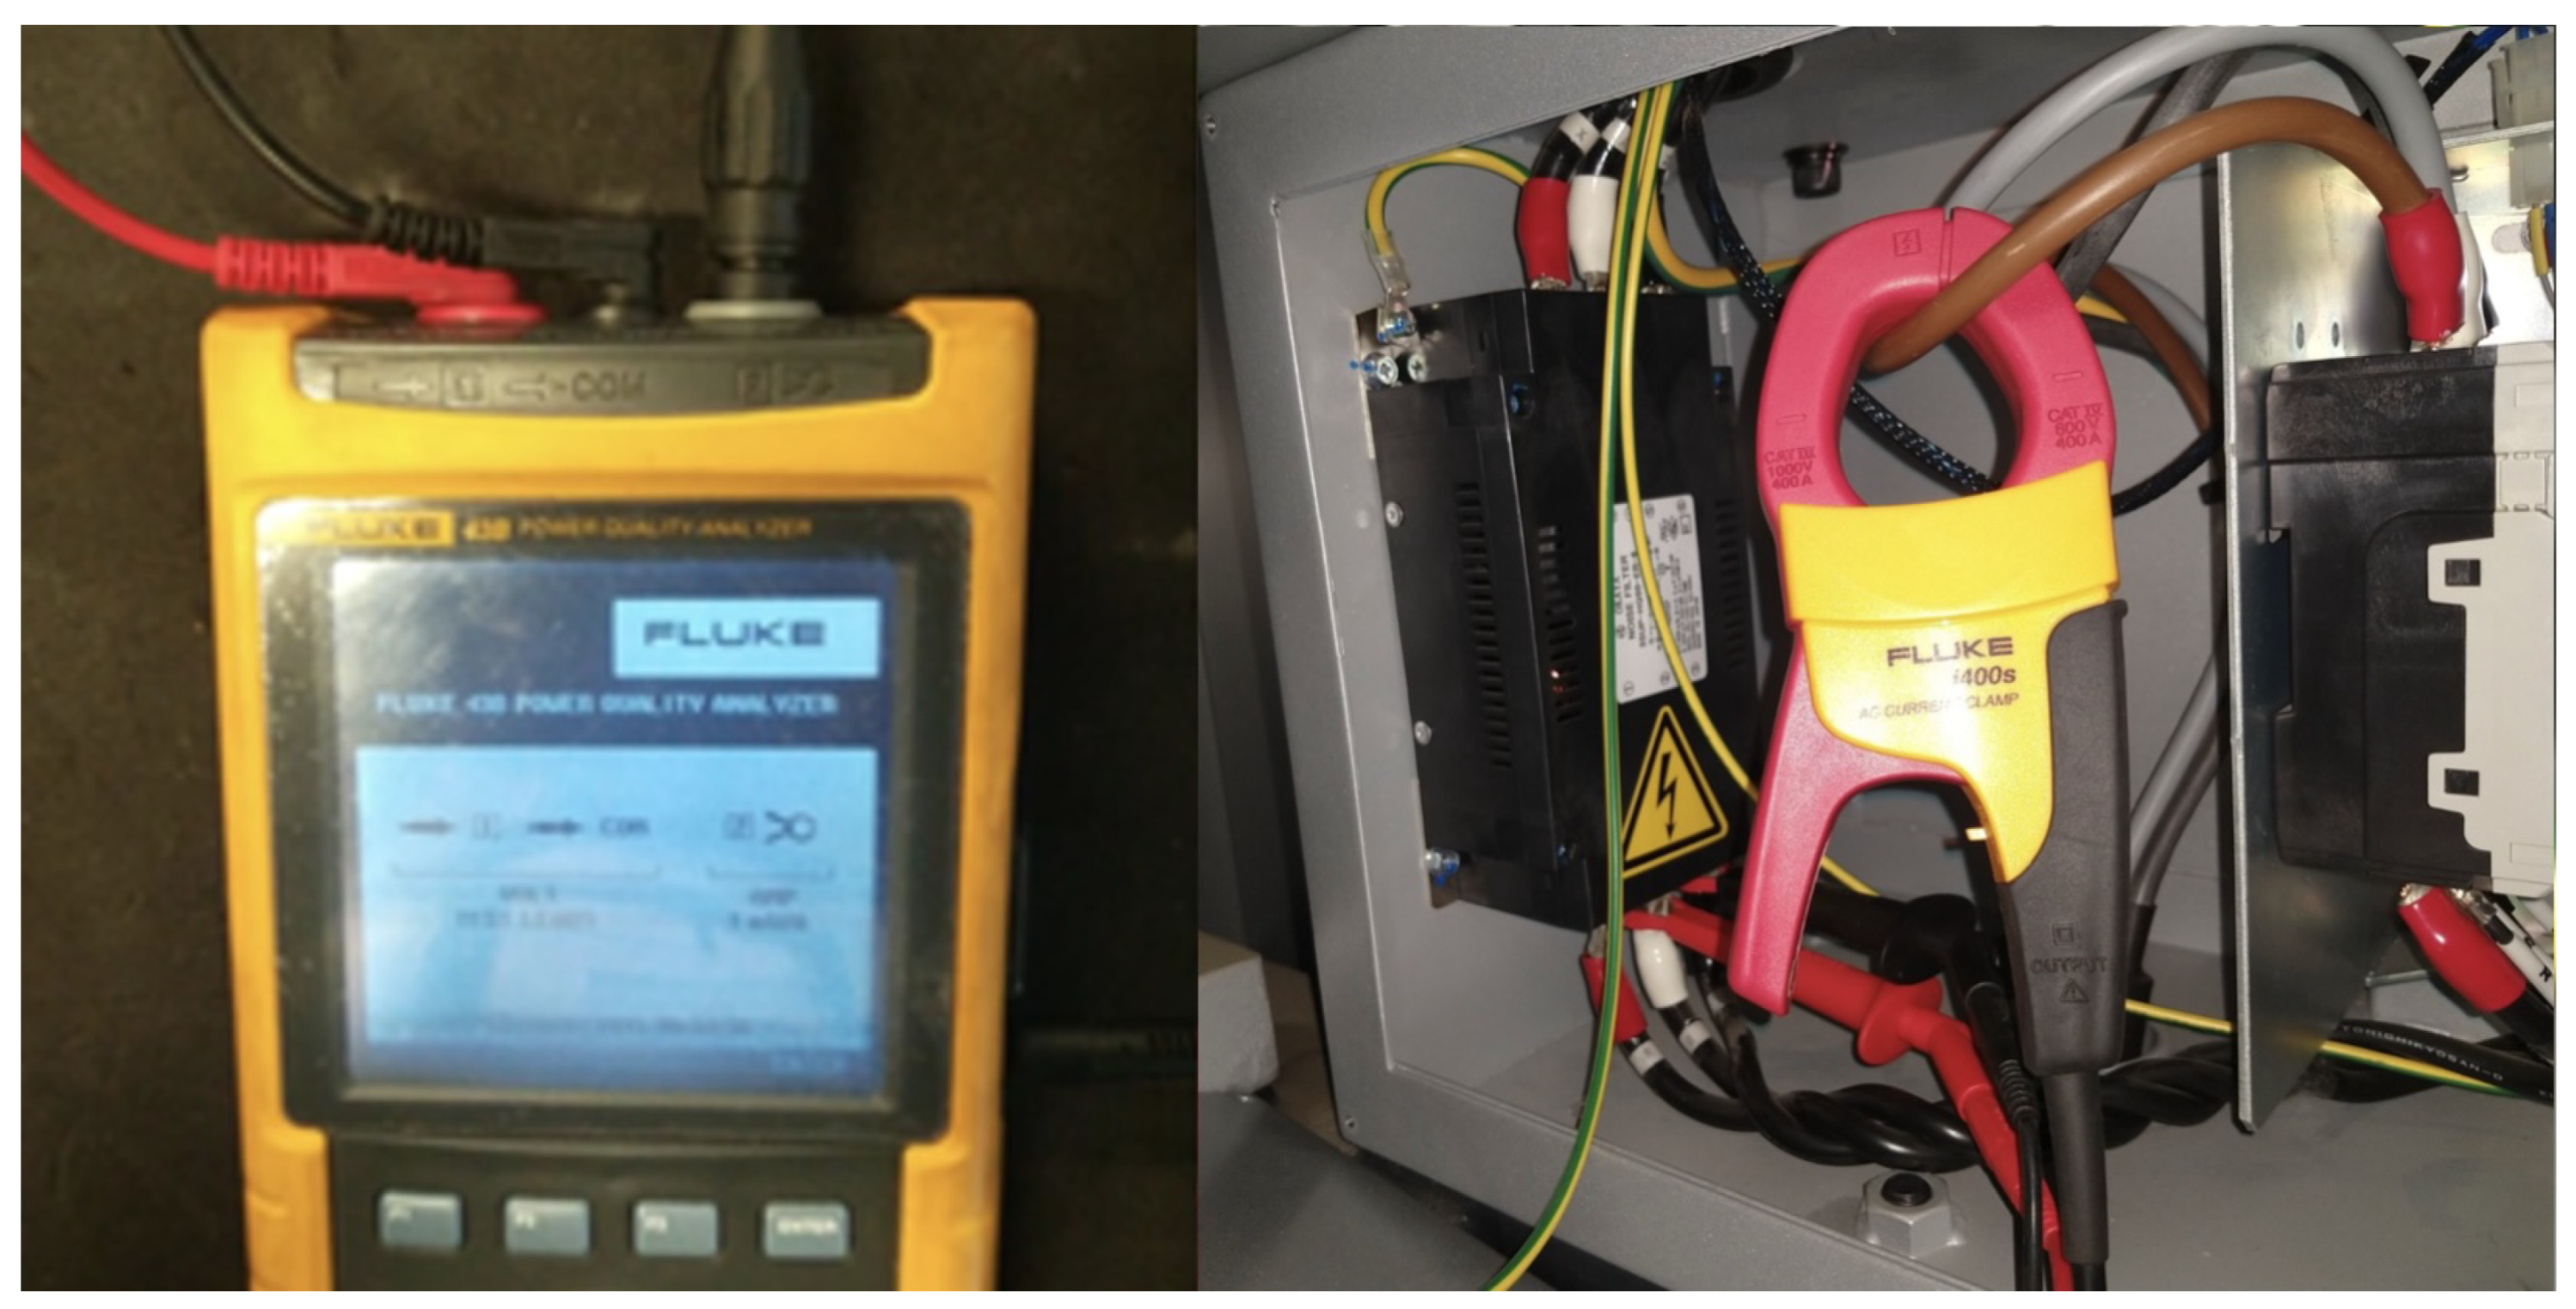
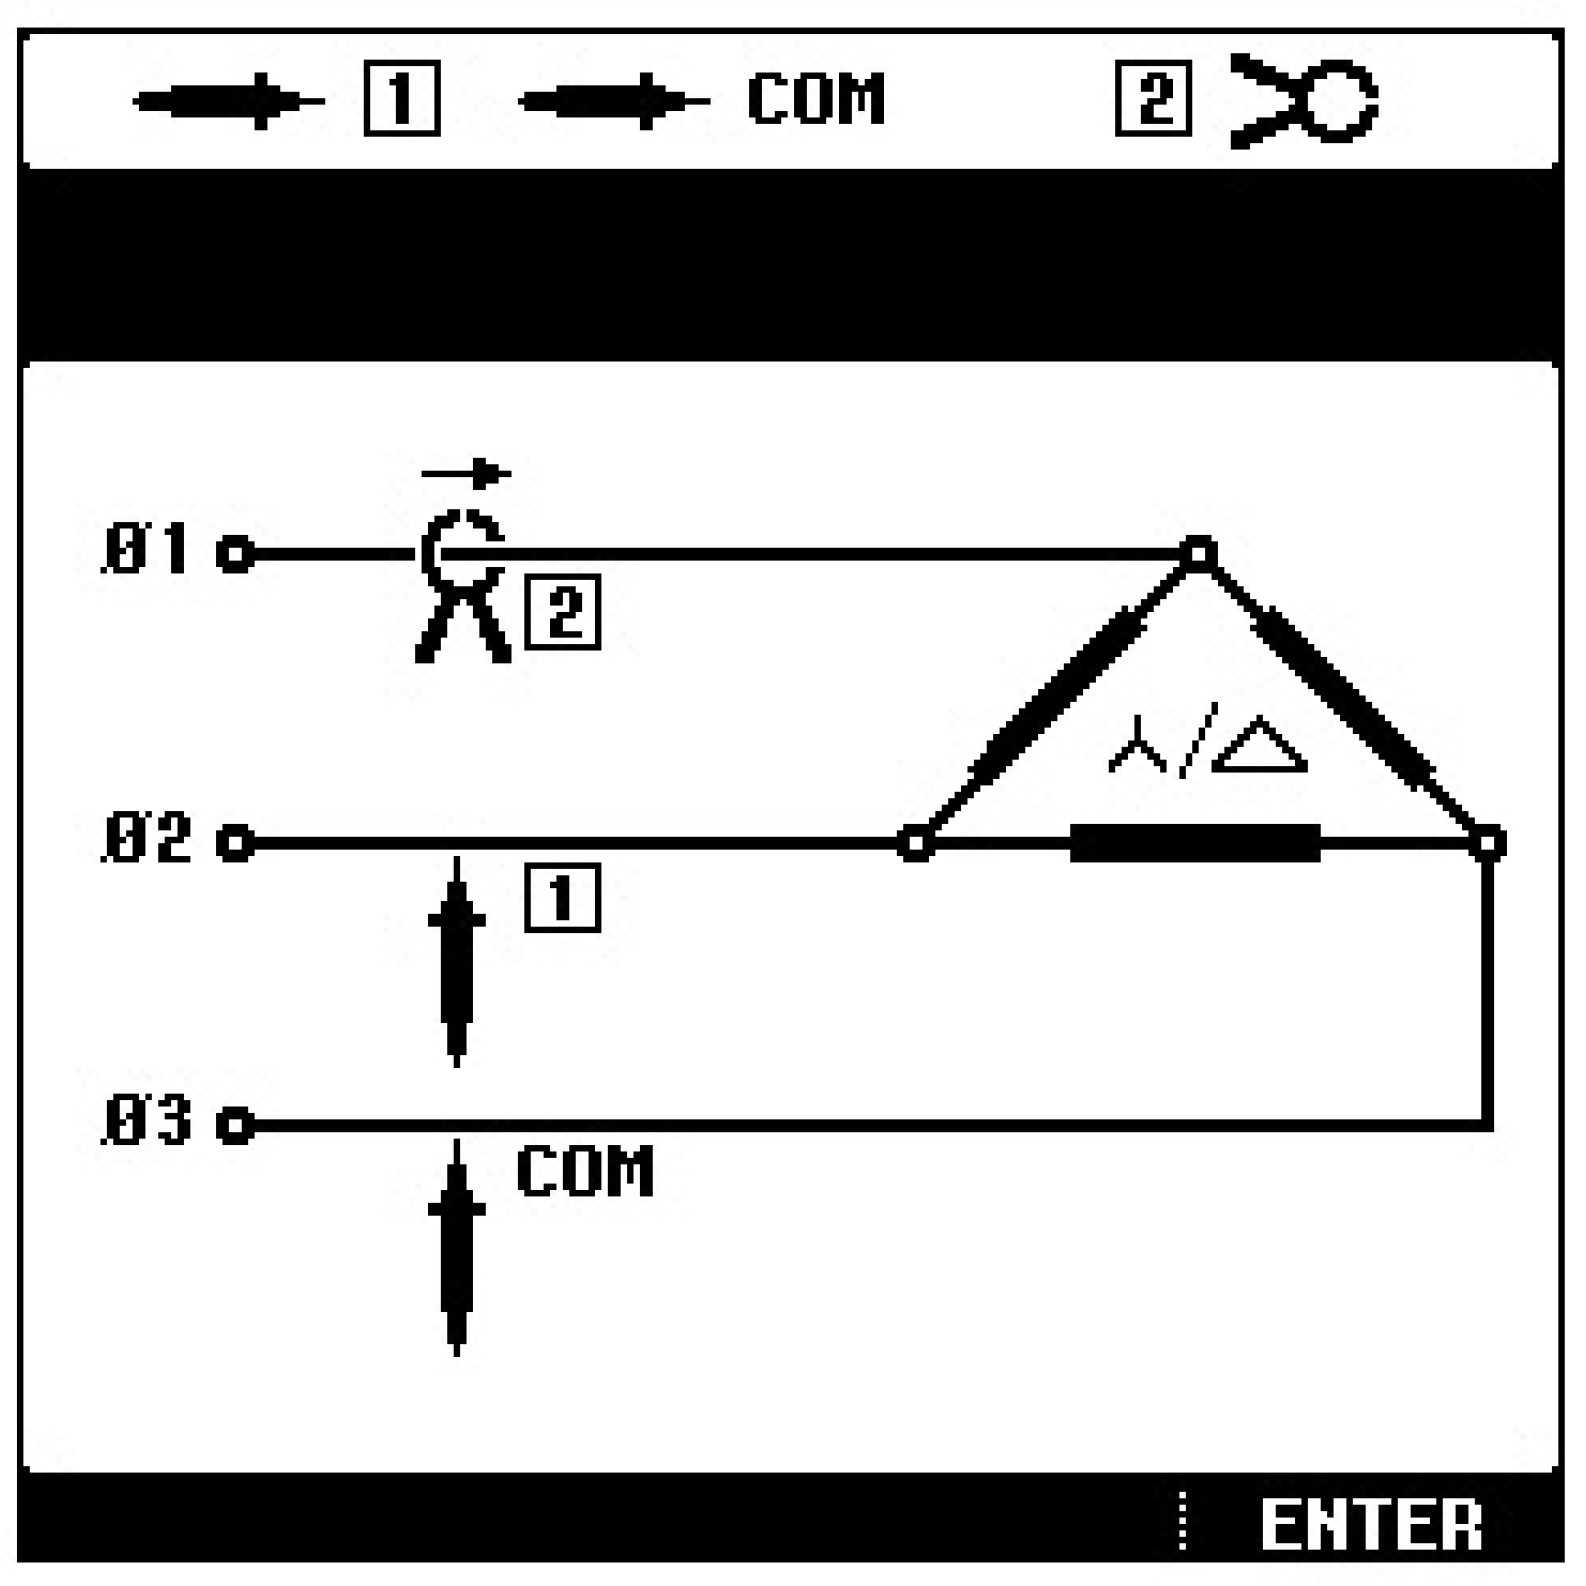
The electrical power was measured by employing a Fluke 43B power analyzer. To know the power measurements during machining, the power analyzer was connected to the main power lines, as shown in Figure 4. This ensured that the measurement contemplated the necessary electrical energy to power the actuators, display, fans, cooling system, and other machine components. Figure 5 shows the electrical connection diagram recommended by Fluke. Surface roughness was calculated with the Mitutoyo SJ-210 roughness meter, with a sampling length of 2.5 mm. The value considered for each sample was based on average measurements taken from the central area of each of the three flat surfaces of the machined pieces.

Figure 4.
Connection of the power analyzer (Fluke 43B) on the main lines of the Zodick VZ300L machine.

Figure 5.
Connection diagram recommended by Fluke to measure the total energy consumption of the machine.
To define an initial or baseline combination of values for the machining process, the values for pulse on-time, pulse off-time, servo voltage, wire tension, wire speed, and voltage shown in Table 2 were taken as a starting point. These values were selected based on pilot experiments and considering the values recommended by the manufacturer of the WEDM machine. This set of values represents a typical selection for machining AISI D2 steel.
Table 2.
Baseline values for the experiment.
The manufacturer’s recommendations and the same experiments used to select the baseline values were used to define the levels 1, 2, and 3 for each factor. The levels are intended to explore the variation in the response around the baseline values without moving too far from the manufacturer’s recommended values to cause excessive wear in the wire or break it. This is especially true for the wire tension and wire speed, whose values were kept well below the maximum allowed by the machine. Table 3 shows the selected levels for each one of the factors.
Table 3.
Factors selected and their levels for the experiment.
Following Taguchi’s methodology, an orthogonal array was employed to analyze the WEDM process. Each of the 27 experiments was conducted with five repetitions for a total of 270 experimental runs: 135 for the 19 mm thick plate and 135 for the 25 mm thick plate.
Other factors were also considered, which were kept constant during the experiments. These factors were a 0.25 mm diameter brass electrode, vertical cutting angle, a peak current of 2215 units, a servo feed of 60 units, 55 units of water pressure, and the use of deionized water as a dielectric fluid. The MAO, the machine setting that controls the sensitivity level and the amount of adjustment to the “On” and “Off” times, was set to 250.
4. Results
4.1. Results to Minimize Surface Roughness
The results shown in Table 4 were obtained from the measurements taken for each of the 19 mm and 25 mm specimens to know their surface roughness. The two different thicknesses were considered noise factors, implying that the process had to be as insensitive as possible to the thickness of the plate being machined. Together with the mean, the table shows the signal-to-noise ratio (S/N) using a smaller-the-better quality response. A high S/N ratio represents an experiment where the combination of factors and levels provides a more robust response, meaning that the surface roughness changes less from one replicate to the next. A low mean represents a less coarse, better surface roughness.
Table 4.
Experimental results for the surface roughness.
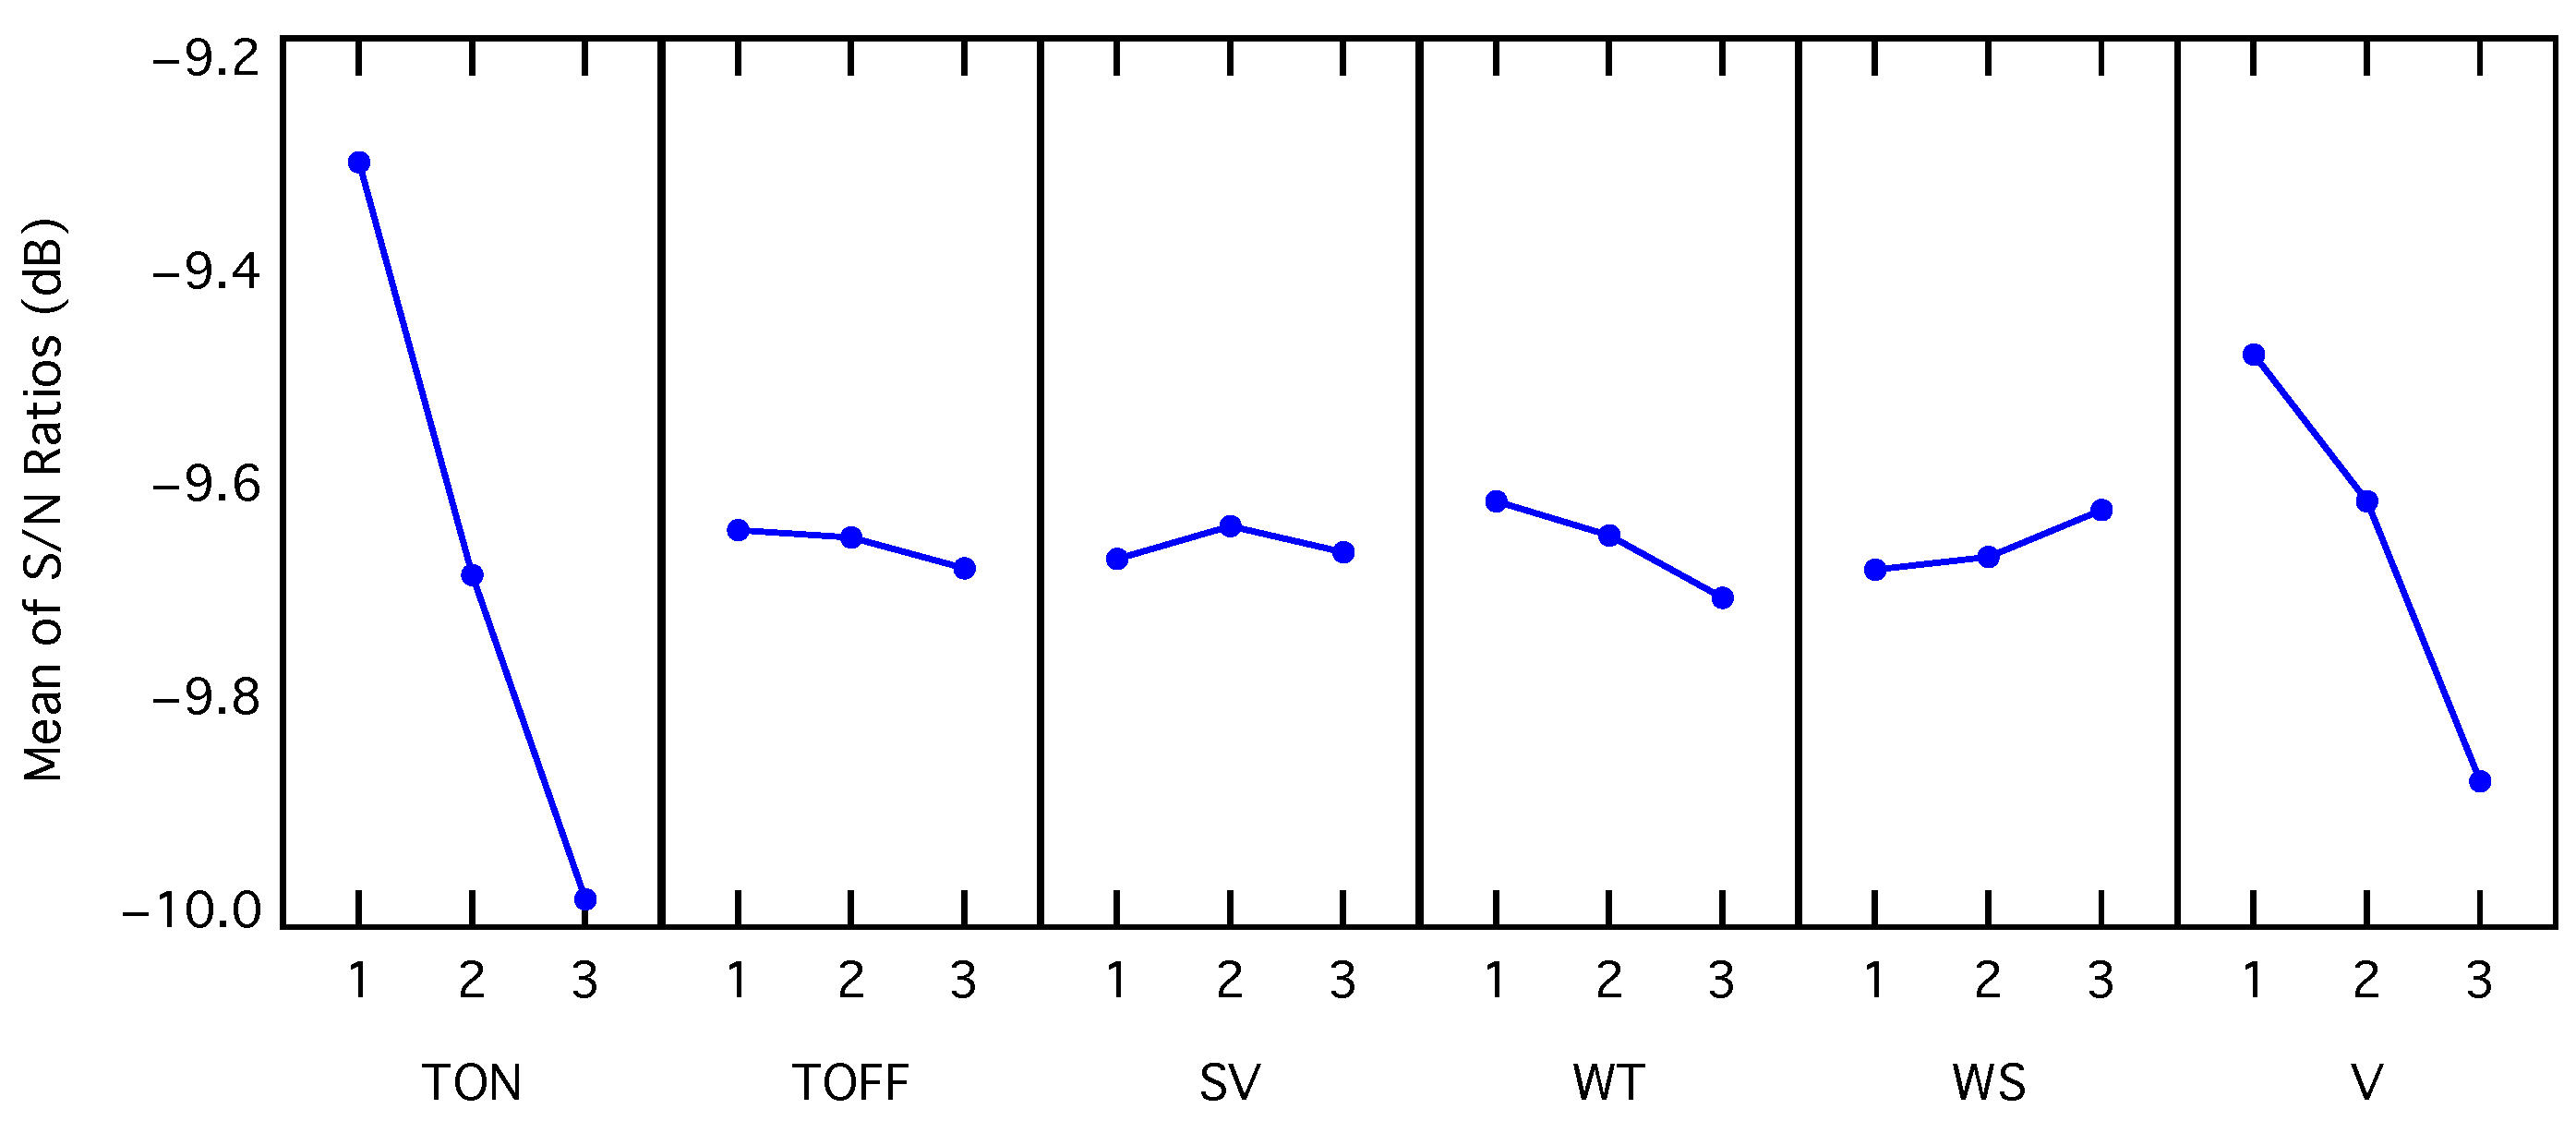
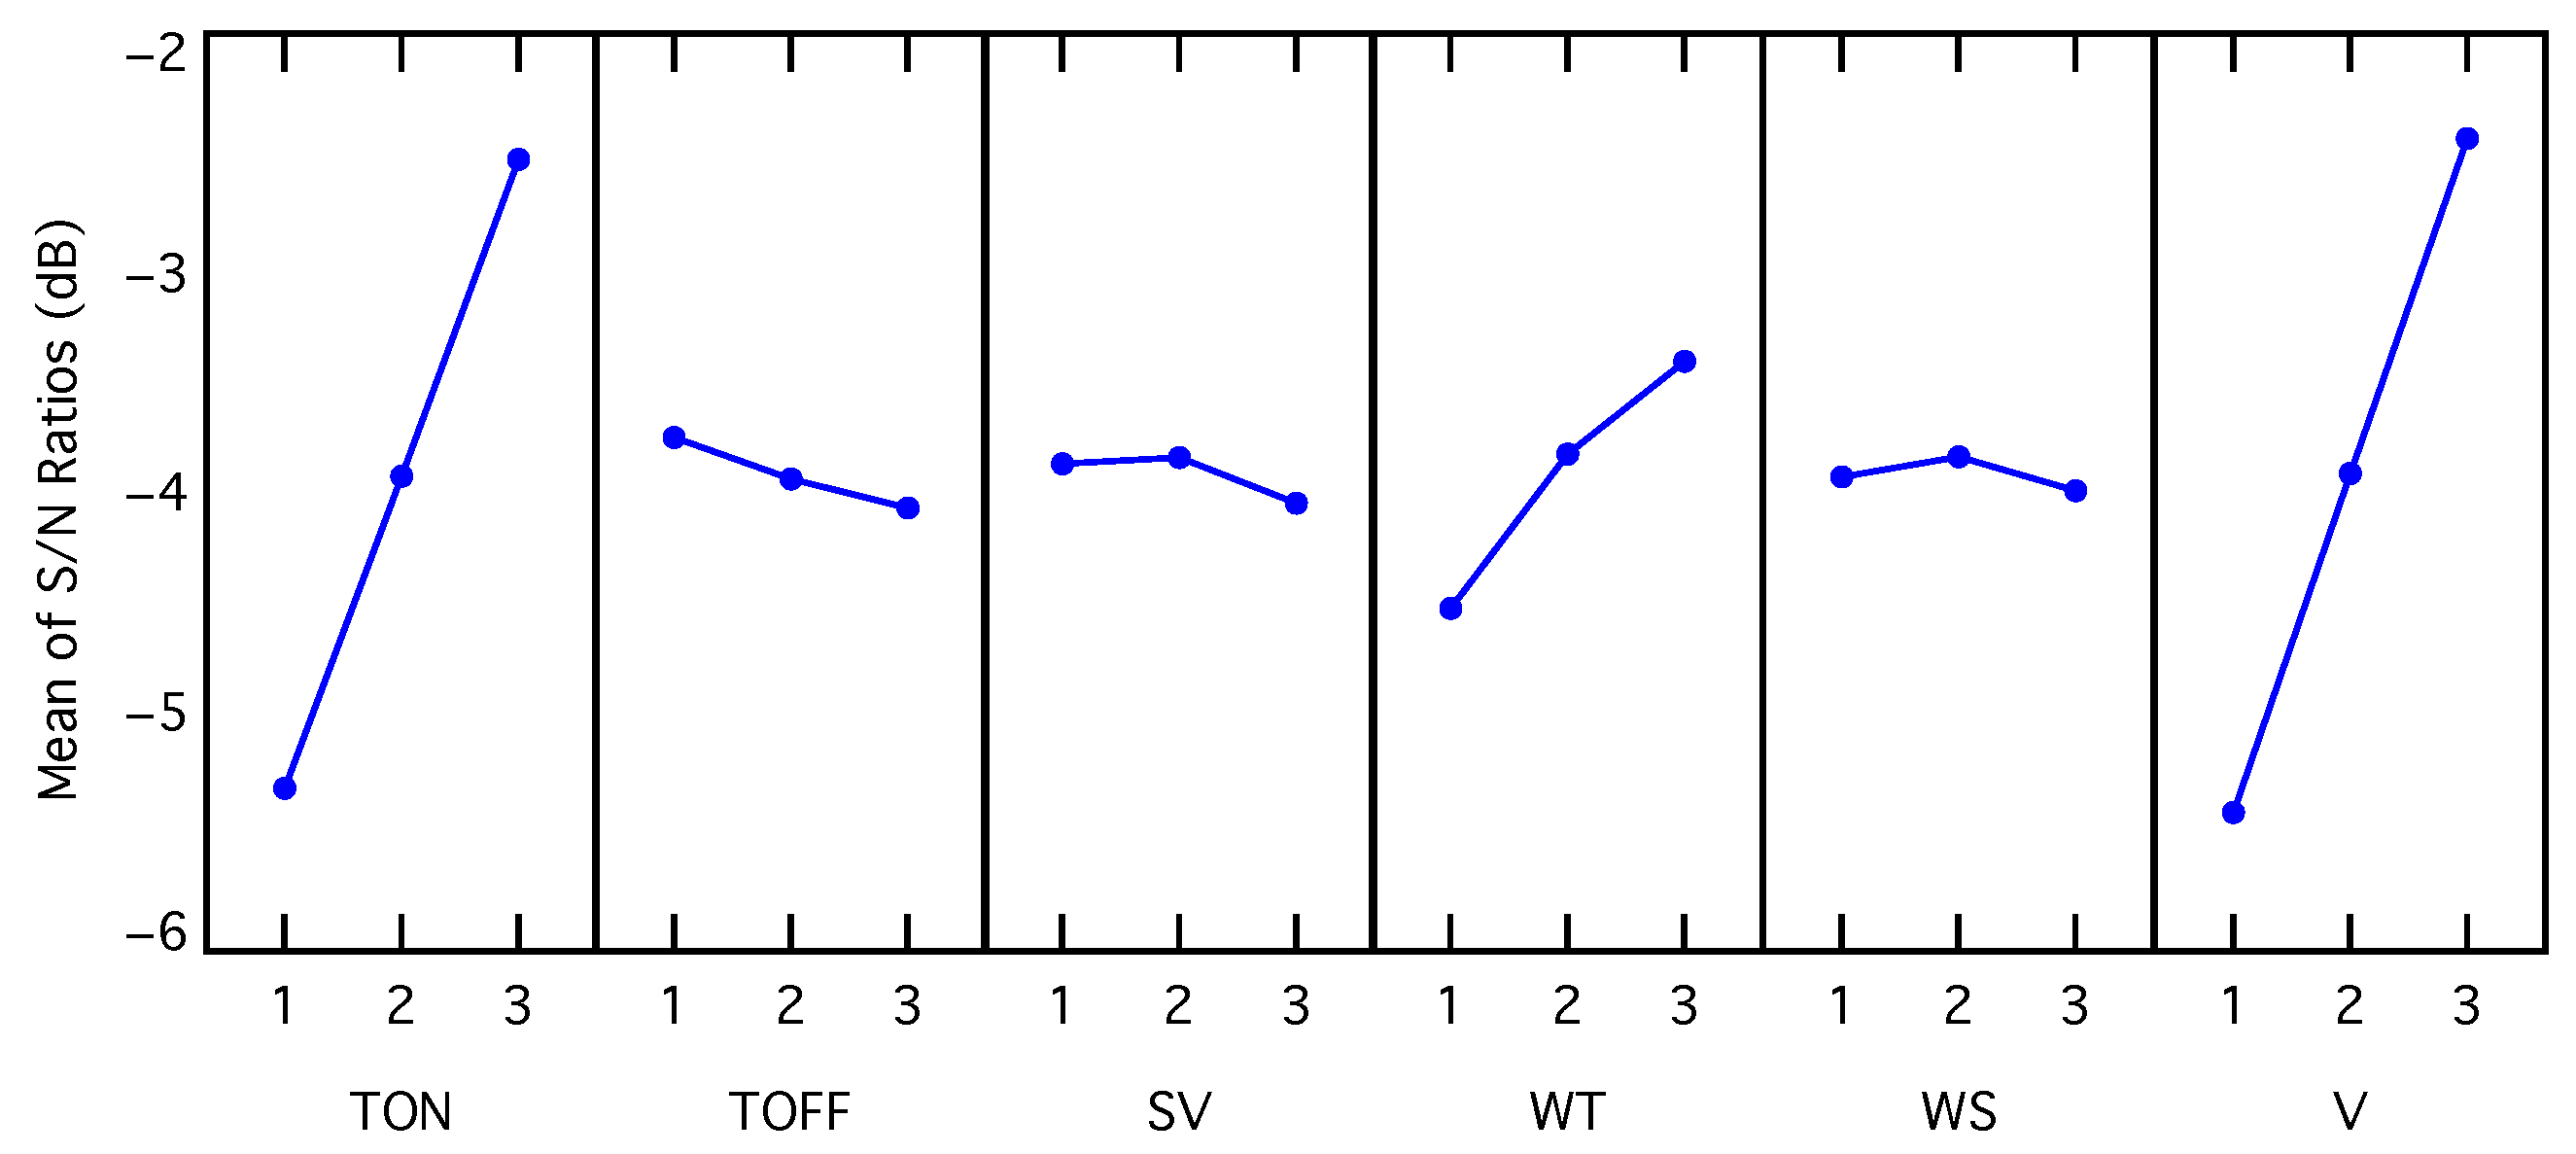
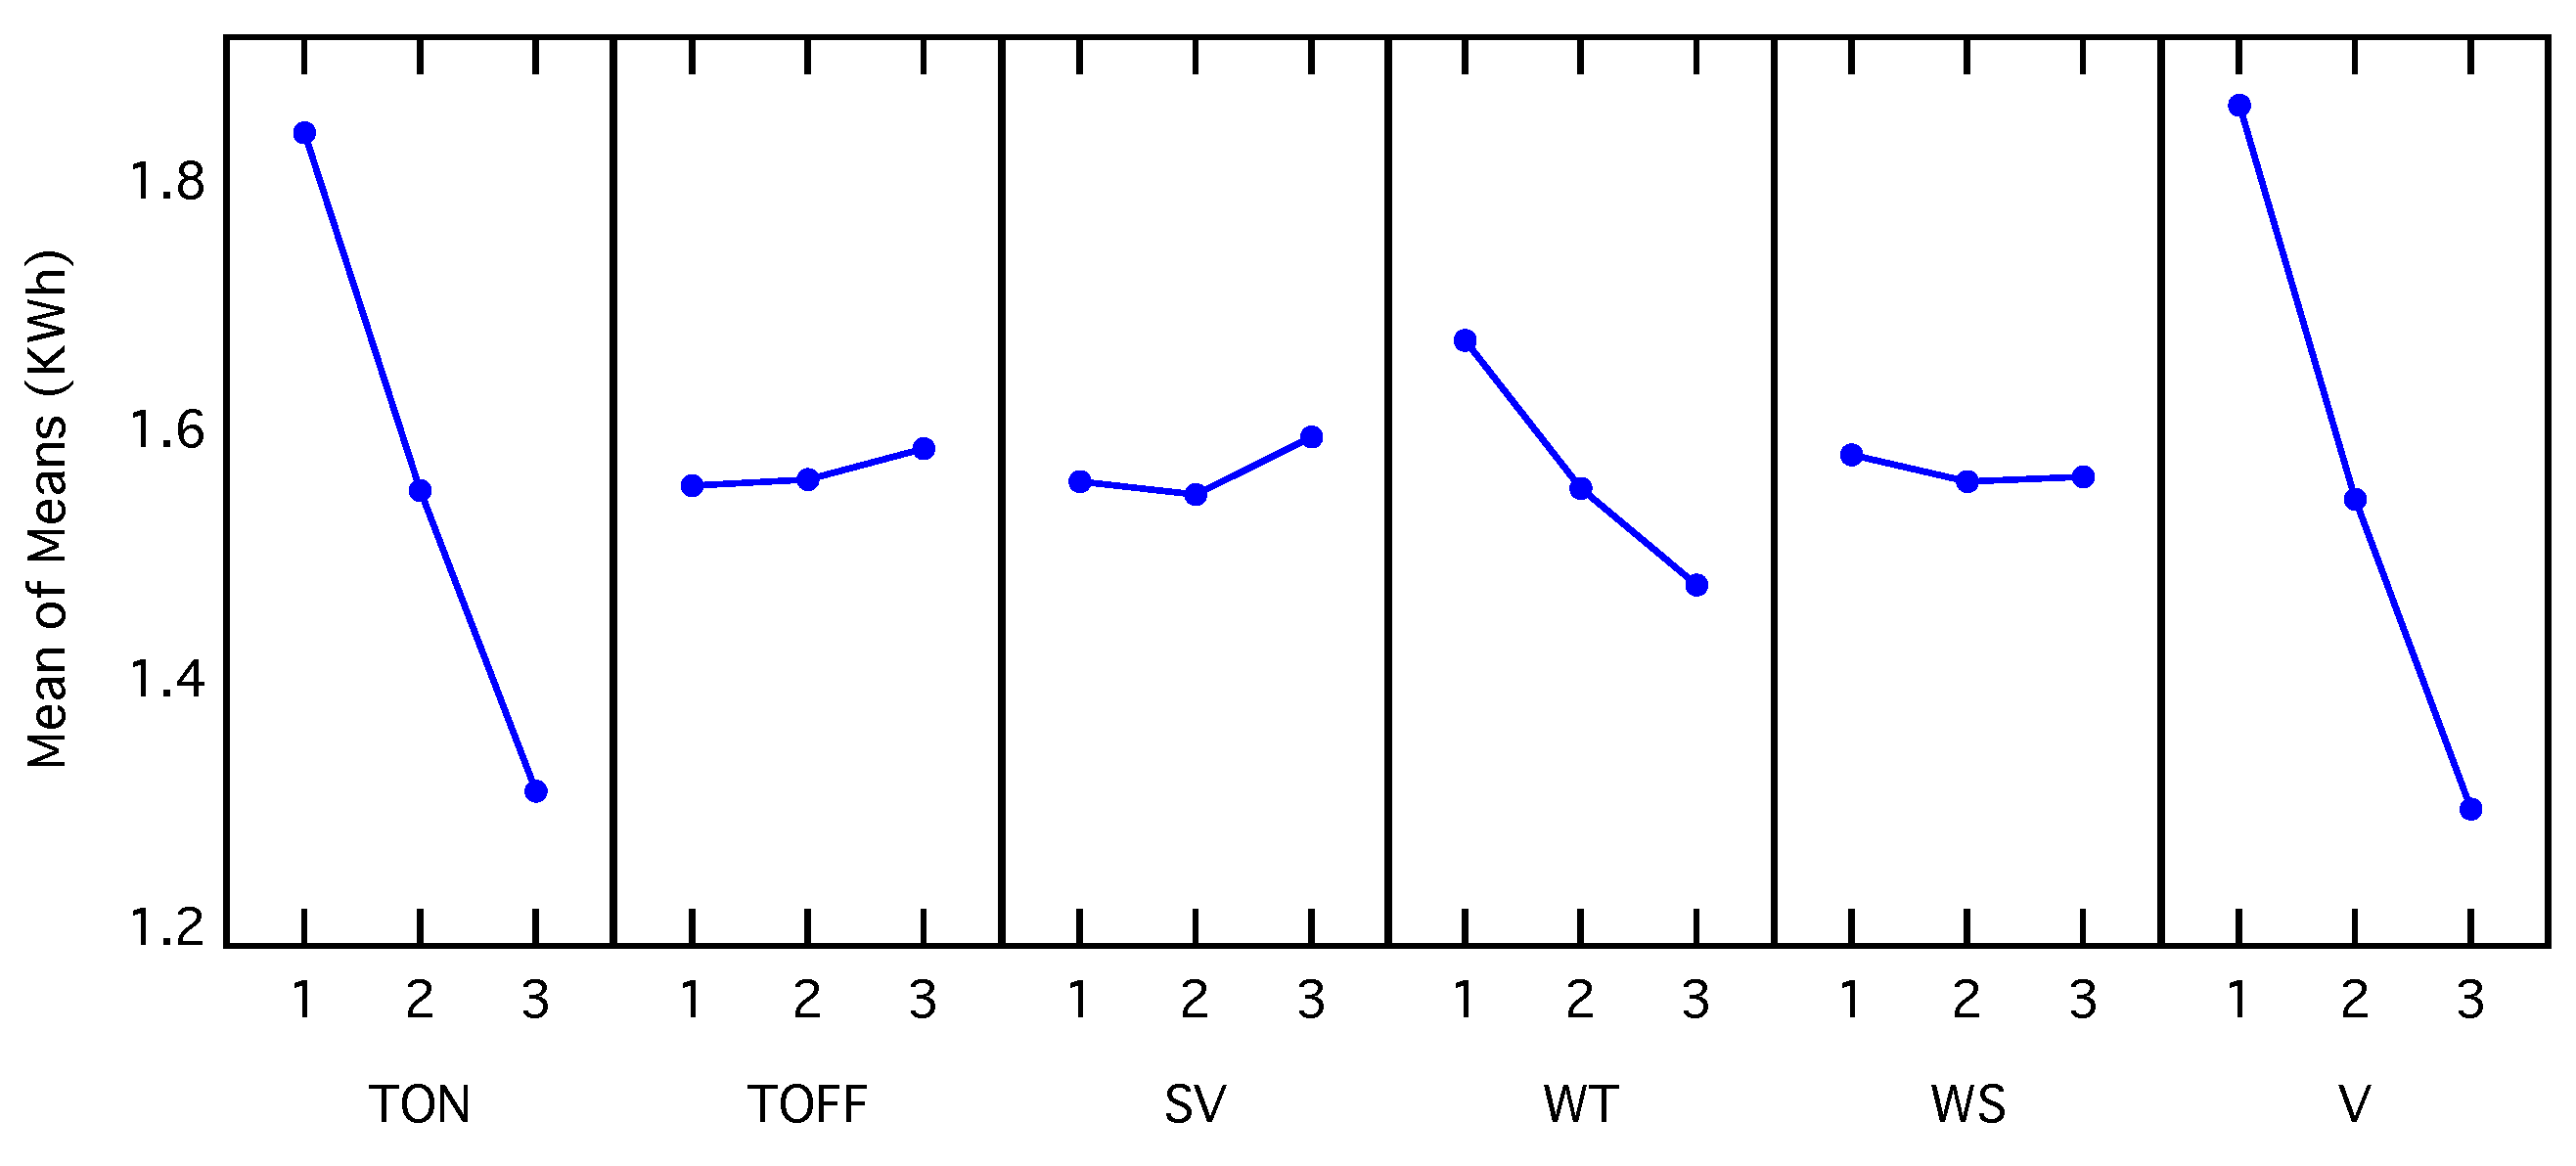
The average response plots of the S/N ratio and the mean for the surface roughness are shown in Figure 6 and Figure 7, respectively. These graphs show the effect of each cutting parameter on the response. To determine the optimal values for each cutting parameter, it is necessary to consider both graphs, remembering that higher values of the signal-to-noise ratio and lower mean values are better.

Figure 6.
Average response plot of the S/N ratio of the surface roughness.

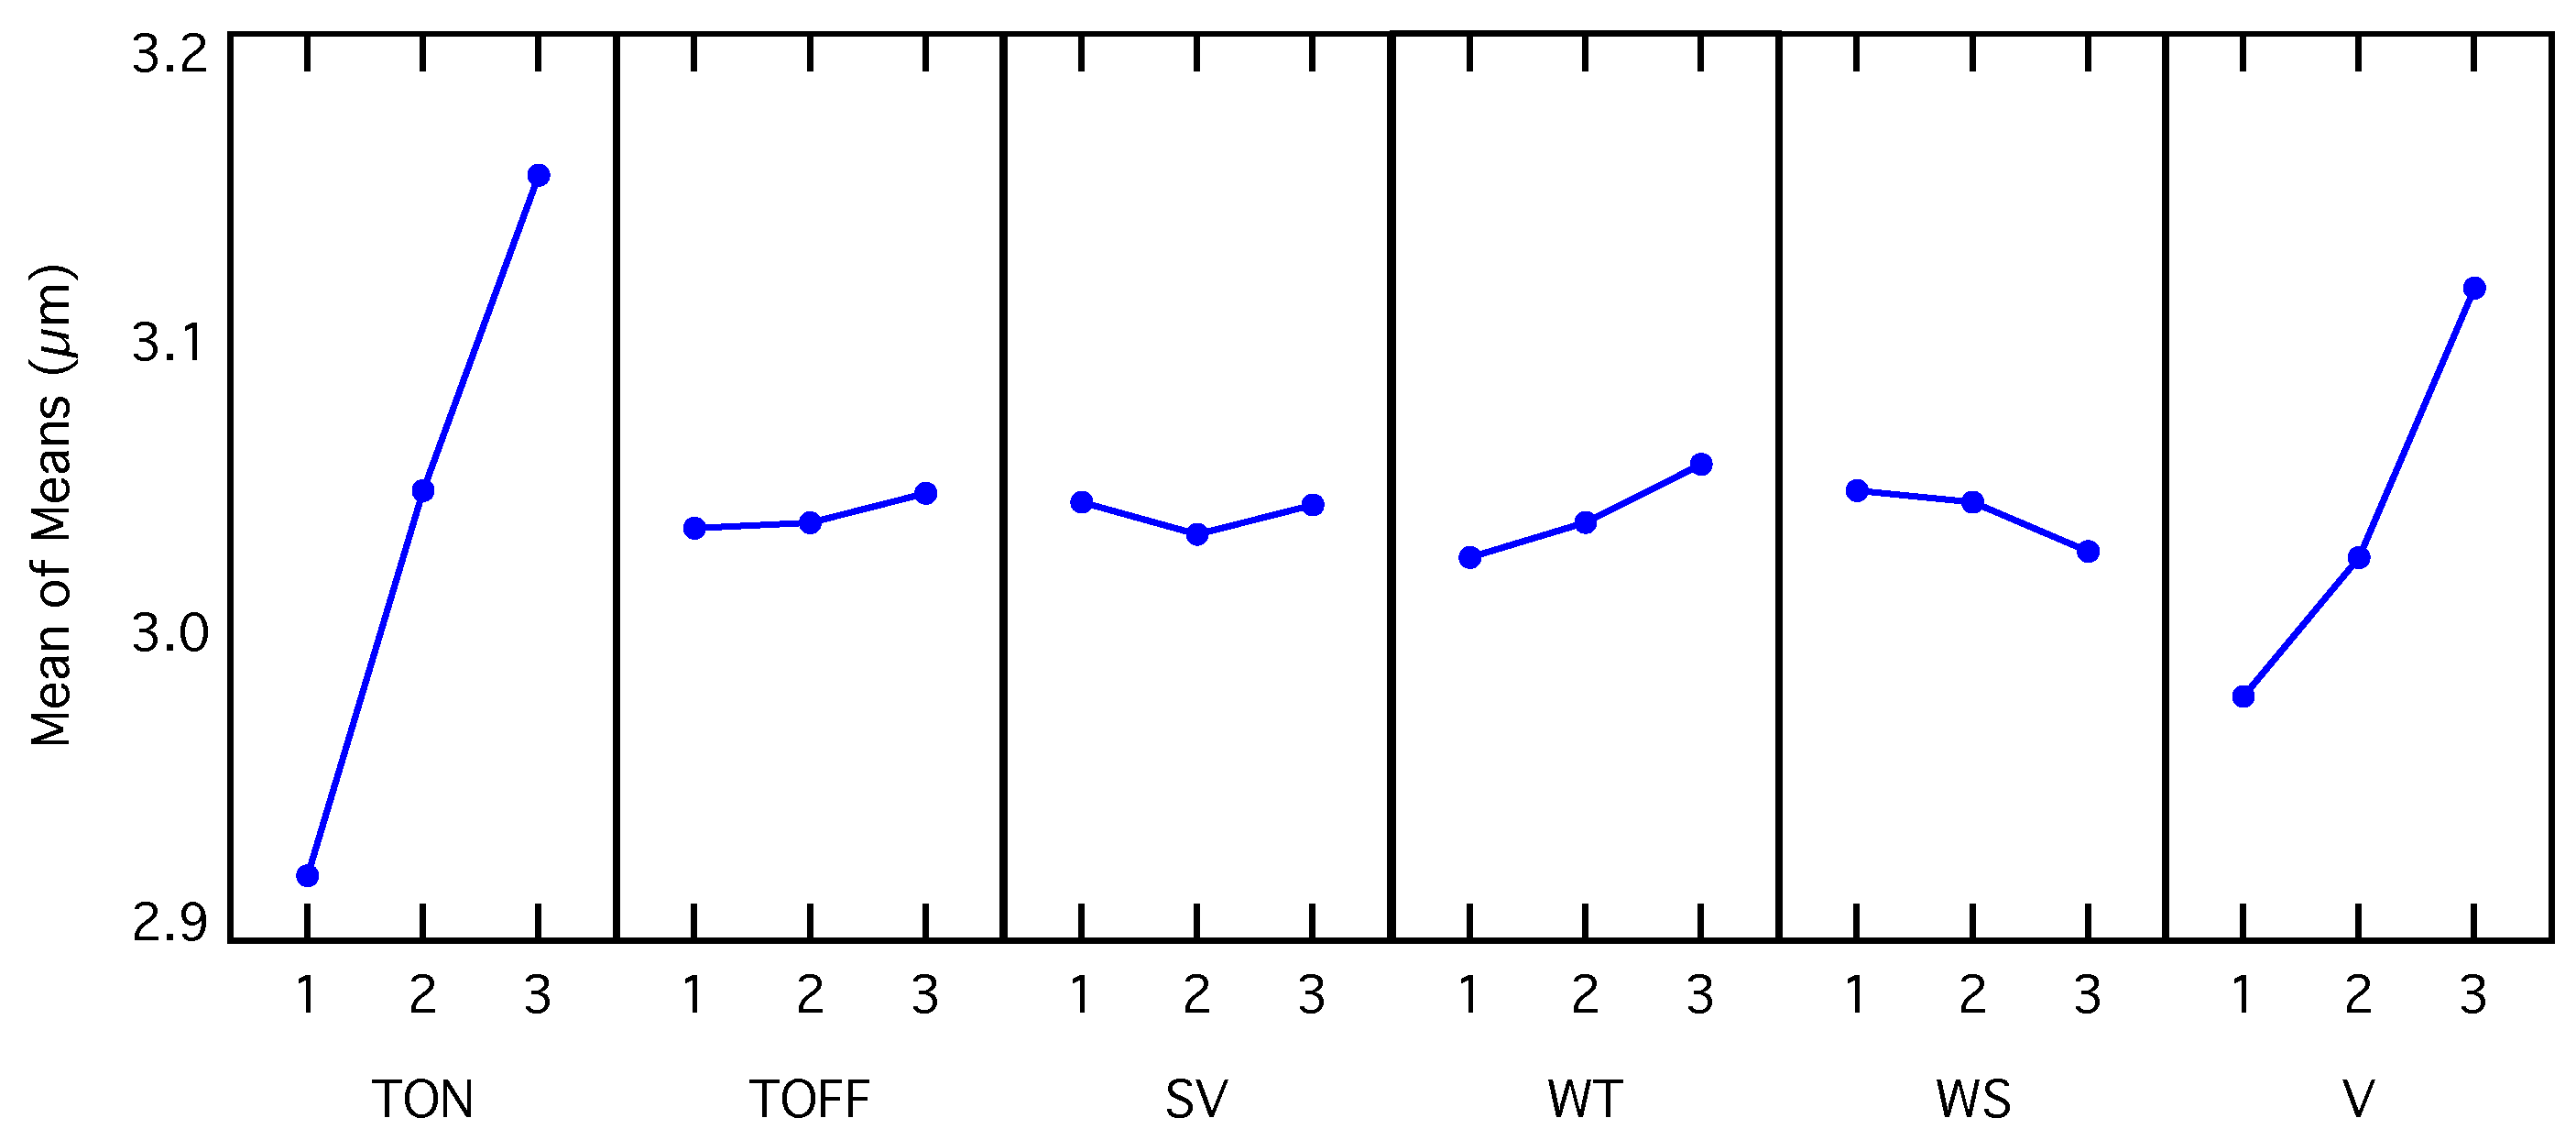
Figure 7.
Average response plot of the mean of the surface roughness.
From both average response plots, two things stand out. First, the values for each factor that maximized the S/N ratio and minimized the mean were the same. These values are summarized in Table 5. Second, the pulse on-time and the voltage factors caused the most variation in the surface roughness.
Table 5.
Optimal levels that improved surface roughness.
The statistical significance of the factors and their contribution on the response can be verified by an analysis of variance. Table 6 and Table 7 show the analysis of variance (ANOVA) for the model considering the S/N ratio and the mean, respectively, for the surface roughness. From the results, both S/N ratio and the mean had a similar behavior. The pulse on-time (Ton) and the voltage were the only significant factors, with a p-value of less than 0.001. They were also the only factors that were relevant for the analysis, as both factors accounted for more than 90% of the contribution to the response and all the other factors had a contribution of less than 1.2%.
Table 6.
Analysis of variance when considering the S/N ratio for the surface roughness.
Table 7.
Analysis of variance when considering the mean for the surface roughness.
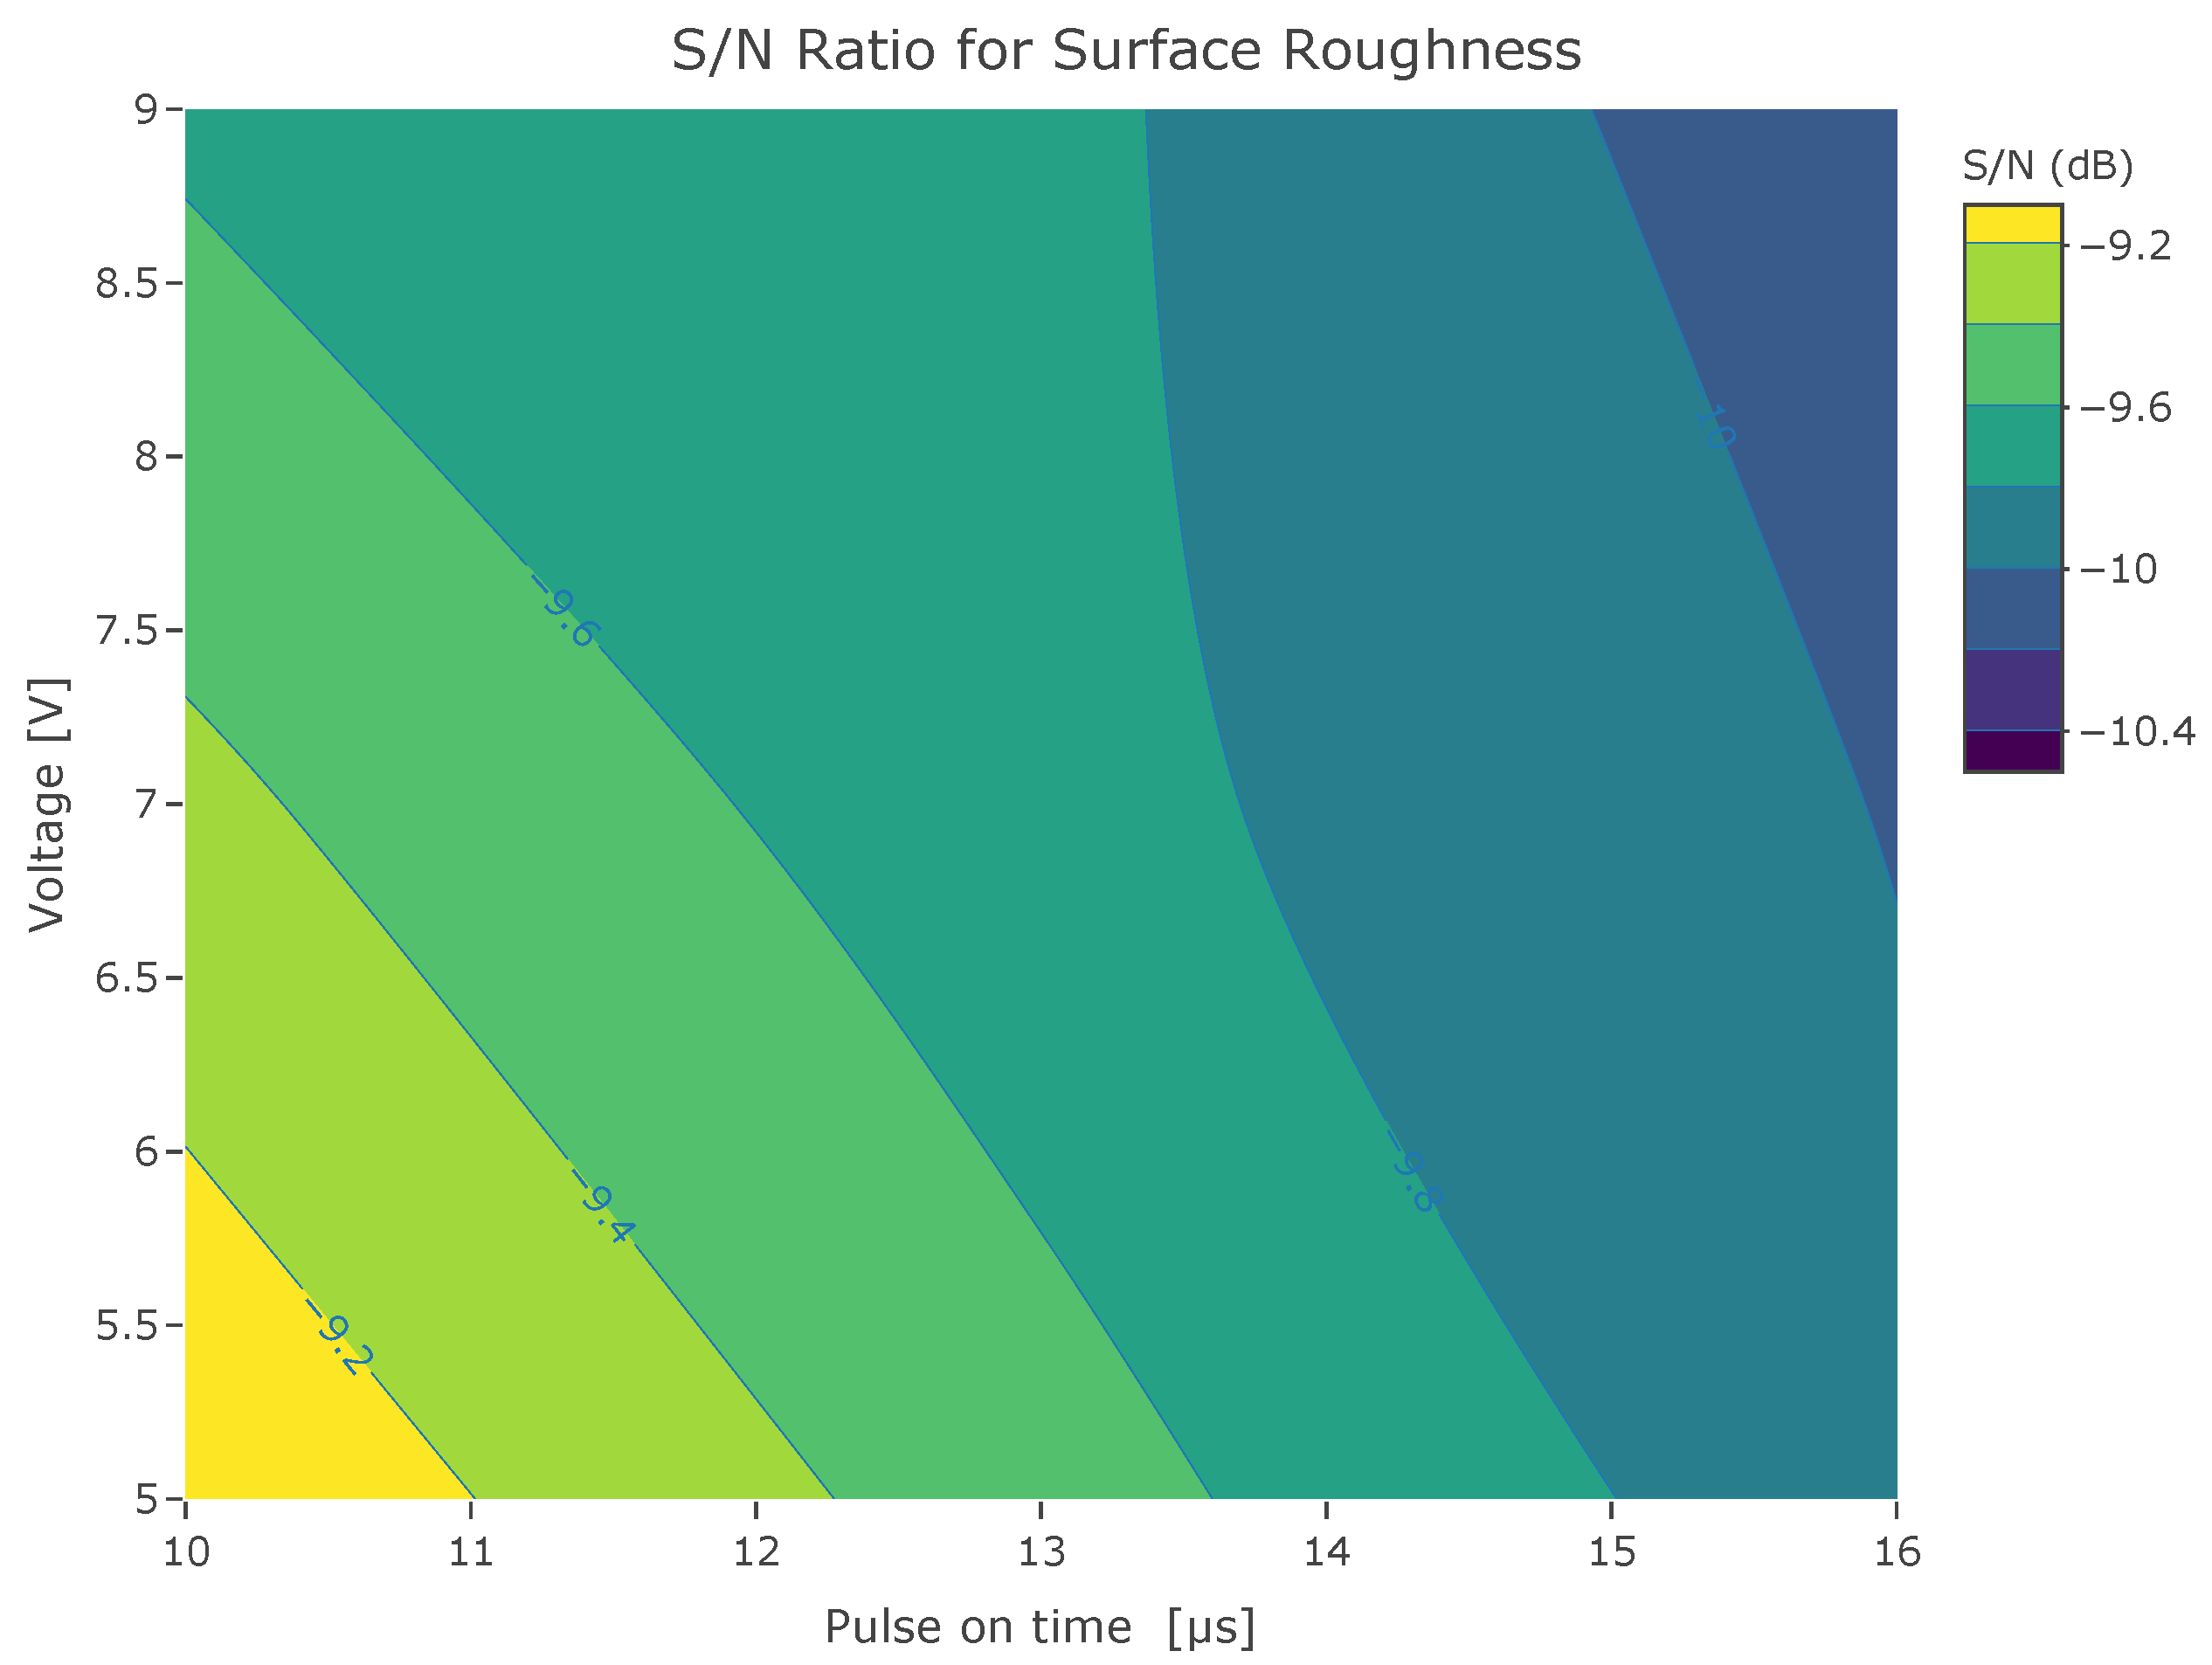
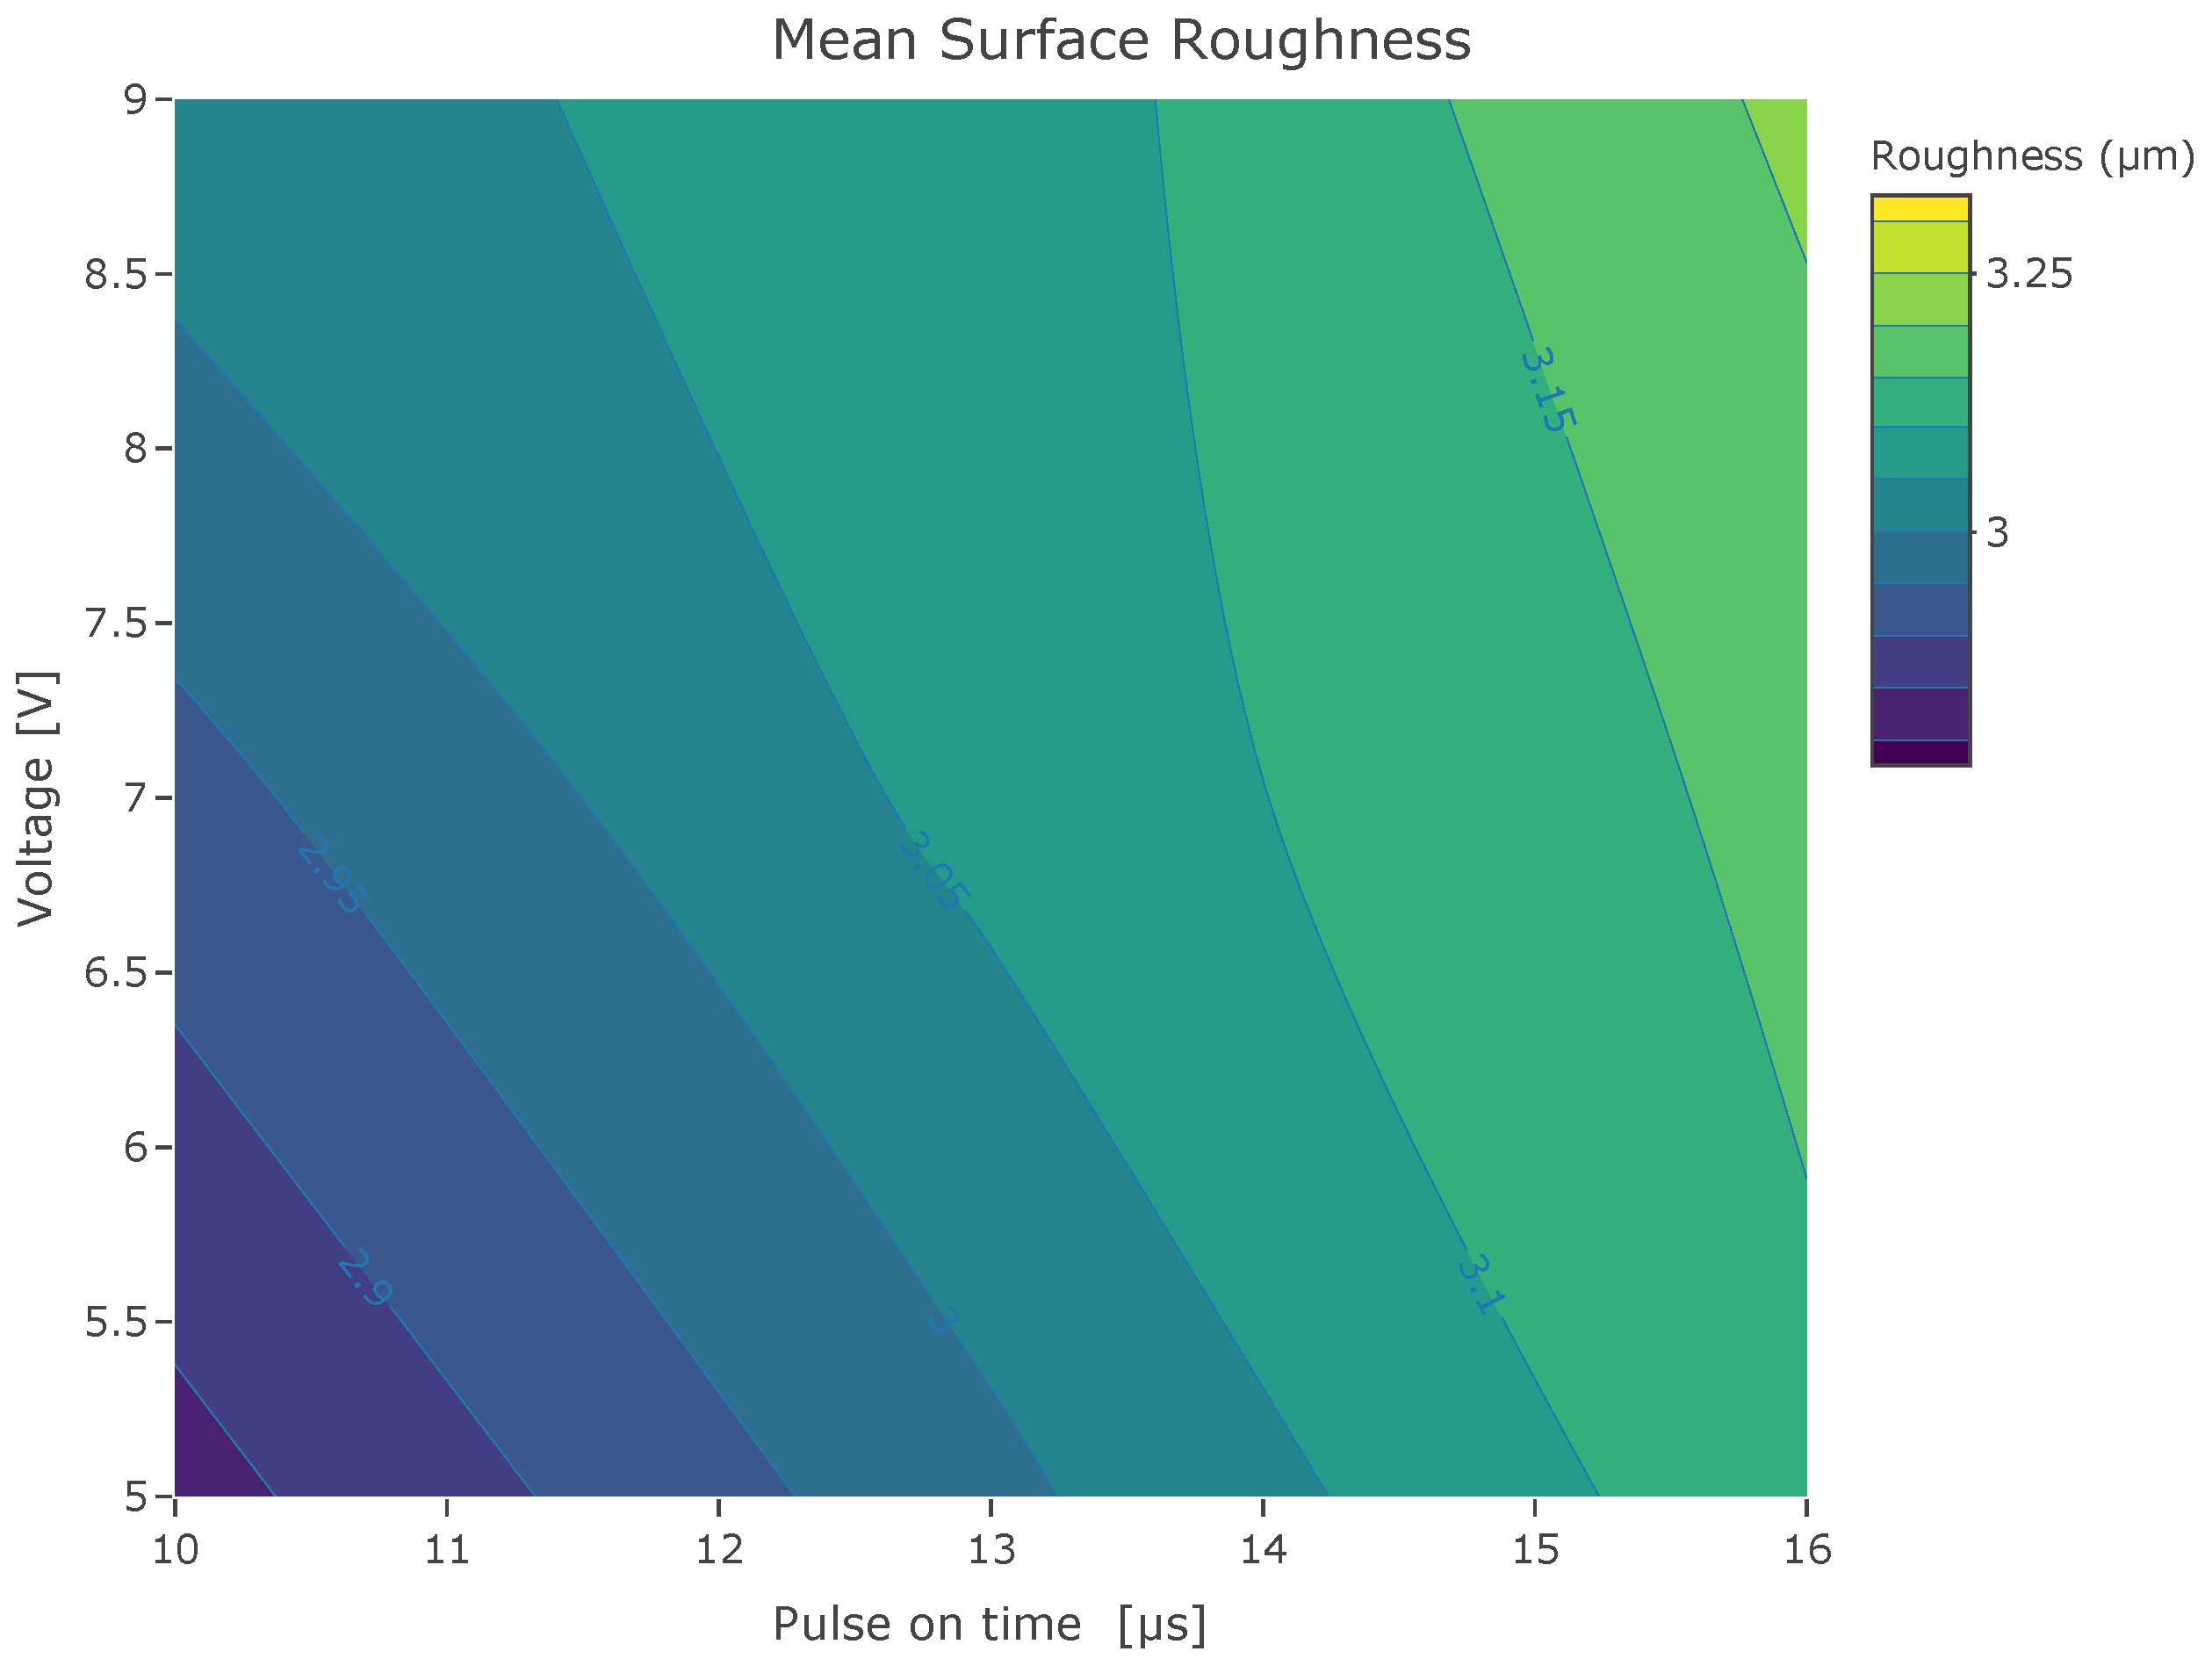
Considering pulse on-time and the voltage as the more important factors, Figure 8 and Figure 9 are contour plots showing the behavior of the S/N ratio and the mean for the surface roughness within the limits studied. The contour plots exhibit how both the S/N ratio and the mean improve as the pulse on-time and the voltage decrease.

Figure 8.
Contour plot of the S/N ratio for the surface roughness as a function of pulse on-time (Ton) and voltage (V) within the limits studied. As the values of the S/N ratio are negative, values closer to zero are better.

Figure 9.
Contour plot of the mean for the surface roughness as a function of pulse on-time (Ton) and voltage (V) within the limits studied. Smaller values are better.
4.2. Results to Minimize Energy Consumption
The results shown in Table 8 were obtained from the measurements taken to know the energy consumption for each of the 19 mm and 25 mm specimens. Together with the mean, the table shows the signal-to-noise ratio (S/N) using a smaller-the-better quality response, as it was desired to minimize energy consumption. As with the surface roughness, a high S/N ratio represents an experiment where the combination of factors and levels provides a more robust response, meaning that the energy consumption changes less from one replicate to the next. A low mean represents lower energy consumption.
Table 8.
Experimental results for the energy consumption.
The average response plots of the S/N ratio and the mean values for the energy consumption are shown in Figure 10 and Figure 11, respectively. These graphs show the effect of each cutting parameter on the energy consumption. As with the surface roughness, to determine the optimal values for each cutting parameter, it is necessary to consider both graphs. The optimal levels that improved the energy consumption are shown in Table 9.

Figure 10.
Average response plot of the S/N ratio for the energy consumption.

Figure 11.
Average response plot of the mean for the energy consumption.
Table 9.
Levels that minimized energy consumption.
From the average response plots, again, two things stand out. First, the values for each factor that maximized the S/N ratio and minimized the mean were the same. These values are summarized in Table 9. Second, the pulse on-time, wire tension, and voltage factors caused the most variation in the energy. It is important to notice that wire tension was neither a significant nor important factor for surface roughness, but it appeared to be a relevant factor to control energy consumption.
Once more, this can be verified with an analysis of variance. Table 10 and Table 11 show the analysis of variance of the model for the S/N ratio and mean, respectively. From the results, three factors were significant for both responses with a p-value of less than 0.001: Ton, WT, and V. Considering the contribution from these three factors, Ton and V were again the most important ones as together they contributed to the response with a more than 90% similarity to what happens with the surface roughness. Wire tension accounted for roughly 5% of the change in the response. As the error in the model was 5.2% for the mean and 2.25% for the S/N ratio, the relevance of the wire tension to control energy consumption may be open to discussion.
Table 10.
Analysis of variance when considering the S/N ratio for the energy consumption.
Table 11.
Analysis of variance when considering the mean for the energy consumption.
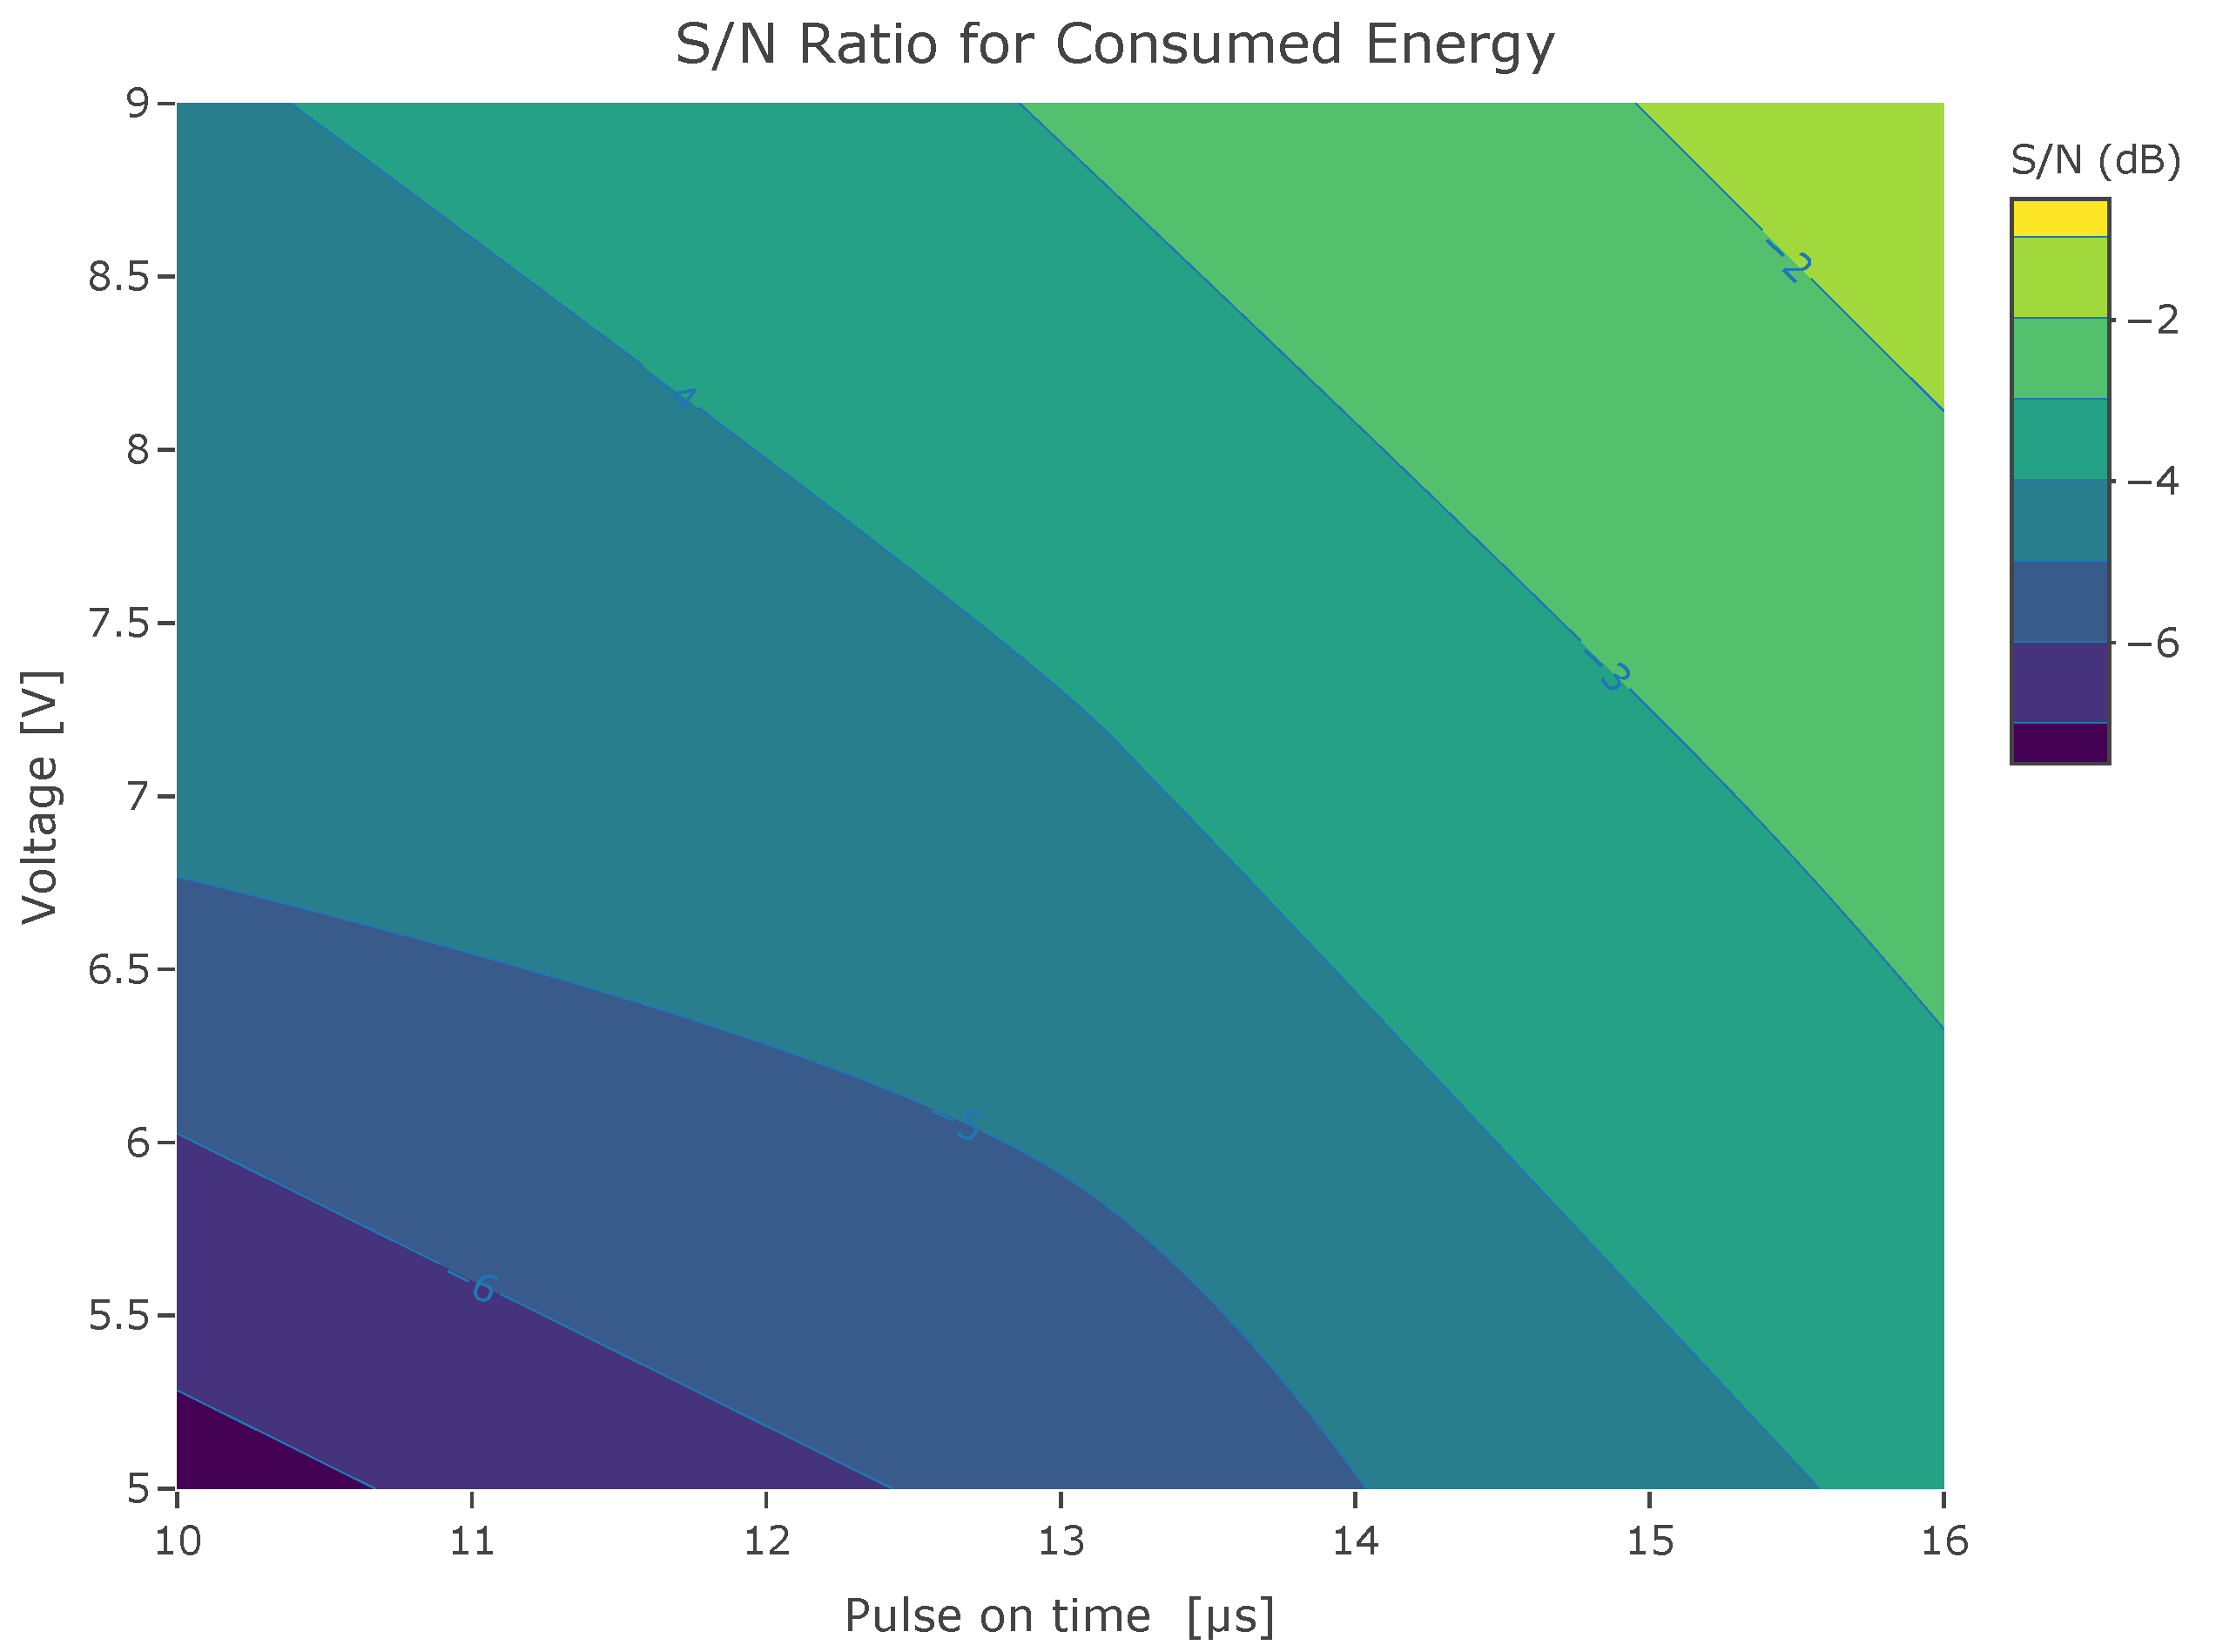
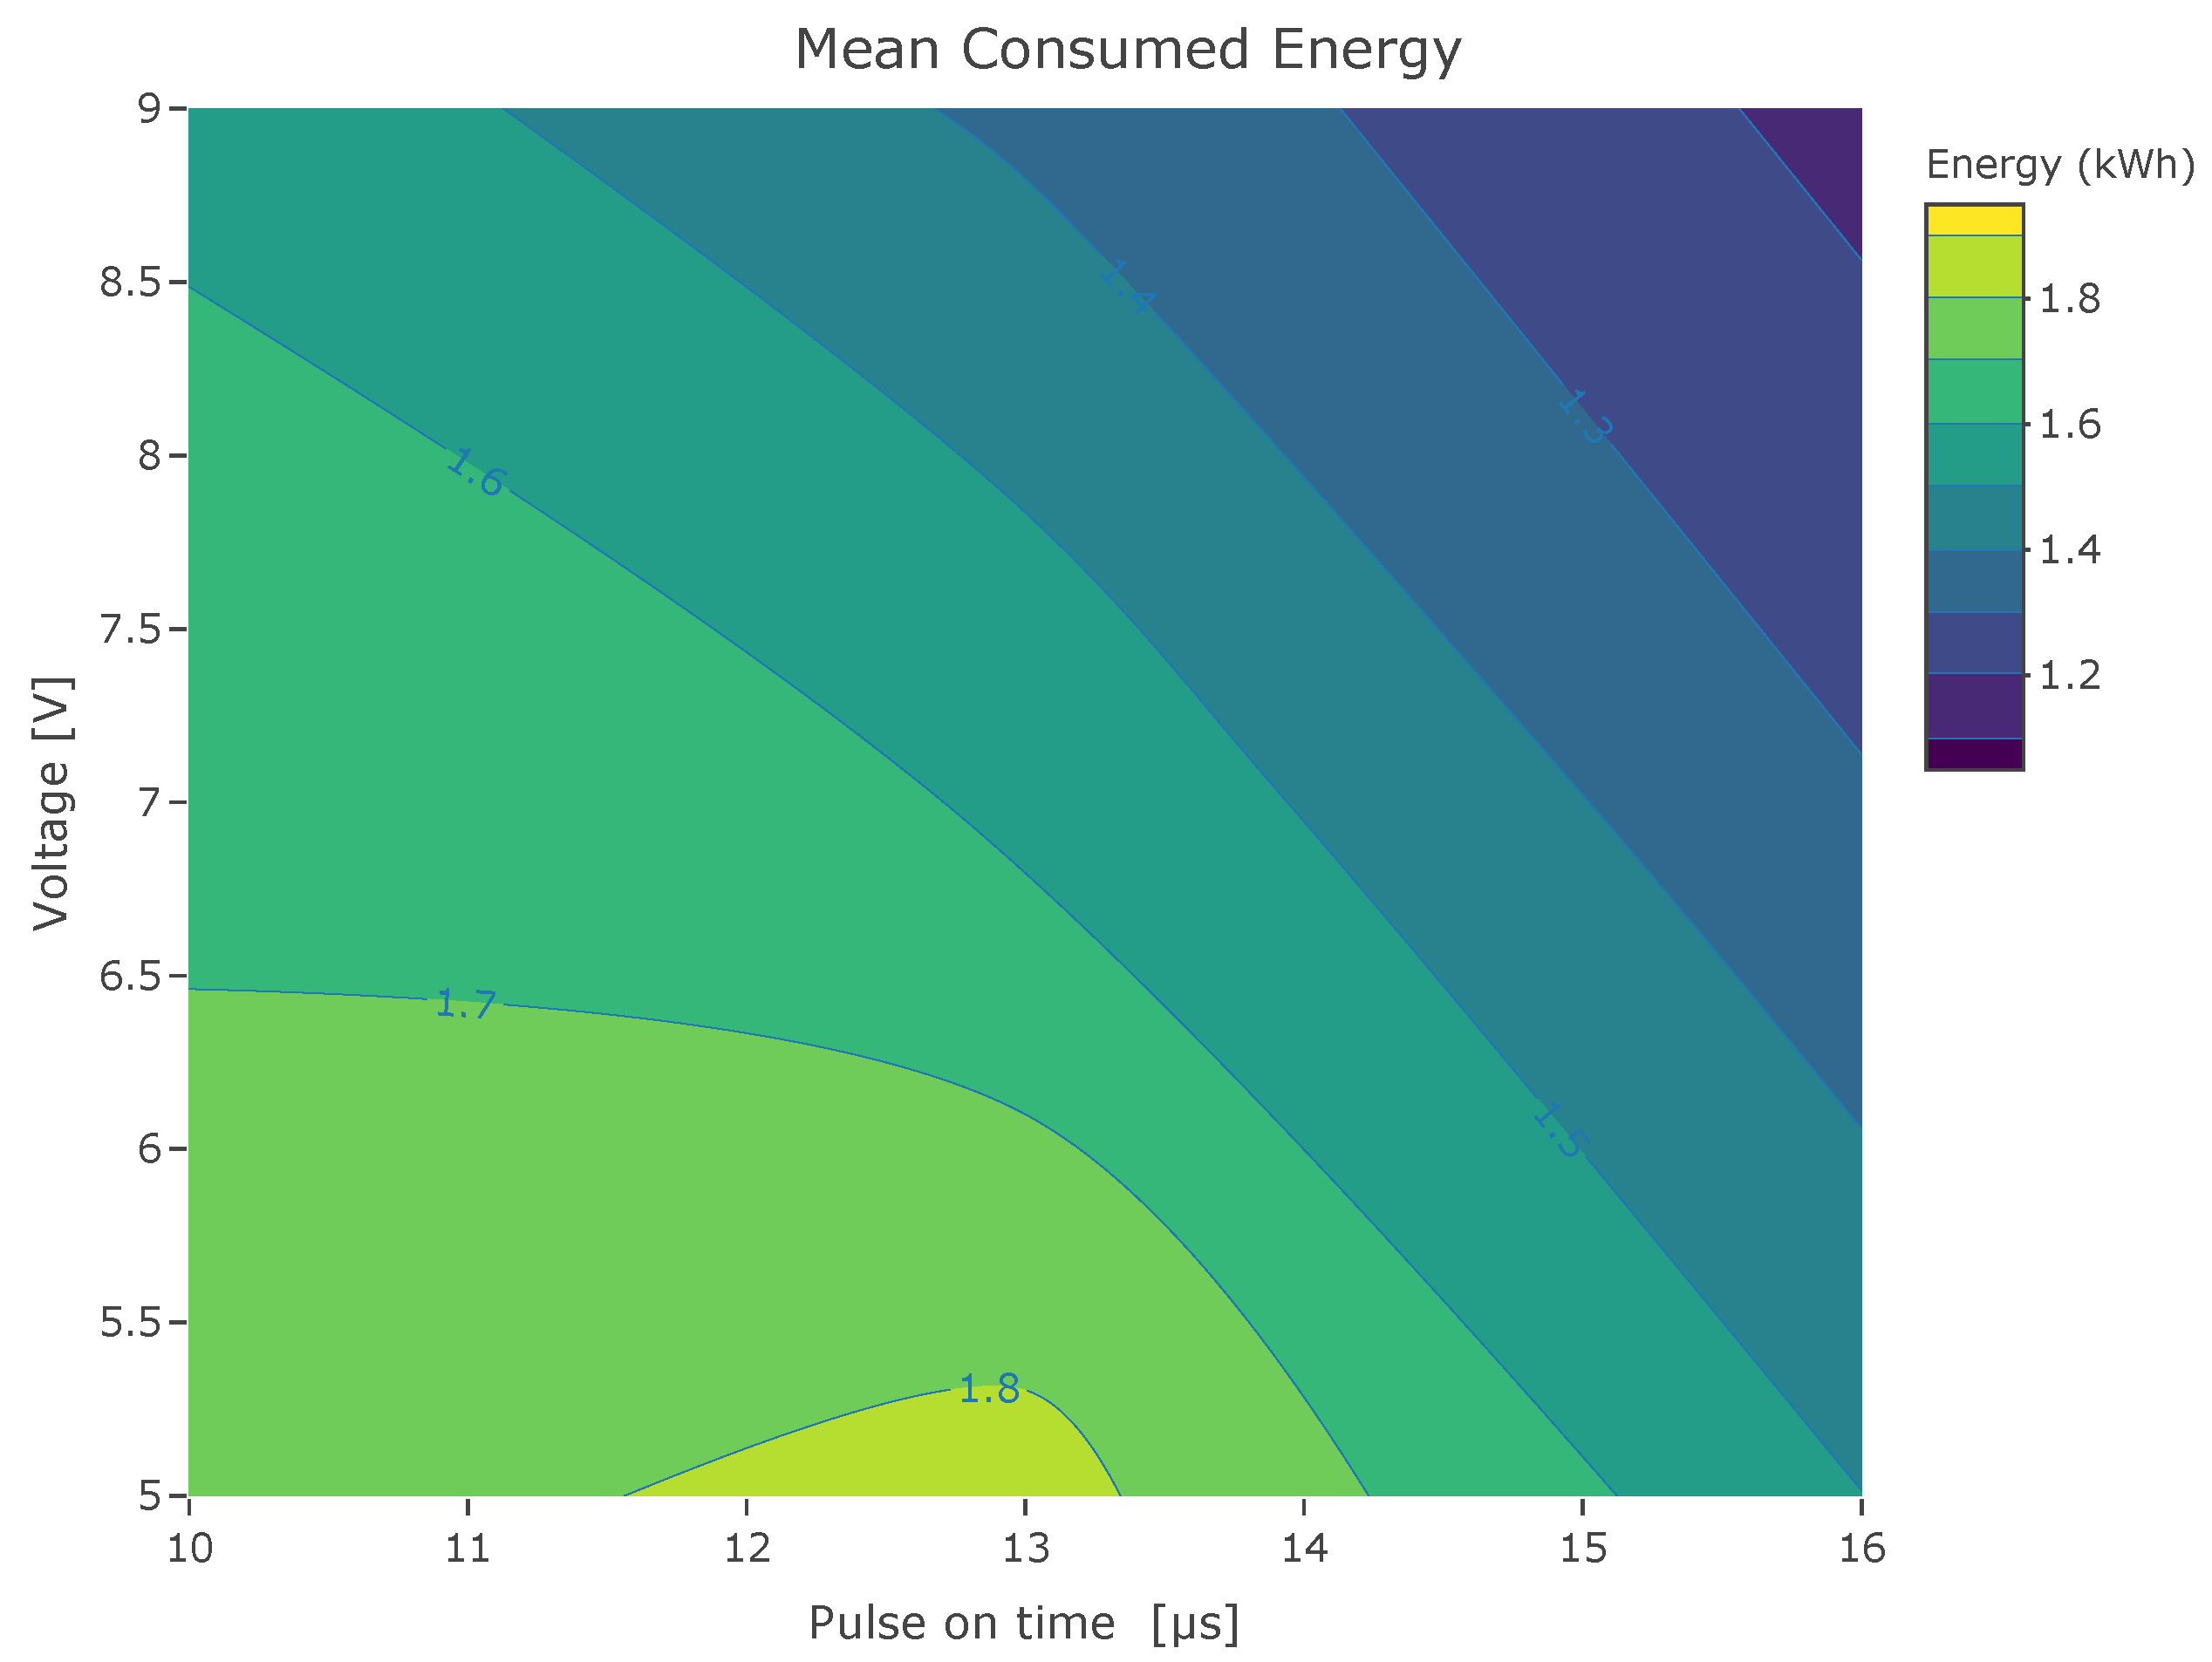
Againg, considering pulse on-time and the voltage as the more important factors, Figure 12 and Figure 13 are contour plots showing the behavior of the S/N ratio and the mean for the energy consumed within the limits studied. The contour plots exhibit how both the S/N ratio and the mean improve as the pulse on-time and the voltage increase.

Figure 12.
Contour plot of the S/N ratio for the energy consumption as a function of pulse on-time (Ton) and voltage (V) within the limits studied. As the values of S/N ratio are negative, values closer to zero are better.

Figure 13.
Contour plot of the mean for the energy consumption as a function of pulse on-time (Ton) and voltage (V) within the limits studied. Smaller values are better.
4.3. Factors That Reduce Energy Consumption and Improve Surface Roughness
Consider the two most important factors in the analysis: pulse on-time and voltage. The values of these two factors that improve surface roughness worsen energy consumption and vice versa. To obtain the values of the factors that lower energy consumption without worsening surface roughness, it is necessary to consider the contribution of each factor to each response.
Table 12 summarizes the levels that minimize the surface roughness and the energy consumption, together with the contribution percentages that the factors have for each of the responses. Ideally, suppose one factor has a strong contribution to one response and a weak one to the other. In that case, it is possible to say that it is more convenient to select as a better value than the one that improves the result on the response where the factor has a strong influence. However, if such a decision cannot be simply made because the percentage contribution to both responses is similar, other methods or performance characteristics must be considered.
Table 12.
Combination of factors and levels that improve both responses.
Fortunately, the simple approach described above worked here. The pulse on-time (Ton) had a contribution of around 42% for the energy consumption and around 68% for the surface roughness. Hence, it was possible to select the level for Ton based on the result that minimized the surface roughness, which was level 1.
For the voltage (V), its contribution to the energy consumption was around 50% whereas for the surface roughness, it was around 23%. Therefore, the best level for the voltage could be selected based on the results of the energy consumption, that is, level 3.
The wire tension (WT) level could be selected based on the energy consumption alone, since it was only relevant for that response. In consequence, the best level for the wire tension was level 3.
Wire speed was a weak contributor to both responses, so any of the levels chosen for this factor could work. Higher wire speeds could lead to increased machining efficiency and a higher material removal rate, so a wire speed of 7 m/min, corresponding to its level 3, was chosen.
Using the above arguments, the levels that optimized both responses were a pulse on-time of 10 µs, a pulse off-time of 11 µs, a servo voltage of 44 volts, a wire tension of 50 g-force, a wire speed of 7 m/min, and a voltage of 9 volts.
4.4. Verification Experiment
Using the results shown in Table 12 where the levels that optimized both responses were a pulse on-time of 10 µs, a pulse off-time of 11 µs, a servo voltage of 44 V, a wire tension of 50 g, a wire-speed of 7 m/min, and a voltage of 9 V, experiments were run to verify this finding.
The results for the verification experiments are reported in Table 13 for the surface roughness response and in Table 14 for the energy consumption. In both cases, the responses found using the optimal levels previously mentioned were compared with the baseline values defined in Table 2. To ensure comparable results, the verification experiment was run five times for the 19 mm plate and five times for the 25 mm plate.
Table 13.
Verification run for the surface roughness.
Table 14.
Verification run for the energy consumption.
Table 15 summarizes the comparison between the responses obtained with the optimal levels defined in this work and the baseline values. From the values, it is easy to see that the surface roughness improvement was marginal, with a 1.3% decrease in variability and a 1.2% decrease in the mean surface roughness. Considering the energy consumption, the improvement was more important, with a decrease in variability of 8% and a decrease in energy consumption of 8.4%. It is important to note that both responses improved with the selected levels for each of the variables, even when considering plates with different thicknesses.
Table 15.
Improvement on surface roughness and energy consumption compared to baseline values.
5. Conclusions
This work aimed to optimize cutting parameters in wire electric discharge machining (WEDM) to minimize energy consumption when machining AISI D2 steel. To ensure that the quality of the machining process was not sacrificed, surface roughness was also considered as a performance response.
The analysis was performed based on Taguchi’s method, using a smaller-the-better type of response. Six process variables were considered factors for the analysis: pulse on-time, pulse off-time, servo voltage, wire tension, wire speed, and voltage. The design of the experiments was carried out using an orthogonal array. Two plate thicknesses, 19 and 25 mm, were considered to simulate that the optimization process should be insensitive to the thickness of the plate being machined.
Six control factors were considered in the experiment: pulse on-time (Ton), pulse off-time (Toff), servo voltage (SV), wire tension (WT), wire-speed (WS), and the voltage in the wire (V). From the experiments, two control factors contributed 90% of the variations in the responses: pulse on-time and voltage in the wire. Pulse off-time, servo voltage, and wire speed had no effect on any of the responses.
Considering pulse on-time and the voltage were the more important factors in the experiment, it was found that for surface roughness, both the S/N ratio and the mean improved as the pulse on-time and the voltage decreased. On the other hand, for the energy consumption, both the S/N ratio and the mean improved as the pulse on-time and the voltage increased.
The result that increasing pulse on-time and voltage may reduce the overall energy consumption of the WEDM process requires an explanation, as it may be counterintuitive. This is due to an increased material removal rate as a longer pulse on-time allows each discharge to remove more material, thus achieving the desired cut faster. The effect of an increasing voltage is similar. A higher voltage increases the energy density of each spark, resulting in more effective material removal per discharge.
To reduce energy consumption without sacrificing the surface roughness, a pulse on-time of 10 µs, a pulse off-time of 11 µs, a servo voltage of 44 V, a wire tension of 50 g, a wire speed of 7 m/min, and a voltage available on the wire of 9 V should be used. This combination of values reduced the energy consumption by 8%, whereas surface roughness was improved by 1% when compared with the baseline values.
Considering the work conducted, the use of signal-to-noise ratios and means as part of Taguchi’s methodology is a sound choice to analyze the problem and find the best values for the control factors. Additional information from an analysis of variance, specifically the contribution of each factor to the variation in the response, can help to select the best levels when more than one response is of interest. As in this work, this simple approach can be sufficient to decide the overall best levels for multi-response problems when the contribution of each factor is different for each response.
Author Contributions
Conceptualization, J.d.D.C.-N. and H.O.G.-R.; methodology, J.d.D.C.-N. and J.C.M.-V.; experimentation, H.O.G.-R.; validation, J.d.D.C.-N. and J.C.M.-V.; writing—original draft preparation, J.C.M.-V.; writing—review and editing, J.d.D.C.-N. and J.C.M.-V.; visualization, J.C.M.-V. and H.O.G.-R.; supervision, J.d.D.C.-N. All authors have read and agreed to the published version of the manuscript.
Funding
This research received no external funding.
Institutional Review Board Statement
Not applicable.
Informed Consent Statement
Not applicable.
Data Availability Statement
The raw data supporting the conclusions of this article will be made available by the authors on request.
Conflicts of Interest
The authors declare no conflicts of interest.
References
- Mandal, K.; Sarkar, S.; Mitra, S.; Bose, D. Multi-Attribute Optimization in WEDM of Light Metal Alloy. Mater. Today Proc. 2019, 18, 3492–3500. [Google Scholar] [CrossRef]
- Ram Prasad, A.V.S.; Ramji, K.; Kolli, M. An Experimental Investigation on Machining Parameters of Titanium Alloy Using WEDM. Mater. Today Proc. 2019, 18, A12–A16. [Google Scholar] [CrossRef]
- Zhang, Y.; Zhang, Z.; Zhang, G.; Li, W. Reduction of Energy Consumption and Thermal Deformation in WEDM by Magnetic Field Assisted Technology. Int. J. Precis. Eng. Manuf.-Green Tech. 2020, 7, 391–404. [Google Scholar] [CrossRef]
- Ho, K.H.; Newman, S.T.; Rahimifard, S.; Allen, R.D. State of the art in wire electrical discharge machining (WEDM). Int. J. Mach. Tools Manuf. 2004, 44, 1247–1259. [Google Scholar] [CrossRef]
- Reddy, D.; Soni, H.; Narendranath, S. Experimental Investigation and Optimization of WEDM process parameters for Ti50Ni48Co2 Shape Memory Alloy. Mater. Today Proc. 2018, 5, 19063–19072. [Google Scholar] [CrossRef]
- Li, W.; Kara, S. Characterising Energy Efficiency of Electrical Discharge Machining (EDM) Processes. Procedia CIRP 2015, 29, 263–268. [Google Scholar] [CrossRef]
- Gamage, J.R.; DeSilva, A.K.M.; Harrison, C.S.; Harrison, D.K. Process level environmental performance of electrodischarge machining of aluminium (3003) and steel (AISI P20). J. Clean. Prod. 2016, 137, 291–299. [Google Scholar] [CrossRef]
- Ishfaq, K.; Sana, M.; Waseem, M.U.; Anwar, S.; Zia, A.W. Circular usage of waste cooking oil towards green electrical discharge machining process with lower carbon emissions. Int. J. Adv. Manuf. Technol. 2024, 131, 5133–5153. [Google Scholar] [CrossRef]
- Rodic, D.; Gostimirovic, M.; Madic, M.; Sekulic, M.; Aleksic, A. Fuzzy model-based optimal energy control during the electrical discharge machining. Neural Comput. Appl. 2020, 32, 17011–17026. [Google Scholar] [CrossRef]
- Gostimirovic, M.; Pucovsky, V.; Sekulic, M.; Radovanovic, M.; Madic, M. Evolutionary multi-objective optimization of energy efficiency in electrical discharge machining. J. Mech. Sci. Technol. 2018, 32, 4775–4785. [Google Scholar] [CrossRef]
- Hasan, M.M.; Saleh, T.; Sophian, A.; Rahman, M.A.; Huang, T.; Mohamed Ali, M.S. Experimental modeling techniques in electrical discharge machining (EDM): A review. Int. J. Adv. Manuf. Technol. 2023, 127, 2125–2150. [Google Scholar] [CrossRef]
- Sarala Rubi, C.; Prakash, J.; Juliyana, S.; Čep, R.; Salunkhe, S.; Kouril, K.; Ramdas Gawade, S. Comprehensive review on wire electrical discharge machining: A non-traditional material removal process. Front. Mech. Eng. 2024, 10, 1322605. [Google Scholar] [CrossRef]
- Taguchi, G.; Chowdhury, S.; Wu, Y. Taguchi’s Quality Engineering Handbook; Wiley: Hoboken, NJ, USA, 2004. [Google Scholar] [CrossRef]
- Gupta, R.; Agrawal, S.; Singh, P. Modeling and optimization of WEDM machining of armour steel using modified crow search algorithm approach. Int. J. Interact. Des. Manuf. 2024, 1–21. [Google Scholar] [CrossRef]
- Selvam, R.; Vignesh, M.; Pugazhenthi, R.; Anbuchezhiyan, G.; Satyanarayana Gupta, M. Effect of process parameter on wire cut EDM using RSM method. Int. J. Interact. Des. Manuf. 2023, 1–12. [Google Scholar] [CrossRef]
- Sadhana, A.D.; Prakash, J.U.; Ananth, S.; Juliyana, S.J.; Rubi, C.S. Effect of process parameters for wire EDM of AISI H13 tool steel. Mater. Today Proc. 2022, 52, 1870–1874. [Google Scholar] [CrossRef]
- Chary, E.A.; Basha SU, A.; Dheeraj, Y.; Kumar, D.S. Taguchi optimization in machining dual-phase steel (DP980) with WEDM using brass wire. Mater. Today Proc. 2022, 62, 3416–3420. [Google Scholar] [CrossRef]
- Paturi, U.M.; Devarasetti, H.; Reddy, N.S.; Kotkunde, N.; Patle, B.K. Modeling of surface roughness in wire electrical discharge machining of Inconel 718 using artificial neural network. Mater. Today Proc. 2021, 38, 3142–3148. [Google Scholar] [CrossRef]
- Saif, M.; Tiwari, S. Investigation towards surface roughness and material removal rate in Wire-EDM of aluminium alloy 6061 and 5083 using Taguchi method. Mater. Today Proc. 2021, 47, 1040–1047. [Google Scholar] [CrossRef]
- Naik, G.M.; Anjan, B.N.; Badiger, R.I.; Bellubbi, S.; Mishra, D.K. An investigation on effects of wire-EDT machining parameters on surface roughness of INCONEL 718. Mater. Today Proc. 2021, 35, 474–477. [Google Scholar] [CrossRef]
- Kumar, A.; Jagota, V.; Shawl, R.Q.; Sharma, V.; Sargam, K.; Shabaz, M.; Khan, M.T.; Rabani, B.; Gandhi, S. Wire EDM process parameter optimization for D2 steel. Mater. Today Proc. 2021, 37, 2478–2482. [Google Scholar] [CrossRef]
- Kumar, S.U.; Manikandan, N.; Binoj, J.S.; Thejasree, P.; Shajahan, S.; Arulkirubakaran, D. Multi objective optimization of wire-electrical discharge machining of stellite using Taguchi—Grey approach. Mater. Today Proc. 2021, 39, 216–222. [Google Scholar] [CrossRef]
- Manikandan, N.; Binoj, J.S.; Thejasree, P.; Sasikala, P.; Anusha, P. Application of Taguchi method on Wire Electrical Discharge Machining of Inconel 625. Mater. Today Proc. 2021, 39, 121–125. [Google Scholar] [CrossRef]
- Ramaswamy, A.; Perumal, A.V.; Jagadeesan, J.; Kaladharan, P.; Nagarajan, H.V. Optimization of WEDM process parameters for D3 die steel using RSM. Mater. Today Proc. 2021, 37, 2063–2069. [Google Scholar] [CrossRef]
- Muniappan, A.; Jayakumar, V.; Ajithkumar, R.; Veerabhadra, S.K.; Prasanna, R. Optimization of WEDM Process Parameters for Cutting Speed using Taguchi technique. Mater. Today Proc. 2019, 18, 332–341. [Google Scholar] [CrossRef]
- Babu, K.N.; Karthikeyan, R.; Punitha, A. An integrated ANN—PSO approach to optimize the material removal rate and surface roughness of wire cut EDM on INCONEL 750. Mater. Today Proc. 2019, 19, 501–505. [Google Scholar] [CrossRef]
- Dayakar, K.; Krishnam Raju, K.V.M.; Raju, C.R.B. Prediction and optimization of surface roughness and MRR in wire EDM of maraging steel 350. Mater. Today Proc. 2019, 18, 2123–2131. [Google Scholar] [CrossRef]
Disclaimer/Publisher’s Note: The statements, opinions and data contained in all publications are solely those of the individual author(s) and contributor(s) and not of MDPI and/or the editor(s). MDPI and/or the editor(s) disclaim responsibility for any injury to people or property resulting from any ideas, methods, instructions or products referred to in the content. |
© 2024 by the authors. Licensee MDPI, Basel, Switzerland. This article is an open access article distributed under the terms and conditions of the Creative Commons Attribution (CC BY) license (https://creativecommons.org/licenses/by/4.0/).