Abstract
In this work, a numerical study on the loop-terminated Mach–Zehnder interferometer (LT-MZI) structure for CO2 gas sensing applications is carried out via the finite element method. The sensing arm is covered with a polyhexamethylene biguanide (PHMB) polymer which is highly receptive to CO2 gas. The refractive index of the host material decreases due to the absorption of the CO2 gas resulting in a shift in the interference pattern of the LT-MZI structure. As a result, a redshift in the wavelength is observed in the transmission spectrum of the device. The sensitivity of the device is estimated at 7.63 pm/ppm, 34.46 pm/ppm, and 74.78 pm/ppm for the sensing arm lengths of 5 µm, 10 µm, and 15 µm, respectively. The sensitivity can be further enhanced, however, at the cost of the bigger footprint of the device. Utilizing the innovative sensor design, a comprehensive range of CO2 gas concentrations spanning from 0 to 524 ppm is effectively detected. This compact and highly sensitive device serves as a vital tool for monitoring indoor CO2 levels, fostering a healthier breathing environment for all occupants.
1. Introduction
Integrated photonic sensors hold significant importance in various fields due to their ability to accurately and efficiently detect and measure physical, chemical, and biological parameters [1,2]. These sensors utilize light to sense changes in their surroundings, offering advantages such as high sensitivity, fast response times, and miniaturization [3]. Their integration into compact and scalable platforms enables the development of portable, low-cost, and highly sensitive sensing devices for applications ranging from environmental monitoring and healthcare diagnostics to telecommunications and industrial process control [4,5,6]. By leveraging the unique properties of light, integrated photonic sensors contribute to advancements in fields such as biomedical research, environmental sustainability, and the optimization of industrial processes, ultimately fostering innovation and improving quality of life [7,8,9].
The Mach–Zehnder interferometer (MZI) structure holds immense significance in sensing applications due to its ability to efficiently manipulate and detect light signals [10,11]. This structure utilizes the principle of interference to measure changes in optical properties, making it highly sensitive to external stimuli such as temperature, pressure, and refractive index variations [12,13,14,15]. Its compact size, low power consumption, and high sensitivity make it ideal for a wide range of sensing applications, including environmental monitoring, biomedical diagnostics, and industrial process control [16,17,18]. Additionally, its versatility allows for integration with various materials and technologies, paving the way for innovative sensing solutions with improved performance and reliability.
The Sagnac loop serves multiple purposes in optical systems. In the context of MZI, like the loop-terminated Mach–Zehnder interferometer (LT-MZI), the Sagnac loop acts as a crucial component to enhance performance and functionality. One of the key functions of the Sagnac loop in an LT-MZI is to reduce the length of the interferometer by a factor of two. This reduction in length is advantageous for compactness and integration into miniaturized optical devices, allowing for space-efficient designs without compromising performance. Moreover, the Sagnac loop enhances the interferometer’s phase sensitivity. By circulating light through the loop, it increases the effective path length travelled by the light, thereby amplifying the interference effects [19]. In interferometric sensors, including those used for refractive index sensing, common mode rejection is crucial for eliminating unwanted noise and environmental perturbations. The Sagnac loop configuration inherently provides excellent common mode rejection, as any disturbance affecting both arms of the interferometer equally will not affect the interference pattern [20].
Carbon dioxide (CO2) monitoring is of paramount importance due to its significant implications for both environmental and human health. As a major greenhouse gas, CO2 plays a crucial role in regulating the Earth’s climate, influencing temperature patterns, weather phenomena, and ultimately the balance of ecosystems [21]. Moreover, in indoor environments, monitoring CO2 is essential for ensuring air quality and occupant comfort. Elevated CO2 levels can indicate poor ventilation, which can lead to a buildup of other pollutants and potential health risks, including headaches, fatigue, and respiratory problems [22,23]. By monitoring CO2 concentrations, it is possible to maintain optimal indoor air quality, promote productivity, and safeguard the well-being of occupants in various settings, including homes, schools, offices, and healthcare facilities. In this work, a novel design of a CO2 gas sensor is proposed which is based on an LT-MZI embedded with polyhexamethylene biguanide (PHMB) functional polymer in the sensing arm to determine the minute change in the gas concentration.
2. Device Design and Analysis
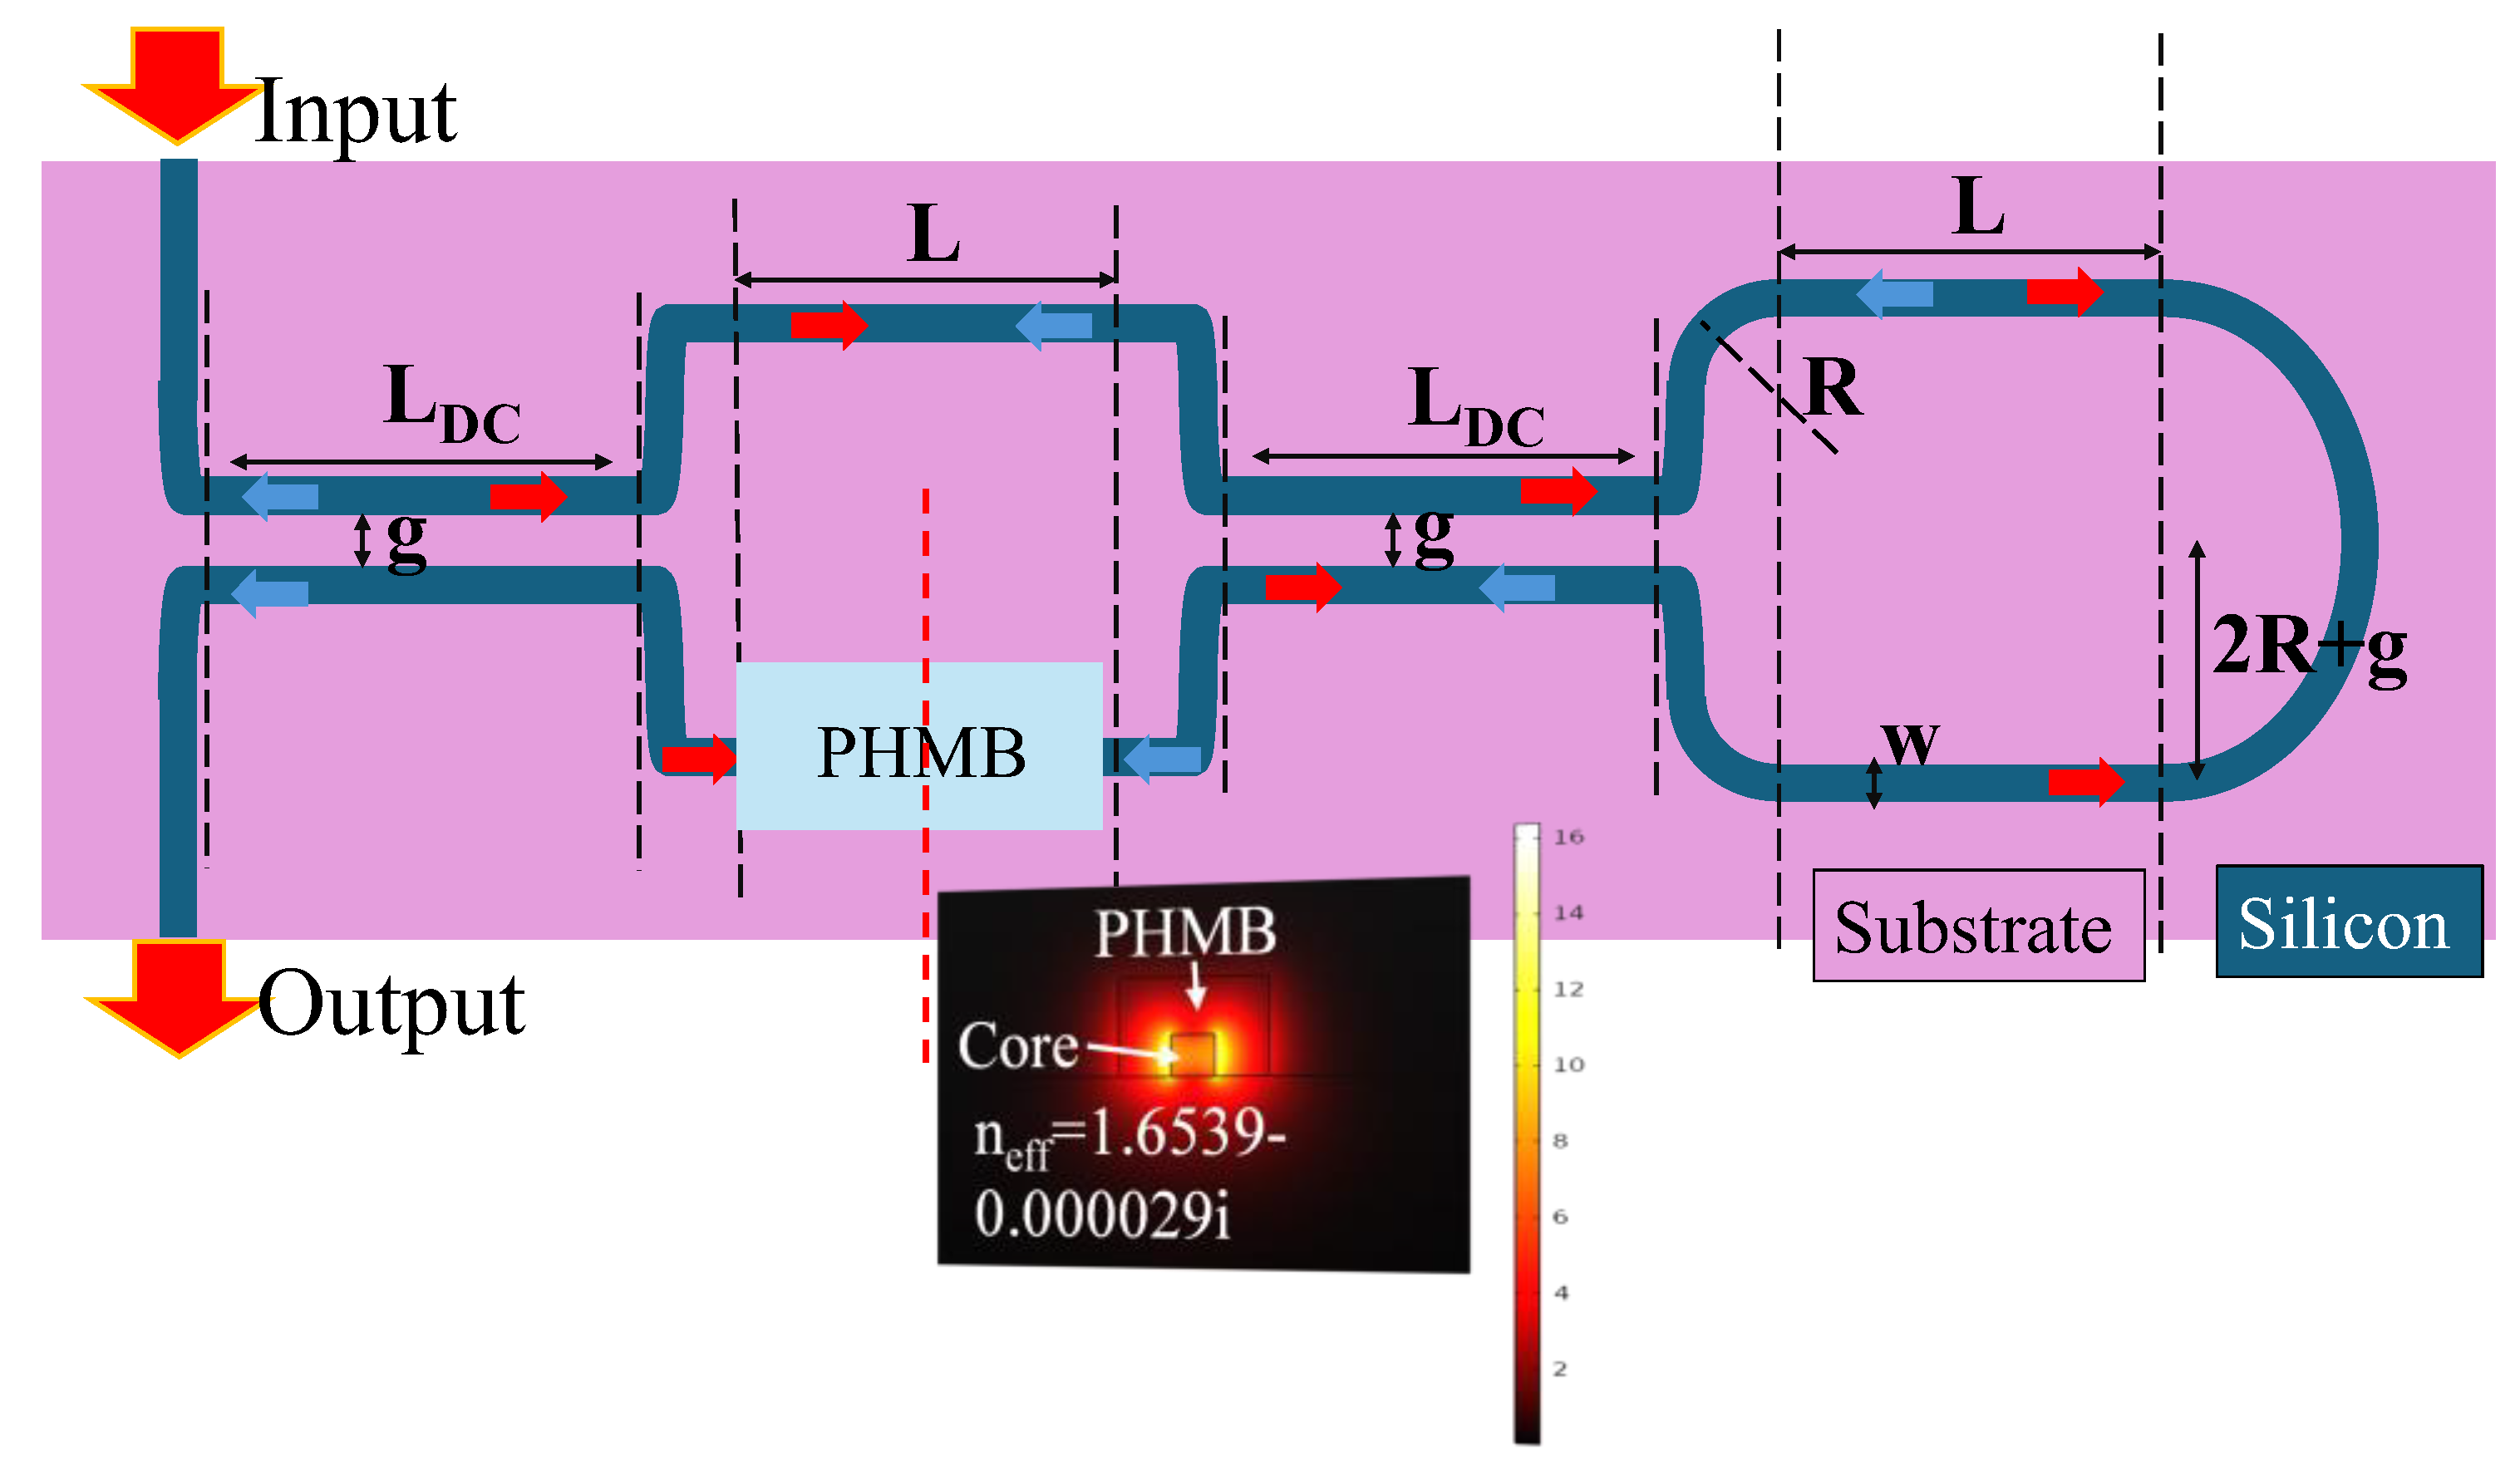
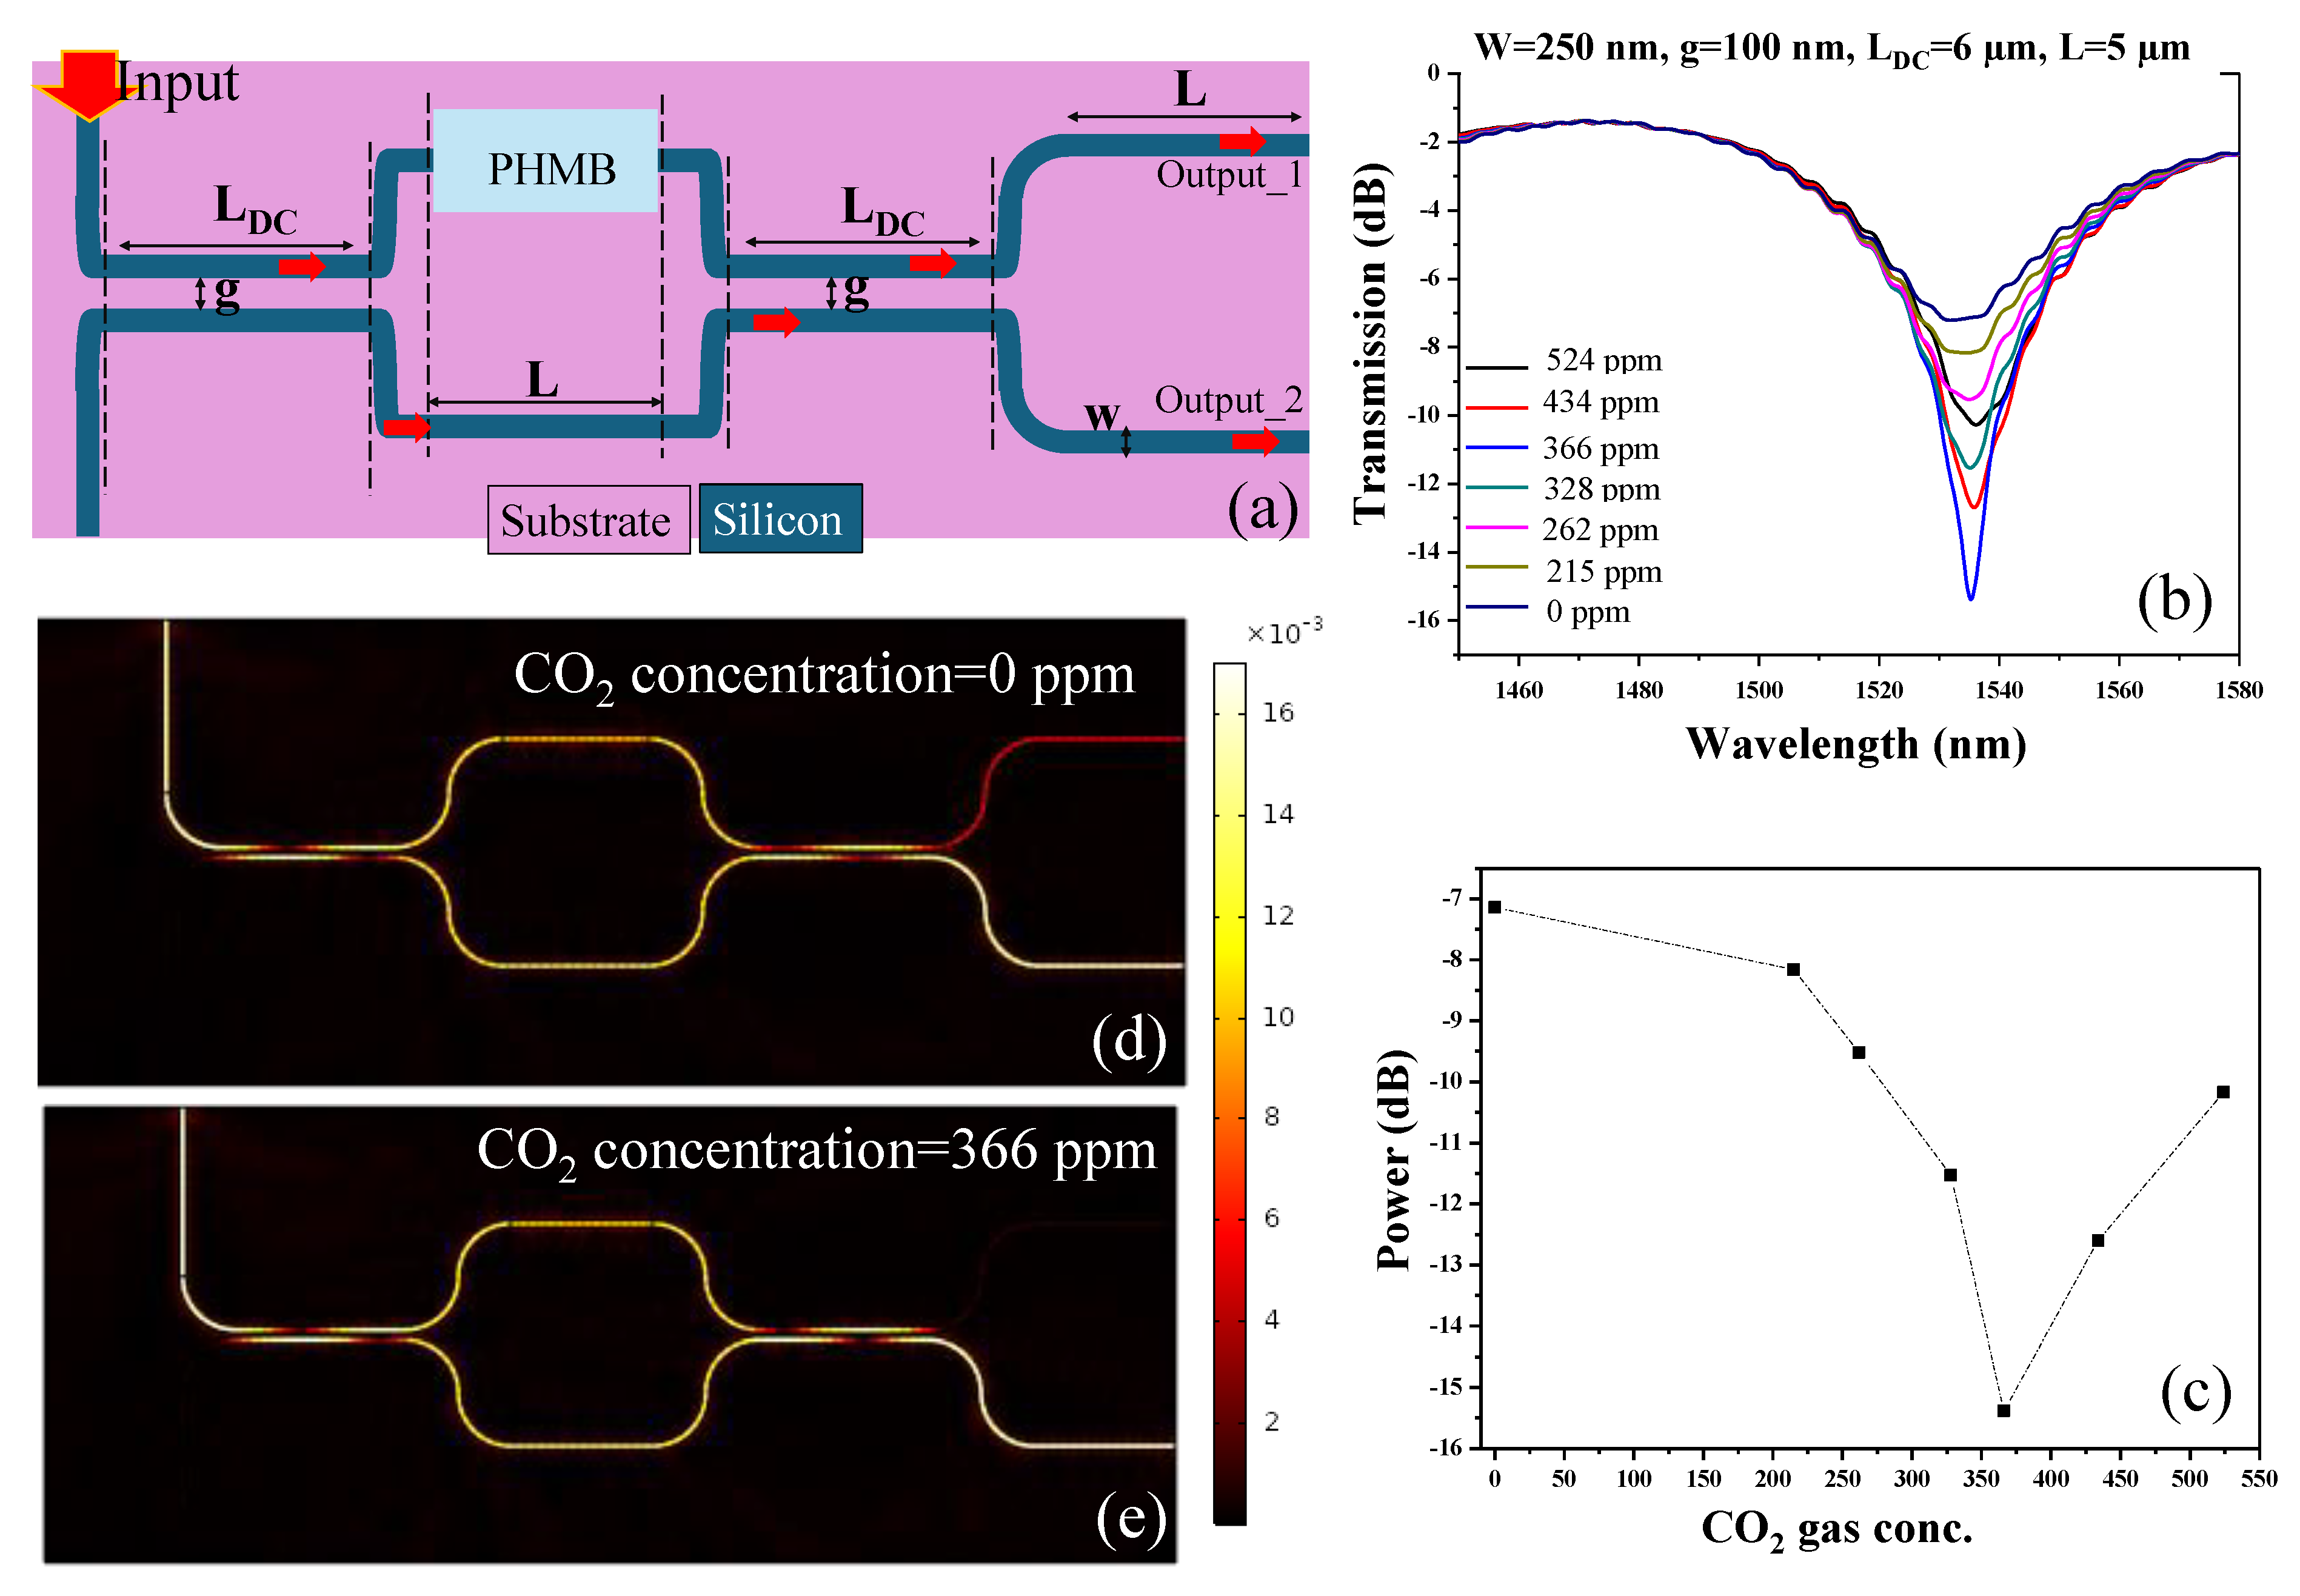
In this paper, a novel approach for developing a highly compact CO2 gas sensor is proposed by leveraging an SOI-based LT-MZI and PHMB polymer which is deposited onto the sensing arm as shown in Figure 1. The inset shows the E-field distribution at 1550 nm in the cross-sectional view of the waveguide covered with a 300 nm thick PHMB polymer. The height and width of the waveguide are considered as 220 nm and 250 nm, respectively. The LT-MZI configuration incorporates a Sagnac loop at the end of the conventional MZI, effectively halving the interferometer’s length. This advancement holds promise for enhanced sensor performance, scalability, and versatility in various applications requiring precise refractive index measurements. The length of the directional coupler waveguide and arms of the MZI segment are designated by LDC and L, respectively. The waveguide maintains a consistent width, denoted as w, across its entirety. Introducing the gap, represented as g, between the two waveguides of the directional coupler segment facilitates efficient coupling. Moreover, the fixed bending radius, denoted as R, set at 2 µm, ensures the design’s compactness, a crucial aspect in crafting effective sensing devices. Table 1 presents the range of the geometric parameters used in the device design.

Figure 1.
Schematic representation of LT-MZI structure embedded with PHMB polymer on the sensing arm for CO2 gas sensing. Inset presents the H-field distribution at 1550 nm in the cross-sectional view of the waveguide covered with PHMB polymer.

Table 1.
Geometric parameters of LT-MZI structure.
In an accurate endeavor, rigorous simulations are conducted to dissect transmittance patterns and field distributions. Employing the 2D-finite element method (2D-FEM) via COMSOL Multi-physics software (v.6.1), the intricacies of light propagation are determined. Leveraging the rich materials library within COMSOL, refractive indices for pivotal materials like silicon, SiO2, and air are obtained, ensuring alignment with real-world parameters. To maintain precision, the device design undergoes precise segmentation into subdomains, further subdivided into triangular mesh elements. Each element features a grid size precisely set at λ/100, striking an optimal balance between simulation accuracy and computational efficiency. In the pursuit of realistic electromagnetic wave phenomena analysis, an open-bounded domain is established as a fundamental imperative. To emulate this environment faithfully, scattering boundary conditions (SBCs) are judiciously implemented along the outer perimeters of the FEM simulation window.
Through these systematic approaches and the utilization of computing resources—an 8-core processor (3.8 GHz) paired with 128 GB of RAM—a suite of simulations characterized by their high fidelity and reliability are generated. These simulations offer invaluable insights into transmittance characteristics and field distributions, serving as a cornerstone for the optimization and advancement of photonic device designs.
3. Design of a 3 dB Directional Coupler
An integrated photonic 3 dB directional coupler is a crucial component in optical communication systems, facilitating efficient power splitting and combining two waveguides on a chip [24]. It achieves a balanced power division (50:50) through precise design and fabrication techniques, where half of the input power is transferred to each output port. This device operates based on the principle of evanescent field coupling, enabling the seamless transmission of optical signals with minimal loss and crosstalk. In general, the coupling length (LDC) can be calculated using the following formula:
where βeff is the effective propagation constant of the coupled modes, and the effective propagation constant βeff depends on the waveguide parameters, such as the waveguide’s refractive indices, the waveguide’s width and height, and the wavelength of light.
The transmission spectrum is plotted for a directional coupler based on an SOI platform with LDC varying between 0.5 µm and 12 µm. The transmission is calculated as Pout/Pin, where Pout and Pin are the output and input power, respectively. When designing with the COMSOL Multiphysics tool (v.6.1), it considers several types of losses of the light propagation in optical waveguides. These include absorption losses, where the waveguide material absorbs light energy. The software also accounts for radiation losses from waveguide bends and mode mismatches, as well as coupling losses at interfaces and junctions. Additionally, mode conversion losses occur when higher-order modes are present or when unintended mode coupling happens. By incorporating these factors, accurate modeling of waveguide performance and efficiency is obtained. Incremental changes in the width (w) of the waveguide core from 250 nm to 280 nm are made to examine their influence on the coupling length, as depicted in Figure 2a–d. Notably, the beat length of the directional coupler demonstrates an increase as w rises from 250 nm to 280 nm. In optical directional couplers, the beat length signifies the length over which the phase difference between the coupled modes changes by 2π radians (one full cycle). This metric is influenced by factors including the wavelength of light, refractive indices of the materials, and the physical dimensions of the coupler. Consequently, for w = 250 nm, achieving a 3 dB power distribution remains feasible even at an LDC as small as 3 µm. Figure 2e,f show the normalized H-field distribution in the directional coupler for LDC = 4 µm and LDC = 3 µm, respectively.
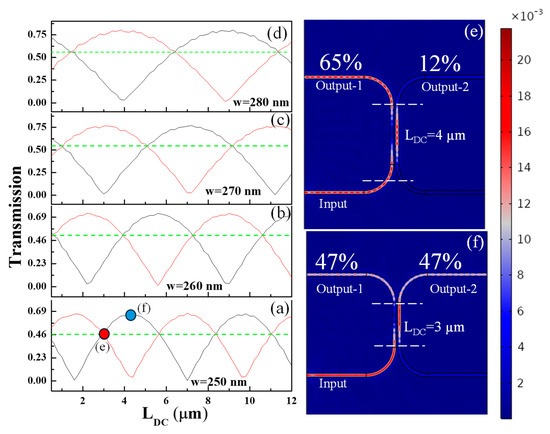
Figure 2.
Transmission of a directional coupler segment versus LDC for waveguide width (w) of (a) 250 nm, (b) 260 nm, (c) 270 nm, and (d) 280 nm. The normalized H-field distribution in the directional coupler for (e) LDC = 4 µm and (f) LDC = 3 µm. Note: The gap between the waveguides is fixed at 100 nm. Red and black lines represent the output power at Output-1 and Output-2, respectively. Whereas the green dashed line indicates the equal power distribution at both output port.
4. Optimization of LT-MZI Structure
In this section, the LT-MZI structure undergoes optimization to ascertain the spectral characteristics of the device. At this stage, the LT-MZI structure is examined in its bare form, devoid of any PHMB polymer covering on the sensing arm, and lacks an upper cladding in this particular configuration. Initially, the impact of variations in LDC on both interference dips and the free spectral range (FSR) is thoroughly investigated which is a fundamental parameter that defines the spacing between consecutive resonance frequencies within the device. It represents the spectral range over which the resonator can operate without encountering spectral overlap between adjacent resonances. Essentially, the FSR determines the resolution or spacing capability of the resonator’s spectral response. It is typically influenced by various factors such as the physical dimensions of the resonator, including its length, width, and height, as well as the refractive index of the material.
Interference dips, a key aspect in MZI structures, signify instances where the output intensity of the interferometer diminishes due to interference between the two optical paths. LDC is varied between 3 µm and 6 µm, whereas the other geometric parameters such as w, g, and L are fixed at 250 nm, 100 nm, and 5 µm, respectively. The transmission of the device is plotted by utilizing the expression , where Pout and Pin are the output and input power, respectively.
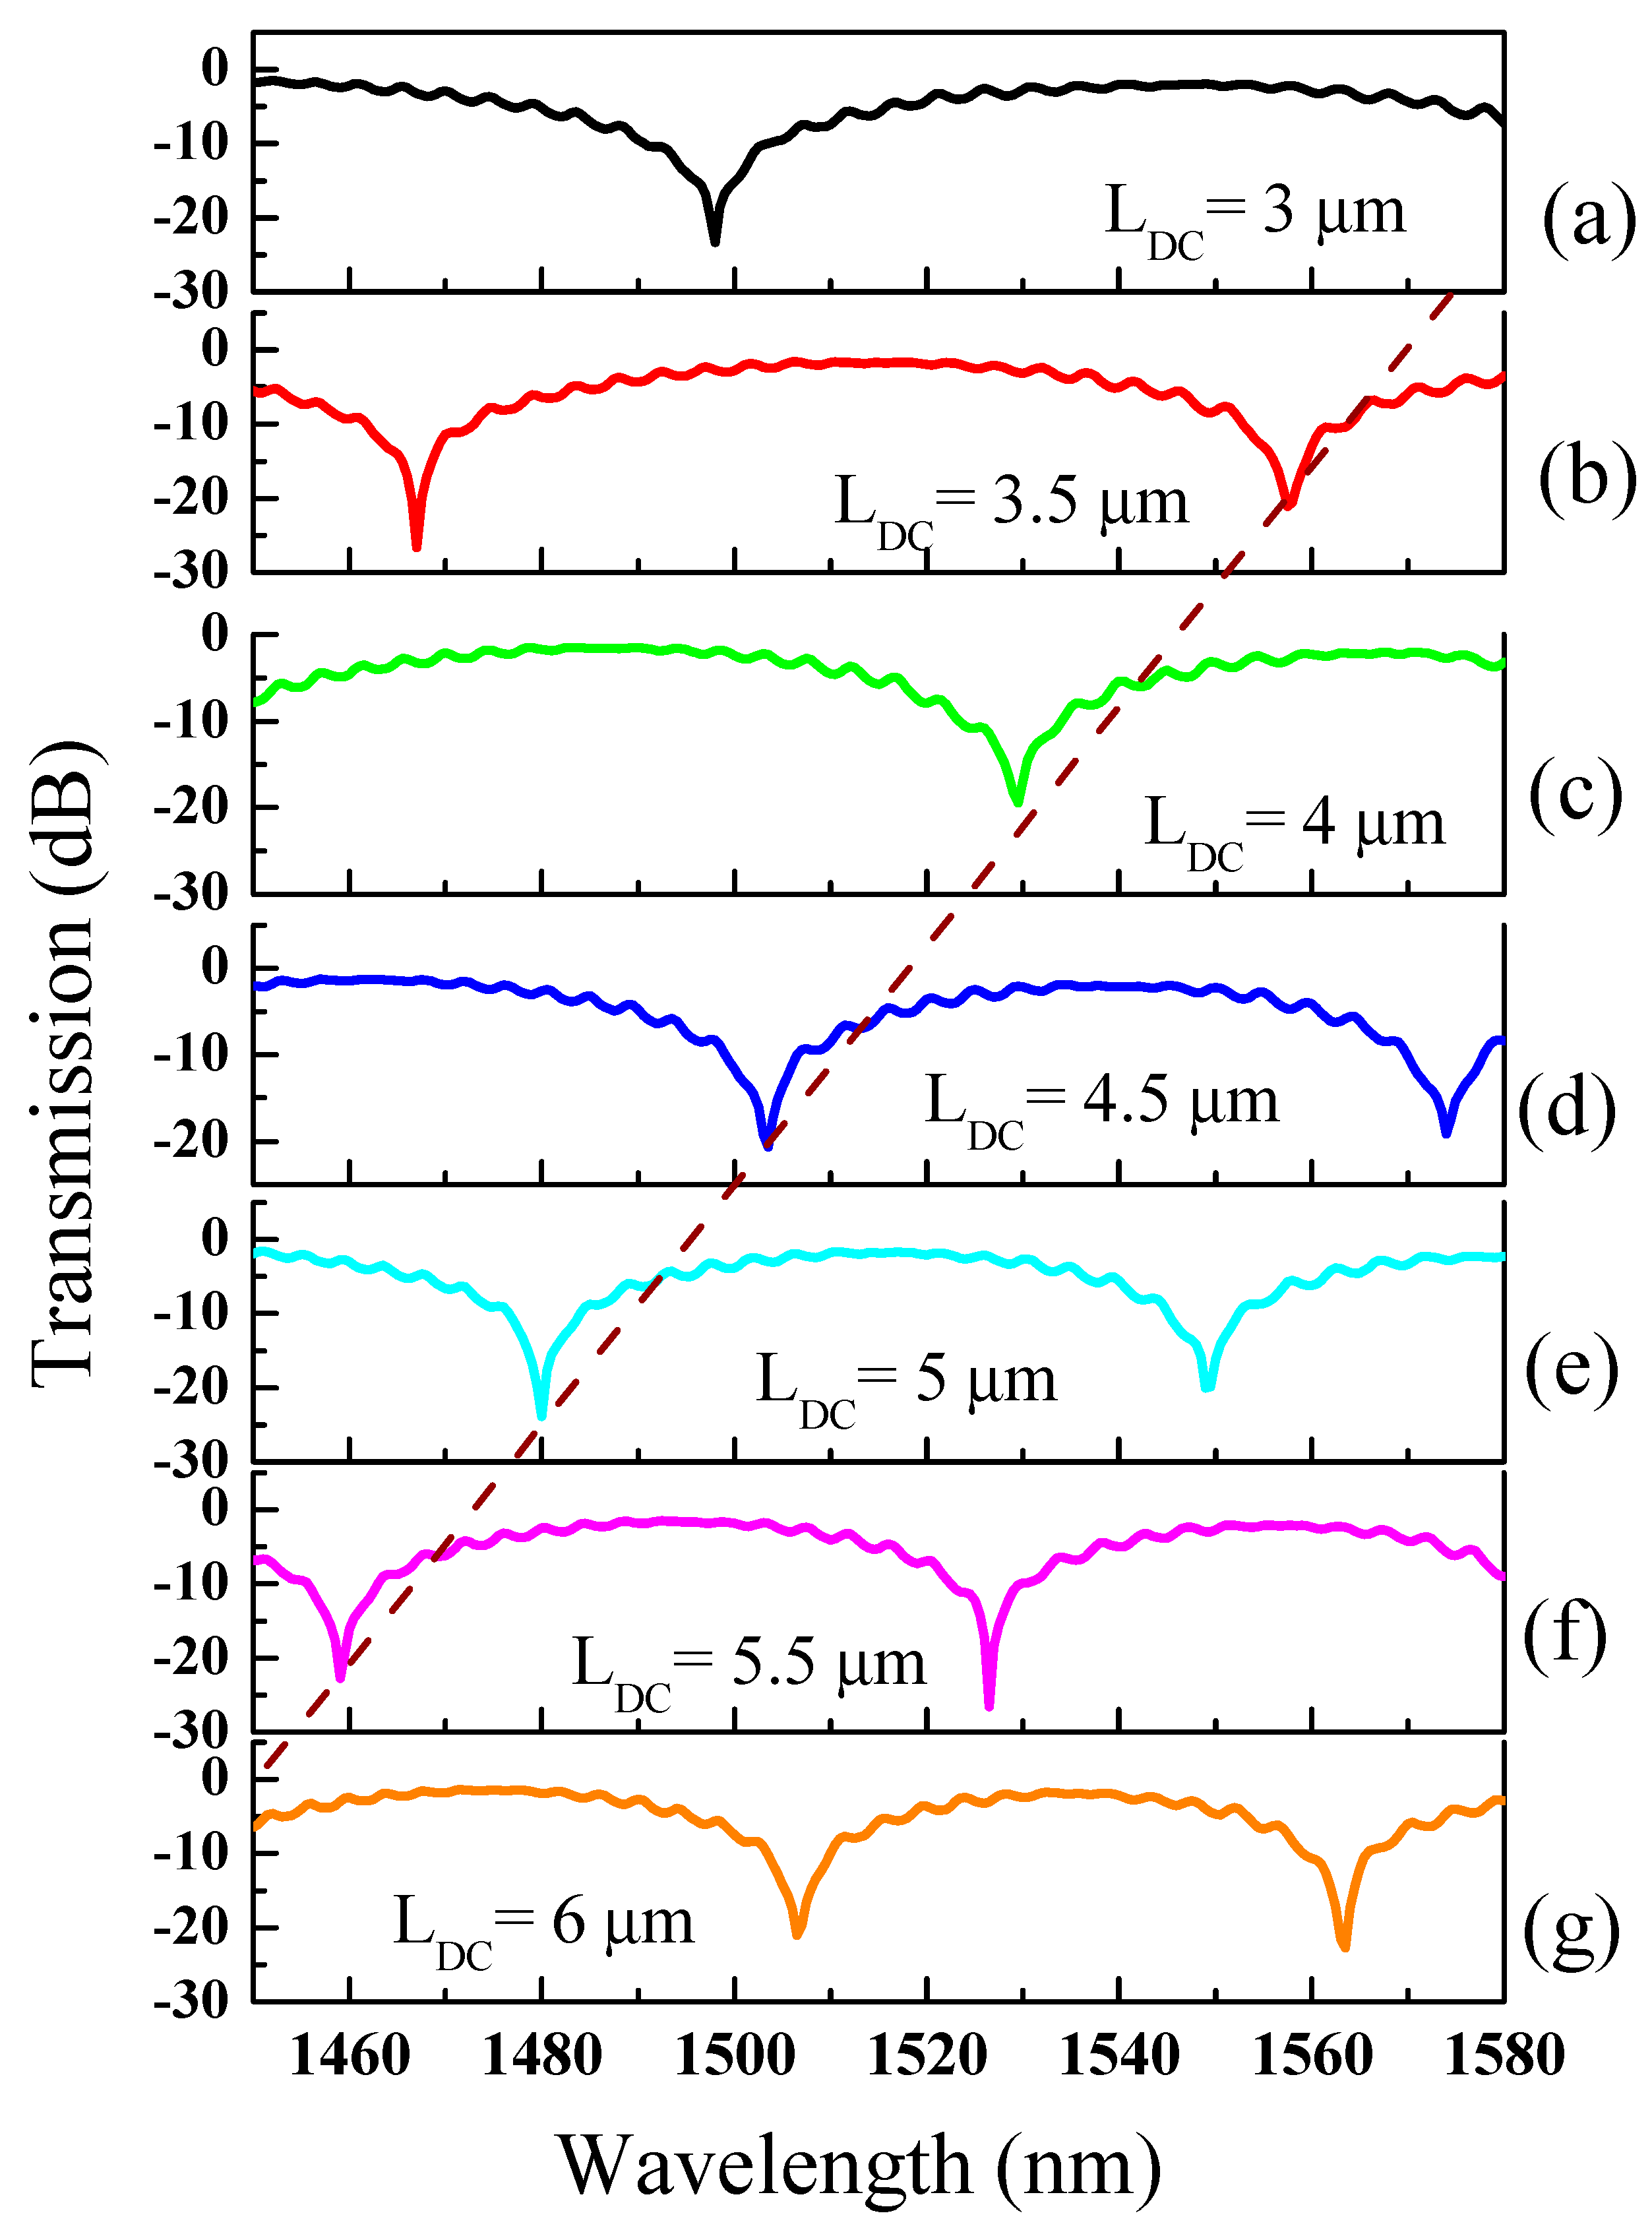
From Figure 3a–g, it is evident that as LDC increases from 3 µm to 6 µm, the FSR of the device decreases from 90 nm to 57 nm, accompanied by a noticeable blueshift in the dips. The extinction ratio (ER) of the device ranges from 19 dB to 27 dB, indicating a robust destructive interference resulting from the interaction of two light waves with opposite phases. For further investigation, LDC is fixed at 6 µm, which provides a good transmission characteristic in the desired wavelength range.
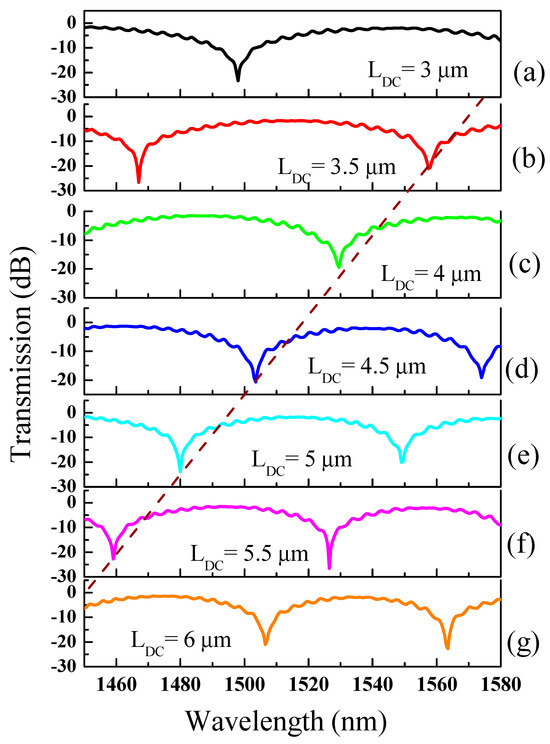
Figure 3.
Transmission spectrum of the LT-MZI structure versus LDC, (a) 3 µm, (b) 3.5 µm, (c) 4 µm, (d) 4.5 µm, (e) 5 µm, (f) 5.5 µm, (g) 6 µm. Note: w = 250 nm, g = 100 nm, L = 5 µm. The dashed line indicates the blueshift in the wavelength as LDC increases.
The width (w) of the waveguide in integrated photonic sensors plays an important role in defining the sensitivity of the device. As w approaches the cut-off, even slight variations in factors like material properties, dimensions, or the presence of external elements can cause noticeable alterations in its transmission characteristics. This heightened sensitivity is advantageous for sensing applications because it enables the detection of subtle changes in the environment with greater precision. Consequently, designing a waveguide near the cut-off can enhance the sensitivity of sensors based on waveguide principles, making them more effective for detecting changes in parameters such as temperature, pressure, or chemical composition.
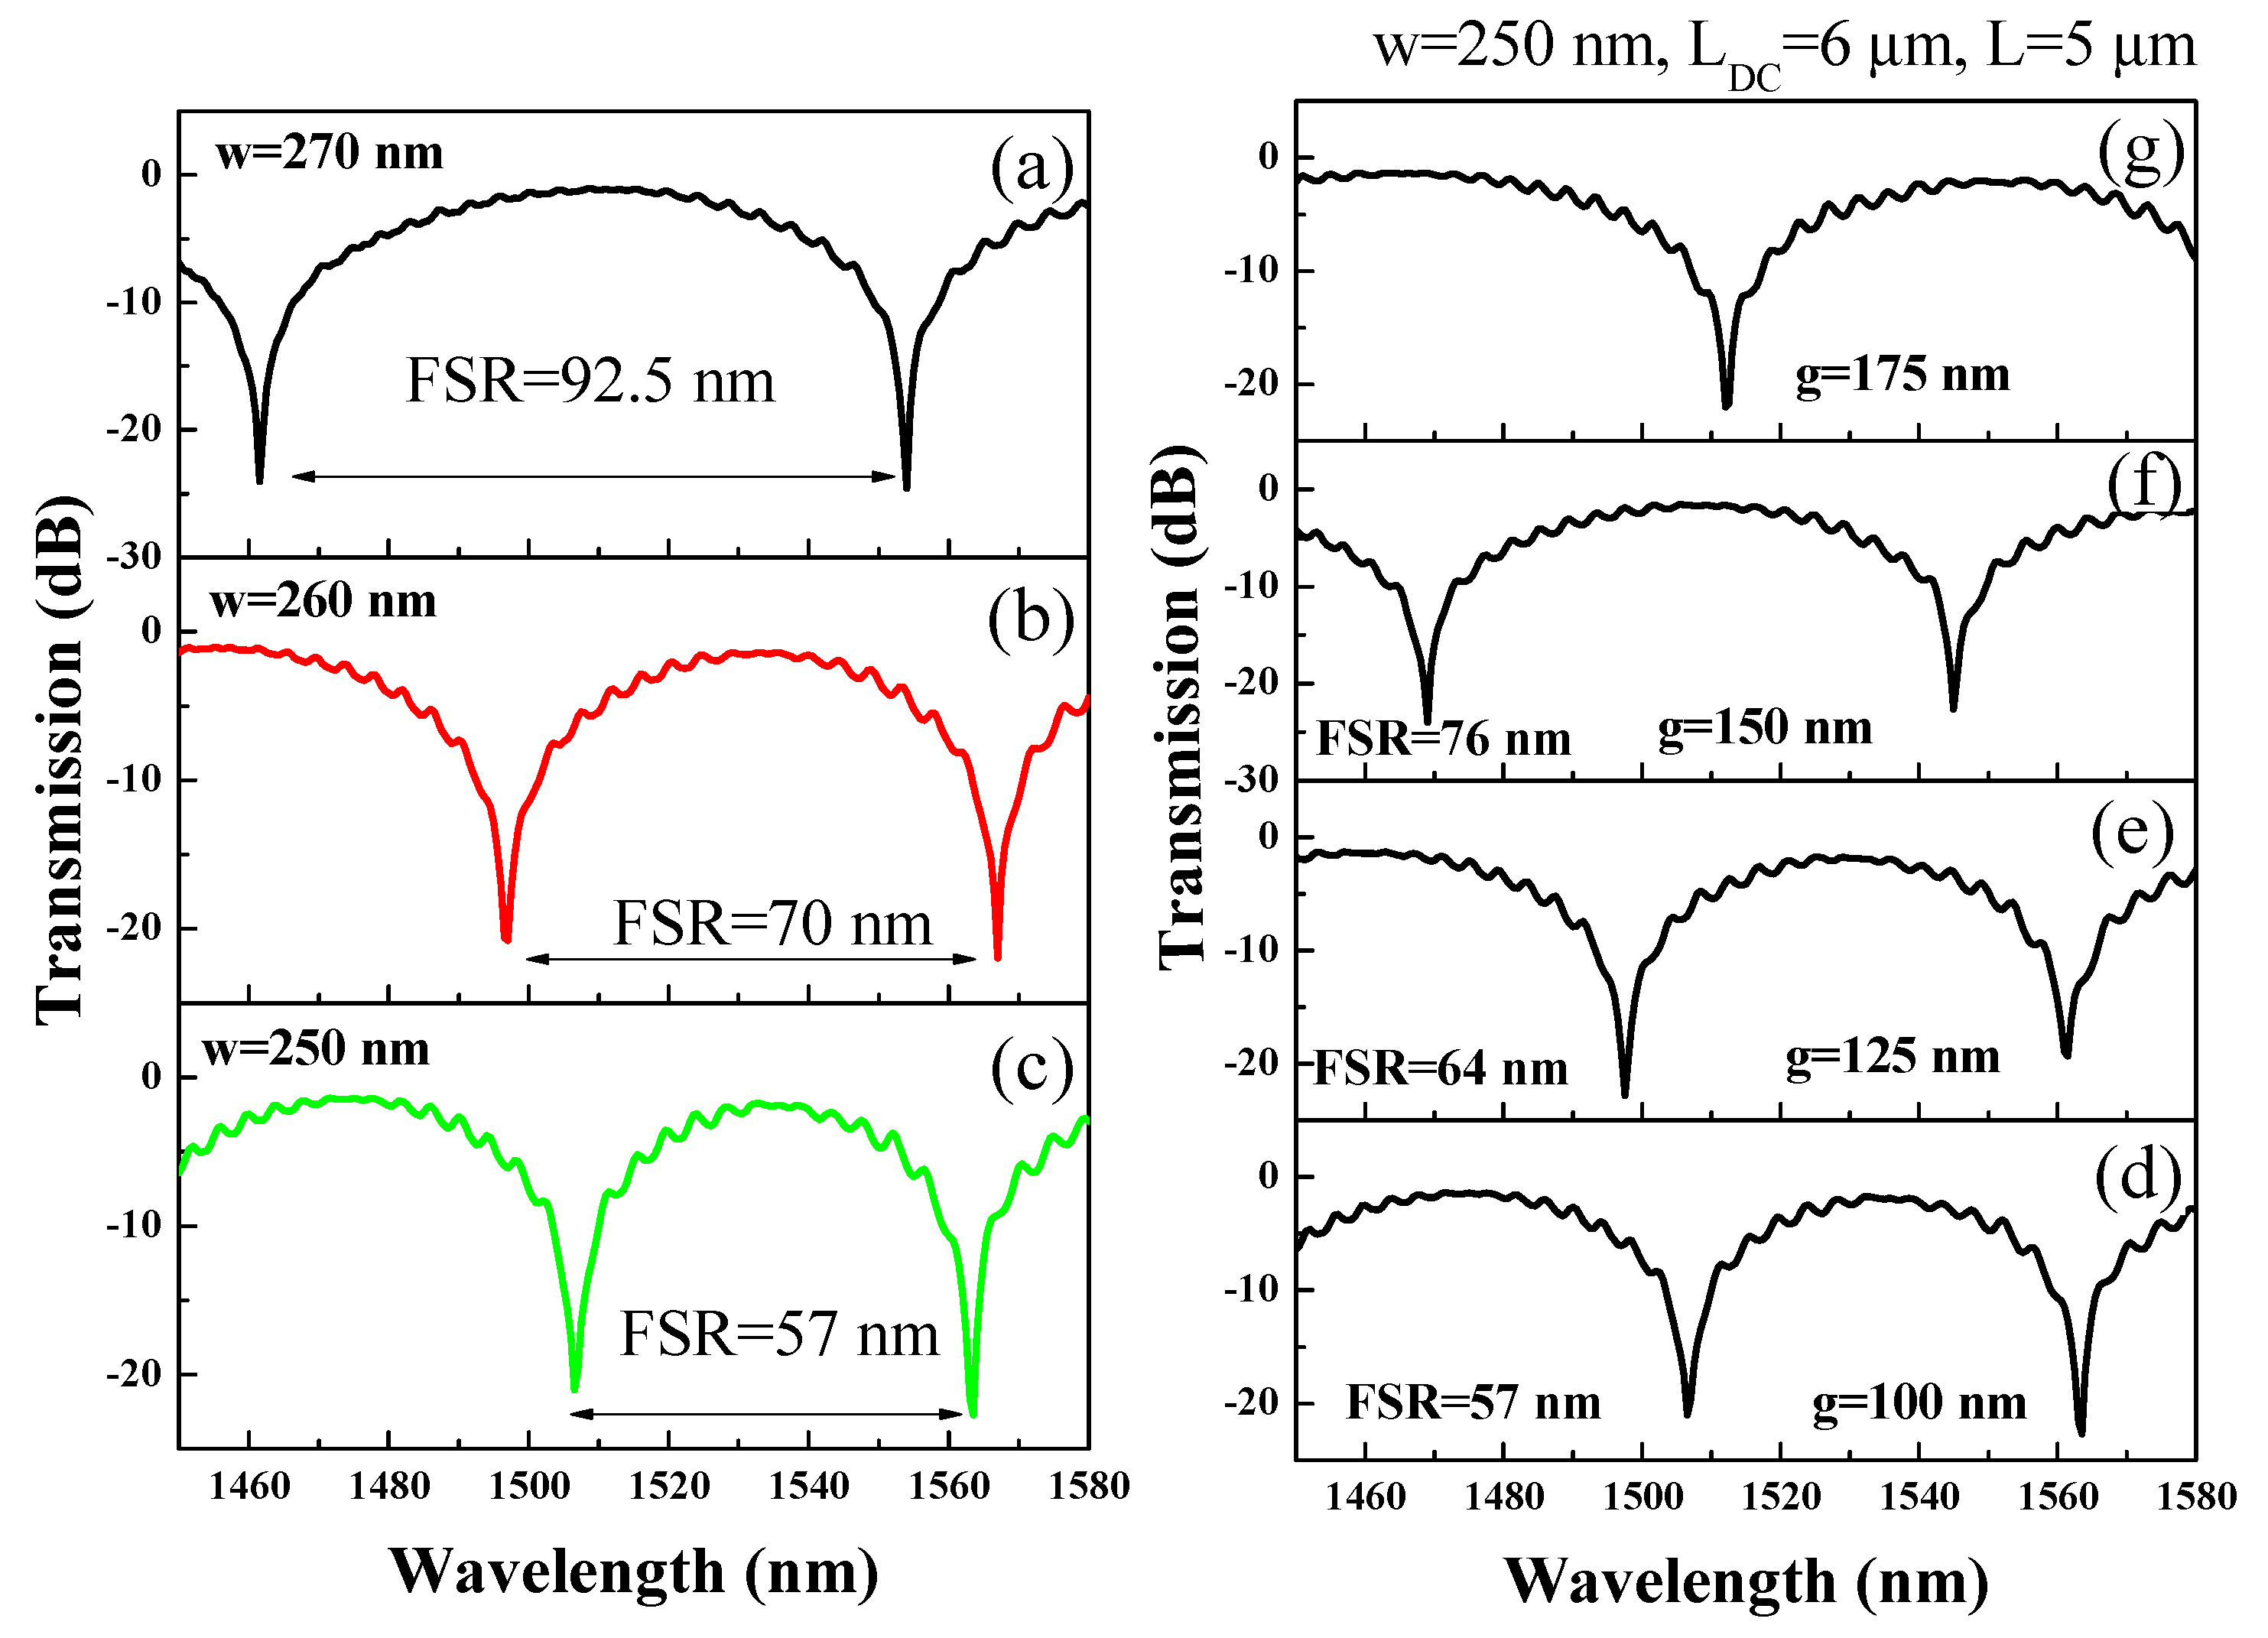
The impact of w on the FSR of the device, spanning from 250 nm to 270 nm is determined, as illustrated in Figure 4a–c. While keeping other geometric parameters such as LDC, g, and L constant at 6 µm, 100 nm, and 5 µm, respectively, a notable trend is observed. Specifically, the FSR exhibited a discernible rise from 57 nm to 92.5 nm with an increment in w from 250 nm to 270 nm. This observation underscores the pivotal role that waveguide dimensions, which in turn contribute to the total path length of the device, play in shaping its spectral characteristics.
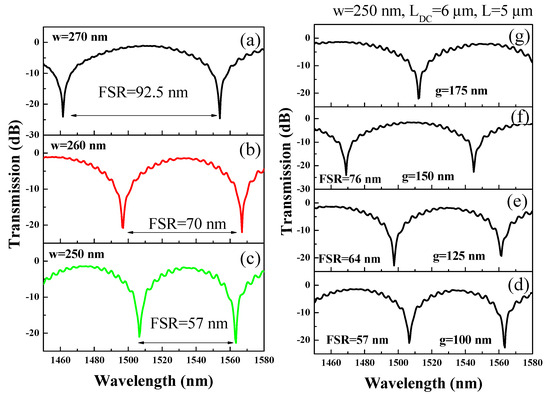
Figure 4.
Transmission spectrum of LT-MZI versus w, (a) 250 nm, (b) 260 nm, (c) w = 270 nm. Note: LDC = 6 µm, g = 100 nm, L = 5 µm. Transmission spectrum of LT-MZI versus g, (d) 100 nm, (e) 125 nm, (f) 150 nm, (g) 175 nm. Note. LDC = 6 µm, L = 5 µm, w = 250 nm.
In the design of an LT-MZI, the gap between the two waveguides of a 3 dB directional coupler significantly impacts the power division across the wavelength spectrum. The spacing between the waveguides determines the coupling strength between them, which in turn affects the transfer of power from one waveguide to the other. In the context of a wavelength spectrum, variations in g can lead to changes in the interference pattern observed within the coupler. When g is small, i.e., 100 nm, the FSR of the LT-MZI is 57 nm, which increases beyond 80 nm as g approaches 175 nm (see Figure 4d–g). Therefore, precise control over the waveguide separation is crucial for optimizing the power division and maintaining spectral integrity in the LT-MZI structure.
5. Results and Discussion
CO2, a colorless, odorless, and non-flammable greenhouse gas, is primarily generated through the combustion of carbonaceous materials or animal metabolism. Its escalating concentration and growth rate pose severe threats to the environment, including global warming and unsustainable environmental challenges [25]. Consequently, there is a pressing need for highly sensitive CO2 gas sensors to monitor greenhouse gas concentrations effectively. With increasing CO2 levels in the surrounding medium, the refractive index of functionalization layers undergoes discernible changes as shown in Table 2.
After fabricating the primary sensing structure using electron-beam lithography (EBL) and reactive ion etching (RIE), a second lithography process is required. In this process, a photoresist layer is spin-coated over the entire sample. Subsequently, a small sensing window is left open on the sensing arm of the device. PHMB is then spin-coated within this window, and the thickness of the PHMB layer is precisely controlled by adjusting the spin-coating speed. For effective CO2 gas sensing applications, a PHMB thickness of approximately 240–250 nm is optimal [26].
Table 2.
Refractive index of PHMB versus CO2 gas concentration [27,28].
Table 2.
Refractive index of PHMB versus CO2 gas concentration [27,28].
| PHMB Refractive Index | Gas Concentration (ppm) |
|---|---|
| 1.55 | 0 |
| 1.54 | 215 |
| 1.53 | 262 |
| 1.52 | 328 |
| 1.51 | 366 |
| 1.49 | 434 |
| 1.48 | 524 |
Polyhexamethylene biguanide (PHMB), featuring basic amide-bearing functional groups and belonging to the guanidine polymer family, emerges as a prime candidate for functionalization polymer layers due to its sensitivity and selectivity to low CO2 concentrations at room temperature and atmospheric pressure [27]. Notably, unlike previous functional materials, PHMB does not necessitate the presence of water vapor for CO2 absorption and release. Gas sensors employing PHMB exhibit a linear correlation between the resonance wavelength blueshift and CO2 concentration [22,29]. Remarkably, there are no reported instances of gases other than CO2 interfering with the sensitivity of the PHMB polymer layer, rendering it highly suitable for CO2 gas sensing applications. In a study analyzing PHMB’s selectivity as a functional layer for CO2 gas against hydrogen gas, it was confirmed that the sensor displayed no response to hydrogen or nitrogen gas, ensuring accurate detection of CO2 without false positives [26].
The concentration of CO2 gas deemed dangerous for humans typically begins to pose health risks when it exceeds certain thresholds. While CO2 is naturally present in the atmosphere at concentrations around 400 ppm, indoor environments can experience elevated levels due to poor ventilation or specific activities such as combustion. Generally, concentrations above 1000 ppm are considered to cause discomfort and may lead to symptoms such as headaches, dizziness, and drowsiness. At higher concentrations, exceeding 5000 ppm, CO2 can induce more severe symptoms, including difficulty breathing, increased heart rate, and impaired cognitive function. Extremely high concentrations, reaching tens of thousands of ppm, are life-threatening and can result in unconsciousness or even death. Therefore, maintaining CO2 levels below 1000 ppm in indoor environments is advisable to ensure the safety and well-being of occupants.
Initially, the MZI structure without an end loop is investigated for its CO2 gas sensing capabilities. The schematic diagram of this structure is depicted in Figure 5a. The intensity interrogation method in an MZI structure involves monitoring changes in the intensity of light at the output_1 port to detect variations in external conditions, such as gas concentration. In this method, the interference pattern of light, which results from the phase difference between the two arms of the interferometer, is analyzed. As the external condition (e.g., gas concentration) changes, it affects the refractive index of the PHMB polymer, resulting in the shift in the effective refractive index in the sensing arm of the MZI, leading to a shift in the interference pattern. This shift causes a change in the intensity of light at specific wavelengths.
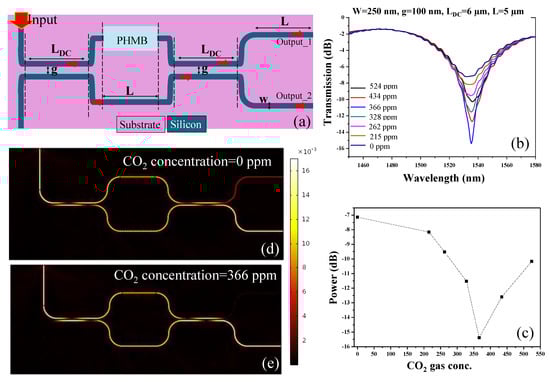
Figure 5.
(a) Schematic representation of MZI structure without end loop (red arrows indicate the light propagation direction), (b) transmission spectrum versus CO2 gas concentration, (c) power decay at Output_1 for the operational wavelength of 1535.5 nm versus CO2 gas concentration. Normalized H-field distribution in the device at the wavelength of 1535.5 nm for the gas concentrations of (d) 0 ppm and (e) 366 ppm.
The transmission spectrum of the device is plotted over a wavelength range of 1450 nm to 1580 nm, with varying gas concentrations, as shown in Figure 5b. The geometric parameters of the device are fixed, with w = 250 nm, g = 100 nm, LDC = 6 µm, and L = 5 µm. At the operational wavelength of 1535.5 nm, destructive interference occurs, resulting in a dip in the transmission spectrum that becomes more pronounced as the gas concentration increases. Figure 5c illustrates the power measured at Output_1 at the wavelength of 1535.5 nm under different gas concentrations. It is observed that the power decreases from −7.15 dB to −15.38 dB as the gas concentration rises from 0 ppm to 366 ppm. However, beyond 366 ppm, a slight increase in power is noted, which may be attributed to weak destructive interference. Additionally, the H-field distribution within the device is presented for gas concentrations of 0 ppm and 366 ppm in Figure 5d,e, respectively. These figures provide a visual representation of the field changes due to varying gas concentrations.
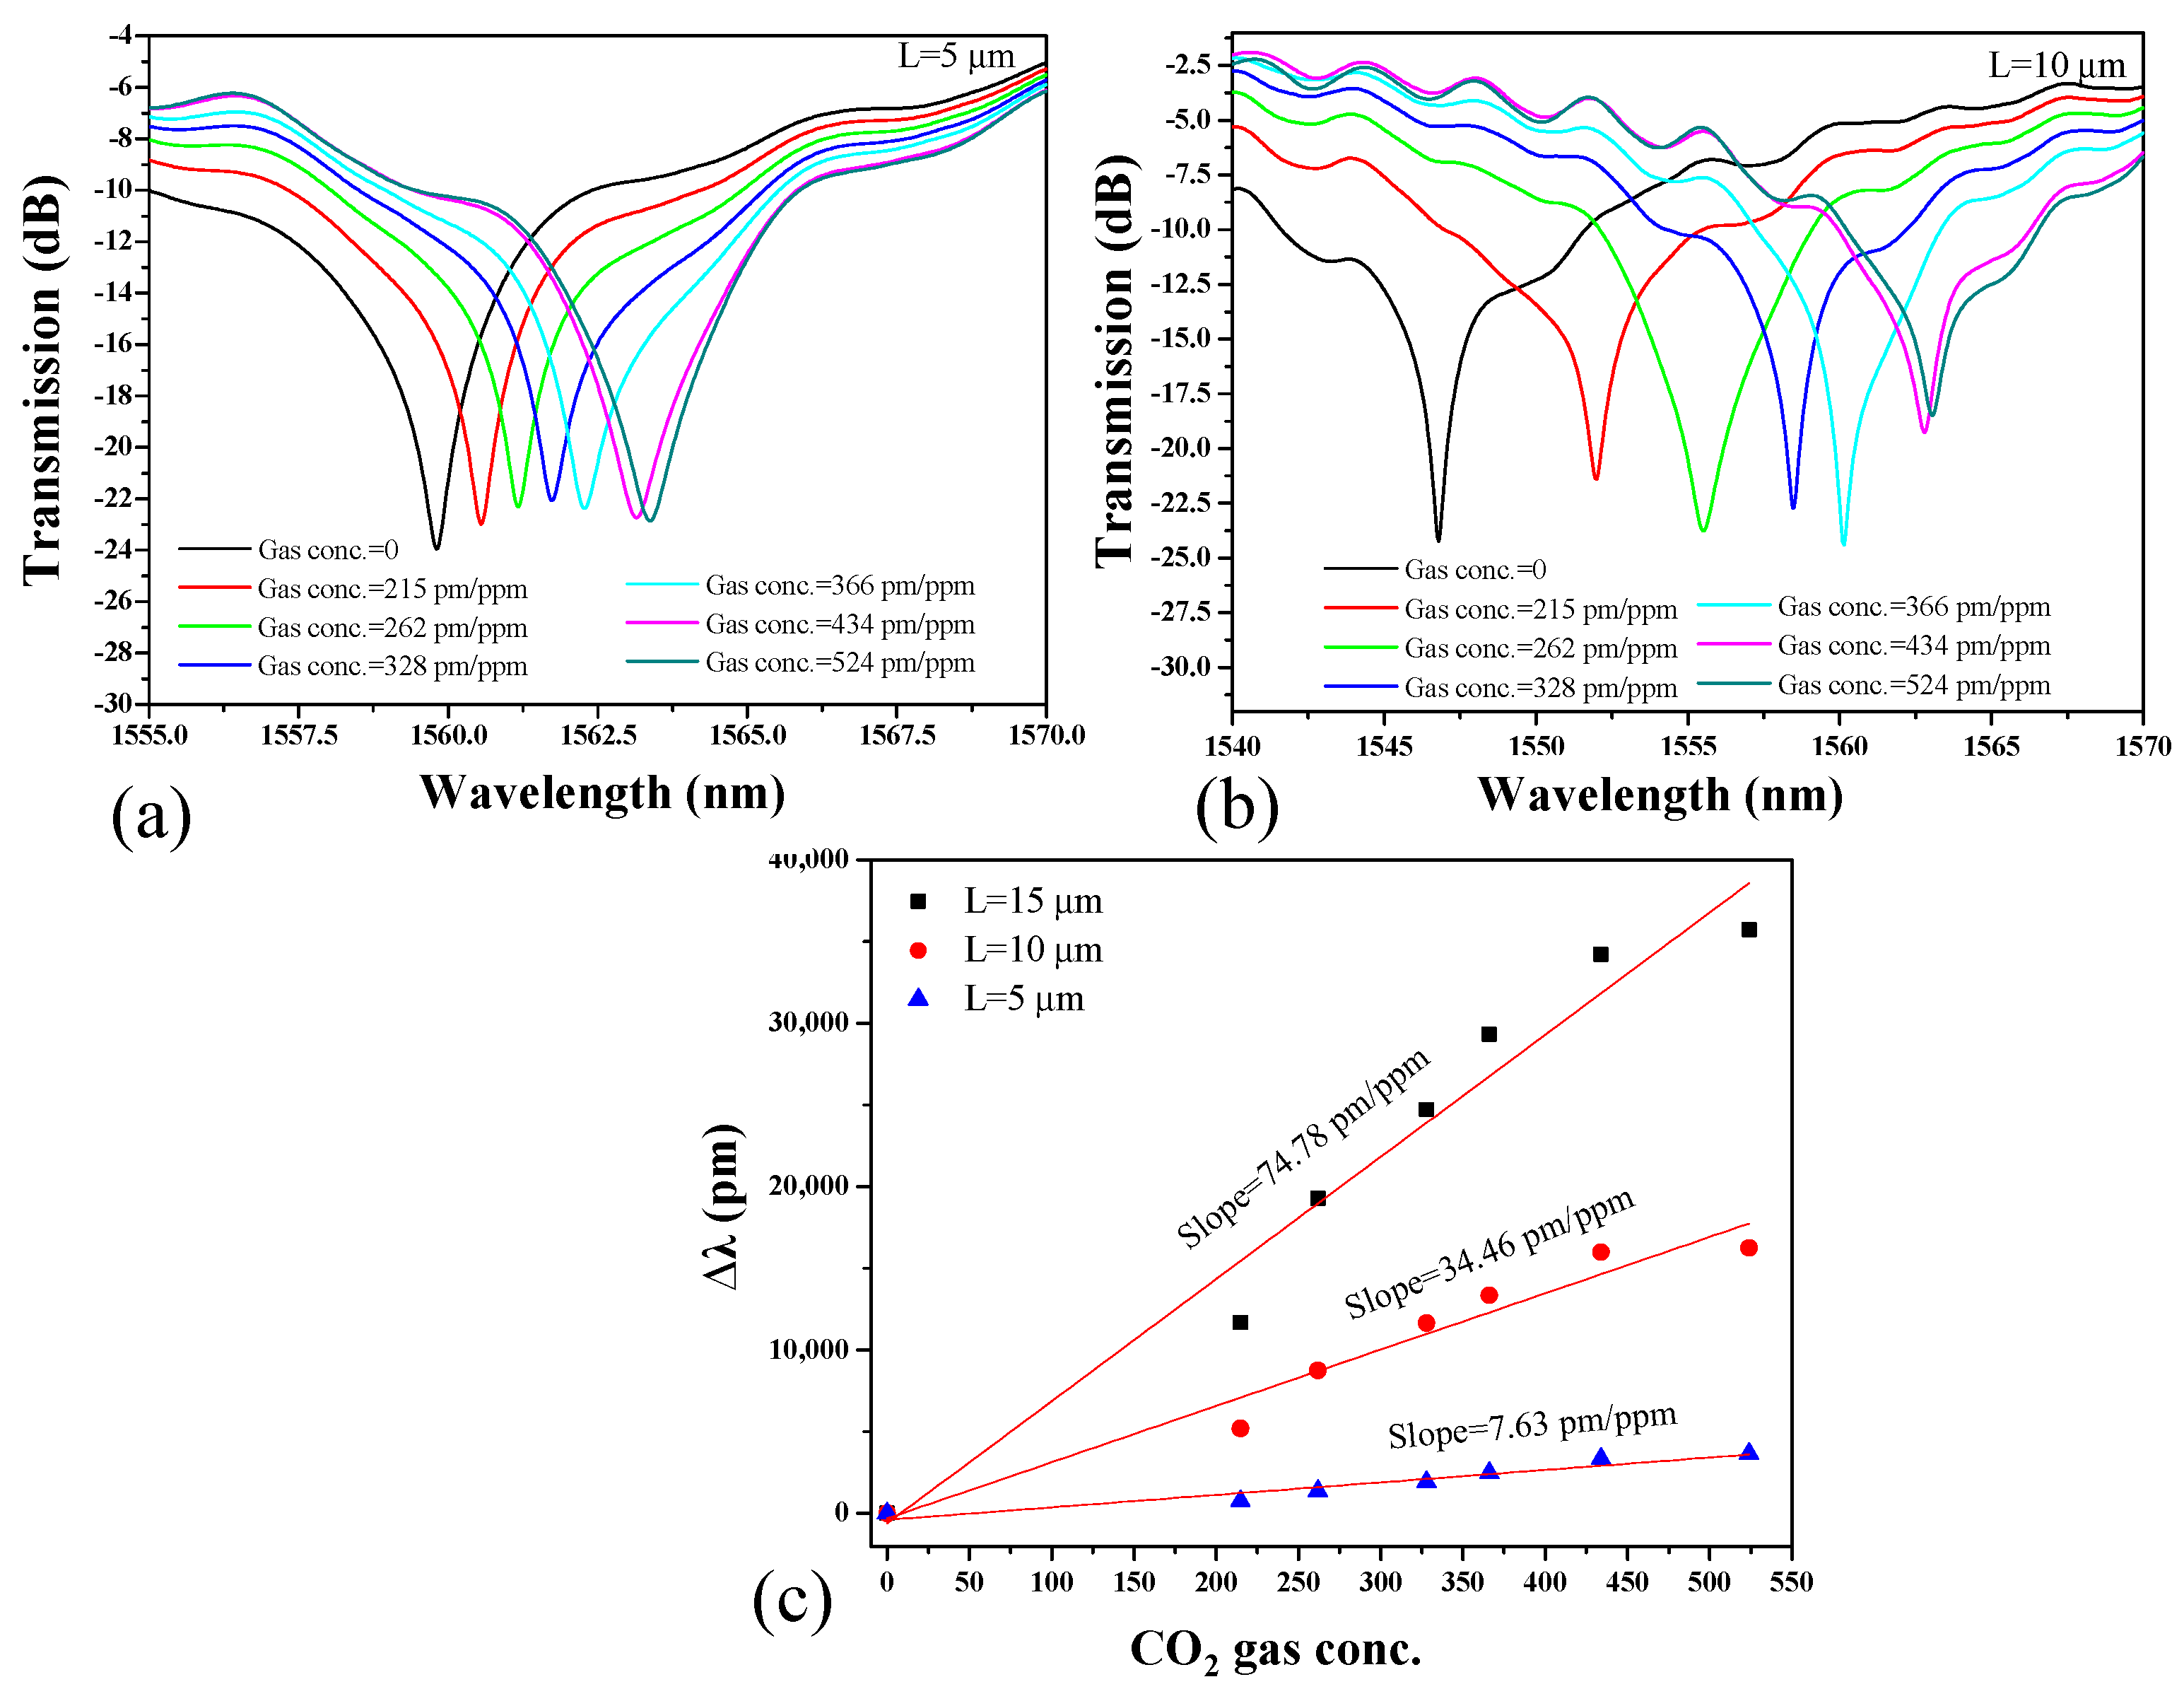
The transmission spectrum of the LT-MZI structure under varying CO2 gas concentrations is methodically depicted for two distinct arm lengths, L = 5 µm and L = 10 µm, illustrated in Figure 6a,b, respectively. Analyzing these figures reveals a noticeable trend: as the CO2 gas concentration escalates from 0 to 524 ppm, an observable red shift in the interference dip occurs. However, the magnitude of this wavelength shift is intrinsically linked to the length of the MZI arms.
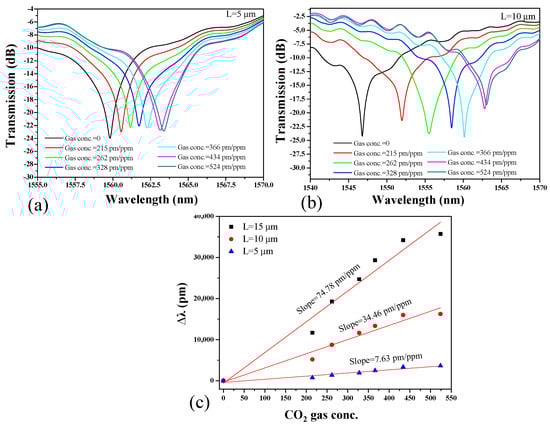
Figure 6.
Transmission spectrum of LT-MZI structure in the presence of CO2 gas with different concentrations. The length (L) of the sensing arm is (a) 5 µm and (b) 10 µm. (c) Sensitivity of the device for L = 5 µm, 10, 15 µm. Note: The remaining geometric parameters are LDC = 6 µm, w = 250 nm, and g = 100 nm.
The sensitivity of an MZI structure increases with longer arm lengths (L = 15 µm) compared to shorter ones (L = 5 µm) as shown in Figure 6c. Firstly, longer arms provide a greater interaction length for the propagating optical signal within the device, allowing for more opportunities for the signal to experience phase changes induced by external stimuli, such as refractive index variations induced by the change in the properties of PHMB deposited on the sensing arm. This increased interaction length enhances the sensitivity of the MZI to these external perturbations. Additionally, longer arm lengths typically result in a larger optical path length imbalance between the two arms of the interferometer. This imbalance amplifies the phase difference between the two arms, leading to more significant interference pattern changes in response to minute changes in the external conditions. Furthermore, longer arms inherently possess a higher spatial resolution, enabling the detection of smaller changes in the environment or sample properties. The sensitivity of the proposed device was estimated at 7.63 pm/ppm, 34.46 pm/ppm, and 74.78 pm/ppm for the arm lengths (L) of 5 µm, 10 µm, and 15 µm, respectively. Furthermore, Table 3 showcases not only the footprint of the device but also the sensitivity it offers.
Table 3.
Device footprint versus sensitivity.
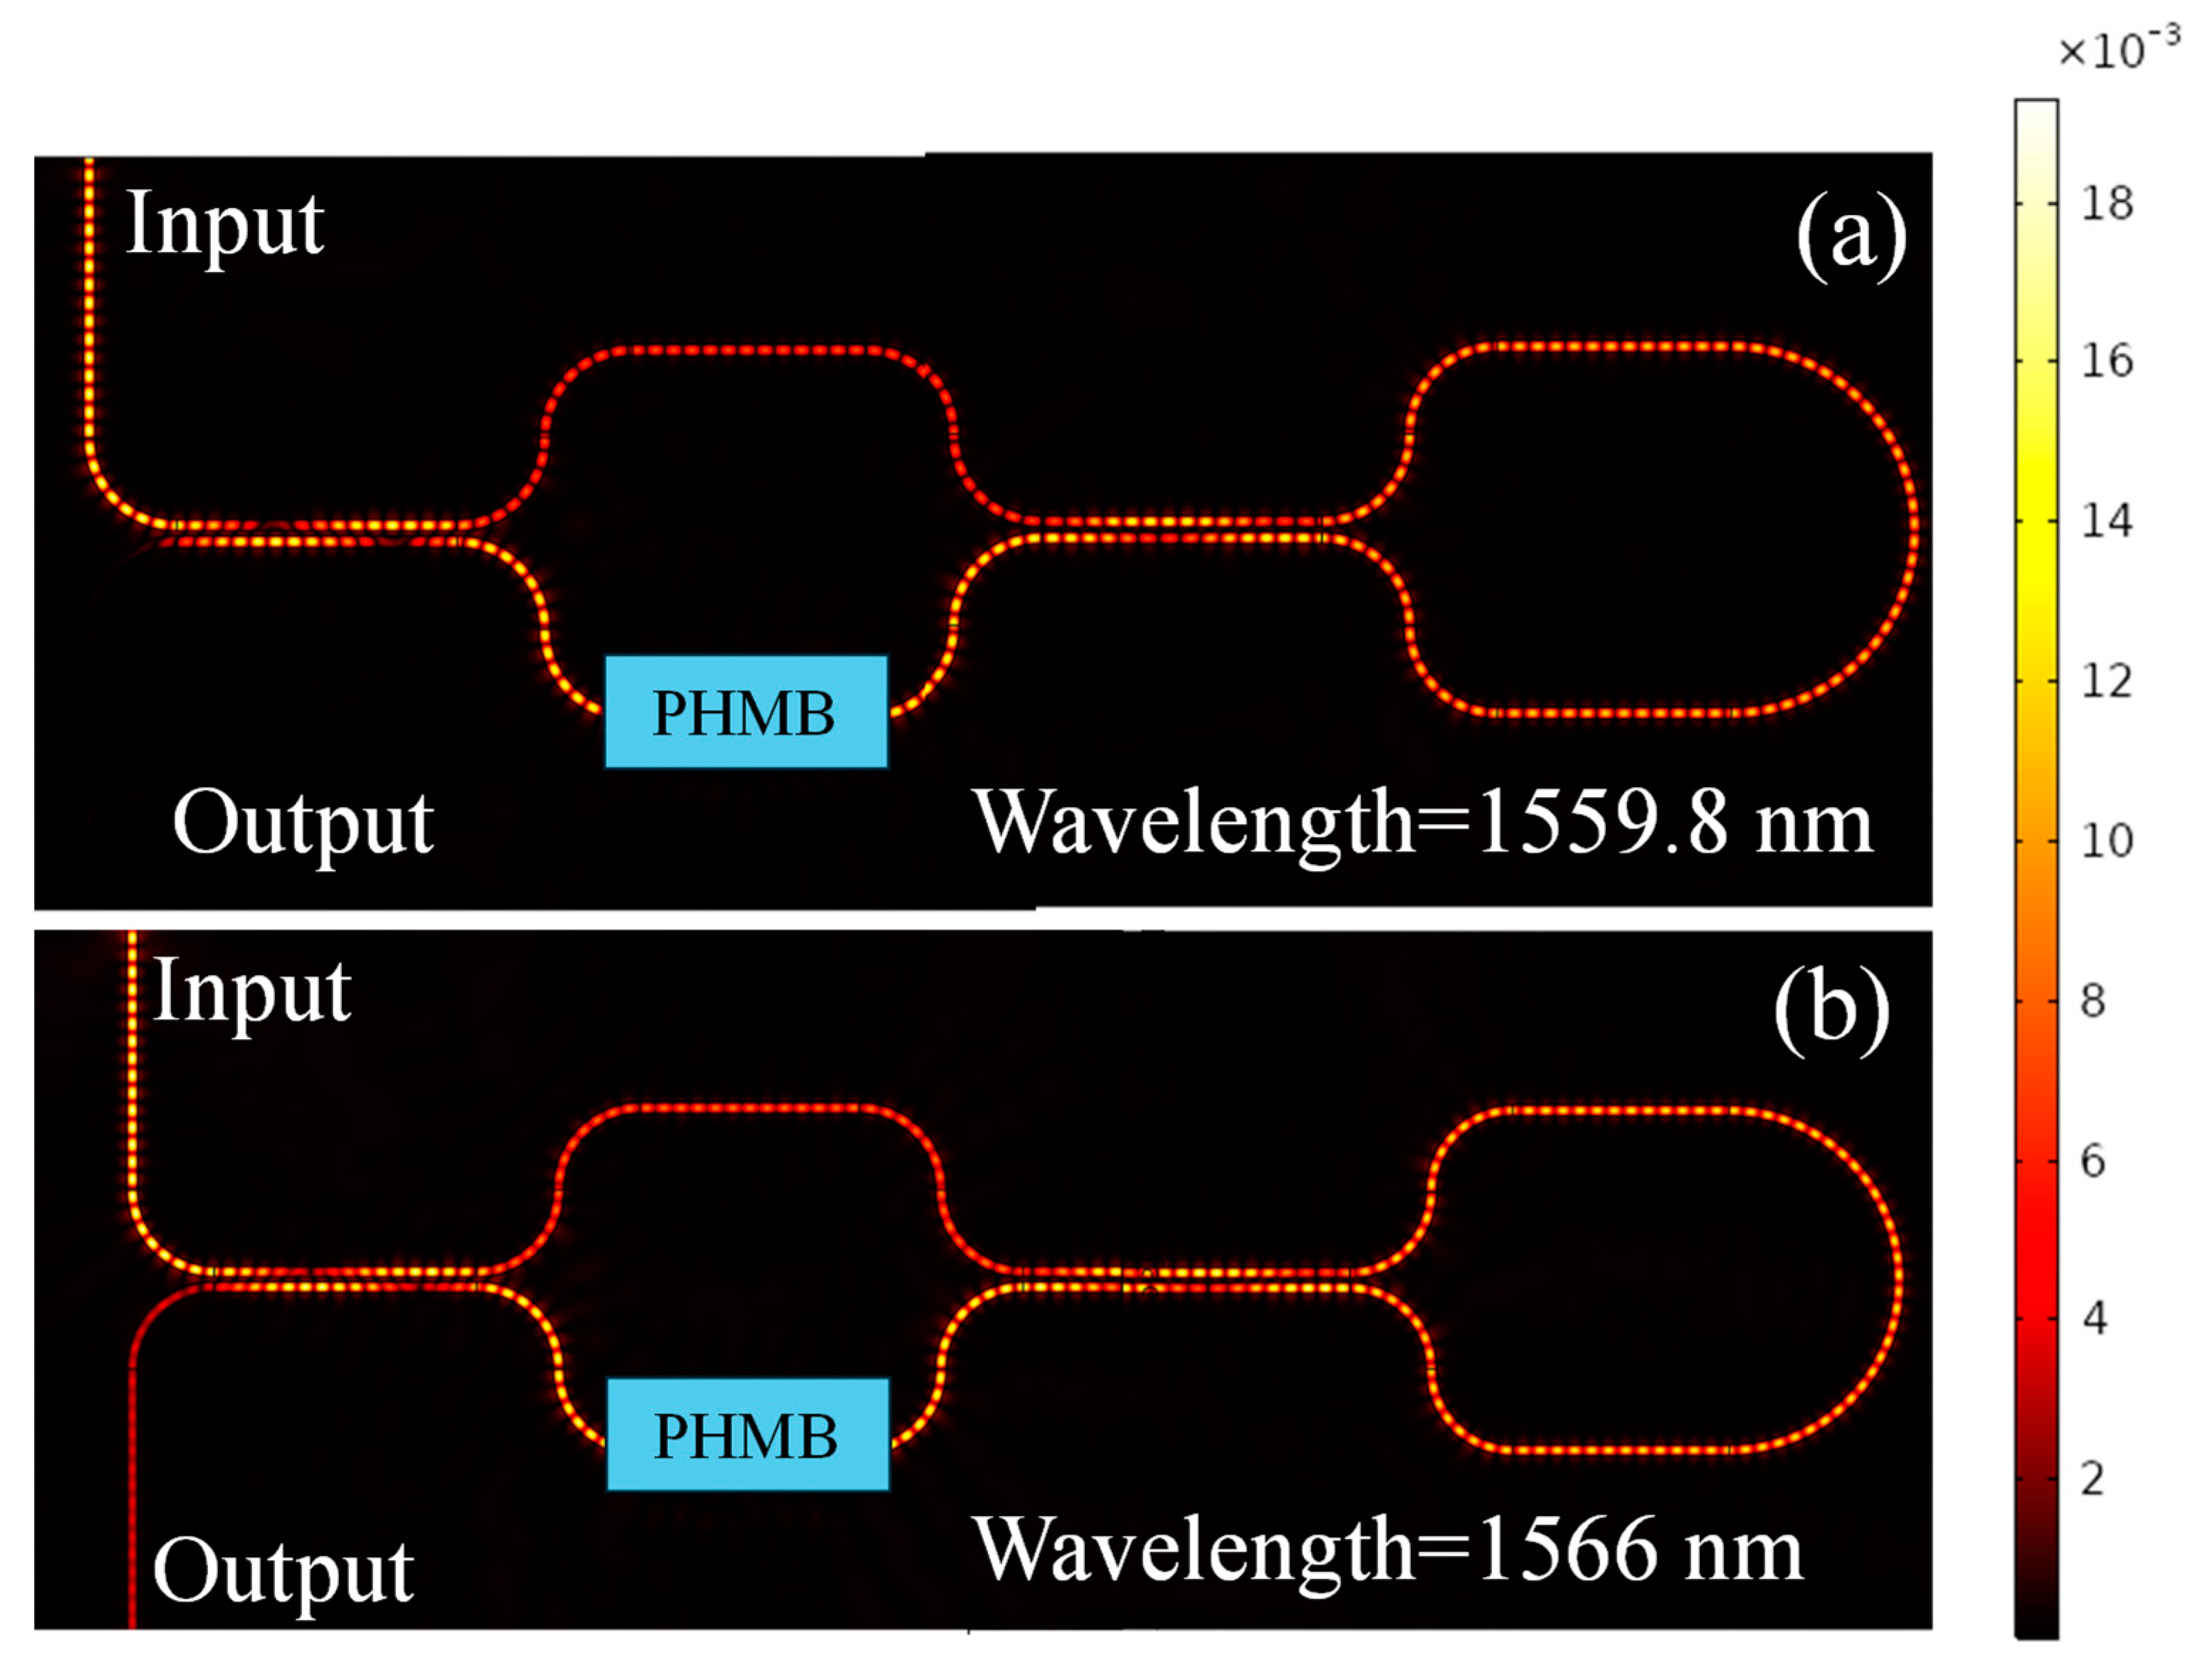
The normalized H-field distribution within the LT-MZI structure is vividly illustrated in Figure 6. It delineates the wavelength where both destructive interference and constructive interference occur, as depicted in Figure 7a,b, respectively. The key geometric parameters of the device are as follows: LDC = 6 µm, L = 5 µm, w = 250 nm, and g = 100 nm. Additionally, in this particular scenario, the CO2 gas concentration is assumed to be negligible.
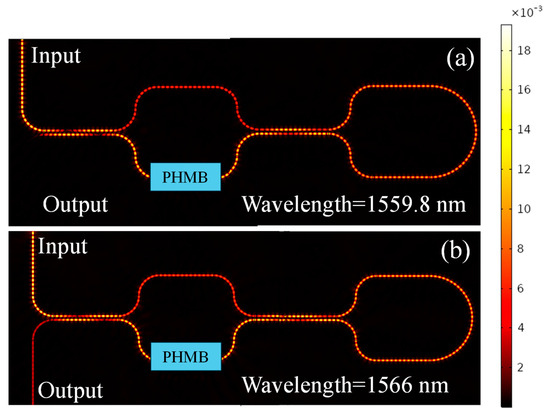
Figure 7.
Normalized H-field distribution in the LT-MZI structure at, (a) λ = 1559.8 nm, (b) 1566 nm.
Table 4 showcases a compilation of recent publications focusing on different types of photonic sensors utilizing PHMB polymer tailored for diverse applications, including subwavelength grating slot waveguides, metasurfaces, and optical fiber interferometers, specifically engineered for CO2 gas sensing. Notably, the analysis reveals a notable trend: the sensor device proposed based on the LT-MZI structure emerges as a standout performer in terms of its unparalleled responsiveness to CO2 gas within the ambient environment, surpassing the efficacy of previous works in this domain.
Table 4.
Sensitivity comparison of the proposed sensor design with previously published works.
6. Conclusions
In this study, a numerical investigation of an LT-MZI structure is conducted and the structure is proposed for a CO2 gas sensing application by covering the sensing arm with a functional polymer. The MZI represents a paradigmatic model of precision in sensing realms, relying on light wave interference to discern infinitesimal environmental alterations. By dividing a light beam into two trajectories and subsequently reuniting them, the MZI exhibits exceptional sensitivity in detecting variations in parameters such as the refractive index, temperature, and pressure. The Sagnac loop emerges as a versatile component within optical systems, particularly when integrated with MZIs like the LT-MZI, playing a pivotal role in enhancing both performance and functionality. Within the LT-MZI framework, a primary function of the Sagnac loop is to halve the interferometer’s length, thereby facilitating the creation of compact, seamlessly integrated optical devices that optimize spatial resources while upholding performance integrity. As the concentration of the CO2 gas increases, the refractive index of the functional polymer changes, resulting in the shift in the interference pattern. The estimated sensitivity of the proposed device is 7.63 pm/ppm for a sensing arm length of 5 µm, with potential enhancement to 74.78 pm/ppm as the sensing arm length extends to 15 µm.
Funding
This research received no external funding.
Institutional Review Board Statement
Not applicable.
Informed Consent Statement
Not applicable.
Data Availability Statement
Data is contained within the article.
Acknowledgments
The author acknowledges the constant support of the Warsaw University of Technology, Poland, in the completion of this work.
Conflicts of Interest
The authors declare no conflicts of interest.
References
- Sensors|Free Full-Text|Recent Advances in Integrated Photonic Sensors. Available online: https://www.mdpi.com/1424-8220/12/11/15558 (accessed on 6 February 2024).
- František, U.; Jozef, C. Current trends in photonic sensors. In Proceedings of the 2014 24th International Conference Radioelektronika, Bratislava, Slovakia, 15–16 April 2014; pp. 1–6. [Google Scholar] [CrossRef]
- Boonruang, S.; Mohammed, W.S. Integrated diffractive optical elements for optical sensors applications. In Proceedings of the 2011 2nd International Conference on Photonics, Kota Kinabalu, Malaysia, 17–19 October 2011; IEEE: Kota Kinabalu, Malaysia, 2011; pp. 1–5. [Google Scholar] [CrossRef]
- Shahbaz, M.; Butt, M.A.; Piramidowicz, R. A Concise Review of the Progress in Photonic Sensing Devices. Photonics 2023, 10, 698. [Google Scholar] [CrossRef]
- Hu, D.; Zou, C.; Ren, H.; Lu, J.; Le, Z.; Qin, Y.; Guo, S.; Dong, C.; Hu, W. Multi-Parameter Sensing in a Multimode Self-Interference Micro-Ring Resonator by Machine Learning. Sensors 2020, 20, 709. [Google Scholar] [CrossRef] [PubMed]
- Robalinho, P.M.R.; Gomes, A.D.; Frazão, O. High Enhancement Strain Sensor Based on Vernier Effect Using 2-Fiber Loop Mirrors. IEEE Photonics Technol. Lett. 2020, 32, 1139–1142. [Google Scholar] [CrossRef]
- Jans, H.; O’Brien, P.; Artundo, I.; Porcel, M.A.G.; Hoofman, R.; Geuzebroek, D.; Dumon, P.; van der Vliet, M.; Witzens, J.; Bourguignon, E.; et al. Integrated bio-photonics to revolutionize health care enabled through PIX4life and PIXAPP. In Proceedings of the Nanoscale Imaging, Sensing, and Actuation for Biomedical Applications XV, San Francisco, CA, USA, 20 February 2018; SPIE: Bellingham, WA, USA, 2018; Volume 10506, pp. 98–102. [Google Scholar] [CrossRef]
- Butt, M.A.; Shahbaz, M.; Piramidowicz, R. Racetrack Ring Resonator Integrated with Multimode Interferometer Structure Based on Low-Cost Silica–Titania Platform for Refractive Index Sensing Application. Photonics 2023, 10, 978. [Google Scholar] [CrossRef]
- Liao, J.; Yang, L. Optical whispering-gallery mode barcodes for high-precision and wide-range temperature measurements. Light Sci. Appl. 2021, 10, 32. [Google Scholar] [CrossRef] [PubMed]
- Zhao, C.; Xu, L.; Liu, L. Ultrahigh Sensitivity Mach−Zehnder Interferometer Sensor Based on a Weak One-Dimensional Field Confinement Silica Waveguide. Sensors 2021, 21, 6600. [Google Scholar] [CrossRef]
- High-Sensitive Plasmonic Sensor Based on Mach-Zehnder Interferometer—ScienceDirect. Available online: https://www.sciencedirect.com/science/article/pii/S0030399220314420 (accessed on 27 April 2024).
- Doughan, I.; Oyemakinwa, K.; Ovaskainen, O.; Roussey, M. Strip-loaded Mach–Zehnder interferometer for absolute refractive index sensing. Sci. Rep. 2024, 14, 3064. [Google Scholar] [CrossRef] [PubMed]
- Ouyang, B.; Li, Y.; Kruidhof, M.; Horsten, R.; van Dongen, K.W.A.; Caro, J. On-chip silicon Mach–Zehnder interferometer sensor for ultrasound detection. Opt. Lett. 2019, 44, 1928–1931. [Google Scholar] [CrossRef] [PubMed]
- Zhao, Y.; Tong, Z.; Zhang, W.; Zhang, J.; Li, J.; Wang, X. Refractive index Mach–Zehnder interferometer sensor based on tapered no-core fiber. Laser Phys. 2021, 31, 45101. [Google Scholar] [CrossRef]
- Zhang, Y.; Zou, J.; He, J.-J. Temperature sensor with enhanced sensitivity based on silicon Mach-Zehnder interferometer with waveguide group index engineering. Opt. Express 2018, 26, 26057–26064. [Google Scholar] [CrossRef] [PubMed]
- Yuan, D.; Dong, Y.; Liu, Y.; Li, T. Mach-Zehnder Interferometer Biochemical Sensor Based on Silicon-on-Insulator Rib Waveguide with Large Cross Section. Sensors 2015, 15, 21500–21517. [Google Scholar] [CrossRef] [PubMed]
- Fabricius, N.; Gauglitz, G.; Ingenhoff, J. A gas sensor based on an integrated optical Mach-Zehnder interferometer. Sens. Actuators B Chem. 1992, 7, 672–676. [Google Scholar] [CrossRef]
- Porte, H.; Gorel, V.; Kiryenko, S.; Goedgebuer, J.-P.; Daniau, W.; Blind, P. Imbalanced Mach-Zehnder interferometer integrated in micromachined silicon substrate for pressure sensor. J. Light. Technol. 1999, 17, 229–233. [Google Scholar] [CrossRef]
- Sagnac Interference in Integrated Photonics|Applied Physics Reviews|AIP Publishing. Available online: https://pubs.aip.org/aip/apr/article/10/1/011309/2881196/Sagnac-interference-in-integrated-photonics (accessed on 7 May 2024).
- Arianfard, H.; Wu, J.; Moss, D.J. Integrated Photonic Coupled Sagnac Loop Reflectors for Flat-Top Wavelength Interleaving and Switching. In Proceedings of the 14th Pacific Rim Conference on Lasers and Electro-Optics (CLEO PR 2020) (2020), Paper C11H_4, Optica Publishing Group, Sydney, NSW, Australia, 2–6 August 2020. P. C11H_4. [Google Scholar] [CrossRef]
- How Exactly Does Carbon Dioxide Cause Global Warming?—State of the Planet. Available online: https://news.climate.columbia.edu/2021/02/25/carbon-dioxide-cause-global-warming/ (accessed on 7 May 2024).
- Khonina, S.N.; Kazanskiy, N.L.; Butt, M.A.; Kaźmierczak, A.; Piramidowicz, R. Plasmonic sensor based on metal-insulator-metal waveguide square ring cavity filled with functional material for the detection of CO2 gas. Opt. Express 2021, 29, 16584–16594. [Google Scholar] [CrossRef] [PubMed]
- Chou, Y.-A.; Wang, Z.-Y.; Chang, H.-C.; Liu, Y.-C.; Su, P.-F.; Huang, Y.T.; Yang, C.-T.; Lai, C.-H. Indoor CO2 monitoring in a surgical intensive care unit under visitation restrictions during the COVID-19 pandemic. Front. Med. 2023, 10, 1052452. [Google Scholar] [CrossRef]
- Lu, L.; Wu, J.; Wang, T.; Su, Y. Compact all-optical differential-equation solver based on silicon microring resonator. Front. Optoelectron. 2012, 5, 99–106. [Google Scholar] [CrossRef]
- CO2, the Greenhouse Effect and Global Warming: From the Pioneering Work of Arrhenius and Callendar to Today’s Earth System Models—ScienceDirect. Available online: https://www.sciencedirect.com/science/article/pii/S0160932716300308?via%3Dihub (accessed on 4 May 2024).
- Silicon Microring Refractometric Sensor for Atmospheric CO2 Gas Monitoring. Available online: https://opg.optica.org/oe/fulltext.cfm?uri=oe-24-2-1773&id=335762 (accessed on 4 May 2024).
- Optical Fiber Fabry–Perot Interferometric CO2 Gas Sensor Using Guanidine Derivative Polymer Functionalized Layer|IEEE Journals & Magazine IEEE Xplore. Available online: https://ieeexplore.ieee.org/document/8249792/ (accessed on 4 May 2024).
- Li, H.; Sun, B.; Yuan, Y.; Yang, J. Guanidine derivative polymer coated microbubble resonator for high sensitivity detection of CO2 gas concentration. Opt. Express 2019, 27, 1991–2000. [Google Scholar] [CrossRef]
- Kazanskiy, N.L.; Butt, M.A.; Khonina, S.N. Carbon Dioxide Gas Sensor Based on Polyhexamethylene Biguanide Polymer Deposited on Silicon Nano-Cylinders Metasurface. Sensors 2021, 21, 378. [Google Scholar] [CrossRef] [PubMed]
- Badri, S.H. Transmission resonances in silicon subwavelength grating slot waveguide with functional host material for sensing applications. Opt. Laser Technol. 2021, 136, 106776. [Google Scholar] [CrossRef]
- Irfan, M.; Khan, Y.; Rehman, A.U.; Ullah, N.; Khonina, S.N.; Kazanskiy, N.L.; Butt, M.A. Plasmonic Perfect Absorber Utilizing Polyhexamethylene Biguanide Polymer for Carbon Dioxide Gas Sensing Application. Materials 2023, 16, 2629. [Google Scholar] [CrossRef] [PubMed]

Disclaimer/Publisher’s Note: The statements, opinions and data contained in all publications are solely those of the individual author(s) and contributor(s) and not of MDPI and/or the editor(s). MDPI and/or the editor(s) disclaim responsibility for any injury to people or property resulting from any ideas, methods, instructions or products referred to in the content. |
© 2024 by the author. Licensee MDPI, Basel, Switzerland. This article is an open access article distributed under the terms and conditions of the Creative Commons Attribution (CC BY) license (https://creativecommons.org/licenses/by/4.0/).