Article

Microplastics’ Detection in Honey: Development of Protocols in a Simulation

by
Klytaimnistra Katsara
1,2,
Zacharias Viskadourakis
2,
Eleftherios Alissandrakis
1,3,
Nikos Kountourakis
4,
George Kenanakis
2,* and
Vassilis M. Papadakis
2,3,5,*
1
Department of Agriculture, Hellenic Mediterranean University, Estavromenos, GR-71410 Heraklion, Greece
2
Institute of Electronic Structure and Laser, Foundation for Research and Technology—Hellas, N. Plastira 100, GR-70013 Heraklion, Greece
3
Institute of Agri-Food and Life Sciences, Hellenic Mediterranean University Research Centre, GR-71410 Heraklion, Greece
4
Institute of Molecular Biology and Biotechnology, Foundation for Research and Technology—Hellas, GR-70013 Heraklion, Greece
5
Department of Industrial Design and Production Engineering, University of West Attica, GR-12243 Athens, Greece
*
Authors to whom correspondence should be addressed.
Appl. Sci. 2024, 14(11), 4720; https://doi.org/10.3390/app14114720
Submission received: 2 April 2024 / Revised: 12 May 2024 / Accepted: 28 May 2024 / Published: 30 May 2024

Abstract

:
Honey, renowned for its nutritional and therapeutic properties, has recently come under scrutiny due to its contamination by microplastics, in multiple ways. Bees’ exposure to plastic pollution impacts the whole hive’s ecosystem, and plastic tends to accumulate in hive products. Plastic packaging as polyethylene terephthalate (PET) is used to store honey in small flexible packages, which also increases the risk of microplastic migration. This study aims to establish three practical detection methods for PET microplastics and nanoplastics in honey, using readily available laboratory equipment without the need for chemical digestion or costly pretreatment protocols, in a laboratory-based simulation. The first method utilizes Raman micro-spectroscopy, offering high-resolution identification of PET microplastics on cellulose acetate filters with Raman mapping, eliminating the need for organic solvents or dyes. The second method employs optical microscopic observation under fluorescence with the aid of 4-dimethylamino-4′-nitrostilbene dye and ultraviolet radiation to enhance microplastic visibility, making it suitable for laboratories with standard optical microscopes. To isolate MPs from the solid honey particles, a density separator has been introduced using pentane. Lastly, the third method employs the use of electrospray ionization mass spectrometry for the detection of nanoplastics (<200 nm) in honey samples, through the examination of the different extraction phases of density separation. All the aforementioned methods contribute to efficient microplastic detection in honey, ensuring its quality and safe consumption.

1. Introduction

Honey is one of the most nutritious natural products, with essential and therapeutic properties for human health [1,2]. It has been reported that it exhibits an inhibitory effect on many species of pathogenic bacteria [3,4]. Nowadays, in modern medicine, honey is used for wound healing, including burns, treatment, and prevention of gastrointestinal track diseases, fungal infections, and cardiovascular diseases due to its antioxidant properties [4]. It is a viscous nonhomogeneous colloid substance consisting mostly of sugars, water, and solid particles such as pollen, pollen grains, wax, and propolis [3,5]. As is already known, plastic pollution has affected bees. Microplastics (MPs) and particles such as synthetic fibers and fragments have been detected on bees’ bodies and wings, as well as on the food they eat [6]. MPs are then transferred to the hive from the blossoms and eventually migrate into honey [7,8]. Different chemical compounds have been detected in honey samples [9], such as styrene, phthalates, and bisphenol A [10]. Also, the detection of MPs in honey samples has been achieved with filtration methods, and identified with Raman and FTIR spectroscopy [11,12]. The extraction of MPs from honey has not been studied thoroughly because the detection, isolation, and origin determination of MPs in honey samples is challenging for researchers, due to honey composition [13]. Additionally, the interface of food with plastic packaging such as polyethylene terephthalate (PET) and other polymers causes migration of MPs [14]. Their detection is difficult to achieve without any chemical pretreatment to remove the organics and needs to be followed by chromatographic analysis [10,13]. Food quality assurance is of crucial importance for the protection of consumers’ health and, although plenty of work exists in the literature, there is still a gap in developing a protocol for efficient isolation and detection of MPs in honey.
In this work, multiple methodologies were developed and tested to achieve the optimum isolation of MPs (with particle dimensions >1 μm) from real honey samples, based on simulations. The simulations of PET plastic packaging migration into honey involve the introduction of PET powder [15] into honey samples. All the methodologies developed were designed based on equipment found in scientific labs, without the application of any digestion protocol to remove the organics. Raman mapping and optical and fluorescence microscopy were used for PET MP detection. Raman mapping, particularly Raman micro-spectroscopy, has no sample management costs since it is a label-free method, where pretreatment of sample preparation is not obligatory [16,17]. This is the reason why Raman mapping is the first proposed method for multiple sample measurements [18,19,20]. Additionally, optical and fluorescence microscopy [21] is proposed as an alternative economic method for PET MP detection in honey. To enhance MP detection efficiency, pentane, an organic solvent, was used as a density separator [22]. This allowed the distribution of MPs and solid particles of honey in different extraction phases. Then, detection was performed in each phase. Alternatively to density separation, dyed PET MPs can be detected through optical and fluorescence microscopy using 4-dimethylamino-4′-nitrostilbene (DANS) dye [23] and under ultraviolet (UV) radiation. In this case, DANS-dyed MPs presented different fluorescence from the rest of the honey solids, allowing their discrimination through microscopy.
Regarding particle sizes of MPs on the scale of nanoplastics (<200 nm), where their detection efficiency is beyond the limits of Raman micro-spectroscopy, mass spectrometry (MS) was employed. MS has been extensively used to identify specific fragments. In combination with other analytical approaches (for example, gas chromatography and liquid chromatography), MS is used for the detection of a limited amount of different polymers in environmental matrices [24] such as water, soil, and food [25]. In particular, it is used for nanoplastic (NP) determination in environmental samples [26], for trace analysis of nanoplastics (NPs) in natural waters [27] and wastewaters [28], for extraction and identification of MPs in soil and compost [29], and the determination of monomers and oligomers in PET trays and bottles used for food [30]. Although electrospray ionization mass spectrometry (ESI–MS) [31] is a very useful and applied technique, it has not yet been used for the identification of fragments deriving from MPs without any analytical procedure. For example, in 2020, a non-targeted method was developed to screen plastic-related chemicals in honey, with an LC system coupled to a Q-TOF equipped with a Dual AJS ESI ion source operating in positive ionization mode [32]. In this work, the electrospray ionization mass spectrometry (ESI–MS) technique with a mass spectrometer [33] was used to detect PET NPs in the samples of filtrates (<200 nm), without the application of any other analytical method. Terephthalic acid (TPA) and monohydroxyethyl terephthalate (MHET) [30] were detected in the honey samples which contained PET MPs. This is the first time that a sample with NPs is directly injected into an MS detector.
In this study, all aforementioned methods proved that PET MPs can be detected in honey samples with optical and fluorescence microscopy, if the MPs are dyed with DANS, or Raman mapping. In the case of PET NPs, the particles can be detected using the ESI–MS technique following dilution of honey samples in pentane, which is used as a density separator. A significant advantage on this approach is that no pretreatment is required to remove the organic honey constituents, nor the usage of complicated analytical methods to detect the PET fragments. As a result, the application of the aforementioned methods successfully allowed the detection of dozens of MPs, in a PET migration simulation, laying the foundation for the detection of MPs in real samples.

2. Materials and Methods

2.1. Plastic Packages of Honey

Numerous honey packages, purchased from the local market, were investigated in this study. In particular, nine different honey stick packages were characterized by Raman spectroscopy and tested with a reference database (KnowItAll, Informatics System, Bio–Rad Laboratories, Hercules, CA, USA). Four of the packages were made of PET, one was made of low-density polyethylene (LDPE), three others were made of polypropylene (PP), and one was made of composite polyethylene (PE)/PP (with a comparative score of over 70% based on the “KnowItAll” database). Additionally, nine honey boxes and bottles were measured, of which five were made of PET with a comparative score of over 90%. The rest of them were made from LDPE, polyvinyl chloride (PVC), polystyrene (PS), and p(Vinyl chloride-co-vinyl acetate) (PVCAc). The resulting percentages of all comparative scores from the packaging materials tested are shown in the Supplementary Section (Table S1). Based on the aforementioned materials, and due to the frequent usage of PET as the plastic packaging for honey, it was decided to use PET MPs for the simulation in this study.

2.2. MP Pulverization Protocol

A “DECO-PBM-V” planetary ball mill (Hanchen Instrument, Yueyang, China) armed with two stainless steel and two zirconia grinding jars with 100 mL volume each, that can be rotated at 960 r/min, was used to grind several types of polymeric powders (Figure S1a in Supplementary Section).
PET microplastic (MP) powder was supplied by the local industry. Particle dimensions ranged between 0.575–404 μm, as determined by scanning electron microscopy (SEM) images that were obtained using a field emission scanning electron microscope (FE-SEM, JEOL JSM-7000F; JEOL Ltd., Tokyo, Japan). To reduce the dimensions of the particles, we performed the pulverization protocol as follows. The powder was placed in stainless-steel and zirconia grinding jars in combination with corresponding balls with diameters of 15, 10, and 5 mm (Figure S1b in Supplementary Section) [15]. To avoid overheating and melting of PET, the powder was pulverized for 3 min at 447 rpm; this procedure was repeated ten times, through 6 min intervals. This procedure was repeated ten times again, with the addition of ethanol into the boxes in every repetition. After completion and atmospheric drying for 20 h, the zirconia balls were removed from the jar and the two powders were mixed in the jar with stainless-steel balls. Liquid Ν2 was then placed in the box, and the powder was pulverized again for 3 min at 447 rpm at 6 min intervals. This procedure was repeated twenty times. Subsequently, the powder was sonicated with deionized water for 15 min in a water bath and, after drying, it was passed through a metallic sieve of 1 mm pore size. Then the powder was mixed with ethanol and heated with the 5 mm stainless-steel balls at T = 80 °C for 1 h. Finally, the powder was pulverized with the 5 mm stainless-steel balls for 3 min at 448 rpm twenty times at 6 min intervals. The final pulverized PET powder was sonicated for 1 h in a water bath and placed in a laboratory oven (Memmert UNP 500, Memmert GmbH + Co. KG, Schwabach, Germany) at Τ = 55 °C for 48 h. Based on the results, the detection of MPs with 1 μm dimensions was performed using a confocal microscope [34] attached to the micro-Raman setup [35].

2.3. Protocol 1: PET MPs Detection in Deionized Water through Organic Solvents

An amount of 80 mg of pulverized PET powder was mixed with 20 mL of deionized water in a glass beaker. The suspension was filtered through metallic filters of 40, 100, and 200 mesh. After that, the suspension was equally divided into four large PP plastic Eppendorf tubes of 15 mL with a glass syringe during stirring. In each Eppendorf tube, 2.5 mL of organic solvents were placed to produce four different samples: (S1): toluene; (S2): petroleum ether; (S3): dipentene; and (S4): pentane. Each Eppendorf tube was shaken by hand for 1 min and placed on a stirrer for 5 min at 45 rpm. Afterward, the supernatant (all the organic phase) was taken with a glass pipette and placed in a metallic cup for each Eppendorf tube, respectively [36]. As sample carriers, metallic cups were cleaned and used just once for these experiments, as plastic particle carryover was observed even though cleaning was performed using acetone, ethanol, and sonication. Other materials tested as sample carriers for these experiments are presented in the discussion section. The four metallic cups were put on a heating plate to dry (Figure S1c in the Supplementary Section). Raman mapping was carried out for each sample (Figure S1d in the Supplementary Section). Later, 2.5 mL from the water phase of each sample was taken with a glass pipette and put in four metallic cups for Raman mapping, at the same conditions, after drying for one week in a fume hood.

2.4. Protocol 2: Methodological Experiment: Distributions of PET MPs into Different Organic Phases according to Their Dimensions

One scoop (80 mg) of the pulverized PET powder described above was mixed with 2.5 mL of deionized water in a glass beaker. The suspension was filtered through metallic filters of 40 mesh (twice), 60, 100, and 200 mesh, respectively. In another glass beaker, 2 g of honey was mixed with 2.5 mL of deionized water, under stirring at Τ = 70 °C for 10 min, and then the solution was left to cool down at room temperature. After that, both mixtures were put together in a 15 mL PP Eppendorf tube. The final mixture was shaken by hand for 1 min and placed on the stirrer for 5 min at 45 rpm. Then, 5 mL of pentane was added, and the solution was shaken by hand for 1 min and placed on the stirrer for 10 min at 55 rpm. After 10 min of recovering, in a fume hood, three phases were created: the supernatant (D_Y1), the colloid phase, and the remaining sample phase. The D_Y1 was taken using a glass pipette and filtered using a 0.45 μm cellulose acetate (CA) filter. The colloid phase was collected and centrifuged at 1500 r/min for 10 min [37]. Subsequently, after centrifugation, the supernatant (D_YC1) was taken with a glass pipette and passed through another syringe attached to a 0.45 μm CA filter. The remaining solution from the centrifugation was centrifuged again at 1500 r/min for 10 min and all the solution created except the sediment (D_C1) was taken using a clean glass pipette and passed through another syringe with a 0.45 μm CA filter. The sediment was diluted in 20 μL of ethanol and placed on a metallic microscopic slide. All the filtrates were stored in glass vials in a freezer at 4 °C for 24 h. The next day, the extraction procedure was repeated with the remaining sample (the rest of the initial sample without the supernatant and the colloid phase), by adding 5 mL of pentane. The names of the respective phases from the second extraction were “D_Y2” for the new supernatant, “D_YC2” for the new supernatant after the first centrifugation, and “D_C2” for the new solution after the second centrifugation without the sediment. Lastly, the new remaining sample from the second extraction (D_Final), was taken with a glass pipette and passed through another syringe attached to a 0.45 μm CA filter. After 48 h, all filters were opened, and Raman mapping was carried out for each sample. In Figure 1, pictures from the experimental setup before and during the measuring process, as described earlier, are presented. The filtrates from the first and second extractions were passed through a 0.2 μm CA filter. The new filtrates, called “NF samples”, were stored in PCR-clean Eppendorf tubes in the freezer at 4 °C for 1 week.

2.5. Protocol 3: Honey Samples Dyed with DANS Dye

2.5.1. Pre-DANS Test Protocol

Before dyeing the MPs with DANS [23], an attempt was made to check if they could be detected (and measured) on CA filters. In a glass beaker, 1 g of honey was diluted in 10 mL deionized water and 80 mg of pulverized MPs PET was added, at Τ = 70 °C, with stirring for 10 min. After cooling down at room temperature, the solution was filtered through metallic filters of 40 mesh (twice), 50, 60, 100, and 200 mesh, respectively, to ensure that the large solid particles of honey remained on the filter. Finally, the sample was passed through a 0.45 μm CA filter and washed with 5 mL of ethanol to avoid any sugar fluorescence during Raman spectroscopy.

2.5.2. First Experiment with Dyed MPs in Honey Protocol

In this protocol, MPs were dyed before mixing with honey solution. In more detail, 1 g of honey was diluted in 5 mL deionized water in a glass beaker, heated under stirring at Τ = 70 °C for 10 min, and left to cool down at room temperature. In another beaker, 125 mg pulverized PET MPs were added with 5 mL deionized water and 250 μL of DANS stock solution [23], heated at Τ = 60 °C, in a vigorous stirring for 1 h. After the two solutions had reached room temperature, they were mixed and shaken for 1 min by hand. Furthermore, the solution was filtered through metallic filters of 40 mesh (twice), 50, 60, 100, and 200 mesh, respectively. The sample then was passed through a CA filter 0.45 μm and, to avoid fluorescence during Raman spectroscopy, a wash of 5 mL pentane was made. Ethanol was not used here for washing to avoid discoloring of the dyed MPs.

2.5.3. Second Experiment with Dyed MPs in Honey Protocol

In this protocol, MPs were dyed inside the honey solution. In more detail, in a glass beaker, 1 g of honey was diluted in 8 mL deionized water, heated under stirring at Τ = 70 °C for 10 min, and left to cool down at room temperature. Afterward, the honey solution was filtered through metallic filters of 40 mesh (twice), 50, 60, 100, and 200 mesh, respectively, while 250 mg pulverized PET MPs were added with 2 mL deionized water and 500 μL from DANS stock solution in the honey solution [23], and heated at Τ = 60 °C with vigorous stirring for 1 h. The latter solution was filtered through metallic filters of 40 mesh (twice), 50, 60, 100, and 200 mesh, respectively, and each sample was passed through a 0.45 μm CA filter to avoid fluorescence during Raman spectroscopy and washed with 5 mL pentane. Ethanol was not used here for washing to avoid discoloring of the dyed MPs.

2.6. Material Characterization

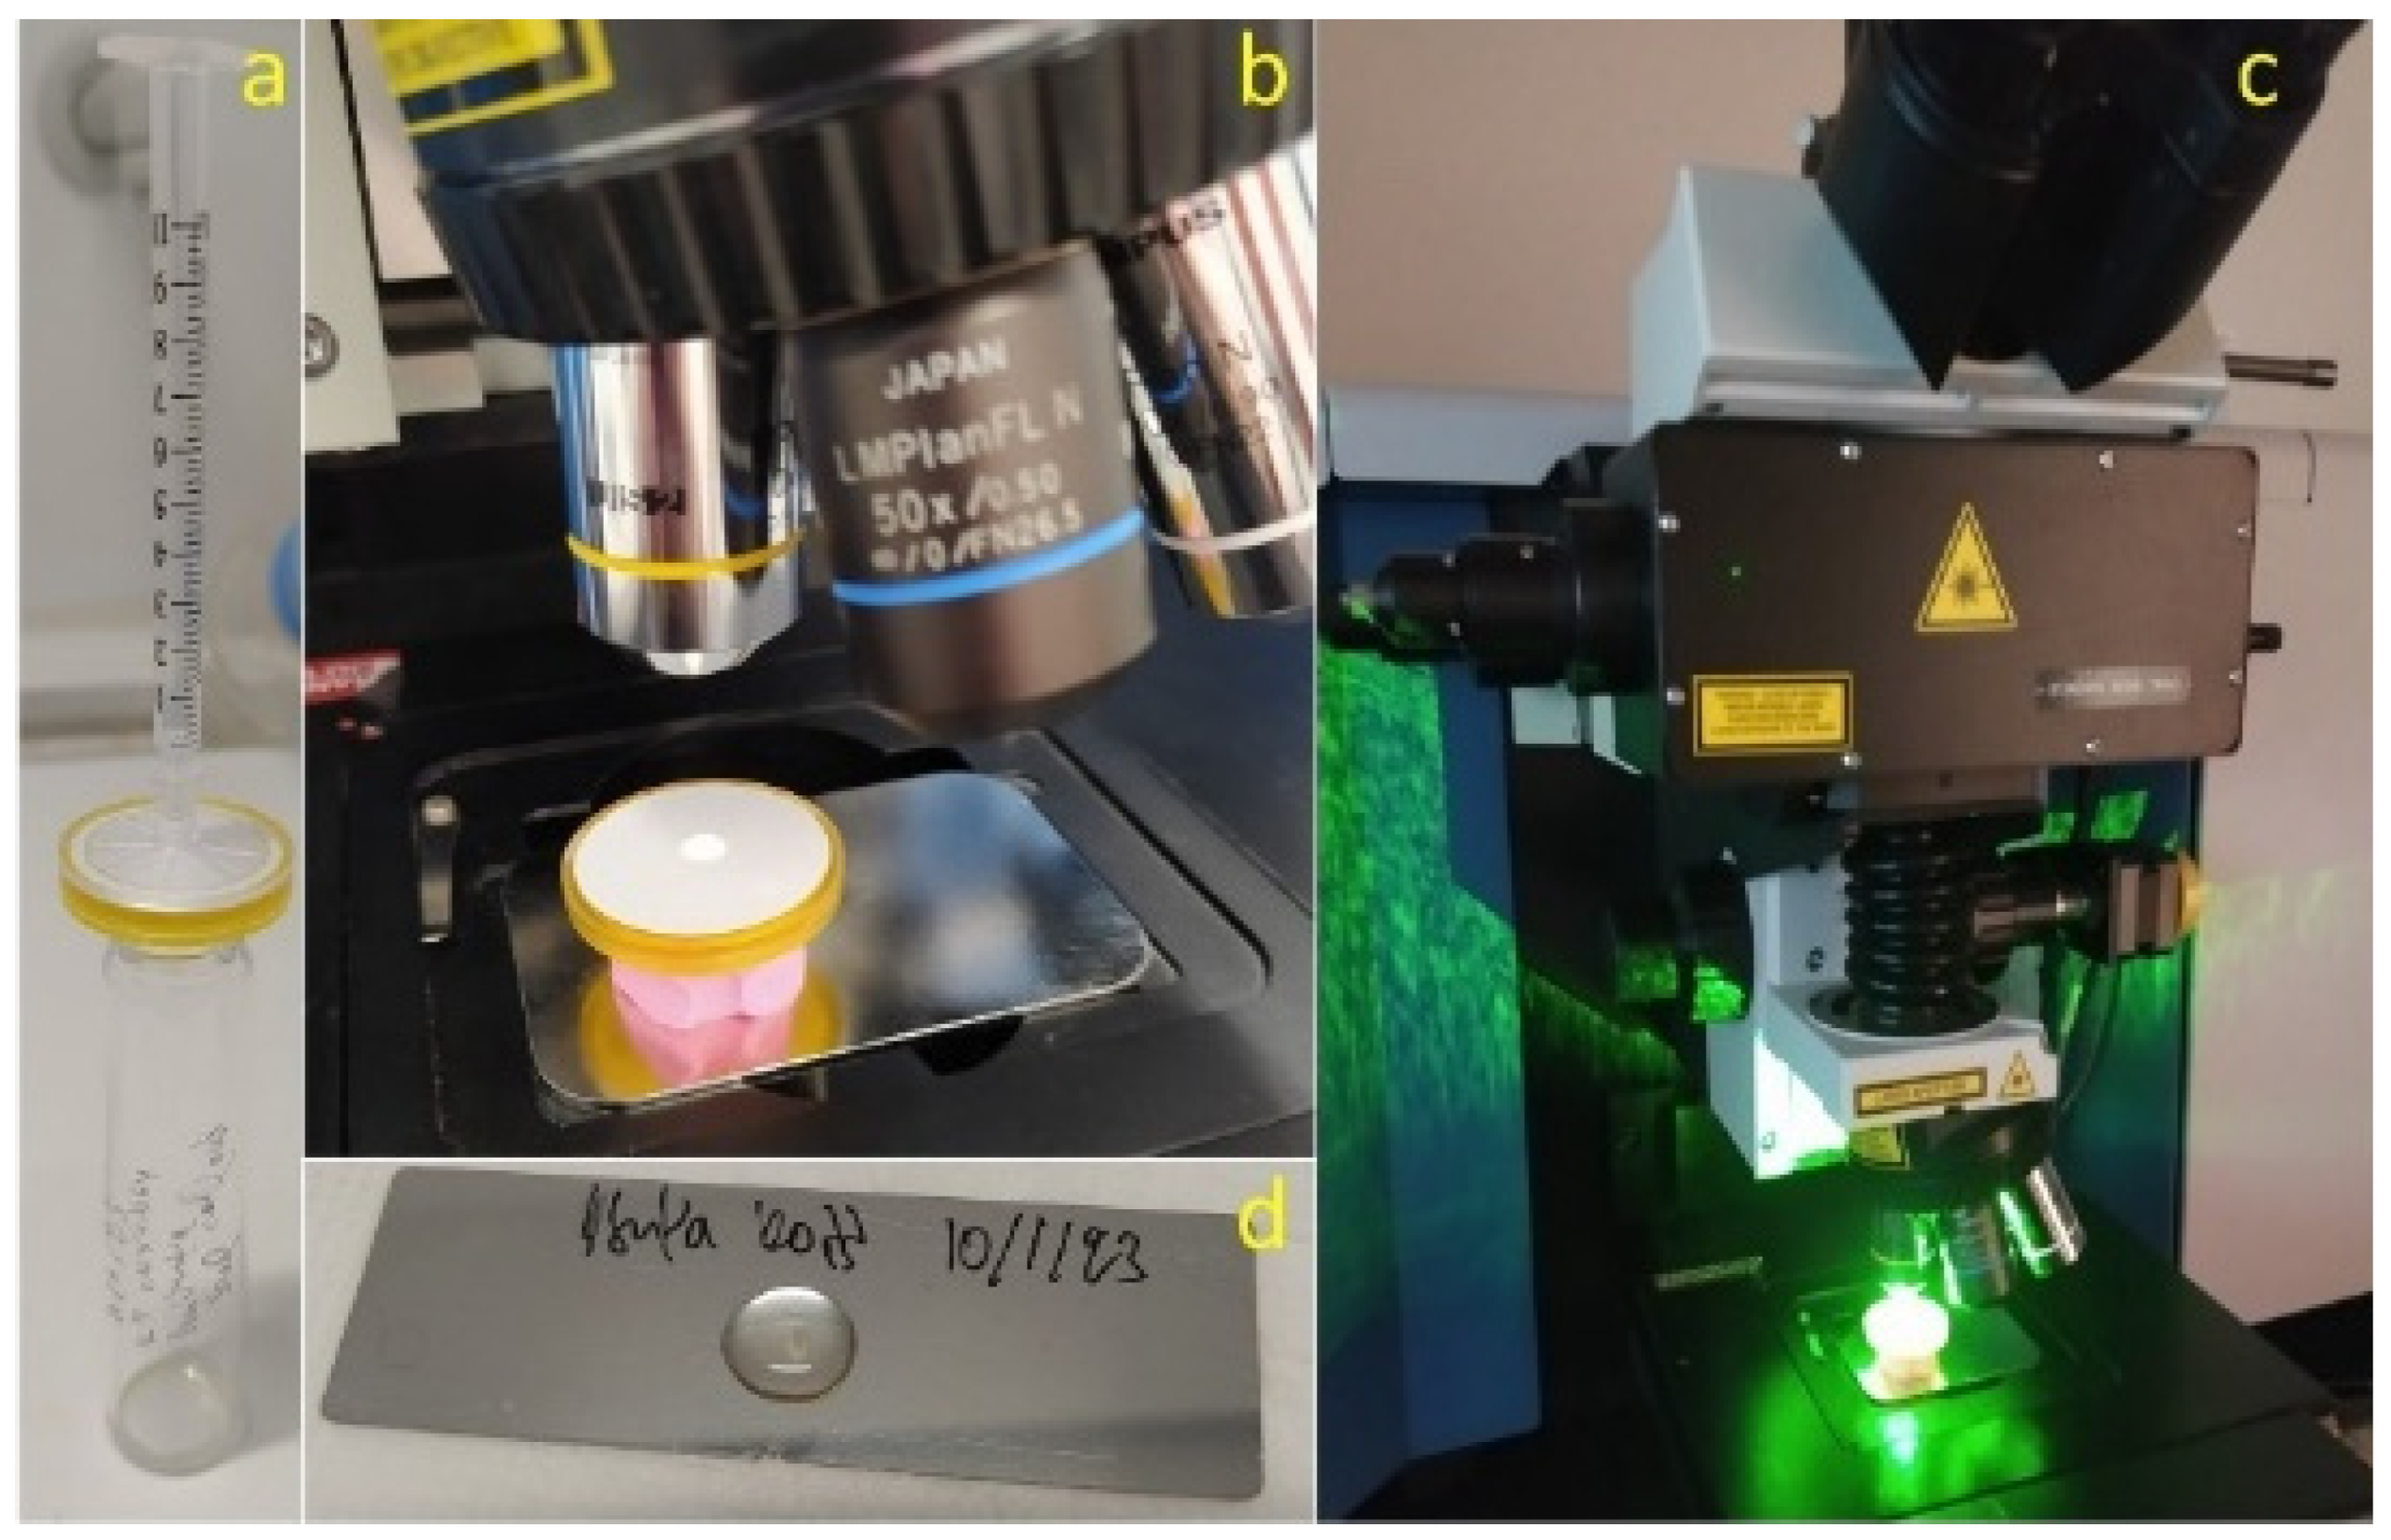
2.6.1. Raman Spectroscopy and Mapping

Raman measurements were conducted at room temperature using a LabRAM HR Evolution Confocal Raman Microscope (LabRAM HR; HORIBA FRANCE SAS, Lille, France). Raman excitation was achieved with a selection between two laser lines: 532 nm and 785 nm. The lasers had maximum powers of 100 mW and 400 mW, respectively. A 600 groves/mm grating resulted in a Raman spectral resolution of around 2 cm−1.
Each sample filter and sediment were observed under the Raman microscope for about 5 h, switching between two objective lenses, 10× (MPlan 10×/0.25, OLYMPUS Corporation, Tokyo, Japan) and 50× (LMPlanFLN 50×/0.5, OLYMPUS Corporation, Tokyo, Japan) to get a broad picture of the dimensions of MPs. The Raman mapping sample area was randomly chosen near the center of the filter. For Protocol 1, Raman mapping refers to the scanning of the selected area, in 3600 points, that lasted for 15 measurement h. In each point, the Raman spectral signal was acquired, with an acquisition time of 5 s, 3 accumulations per point, 3 mW laser intensity (10% from a maximum power of 30 mW on the samples), and a spectral range of 200–1850 cm−1 with λ = 532 nm [38] using the 50× lens. For Protocol 2, Raman mapping was carried out for each sample for 18 measurement h, step 10 μm, acquisition time 5 s, 3 accumulations per point, 10 mW laser intensity (25% from a maximum power of 40 mW on the sample), and a spectral range of 2000–1850 cm−1 with λ = 532 nm using the 10× lens. For quantification of each Raman mapping area, ImageJ-win64.exe software [39] was used, as shown in Figure S9 of the Supplementary Section.
For Protocol 3, Raman measurements were carried out using both laser sources. Firstly, Raman excitation was achieved with a λ = 532 nm laser source, within a power range of 0.3–3 mW, on the sample. Due to fluorescence, a 785 nm laser source was preferred with 100 mW laser intensity on the sample. The acquisition settings were set to 10 s acquisition time, 3 accumulations per point, spectral range between 200–1850 cm−1, and 600 grooves/mm grating. Here, three objective lenses were used a custom-made 4× (NA 0.25), and the two aforementioned objective lenses: 10× (NA 0.25) and 50× (NA 0.5) for MP observation.
Raman maps were generated through the LabSpec software (LabSpec LS6, Horiba France SAS, Longjumeau, France). Particularly for LS6 following a complete area scan, it provides the capability to enhance the visualization of a scanned area by depicting specific and selected Raman peaks. This enables an intensity-dependent visualization of up to three Raman peaks (chemical bonds) in different colors based on the Raman peak intensity or chemical bond concentration.

2.6.2. Optical and Fluorescence Microscopy

Optical fluorescence measurements were conducted through the LabRAM Raman microscope by exciting the samples using an external ultra-high power UV curing system (Edmund Optics Ltd., York, UK) equipped with a UV lamp, centered at 365 nm with a 4 mm beam diameter and an irradiance of ~5.0–5.5 W/cm2 at a working distance of 20 mm. For the identification of the MPs, a 785 nm source from a Raman spectrometer was used, to avoid fluorescence under UV illumination. The UV beam had almost a 90-degree angle of incidence with the samples’ surface. The sample was placed under the objective lens, with the UV lamp, holding the lamp by hand as shown in Figure S2 of the Supplementary Section. Under UV, MPs can be detected more easily with DANS dye and appear pink with a “glowing crown” around them.

2.6.3. Sample Preparation and Mass Spectrometry Analysis

The NF samples from Protocol 2 were analyzed by the ESI–MS technique [31] with LTQ-Orbitrap XL ETD (Thermo Fisher Scientific, Bremen, Germany) mass spectrometer [33], for possible detection of PET NPs (<200 nm).
The settings used for this instrument were:
  • Ionization: Positive [MH]+
  • ESI source Parameters:
    Spray Voltage: 3.6 kV
    Capilary Voltage: 37 V
    Capilary Temp: 275 °C
    Tube Lens: 130 V
  • AGC Settings:
    Full MS 5 × 10⁵
    Flow rate: 3 μL/min
    Resolution: 80,000
Data were acquired with Xcalibur software (Xcalibur v4.2.47, Thermo Scientific, Waltham, MA, USA). First of all, the mass analyzer was washed with a solution of acetonitrile (ACN)-0.5% formic acid and the syringe with ACN and deionized water. The measurement m/z range was from 100 to 2000. Afterward, all backgrounds of the solvents ((ACN)-0.5% formic acid, H2O, and pentane) were measured to detect possible PET NP fragments. Previously, controls were made based on Protocol 2, without any PET MPs, and each phase from the NF samples was measured to avoid any NP contamination. A portion of 150 μL from each sample was mixed with 150 (ACN)-0.5% formic acid and injected directly into the MS detector. Additionally, NF samples were measured, and finally, a sample with NPs in deionized water was measured to find the masses of PET NPs. Mass spectrometry was performed in the Proteomics Facility at the Institute of Molecular Biology and Biotechnology, Foundation for Research and Technology, Hellas, http://profi.imbb.forth.gr (accessed on 25 May 2024).

3. Results and Discussion

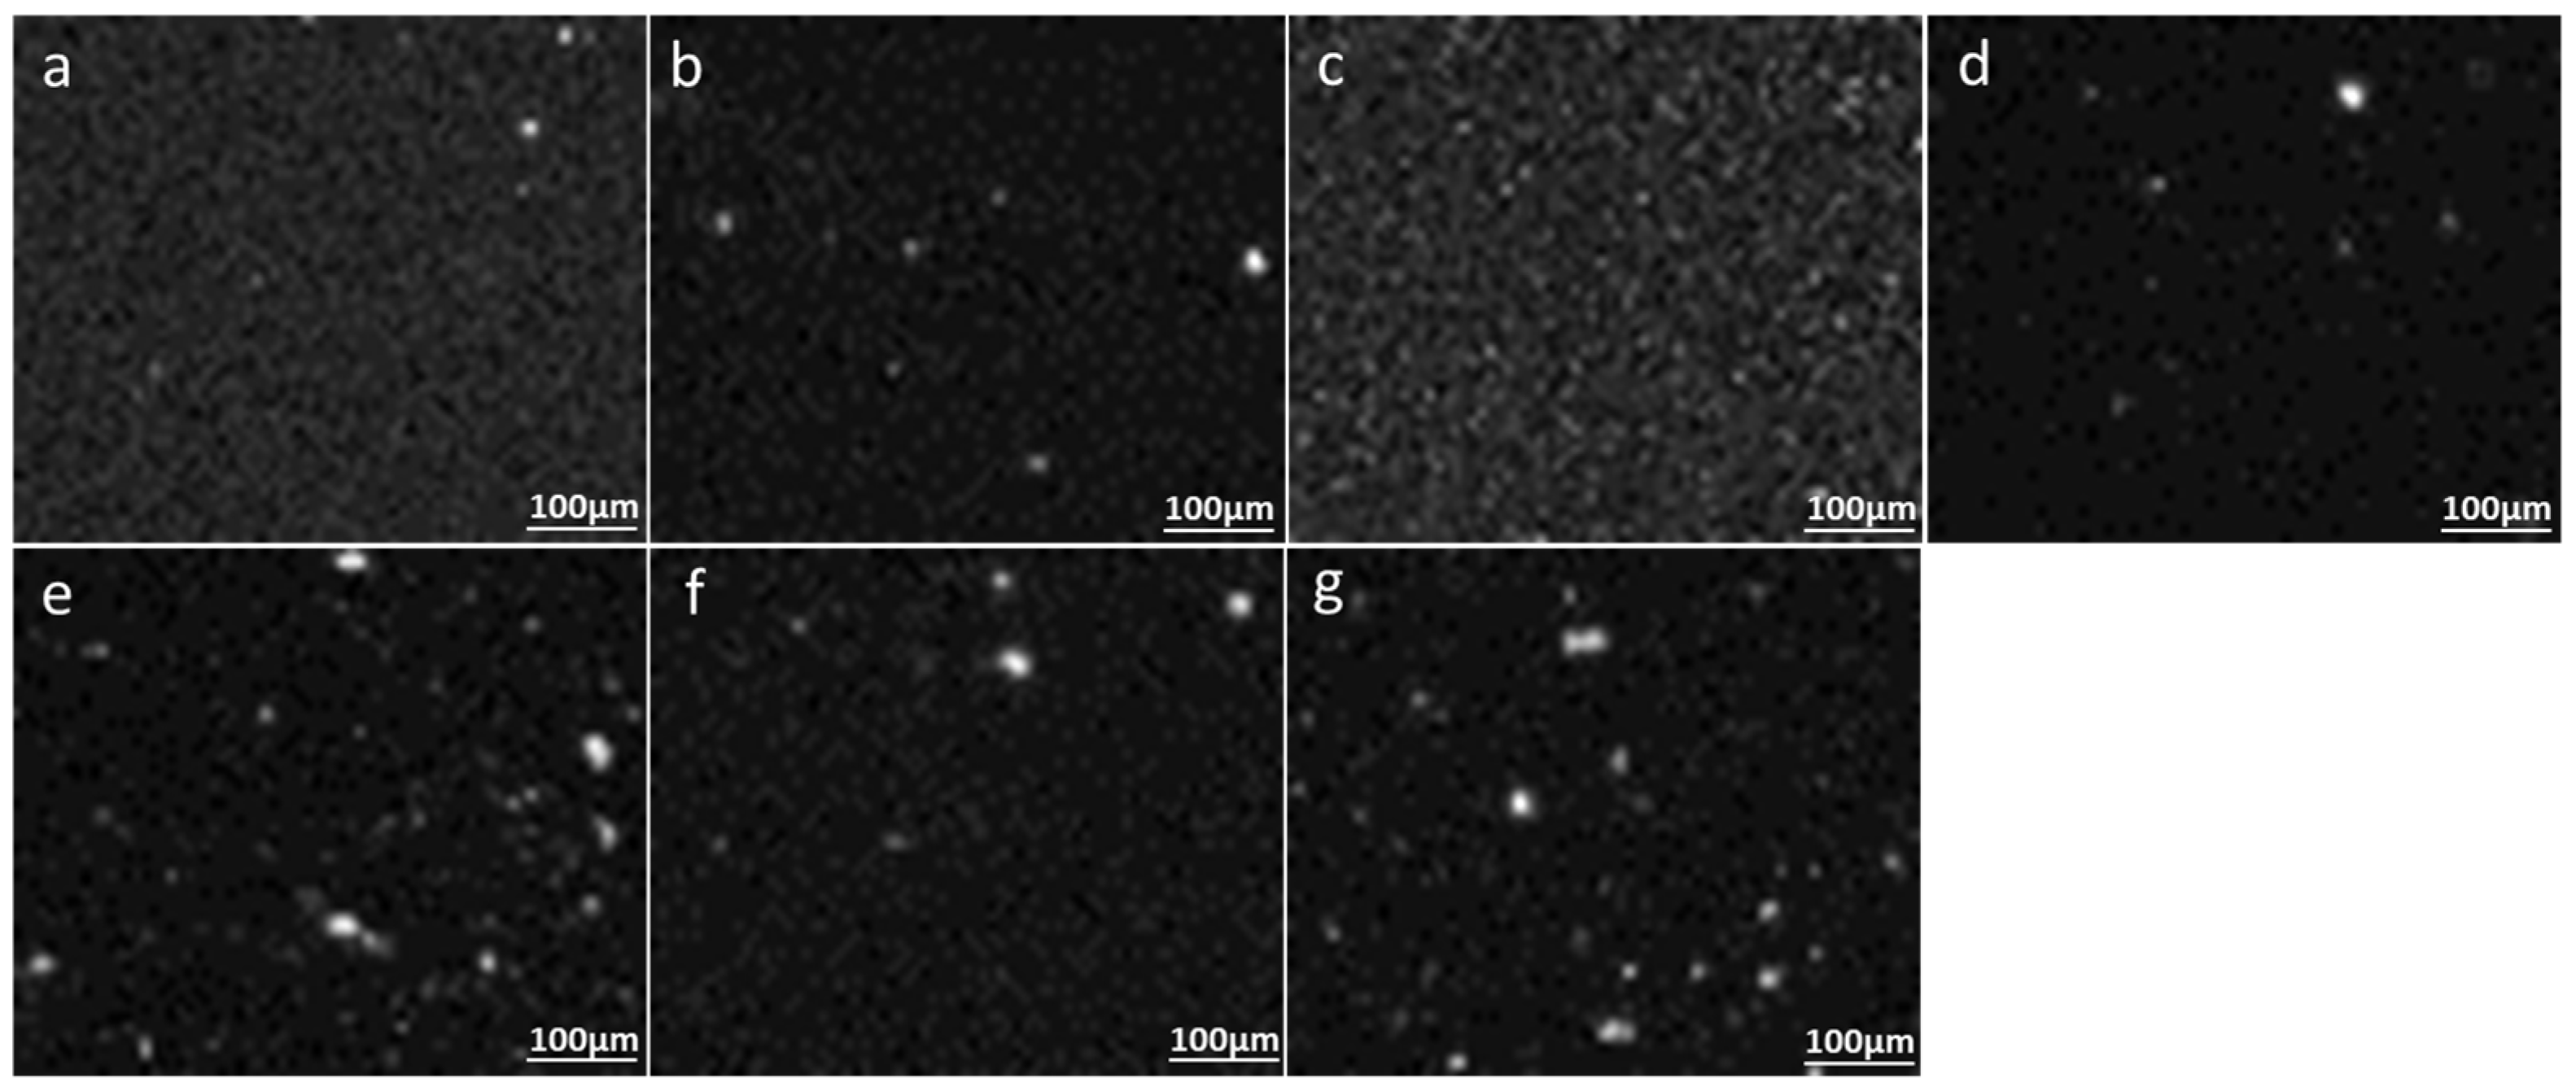
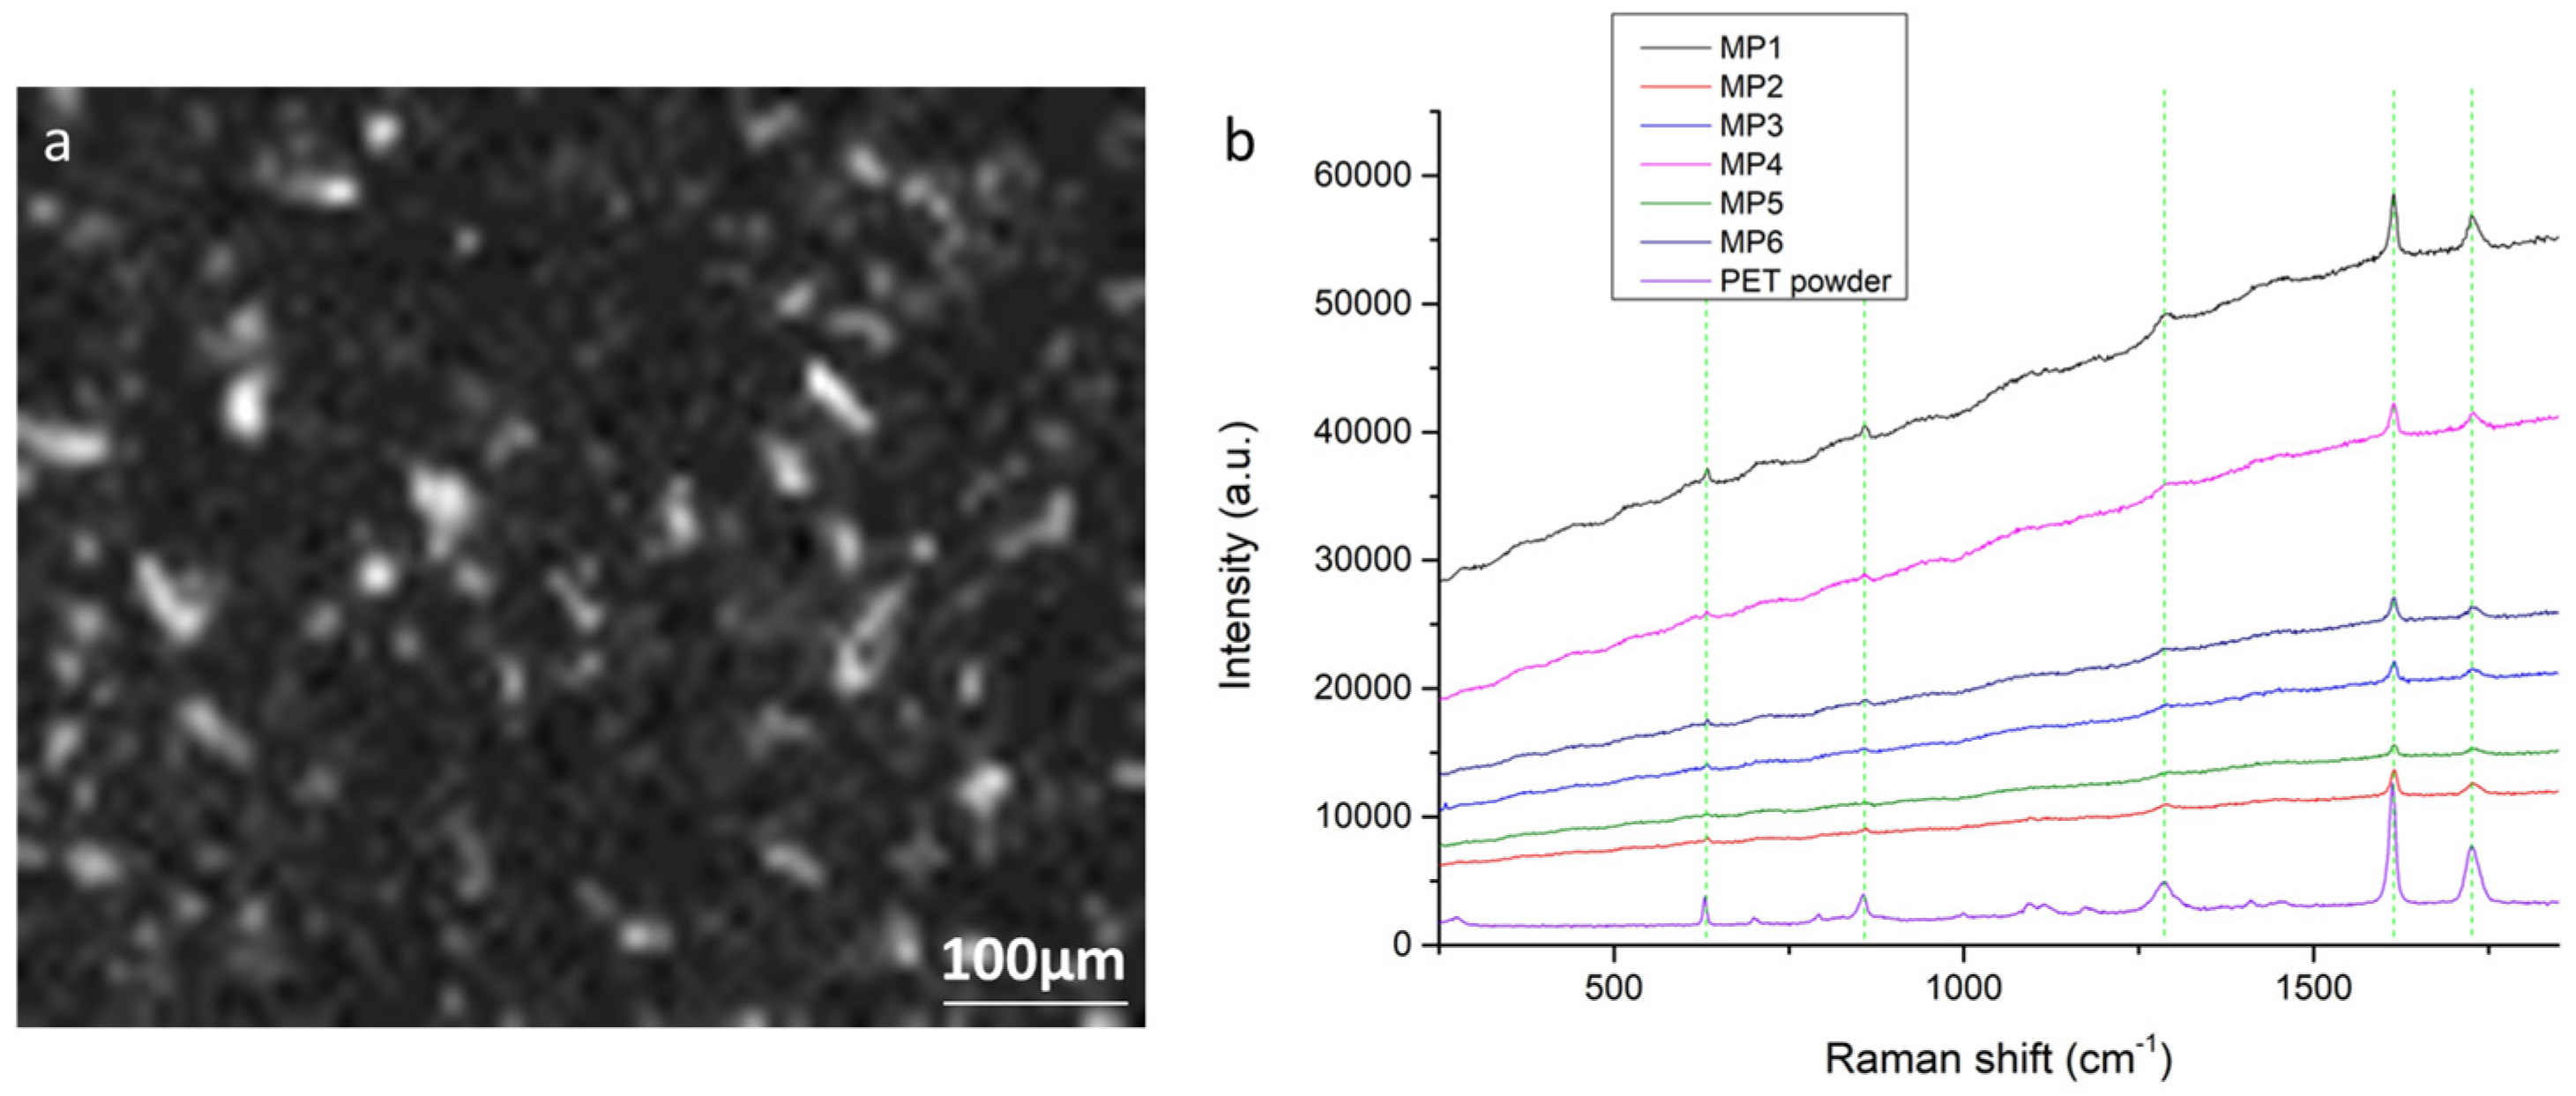
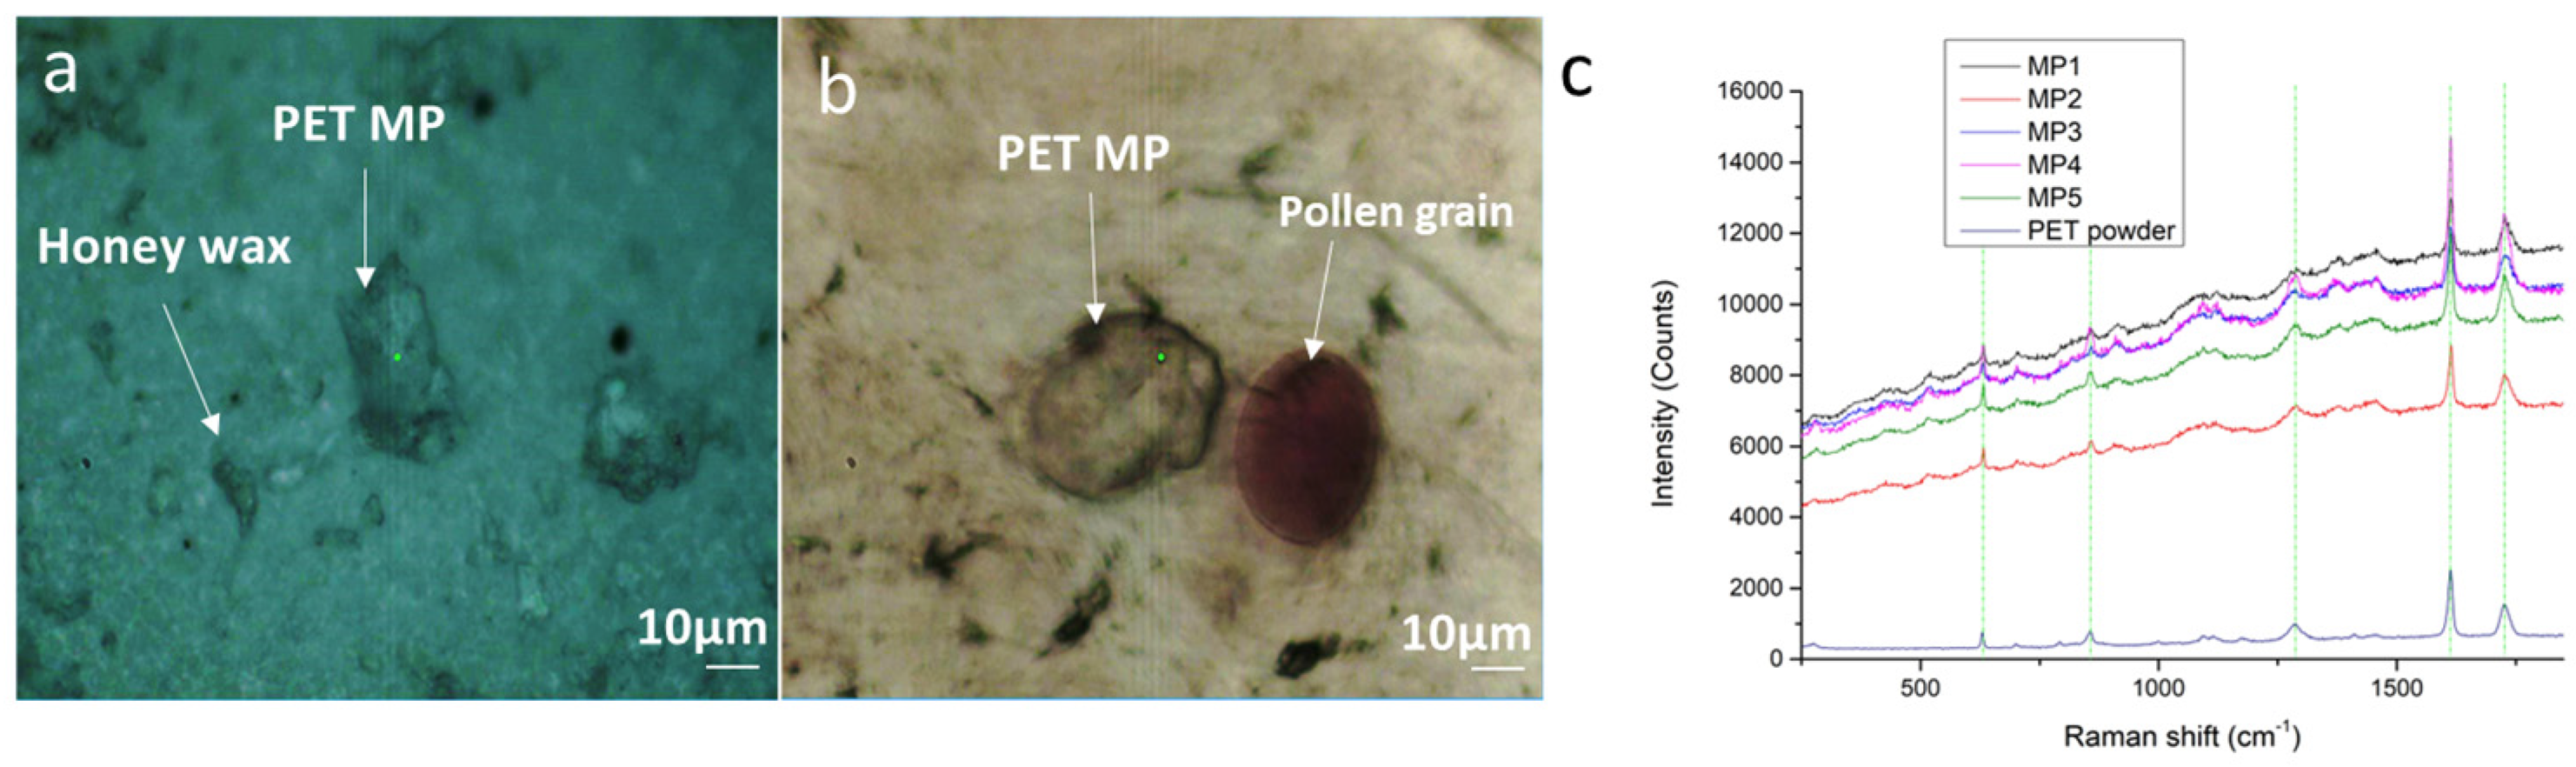
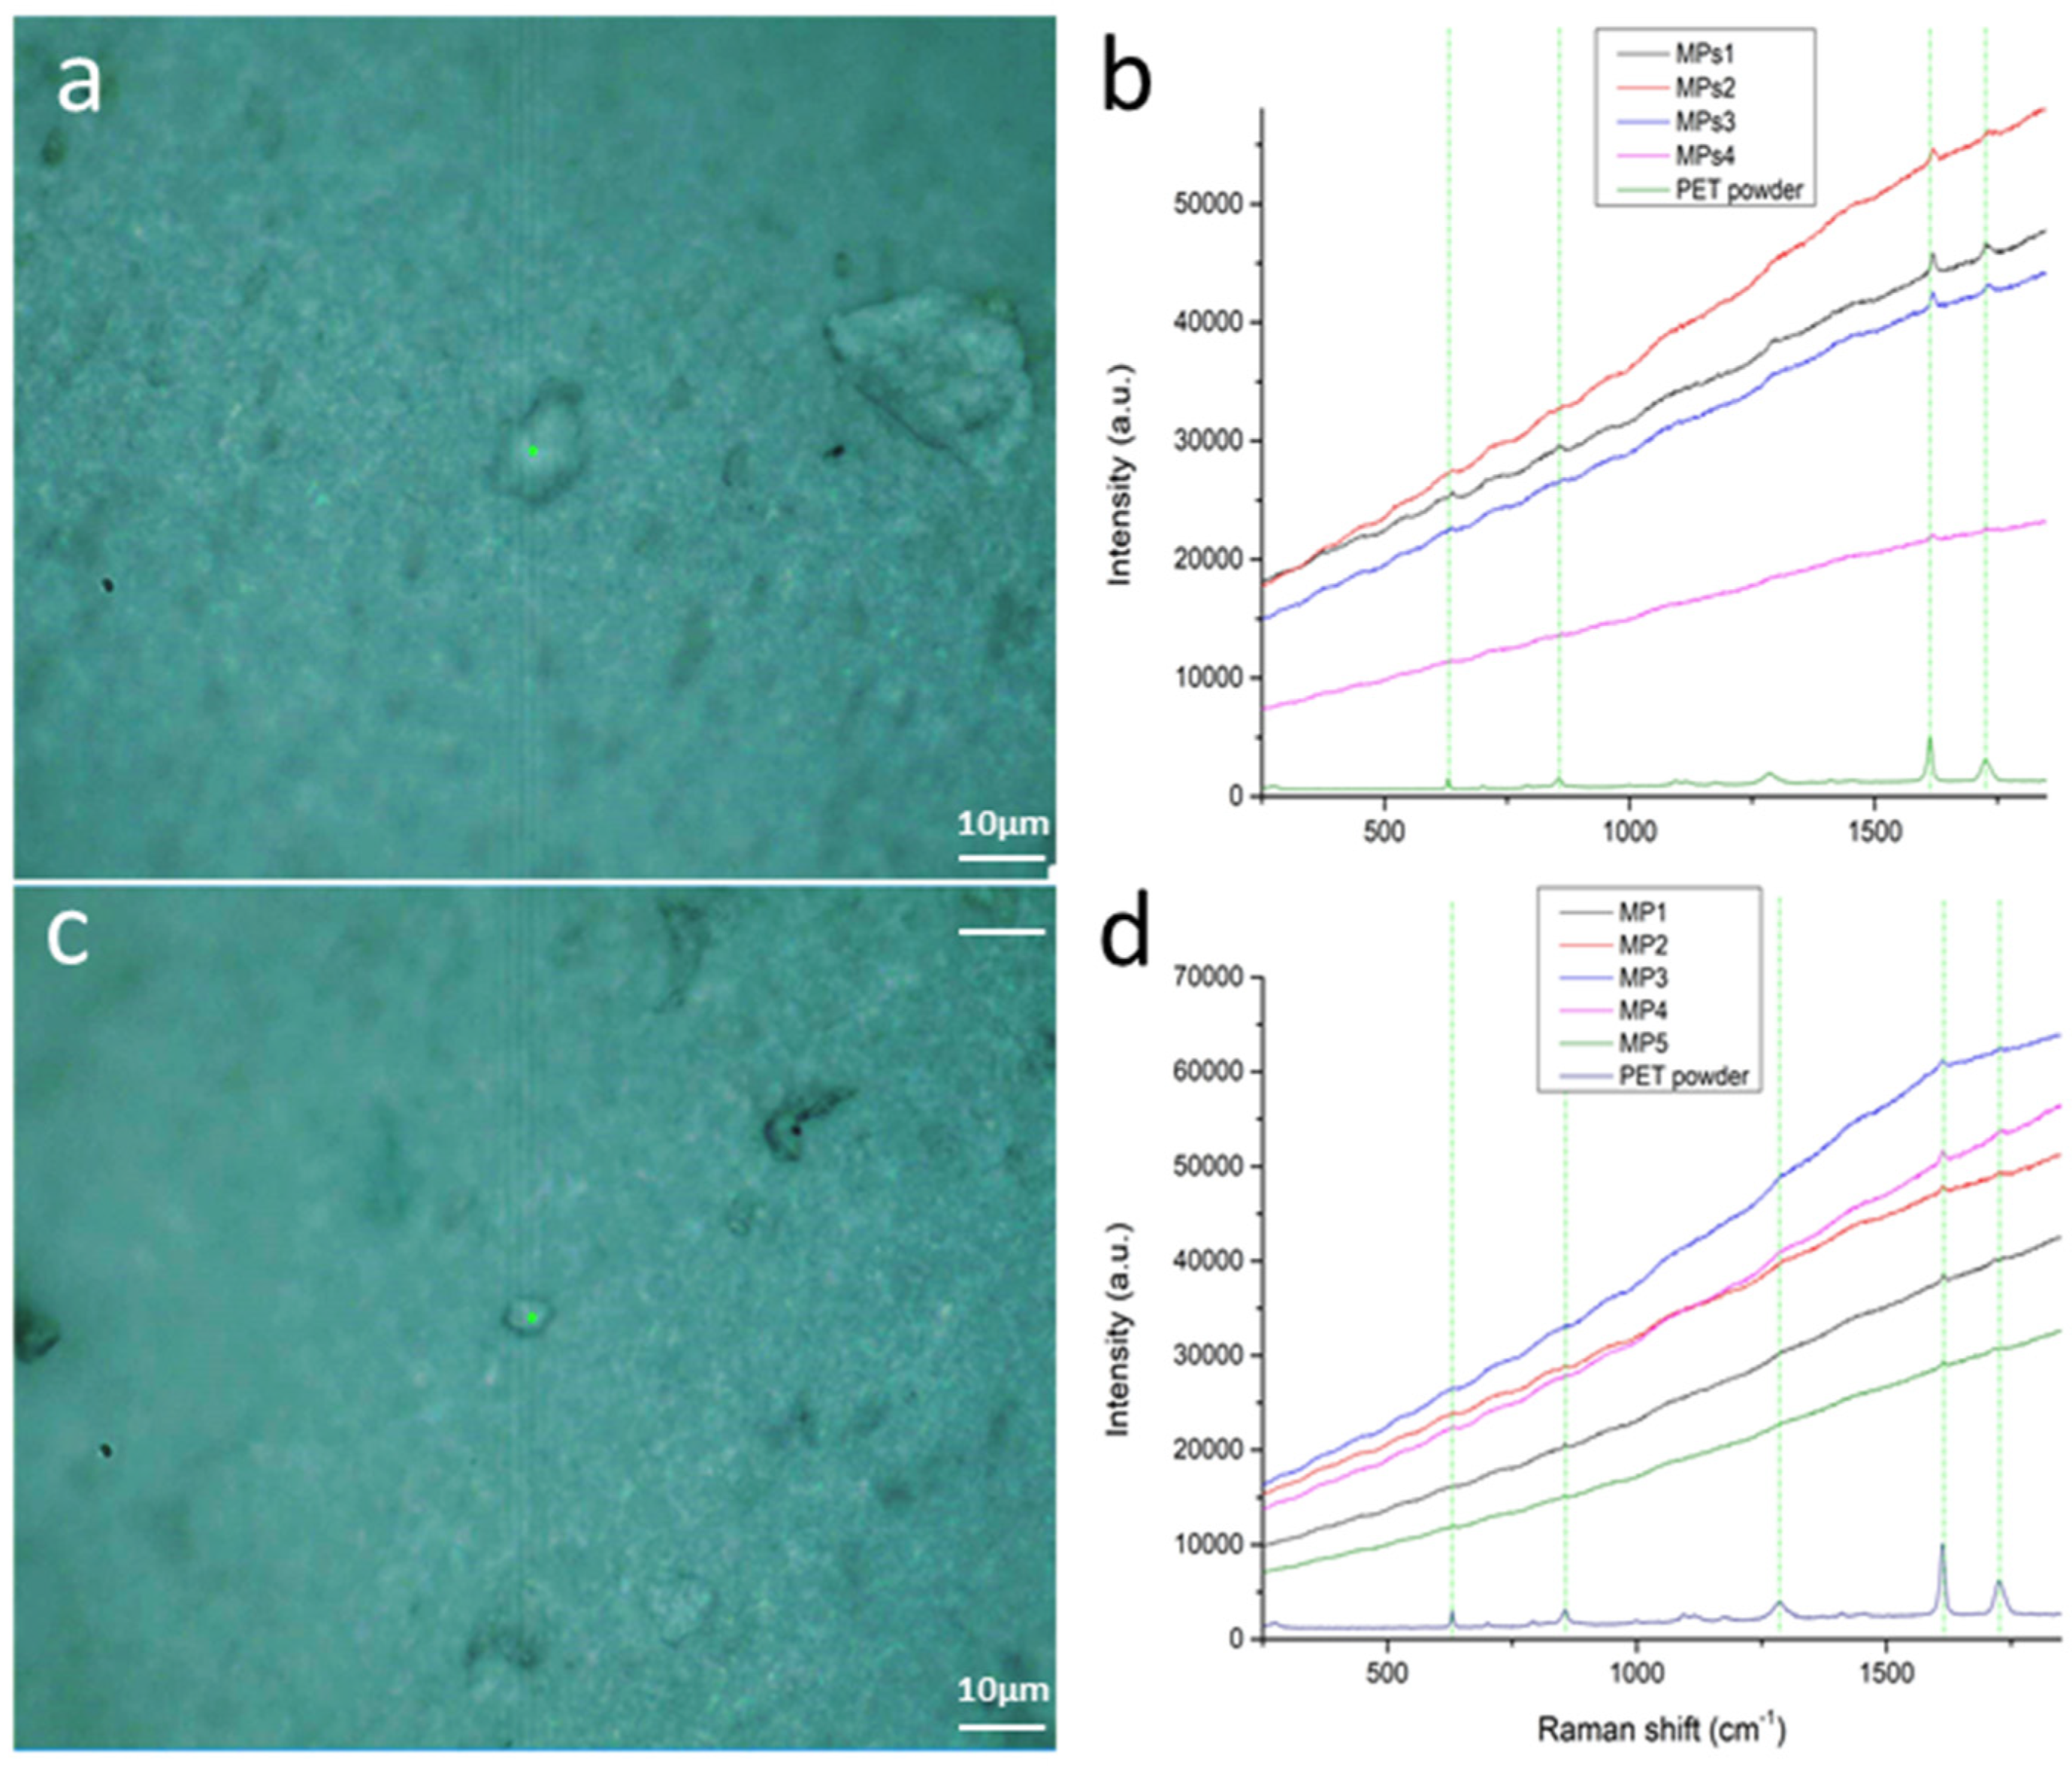
3.1. Method 1: PET MPs Detection in Honey Solution through Raman Mapping

PET MPs were detected without any pretreatment, using Raman micro-spectroscopy. Raman mapping is an effective approach for the detection of MPs with enhanced resolution, time-saving, and user-friendly techniques, since mapping measurement is automated. Raman maps are incredibly helpful for small filter areas, since with selected Raman peak visualization, MPs are highlighted in intensity. Here, for the characterization of PET MPs, Raman mapping was performed. A random sample area was chosen (75 × 58 μm), close to the center of each filter. Raman maps of CA filters from each extraction phase with density separator are presented in Figure 2. The bright spots correspond to identified PET MPs. In all extraction phases except from D_YC1, PET MPs were detected. As previously described (for Protocol 2 Raman mapping), diluted honey in deionized water was passed through a 0.45 μm CA filter after filtration with 200 mesh (74 μm pore size); many MPs were detected in different dimensions: 1–8 μm, 25 μm, and 50–74 μm. Each Raman map required 18.5 h for a complete acquisition (step 9.8 μm). Figure 3a depicts the Raman map from diluted honey with MPs in deionized water which passed through a CA filter after filtration with mesh 200 (74 μm pore size) without any density separation. The bright spots correspond to identified PET MPs. However, honey solid particles are all over the filter and MPs are not clearly seen, because of their small dimensions, in comparison with the supernatants in pentane from the density separator’s experiment (Figure 2a–d). In Figure 4b, PET MP Raman signals from Figure 4a are presented.

3.2. Method 2: PET MPs Detection in Honey through Optical Observation of Fluorescence

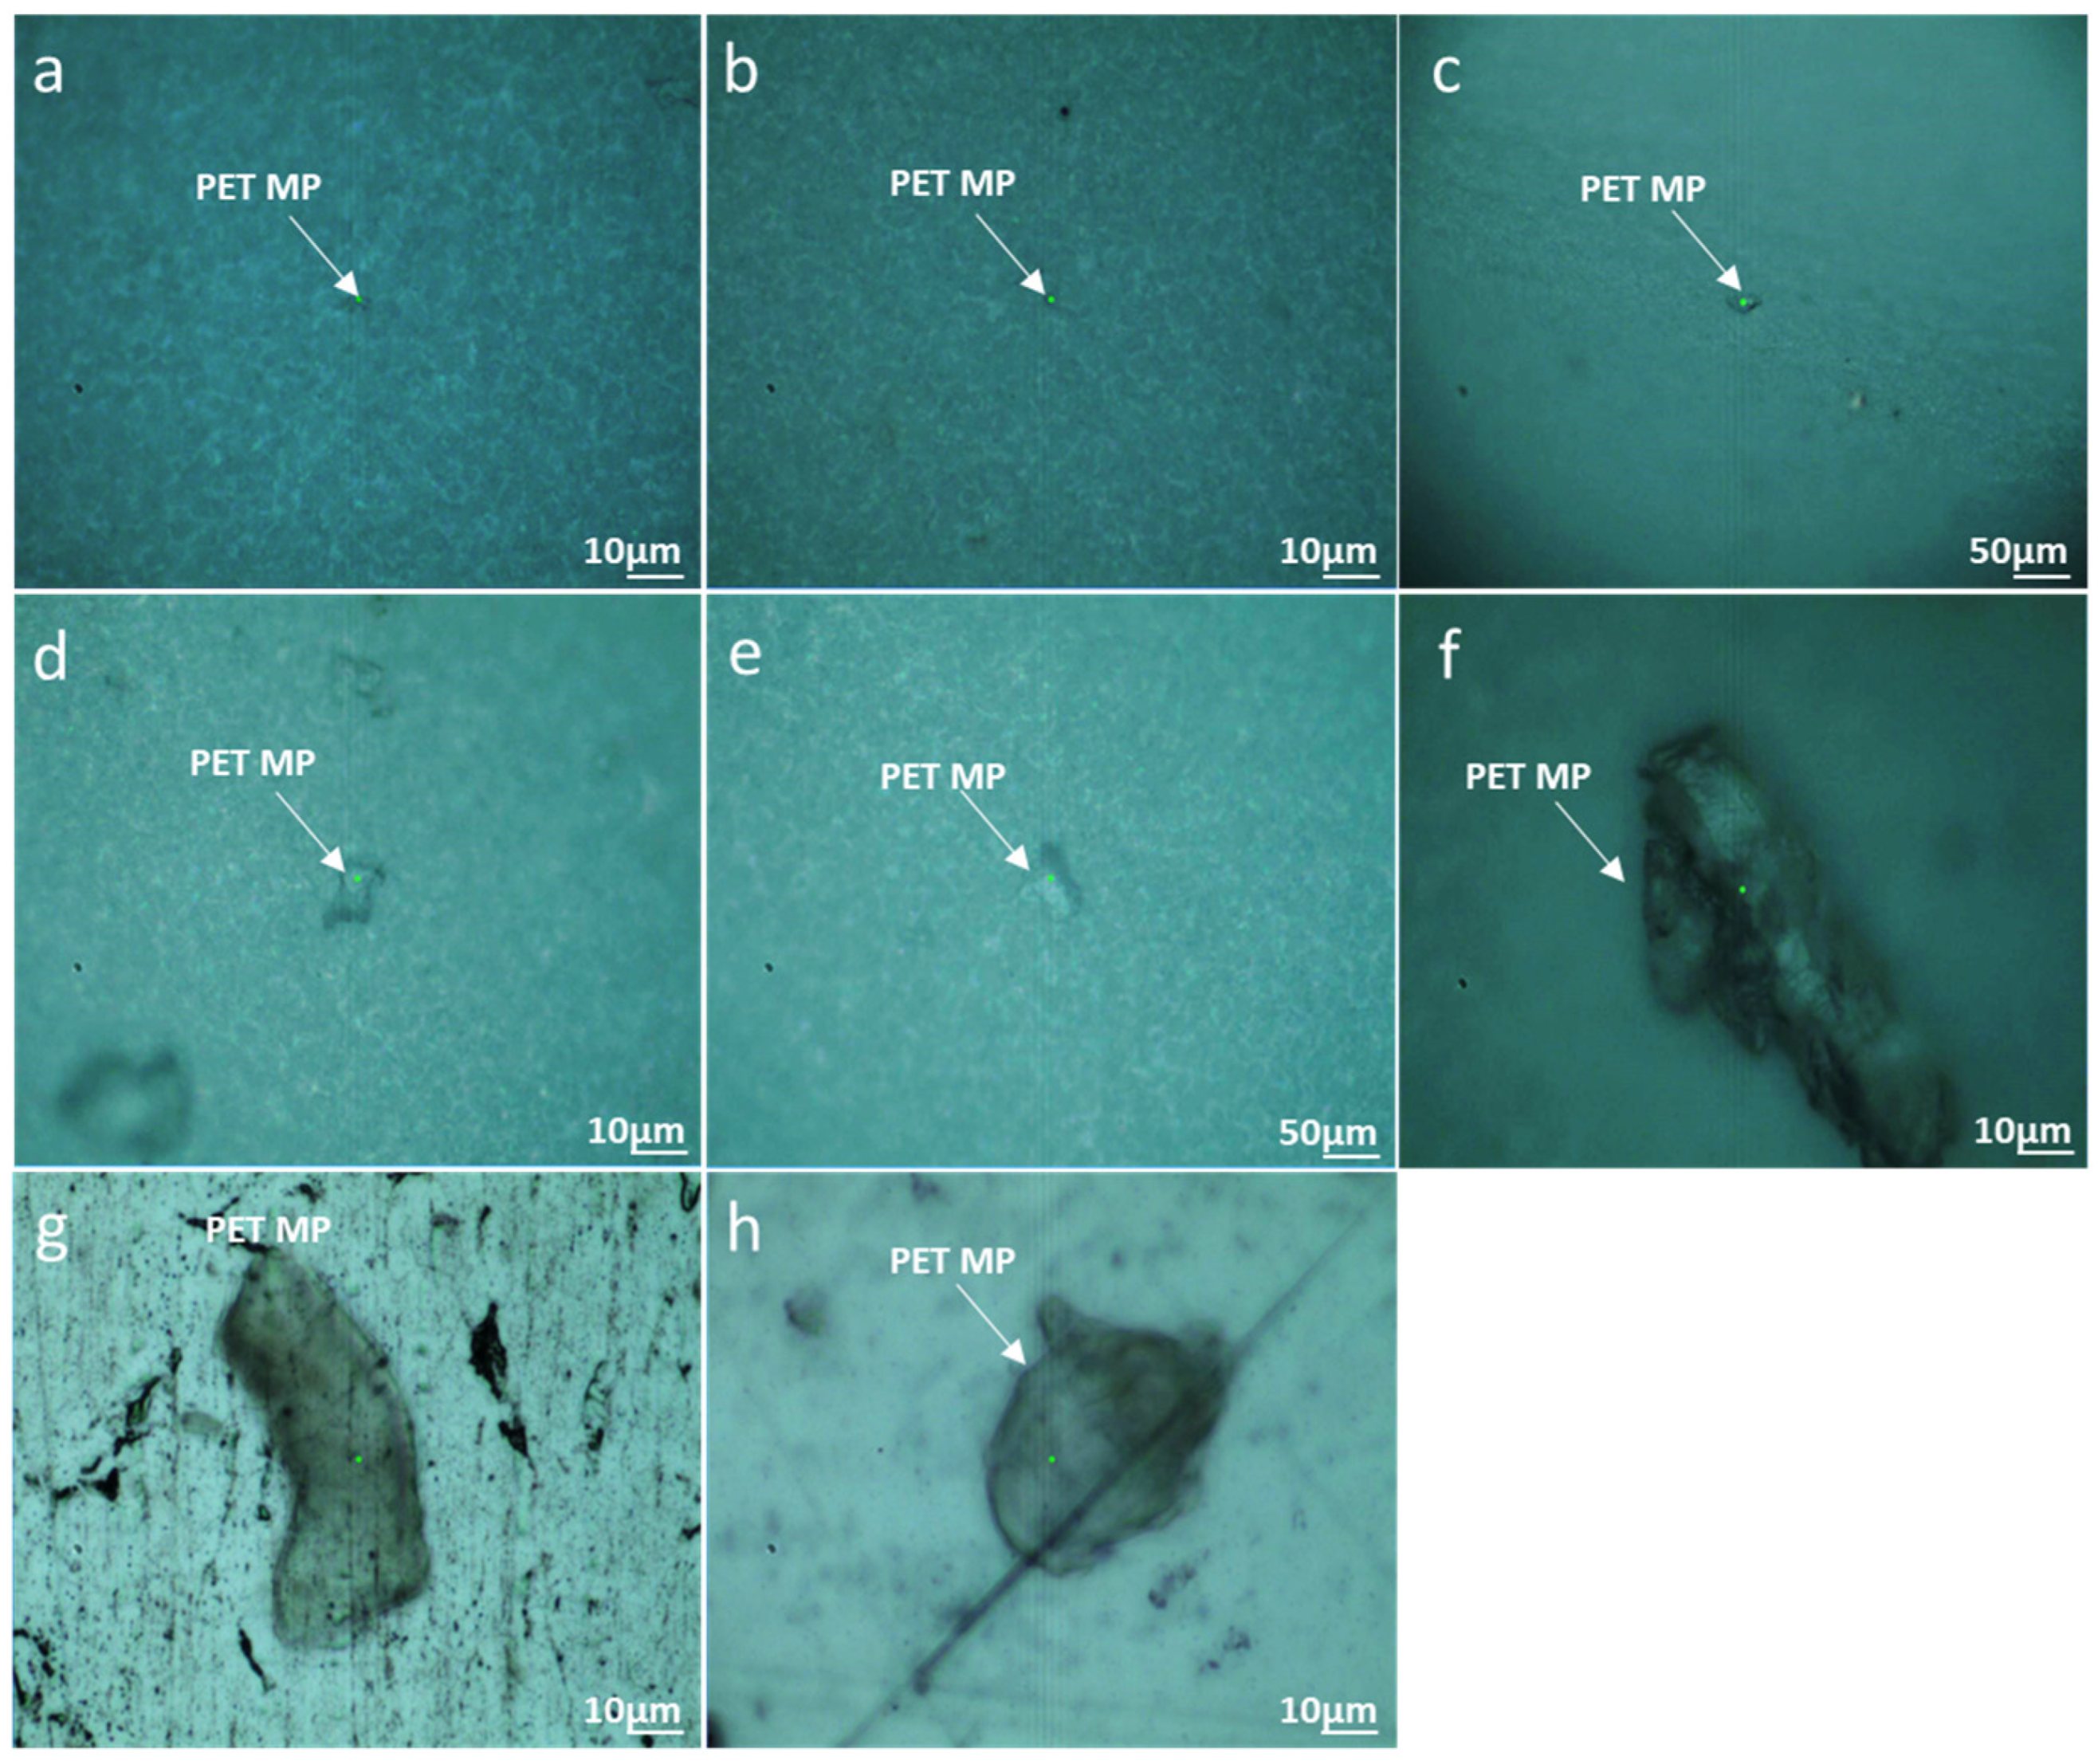
3.2.1. Optical Microscopy

For the determination of PET MPs’ dimensions, the whole filter area was scanned for about 5 h in each filter. All filters from each experiment, with and without pentane as a density separator, were visually studied using the confocal optical microscope. As it was observed from the pentane experiments, the solid honey particles were evenly distributed throughout the sample; however, larger honey particles had moved to the lower extraction phases along with the largest MPs. Thus, MPs with smaller dimensions were observed in the upper extraction phases. Figure 4 depicts optical microscopy pictures of PET MPs from each different extraction phase. The MPs’ identification was carried out by Raman spectroscopy. It is worth noticing that sediments of colloid phases were placed on metallic microscopic slides for MP observation, but honey solid particles could not be identified due to fluorescence (either by the 532 nm or 785 nm excitation source). Honey solid particles such as pollen grains, wax, and propolis with PET MPs were detected in the sediments of the remaining samples at the bottom of the Eppendorf tube, as shown in Figure 5a. MPs could not be distinguished from honey waxes. As one can see from Figure 5b, pollen grains were the only particles discriminated, while MPs could not be distinguished from honey solids all over the filter, which is in contrast to the DANS dye approach (see next Section 3.2.2).

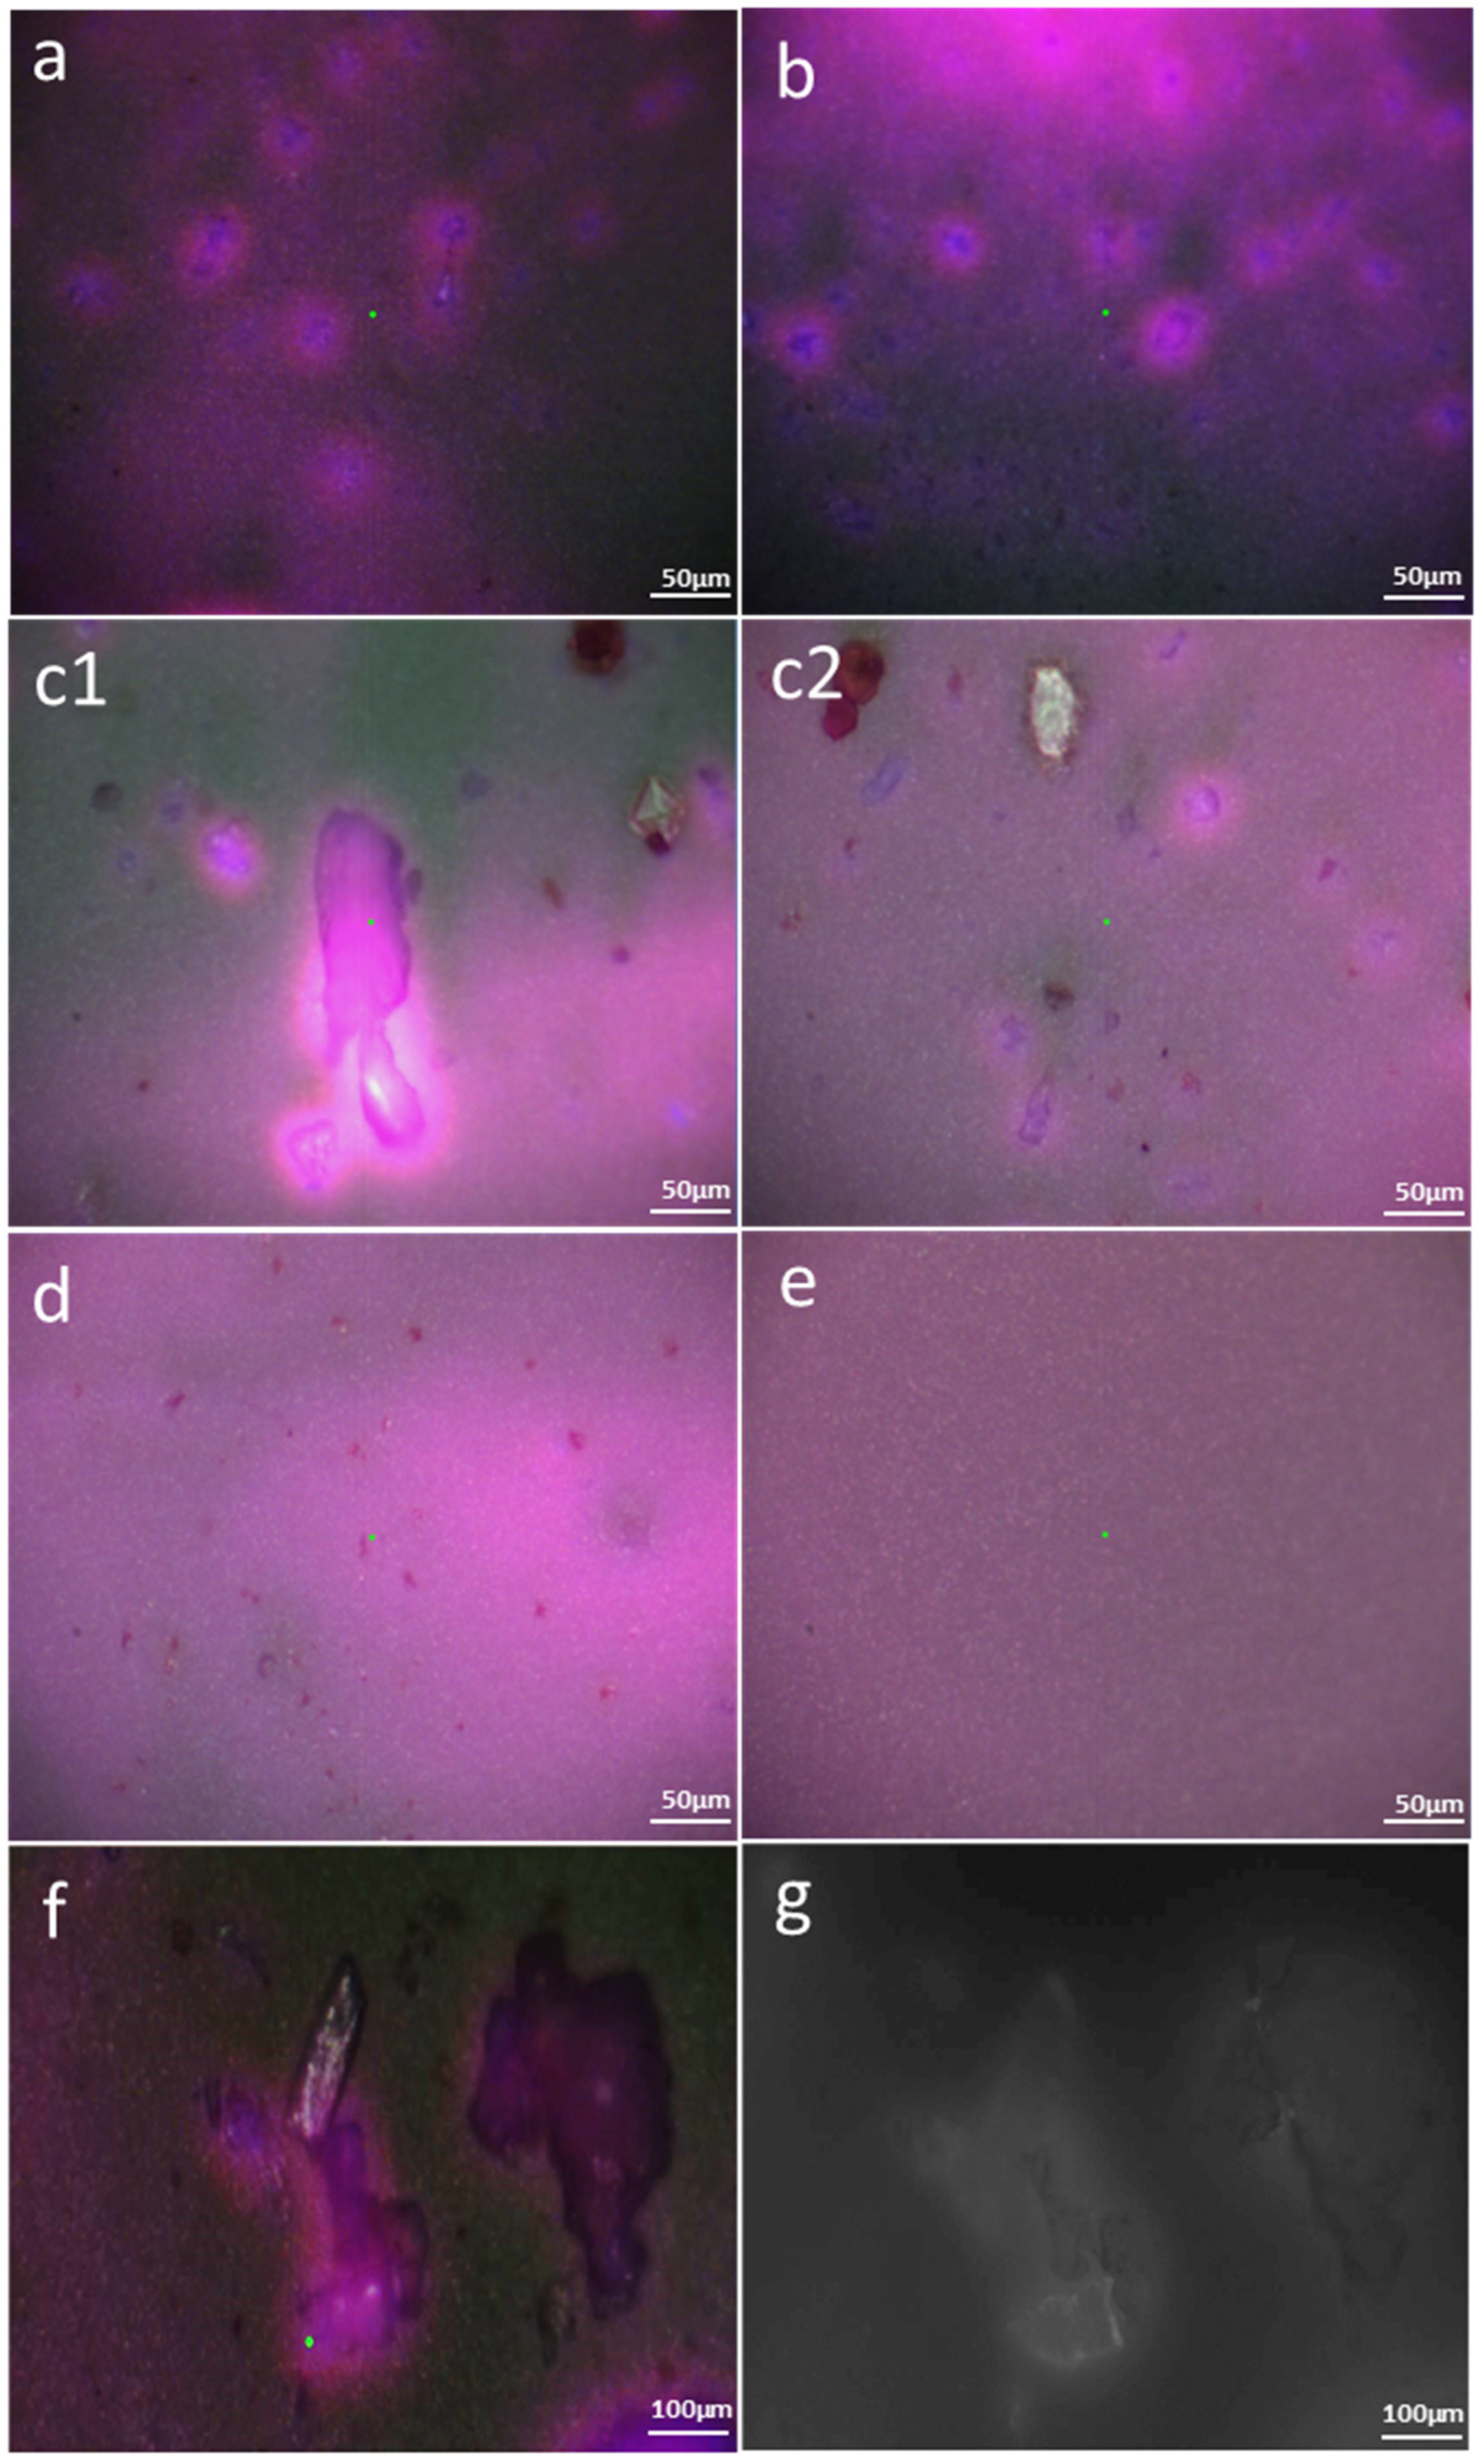
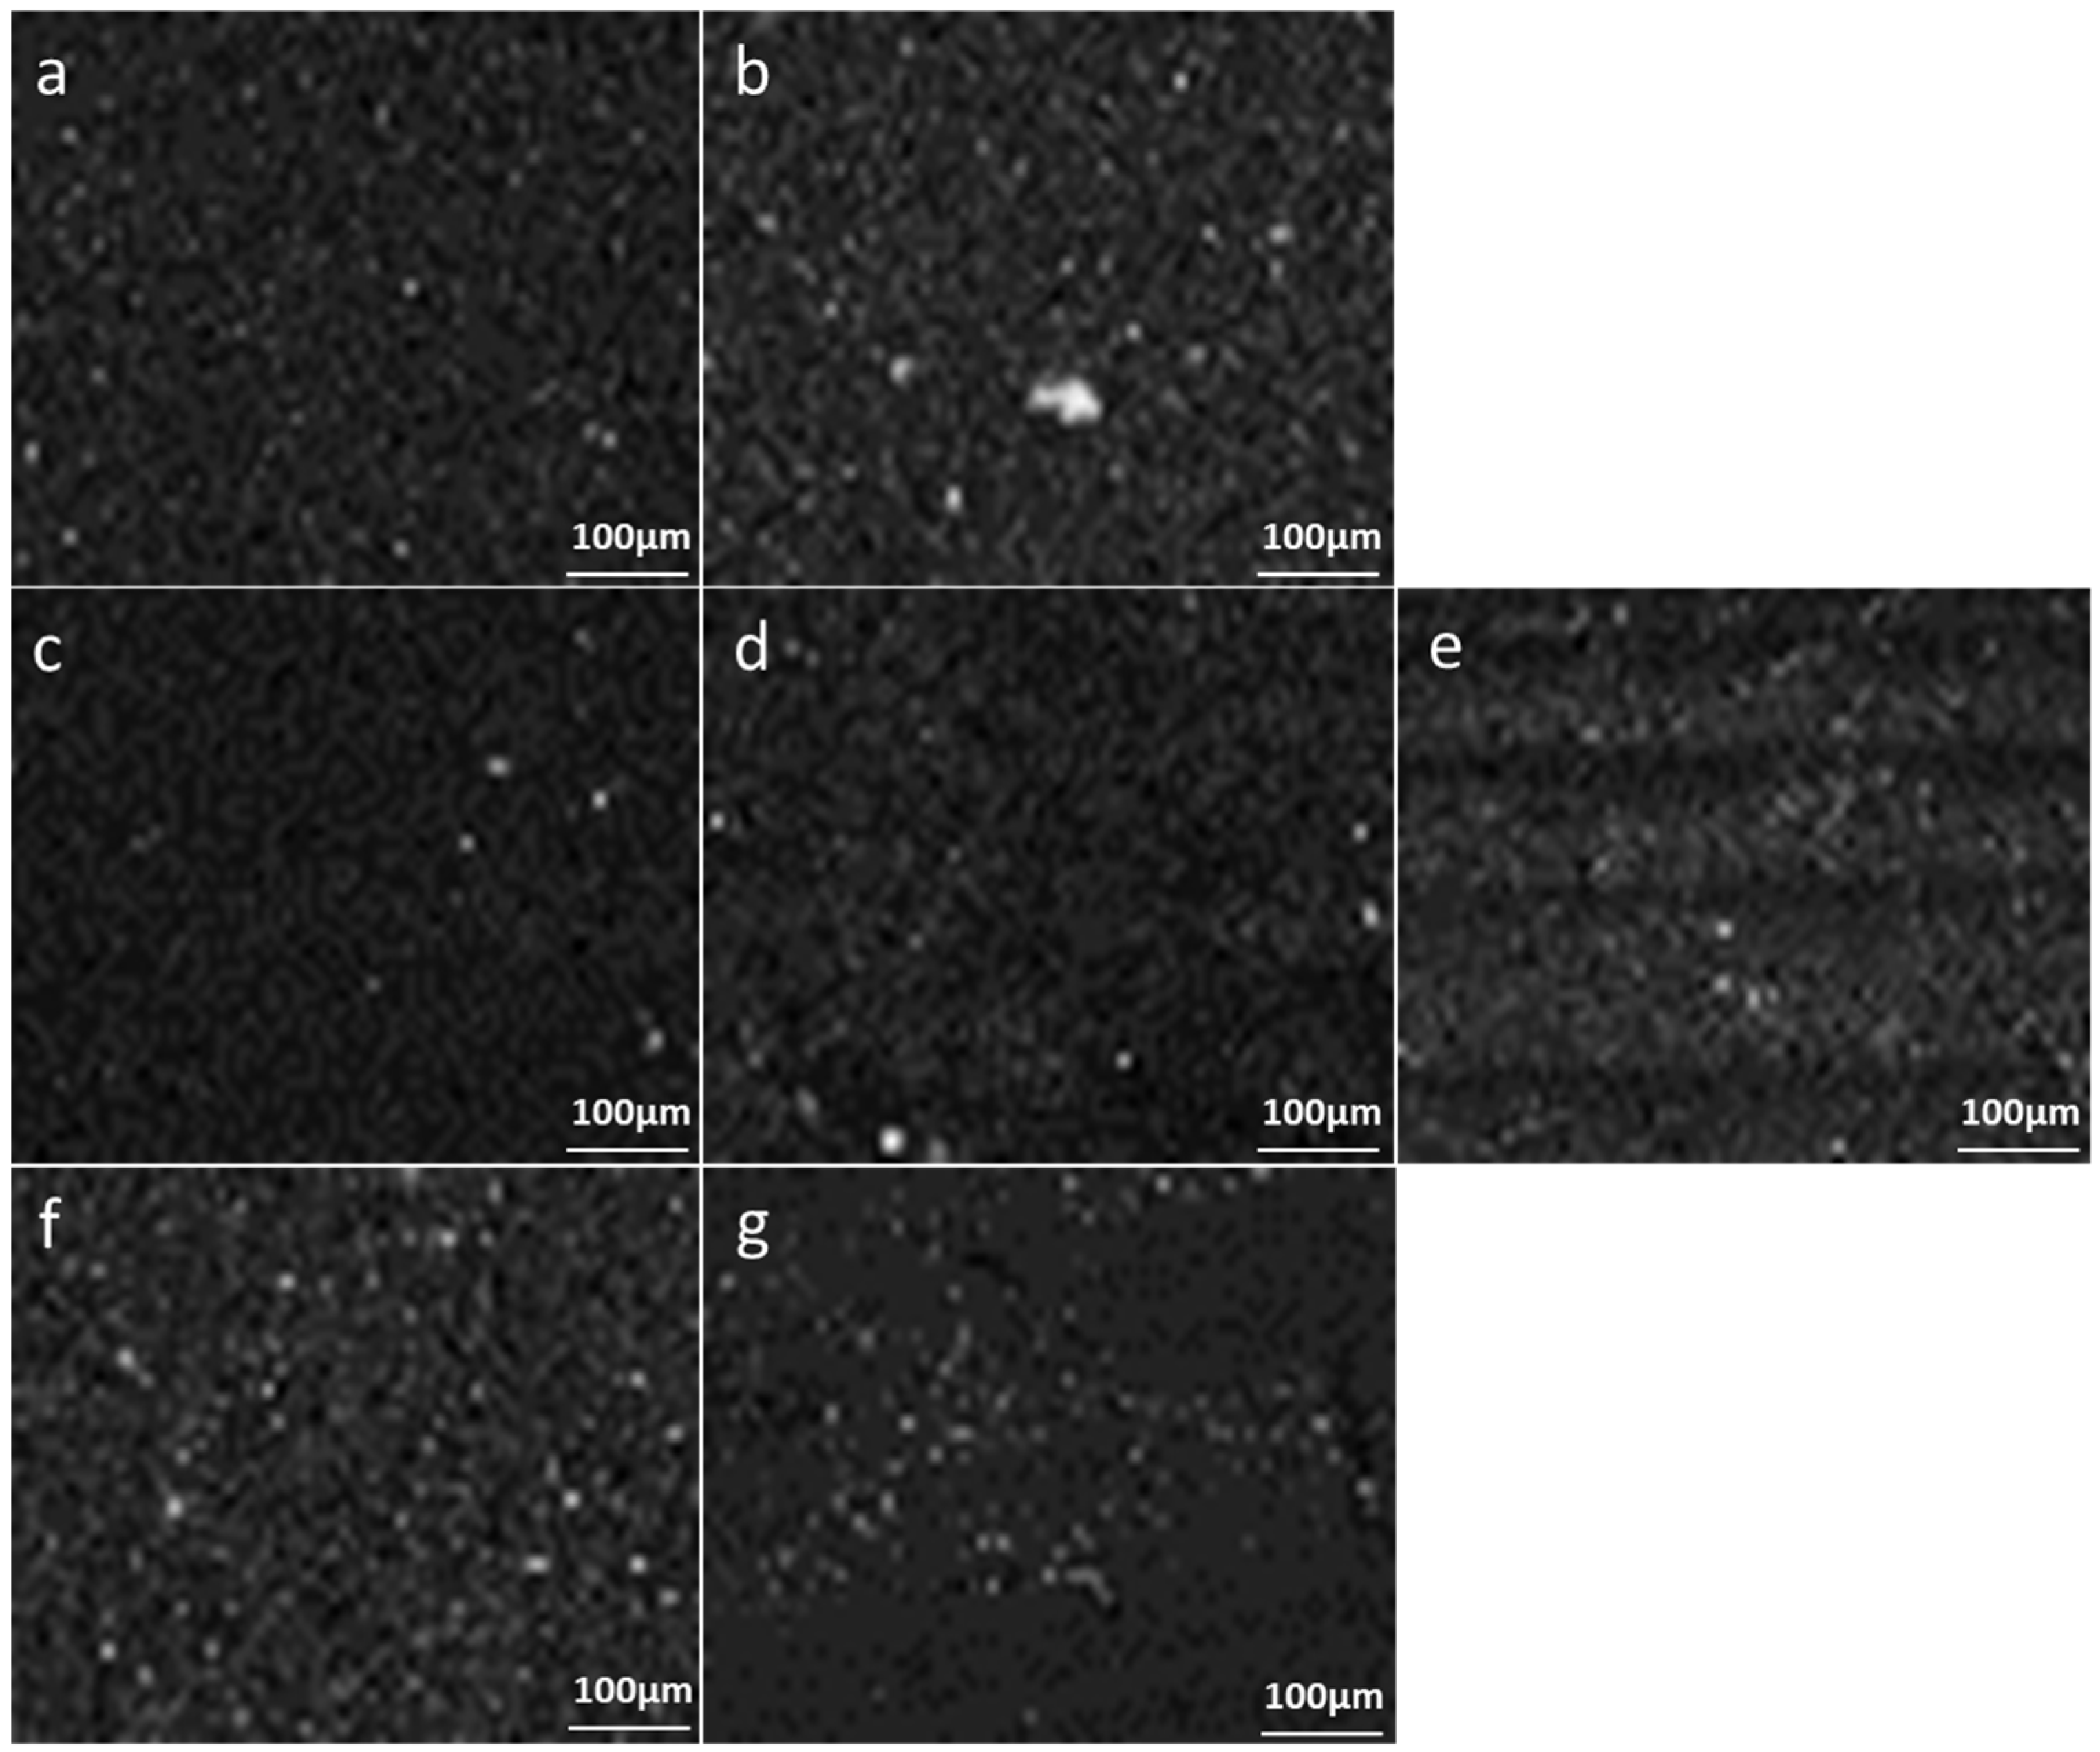
3.2.2. Enhanced Optical and Fluorescence Microscopy with DANS Dye under UV Radiation and Multispectral Imaging

In these experiments, DANS dye was chosen to improve the detection efficiency of MPs on CA filters under UV radiation. PET MPs were dyed inside the honey environment. MPs presented a significant fluorescence, even though samples were thoroughly washed using pentane. For the identification of MPs, Raman measurements were conducted as mentioned in Section 2.6.1 for Protocol 3. Several dimensions of MPs were detected: 3 μm, 5 μm, 10 μm, 18 μm, 20 μm, 35 μm, and 40 μm. Figure 6 indicates the Raman spectral signatures with the fluorescence due to the DANS dye absorbed from MPs.
PET MPs can also be dyed with DANS by passing the dye through the syringe filter. Afterward, the syringe filter was left at room temperature (RT) to dry for 24 h, before breaking the filter cup to collect the filter. Alternatively, one can break the filter cup and spread the dye on the filter surface afterward, but it was preferable to pass the dye through the syringe filter before breaking the filter cup because the dye spreads more homogeneously on the CA filter. Optical fluorescence measurements in combination with Raman measurements were conducted. Also, DANS dye does not interfere with Raman signals of plastics. An important observation was also that honey solid particles do not present this specific “glowing crown”. Honey solid particles have a red and bright yellow fluorescence, while the clean CA filter appears light pink under UV radiation. It was assumed that it could be possibly used for the identification of honey MPs in real samples. It was concluded that the less time-consuming way to dye PET MPs was to pass the dye solution through the syringe filter before breaking the filter cup. Still, the PET MPs were more homogeneously dyed when the dye solution was mixed with a honey sample with double quantity based on the [23] protocol. In Figure 7a,b dyed PET MPs are presented under UV, observed with a Raman microscope, whereas Figure 7a refers to dyed PET MPs under UV on a CA filter from the first experiment, and in Figure 7b, to the second experiment. Dyed PET MPs are distinguished by the “glowing crown” as mentioned previously. In Figure 7c1,c2 dyed PET MPs are observed under UV on a CA filter in honey. As was mentioned before, the CA filter with MPs was dyed with DANS dye in two different ways and allowed to dry at room temperature. In these pictures, solid particles of honey are observed, which have red and yellow colors under UV radiation. Additionally, in Figure 7d pure honey with DANS under UV is presented on the CA filter. Here, solid particles of honey are observed, which have red and bright yellow colors under UV radiation. A pure filter with DANS is presented in Figure 7e, where there are not any dyed particles. Finally, in Figure 7f, dyed MPs under UV are presented, in comparison with Figure 7g, where the same area as the picture area is presented with monochromatic imaging through a multispectral device (Xpecam X02, XpectralTEK, Braga, Portugal) at 625 nm wavelength. Multispectral imaging was used to enhance the contrast between the dyed PET MP particles and the background. The resulting images did not show a significant enhancement, with the best contrast appearing at 625 nm.

3.3. PET MP Detection in Deionized Water through Organic Solvents

Stainless steel blind nuts, aluminum foiled cups, PES filters, and CA filters were used as possible sample carriers [40]. Eventually, single-use CA syringe filters with 0.45 μm pore size proved to be the best choice for all the experiments, as they are disposable, do not interfere with the Raman signaling, and can filter as much volume as needed.
Toluene, petroleum ether, dipentene, and pentane were chosen as possible density separators of MPs since they create different distinct phases with water. Since they are volatile, they were used in small quantities (2.5 mL) and processed in a fume hood to avoid any environmental toxicity. Pentane was selected for its ability to remove oil residues as described in [22]. Hexane was also used as a possible solvent, but impurities caused interference in Raman signals.
Raman maps were compared between the different organic solvents and their aqueous phases. Bright spots indicate the existence of MPs. When toluene was used, the aqueous phase (Figure 8b) contained more MPs than the toluene phase (Figure 8a). The same was observed with petroleum ether (Figure 8d). Dipentene was found to be very sensitive to laser irradiation resulting in a Raman map with overexposed spots (“burnt”), so Raman mapping of the aqueous phases was not performed. Finally, pentane was found to be the best solution, as more MPs were detected in the organic phase (Figure 8f) compared to the aqueous phase (Figure 8g). Therefore, pentane was the chosen organic solvent for the density separation method.

3.4. Contamination Check

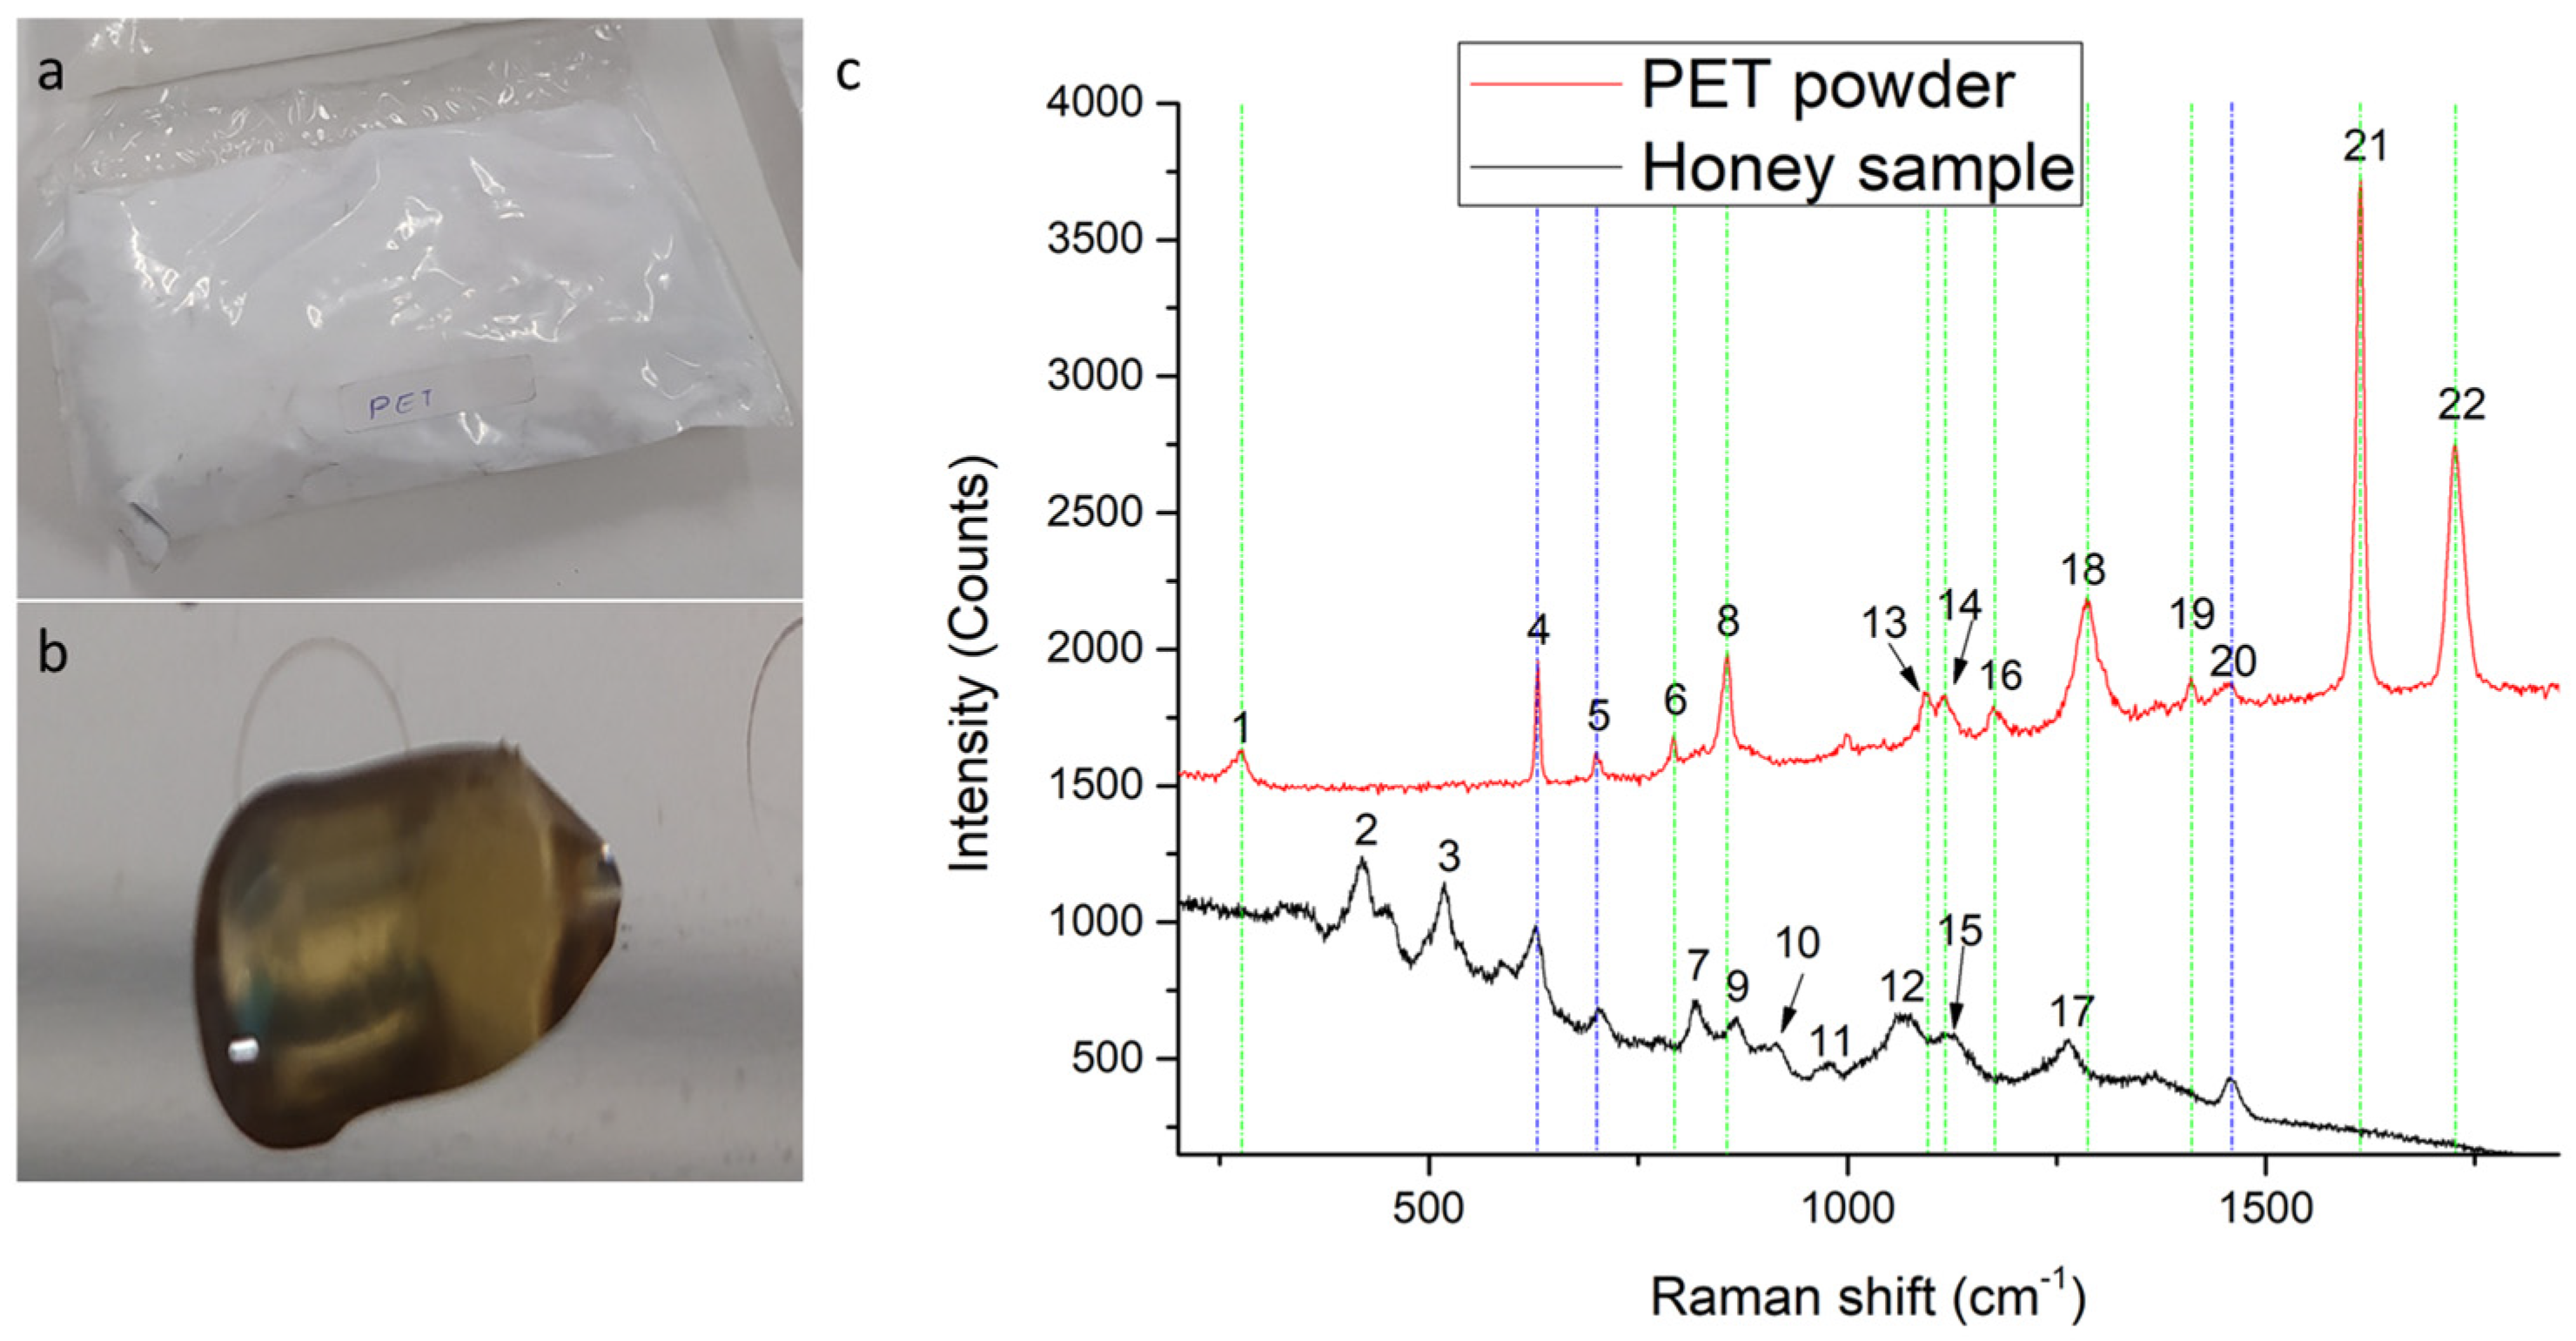
3.4.1. Reference Spectra and Assignments

Raman spectra of both PET MPs (Figure 9a) and honey (Figure 9b) are presented, to verify that there are no overlaps that could mislead this research (shown in Figure 9c). As is evident, between the two spectra, there are only three small peaks that belong to the same wavenumber, which are depicted with blue lines in Figure 9c and with bold in Table 1. The remaining ten Raman lines (in green colour), including the strongest PET Raman peaks centered at 1613 cm−1 and 1726 cm−1, do not exist in the honey spectrum. As a result, the PET characterization and identification in this work will be based only on the ten remaining Raman spectral features as depicted in green color in Figure 9c. Table 1 presents the Raman peak assignments found in honey and PET [41,42,43].
The mass spectrometry analysis was based on the literature [30], where the fragments with m/z 167 MH+ and 211 MH+ belong to PET monomers/oligomers. The fragment 167 is assigned to terephthalic acid H-T[TG]0-OH (TPA), and the fragment 211 is referred to as monohydroxyethyl terephthalate H-[TG]1-OH (MHET) [30].

3.4.2. Contamination Due to Materials Used

To confirm that no signal interference was introduced from the materials used in the experiments above, each tool accessory was tested under Raman spectroscopy. To avoid any MP contamination, no plastic equipment was used with a similar Raman fingerprint as the PET powder. The identification of each material was conducted using the “KnowItAll” Informatics System Bio-Rad Laboratories database. All Raman signals from the plastic tools used in this project (syringes, filters, etc.) are presented in Supplementary Section in comparison to the PET powder. It was fortunate that the Raman spectrum of PET was differentiated from the Raman signals of each plastic accessory used.

3.5. Methodological Experiment: Distributions of PET MPs into Different Organic Phases according to Their Dimensions

To study the MPs’ phase of preference, pentane was used as a density separator, to disperse the MPs. As mentioned in Section 2.4 and Section 3.1, each of the different phases passed through the CA syringe filters to collect the MPs. PET MPs on CA filters were observed and identified with the optical Raman microscope, and random selected areas were measured with Raman mapping. Raman maps acquired were then analyzed with the ImageJ application to measure the number and dimensions of MPs present in each extraction phase. MP measurements were then compared among all phases, referring to the number of MPs found in each specific selected filter area (610 × 500 μm). It was found that the D_Final had the highest number of MPs found, 121 particles, in the selected filter area compared to the other phases, while MPs’ dimensions ranged between 3 μm and 75 μm. The second phase with the most MPs found was the D_C1, with 111 particles of PET MPs in the selected filter area. MPs with dimensions between 5–8 μm were recovered in five out of the seven phases. Smaller dimensions close to the nanometric scale (1–2 μm) were recovered only from supernatants and the D_C1. However, MPs in the D_YC1 (Figure 2c) were not observed with optical microscopic observation and ImageJ in the whole filter area or with Raman mapping.
Also, it was expected that the pentane isolates PET MPs with small dimensions (1–2 μm) and that gravity acts more on the larger MPs. In more detail, D_Y1, D_Y2, and D_C1 contained the smallest dimensions of MPs, between 1 and 20 μm. It was remarkable that in D_Y1, D_Y2, and D_C1, Raman spectroscopy was able to detect MPs with dimensions up to 1 μm. The quantity of MPs was not so large, but their dispersion was sufficient to give satisfactory discrimination of the smallest dimensions (1–3 μm). The D_YC2 had larger dimensions of MPs ranging between 18 and 50 μm, which coexisted with MPs having smaller dimensions of 2–3 μm. An interesting result was observed between the two colloid phases. In the D_C1, the MPs’ dimensions were the smallest, from 1 μm up to 30 μm, which was in contrast with the D_C2, where the MPs’ dimensions were between medium and large (18–25 μm), including aggregates of 100 μm. Interestingly, these aggregates were larger than what the metallic filter mesh allowed (200 mesh/74 μm), assuming that they were created during the centrifugation of the colloidal phase. As a result, those aggregates did not permit us to calculate the MPs’ dimensions. Sediments and the D_Final included mostly of MPs of large dimensions, which was expected, since gravity pulls down the heavy MPs together with the rest of the solid honey particles such as pollen, pollen grains, wax, and propolis. These particles presented high photoluminescence that covered the Raman signals. The categorization of the different dimensions in the different phases was fulfilled, with the help of pentane, which made the MPs’ detection easier on the CA filter, without any further sample preparation. In Table 2, the results are presented, referring to the MPs’ dimension distribution between the different phases.

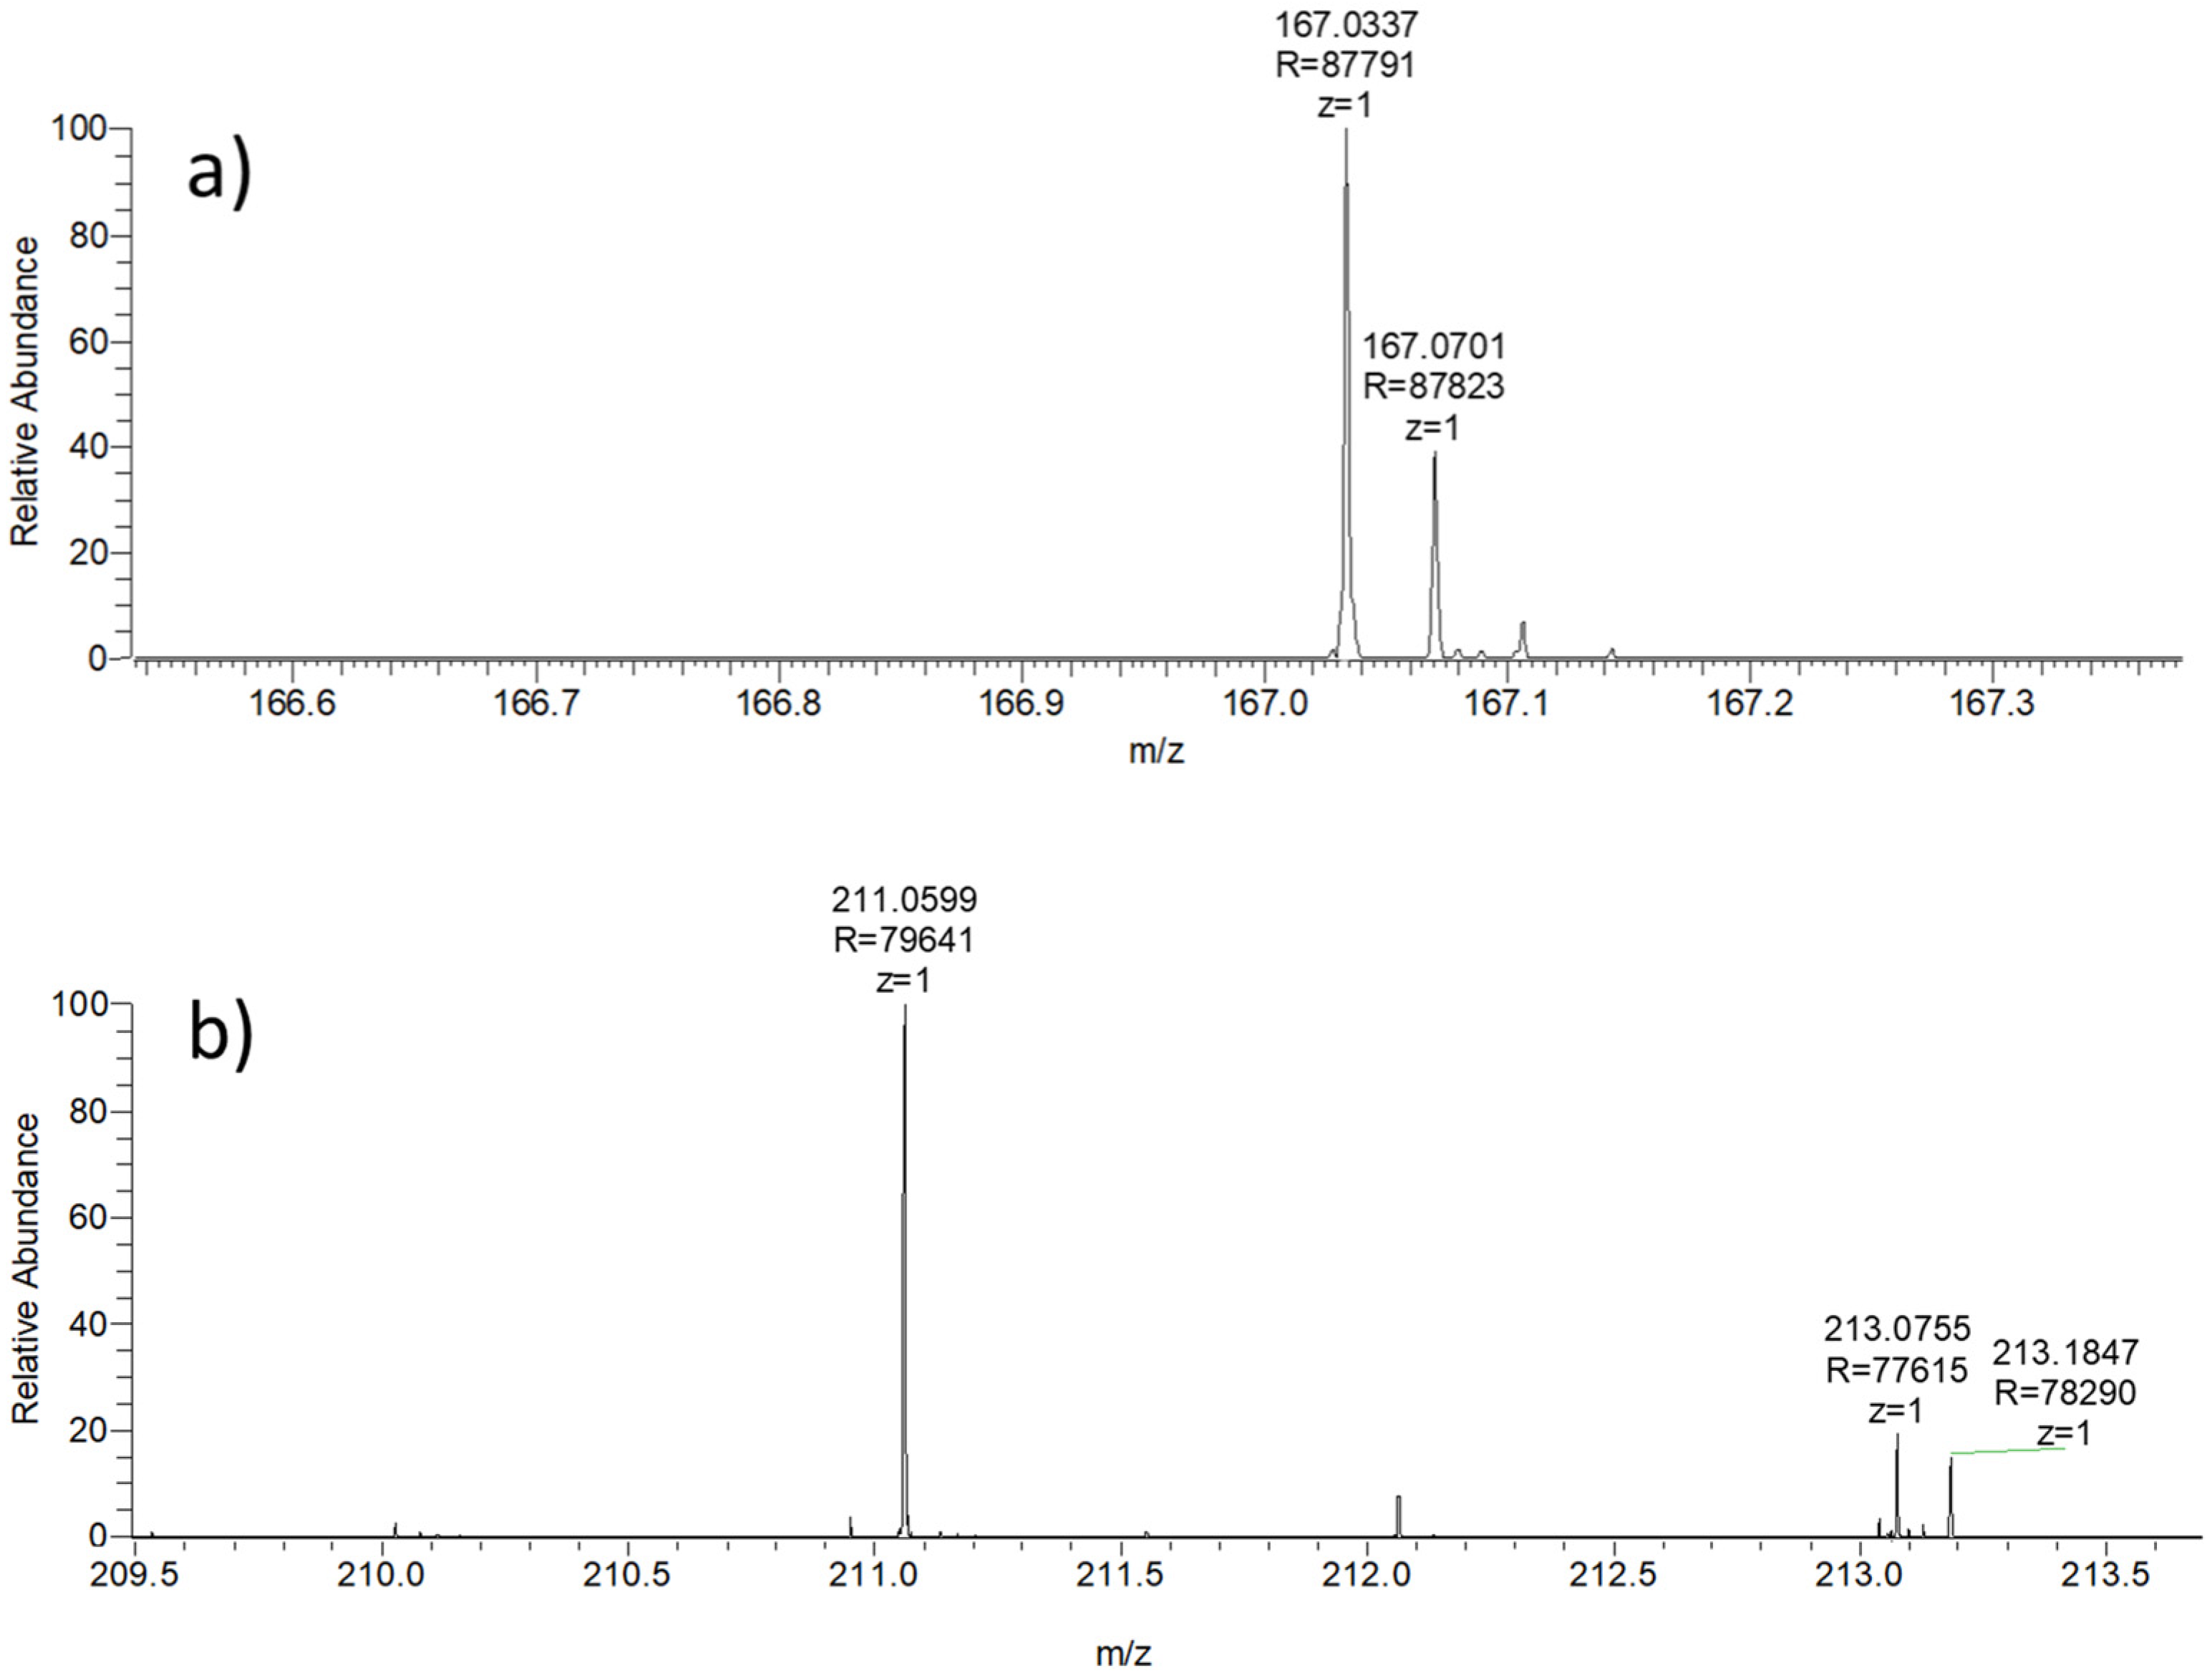
3.6. Analysis of Mass Spectrometry and Results

Confirming the PET masses (MH+) to the literature [30], fragments with m/z 167.0337 and 211.0599 corresponding to TPA and MHET, respectively, were found in D_C1, D_C2, and D_Final, and in the indicator sample with PET MPs and deionized water (MPs_H2O), by the ESI–MS technique using the LTQ-Orbitrap XL ETD mass spectrometer. As is presented in Table 3, the fragments did not exist in the corresponding control samples with honey (C_C1, C_C2, and C_Final), which was the most essential MS result. The common existence of the fragment ion 167 in the solvents does not disturb the identification of this fragment ion as PET ion in the samples. In the supernatants, these fragments were not identified as PET fragments because “z” was not determined from the analysis of Xcalibur software. Additionally, based on the reference table (Common Background Contamination Ions in Mass Spectrometry, Fisher Chemical, Ottawa, ON, Canada), there was no contamination in the samples. In Figure 10, the two fragments are presented at specific time points from the MPs_H2O samples. Additional spectra are presented in the Supplementary Section Figures S3–S9. Our result reveals that PET fragments can be detected in diluted honey solutions using the ESI–MS technique with the LTQ-Orbitrap XL ETD mass spectrometer simply by injecting the PET NP samples directly into the MS detector.

4. Conclusions

The main goal of this work was to develop methodologies for the detection of MPs/NPs in honey samples.
MPs, referring to particle dimensions between 1 μm and 74 μm, were sufficiently detected by Raman spectroscopy and optical and fluorescence microscopy. NPs referring to particle dimensions smaller than 0.2 μm were impossible to be detected with the same techniques as in MPs. For this purpose, we employed the ESI–MS technique, which allowed the successful detection of the PET fragments in the honey solutions. PET fragments were detected in the colloid phases and the remaining samples of diluted honey solutions, when pentane was used as a density separator. Finally, all three methodologies presented in this work proved that it is possible to detect PET MPs/NPs in honey samples when dozens of MP particles exist in a sample.
The most efficient method to detect PET MPs in honey solutions is to combine a density separation methodology using pentane with the analytical capabilities of Raman mapping, which also allows MPs identification. Similarly, optical microscopy is a simple, cost-efficient, time-consuming methodology for MP detection in honey samples that can be applied in a wide range of laboratories using commonly found optical microscopes, DANS dye, and the proposed sample preparation protocols.
We hope that this work will lay the foundation for MP/NP detection in real samples and inspire the community to develop similar approaches for other complex samples.

Supplementary Materials

The following supporting information can be downloaded at: https://www.mdpi.com/article/10.3390/app14114720/s1, Table S1: characterization of market honey packages; Figure S1: (a) planetary mill ball with (b) balls with metallic cups, (c) metallic cups as samplers, and (d) metallic cup under the Raman microscope; Figure S2: (a) the mapping of the D_C1, in Protocol 2 from the Materials and Methods section and (b) the mapping of the picture S2a with ImageJ threshold, with its characteristics presented in the table; Figure S3: Experimental setup of UV-excited fluorescence. The sample is placed under the objective lens, with the UV lamp in a way that the created beam is parallel to the flat area of the filter, holding the lamp by hand; Figure S4: PET fragment ion m/z 167.0341 from the D_C1; Figure S5: PET fragment ion m/z 211.0605 from the D_C1; Figure S6: PET fragment ion m/z 167.0342 from the D_C2; Figure S7: PET fragment ion m/z 211.0605 from the D_C2; Figure S8: PET fragment ion m/z 167.0339 from the D_Final; Figure S9: PET fragment ion m/z 211.0607 from the D_Final.

Author Contributions

Conceptualization and methodology, K.K., G.K., E.A. and V.M.P.; bibliographic investigation, K.K., G.K., E.A., N.K. and V.M.P.; experimental characterization and analysis, K.K., G.K., N.K., Z.V. and V.M.P.; manuscript reviewing, G.K., E.A., N.K., Z.V. and V.M.P.; funding acquisition G.K., E.A. and V.M.P. All authors have read and agreed to the published version of the manuscript.

Funding

This work was financially supported by the Hellenic Foundation for Research and Innovation (HFRI) under the 4th Call for HFRI PhD Fellowships (Fellowship Number: 10660). The article processing charges for this work were financed by the Institute of Electronic Structure and Laser of the Foundation for Research and Technology, Hellas, and the Hellenic Mediterranean University.

Institutional Review Board Statement

Not applicable.

Informed Consent Statement

Not applicable.

Data Availability Statement

All data reported here can be made available upon request.

Acknowledgments

This research work was supported by the Hellenic Foundation for Research and Innovation (HFRI) under the 4th Call for HFRI PhD Fellowships (Fellowship Number: 10660). We thank the PROFI (Proteomics Facility at IMBB-FORTH) for performing all the MS measurements. The authors would also like to thank Aleka Manousaki from the Institute of Electronic Structure and Laser of the Foundation for Research and Technology, Hellas (IESL-FORTH), for assisting us on the SEM images presented in this work.

Conflicts of Interest

The authors declare no conflicts of interest.

References

  1. Hossain, M.L.; Lim, L.Y.; Hammer, K.; Hettiarachchi, D.; Locher, C. Honey-Based Medicinal Formulations: A Critical Review. Appl. Sci. 2021, 11, 5159. [Google Scholar] [CrossRef]
  2. Islam, M.K.; Lawag, I.L.; Green, K.J.; Sostaric, T.; Hammer, K.A.; Lim, L.Y.; Locher, C. An investigation of the suitability of melissopalynology to authenticate Jarrah honey. Curr. Res. Food Sci. 2022, 5, 506–514. [Google Scholar] [CrossRef] [PubMed]
  3. Almasaudi, S. The antibacterial activities of honey. Saudi J. Biol. Sci. 2021, 28, 2188–2196. [Google Scholar] [CrossRef] [PubMed]
  4. Eteraf-Oskouei, T.; Najafi, M. Traditional and modern uses of natural honey in human diseases: A review. Iran. J. Basic Med. Sci. 2013, 16, 731–742. [Google Scholar] [PubMed]
  5. Gkoutzouvelidou, M.; Panos, G.; Xanthou, M.N.; Papachristoforou, A.; Giaouris, E. Comparing the Antimicrobial Actions of Greek Honeys from the Island of Lemnos and Manuka Honey from New Zealand against Clinically Important Bacteria. Foods 2021, 10, 1402. [Google Scholar] [CrossRef] [PubMed]
  6. Balzani, P.; Galeotti, G.; Scheggi, S.; Masoni, A.; Santini, G.; Baracchi, D. Acute and chronic ingestion of polyethylene (PE) microplastics has mild effects on honey bee health and cognition. Environ. Pollut. 2022, 305, 119318. [Google Scholar] [CrossRef] [PubMed]
  7. Liebezeit, G.; Liebezeit, E. Origin of Synthetic Particles in Honeys. Pol. J. Food Nutr. Sci. 2015, 65, 143–147. [Google Scholar] [CrossRef]
  8. Edo, C.; Fernández-Alba, A.R.; Vejsnæs, F.; van der Steen, J.J.M.; Fernández-Piñas, F.; Rosal, R. Honeybees as active samplers for microplastics. Sci. Total Environ. 2021, 767, 144481. [Google Scholar] [CrossRef] [PubMed]
  9. Cella, C.; La Spina, R.; Mehn, D.; Fumagalli, F.; Ceccone, G.; Valsesia, A.; Gilliland, D. Detecting Micro- and Nanoplastics Released from Food Packaging: Challenges and Analytical Strategies. Polymers 2022, 14, 1238. [Google Scholar] [CrossRef]
  10. Penalver, R.; Arroyo-Manzanares, N.; Campillo, N.; Vinas, P. Targeted and untargeted gas chromatography-mass spectrometry analysis of honey samples for determination of migrants from plastic packages. Food Chem. 2021, 334, 127547. [Google Scholar] [CrossRef]
  11. Diaz-Basantes, M.F.; Conesa, J.A.; Fullana, A. Microplastics in Honey, Beer, Milk and Refreshments in Ecuador as Emerging Contaminants. Sustainability 2020, 12, 5514. [Google Scholar] [CrossRef]
  12. Muhlschlegel, P.; Hauk, A.; Walter, U.; Sieber, R. Lack of evidence for microplastic contamination in honey. Food Addit. Contam. Part A Chem. Anal. Control Expo. Risk Assess. 2017, 34, 1982–1989. [Google Scholar] [CrossRef] [PubMed]
  13. Katsara, K.; Kenanakis, G.; Alissandrakis, E.; Papadakis, V.M. Honey Quality and Microplastic Migration from Food Packaging: A Potential Threat for Consumer Health? Microplastics 2022, 1, 406–427. [Google Scholar] [CrossRef]
  14. Zhou, X.; Wang, J.; Ren, J. Analysis of Microplastics in Takeaway Food Containers in China Using FPA-FTIR Whole Filter Analysis. Molecules 2022, 27, 2646. [Google Scholar] [CrossRef] [PubMed]
  15. El Hadri, H.; Gigault, J.; Maxit, B.; Grassl, B.; Reynaud, S. Nanoplastic from mechanically degraded primary and secondary microplastics for environmental assessments. NanoImpact 2020, 17, 100206. [Google Scholar] [CrossRef]
  16. Katsara, K.; Psatha, K.; Kenanakis, G.; Aivaliotis, M.; Papadakis, V.M. Subtyping on Live Lymphoma Cell Lines by Raman Spectroscopy. Materials 2022, 15, 546. [Google Scholar] [CrossRef]
  17. Roeffaers, M.B.; Zhang, X.; Freudiger, C.W.; Saar, B.G.; van Ruijven, M.; van Dalen, G.; Xiao, C.; Xie, X.S. Label-free imaging of biomolecules in food products using stimulated Raman microscopy. J. Biomed. Opt. 2011, 16, 021118. [Google Scholar] [CrossRef]
  18. Lotfi Choobbari, M.; Ferguson, J.; Van den Brande, N.; Smith, T.; Chalyan, T.; Meulebroeck, W.; Ottevaere, H. Studying the concentration of polymers in blended microplastics using 2D and 3D Raman mapping. Sci. Rep. 2023, 13, 7771. [Google Scholar] [CrossRef] [PubMed]
  19. Sobhani, Z.; Al Amin, M.; Naidu, R.; Megharaj, M.; Fang, C. Identification and visualisation of microplastics by Raman mapping. Anal. Chim. Acta 2019, 1077, 191–199. [Google Scholar] [CrossRef]
  20. Leung, M.M.; Ho, Y.W.; Maboloc, E.A.; Lee, C.H.; Wang, Y.; Hu, M.; Cheung, S.G.; Fang, J.K. Determination of microplastics in the edible green-lipped mussel Perna viridis using an automated mapping technique of Raman microspectroscopy. J. Hazard. Mater. 2021, 420, 126541. [Google Scholar] [CrossRef]
  21. Park, H.M.; Park, S.; de Guzman, M.K.; Baek, J.Y.; Cirkovic Velickovic, T.; Van Messem, A.; De Neve, W. MP-Net: Deep learning-based segmentation for fluorescence microscopy images of microplastics isolated from clams. PLoS ONE 2022, 17, e0269449. [Google Scholar] [CrossRef]
  22. Zada, L.; Leslie, H.A.; Vethaak, A.D.; Tinnevelt, G.H.; Jansen, J.J.; de Boer, J.F.; Ariese, F. Fast microplastics identification with stimulated Raman scattering microscopy. J. Raman Spectrosc. 2018, 49, 1136–1144. [Google Scholar] [CrossRef]
  23. Sancataldo, G.; Ferrara, V.; Bonomo, F.P.; Chillura Martino, D.F.; Licciardi, M.; Pignataro, B.G.; Vetri, V. Identification of microplastics using 4-dimethylamino-4′-nitrostilbene solvatochromic fluorescence. Microsc. Res. Tech. 2021, 84, 2820–2831. [Google Scholar] [CrossRef]
  24. Peng, C.; Tang, X.; Gong, X.; Dai, Y.; Sun, H.; Wang, L. Development and Application of a Mass Spectrometry Method for Quantifying Nylon Microplastics in Environment. Anal. Chem. 2020, 92, 13930–13935. [Google Scholar] [CrossRef] [PubMed]
  25. Adhikari, S.; Kelkar, V.; Kumar, R.; Halden, R.U. Methods and challenges in the detection of microplastics and nanoplastics: A mini-review. Polym. Int. 2021, 71, 543–551. [Google Scholar] [CrossRef]
  26. Sunta, U.; Trebse, P.; Kralj, M.B. Simply Applicable Method for Microplastics Determination in Environmental Samples. Molecules 2021, 26, 1840. [Google Scholar] [CrossRef]
  27. Schirinzi, G.F.; Llorca, M.; Seró, R.; Moyano, E.; Barceló, D.; Abad, E.; Farré, M. Trace analysis of polystyrene microplastics in natural waters. Chemosphere 2019, 236, 124321. [Google Scholar] [CrossRef]
  28. Tian, L.; Skoczynska, E.; van Putten, R.J.; Leslie, H.A.; Gruter, G.M. Quantification of polyethylene terephthalate micro- and nanoplastics in domestic wastewater using a simple three-step method. Sci. Total Environ. 2023, 857, 159209. [Google Scholar] [CrossRef]
  29. Prosenc, F.; Leban, P.; Šunta, U.; Bavcon Kralj, M. Extraction and Identification of a Wide Range of Microplastic Polymers in Soil and Compost. Polymers 2021, 13, 4069. [Google Scholar] [CrossRef] [PubMed]
  30. Kim, D.-J.; Lee, K.-T. Determination of monomers and oligomers in polyethylene terephthalate trays and bottles for food use by using high performance liquid chromatography-electrospray ionization-mass spectrometry. Polym. Test. 2012, 31, 490–499. [Google Scholar] [CrossRef]
  31. Wilm, M. Principles of electrospray ionization. Mol. Cell. Proteom. 2011, 10, M111.009407. [Google Scholar] [CrossRef]
  32. von Eyken, A.; Ramachandran, S.; Bayen, S. Suspected-target screening for the assessment of plastic-related chemicals in honey. Food Control 2020, 109, 106941. [Google Scholar] [CrossRef]
  33. Yan, X.T.; Zhang, Y.; Zhou, Y.; Li, G.H.; Feng, X.S. Technical Overview of Orbitrap High Resolution Mass Spectrometry and Its Application to the Detection of Small Molecules in Food (Update Since 2012). Crit. Rev. Anal. Chem. 2022, 52, 593–626. [Google Scholar] [CrossRef]
  34. Li, F.; Song, N.; Li, X.; Jirigalantu; Mi, X.; Sun, C.; Sun, Y.; Feng, S.; Wang, G.; Qiu, J.; et al. Detection of microplastics via a confocal-microscope spatial-heterodyne Raman spectrometer with echelle gratings. Spectrochim. Acta A Mol. Biomol. Spectrosc. 2024, 313, 124099. [Google Scholar] [CrossRef]
  35. Schymanski, D.; Ossmann, B.E.; Benismail, N.; Boukerma, K.; Dallmann, G.; von der Esch, E.; Fischer, D.; Fischer, F.; Gilliland, D.; Glas, K.; et al. Analysis of microplastics in drinking water and other clean water samples with micro-Raman and micro-infrared spectroscopy: Minimum requirements and best practice guidelines. Anal. Bioanal. Chem. 2021, 413, 5969–5994. [Google Scholar] [CrossRef]
  36. Ossmann, B.E.; Sarau, G.; Schmitt, S.W.; Holtmannspotter, H.; Christiansen, S.H.; Dicke, W. Development of an optimal filter substrate for the identification of small microplastic particles in food by micro-Raman spectroscopy. Anal. Bioanal. Chem. 2017, 409, 4099–4109. [Google Scholar] [CrossRef]
  37. Murray, A.; Örmeci, B. Removal Effectiveness of Nanoplastics (&lt;400 nm) with Separation Processes Used for Water and Wastewater Treatment. Water 2020, 12, 635. [Google Scholar] [CrossRef]
  38. Kniggendorf, A.-K.; Wetzel, C.; Roth, B. Microplastics Detection in Streaming Tap Water with Raman Spectroscopy. Sensors 2019, 19, 1839. [Google Scholar] [CrossRef]
  39. Schneider, C.A.; Rasband, W.S.; Eliceiri, K.W. NIH Image to ImageJ: 25 years of image analysis. Nat. Methods 2012, 9, 671–675. [Google Scholar] [CrossRef] [PubMed]
  40. Shams, M.; Alam, I.; Chowdhury, I. Aggregation and stability of nanoscale plastics in aquatic environment. Water Res. 2020, 171, 115401. [Google Scholar] [CrossRef] [PubMed]
  41. Bistričić, L.; Borjanović, V.; Leskovac, M.; Mikac, L.; McGuire, G.E.; Shenderova, O.; Nunn, N. Raman spectra, thermal and mechanical properties of poly(ethylene terephthalate) carbon-based nanocomposite films. J. Polym. Res. 2015, 22, 39. [Google Scholar] [CrossRef]
  42. Huzortey, A.A.; Arefi, A.; Anderson, B.; Khadem, H.; Sackey, S.S.; Mahmoodi-Khaledi, E.; Tavassoli, S.H. 532-nm Laser-Excited Raman Spectroscopic Evaluation of Iranian Honey. Food Anal. Methods 2021, 15, 772–782. [Google Scholar] [CrossRef]
  43. Perret, E.; Braun, O.; Sharma, K.; Tritsch, S.; Muff, R.; Hufenus, R. High-resolution 2D Raman mapping of mono- and bicomponent filament cross-sections. Polymer 2021, 229, 124011. [Google Scholar] [CrossRef]
Figure 1. Experimental setup. (a) Sample filtration through CA filter; (b) CA filter under the Raman microscope for Raman mapping; (c) 532 nm laser on for Raman mapping; and (d) The sediment on a metallic microscopic slide.
Applsci 14 04720 g001
Figure 2. Raman maps from each extraction phase: (a) D_Y1; (b) D_Y2; (c) D_YC1; (d) D_YC2; (e) D_C1; (f) D_C2; (g) D_Final.
Applsci 14 04720 g002
Figure 3. (a) Raman map from diluted honey with MPs in deionized water which passed through CA filter after filtration with mesh 200 (74 μm pore size) and (b) PET MPs as identified from the left map.
Applsci 14 04720 g003
Figure 4. PET MPs under the optical microscope from each phase: (a) D_Y1; (b) D_Y2; (c) D_YC2; (d) D_C1; (e) D_C2; (f) D_Final; (g) sediment of colloid phase from the first extraction; (h) sediment of colloid phase from the second extraction.
Applsci 14 04720 g004
Figure 5. (a) PET MPs with honey solids on CA filter; (b) PET MPs with honey solids on the microscopic metallic slide; (c) The Raman signals of the five detected PET MPs from Figure 5a,b and Figure 4a–c compared with PET powder Raman signal.
Applsci 14 04720 g005
Figure 6. (a) Picture with MPs from first experiment with dyed MPs into the honey; (b) Raman plot of MPs detected in picture (a); (c) Picture with MPs from second experiment with dyed MPs in honey, before dyed MPs mixed with it; (d) Raman plot of MPs detected in picture (c).
Applsci 14 04720 g006
Figure 7. (a) CA filter from the first experiment with dyed PET MPs under UV; (b) CA filter from the second experiment with dyed PET MPs under UV; (c1,c2) CA filter from dyed PET MPs under UV in honey; (d) CA filter from pure honey with DANS under UV; (e) pure CA filter with DANS; (f) dyed MPs under UV; (g) the same area as picture (f), dyed MPs with monochromatic imaging at 625 nm.
Applsci 14 04720 g007
Figure 8. Raman maps comparison between different organic solvents and their aqueous phases: (a) Raman map of S1, toluene sample; (b) Raman map of the aqueous phase of S1; (c) Raman map of S2, petroleum ether sample; (d) Raman map of the aqueous phase of S2; (e) Raman map of S3; (f) Raman map of S4, pentane sample, (g) Raman map of the aqueous phase of S4.
Applsci 14 04720 g008
Figure 9. (a) PET powder; (b) honey sample; and (c) Raman spectra for pure honey (black line) and PET powder (red line), used for the experiments.
Applsci 14 04720 g009
Figure 10. MS1 spectra of PET fragments masses, z = 1 MH+ in MPs_H2O sample: (a) m/z 167.0337 and (b) m/z 211.0599.
Applsci 14 04720 g010
Table 1. List of the major Raman peak assignments commonly found in honey and PET [41,42,43].
Peak
Number
Raman Shift (cm−1)AssignmentsPeak Strength
HoneyPETHoneyPET
1-277-C-C stretching (ring), CCC bending (ring) [41]Weak
2420-C–C-O and C–C-C bending of major Fructose or minor Glucose [42]-Strong
3518-C–C-O and C–C-C deformation of minor Fructose or major Glucose [42]-Strong
4628630Ring deformation of major Fructose or minor Sucrose [42]CCC in-plane bending (ring) [41]Common (strong)
5706700C-O and C–C-O stretching, O-C-O bending of Fructose [42]-Common (weak)
6-792-CH out of plane bending (ring) [41]Weak
7820-C–OH bending of Fructose [42]-Medium
8-857-C–C stretching (ring breathing), C–O stretching [41]Strong
9869-C–O–C Cyclic alkyl ethers of major Fructose or minor Glucose [42]-Medium weak
10916-CH, COH bending of major Glucose or minor Maltose [42]-Weak
11980-Ring breathing of Fructose [42]-Weak
121075-C–O–C stretching, C-N vibration of proteins in major Fructose or minor Glucose [42]-Medium
13-1095-Ring C–C, ester C(O)–O, ethylene glycol C–C (trans) [43]Weak
14-1115-CH in-plane bending (ring), C–O stretching [41]Weak
151127-C–OH deformation of major Glucose or minor Maltose [42] Medium
16-1174-CH in-plane bending (ring) [41]Weak
171264-C–O–C Cyclic alkyl ethers of Fructose [42] Medium
18-1285-C–C stretching (ring), C–O stretching [41]Strong
19-1411-C–C stretching (ring) [41]Weak
2014571455CH2 bending of Fructose or minor Glucose [42]CH deformation [41]Common (weak)
21-1613-C=C stretching (ring) [41]Very Strong
22-1726-C=O stretching [41]Strong
Table 2. Statistics on MP particle dimensions due to the density separation phases with pentane. All particles have been counted in the same field of view (740 × 590 μm).
First Extraction Phase Second Extraction Phase
Optical Microscopy/Raman MappingImageJOptical Microscopy/Raman MappingImageJMP Dimensions and Quantity Notes
PhaseMP Dimension MP CountAverage
Dimension (μm2)
MP DimensionMP CountAverage
Dimension (μm2)
D_Y (1,2)1–20 μm54121–20 μm4119Many small and medium MPs
D_YC (1,2)---18–50 μm
A few 2–3 μm
2728Medium MPs
D_C (1,2)1–30 μm11130Many 18–25 μm
100 μm clusters
Some 10 μm
7425First extraction → Many small and medium MPs
Second extraction → Many medium and large MPs
Sediment of colloidal phaseNo MPs < 8–74 μmNo red mapNo red map75 μm and >100 μm clusters
Some 5 μm
No red mapNo red mapFirst extraction → Large MPs
Second extraction → Huge clusters > CA filter pore size
D_Final 3, 5, 10, 20 μm
55–75 μm
12129The most MPs found. MPs < 1–2 μm not found
Table 3. PET fragments’ masses, z = 1 MH+ in samples, control samples, and solvents found in the MS experiment.
PET Fragments in MPs_H2O
167.0337 MH+
(±10 ppm)
211.0599 MH+
(±10 ppm)
SamplesPET Fragments in Samples
Deionized water (H2O)167.0338, z = 1-
(ACN)-0.5% formic acid167.0337, z = 1-
(ACN)-0.5% formic acid–pentane167.0339, z = 1-
(ACN)-0.5% formic acid–(H2O)167.0337, z = 1-
C_C1--
C_C2--
C_Final--
D_C1167.0341, z = 1211.0605, z = 1
D_C2167.0342, z = 1211.0605, z = 1
D_Final167.0339, z = 1211.0607, z = 1
Disclaimer/Publisher’s Note: The statements, opinions and data contained in all publications are solely those of the individual author(s) and contributor(s) and not of MDPI and/or the editor(s). MDPI and/or the editor(s) disclaim responsibility for any injury to people or property resulting from any ideas, methods, instructions or products referred to in the content.

