
Adsorption on Powdered Activated Carbon (PAC) Dosed into an Anthracite-Sand Filter in Water Treatment—Model and Criterion Equations

Abstract
1. Introduction
2. Data, Methods and Techniques
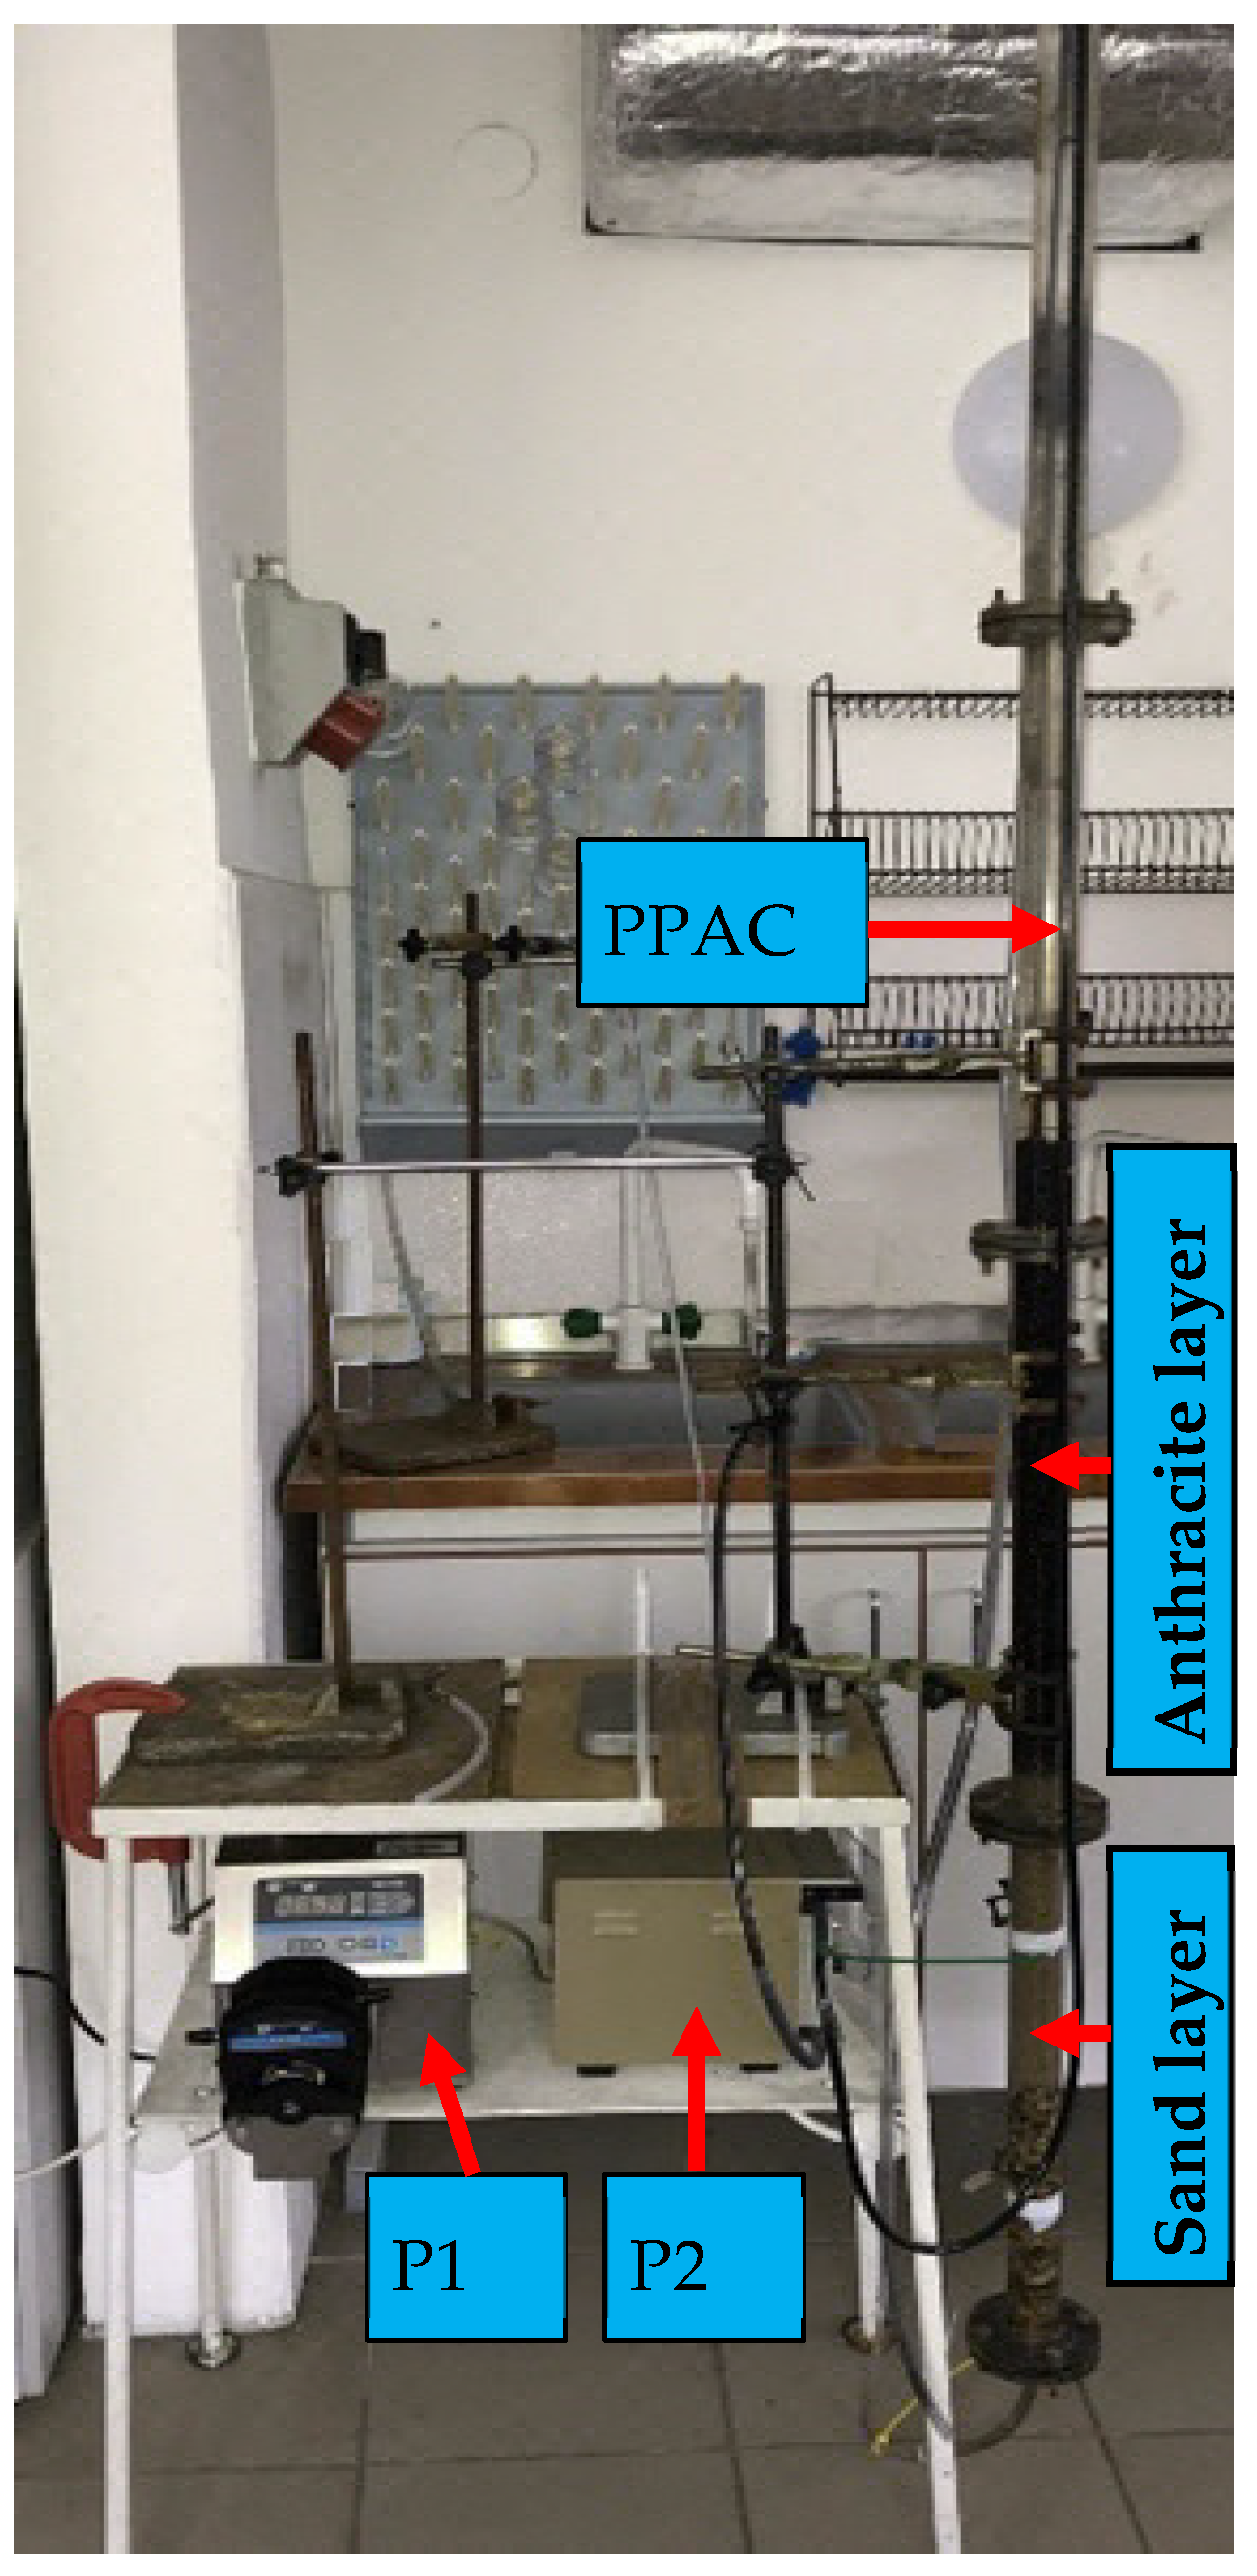
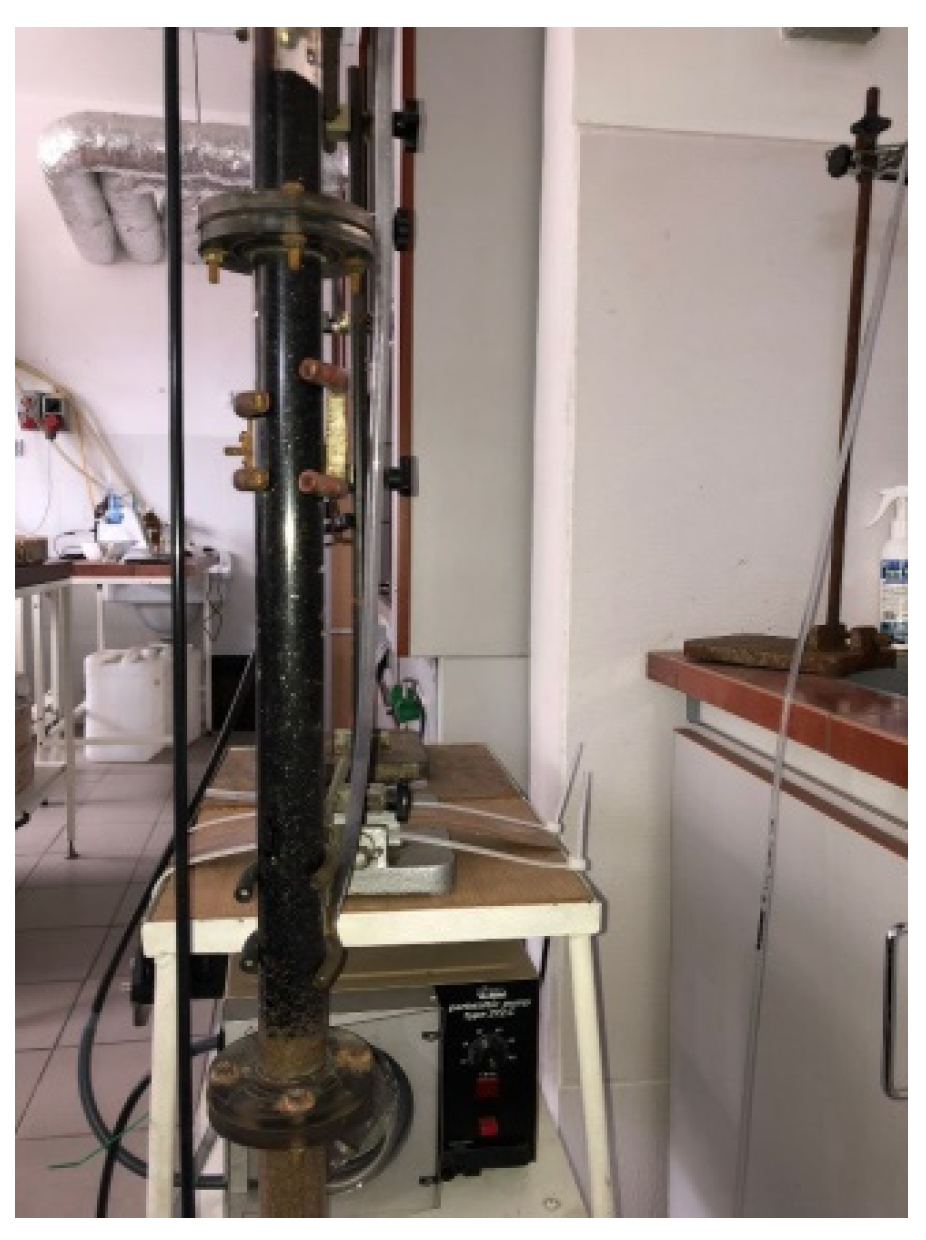
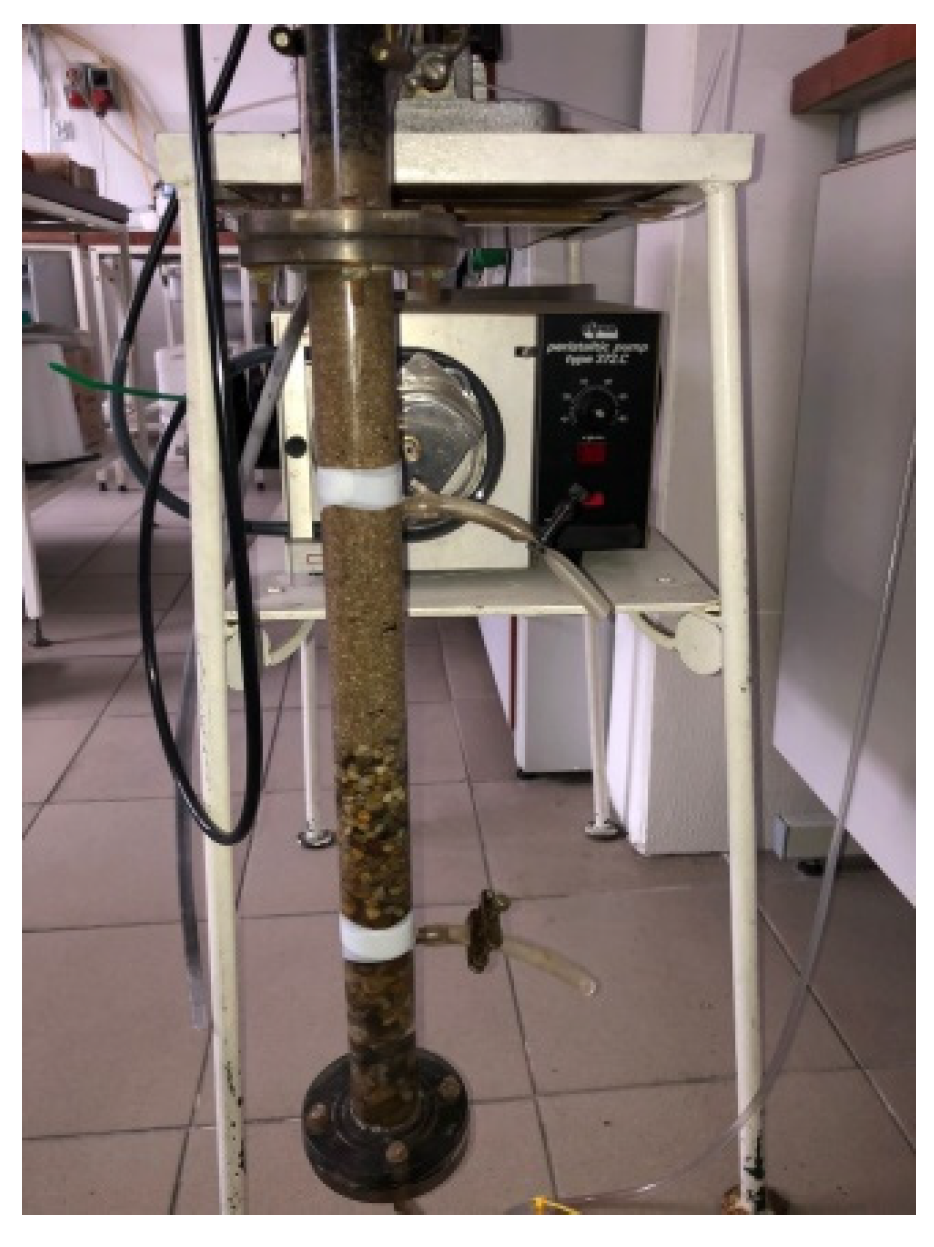
2.1. Filter Supplemented with PAC
- Methylene number: min. 20 mL,
- Iodine number: min. 850 mg/g
- Moisture: max. 8–10%
- Surface area: min. 800 m2/g
2.2. Experiments
2.3. Parameters of the Advection and Diffusion Model
- —electrolyte concentration (val/cm3);
- —equivalent conductivity (μS·cm2/val);
- —specific conductivity (μS/cm);
- —mass of a tracer introduced (val);
- —flow rate (m3/s);
- —actual filtration velocity (capillary velocity) (m/s), ;
- —apparent filtration velocity (empty bed velocity) (m/s);
- —average porosity of the filter bed;
- —actual coefficient of longitudinal turbulent diffusion (coefficient of longitudinal capillary turbulent diffusion) (m2/s), ;
- —longitudinal turbulent diffusion coefficient in an empty bed (m2/s);
- —linear coordinate (height of the bed including the supporting layer and the drain tube x = L = 3.1 m);
- —time (s).
2.4. Model of Adsorption in the Filter with PAC
- —adsorbate concentration (g/m3 of water) for absorbance (1/m);
- —equilibrium concentration (g/m3 of water) for absorbance (1/m);
- —mass transfer rate constant across a water–sorbent interface (m/s);
- —specific outer surface of sorbent particles (m2/g of PAC);
- —empty bed (column) velocity (m/s);
- —longitudinal dispersion coefficient in an empty bed (m2/s);
- —filter bed porosity (m3 of pores/m3 of bed);
- ρp,sorb—apparent density of sorbent fed to a column (g PAC/m3 of bed), ;
- —mass of sorbent fed to a filter column (g of sorbent);
- —volume of an adsorption column (anthracite + PAC) (m3 of bed), sum of the volume of anthracite with PAC (m3 of sorbent) and the volume of pores (m3 of pores) is the volume of the bed (m3 of bed); note: the volume of pores (m3 of pores) is equivalent to volume of water (m3 of water); it means that: 1 m3 of pores = 1 m3 of water;
- —time (s);
- —linear coordinate (m).
- a*—adsorption capacity (g/m3 of sorbent) for absorbance ((1/m)/m3 of sorbent), ;
- a—adsorption capacity (g/g of sorbent) for absorbance ((1/m)/g of sorbent);
- —share of a anthracite + sorbent volume (i.e., sorbent) in the bed volume (m3 of sorbent/m3 of bed) (others as above).
- Γ*—Henry’s constant (m3 of water/m3 of sorbent) for absorbance (1/m3 of sorbent)
- Γ—Henry’s constant (m3 of water/g PAC) for absorbance (1/g PAC) (others as above).
- —maximum adsorption capacity (asymptote of the Langmuir isotherm) (g/m3 of sorbent) for absorbance ((1/m)/m3 of sorbent);b—Langmuir isotherm’s constant (g/m3 of water) for absorbance (1/m) (others as above).
- -
- Initial: for t = 0, x ∈ (0, L〉, C(x, t) = 0, a*(x, t) = 0, L—length of the bed—3.1 m
- -
- Boundary: for t ≥ 0, x = 0, C(0, t) = C0, a*(0, t) = 0
3. Results
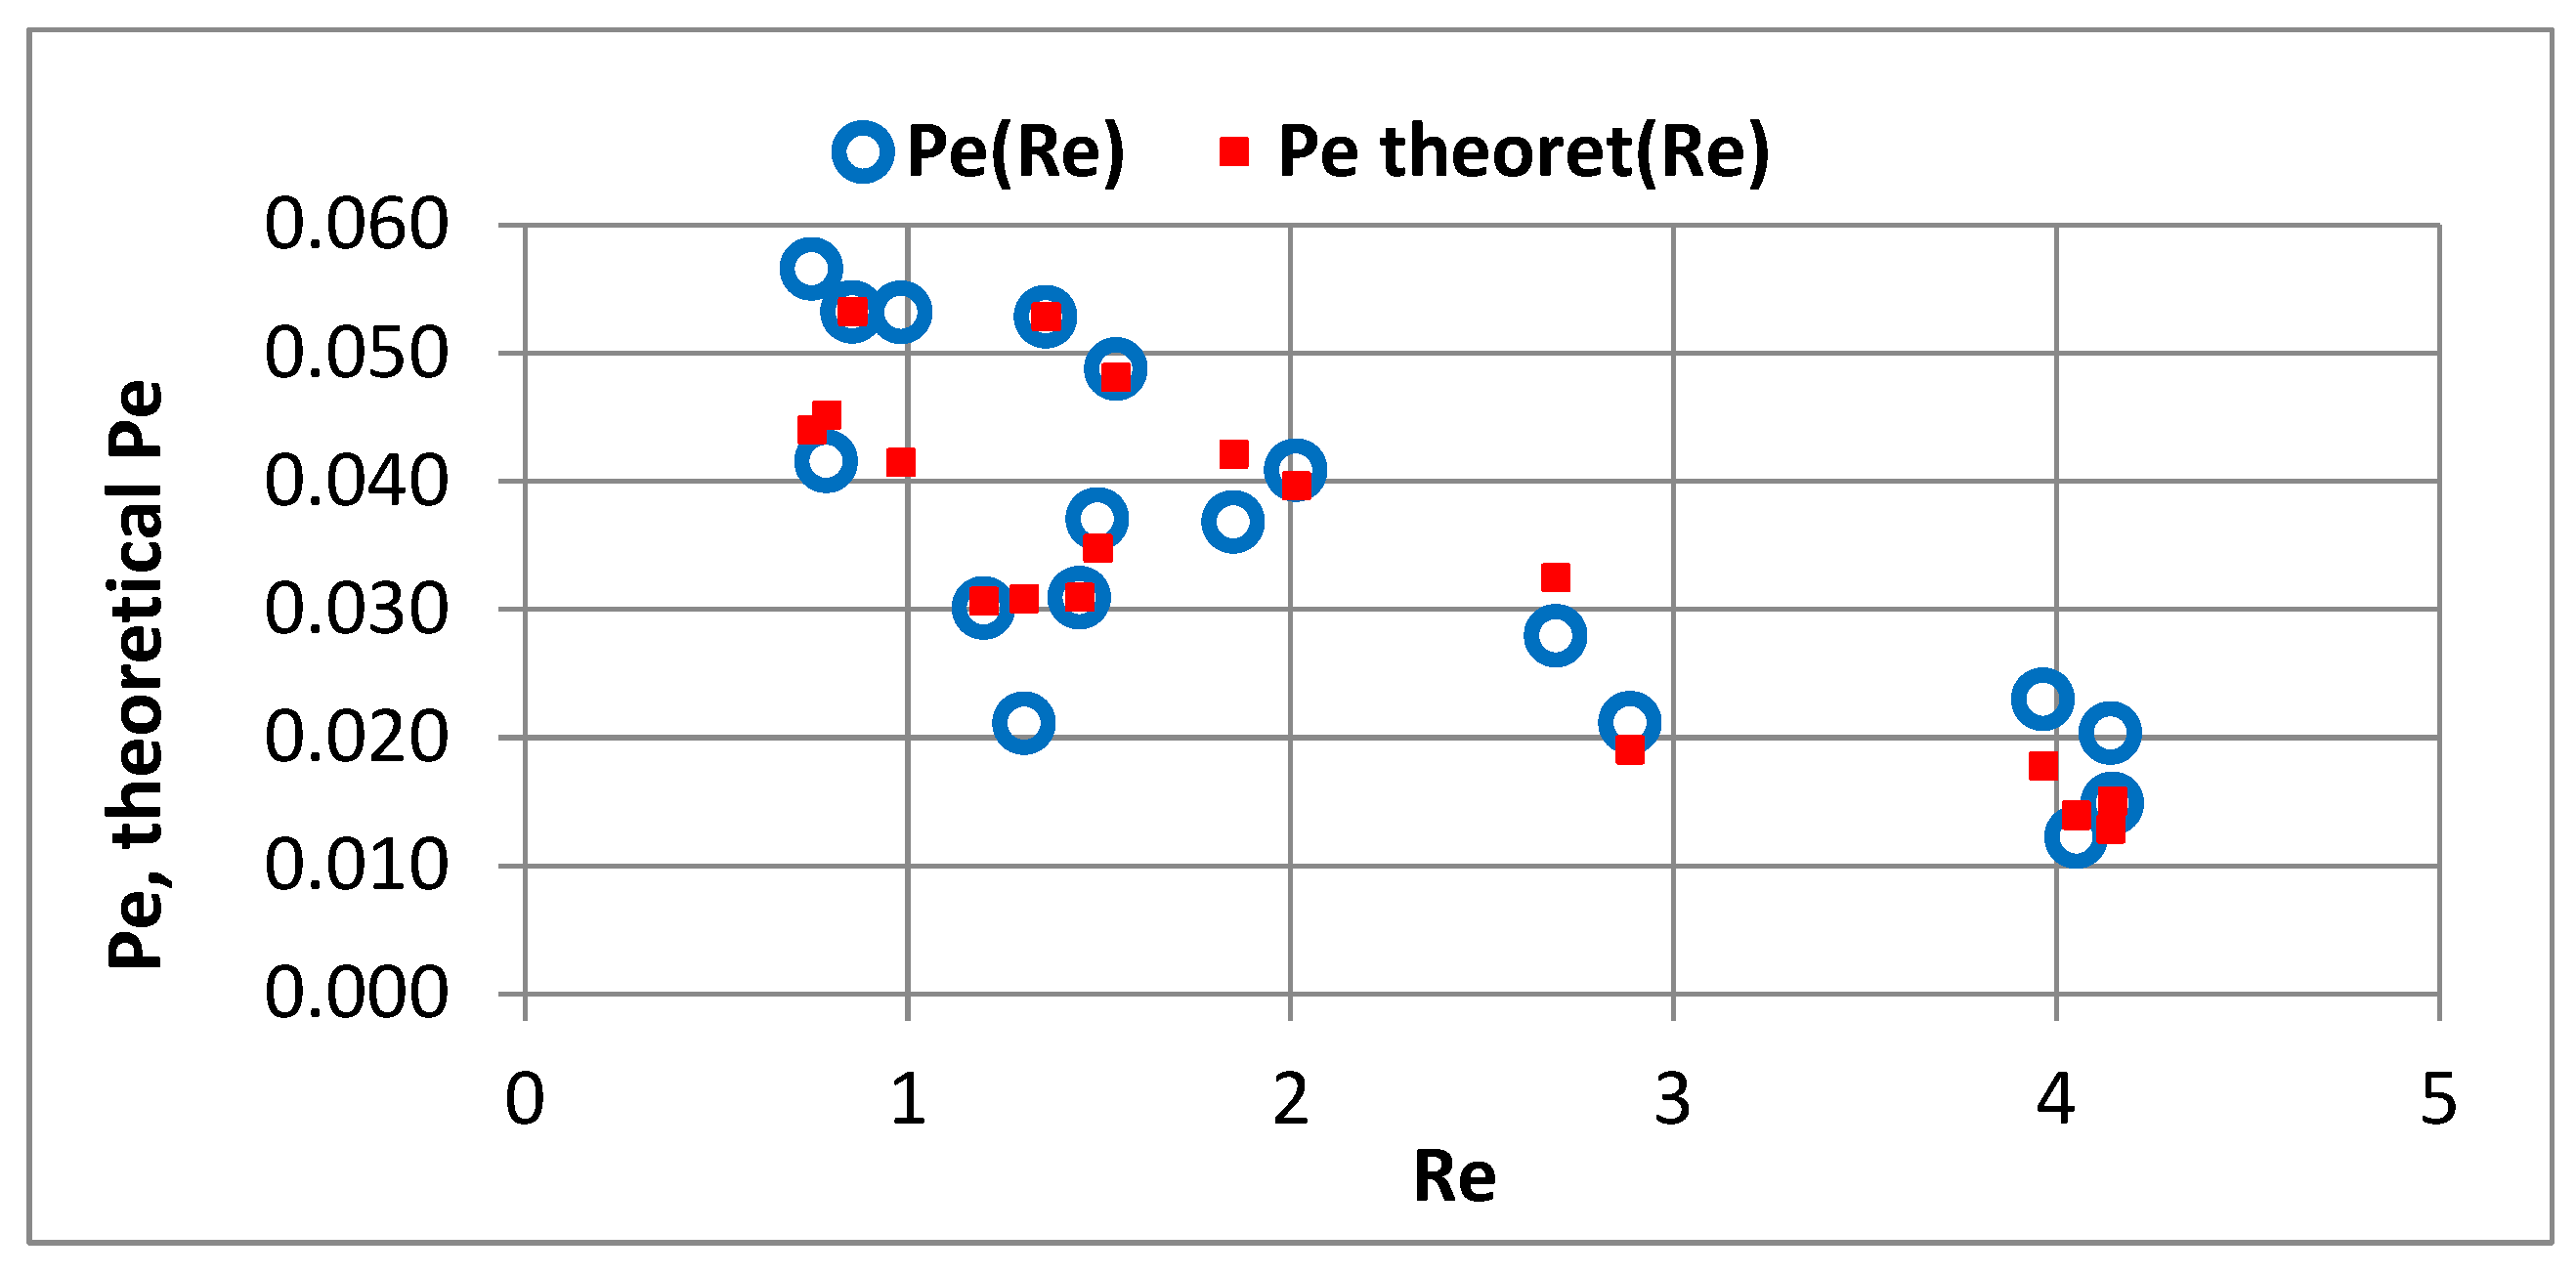
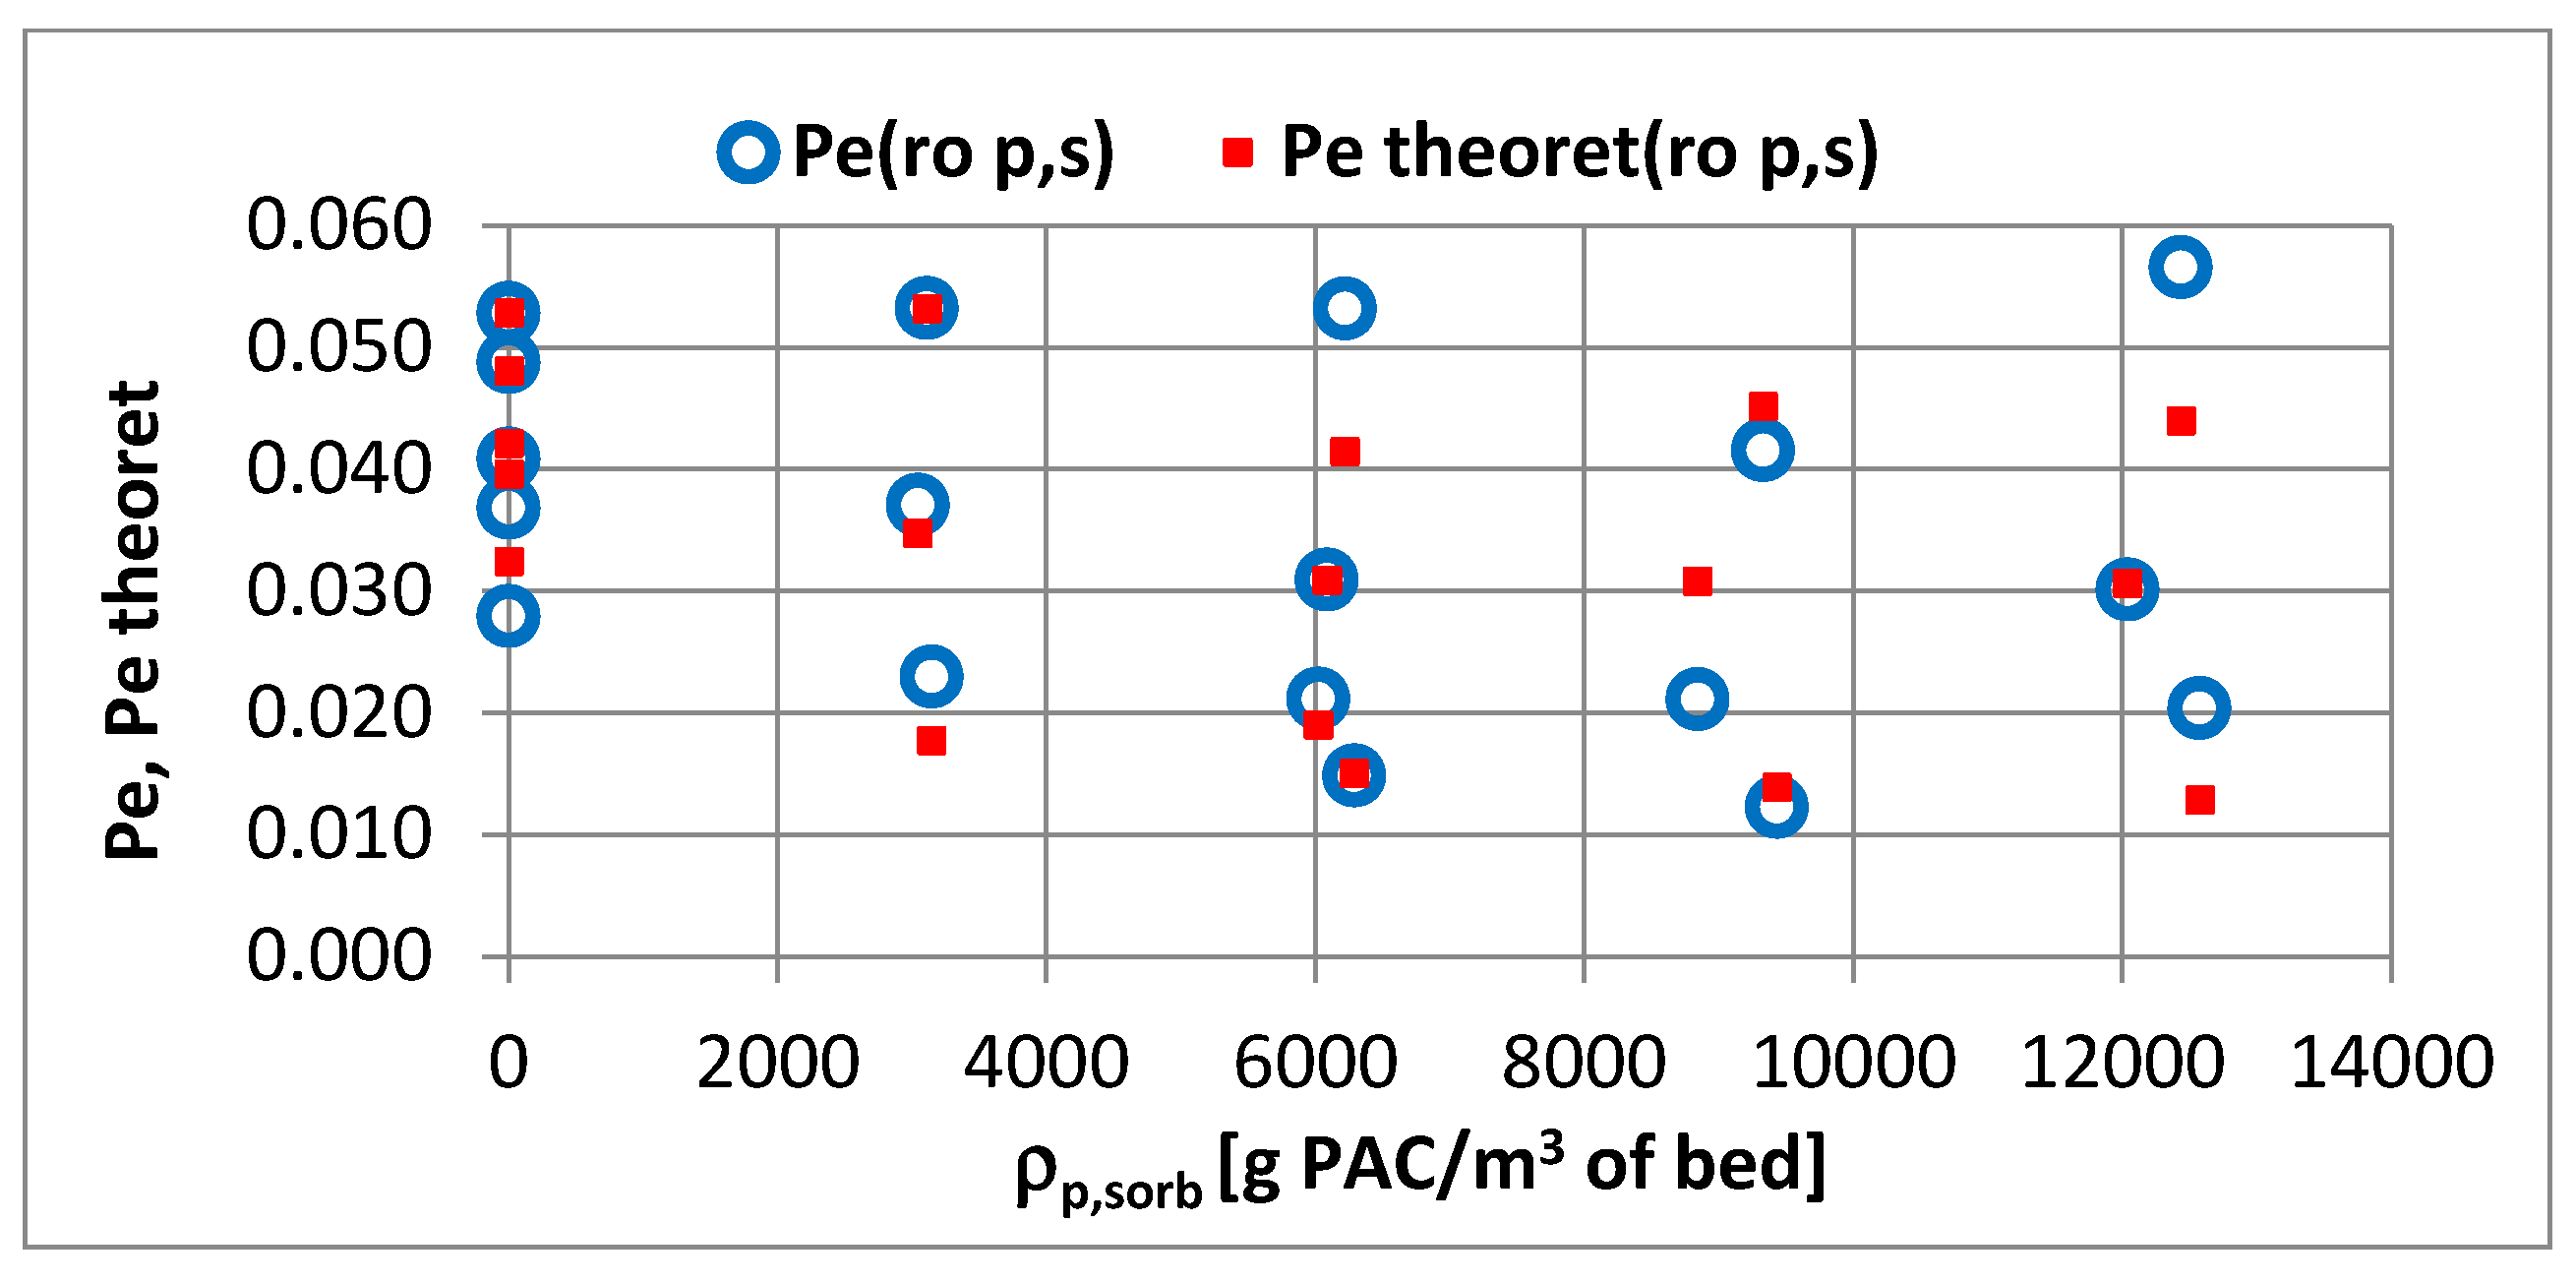
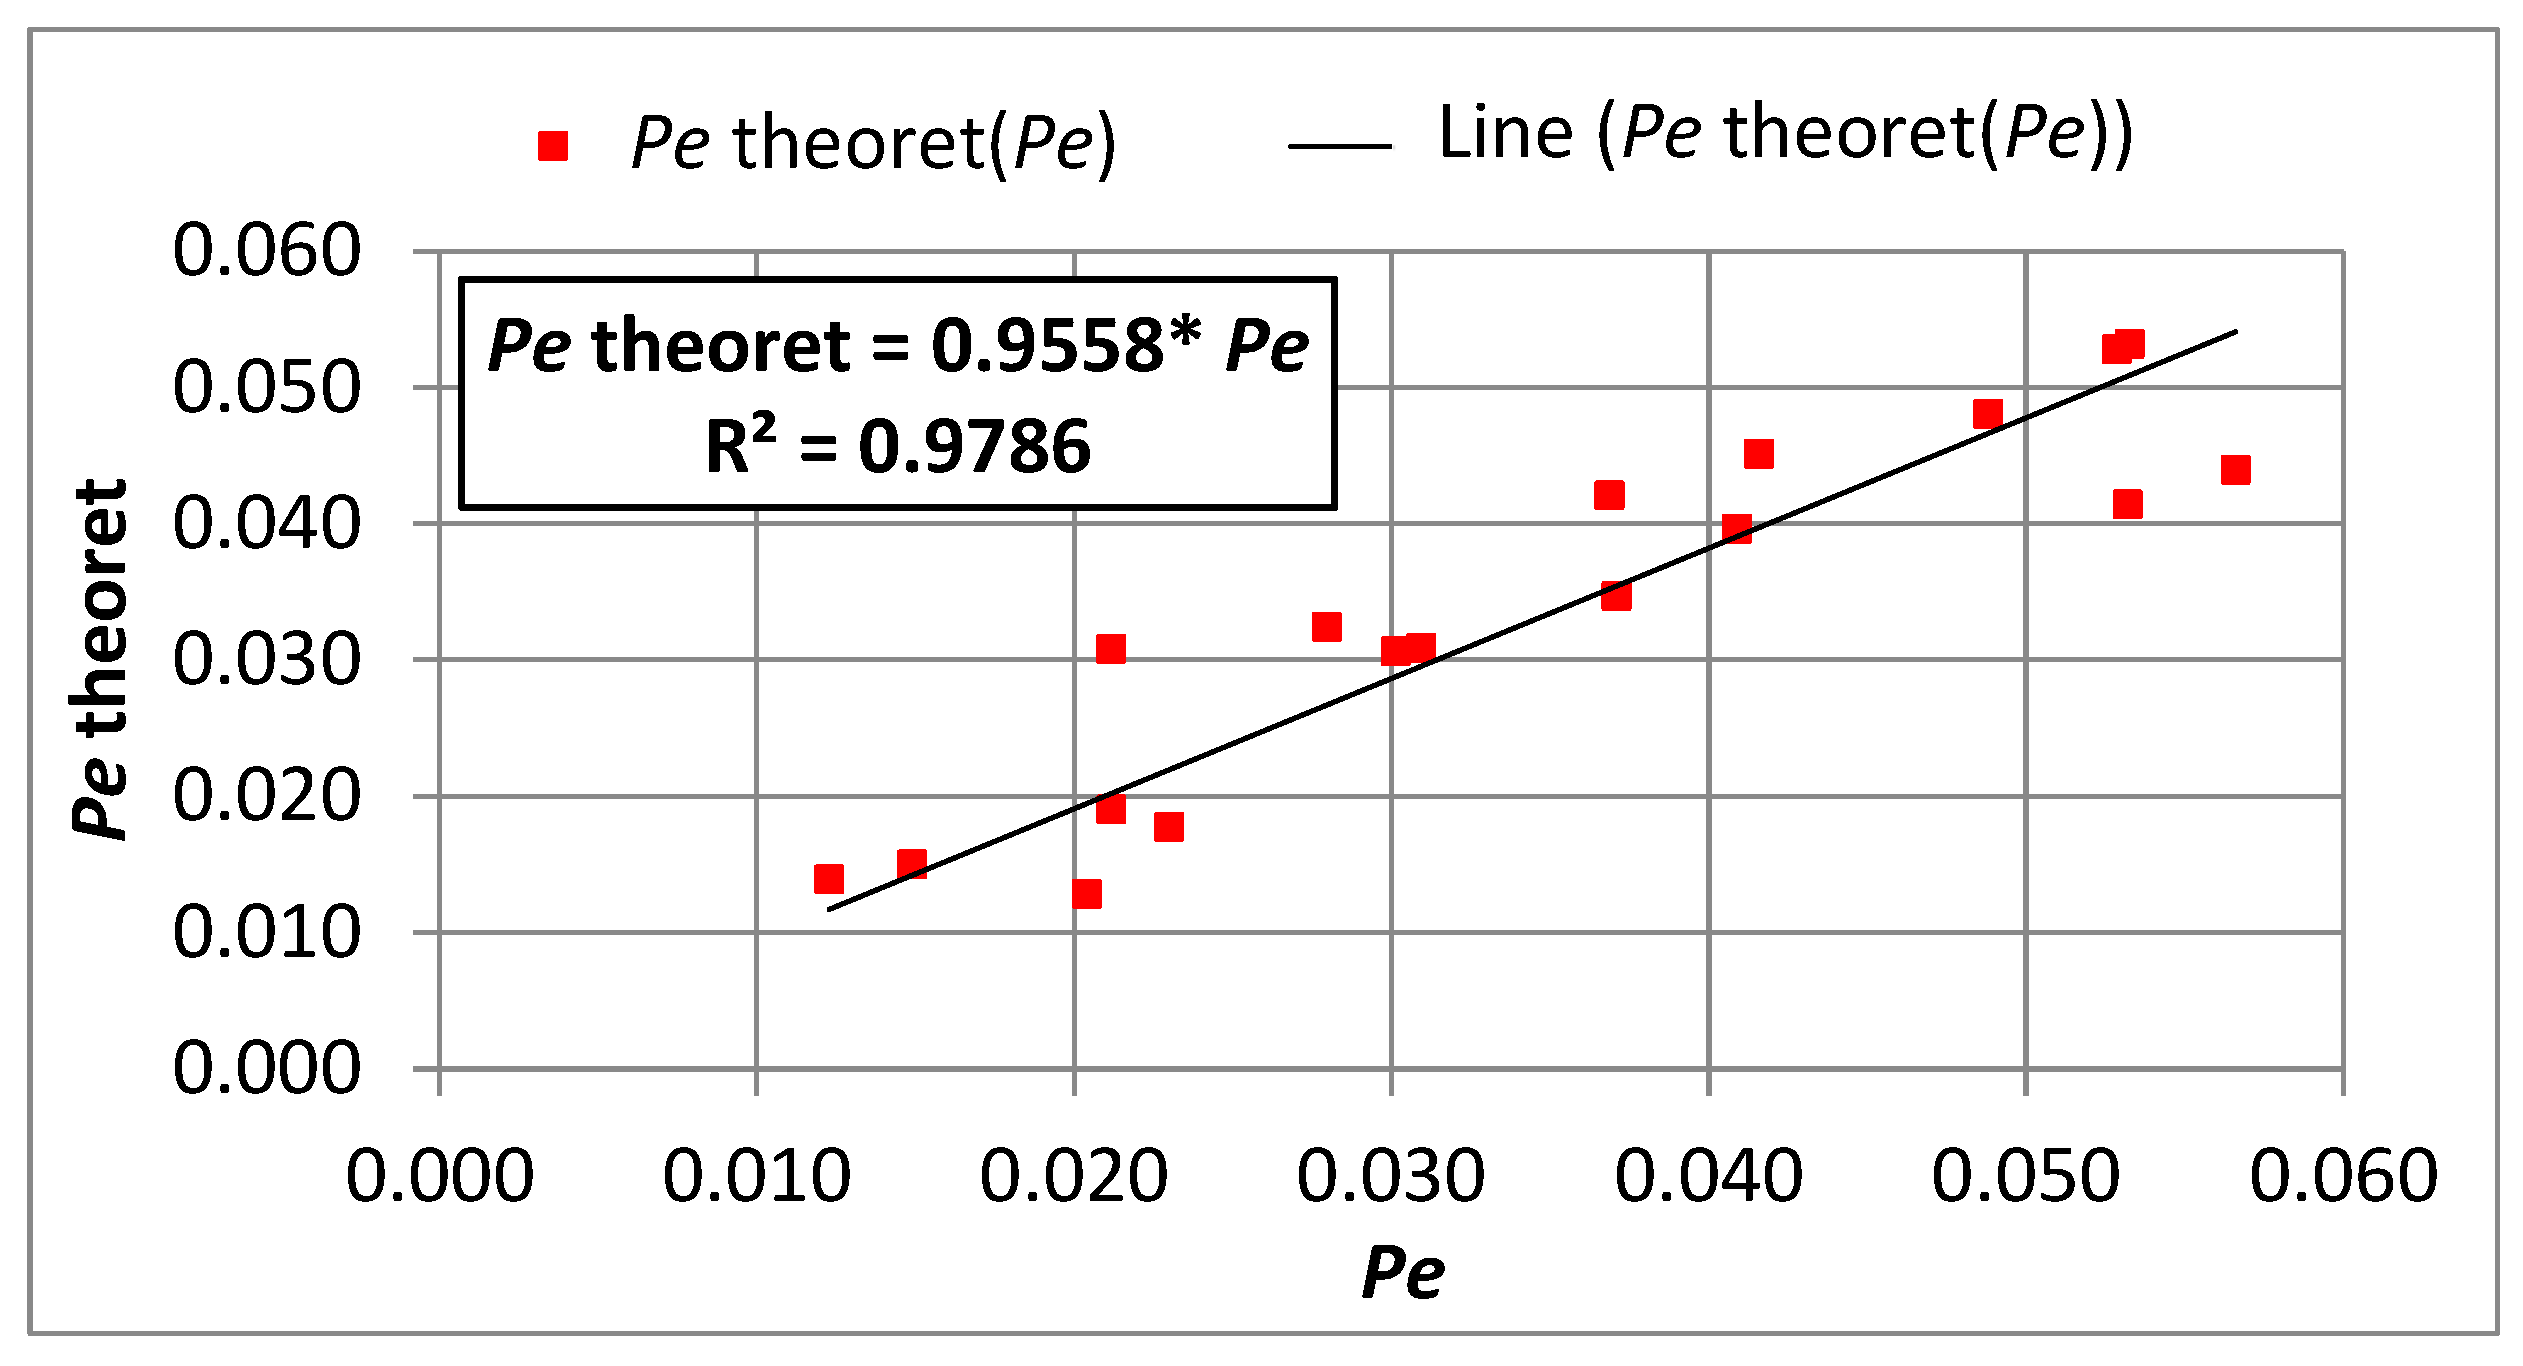
3.1. Longitudinal Dispersion
- -
- The pre-exponential factor, as a constant value for a given experiment ;
- -
- The actual filtration velocity (capillary velocity) ;
- -
- The actual coefficient of longitudinal turbulent diffusion (coefficient of longitudinal capillary turbulent diffusion) .
- Rh—hydraulic radius (m);
- N—numbers of particles in a filter bed;
- D—internal diameter of the filter column (m);
- h—height of the filter bed (m);
- Vz—volume of the filter bed (m3);
- Az—wetted surface area of bed particles (m2);
- dz,50—average diameter of the particle (m), dz,50 = 0.00086 m;
- ρp,sorb—apparent sorbent density (g PAC/m3 of bed);
- ρ0,p,sorb—standard apparent sorbent density (g PAC/m3 of bed), assumed ρ0,p,sorb = 1000 g PAC/m3 of the bed;
- νw—kinematic water viscosity (m2/s), assumed as νw = 10−6 m2/s.
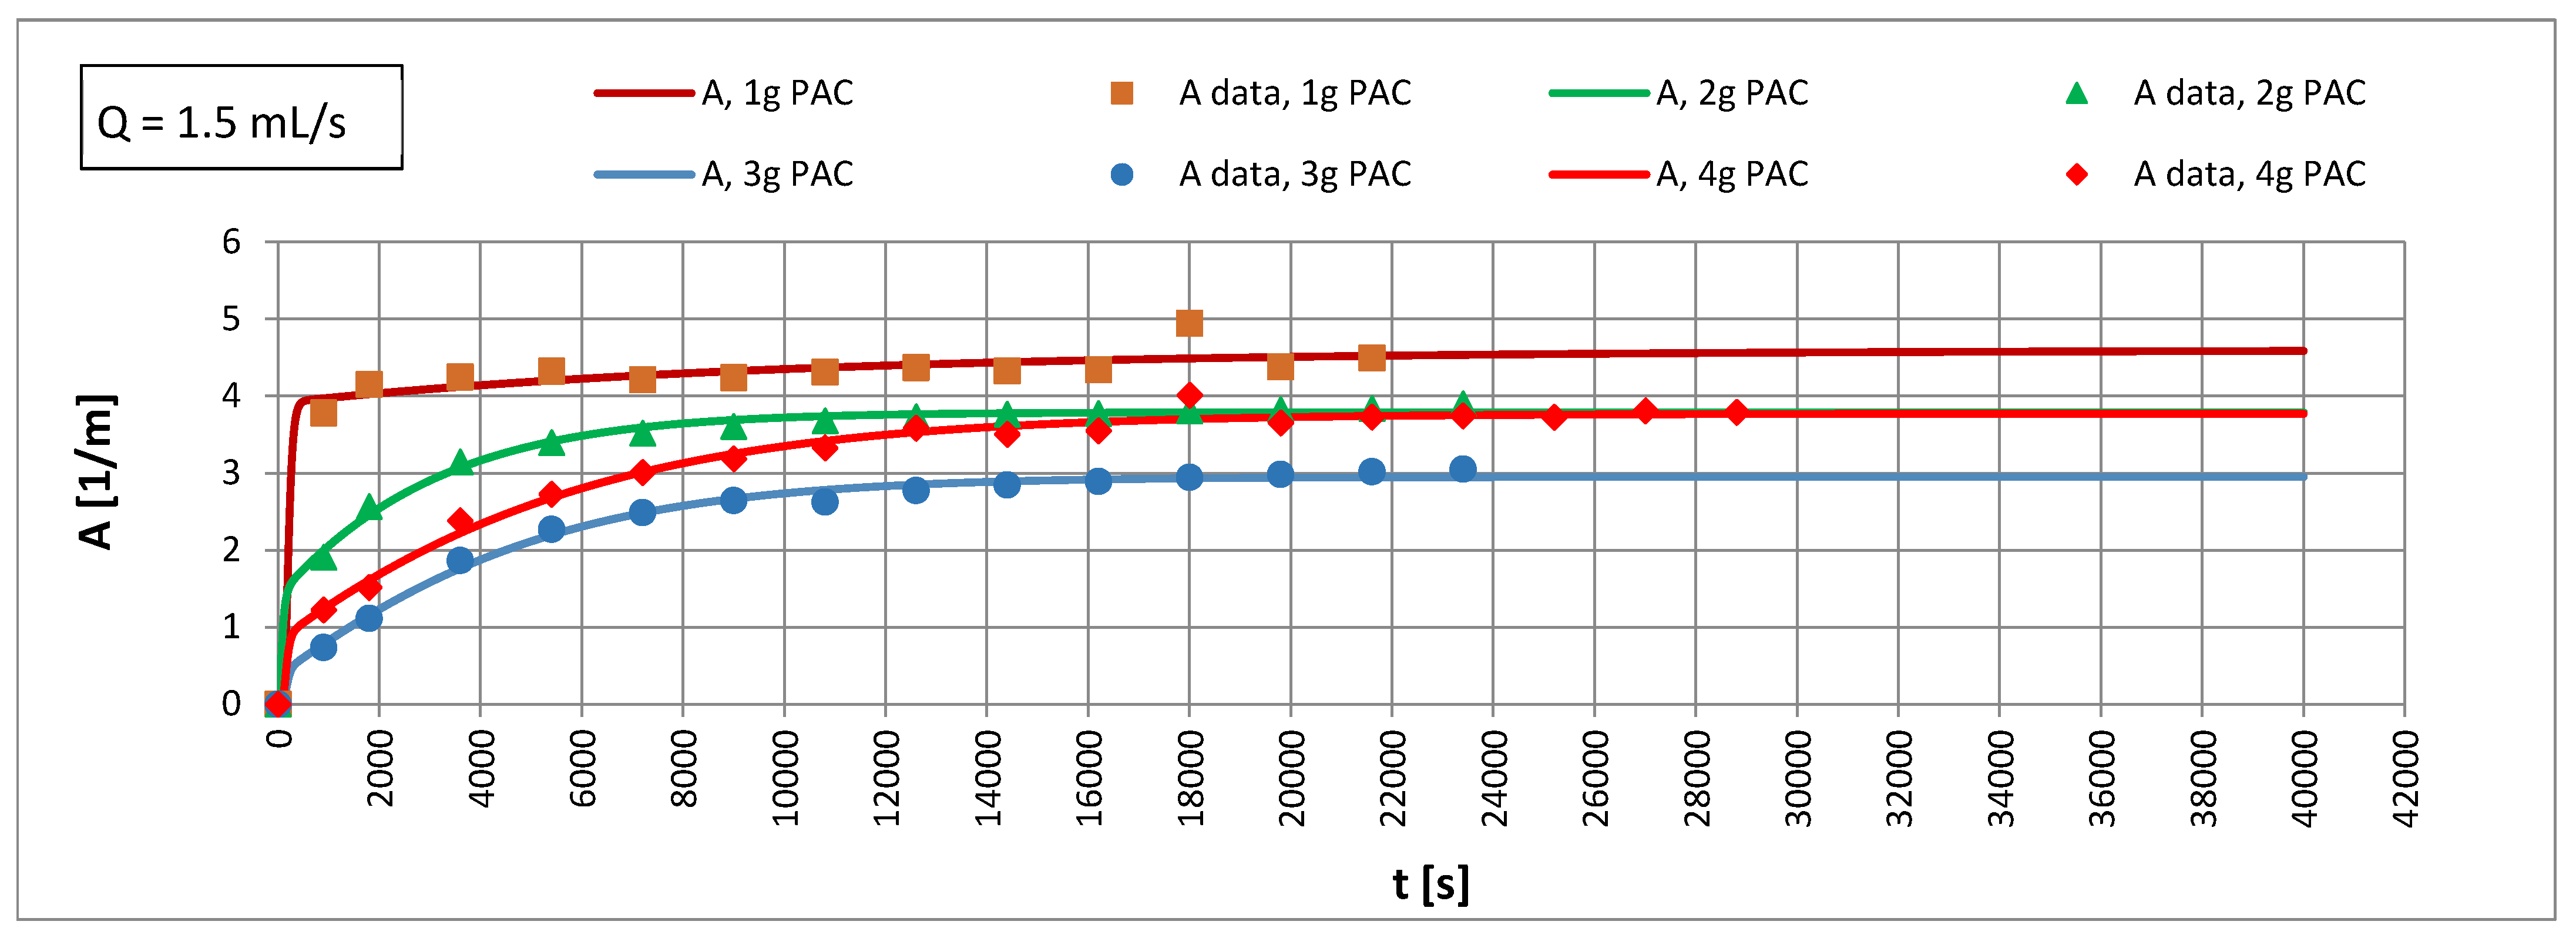
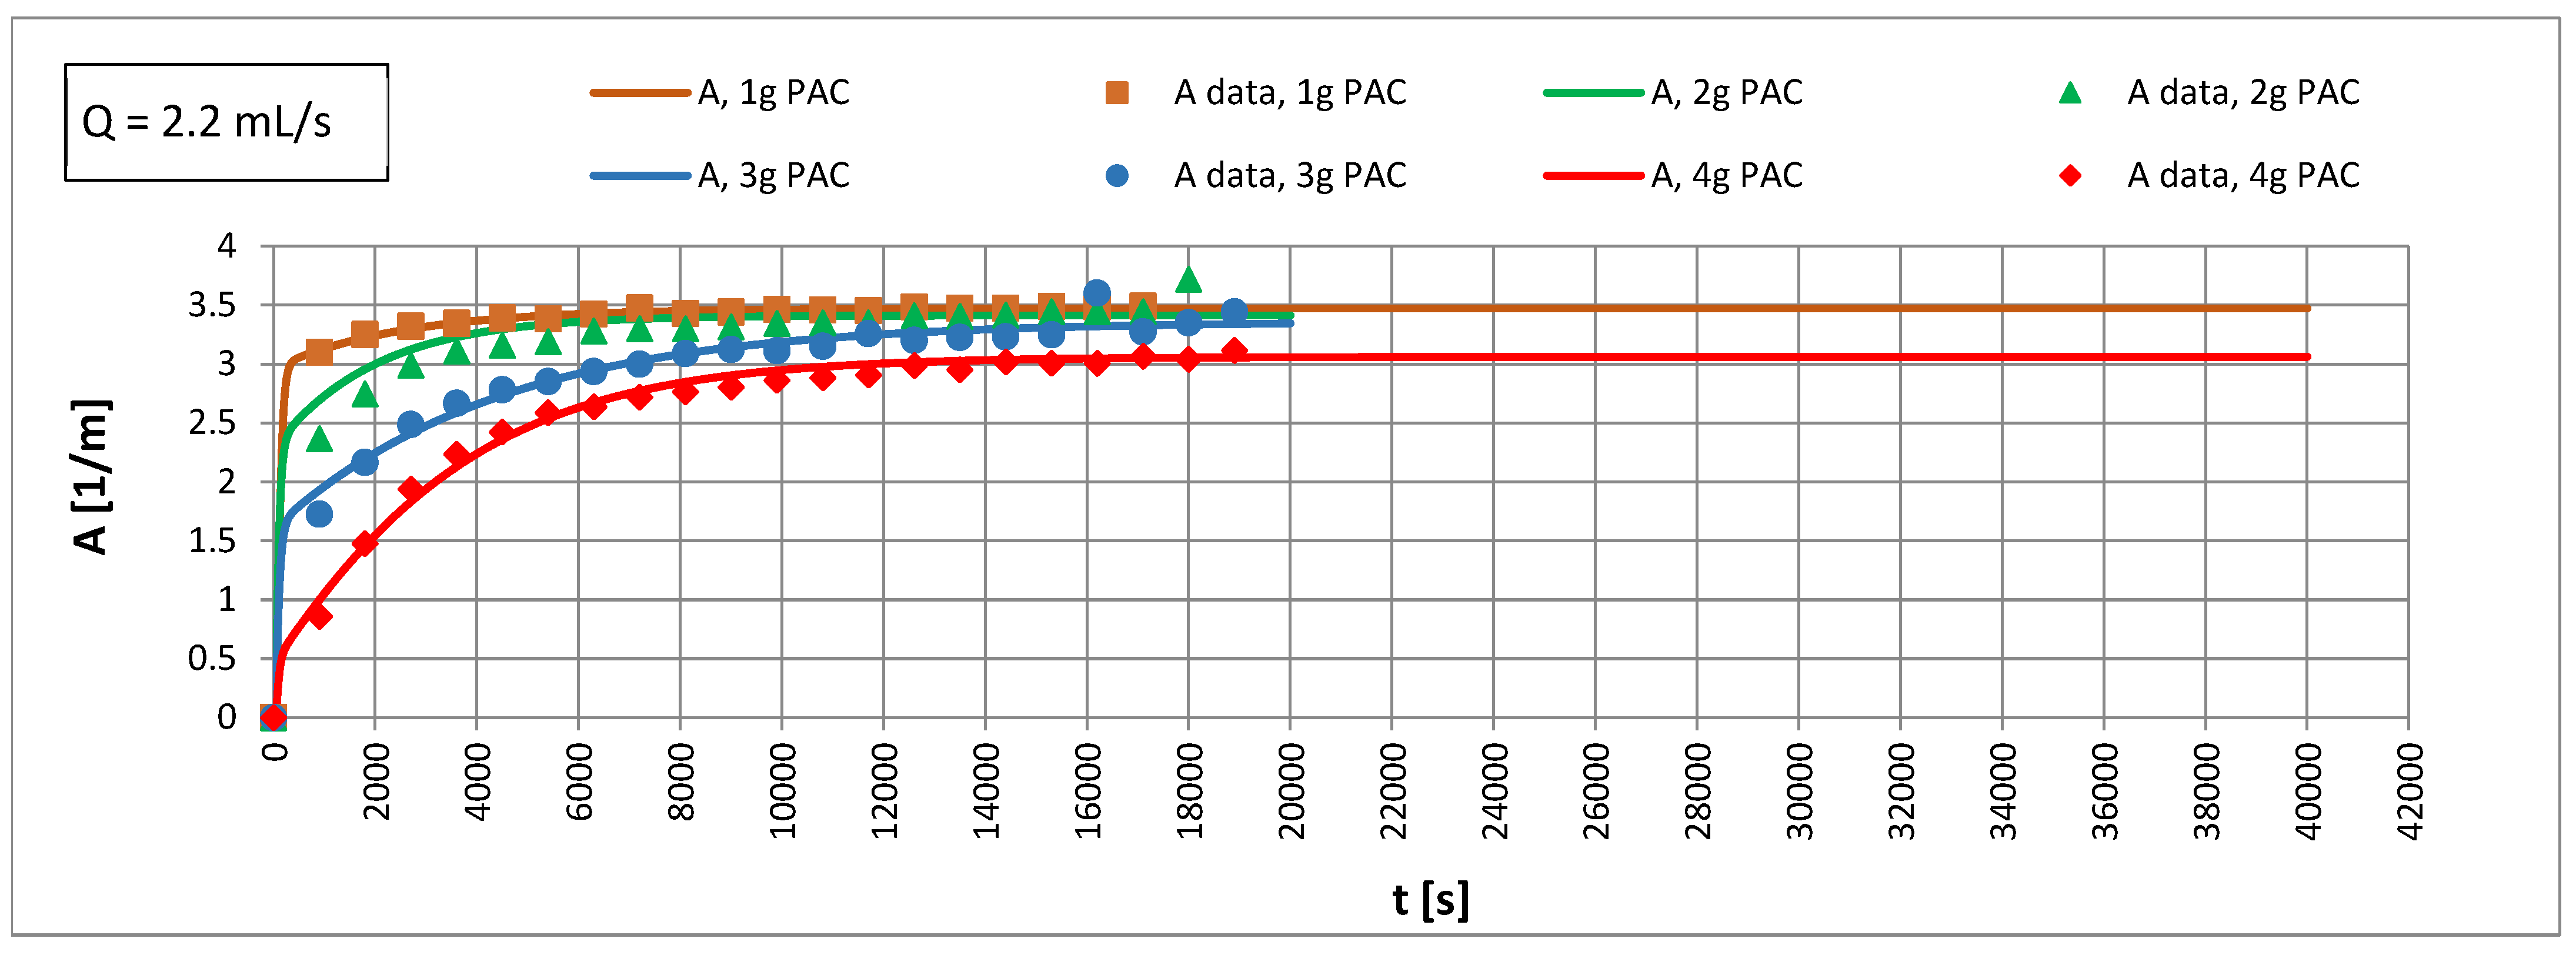
3.2. Adsorption in an Anthracite-Sand Filter with PAC
- k—mass transfer rate constant across a water–sorbent interface (m/s);
- am—specific outer surface of sorbent particles (m2/g PAC);
- Rh—hydraulic radius (m);
- N—number of particles in a bed;
- D—outer diameter of the filter column (m);
- Dm—molecular diffusion coefficient (m2/s), assumed Dm = 10−9 m2/s;
- h—height of the bed (m);
- Vz—volume of the bed (m3);
- Vp—volume of the tube dosing the PAC suspension (m3);
- Az—wetted surface area of the bed particles (m2);
- d50—average diameter of the bed particle (m), d50 = 0.00095 m;
- ρp,sorb—apparent sorbent density (g PAC/m3 of bed);
- ρ0,p,sorb—standard apparent sorbent density (g PAC/m3 of bed), assumed as ρ0,p,sorb = 1000 g PAC/m3 of the bed
- νw—kinematic water viscosity (m2/s), assumed νw = 10−6 m2/s;
- ε—porosity (m3 of pores/m3 of bed).
3.3. Adsorption Isotherm
- —standard Henry’s coefficient (1/m3 of sorbent), assumed = 1 (1/m3 of sorbent);
- d50—average diameter of bed particle (m), d50 = 0.00095 m;
- Re—Equation (15);
- Rh—Equation (17);
- Others as above.
4. Discussion
4.1. Longitudinal Turbulent Diffusion
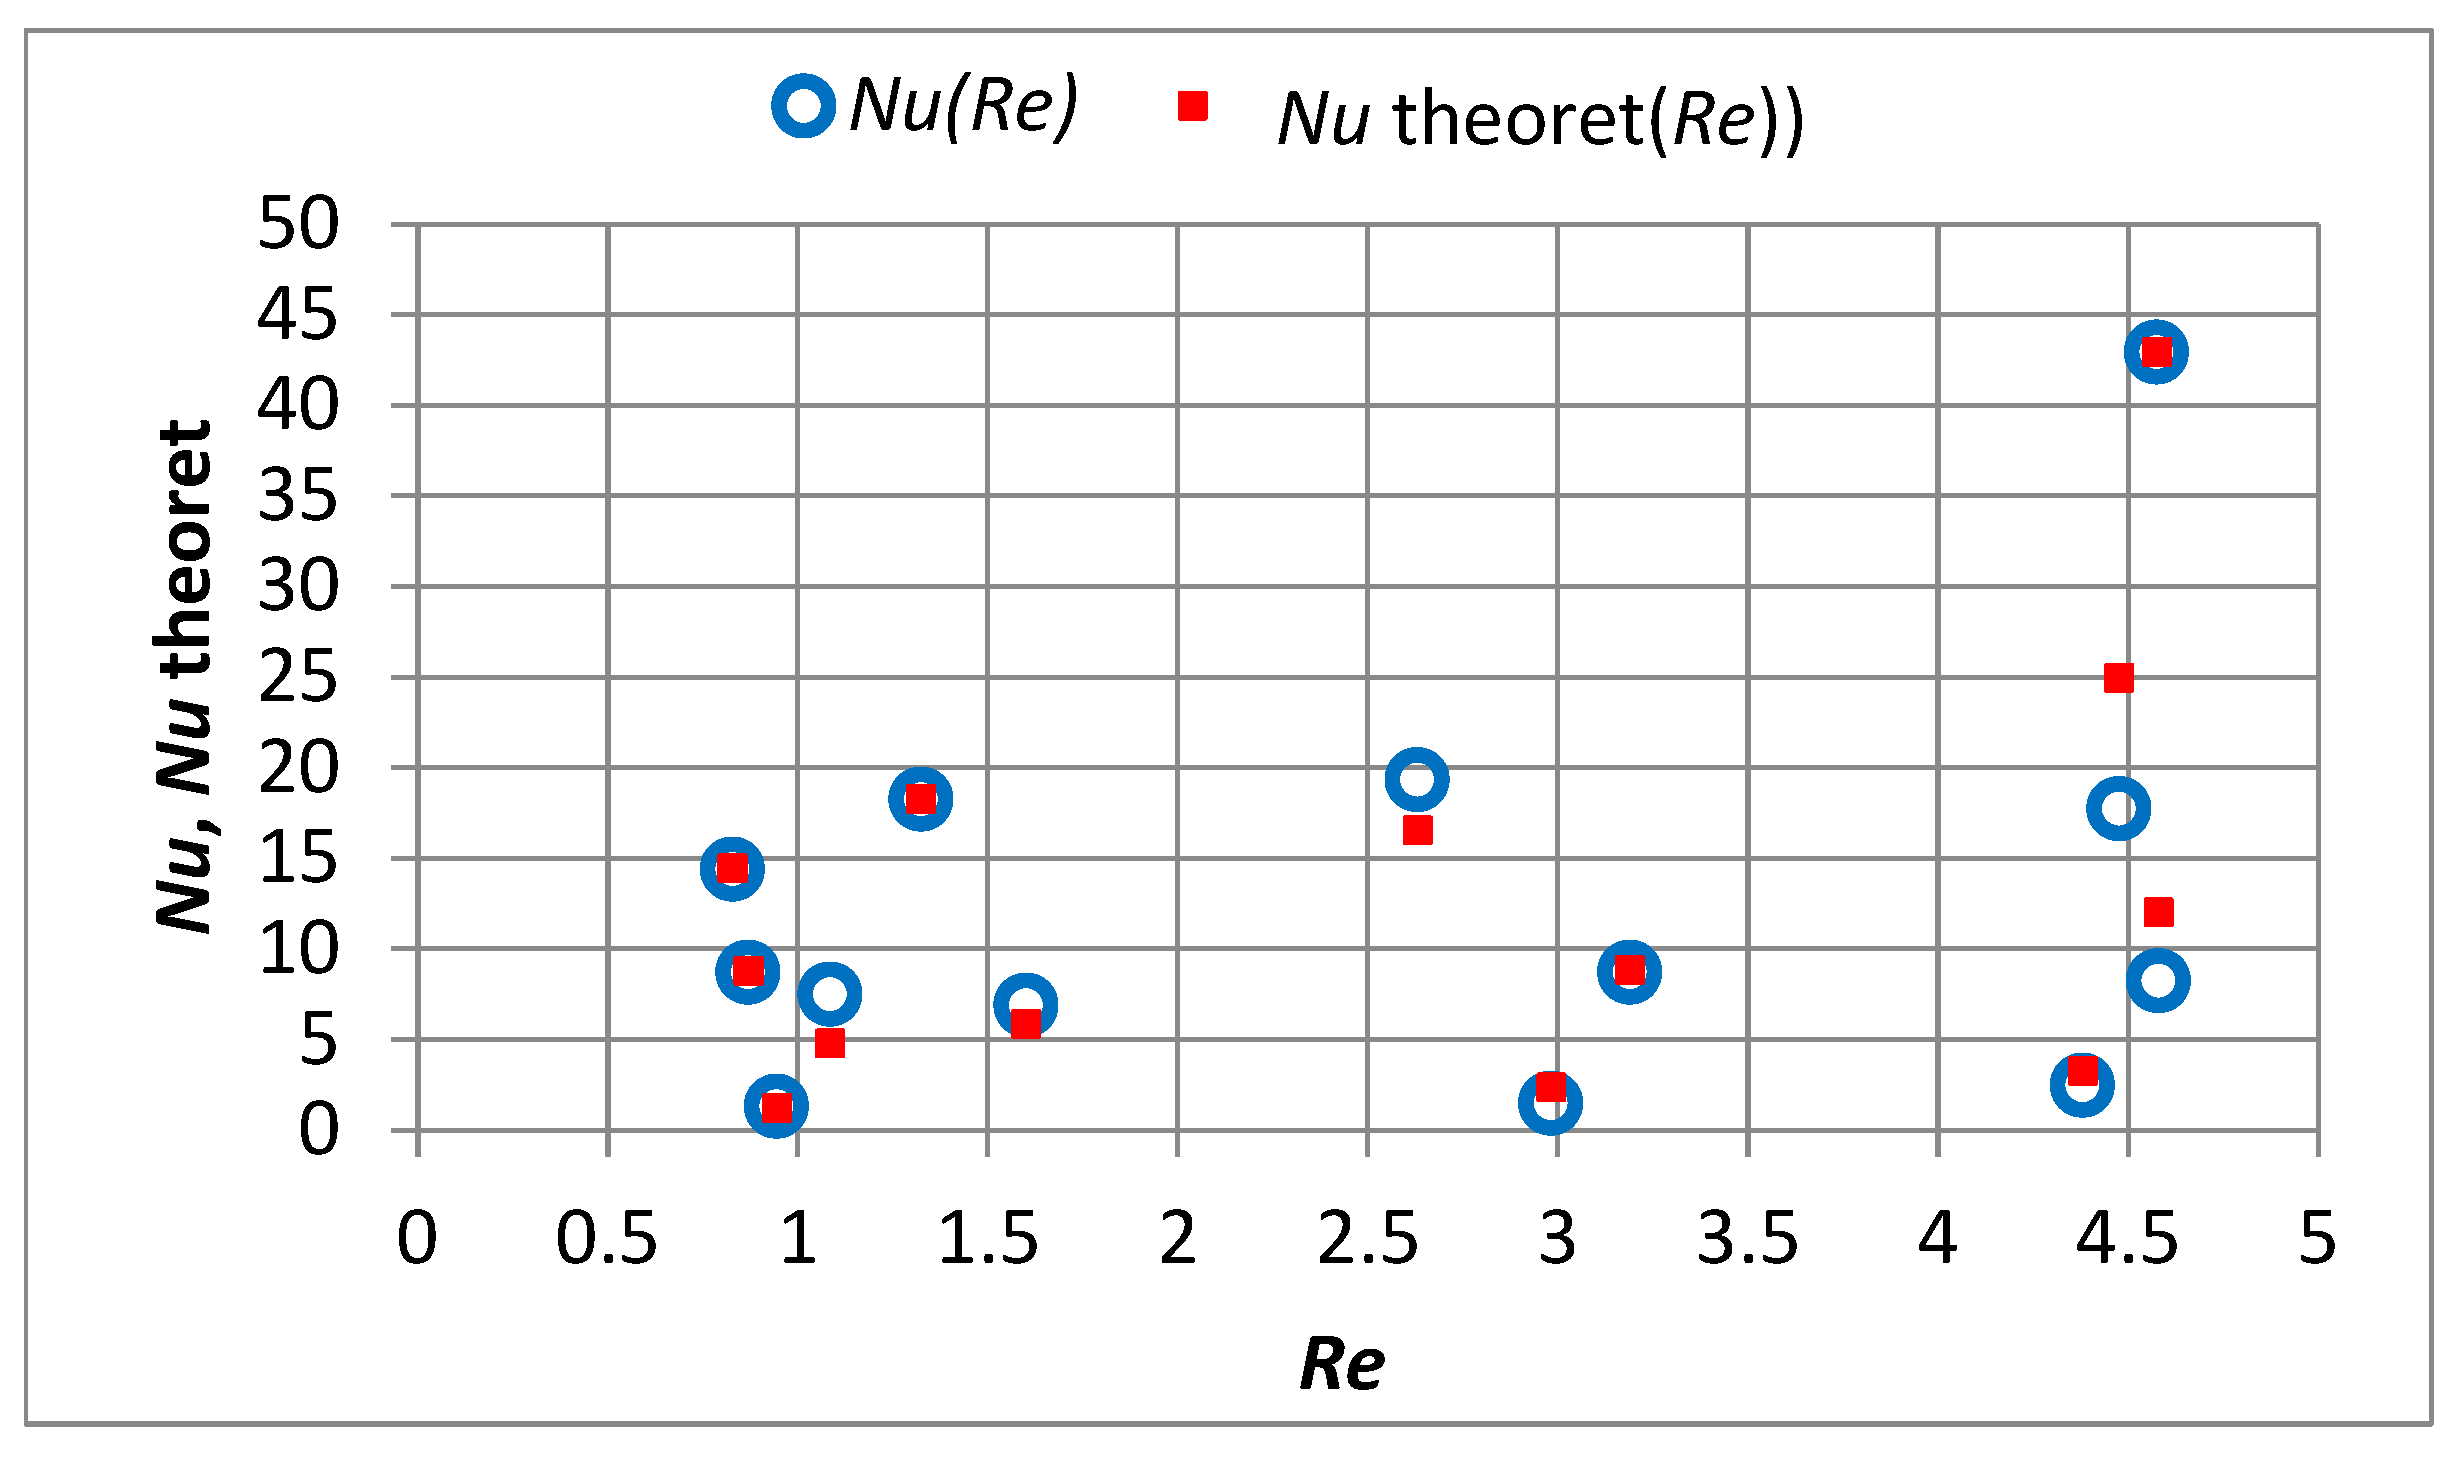
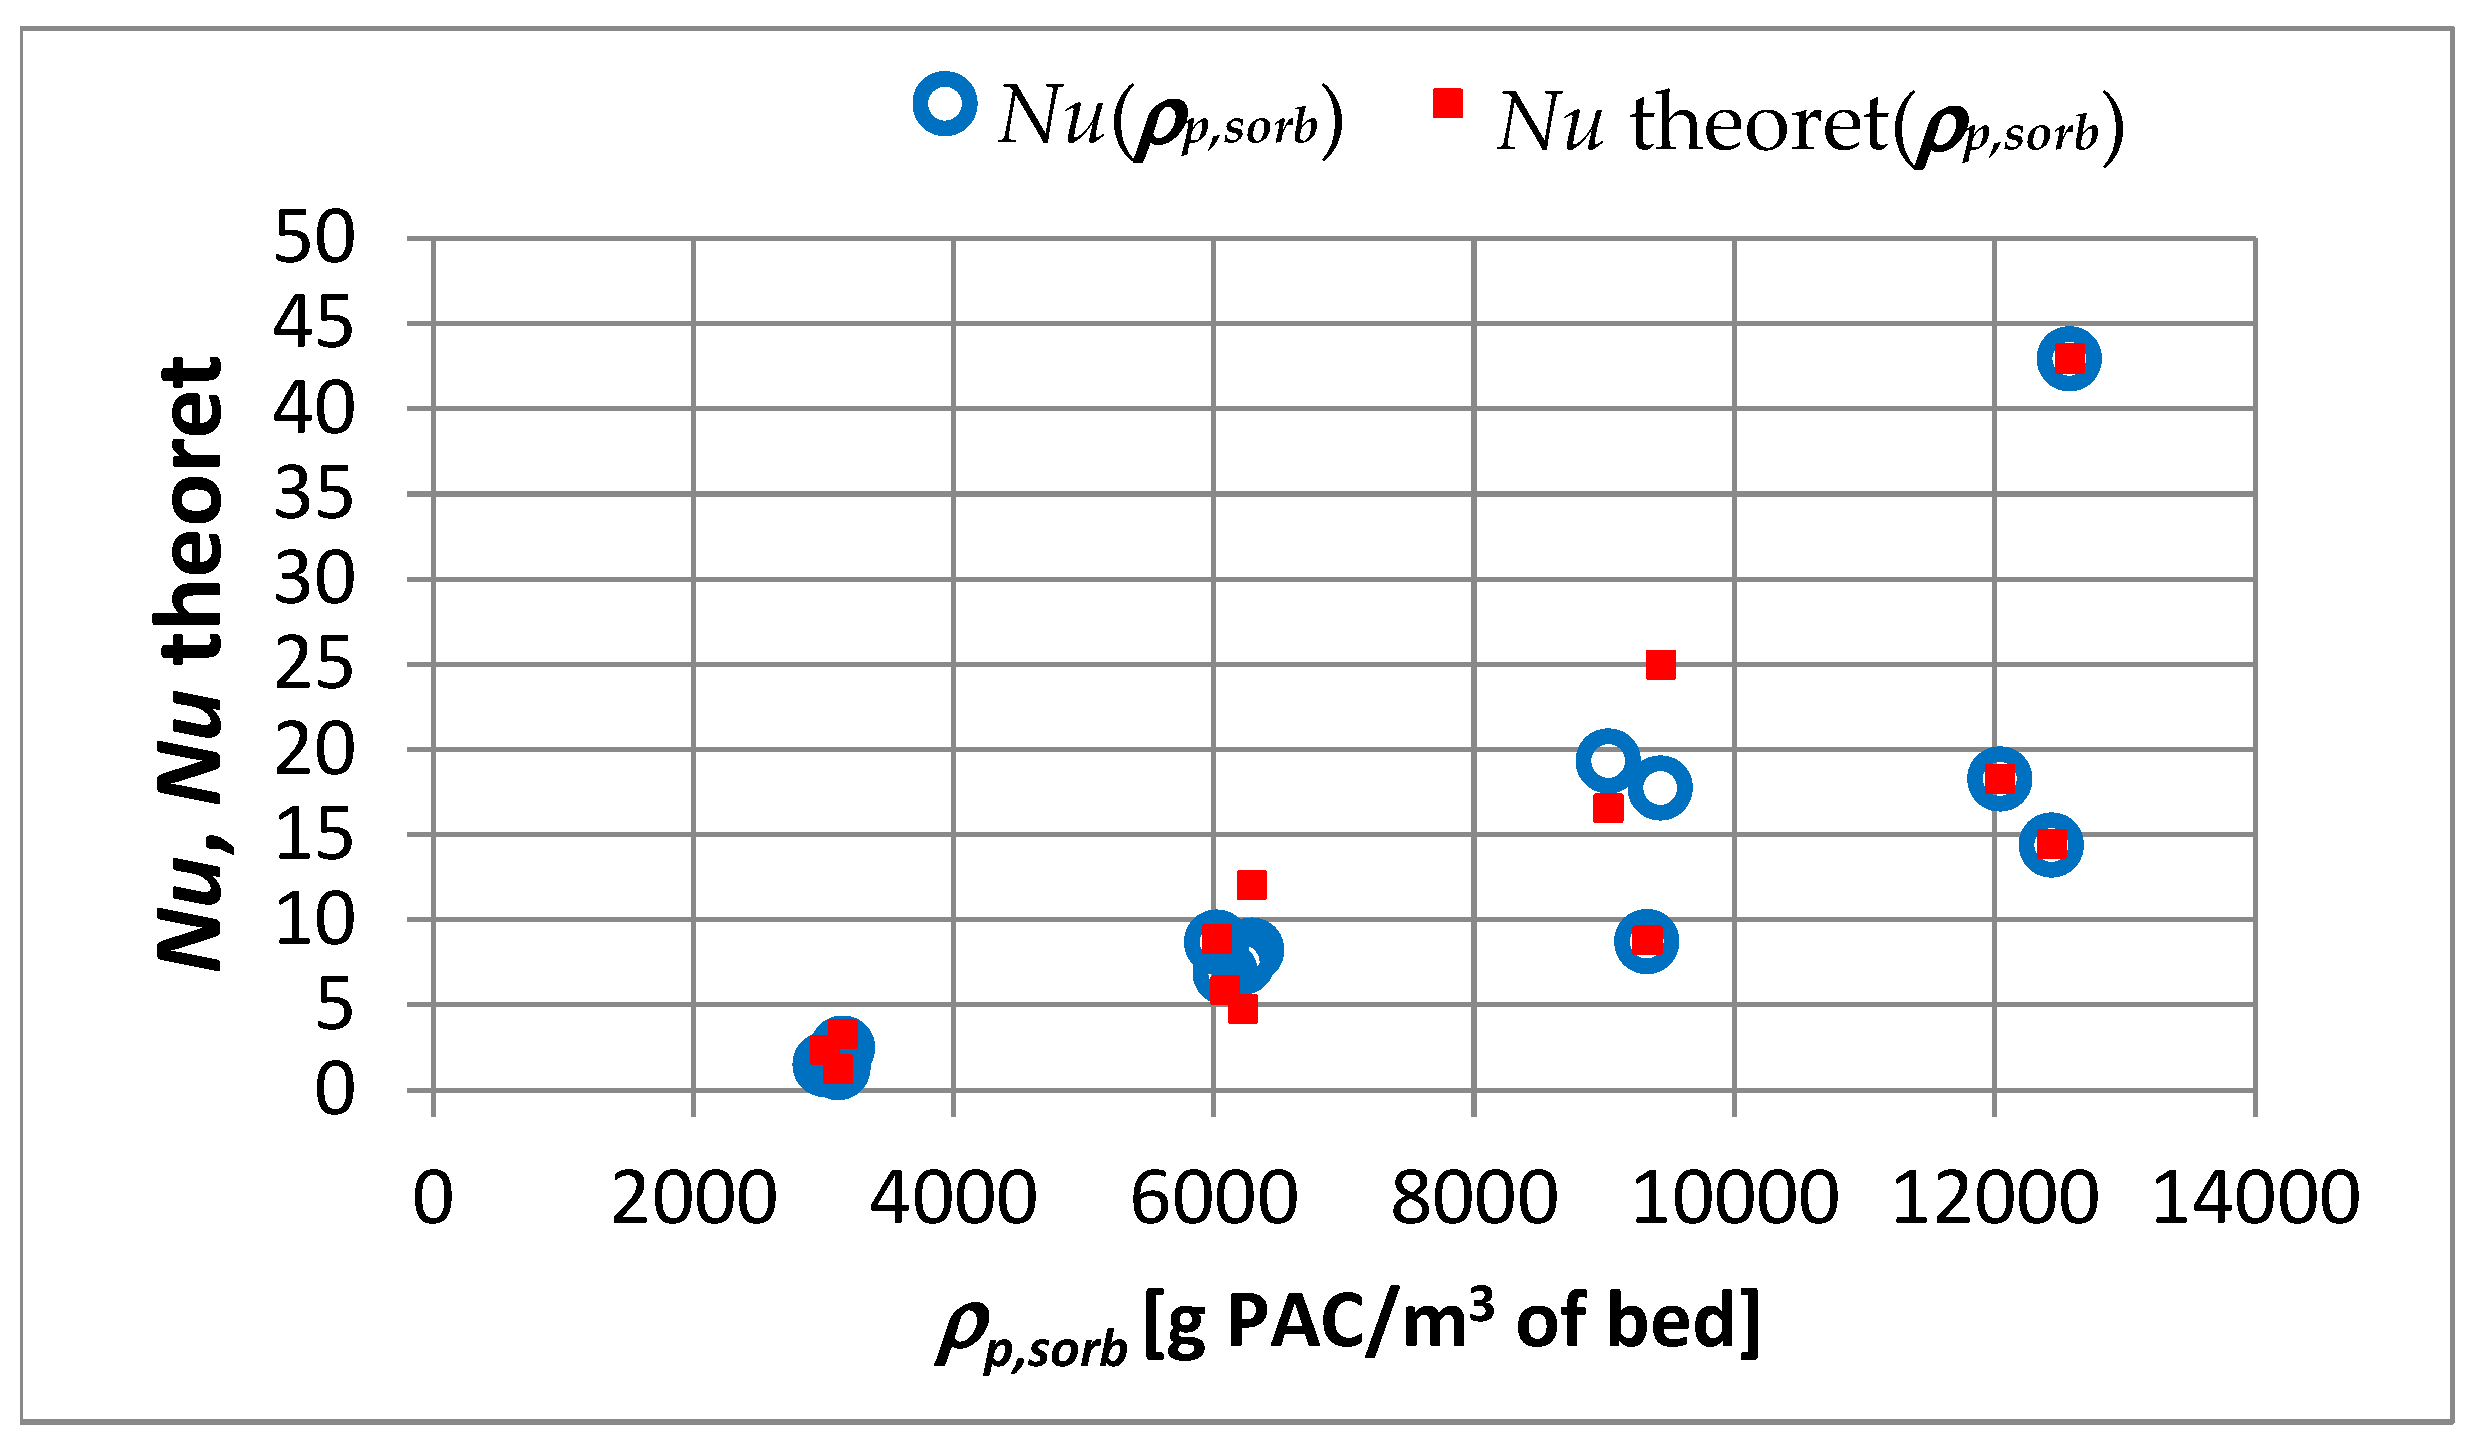
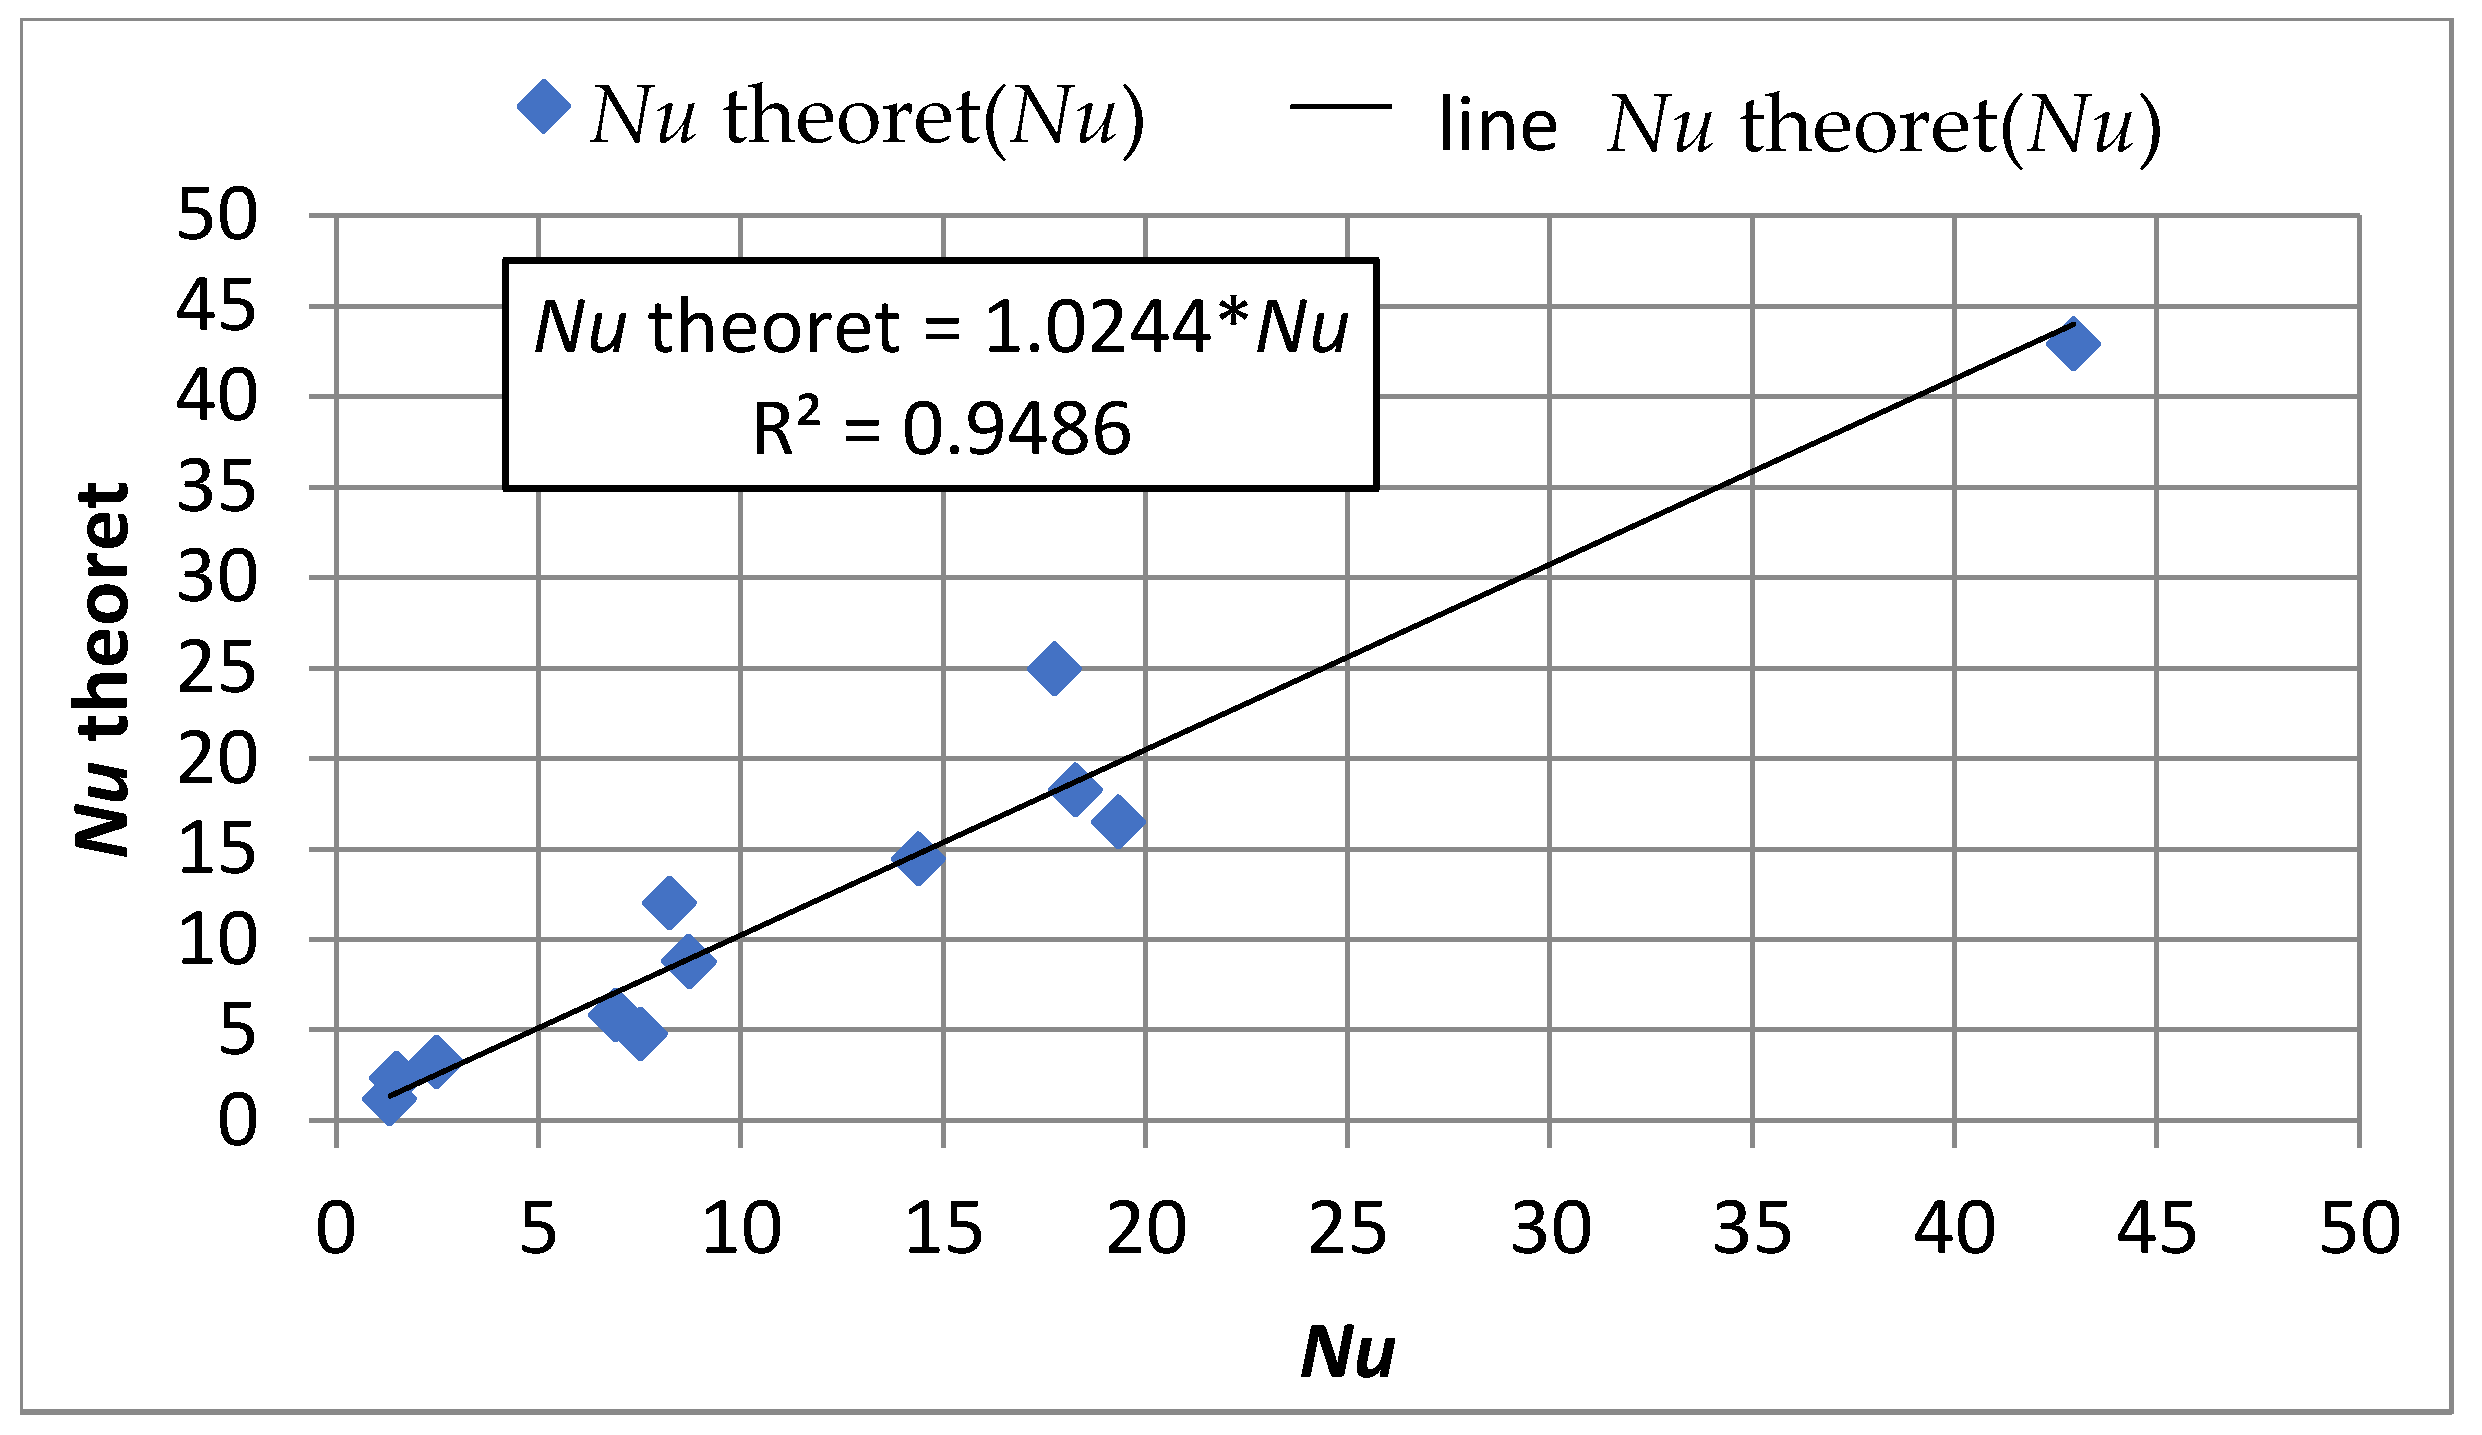
4.2. Mass Transfer across the Water–Sorbent Interface
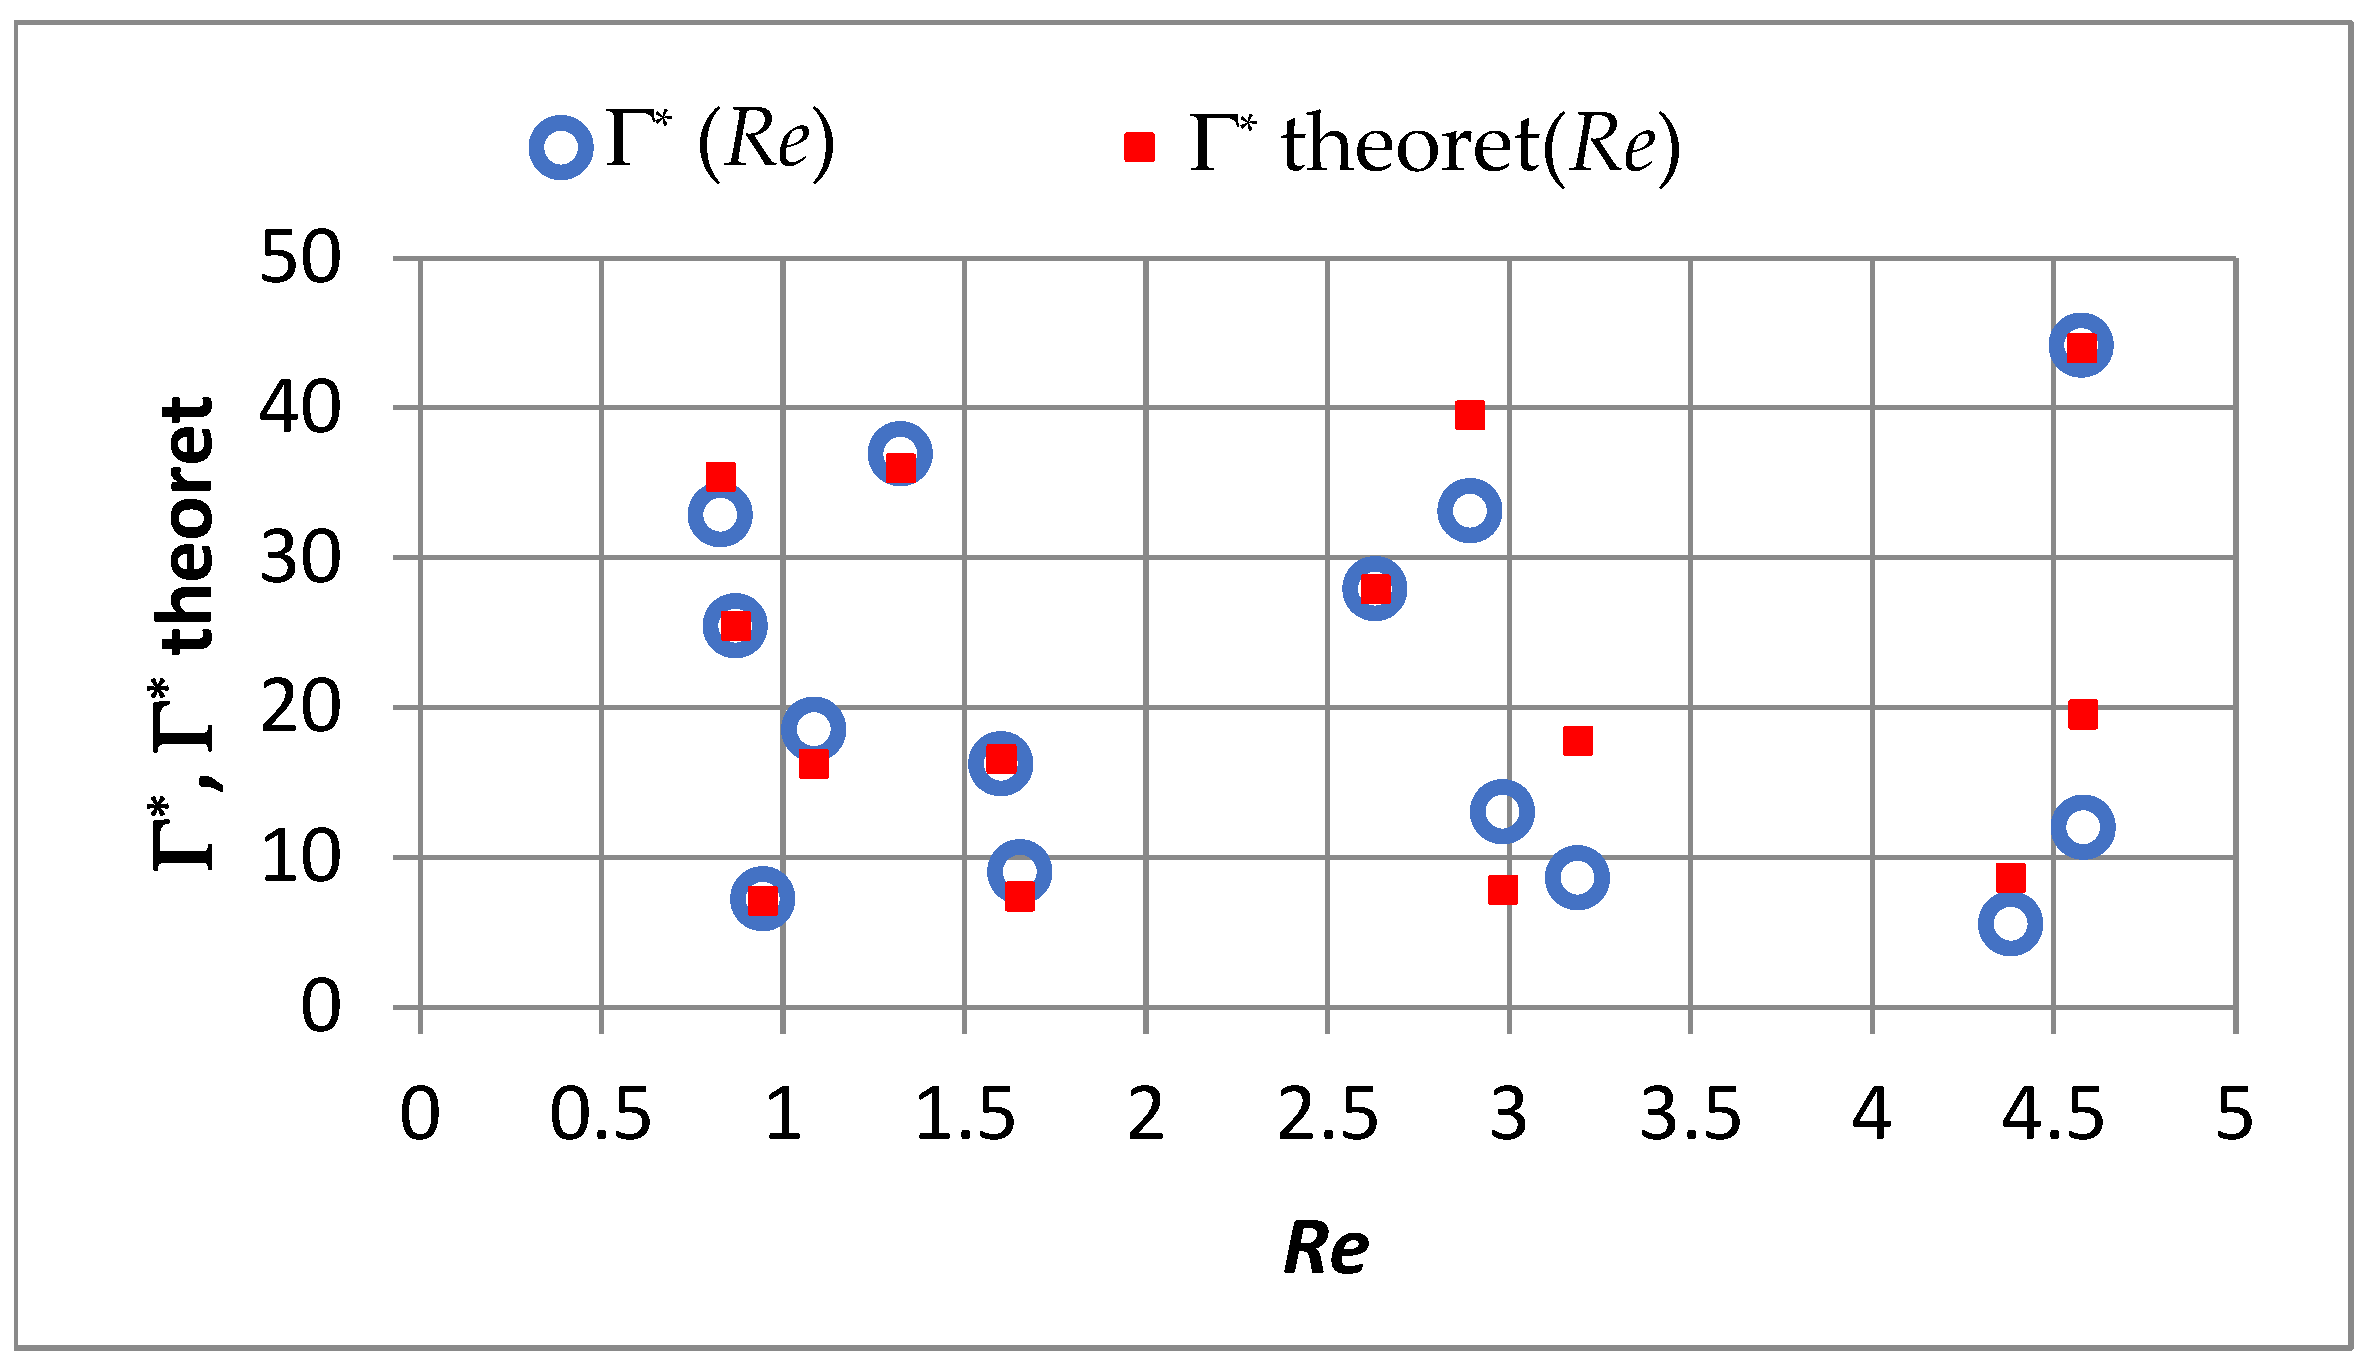
4.3. Adsorption Equilibrium
4.4. Influence of Mass Transfer Rate on Adsorption Effects
4.5. Efficiency of PAC Utilization
5. Analysis of Flow Resistance during Tests on a Semi-Technical Scale
6. Conclusions
- At a low velocity, doubling increases the capillary turbulent diffusion coefficient by 3.5 times; in the medium range, doubling increases by 3.1 times; and in the high velocity range, such an increase results in an increase in by 3.0 times.
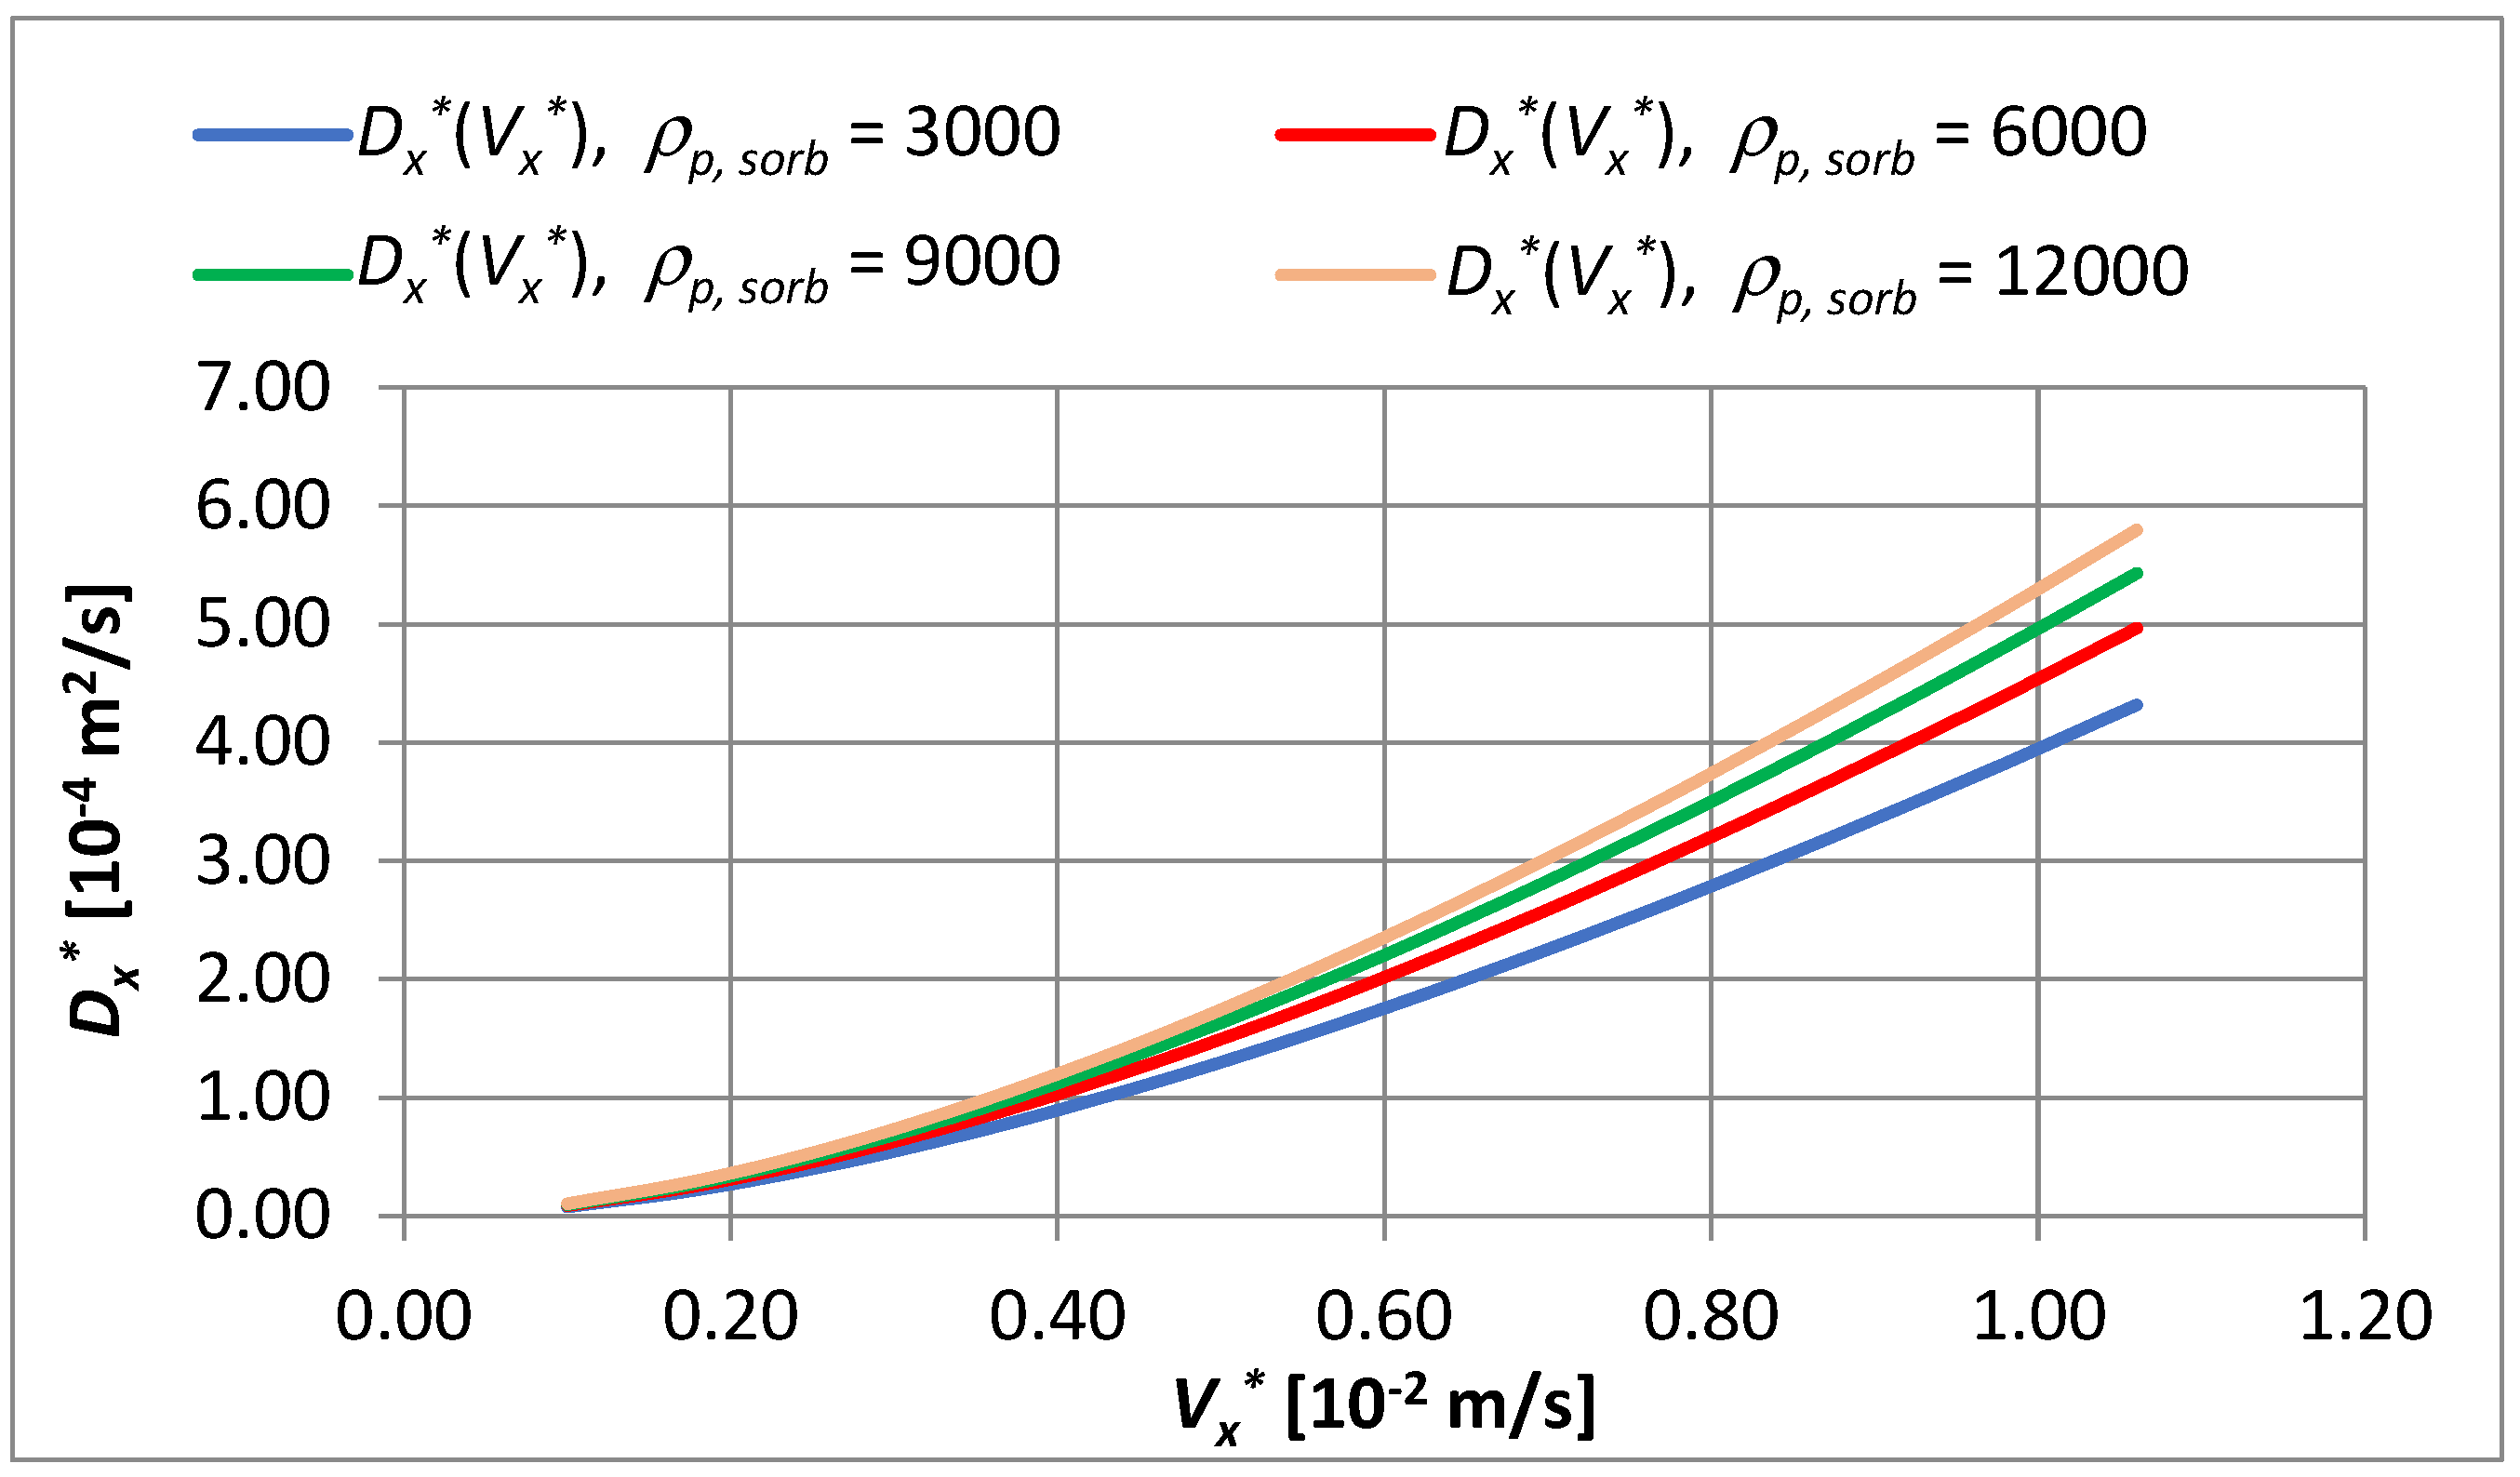
- In the velocity range ∈ 〈0.1·10−2; 1.06·10−2〉 m/s and with the density changing from 3000 to 12,000 g PAC/m3 of bed, the coefficient changes by 1.34 times.
- In the capillary velocity range ∈ 〈0.15·10−2; 0.72·10−2〉 m/s and with a change in the apparent density of the sorbent from 3000 to 12,000 g PAC/m3 of the bed, it was established that the actual coefficient of longitudinal dispersion varies in the range of 0.16·10−4 to 2.03·10−4 m2/s.
- When changing the apparent density of the sorbent from 3000 to 12,000 g PAC/m3 of the bed, the value changes by 3.2 times; this change is slightly smaller than for the sorbent apparent density.
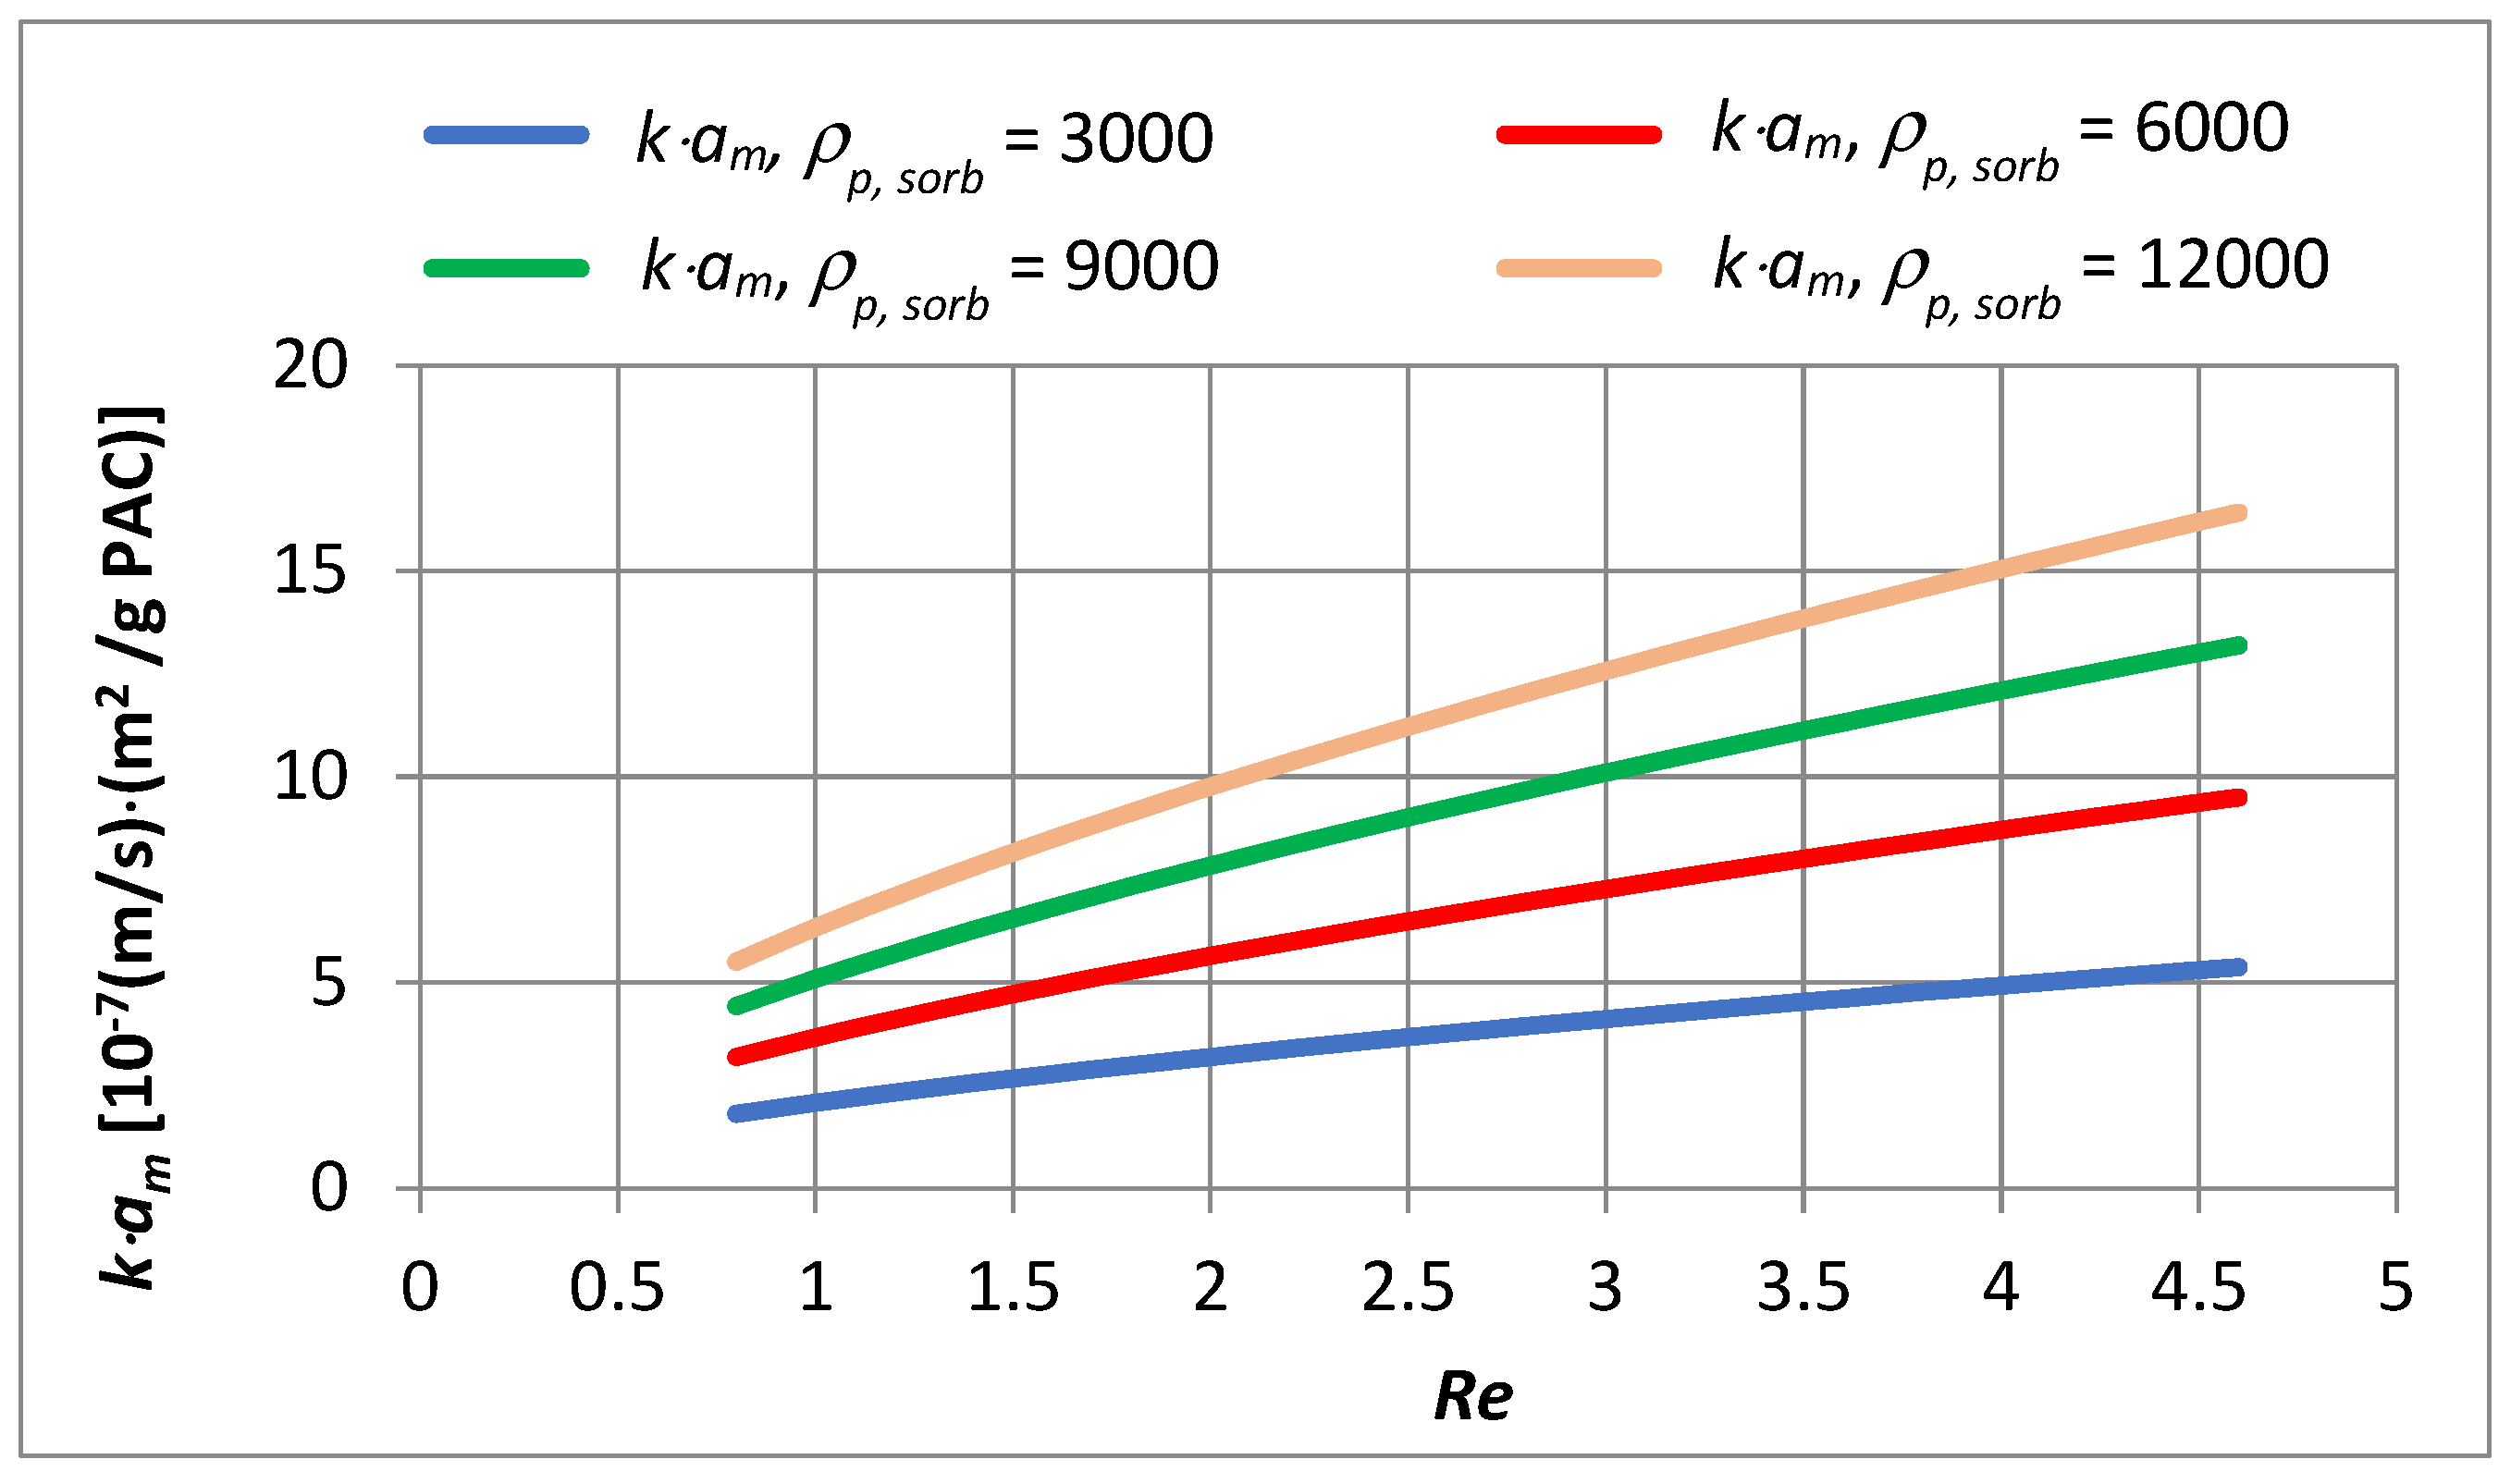
- In the capillary velocity range ∈ 〈0.15·10−2; 0.72·10−2〉 m/s and with a change in the apparent density of the sorbent from 3000 to 12,000 g PAC/m3 of the bed, the product of the constant mass transfer rate and the specific outer surface of sorbent varies in the range of 2.23·10−7 to 1.70·10−6 (m/s)·(m2/g PAC).
- Doubling the filtration velocity increases the value by approximately 1.5 times, while quadrupling it increases the value approximately by 2.4 times.
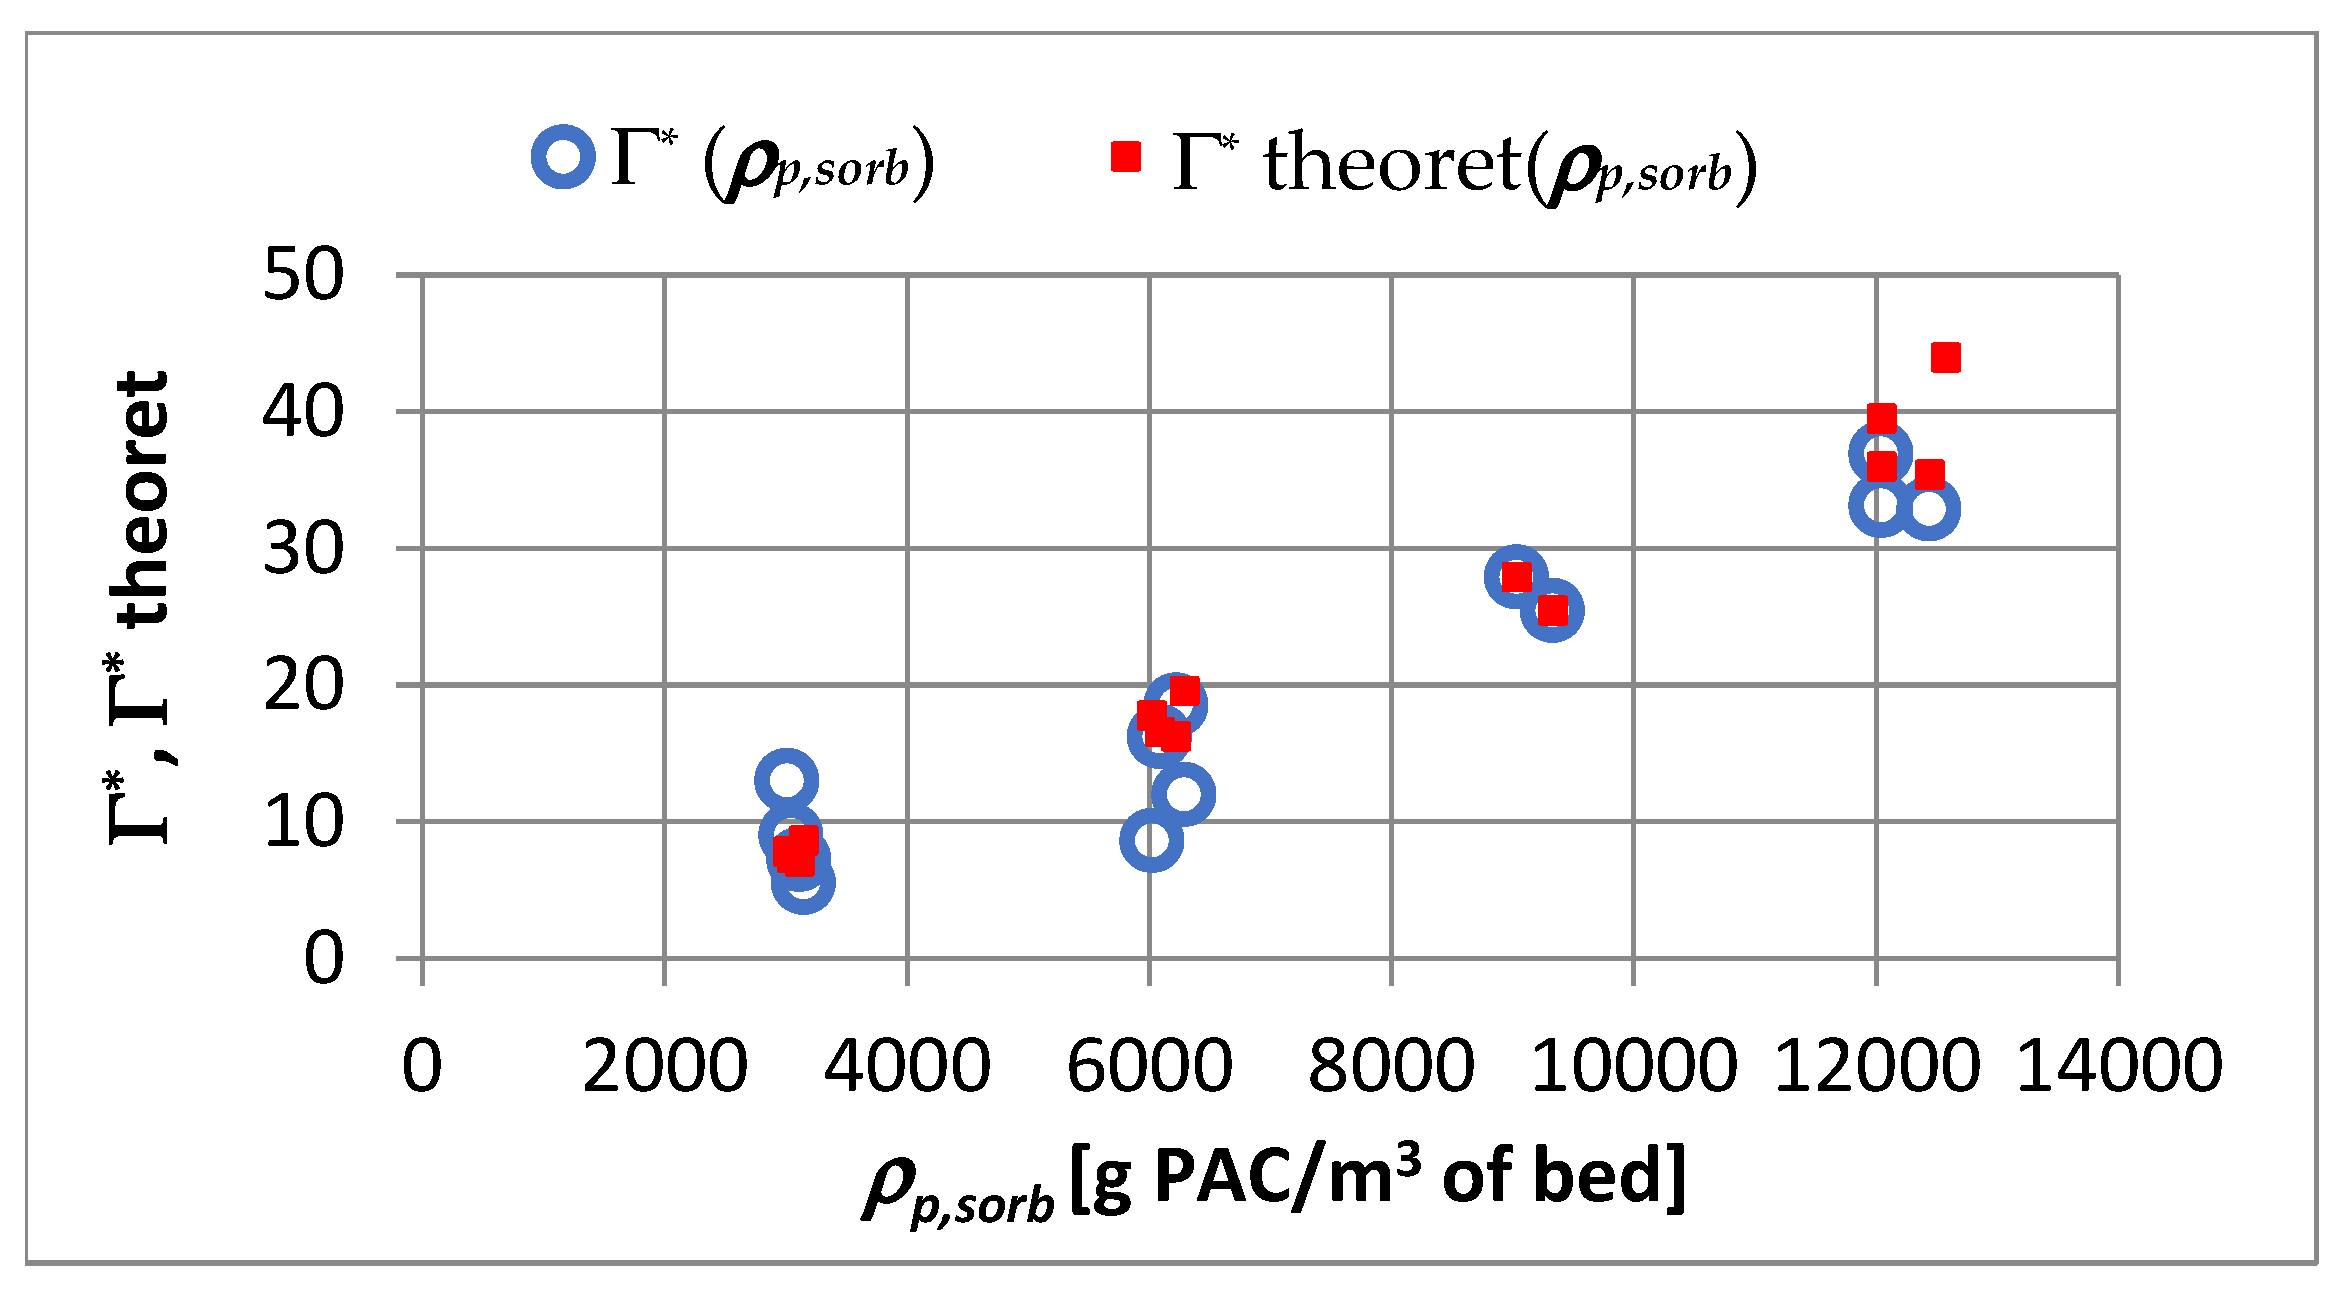
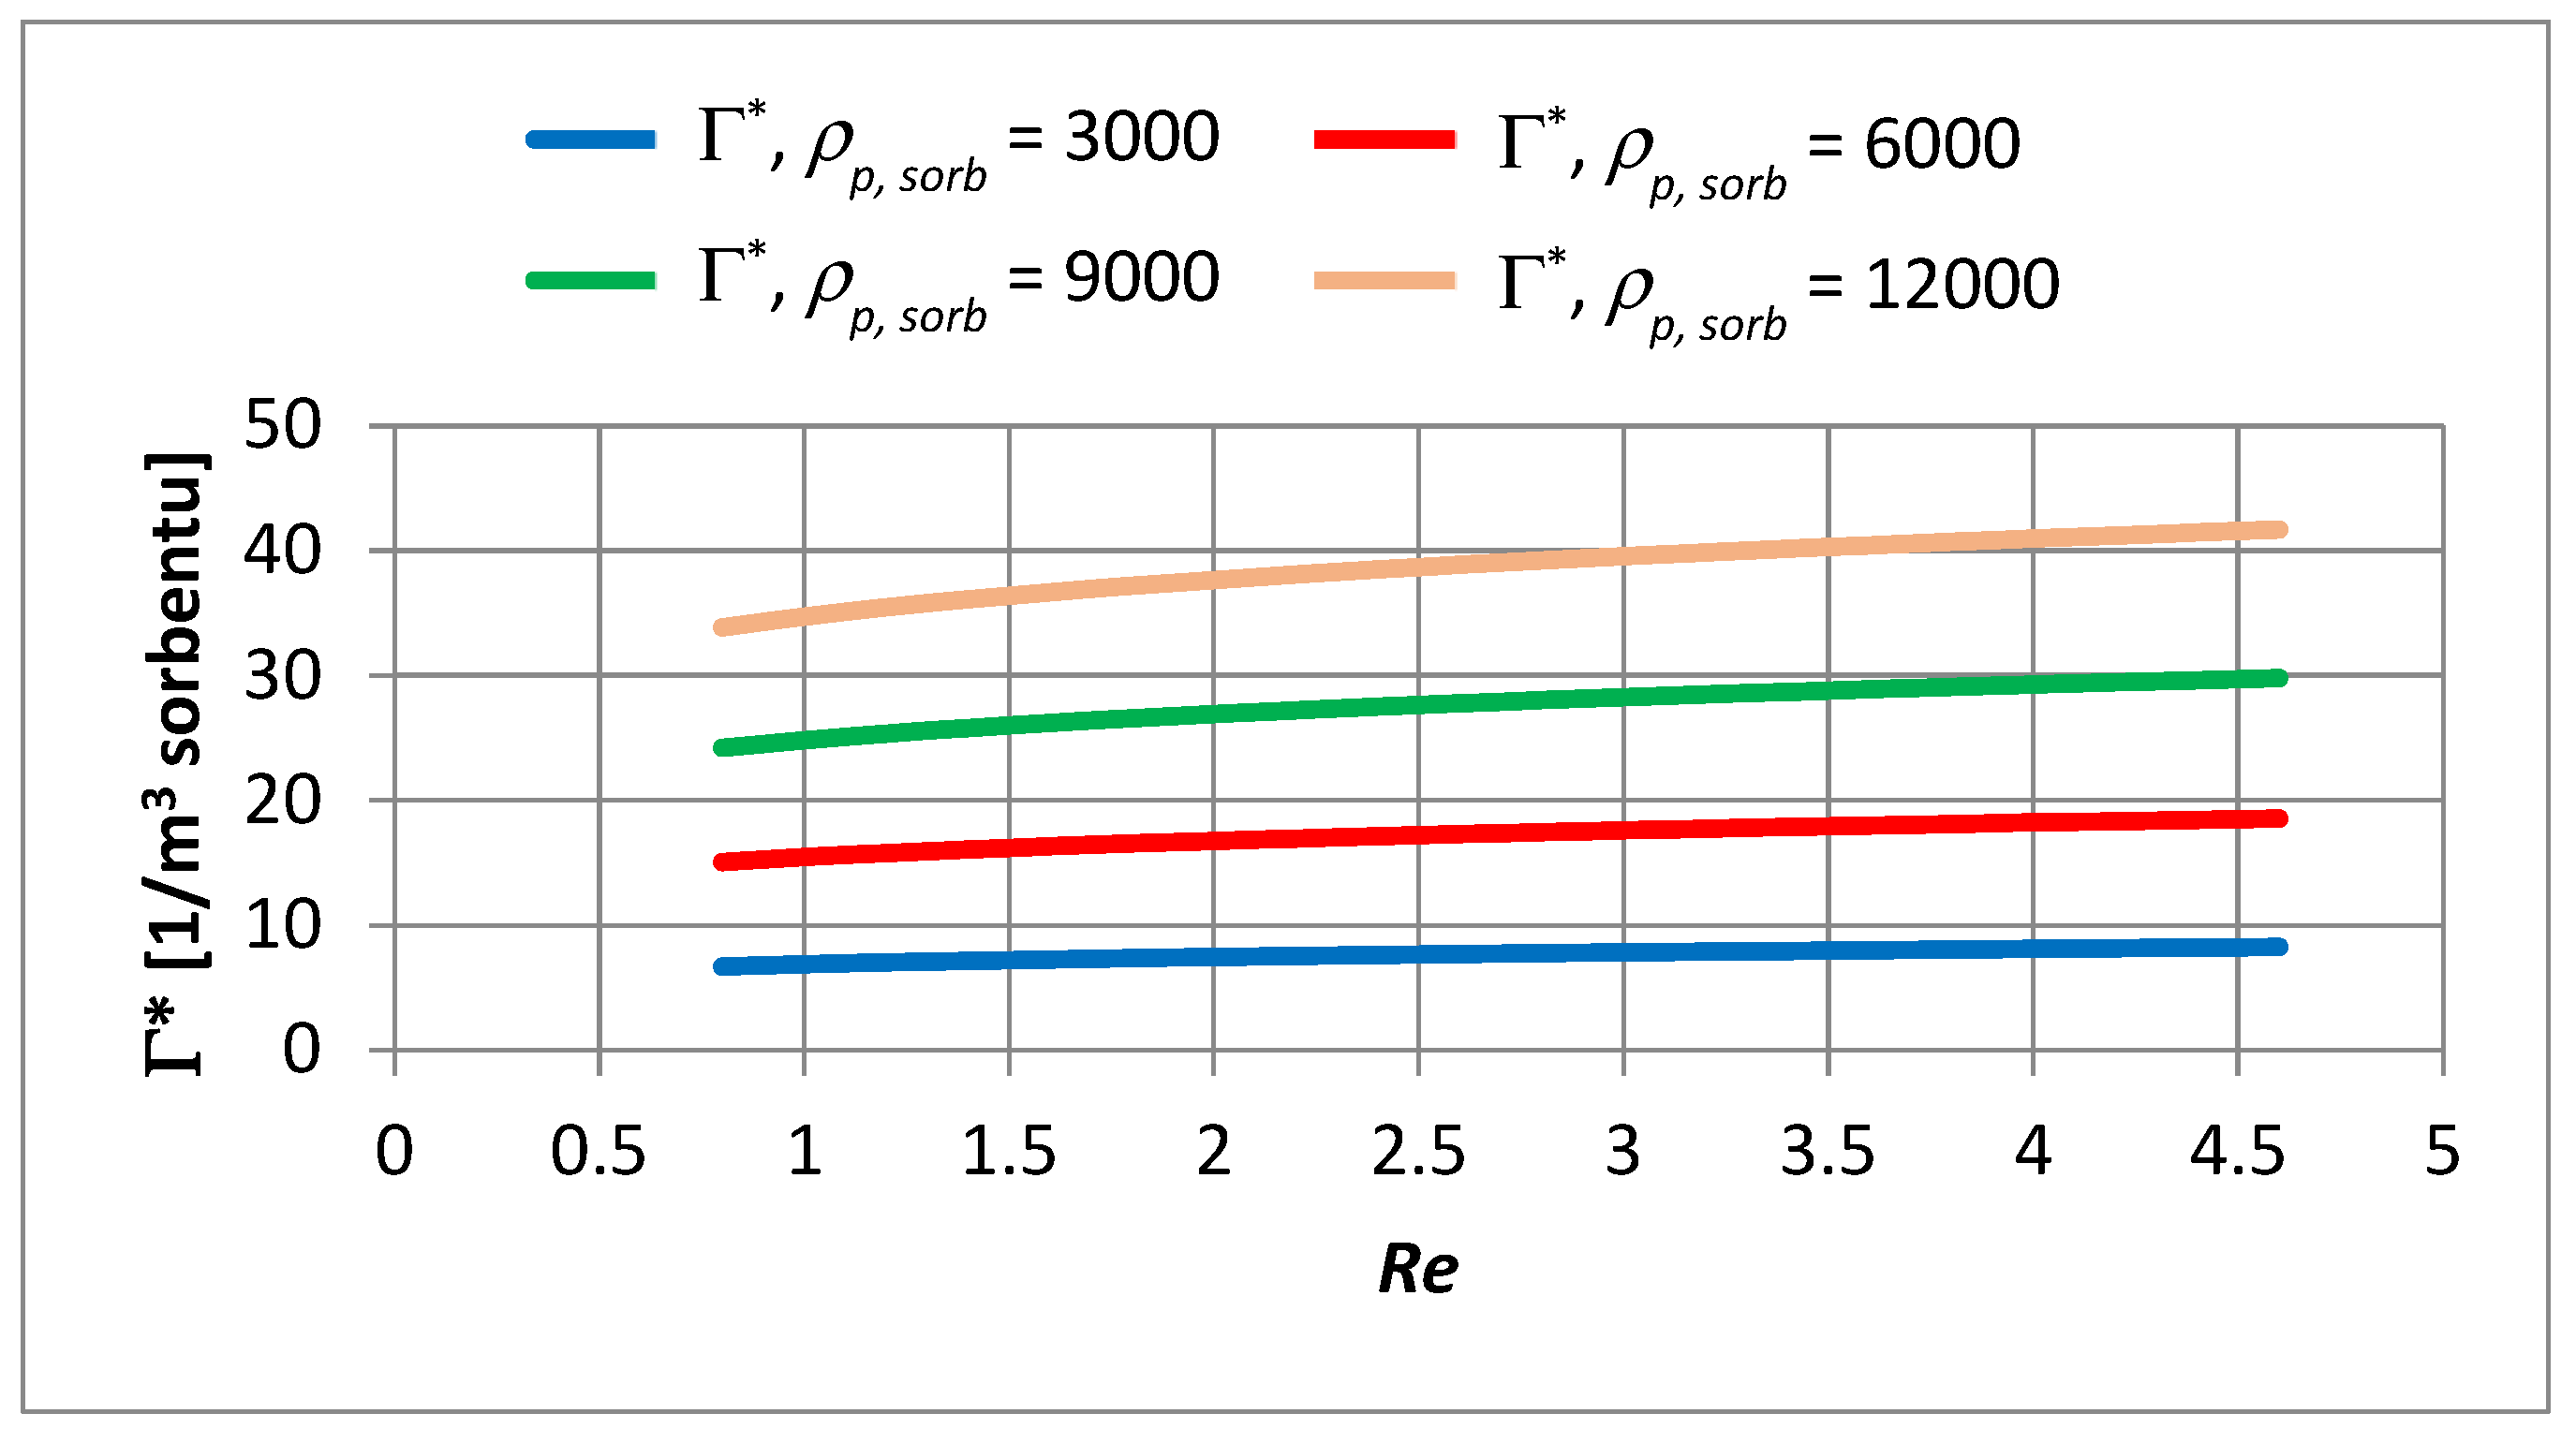
- An increase in the apparent density of the sorbent from 3000 to 12,000 g PAC/m3 of the bed may increase the adsorption coefficient Γ* by about 5.1 times and Γ by about 1.2 times.
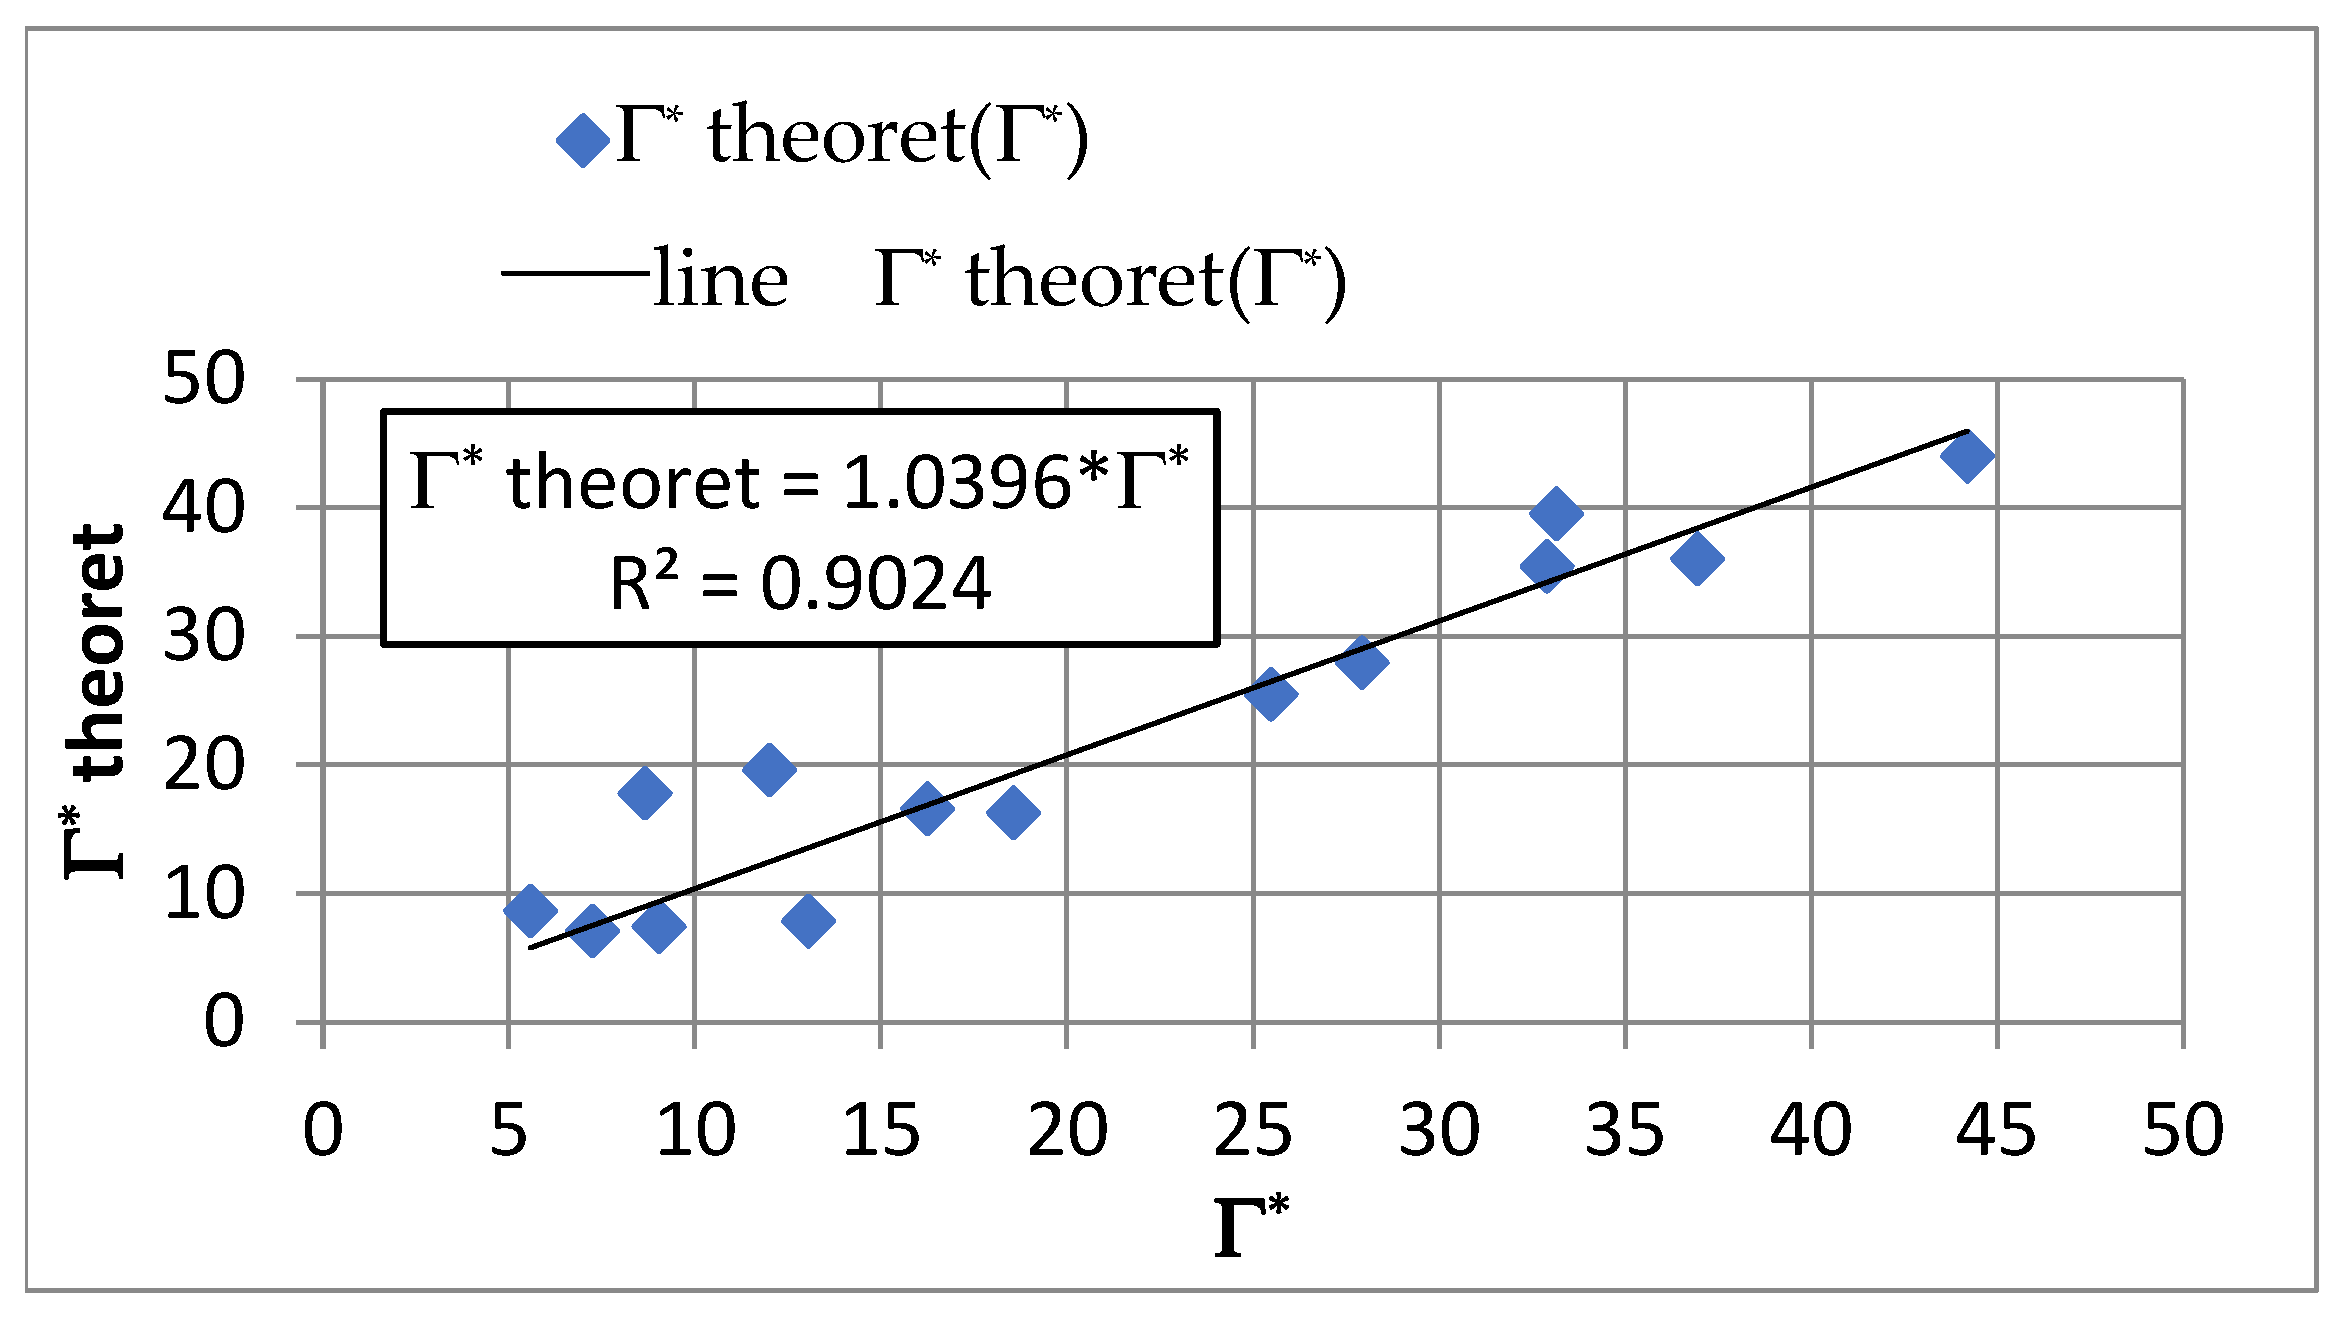
- The Re number affects the adsorption equilibrium constant and can cause changes in Γ* by about 1.23 times for ∈ 〈3000; 12,000〉 g PAC/m3 of bed and changes of Γ by approximately 1.2 times. This means that turbulent diffusion affects the adsorption isotherm coefficient of the powdered sorbent; the particles of sorbent may partially overlap each other. A turbulent motion may promote the transport of adsorbate into the aggregated particles, increasing the adsorption capacity.
- In the capillary velocity range ∈ 〈0.15·10−2; 0.72·10−2〉 m/s and with a change in the apparent density of the sorbent from 3000 to 12,000 g PAC/m3 of the bed, the Henry constant Γ* varies in the range of 7.24 to 44.20 1/m3 of sorbent and the Henry constant Γ vaires in the range of 0.0012 to 0.0019 m3 of water/g PAC.
- Equations comprising dimensionless criterion numbers (Re, Pe, Nu) and similarity moduli can be used to determine the parameters of the adsorption model that facilitate the design of filters with PAC.
- The high organic removal observed in a filter with PAC means that the PAC dose per unit volume of treated water may be several times lower than such a dose in a homogeneous flocculator at the same average effluent adsorbate concentration.
- Microscopic examination showed no presence of the PAC particles in the filtrate coming from this installation.
- The dosing PAC onto the filter bed in the amount of 2380 to 7130 g PAC/m3 does not significantly affect the resistance of water flow through the filter bed and the length of the filter cycle.
Author Contributions
Funding
Institutional Review Board Statement
Informed Consent Statement
Data Availability Statement
Acknowledgments
Conflicts of Interest
References
- Adamski, W.; Szlachta, M. Water Treatment Technology—Principles and Modeling; Wroclaw University of Technology: Wroclaw, Poland, 2011. [Google Scholar]
- Ina, K.; Joll, C.; Heitz, A. Powdered activated carbon coupled with enhanced coagulation for natural organic matter removal and disinfection by-product control: Application in a Western Australian water treatment plant. Chemosphere 2011, 83, 661–667. [Google Scholar]
- Najm, I.N.; Snoeyink, V.L.; Lykins, B.W.; Adams, J.Q. Using powdered activated carbon: A critical review. J. Am. Water Works Assoc. 1991, 83, 65–76. [Google Scholar] [CrossRef]
- Sandrucci, P.; Merlo, G.; Genon, G.; Meucci, L. PAC activity vs by-product precursors in water disinfection. Water 1995, 29, 2299–2308. [Google Scholar] [CrossRef]
- Newcombe, G.; Morrison, J.; Hepplewhite, C. Simultaneous adsorption of MIB and NOM onto activated carbon. I. Characterization of the system end NOM adsorption. Carbon 2002, 40, 2135–2146. [Google Scholar] [CrossRef]
- Newcombe, G.; Morrison, J.; Hepplewhite, C.; Knappe, D.R.U. Simultaneous adsorption of MIB and NOM onto activated carbon. II. Competitive effects. Carbon 2002, 40, 2147–2156. [Google Scholar] [CrossRef]
- Fabris, R.; Chow, C.W.K.; Drikas, M. Practical application of a combined treatment process for removal of recalcitrant NOM—alum and PAC. Water Sci. Technol. Water Supply 2004, 4, 89–94. [Google Scholar] [CrossRef]
- Uyak, V.; Yavuz, S.; Toroz, I.; Ozaydin, S.; Genceli, E.A. Disinfection by-products precursors removal by enhanced coagulation and PAC adsorption. Desalination 2007, 216, 334–344. [Google Scholar] [CrossRef]
- Carriere, A.; Vachon, M.; Belisle, J.L.; Barbeau, B. Supplementing coagulation with powdered activated carbon as a control strategy for trihalomethanes: Application to an existing utility. J. Water Supply Res. Technol. 2009, 58, 363–371. [Google Scholar] [CrossRef]
- Eeshwarasinghe, D.; Loganathan, P.; Kalaruban, M.; Sounthararajah, D.P.; Kandasamy, J.; Vigneswaran, S. Removing polycyclic aromatic hydrocarbons from water using granular activated carbon: Kinetic and equilibrium adsorption studies. Environ. Sci. Pollut. Res. 2018, 25, 13511–13524. [Google Scholar] [CrossRef]
- Alhamed, A.Y. Adsorption kinetics and performance of packed bed adsorber for phenol removal using activated carbon from dates’ stones. J. Hazard. Mater. 2009, 170, 763–770. [Google Scholar] [CrossRef]
- Li, B.-T.; Chen, Z.; Wang, W.-L.; Sun, Y.-X.; Zhou, T.-H.; Li, A.; Wu, Q.-Y.; Hu, H.-Y. Adsorption of Isothiazolone Biocides in Textile Reverse Osmosis Concentrate by Powdered Activated Carbon. Water 2018, 10, 532. [Google Scholar] [CrossRef]
- Szlachta, M.; Wójtowicz, P. Adsorption of methylene blue and Congo red from aqueous solution by activated carbon and carbon nanotubes. Water Sci. Technol. 2013, 68, 2240–2248. [Google Scholar] [CrossRef]
- Bielski, A. Models of adsorption of natural contaminants from treated water for municipal purposes on powdered activated carbon. Tech. Trans. 2020, 6, 117. [Google Scholar] [CrossRef]
- Bielski, A.; Zymon, W.; Żaba, T. Adsorption efficiency of powdered activated carbon applied to a filter bed. Pol. J. Environ. Stud. 2017, 26, 985–993. [Google Scholar] [CrossRef]
- Bielski, A.; Zymon, W. Filter beds supplemented with powdered activated carbon. Environ. Prot. Eng. 2017, 43, 173–191. [Google Scholar] [CrossRef]
- Bielski, A. PAC adsorption efficiencies in the filter and in the homogeneous flocculator. A full-scale comparative study. Environ. Prot. Eng. 2022, 48, 83–97. [Google Scholar] [CrossRef]
- Coulson, J.M.; Richardson, J.F. Coulson and Richardson’s Chemical Engineering; Butterworth-Heinemann: Oxford, UK, 2009; Volume 1–2. [Google Scholar]
- Alhassan, M.; Olutoye, M.A. Mathematical Modeling of a Simulated Fixed Bed for Desalting Operation. Leonardo J. Sci. 2006, 5, 21–32. [Google Scholar]
- Hanen, N.; Abdelmottaleb, O. Modeling of the Dynamics Adsorption of Phenol from an Aqueous Solution on Activated Carbon Produced from Olive Stones. J. Chem. Eng. Process Technol. 2013, 4, 3. [Google Scholar] [CrossRef]
- Kielcew, N.W. Basics of Adsorption Technique; Wydawnictwa Naukowo-Techniczne: Warszawa, Poland, 1980. (In Polish) [Google Scholar]
- Ahmad, A.A.; Hameed, B.H. Fixed-bed adsorption of reactive azo dye onto granular activated carbon prepared from waste. J. Hazard. Mater. 2010, 175, 298–303. [Google Scholar] [CrossRef]
- Bielski, A. Materiały do Ćwiczeń Laboratoryjnych z Ochrony Wód (Materials for Laboratory Exercises in Water Protection); Faculty of Environmental Engineering and Energy, Cracow University of Technology: Cracow, Poland, 2022; (In Polish). [Google Scholar] [CrossRef]
- Rexwinkel, G.; Berkhout, J.T.A.M.; Heesink, A.B.M. Adsorption of chlorinated hydrocarbons from aqueous solutions by wettedandnon-wettedsynthetic sorbents: Dynamics. Chem. Eng. Sci. 2003, 58, 1301–1314. [Google Scholar] [CrossRef]
- Gupta, A.; Gaur, V.; Verma, N. Breakthrough analysis for adsorption of sulfur-dioxide over zeolites. Chem. Eng. Process. 2004, 43, 9–22. [Google Scholar] [CrossRef]
- Chang, H.; Yuan, X.-G.; Tian, H.; Zeng, A.-W. Experiment and prediction of breakthrough curves for packed bed adsorption of water vapor on cornmeal. Chem. Eng. Process. 2006, 45, 747–754. [Google Scholar] [CrossRef]
- Yusuff, A.S.; Popoola, L.T.; Omitola, O.O.; Adeodu, A.O.; Daniyan, I.A. Mathematical Modelling of Fixed Bed Adsorption Column for Liquid Phase Solute: Effect of Operating Variables. Int. J. Sci. Eng. Res. 2013, 4, 811–822. [Google Scholar]
- Bielski, A.; Zielina, M.; Młyńska, A. Analysis of heavy metals leaching from internal pipe cement coating into potable water. J. Clean. Prod. 2020, 265, 121425. [Google Scholar] [CrossRef]
- Zielina, M.; Bielski, A.; Młyńska, A. Leaching of chromium and lead from the cement mortar lining into the flowing drinking water shortly after pipeline rehabilitation. J. Clean. Prod. 2022, 362, 132512. [Google Scholar] [CrossRef]
- Korshin, G.; Chow, C.W.K.; Fabris, R.; Drikas, M. Absorbance spectroscopy-based examination of effects of coagulation on the reactivity of fractions of natural organic matter with varying apparent molecular weights. Water Res. 2009, 43, 1541–1548. [Google Scholar] [CrossRef]


| No. | D (cm) | Q (mL/s) | ρp,sorb (g/m3 of Bed) | (10−2 m/s) | (10−4 m2/s) | Pe | Re |
|---|---|---|---|---|---|---|---|
| 1 | 15 | 1.08 | 0 | 0.24 | 0.2574 | 0.05284 | 1.36 |
| 2 | 15 | 1.13 | 0 | 0.27 | 0.3164 | 0.04878 | 1.54 |
| 3 | 15 | 1.35 | 0 | 0.32 | 0.5020 | 0.03685 | 1.85 |
| 4 | 15 | 1.45 | 0 | 0.35 | 0.4928 | 0.04086 | 2.01 |
| 5 | 15 | 1.93 | 0 | 0.47 | 0.9634 | 0.02794 | 2.69 |
| 6 | 3 | 2.20 | 3143.8 | 0.69 | 1.7250 | 0.02299 | 3.97 |
| 7 | 3 | 2.20 | 6287.6 | 0.72 | 2.7859 | 0.01488 | 4.15 |
| 8 | 3 | 2.20 | 9431.4 | 0.71 | 3.3023 | 0.01227 | 4.05 |
| 9 | 3 | 2.20 | 12,575.2 | 0.72 | 2.0315 | 0.02039 | 4.14 |
| 10 | 3 | 1.50 | 3010.0 | 0.47 | 0.5626 | 0.04797 | 2.70 |
| 11 | 3 | 1.50 | 6020.0 | 0.50 | 1.3640 | 0.02116 | 2.89 |
| 12 | 3 | 1.50 | 9030.1 | 0.42 | 0.5394 | 0.04414 | 2.38 |
| 13 | 3 | 1.50 | 12,040.1 | 0.46 | 0.6536 | 0.04004 | 2.62 |
| 14 | 3 | 1.00 | 3042.4 | 0.26 | 0.4032 | 0.03708 | 1.49 |
| 15 | 3 | 1.00 | 6084.8 | 0.25 | 0.4682 | 0.03093 | 1.45 |
| 16 | 3 | 1.00 | 8841.9 | 0.23 | 0.6161 | 0.02115 | 1.30 |
| 17 | 3 | 1.00 | 12,040.1 | 0.21 | 0.3976 | 0.03013 | 1.20 |
| 18 | 3 | 0.80 | 3109.3 | 0.15 | 0.1605 | 0.05324 | 0.85 |
| 19 | 3 | 0.80 | 6218.5 | 0.24 | 0.2574 | 0.05318 | 0.98 |
| 20 | 3 | 0.80 | 9327.8 | 0.27 | 0.3164 | 0.04157 | 0.79 |
| 21 | 3 | 0.80 | 12,437.0 | 0.32 | 0.5020 | 0.05659 | 0.75 |
| No. | Q (mL/s) | Γ* (1/m3 Sorbent) | PAC Dose (g) | ρp,sorb (g PAC/m3 of Bed) | ε (m3 of Pores/m3 of Bed) | Vx (m/s) | k·am (m/s)∗(m2/g PAC) | Nu | Re |
|---|---|---|---|---|---|---|---|---|---|
| 1 | 2.2 | 5.58 | 1 | 3143.80 | 0.47 | 3.251·10−3 | 4.123·10−7 | 2.489 | 4.380 |
| 2 | 2.2 | 12.00 | 2 | 6287.60 | 0.465 | 3.362·10−3 | 6.754·10−7 | 8.243 | 4.579 |
| 3 | 2.2 | 43.78 | 3 | 9431.40 | 0.46 | 3.251·10−3 | 9.591·10−7 | 17.747 | 4.476 |
| 4 | 2.2 | 44.20 | 4 | 12,575.21 | 0.45 | 3.251·10−3 | 1.703·10−6 | 42.938 | 4.575 |
| 5 | 1.5 | 13.05 | 1 | 3010.02 | 0.47 | 2.212·10−3 | 2.597·10−7 | 1.501 | 2.981 |
| 6 | 1.5 | 8.65 | 2 | 6020.05 | 0.465 | 2.341·10−3 | 7.457·10−7 | 8.713 | 3.188 |
| 7 | 1.5 | 27.92 | 3 | 9030.07 | 0.46 | 1.910·10−3 | 1.092·10−6 | 19.341 | 2.630 |
| 8 | 1.5 | 33.15 | 4 | 12,040.09 | 0.45 | 2.054·10−3 | 6.598·10−7 | 15.932 | 2.891 |
| 9 | 1 | 9.03 | 1 | 3042.39 | 0.47 | 1.226·10−3 | 6.107·10−7 | 3.567 | 1.651 |
| 10 | 1 | 16.24 | 2 | 6084.78 | 0.465 | 1.175·10−3 | 5.848·10−7 | 6.907 | 1.600 |
| 11 | 1 | 34.95 | 3 | 8841.94 | 0.46 | 1.045·10−3 | 1.713·10−6 | 29.722 | 1.439 |
| 12 | 1 | 36.94 | 4 | 12,040.09 | 0.45 | 9.403·10−4 | 7.569·10−7 | 18.277 | 1.323 |
| 13 | 0.8 | 7.24 | 1 | 3109.25 | 0.47 | 7.004·10−4 | 2.229·10−7 | 1.331 | 0.944 |
| 14 | 0.8 | 18.55 | 2 | 6218.51 | 0.465 | 7.959·10−4 | 6.234·10−7 | 7.524 | 1.084 |
| 15 | 0.8 | 25.47 | 3 | 9327.76 | 0.46 | 6.310·10−4 | 4.770·10−7 | 8.730 | 0.869 |
| 16 | 0.8 | 32.89 | 4 | 12,437.02 | 0.45 | 5.876·10−4 | 5.774·10−7 | 14.402 | 0.827 |
| No. | Q (mL/s) | Γ* (1/m3 of Sorbent) | Γ (m3 of Water/g PAC) Equation (5) | PAC Dose D (g) | ρp,sorb (g PAC/m3 of Bed) | ε (m3 of Pores/m3 of Bed) | Filter Cycle Time t for 0.9·A0 (s) | A0 (1/m) | Aa Average (1/m) | V = Q·t (m3) | PAC Dose (g) | |
|---|---|---|---|---|---|---|---|---|---|---|---|---|
| 1 | 2.2 | 5.58 | 0.00094 | 1 | 3143.8 | 0.47 | 1250 | 3.47 | 2.93 | 0.00275 | 0.3035 | 0.3035 |
| 2 | 2.2 | 12 | 0.00102 | 2 | 6287.6 | 0.465 | 2250 | 3.41 | 2.7 | 0.00495 | 0.7794 | 0.3897 |
| 3 | 2.2 | 43.78 | 0.00251 | 3 | 9431.4 | 0.46 | 7250 | 3.36 | 2.51 | 0.01595 | 3.2344 | 1.0781 |
| 4 | 2.2 | 44.2 | 0.00193 | 4 | 12,575.21 | 0.45 | 7250 | 3.06 | 1.98 | 0.01595 | 5.2096 | 1.3024 |
| 5 | 1.5 | 13.05 | 0.00230 | 1 | 3010.02 | 0.47 | 4000 | 4.6 | 3.94 | 0.006 | 0.6018 | 0.6018 |
| 6 | 1.5 | 8.65 | 0.00077 | 2 | 6020.05 | 0.465 | 5500 | 3.79 | 2.72 | 0.00825 | 1.9434 | 0.9717 |
| 7 | 1.5 | 27.92 | 0.00167 | 3 | 9030.07 | 0.46 | 9000 | 2.95 | 1.86 | 0.0135 | 4.7373 | 1.5791 |
| 8 | 1.5 | 33.15 | 0.00151 | 4 | 12,040.09 | 0.45 | 10,500 | 3.77 | 2.49 | 0.01575 | 4.8481 | 1.2120 |
| 9 | 1 | 9.03 | 0.00157 | 1 | 3042.39 | 0.47 | 3500 | 3.73 | 2.54 | 0.0035 | 0.9819 | 0.9819 |
| 10 | 1 | 16.24 | 0.00143 | 2 | 6084.78 | 0.465 | 9500 | 3.54 | 2.47 | 0.0095 | 2.4643 | 1.2322 |
| 11 | 1 | 34.95 | 0.00213 | 3 | 8841.94 | 0.46 | 14,500 | 2.86 | 1.54 | 0.0145 | 7.4423 | 2.4808 |
| 12 | 1 | 36.94 | 0.00169 | 4 | 12,040.09 | 0.45 | 20,500 | 3.13 | 1.85 | 0.0205 | 8.4933 | 2.1233 |
| 13 | 0.8 | 7.24 | 0.00123 | 1 | 3109.25 | 0.47 | 9500 | 3.29 | 2.55 | 0.0076 | 1.3207 | 1.3207 |
| 14 | 0.8 | 18.55 | 0.00160 | 2 | 6218.51 | 0.465 | 15,000 | 2.93 | 1.86 | 0.012 | 4.1337 | 2.0668 |
| 15 | 0.8 | 25.47 | 0.00147 | 3 | 9327.76 | 0.46 | 23,000 | 2.93 | 1.78 | 0.0184 | 7.1183 | 2.3728 |
| 16 | 0.8 | 32.89 | 0.00145 | 4 | 12,437.02 | 0.45 | 29,500 | 2.83 | 1.53 | 0.0236 | 12.0074 | 3.0018 |
| Average Filter Cycle Time (h) | PAC Dose (g PAC/m3 of the Bed) | Filtration Begins | End of Filtration | Increase in Pressure Losses after Filtration | Increase in Pressure Losses after PAC Dosing, Filtration Begins | Increase in Pressure Losses after PAC Dosing, End of Filtration | |||
|---|---|---|---|---|---|---|---|---|---|
| Pressure Loss | Pressure Loss | (cm H2O) | (cm H2O) | (cm H2O) | |||||
| (cm H2O) | (cm H2O) | ||||||||
| Filter with PAC | Filter without PAC | Filter with PAC | Filter without PAC | Filter with PAC | Filter without PAC | ||||
| 1 | 2 | 3 | 4 | 5 | 6 | 7 | 8 | 9 | 10 |
| 21.25 | 4750 | 23.7 | 21.4 | 38.8 | 35.3 | 15.1 | 13.9 | 2.3 | 3.5 |
| 4750 | 23.7 | 20.9 | 41.5 | 38.3 | 17.8 | 17.4 | 2.8 | 3.2 | |
| 4750 | 21 | 22 | 45.3 | 44 | 24.3 | 22 | 1 | 1.3 | |
| 4750 | 22 | 24.2 | 48 | 45.5 | 26 | 21.3 | 2.2 | 2.5 | |
| 22 | 2380 | 21.8 | 20.5 | 44.1 | 40.9 | 22.3 | 20.2 | 1.3 | 3.2 |
| 2380 | 22.2 | 21.2 | 45.2 | 42 | 23 | 20.8 | 1 | 3.2 | |
| 2380 | 22.4 | 20.1 | 49 | 45 | 26.6 | 21.9 | 2.3 | 4 | |
| 2380 | 21.8 | 19.9 | 43.7 | 40 | 21.8 | 20.1 | 1.9 | 3.7 | |
| 18.5 | 7130 | 22.4 | 19.6 | 40 | 37.5 | 17.6 | 17.9 | 2.8 | 2.5 |
| 7130 | 21.8 | 19.5 | 45.2 | 40.2 | 23.3 | 20.7 | 2.3 | 5 | |
| 7130 | 23.9 | 21.7 | 33.9 | 31.9 | 15 | 12.2 | 2.2 | 2 | |
Disclaimer/Publisher’s Note: The statements, opinions and data contained in all publications are solely those of the individual author(s) and contributor(s) and not of MDPI and/or the editor(s). MDPI and/or the editor(s) disclaim responsibility for any injury to people or property resulting from any ideas, methods, instructions or products referred to in the content. |
© 2024 by the authors. Licensee MDPI, Basel, Switzerland. This article is an open access article distributed under the terms and conditions of the Creative Commons Attribution (CC BY) license (https://creativecommons.org/licenses/by/4.0/).
Share and Cite
Bielski, A.; Ożóg, J. Adsorption on Powdered Activated Carbon (PAC) Dosed into an Anthracite-Sand Filter in Water Treatment—Model and Criterion Equations. Appl. Sci. 2024, 14, 4727. https://doi.org/10.3390/app14114727
Bielski A, Ożóg J. Adsorption on Powdered Activated Carbon (PAC) Dosed into an Anthracite-Sand Filter in Water Treatment—Model and Criterion Equations. Applied Sciences. 2024; 14(11):4727. https://doi.org/10.3390/app14114727
Chicago/Turabian StyleBielski, Andrzej, and Jakub Ożóg. 2024. "Adsorption on Powdered Activated Carbon (PAC) Dosed into an Anthracite-Sand Filter in Water Treatment—Model and Criterion Equations" Applied Sciences 14, no. 11: 4727. https://doi.org/10.3390/app14114727
APA StyleBielski, A., & Ożóg, J. (2024). Adsorption on Powdered Activated Carbon (PAC) Dosed into an Anthracite-Sand Filter in Water Treatment—Model and Criterion Equations. Applied Sciences, 14(11), 4727. https://doi.org/10.3390/app14114727