Article

Shear Reinforcement Effectiveness of One-Way Void Slab with the Hollow Core Ratio and Shear Reinforcement

1
Institute of Construction Technology, Seoul National University of Science and Technology, Seoul 01811, Republic of Korea
2
Department of Architectural Engineering, College of Engineering, Dankook University, 152 Jukjeon-ro, Suji-gu, Yongin-si 16890, Gyeonggi-do, Republic of Korea
*
Author to whom correspondence should be addressed.
Appl. Sci. 2024, 14(11), 4737; https://doi.org/10.3390/app14114737
Submission received: 7 May 2024 / Revised: 28 May 2024 / Accepted: 29 May 2024 / Published: 30 May 2024

Abstract

:
Void slabs offer a promising solution for sustainable construction due to their reduced weight and potential for recycled materials. However, their inherent hollowness can compromise shear capacity compared to solid slabs. This study investigates the effectiveness of shear reinforcement in mitigating this vulnerability. Experimental testing with a four-point support loading confirmed shear failure in all specimens and revealed a significant reserve of shear strength exceeding predictions from ACI 318-14 by at least 1.436. This suggests the potential for more efficient designs that utilize less shear reinforcement while maintaining structural integrity. An inverse relationship between porosity and shear strength was observed, highlighting the importance of considering void content during design. Among established design codes (ACI 318-14, UBC 2, and CEB-FIP 1990), CEB-FIP 1990 provided the most accurate prediction of shear capacity for these reinforced hollow slabs. These findings offer valuable insights for optimizing the shear design of voided slabs. The observed strength reserve suggests the potential for reduced shear reinforcement while maintaining safety. Additionally, the influence of porosity and the code comparison provide crucial considerations for future design practices. This research paves the way for developing efficient and safe voided slab applications, promoting sustainability in the construction industry.

1. Introduction

Reinforced concrete remains a dominant material in the Architectural, Engineering, and Construction (AEC) sector due to its versatility and enduring performance [1,2,3,4,5]. Its ability to combine the compressive strength of concrete with the tensile strength of steel reinforcement allows for the creation of robust and adaptable structures. However, as building designs evolve towards larger spans, traditional solid slab systems necessitate thicker slabs. This translates to heavier structures requiring increased beam and column dimensions, leading to a number of drawbacks [6,7,8,9,10].
In practical terms, the slab constitutes a crucial structural element within a building, often requiring the largest quantity of concrete. Primarily tasked with supporting vertical loads, the slab’s design focuses solely on this aspect [11,12,13]. Furthermore, as the building span extends, the thickness of the slab increases, necessitating corresponding adjustments in beam and column dimensions. Solid slab systems, an early innovation aimed at expediting construction and reducing costs by eliminating intermediate beams, remain one of the earliest methods introduced for such purposes [1,11,14]. Nevertheless, the substantial weight associated with this system renders it unsuitable for application in long spans and high-rise structures [10,15,16,17,18]. Additionally, its increased weight contributes to heightened seismic loads, rendering its utilization in regions prone to high seismic activity economically unfeasible [4,19,20]. Alongside the structural shortcomings, it is reported that the manufacturing processes of cement and rebars, which are the main components of concrete, entail substantial energy consumption and greenhouse gas emissions [15,16,21,22].
In order to overcome the addressed difficulties, various structural systems have been developed in recent years. As a solution to this issue, there’s a growing adoption of systems aimed at reducing slab weight, such as voided slabs. These slabs involve removing non-structural concrete from the centre of the slab cross-section and replacing it with lightweight materials such as high-density polyethylene (HDPE), expanded polystyrene (EPS), and so forth. Void slabs are typically categorized into one-way void slabs, utilizing lightweight hollow pipes, and biaxial void slabs employing hollow bodies, depending on the method of constructing the voids [23,24,25,26]. Two-way voided slabs have garnered significant attention as a promising technological advancement aligning with contemporary objectives such as sustainable development, circular economy promotion, and carbon dioxide emission reduction [22,26,27]. Several reports suggest that the adoption of void slabs, which involve a reduced amount of concrete and incorporation of recycled materials for void formers, can align with the objectives outlined in building environmental assessment methodologies such as BREEAM and LEED [21,22,27,28]. Moreover, void slab structures are expected as potential solutions to societal issues like inter-floor noise in densely populated high-rise residential settings such as apartments and high-rise buildings [17,29,30,31].
Although void slabs offer benefits such as reduced self-weight, environmental friendliness, and potential solutions to societal issues, they are susceptible to greater vulnerability to shear forces compared to solid slabs [5]. The reduction in shear force resistance in void slabs is attributed to the removal of abdominal concrete, which does not compromise bending resistance but introduces cross-sectional defects that diminish shear force resistance [2,6,8,9,11,14]. Moreover, shear failure, induced by shear force, poses challenges in failure prediction and user safety due to its inherently brittle nature, contrasting with the gradual failure characteristic of flexural failure [32].
To proactively mitigate these issues, concrete structural design typically establishes a shear strength reduction factor set marginally lower, by 0.1, than the bending strength reduction factor [33]. Nonetheless, to optimize the effectiveness of void slabs, a paramount objective entails pursuing an optimal design strategy aimed at minimizing shear reinforcement while augmenting the hollow core ratio [34,35,36]. The current literature suggests that the shear strength of hollow slabs typically ranges from approximately 40% to 90% in comparison to solid slabs [36,37,38]. While several studies investigate the inherent shear capacity of hollow slabs, there exists a noticeable research gap concerning the development of efficient and effective shear reinforcement techniques. This study aims to bridge this gap by investigating the relationship between the hollow core ratio of the void slabs and their maximum shear capacity, with a specific focus on the effectiveness of shear reinforcement methods. By systematically evaluating different reinforcement configurations, this research could provide valuable insights for engineers to design void slabs that are both structurally efficient and safe. This will ultimately contribute to the wide adoption of void slabs in construction, promoting sustainability through reduced material usage.

2. Experimental Programme

2.1. Shear Capacity Calculation by Various Standards

In this study, the shear capacity of the specimens was calculated by international standards such as the American Concrete Institute (ACI), Uniform Building Code (UBC), and the International Federation for Concrete and Precast Concrete (CEB-FIB). Variations in the standards arise based on three principal parameters: (i) the critical section for punching shear, which dictates the control perimeter; (ii) the permissible shear strength of concrete; and (iii) the influence of shear reinforcement. The equations utilized to estimate the punching shear capacity of solid slabs in this research, considering these parameters, are summarized below.

2.1.1. ACI 318-14

ACI 318-14, established by the American Concrete Institute in 2014 [39], is a concrete design standard that incorporates a specific shear design section for assessing the shear strength of hollow slabs. The shear resistance of reinforced concrete members arises from the combined actions of concrete (Vc) and shear reinforcement (Vs). Equation (1) provides a basic estimate of Vc, while a more refined expression incorporating the influence of concrete compressive strength is given by fck; bw represents the width of the cross-section (mm), d is the effective depth of the cross-section (mm), and the detailed formula of the combined actions of concrete is given by Vc,detailed. Furthermore, shear span-to-depth ratio (a/d), main tensile reinforcement ratio (ρw), lightweight concrete factor ( λ ), shear span-to-depth ratio ( V u d M u ), and coefficient shear force (Vu) are presented in Equation (2). In addition, Equation (3) quantifies the shear reinforcement contribution (Vs), considering the cross-sectional area (Av), spacing of the shear reinforcement (s), and inclination angle (α) of the shear reinforcement. These equations form the basis for a comprehensive understanding of shear behaviours in reinforced concrete members.
V C = 0.17 λ f c k b w d
V c , d e t a i l e d = 0.16 λ f c k + 17 ρ w V u d M u b w d
V s = A v sin α + cos α d s

2.1.2. Uniform Building Code

The Uniform Building Code (UBC), a standard influential primarily in the western United States and established in 1997, provides a framework for evaluating shear capacity in reinforced concrete members [40]. Within this code, Equation (4) defines the shear contribution from the concrete (Vc) based on factors including the compressive strength of the concrete (f′c), the shear span-to-depth ratio (a/d), and the main tensile reinforcement ratio (ρw). Similarly, Equation (5) addresses the shear contribution of dedicated shear reinforcement (Vs) by incorporating its cross-sectional area (Av), the tensile strength of the shear reinforcement (fyt), inclination angle (α), and spacing (s). These equations offered a standardised approach to shear design within the UBC’s domain.
V C = 0.158 f c + 17.1 ρ w V u d M u b w d
V s = A v f y t ( sin α + cos α ) d s

2.1.3. CEB-FIP 1990

In contrast to the Uniform Building Code (UBC) approach, the International Federation for Concrete and Precast Concrete (Fédération international du béton) suggested a code for shear capacity calculation [41]. This model employs a single equation (Equation (6)) to determine the total shear capacity of a reinforced concrete member. This equation incorporates the combined effects of concrete contribution (VRD,C) and shear reinforcement contribution (VRD,S). The factors influencing VRD,C include the shear span-to-depth ratio (d/a), main reinforcement ratio (ρ), and concrete compressive strength (fck), potentially with additional considerations. Similarly, VRD,S is influenced by the shear reinforcement’s spacing (s) in combination with the tensile strength (fyt) for an unspecified factor likely related to its contribution to shear resistance (Equation (7)). A key difference from the previously discussed UBS method lies in the calculation of the effective depth. The use of a modified effective depth (z) in the CEB-FIP model could lead to slightly different shear resistance estimates compared to the UBC and ACI approaches. This difference would be most pronounced for deeper members, where the reduction in effective depth due to the 0.9d factor would have a greater impact on the overall shear capacity calculation.
V R D , C = 0.15 3 d a 1 / 3 ξ 100 ρ w f c k 1 / 3 b w d
V R d , s = A v f y t s z cos θ + cot α
ξ = 1 + 200 / d
z = 0.9 d
It is important to note that both the UBC and CED-FIP model code are recognised engineering design standards with a proven track record of safety and performance. The choice of which approach to use in a particular design situation may depend upon factors such as local building codes, engineering judgement, and familiarity with the respective methodologies.

2.2. Experimental Programme Details

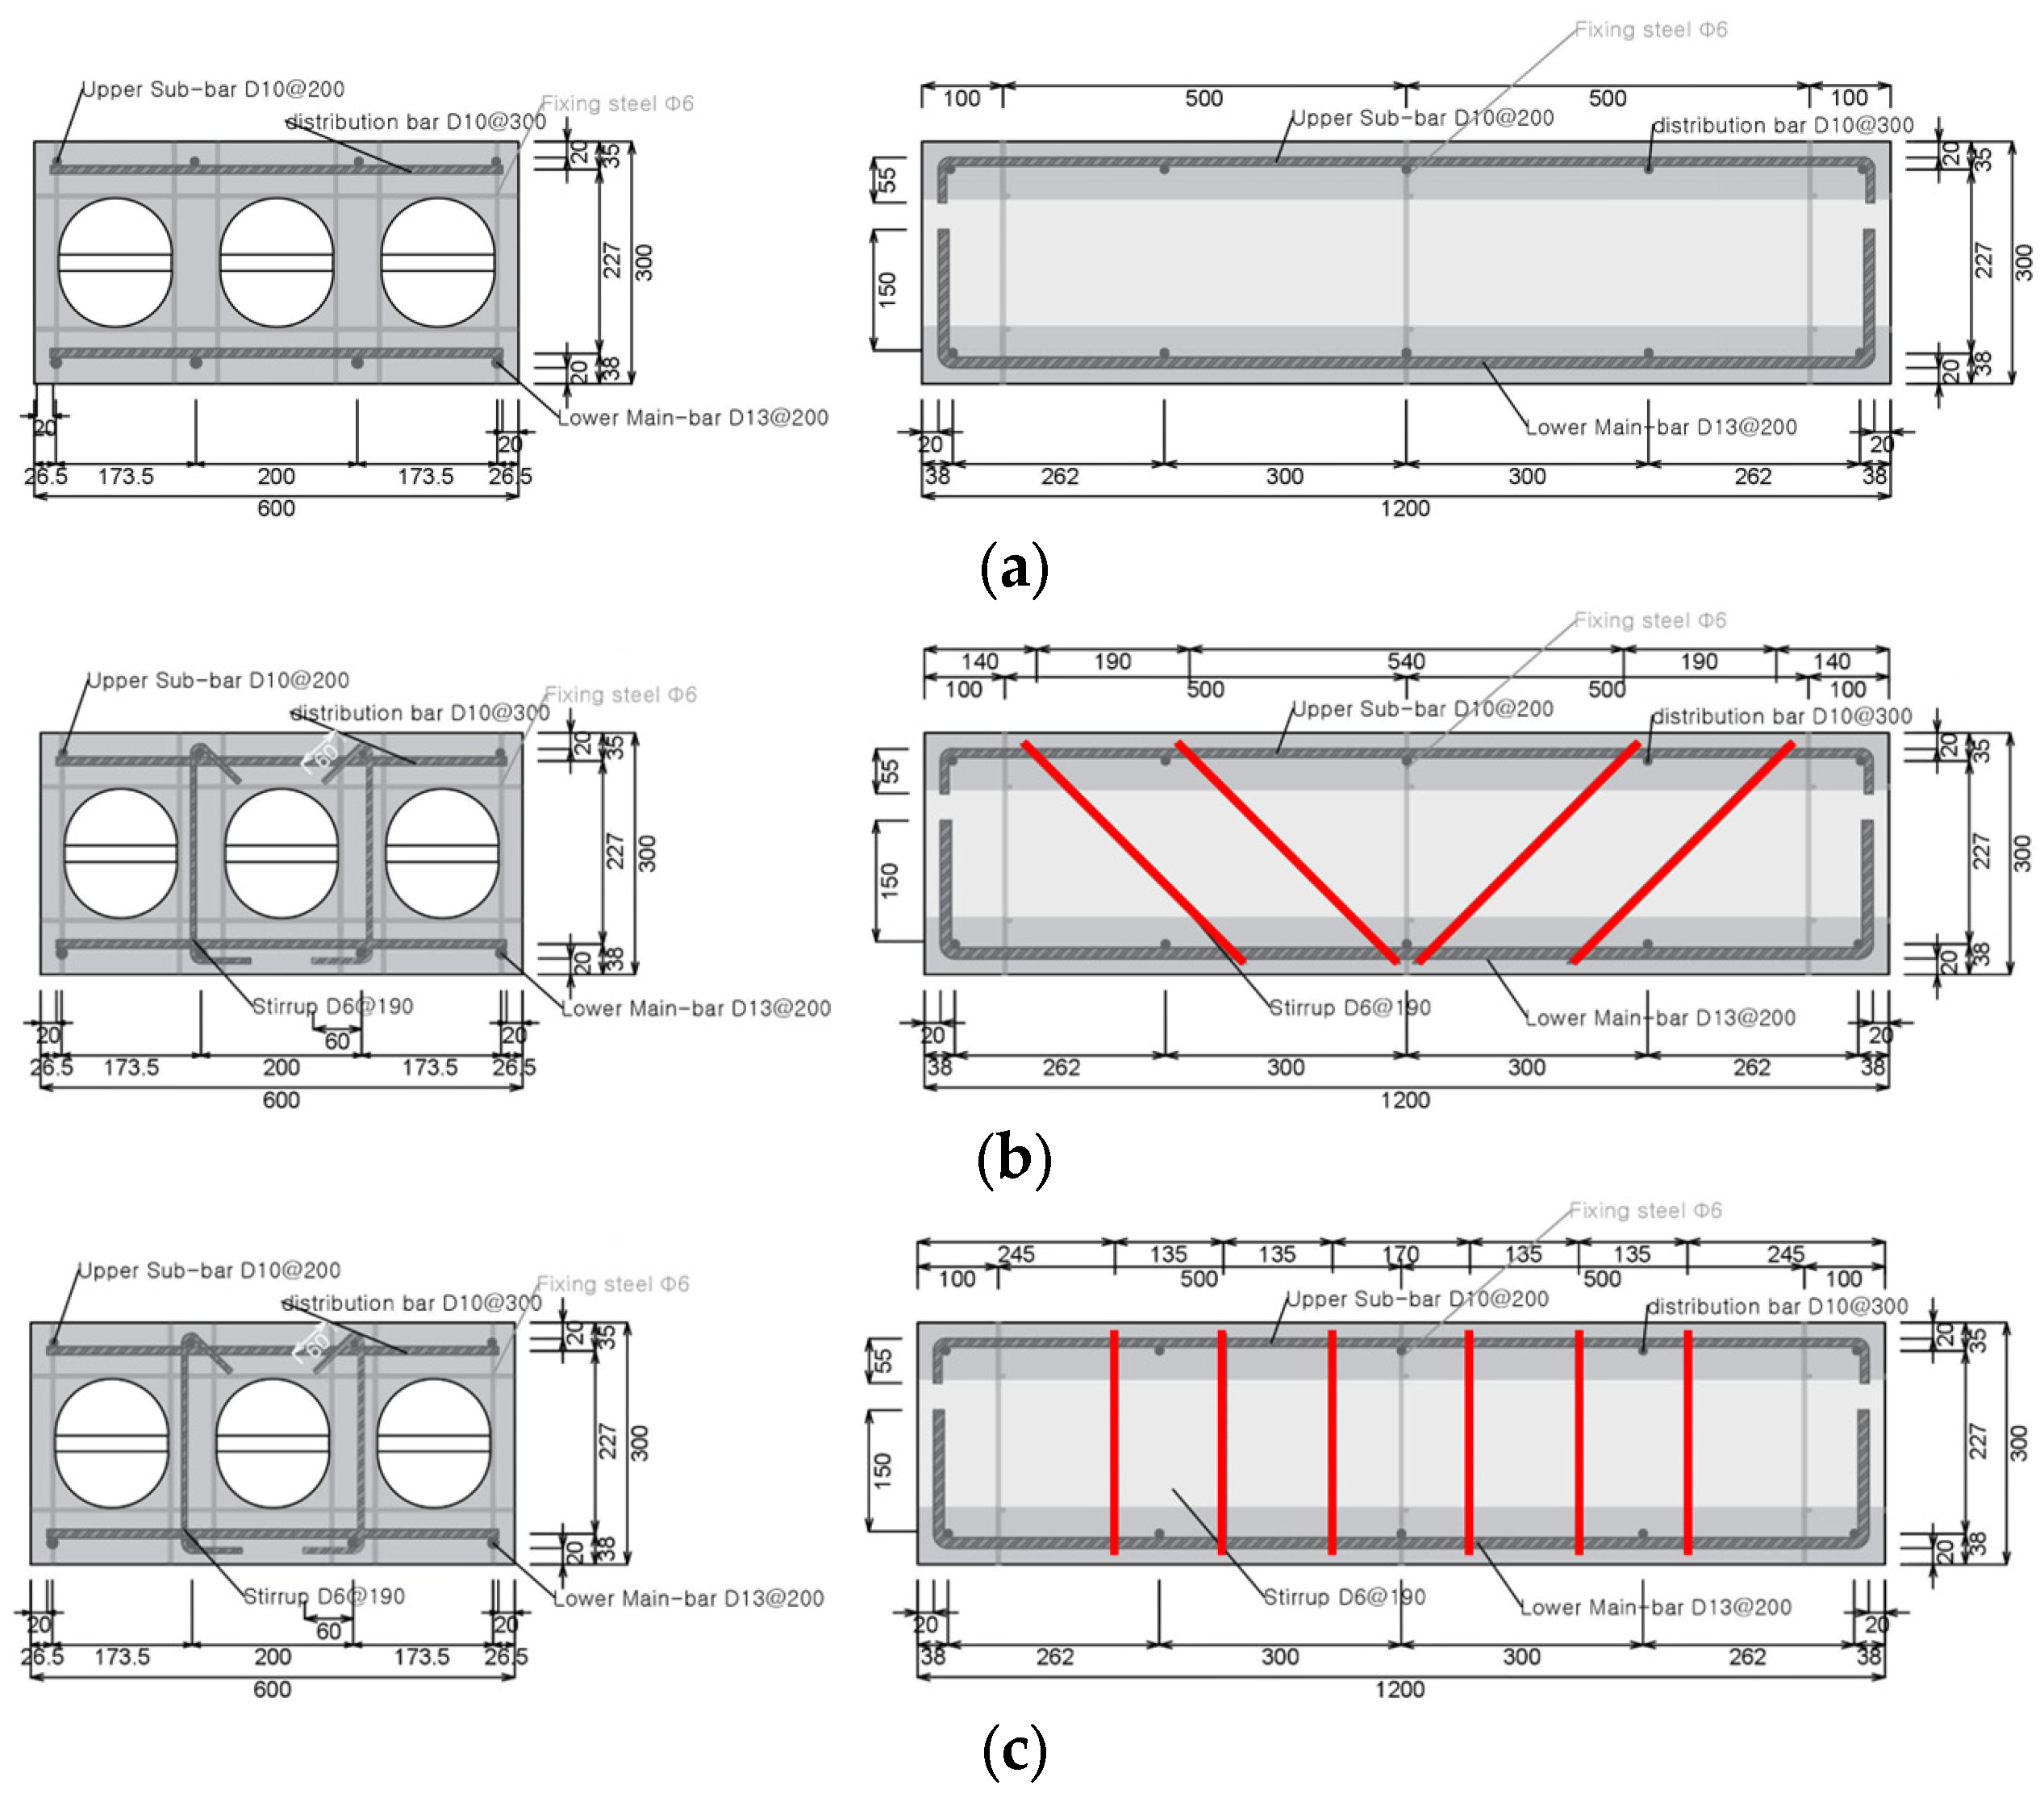
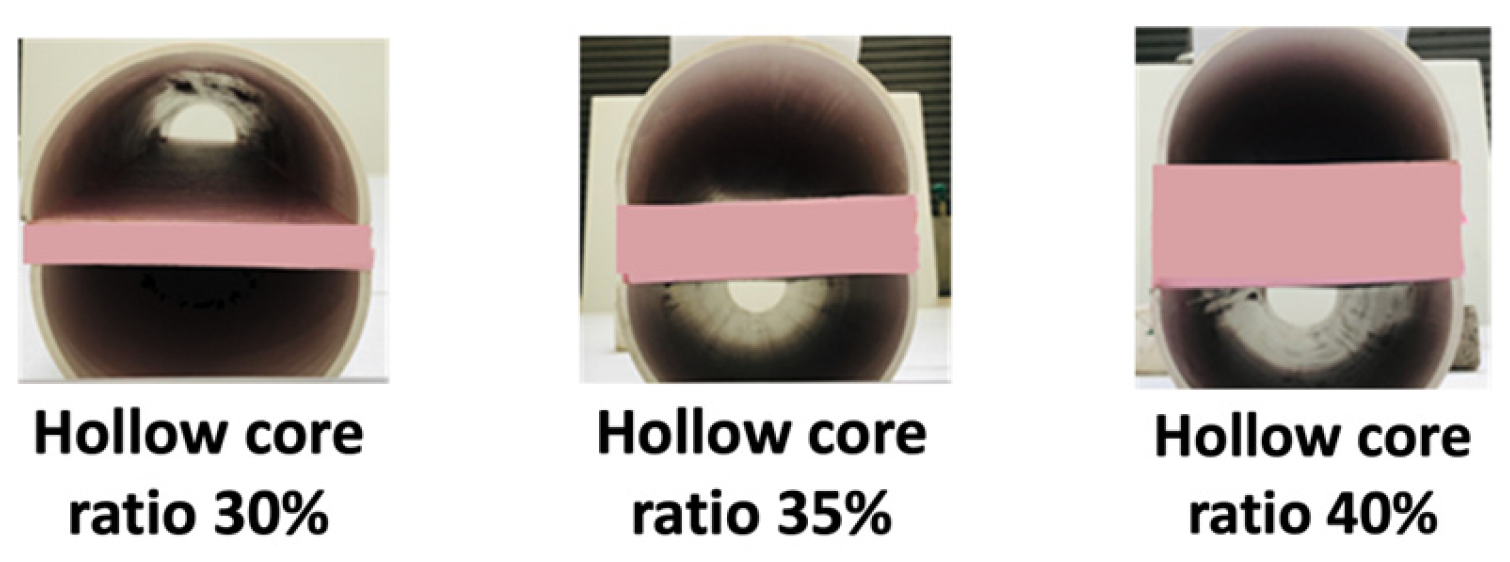
2.2.1. Specimen Design

This experimental study aims to systematically evaluate the effect of void ratio and shear reinforcement on the maximum shear capacity of the void slab system. To achieve this goal, two key variables were identified and investigated in this research: the hollo core ratio and shear reinforcement as shown in Table 1.
The first parameter quantifies the extent of the hollow core ratio with the slab, expressed as a percentage of the total slab volume occupied by void formers. It was manipulated by incorporating hollow tubes of varying volumes into the concrete, resulting in three distinct hollow core ratios of 30, 35 and 40%. The second variable investigated was the type of shear reinforcement with different angles. Three distinct categories were employed in this study as shown in Figure 1. The first specimen likely refers to the specimens without dedicated shear reinforcement, relying solely on the concrete’s inherent shear capacity. The 45° shear reinforcement specimens in this group incorporated shear reinforcement bars inclined at a 45° angle relative to the horizontal plane. The spacing of these bars was maintained at 190 mm centre-to-centre. The 90° shear reinforcement category involved specimens with shear reinforcement bars placed perpendicular to the horizontal plane (i.e., 90° inclination). The spacing of these bars was set at 135 mm centre-to-centre.

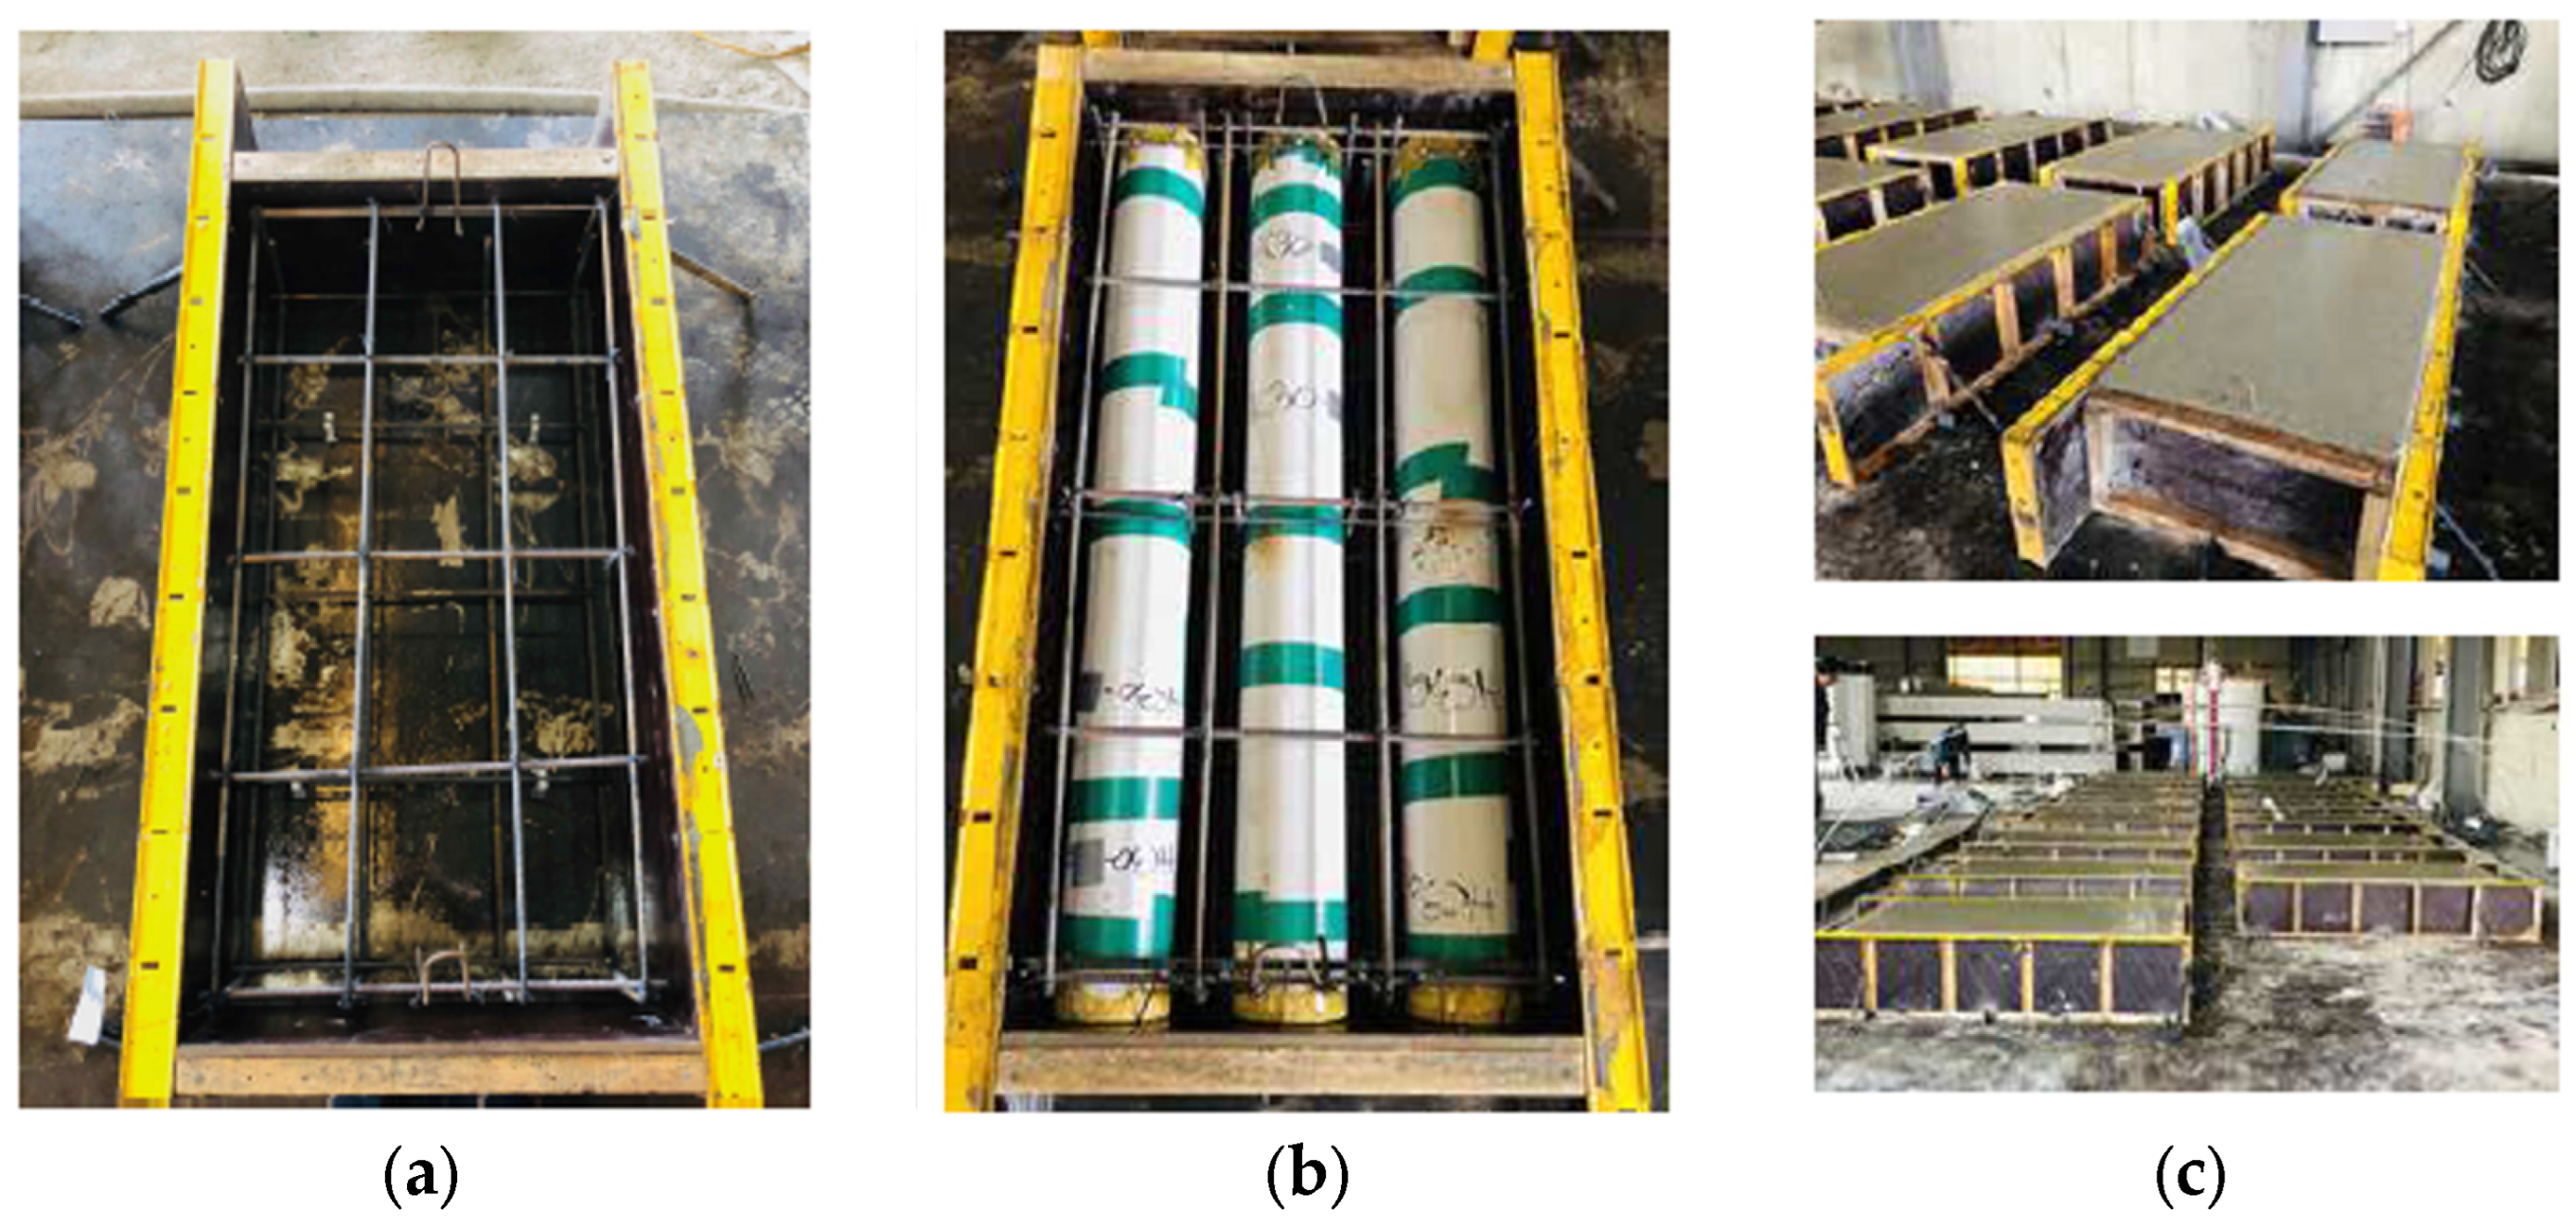
2.2.2. Fabrication of Void Slab for Test Specimens

The initial step in the test specimen preparation involved the creation of hollow cores tailed to the desired void ratio levels. These hollow cores served as the internal hollow core part within the void slab specimens. The manufacturing process of the hollow core parts combining polyvinyl chloride (PVC) pipes and an Extruded Polystyrene Form named “Isopink” was employed. The PVC pipes with a consistent outer diameter of 140 mm were halved longitudinally for installing Isopink and the pipes as shown in Figure 2. To achieve the targeted void ratios for the specimens, varying thicknesses of Isopink inserts were placed between the halved PVC pipe sections. The specific Isopink thickness for each specimen was determined based on its designated hollow core level. Figure 2 illustrates the geometry of the Isopink inserts for the specimens.
After producing the void formers with PVC pipes and Isopink, the fabrication of the test specimens involved the following steps as described in Figure 3:
(1)
Formwork construction: plywood formwork was constructed to replicate the desired dimensions of the reinforced concrete void slabs.
(2)
Hollow core integration: during the reinforcement placement stage, as depicted in Figure 1, a hollow core, prefabricated according to the designated void ratio as described in Table 1 was strategically positioned within the formwork.
(3)
Rebar securing: to prevent the buoyancy of the fresh concrete from displacing the hollow core during the pouring process, additional fixing reinforcement bars were strategically placed. These bars ensured the hollow core remained in the intended position within the formwork.
(4)
Concrete placement and curing: once all reinforcement elements, including the fixing bars, were positioned as per the designated layout (see Figure 2), concrete was carefully poured into the formwork. Standard curing procedures were followed to ensure proper hydration and strength development of the concrete.

2.2.3. Material Properties of the Test Specimens

The concrete mixing design employed for the test specimens is presented in Table 2. Following the casting process stated above, the formwork was carefully removed after one week to allow for initial set and strength gain. The specimens then underwent a controlled curing period exceeding four weeks to ensure proper hydration and achieve the target mechanical properties. This extended curing duration promotes the complete development of the cementitious matrix, leading to a more accurate representation of the material behaviour during testing.
The concrete mixing design for the test specimens was formulated to achieve the target design compressive strength of 24 MPa. To verify compliance with this target, a separate concrete compressive strength confirmation test was carried out. As shown in Figure 4, cylindrical concrete specimens were cast alongside the main test specimens and cured for a minimum of 28 days. Subsequently, these companion cylinders were tested for compressive strength using a universal material testing machine (UTM). The average compressive strength obtained from these cylinders was 24.999 MPa, demonstrating a satisfactory agreement with the design strength.
The test specimens employed a combination of reinforcing bar diameters and yield strengths to achieve the desired performance. D10 bars (fy = 400 MPa) were chosen for both top and bottom main reinforcement due to their balance of strength and constructability within the hollow core geometry. D13 bars (fy = 400 MPa) were used for the primary bottom reinforcement to accommodate potentially higher demands in that region. D6 bars (fy = 300 MPa) served as dedicated shear reinforcement, offering sufficient shear capacity while maintaining workability during concrete placement. Tensile strength tests confirmed the suitability of the chosen reinforcement, exceeding the specified yield strengths for all bar diameters (see Table 3). This verification ensures the reinforcement’s ability to perform as intended during the experimental program.

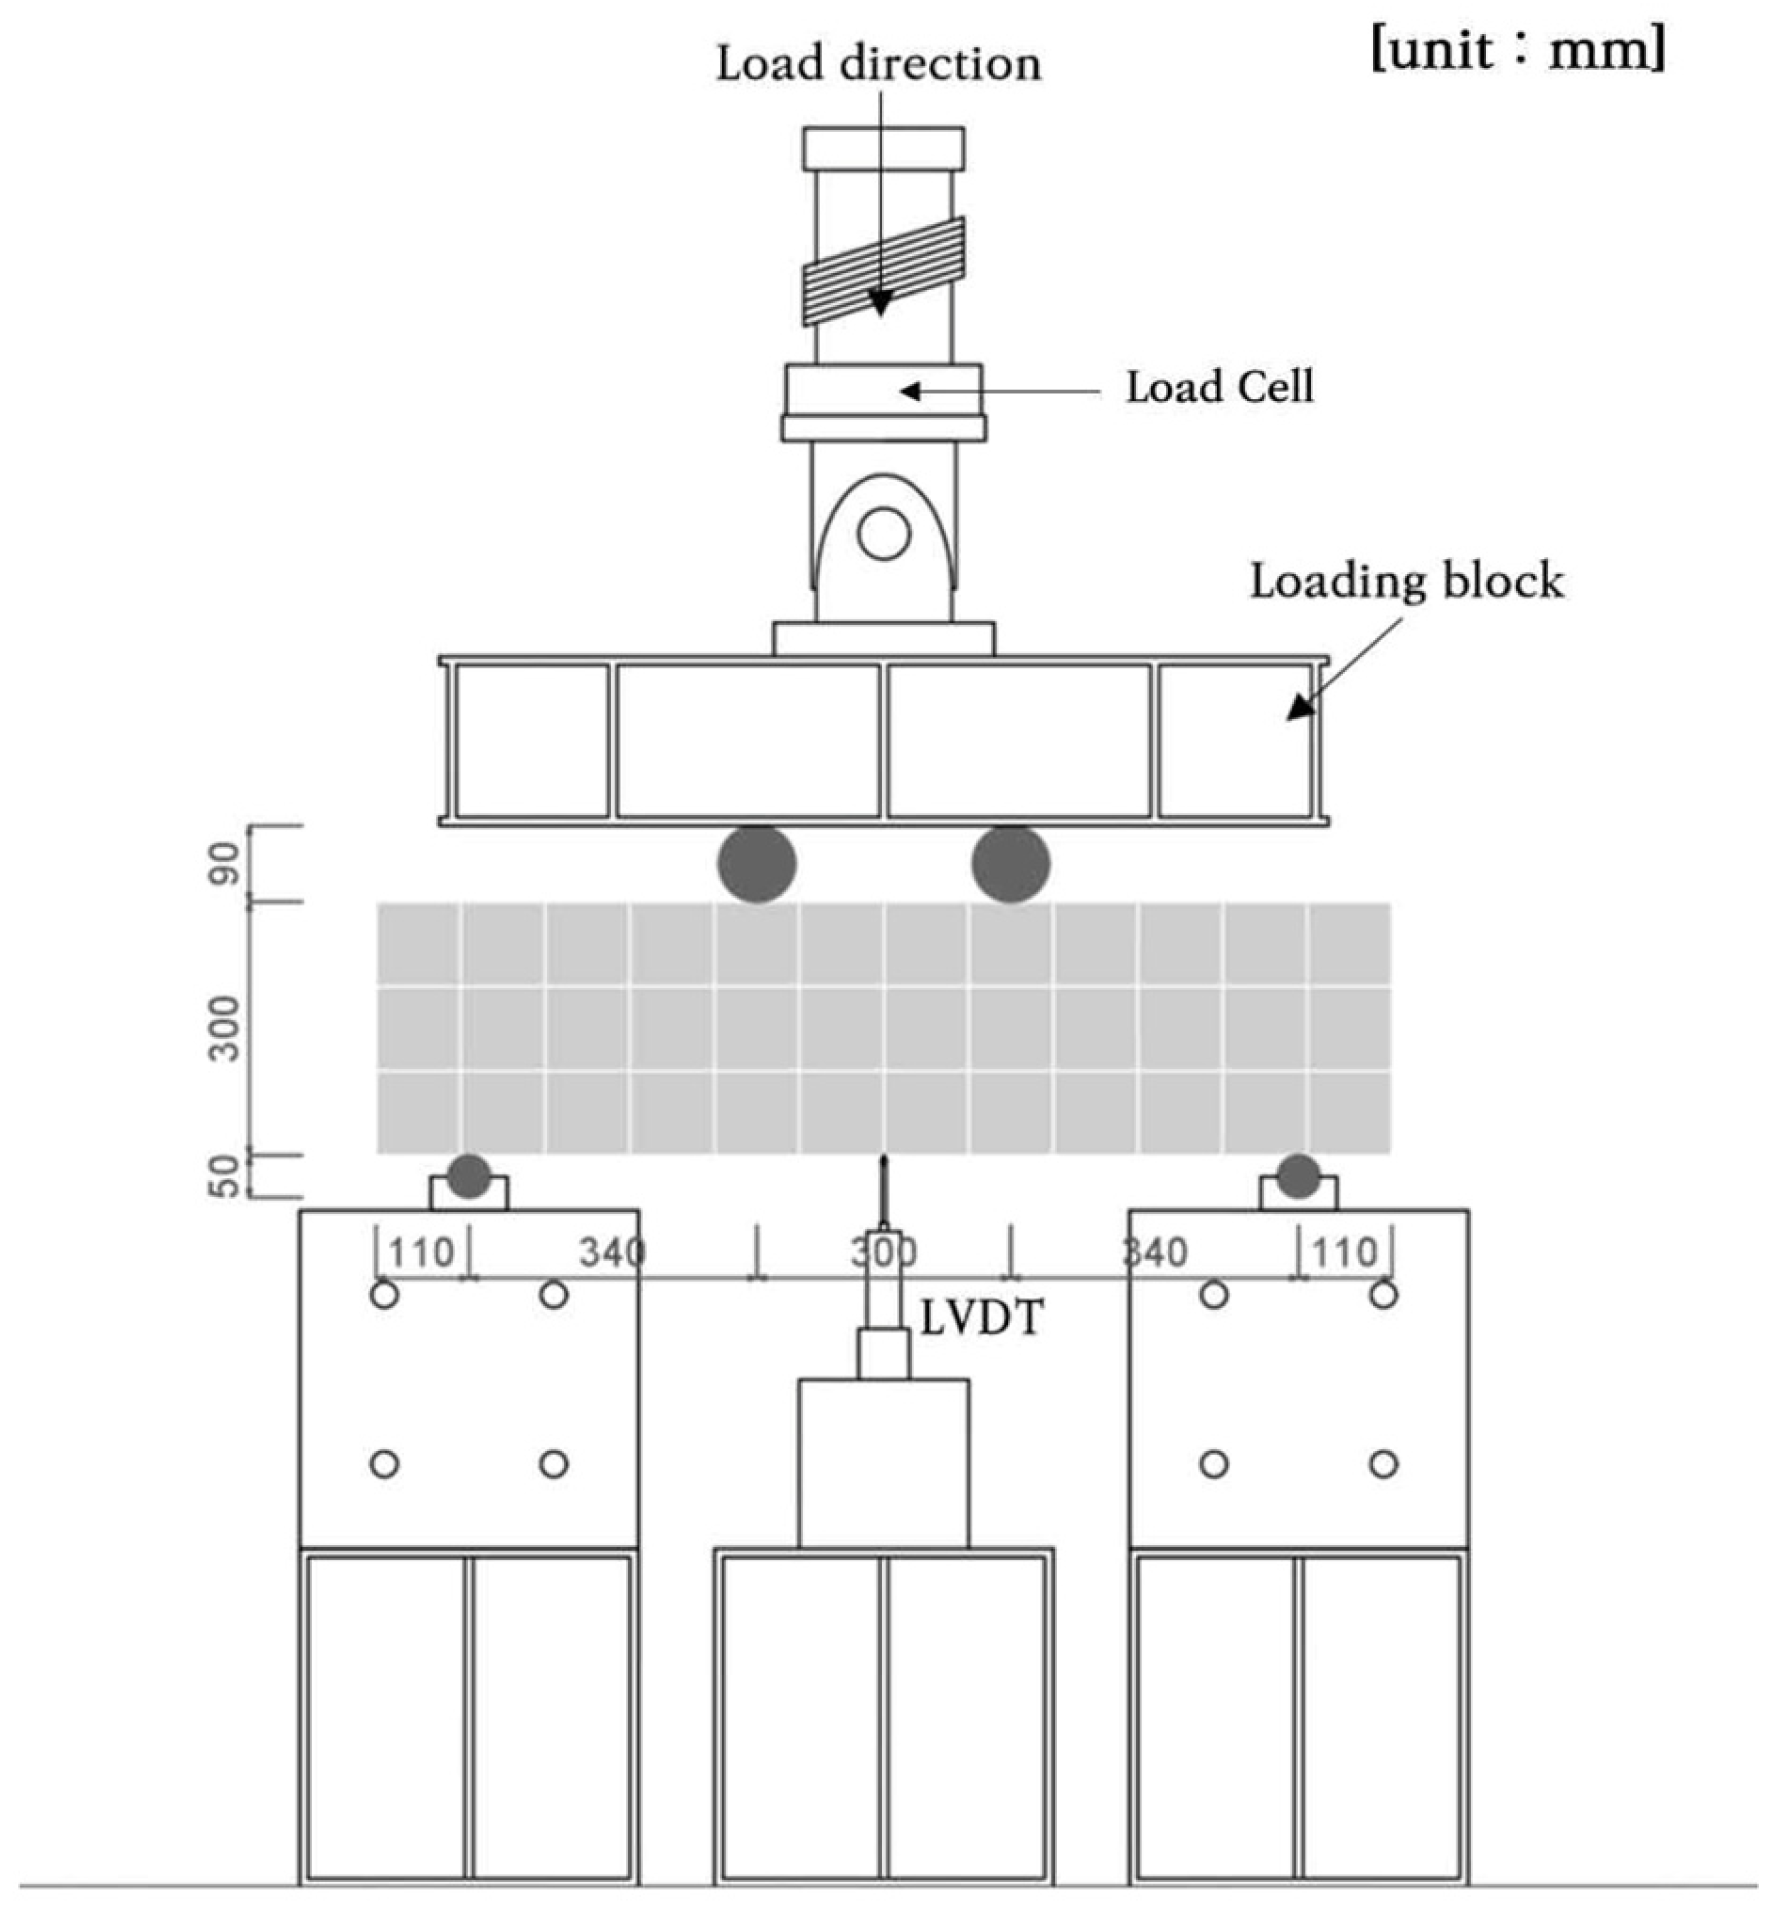
2.3. Test Setup and Instrumental for Shear Performance Evaluation

A four-point bending test configuration was employed on a 500 kN capacity universal testing machine (UTM) with a maximum stroke of 300 mm to assess the shear behaviour of the specimens. The load was applied under displacement control at a constant rate of 3 mm/min using a screw-driven loading mechanism. The upper loading points, acting as hinges that directly transmit load to the specimen, were positioned 150 mm from the specimen’s centre. The lower support points, also acting as hinges, were located 110 mm from each end of the specimen. To capture the deflection behaviour, a linear variable displacement transducer (LVDT) was installed at the centre of the specimen’s bottom surface, continuously monitoring the displacement as the centrally applied displacement increased as described in Figure 5.

3. Experimental Results and Analysis

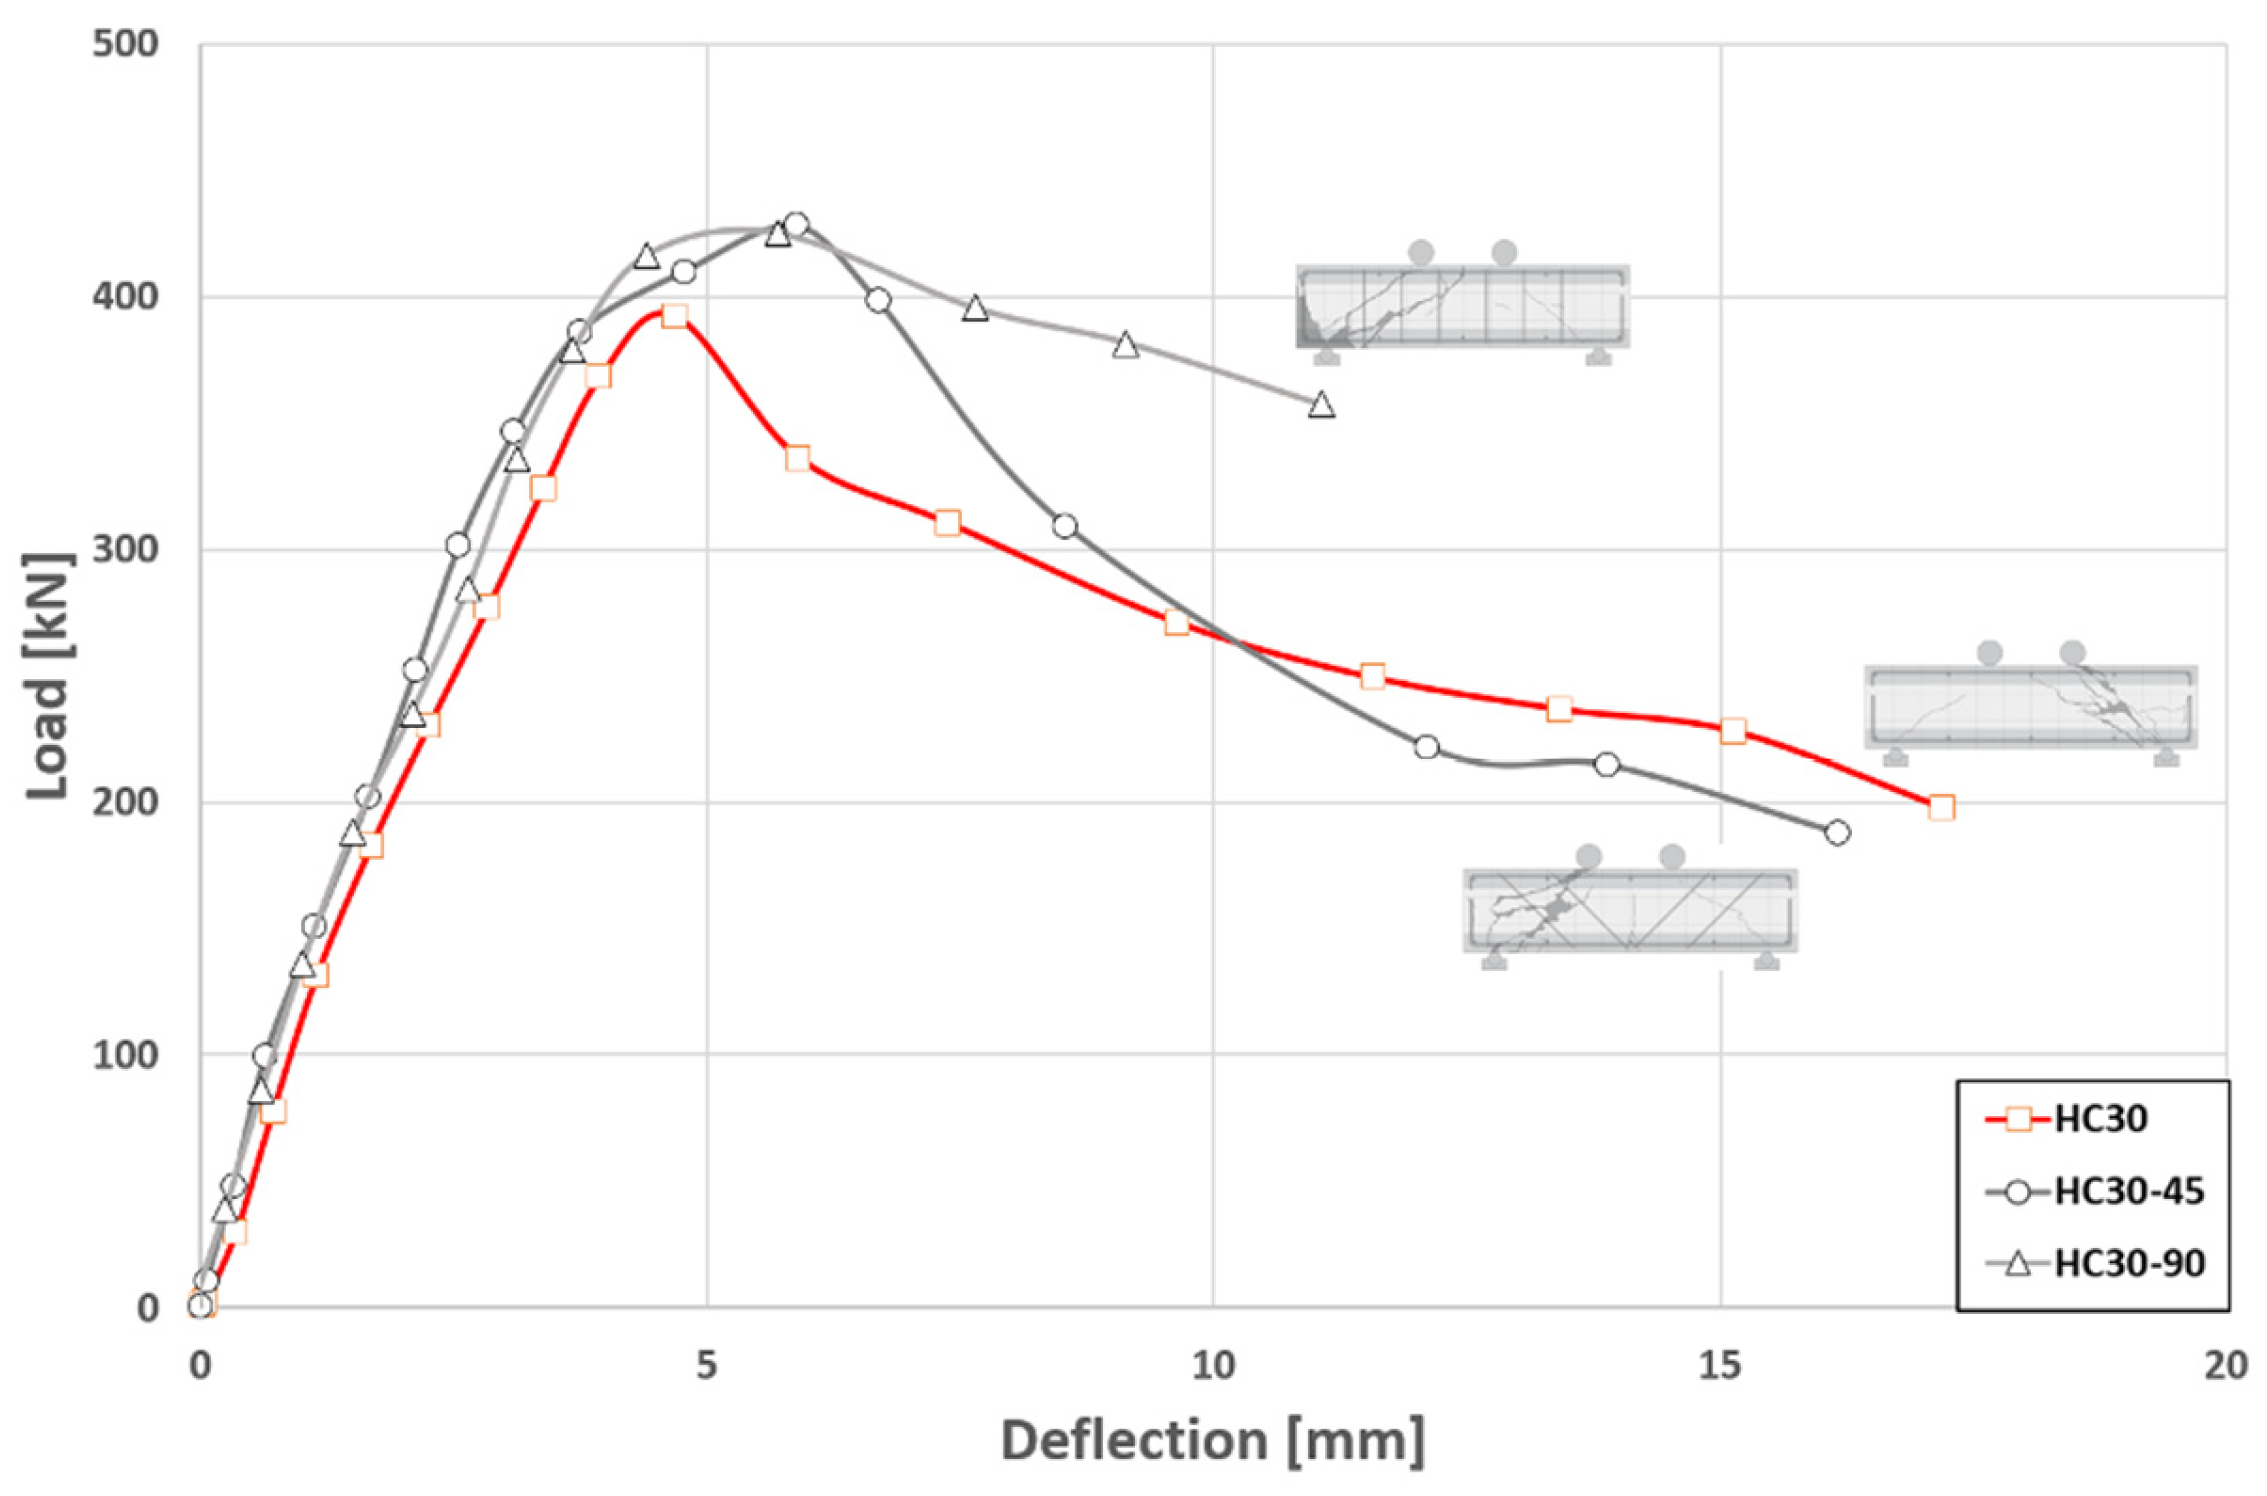
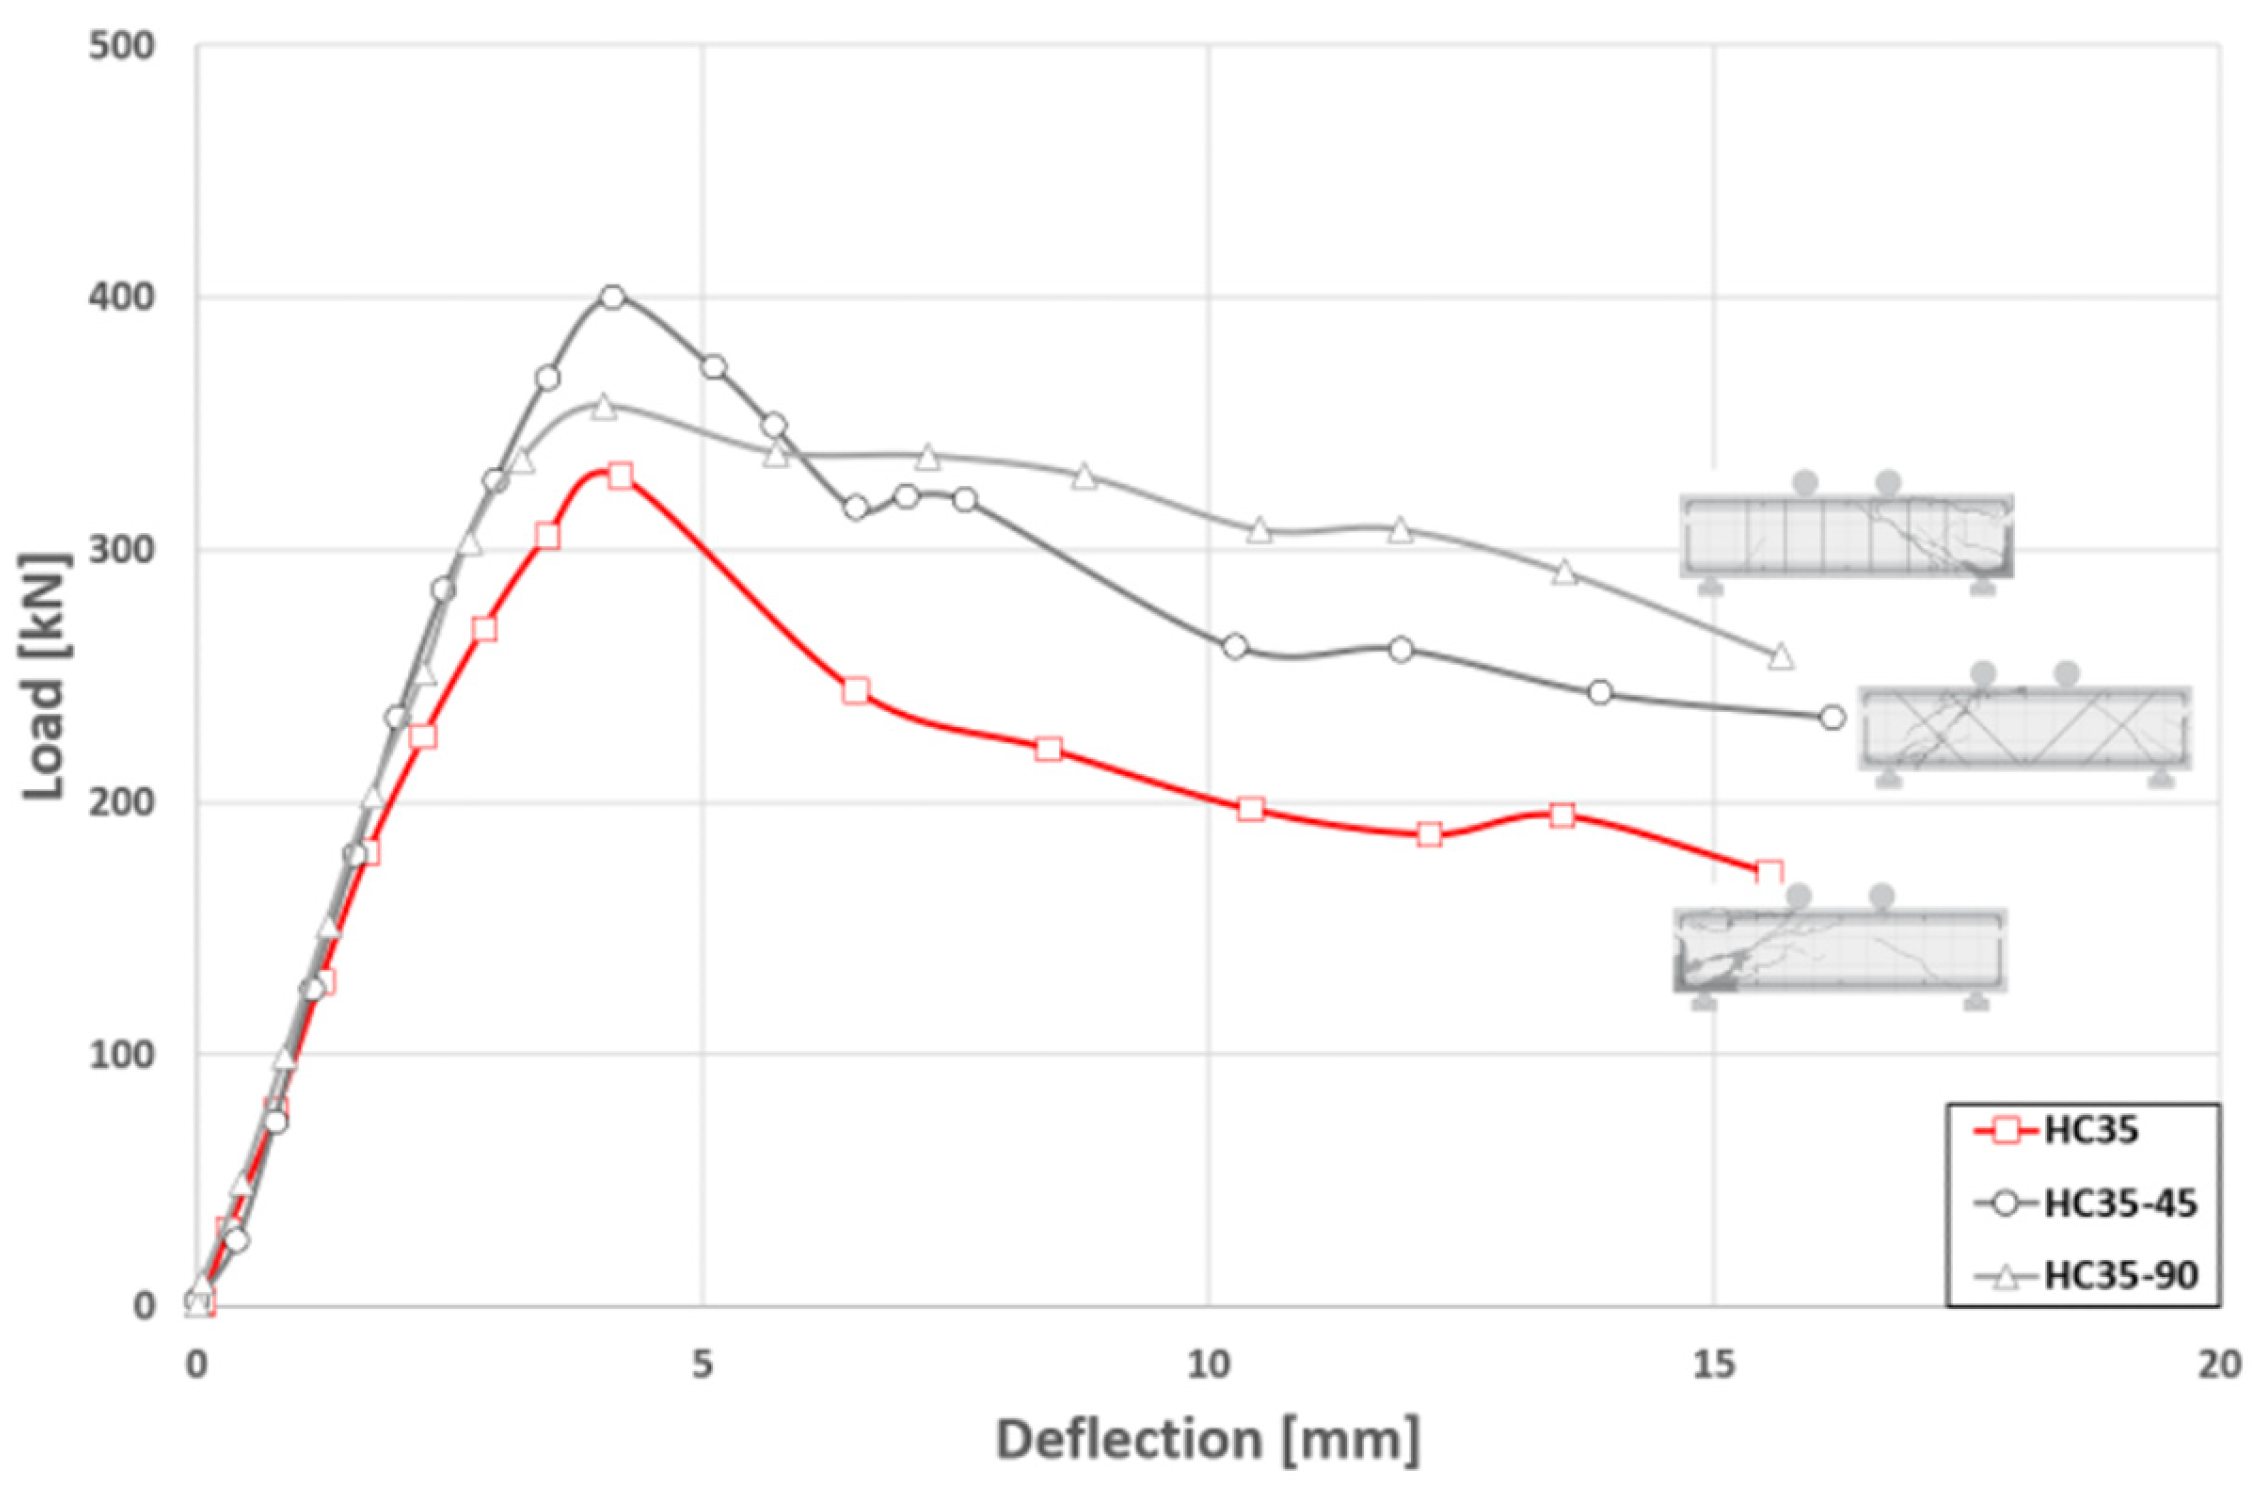
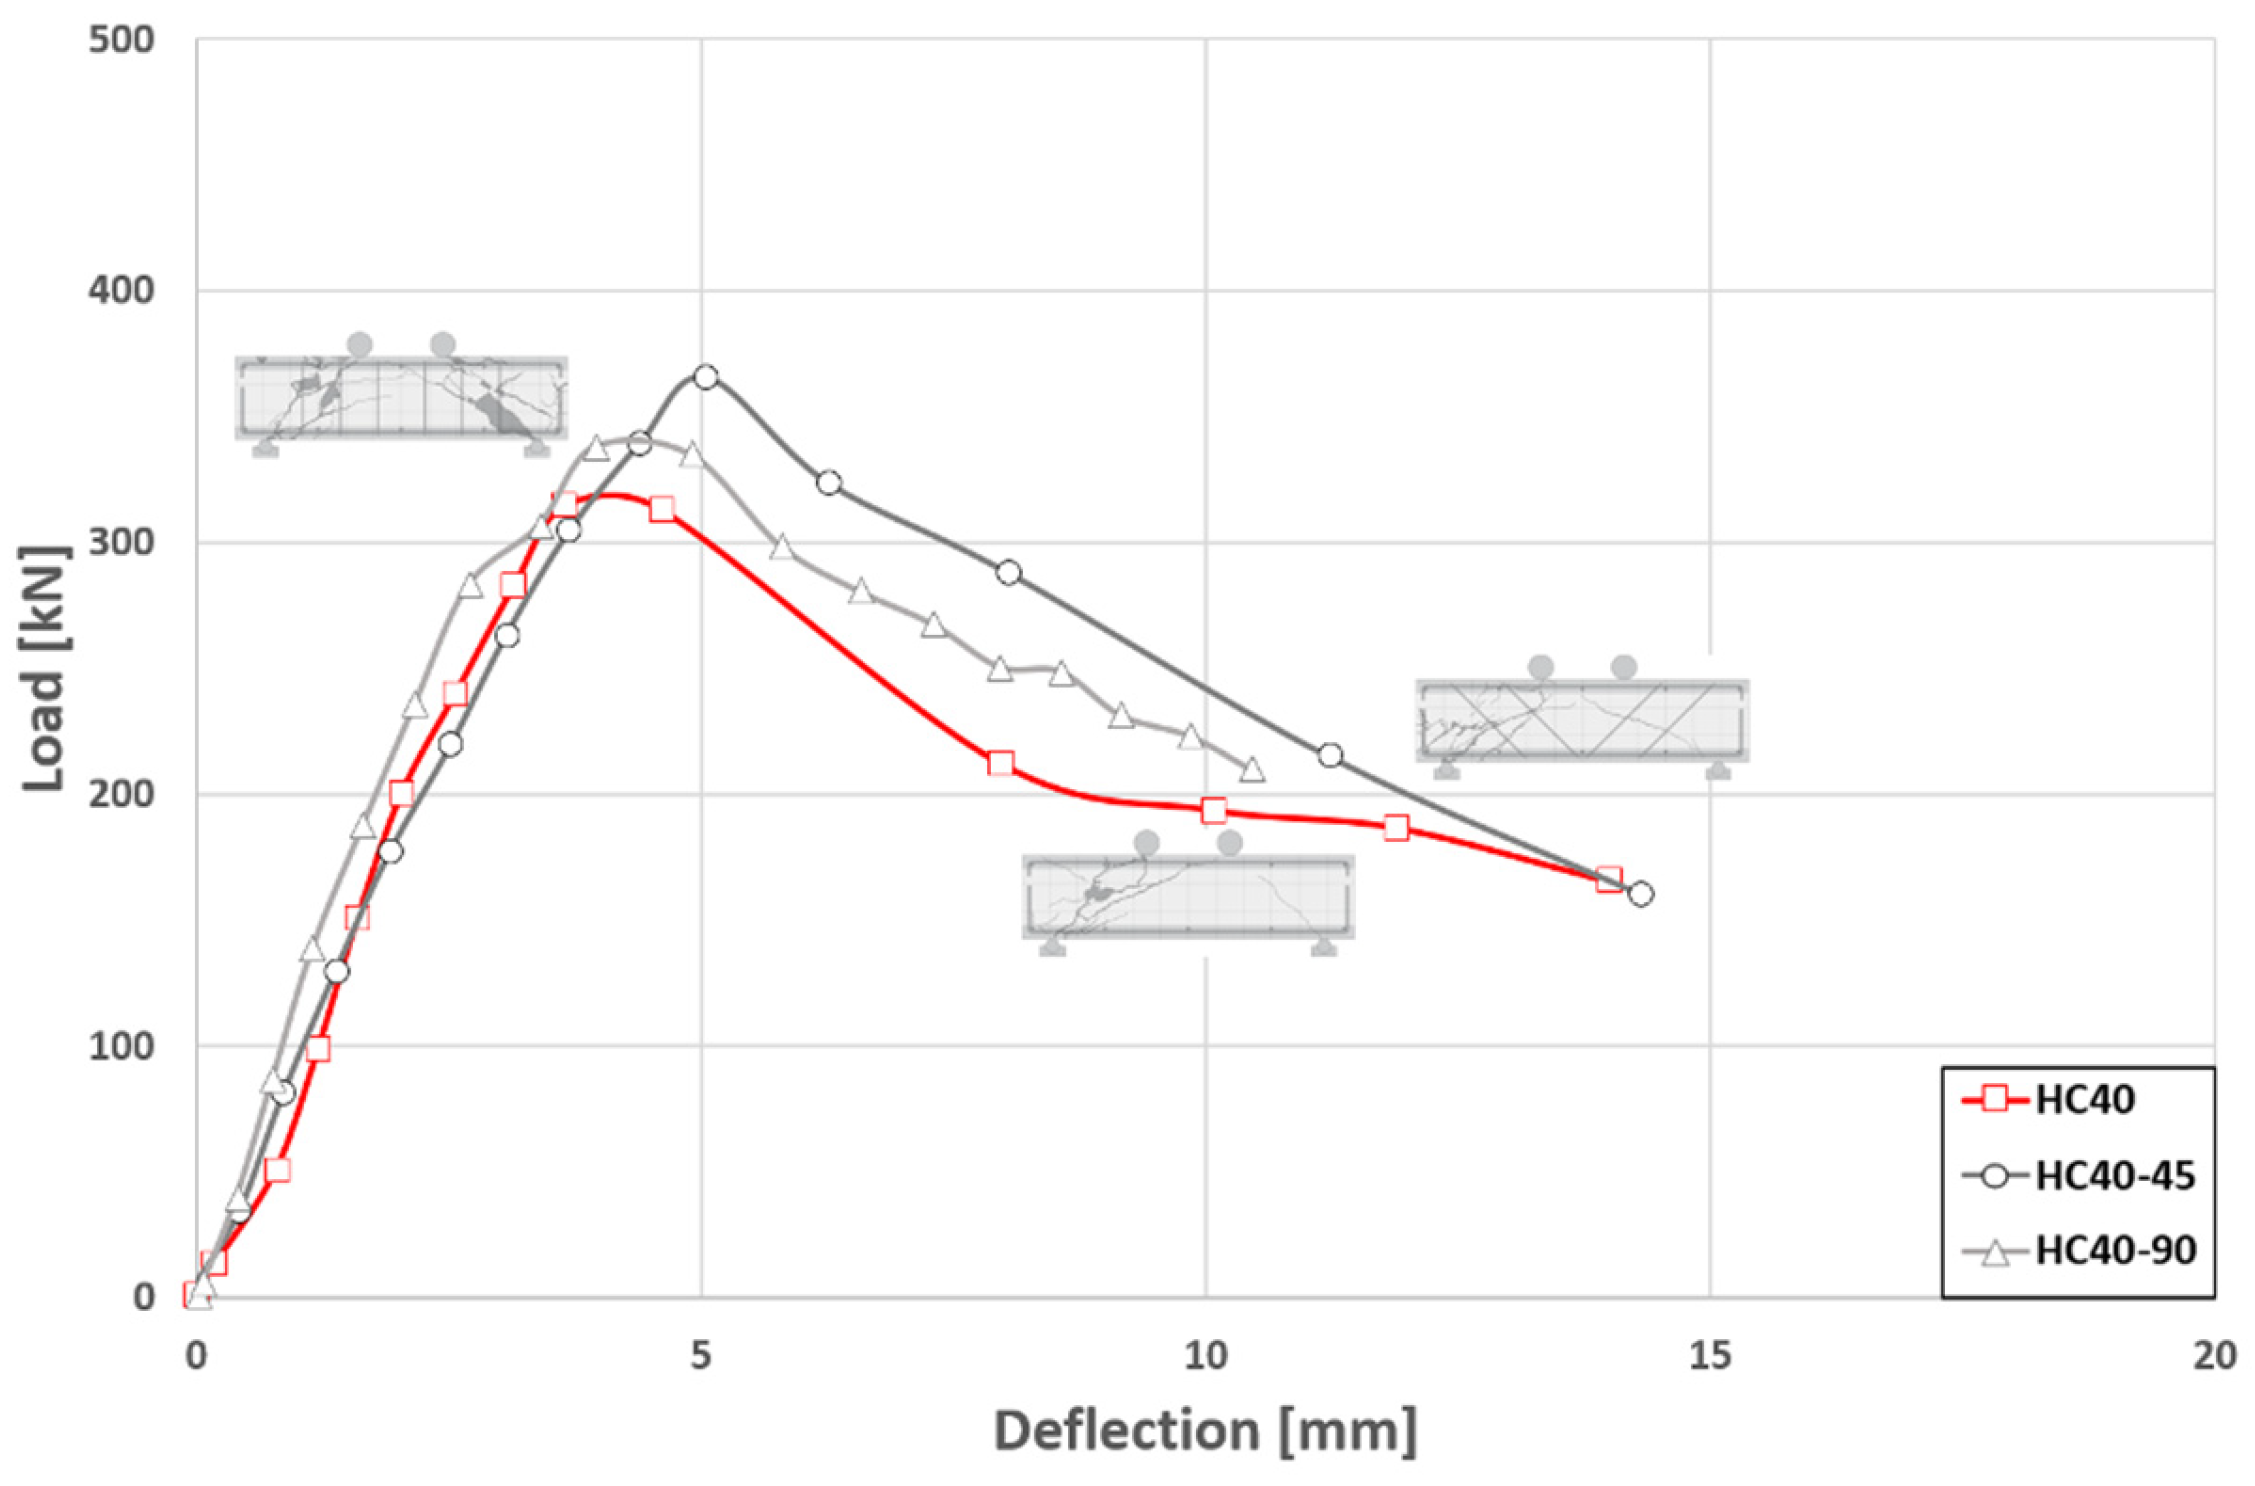
3.1. Load–Displacement Behaviours
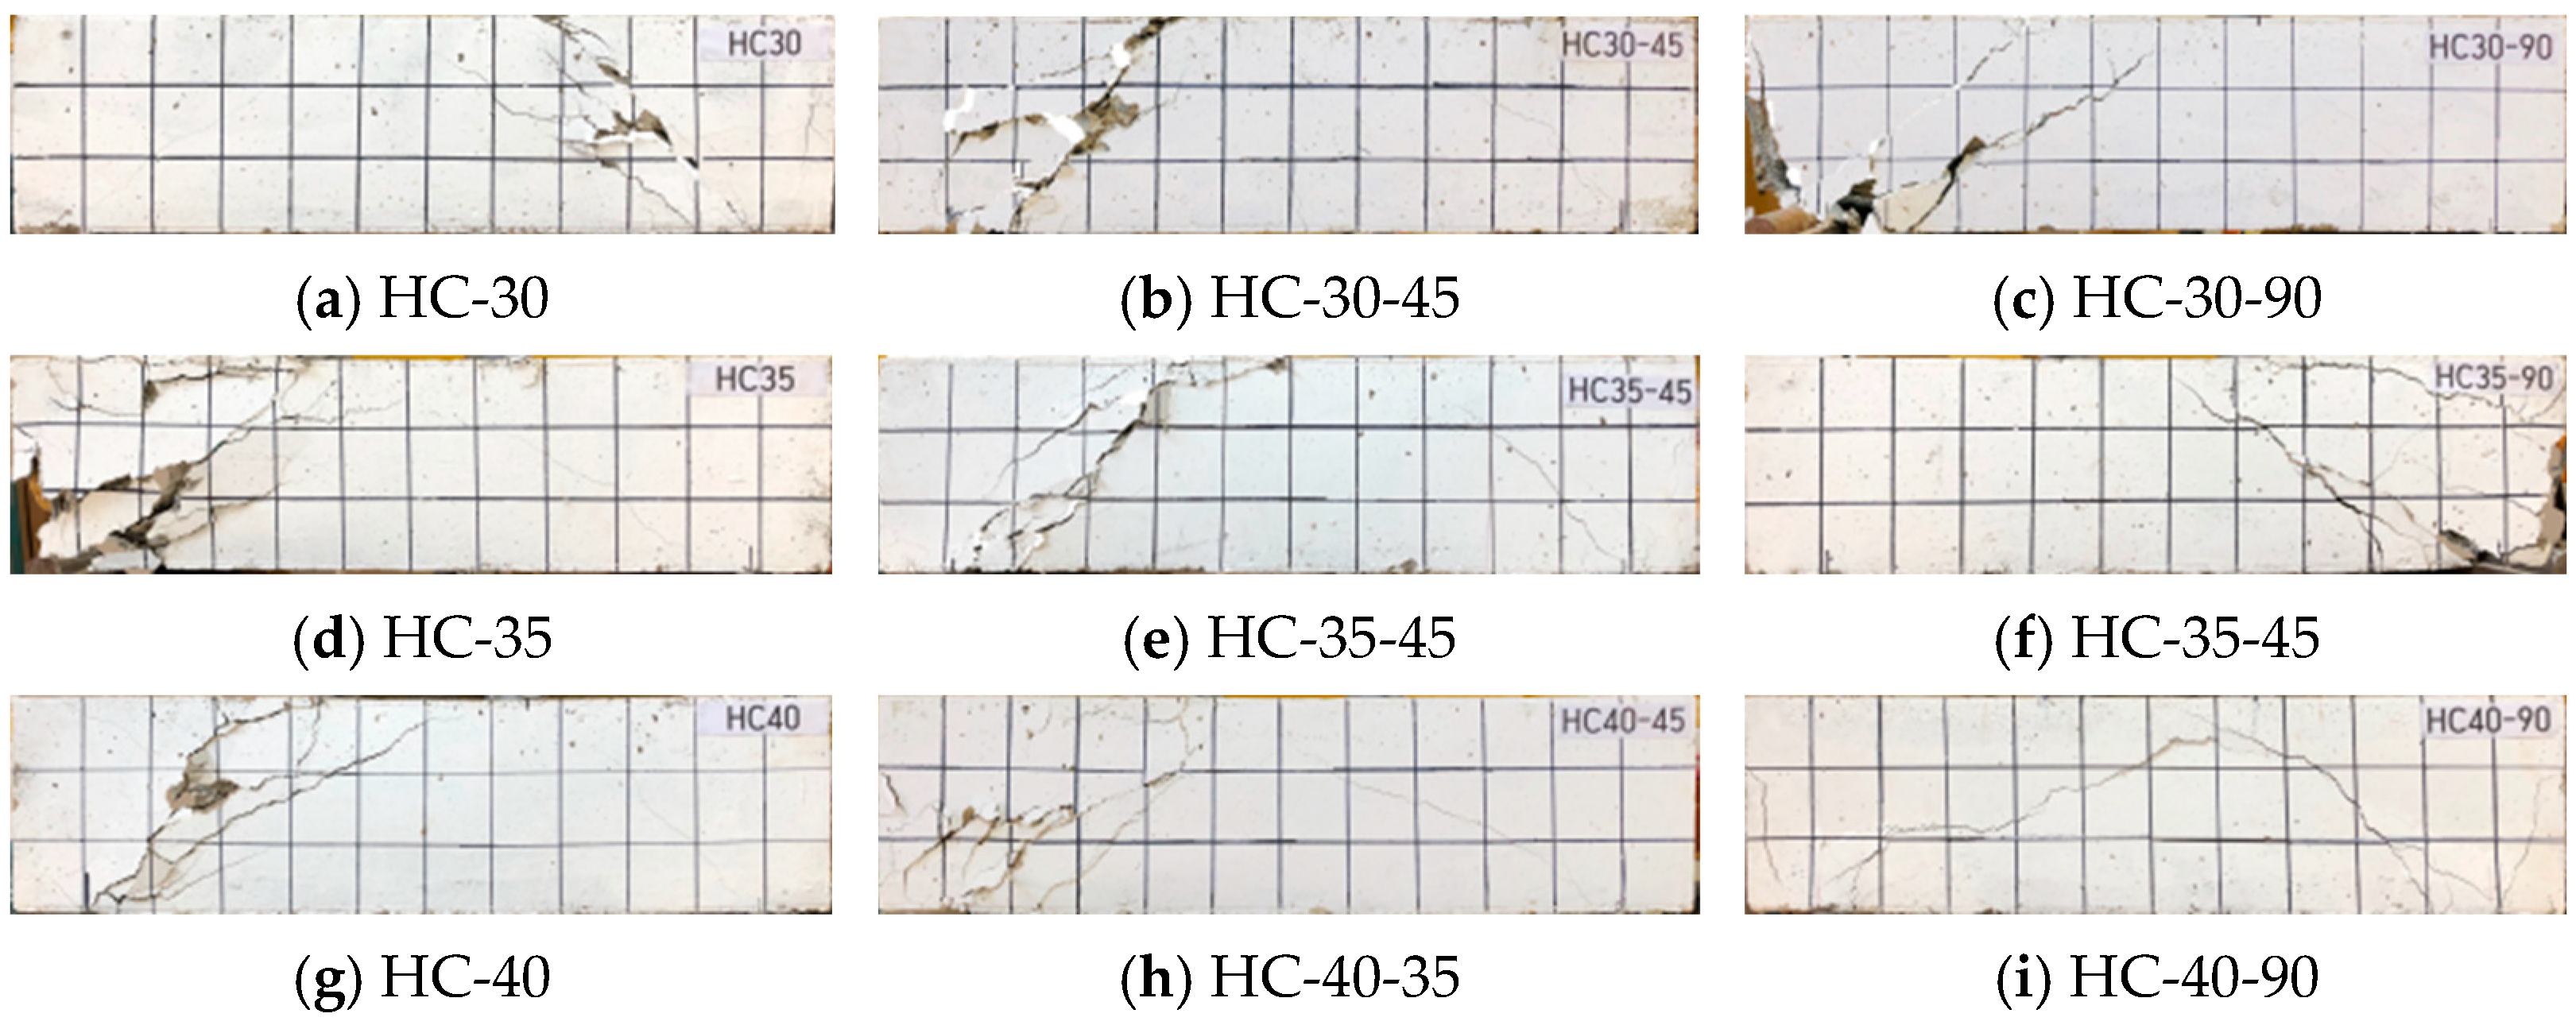
The load–displacement curves for each void slab specimen group are shown in Figure 6, Figure 7 and Figure 8. Figure 6 presents the load–displacement curves for specimens with a 30% void ratio. These curves exhibit a characteristic shear failure pattern, evident in the rapid decrease of the slope after reaching the peak shear strength. This behaviour is consistent across all specimens with the same hollow core ratio, indicating uniformity in their failure mode.
Similar shear failure patterns were observed in specimens with higher hollow core ratios (35% and 40%). Figure 7 and Figure 8, respectively, illustrate the load–displacement curves for these specimens. As with the 30% hollow-core ratio group specimens, these curves display a pronounced decrease in slope following the achievement of peak shear strength. This consistency across different void ratios strengthens the suggestion of a potential trend, where increasing hollow core ratios might influence the failure mechanism of the void slabs.
In the load–displacement curves presented in Figure 8, the results demonstrate a consistent shear failure pattern across all tested hollow core ratios (30%, 35%, and 40%). This behaviour, characterised by a rapid decrease in slope after peak shear strength is reached, indicates a potential influence of the hollow core ratio on the failure mechanism of the void slabs.

3.2. Crack Patterns

Figure 9 presents photographs of the post-test crack patterns observed on the front faces of the test specimens. These photographs were captured immediately following the completion of the experiments. It is important to note that the crack diagrams within the figure were generated using image editing software (e.g., Photoshop (version 25.0)) to virtually flatten the curved surfaces of the specimens for clearer visualization of the crack paths. Overall, as the experiment progressed, a bending crack occurred near the centre of the experiment, and the specimen fractured in the form of a sinusoidal crack. Analysis of these crack diagrams reveal the presence of shear cracks in all specimens and furthermore supporting the conclusions drawn from the load–displacement curves regarding the dominant shear failure mode.
The experimental results for maximum shear capacity were compared with the anticipated shear capacity predicted by the design code equation employed during specimen development (Section 2.1.1). The expected shear strength was calculated in accordance with the detailed formula provided in ACI 318-14 [39]. Table 4 summarizes the results, listing the specimen designation, expected shear capacity (calculated), and the ratio of these two values. Notably, all test specimens exhibited a maximum shear strength exceeding the expected shear strength by a minimum factor of 1.436.
Figure 10 investigates the relationship between the hollow core ratio and shear capacity. Separate graphs are presented for specimens with and without dedicated shear reinforcement. Within each category, the graph is arranged with increasing hollow core ratios along the x-axis. As expected, the expected shear capacity (calculated based on ACI 318-14) exhibits a decreasing trend with an increasing hollow core ratio for the unreinforced specimens. This decrease can be attributed to the reduction in effective cross-sectional areas as the hollow core ratio increases. This observation highlights the potential vulnerability of the void slabs with higher hollow core ratios under shear loading conditions, particularly in the absence of dedicated shear reinforcement.
Figure 11 explores the influence of dedicated shear reinforcement on the shear behaviour of the specimens. It presents a comparison of the expected and maximum shear capacities for specimens with and without a 45-degree shear reinforcement. As observed in the figure, both the expected shear strength (calculated based on ACI 318-14) and the measured maximum shear strength exhibit a decreasing trend with increasing hollow core ratio for specimens with a 45-degree shear reinforcement. This observation suggests that while shear reinforcement can enhance the overall shear capacity compared to unreinforced specimens (refer to Figure 6), its effectiveness diminishes as the hollow core ratio increases.
Finally, Figure 12 explores the influence of the shear reinforcement angle on the shear behaviour. It presents a comparison between the behaviour of specimens with a 45-degree and 90-degree shear reinforcement, both having the same void ratio. Notably, the maximum shear strength appears to follow a logarithmic decrease for specimens with a 90-degree shear reinforcement, suggesting a potentially more pronounced reduction in capacity with increasing void ratios compared to the linear trend observed in specimens with a 45-degree reinforcement (see Figure 11). Further investigation is warranted to explore the specific mechanisms influencing this behaviour.

4. Performance Evaluation of Void Slab with Shear Reinforcement

4.1. Shear Capacity Evaluation Based on Standard Formulae in Different Codes

4.1.1. ACI 318-14

The expected shear strengths for all test specimens were calculated following the American Concrete Institute (ACI) design code procedures. Table 5 summarises the results, categorised by the type of shear reinforcement (unreinforced, 45-degree, and 90-degree) and the hollow core ratio:
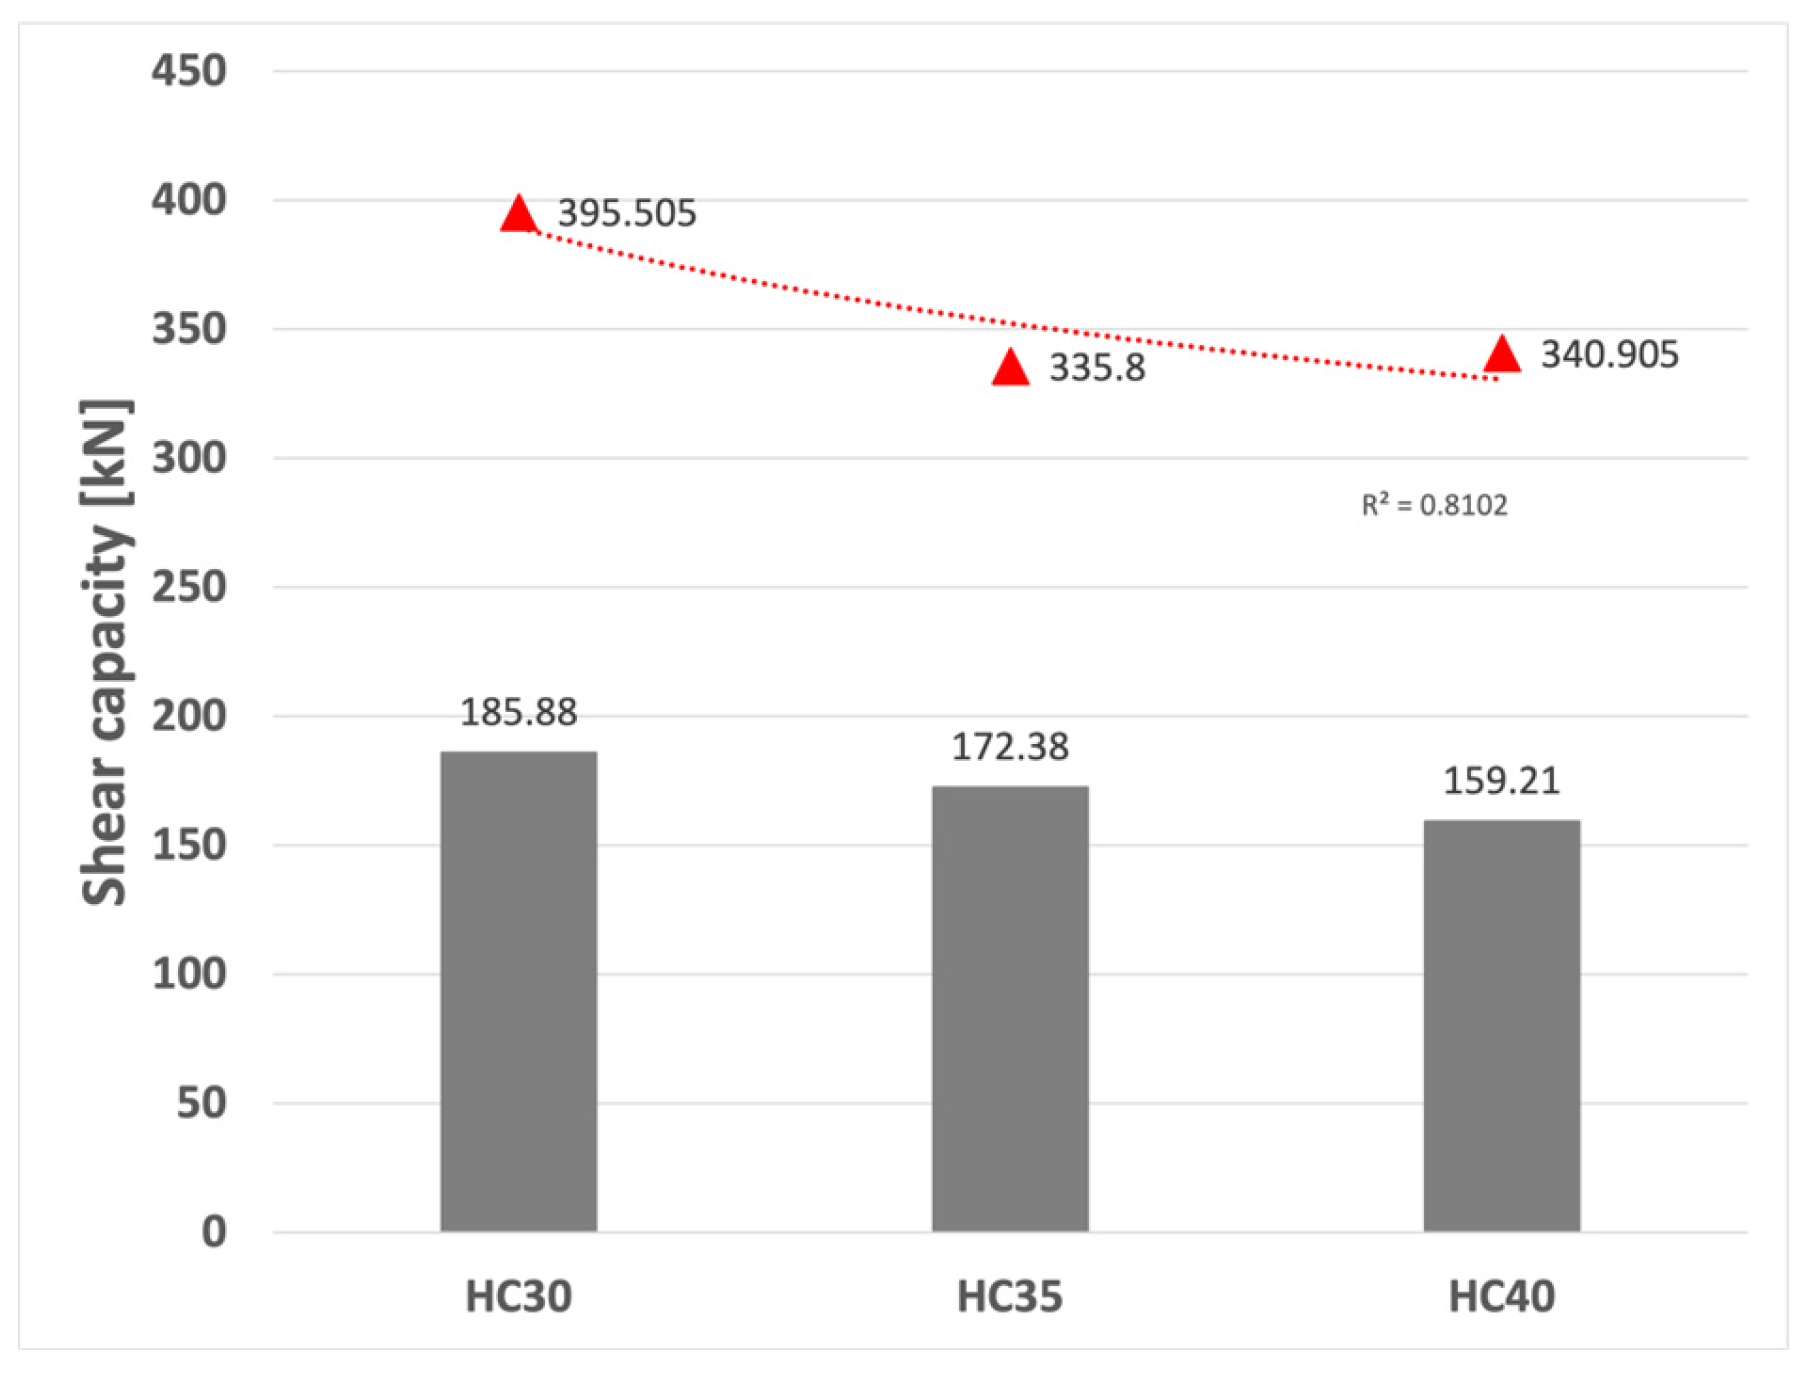
  • The expected shear strength of unreinforced specimens varied. It ranged from a minimum value of 1.95 for HC-35 (likely indicating a void ratio of 35%) to a maximum of 2.14 for HC-40 (likely indicating a hollow core ratio of 40%). On average, the expected shear strength for this group was 2.07. The data also showed some variation within the group, with a variance of 0.011 and a standard deviation of 0.107.
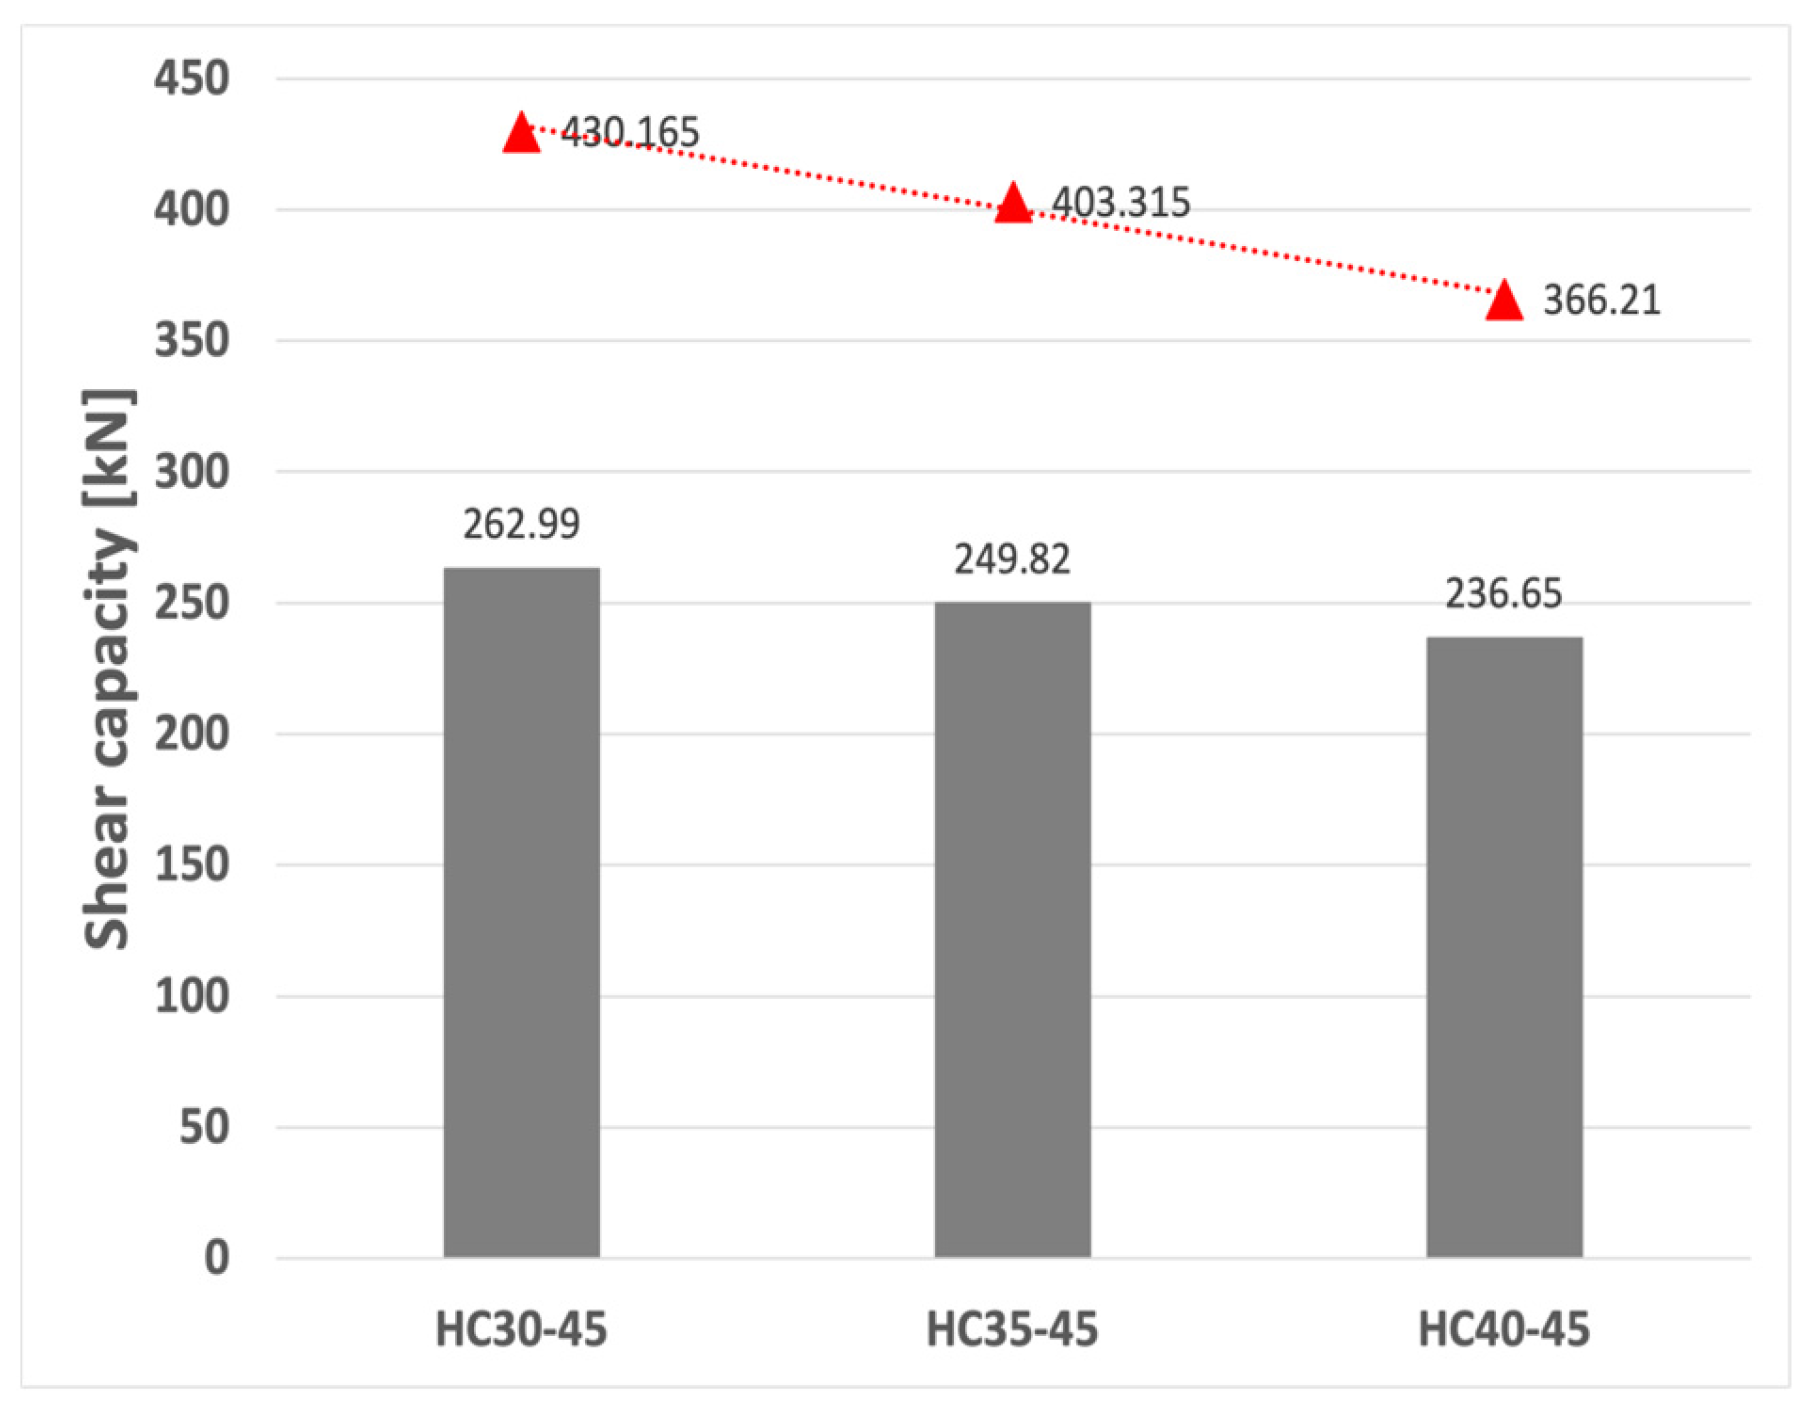
  • Specimens with a 45-degree shear reinforcement exhibited a clear benefit in terms of consistency compared to unreinforced specimens. This group displayed a noticeably narrower range of expected shear strengths, varying from a minimum of 1.55 to a maximum of 1.64. Additionally, the average expected shear strength for the 45-degree group was 1.60.
  • This improved consistency is further supported by the lower variance (0.002) and standard deviation (0.046) observed in the data. These reduced values suggest that a 45-degree shear reinforcement helps to achieve more predictable results in terms of expected shear strength.
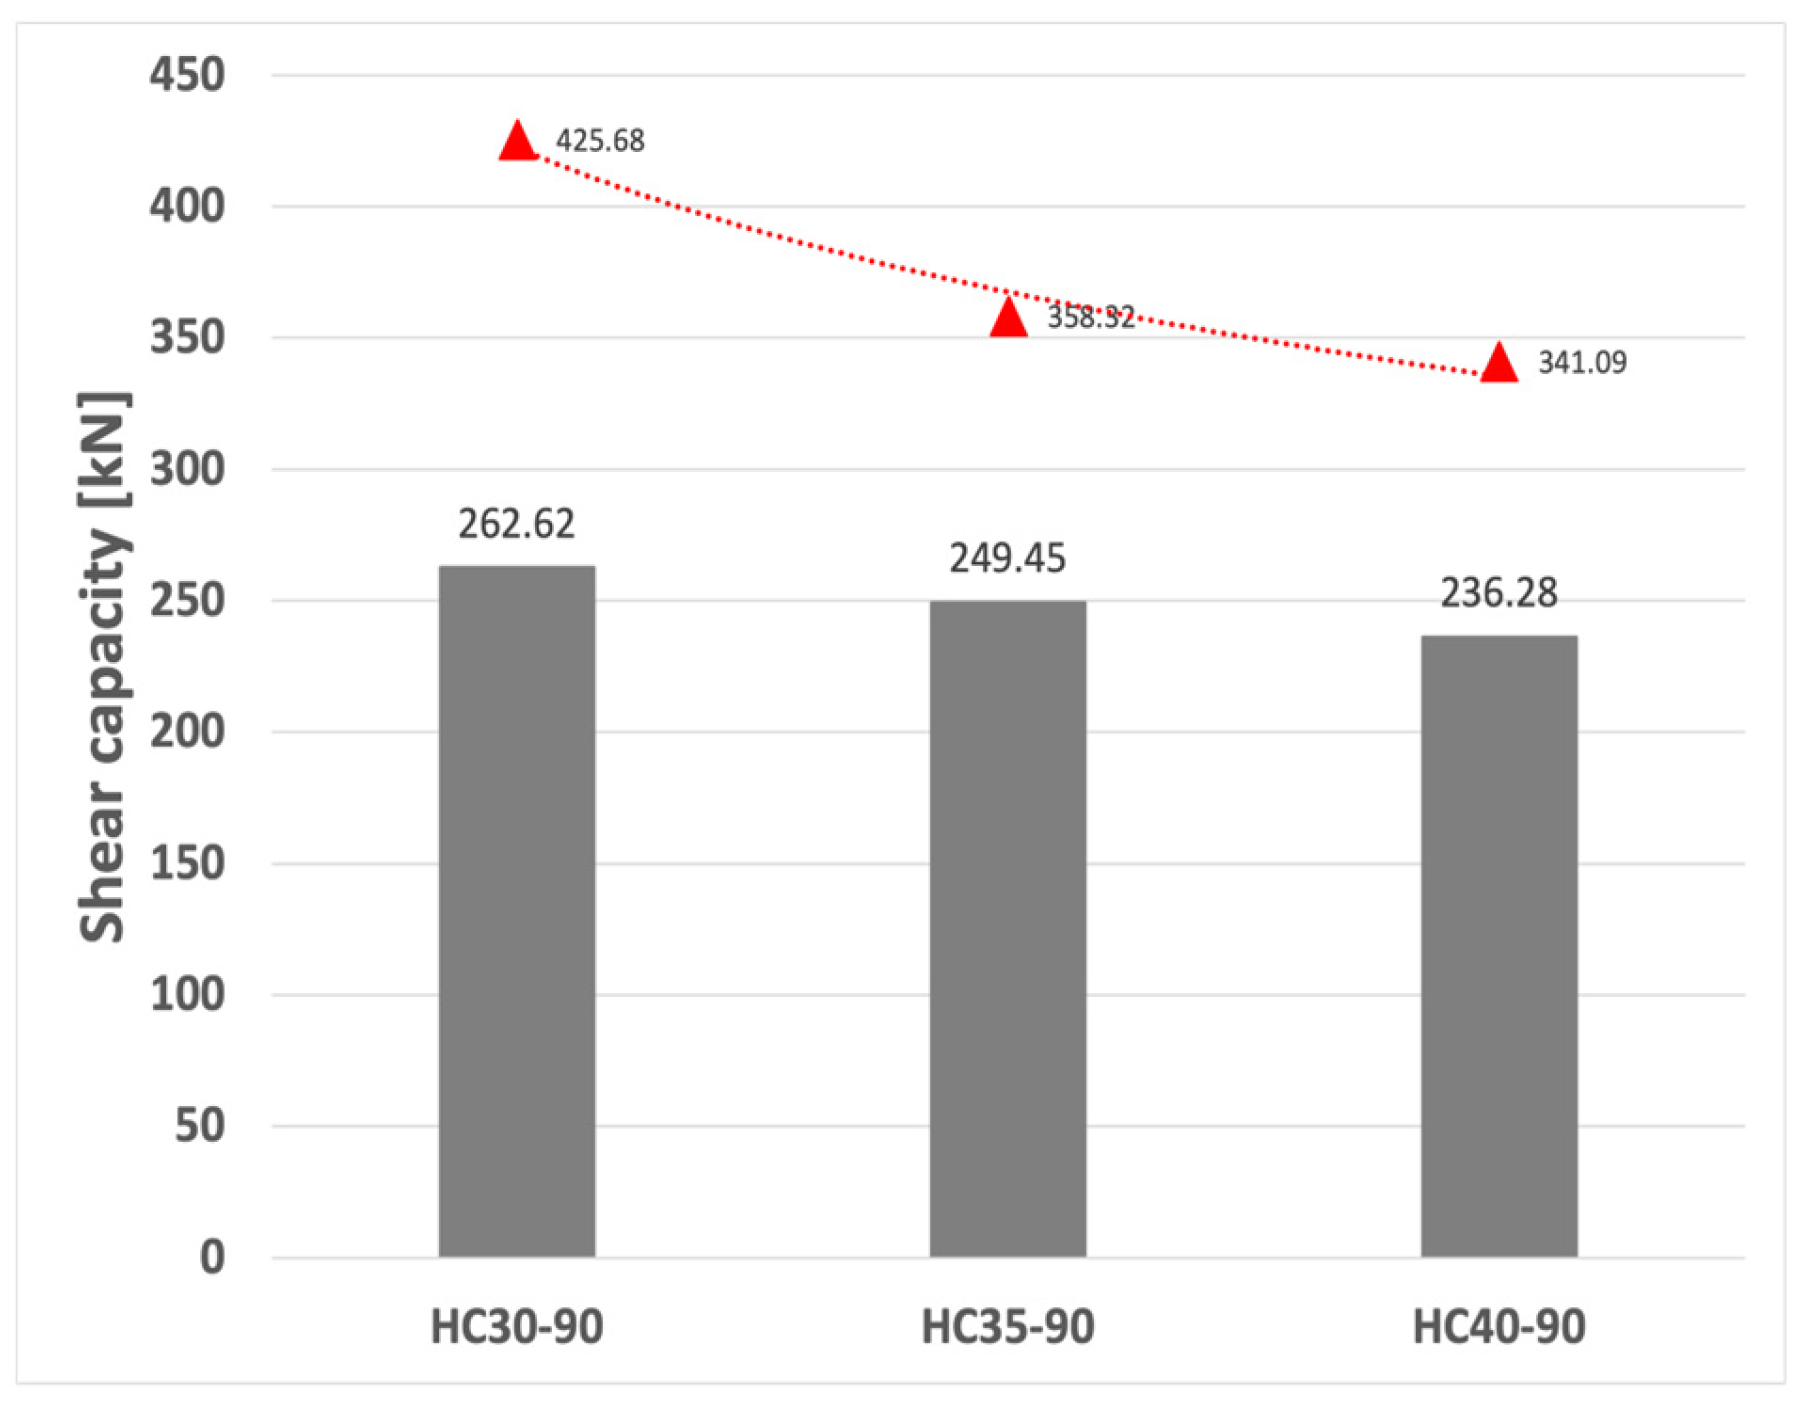
  • Similar to the unreinforced specimens, the expected shear strength of specimens with a 90-degree reinforcement also varied based on void ratio. The minimum value observed was 1.44 for both HC-35-90 and HC-40-90 (likely indicating void ratios of 35% and 40%, respectively). This value increased to a maximum of 1.62 for HC-30-90 (likely indicating a void ratio of 30%).
  • The average expected shear strength for the 90-degree group was 1.50, with a variance of 0.011 and a standard deviation of 0.104. While a 90-degree reinforcement may not entirely eliminate the influence of the void ratio, these findings suggest it can offer some improvement in achieving more consistent shear strength compared to unreinforced specimens.

4.1.2. UBC 2

The expected shear strengths for all test specimens were calculated following the Uniform Building Code 2 (UBC 2) design code procedures, commonly used in the western United States. Table 5, Table 6 and Table 7 summarise the results, categorised by the type of shear reinforcement (unreinforced, 45-degree, and 90-degree) and the hollow core ratio:
  • Building upon the findings from the ACI code analysis (Section 4.1.1), unreinforced specimens continued to exhibit a range of expected shear strengths. This variation spanned from a minimum value of 1.97 for HC-35 (void ratio of 35%) to a maximum value of 2.16 for both HC-40 and HC-30 (void ratios of 40 and 30%, respectively). The average expected shear strength for this group was 2.10. Additionally, the variance and standard deviation were 0.012 and 0.11, respectively (See Table 6).
  • In contrast to the unreinforced specimens, those with a 45-degree shear reinforcement displayed a significantly narrower range of expected shear strengths. This range varied from a minimum of 1.56 to a maximum of 1.65. Notably, the average expected shear strength for this group was 1.60.
  • Furthermore, the variance (0.002) and standard deviation (0.046) were both considerably lower compared to the unreinforced group. These reduced values suggest a more consistent performance in terms of expected shear strength for specimens with a 45-degree reinforcement. This observation aligns with the findings from the ACI code analysis (Section 4.1.1), where similar trends were observed for 45-degree reinforced specimens.
  • Similar to the observations for unreinforced and 45-degree reinforced specimens, the expected shear strength of specimens with a 90-degree reinforcement also exhibited variations based on the hollow core ratio. The minimum value was 1.45 for both HC-35-90 and HC-40-90 (void ratios of 35 and 40%, respectively). This value increased to a maximum of 1.63 for HC-30-90 (void ratio of 30%).
  • The average expected shear strength for the 90-degree group was 1.51, with a variance of 0.011 and a standard deviation of 0.104. These findings suggest that the hollow core ratio remains a factor influencing expected shear strength even with a 90-degree reinforcement.

4.1.3. CEB-FIP 1990

The expected shear strengths for all test specimens were calculated following the CEB-FIP Model Code 1990 design procedures, established by the International Federation for Structural Concrete (fib). Table 7 summarises the results, categorised by the type of shear reinforcement (unreinforced, 45-degree, and 90-degree) and the hollow core ratio.
Unreinforced specimens displayed a variation in their expected shear strengths. The minimum value observed was 1.94 for HC-35 (the hollow core ratio of 35%), while the maximum value reached 2.16 for HC-30 (the hollow core ratio of 30%). The average expected shear strength for this group was 2.06. Additionally, the variance and standard deviation were 0.012 and 0.111, respectively.
In contrast to the unreinforced specimens, those with a 45-degree shear reinforcement exhibited a significantly narrower range of expected shear strengths. This range spanned from a minimum of 1.36 to a maximum of 1.49. Furthermore, the average value for this group was 1.43. Notably, the variance (0.004) and standard deviation (0.067) were both lower compared to the unreinforced group. These reduced values suggest a more consistent performance in terms of expected shear strength for specimens with a 45-degree shear reinforcement:
  • The results for 90-degree reinforced specimens presented an interesting observation. While they exhibited a wider range of expected shear strengths (1.41 to 1.63) compared to the 45-degree specimens, this range remained lower than that observed in the unreinforced group.
  • The average expected shear strength for the 90-degree specimens was 1.49, with a variance of 0.015 and a standard deviation of 0.124. These findings suggest that while a 90-degree reinforcement may not offer the same level of consistency as a 45-degree reinforcement, it still provides some improvement compared to unreinforced specimens.

5. Conclusions

This study investigated the shear performance of the void slabs reinforced with various configurations. The experimental program employed four-point support load testing to validate shear failure modes and assess the impact of different design codes on predicted shear capacity.
  • Shear failure confirmation: The planned void slab specimens, designed according to ACI 318-14 for shear, all exhibited shear failure during load testing. This failure mode was further corroborated through the analysis of load–displacement curves and crack patterns.
  • Enhanced shear capacity: All test specimens demonstrated a significant reserve of shear strength, exceeding the expected shear capacity calculated using ACI 318-14 by a minimum factor of 1.436. This observation suggests the potential for more efficient design approaches that capitalize on the actual shear resistance of these hollow slab configurations.
  • Hollow core ratio and shear strength: An inverse relationship was observed between the porosity of the unreinforced specimens and their maximum shear strength. Specimens with higher porosity generally exhibited lower peak shear resistance. This finding highlights the influence of void content on the overall shear performance of hollow slabs.
  • Comparative analysis of design codes: The expected shear strengths estimated using established design codes (ACI 318-14, UBC 2, and CEB-FIP 1990) were compared against the experimentally obtained maximum shear strengths. Among these codes, CEB-FIP 1990 demonstrated the closest agreement between predicted and actual shear capacity. This suggests that CEB-FIP 1990 may provide a more accurate representation of the shear behaviour for this specific type of hollow slab with shear reinforcement.
In addition, future research efforts could be directed toward a more comprehensive understanding of these shear-reinforced hollow slabs. One avenue would be to explore the influence of different shear reinforcement configurations, including alternative layouts and materials. This could provide valuable insights for optimizing shear performance and potentially lead to more efficient designs.
Additionally, developing and validating analytical models that capture the intricate interaction between the hollow core and the shear reinforcement would be crucial for achieving more precise predictions of shear capacity. Finally, evaluating the long-term behaviour of these slabs under sustained loads is essential for practical design considerations, as it would offer valuable information on their performance over time in real-world applications.
This study provides valuable insights into the shear behaviour of void slabs with shear reinforcement. The observed enhancement in shear capacity compared to code predictions highlights the potential for more efficient design strategies. The influence of porosity and the comparative analysis of design codes offer additional considerations for future design and research endeavours. By continuing to investigate the behaviour of these composite structures, engineers can develop optimized solutions for the safe and efficient utilization of hollow slabs in various construction applications.

Author Contributions

S.N. was responsible for research planning, experimentation, and system identification; S.C. contributed to research writing, reference research, and analysis research; J.H., conducted experiments and assisted with organising and analysing data. Each author played a crucial role in the success of this study, and their contributions are greatly appreciated. All authors have read and agreed to the published version of the manuscript.

Funding

This research was supported by the Basic Science Research Program through the National Research Foundation of Korea (NRF) funded by the Ministry of Education (NRF-2021R1I1A1A01049977).

Data Availability Statement

The datasets generated and/or analysed during the current study are not publicly available due to confidentiality agreements with the construction companies involved in the study. This is to protect proprietary information and trade secrets pertaining to construction techniques, methodologies, and materials used, which could give these companies a competitive disadvantage if made public. However, they are available from the corresponding author upon reasonable request.

Conflicts of Interest

The authors declare no conflicts of interest.

References

  1. Cho, S.; Na, S. Evaluation of the Flexural Performance and CO2 Emissions of the Voided Slab. Adv. Mater. Sci. Eng. 2018, 2018, 3817580. [Google Scholar] [CrossRef]
  2. Ibrahim, I.; Elliott, K.; Abdullah, R.; Kueh, A.; Sarbini, N. Experimental study on the shear behaviour of precast concrete hollow core slabs with concrete topping. Eng. Struct. 2016, 125, 80–90. [Google Scholar] [CrossRef]
  3. Monisha, K.; Srinivasan, G. Experimental behaviour of prestress hollow core slab, RC hollow core slab and normal RC solid slab. Int. Res. J. Eng. Technol. 2017, 4, 1090–1093. [Google Scholar]
  4. Heo, S.; Na, S.; Choi, W. Serviceability Evaluation of High-Rise Buildings Exposed to Typhoon Proximity Effects Using ISO10137 and ISO6897. Buildings 2023, 13, 2119. [Google Scholar] [CrossRef]
  5. Teja, P.P.; Kumar, P.V.; Anusha, S.; Mounika, C.H.; Saha, P. Structural behavior of bubble deck slab. In Proceedings of the IEEE-International Conference on Advances in Engineering, Science and Management (ICAESM-2012), Nagapattinam, India, 30–31 March 2012. [Google Scholar]
  6. Muttoni, A. Punching shear strength of reinforced concrete slabs without transverse reinforcement. ACI Struct. J. 2008, 105, 440–450. [Google Scholar]
  7. Guandalini, S.; Burdet, O.; Muttoni, A. Punching tests of slabs with low reinforcement ratios. ACI Struct. J. 2009, 106, 87–95. [Google Scholar]
  8. Marí, A.; Bairán, J.; Cladera, A.; Oller, E.; Ribas, C. Shear-flexural strength mechanical model for the design and assessment of reinforced concrete beams. Struct. Infrastruct. Eng. 2015, 11, 1399–1419. [Google Scholar] [CrossRef]
  9. Alrousan, R.Z.; Bara’a, R.A. The influence of concrete compressive strength on the punching shear capacity of reinforced concrete flat slabs under different opening configurations and loading conditions. In Structures; Elsevier: Amsterdam, The Netherlands, 2022. [Google Scholar]
  10. Na, S.; Paik, I. Reducing greenhouse gas emissions and costs with the alternative structural system for slab: A comparative analysis of South Korea cases. Sustainability 2019, 11, 5238. [Google Scholar] [CrossRef]
  11. Elstner, R.C.; Hognestad, E. Shearing strength of reinforced concrete slabs. J. Proc. 1956, 53, 29–58. [Google Scholar]
  12. Zineddin, M.; Krauthammer, T. Dynamic response and behavior of reinforced concrete slabs under impact loading. Int. J. Impact Eng. 2007, 34, 1517–1534. [Google Scholar] [CrossRef]
  13. Huang, Y.; Grünewald, S.; Schlangen, E.; Luković, M. Strengthening of concrete structures with ultra high performance fiber reinforced concrete (UHPFRC): A critical review. Constr. Build. Mater. 2022, 336, 127398. [Google Scholar] [CrossRef]
  14. Pilakoutas, K.; Li, X. Alternative shear reinforcement for reinforced concrete flat slabs. J. Struct. Eng. 2003, 129, 1164–1172. [Google Scholar] [CrossRef]
  15. Paik, I.; Na, S. Comparison of carbon dioxide emissions of the ordinary reinforced concrete slab and the voided slab system during the construction phase: A case study of a residential building in South Korea. Sustainability 2019, 11, 3571. [Google Scholar] [CrossRef]
  16. Paik, I.; Na, S.; Yoon, S. Assessment of CO2 emissions by replacing an ordinary reinforced concrete slab with the void slab system in a high-rise commercial residential complex building in South Korea. Sustainability 2018, 11, 82. [Google Scholar] [CrossRef]
  17. Na, S.; Paik, I.; Yun, S.-H.; Truong, H.C.; Roh, Y.-S. Evaluation of the floor impact sound insulation performance of a voided slab system applied to a high-rise commercial residential-complex building. Int. J. Concr. Struct. Mater. 2019, 13, 3. [Google Scholar] [CrossRef]
  18. Wang, L. Vulnerability evaluation of high-rise earthquake-proof buildings in high-pressure area. Int. J. Ind. Syst. Eng. 2021, 39, 361–376. [Google Scholar] [CrossRef]
  19. Heo, S.; Na, S.; Hur, M.-W.; Lee, S. Evaluating the Vertical Extension Module of a Building with Installed Rotary Dampers at Joints. Buildings 2021, 11, 536. [Google Scholar] [CrossRef]
  20. Lee, S.-J.; Choi, K.-K.; Lee, J.-E.; Dinh, N.H.; Park, W.-I. Hysteresis response of rotary friction dampers developed for seismic operational performance of non-structural components vulnerable to overturning. In Structures; Elsevier: Amsterdam, The Netherlands, 2022. [Google Scholar]
  21. Paik, I.; Na, S. Evaluation of carbon dioxide emissions amongst alternative slab systems during the construction phase in a building project. Appl. Sci. 2019, 9, 4333. [Google Scholar] [CrossRef]
  22. Paik, I.; Na, S. Comparison of environmental impact of three different slab systems for life cycle assessment of a commercial building in South Korea. Appl. Sci. 2020, 10, 7278. [Google Scholar] [CrossRef]
  23. Jabir, H.A.; Mhalhal, J.M.; Al-Gasham, T.S. Conventional and bubbled slab strips under limited repeated loads: A comparative experimental study. Case Stud. Constr. Mater. 2021, 14, e00501. [Google Scholar] [CrossRef]
  24. Al-Gasham, T.S.; Mhalhal, J.M.; Abid, S.R. Quasi-static analysis of biaxial voided slabs with openings. In Structures; Elsevier: Amsterdam, The Netherlands, 2021. [Google Scholar]
  25. Kıpçak, F.; Erdil, B.; Tapan, M.; Karaşin, A. The Effect of Voids on Flexural Capacity of Reinforced Concrete Slabs. Period. Polytech. Civ. Eng. 2023, 67, 1048–1065. [Google Scholar] [CrossRef]
  26. Zavalis, M.; Daugevičius, M.; Jokūbaitis, A.; Zavalis, R.; Valivonis, J. Deflection estimation model for prestressed concrete slabs with plastic inserts forming voids. Materials 2022, 15, 3013. [Google Scholar] [CrossRef] [PubMed]
  27. Barreto, M.M.; Timm, J.; Passuello, A.; Molin, D.D.; Masuero, J. Life cycle costs and impacts of massive slabs with varying concrete cover. Clean. Eng. Technol. 2021, 5, 100256. [Google Scholar] [CrossRef]
  28. Sampaio, D.O.; Tashima, M.M.; Costa, D.; Quinteiro, P.; Dias, A.C.; Akasaki, J.L. Evaluation of the environmental performance of rice husk ash and tire rubber residues incorporated in concrete slabs. Constr. Build. Mater. 2022, 357, 129332. [Google Scholar] [CrossRef]
  29. Paik, I.-K.; Na, S. Evaluation of Noise Insulation Performance for Void Deck Slab System which Combines Deck Plates with a Voided Slab System. Int. J. Appl. Eng. Res. 2018, 13, 7348–7359. [Google Scholar]
  30. Park, S.; Moges, K.A.; Pyo, S. Experimental study on the sound absorption performance of surface-perforated mortar. Constr. Build. Mater. 2021, 307, 124824. [Google Scholar] [CrossRef]
  31. Kim, K.W.; Shin, H.K.; Park, J.-Y.; Chung, J.Y. Vibration and Floor Impact Sound Isolation Performance in Bubble Deck Slab. Key Eng. Mater. 2018, 777, 523–527. [Google Scholar] [CrossRef]
  32. Xu, J.; Wu, C.; Li, Z.-X. Analysis of direct shear failure mode for RC slabs under external explosive loading. Int. J. Impact Eng. 2014, 69, 136–148. [Google Scholar] [CrossRef]
  33. Eom, T.-S.; Hwang, I.-H.; Lee, S.-J.; Park, T.-W. Failure Mode and Shear Strength of Nonprestressed Hollow-Core Slabs in One-Way Shear. ACI Struct. J. 2018, 115, 1131–1142. [Google Scholar] [CrossRef]
  34. Varshney, H.; Jauhari, N.; Bhatt, H. A review study on bubble deck slab. Int. J. Res. Appl. Sci. Eng. Technol. 2017, 5, 2136–2139. [Google Scholar] [CrossRef]
  35. Gamal, M.; Heiza, K.; Hekal, G.M.; Nabil, A. Voided slabs as a new construction technology—A review. In Proceedings of the International Conference on Advances in Structural and Geotechnical Engineering, Hurghada, Egypt, 6–9 March 2023. [Google Scholar]
  36. Adil, A.I.; Hejazi, F.; Rashid, R.S. Voided biaxial slabs-state of art. In IOP Conference Series: Earth and Environmental Science; IOP Publishing: Bristol, UK, 2019. [Google Scholar]
  37. Adenan, D.; Kamaruddin, K.; Saman, H.M. Bubble deck slab technology as an alternative slab system—A review. In AIP Conference Proceedings; AIP Publishing: Long Island, NY, USA, 2023. [Google Scholar]
  38. Biradar, R.; Nikam, V.; Sonawane, S. A review of comparative study between conventional slab and bubble deck slab. Int. Res. J. Eng. Technol. 2020, 7, 470–472. [Google Scholar]
  39. ACI Committee 318, ACI CODE-318-14: Building Code Requirements for Structural Concrete and Commentary; ACI Concrete: Farmington Hills, MI, USA, 2014.
  40. Uniform Building Code. Uniform Building Code; International Conference of Building Officials: Whittier, CA, USA, 1997. [Google Scholar]
  41. Comité Euro-International du Béton. CEB-FIP Model Code 1990: Design Code; Thomas Telford Publishing: London, UK, 1993. [Google Scholar]
Figure 1. Details of the specimens. (a) Front and side view of HC-30 specimen. (b) Front and side view of HC-30-45 specimen. (c) Front and side view of HC-30-90 specimen.
Applsci 14 04737 g001
Figure 2. The shape of Isopink and PVC pipe combined materials by the hollow core ratios.
Applsci 14 04737 g002
Figure 3. The process of specimen fabrication. (a) Formwork and reinforcement. (b) Hollow core parts integration. (c) Concrete pouring and curing.
Applsci 14 04737 g003
Figure 4. Material properties test. (a) Concrete compressive strength test. (b) Rebar yield test.
Applsci 14 04737 g004
Figure 5. Test setup for the specimen.
Applsci 14 04737 g005
Figure 6. The load–displacement curve on a hollow core ratio of 30%.
Applsci 14 04737 g006
Figure 7. The load–displacement curve on a hollow core ratio of 35%.
Applsci 14 04737 g007
Figure 8. The load–displacement curve on a hollow core ratio of 40%.
Applsci 14 04737 g008
Figure 9. Post-test crack patterns at the end of the experiments.
Applsci 14 04737 g009
Figure 10. Comparison between expected and experimental shear capacity at non-reinforcement.
Applsci 14 04737 g010
Figure 11. Comparison between expected and experimental shear capacity at 45° reinforcement.
Applsci 14 04737 g011
Figure 12. Comparison between expected and experimental shear capacity at 90° reinforcement.
Applsci 14 04737 g012
Table 1. The list of specimens.
SpecimenHollow Core Ratio (%)Shear Reinforcement
HC-3030.32None
HC-30-4530.3245° reinforcement
HC-30-9030.3290° reinforcement
HC-3534.99None
HC-35-4534.9945° reinforcement
HC-35-9034.9990° reinforcement
HC-4039.66None
HC-40-4539.6645° reinforcement
HC-40-9039.6690° reinforcement
Table 2. A table of the concrete mixing design.
W/C (%)S/a (%)Unit Material Requirements (kg/m3)
WaterCementFine AggregateCoarse Aggregate
47.847.5170356848956
Note: W/C is water–cement ratio and S/a is fine aggregate ratio.
Table 3. Properties of the materials (concrete and rebar).
Concrete
(MPa)
Rebar
(MPa)
Design StrengthCompressive StrengthD13D10D6
24.024.999565.1598.6335.2
Table 4. Expected and experimental shear capacity.
SpecimenExpected Shear Capacity
(kN)
Experimental Shear Capacity
(kN)
Experimental/Expected Shear Capacity
HC-30185.88395.5052.128
HC-30-45262.99430.1651.636
HC-30-90262.62425.681.621
HC-35172.38335.801.948
HC-35-45249.85403.3151.614
HC-35-90249.45358.321.436
HC-40159.21340.9052.141
HC-40-45236.65366.211.547
HC-40-90236.28341.091.444
Table 5. Ratios between experimental shear capacity and expected shear capacity with different reinforcements from ACI 318-14.
No Reinforcement45° Reinforcement90° Reinforcement
NameHC-30HC-35H-C40HC-30-45HC-35-45HC-40-45H-C30-90HC-35-90HC-40-90
Vtest (kN)395.5335.8340.9430.2403.3366.2425.7358.3341.1
VACI185.9172.4159.2263.0249.8236.7262.6249.5236.3
Vtest/VACI2.131.952.141.641.611.551.621.441.44
AVG.2.071.61.5
Var.0.0110.0020.011
S.D.0.1070.0460.104
Note: AVG. is average, Var. is Variance, and S.D. is Standard Deviation.
Table 6. Ratios between experimental shear capacity and expected shear capacity with different reinforcement from UBC 2.
No Reinforcement45° Reinforcement90° Reinforcement
NameHC-30HC-35H-C40HC-30-45HC-35-45HC-40-45H-C30-90HC-35-90HC-40-90
Vtest (kN)395.5335.8340.9430.2403.3366.2425.7358.3341.1
VUBC183.5170.5157.5260.9247.9234.9260.6247.6234.5
Vtest/VUBC2.161.972.161.651.631.561.631.451.45
AVG.2.11.611.51
Var.0.0120.0020.011
S.D.0.110.0470.104
Note: AVG. is average, Var. is Variance, and S.D. is Standard Deviation.
Table 7. Ratios between experimental shear capacity and expected shear capacity with different reinforcement from CEB-FIP 1990.
No Reinforcement45° Reinforcement90° Reinforcement
NameHC-30HC-35H-C40HC-30-45HC-35-45HC-40-45H-C30-90HC-35-90HC-40-90
Vtest (kN)395.5335.8340.9430.2403.3366.2426.7358.3341.1
VCEB182.9173.4163.7287.9278.4268.6261.3251.8242.0
Vtest/VCEB2.161.94163.71.491.451.361.631.421.41
AVG.2.061.431.49
Var.0.0120.0040.015
S.D.0.1110.0670.124
Note: AVG. is average, Var. is Variance, and S.D. is Standard Deviation.
Disclaimer/Publisher’s Note: The statements, opinions and data contained in all publications are solely those of the individual author(s) and contributor(s) and not of MDPI and/or the editor(s). MDPI and/or the editor(s) disclaim responsibility for any injury to people or property resulting from any ideas, methods, instructions or products referred to in the content.

