Article

TYCOS: A Specialized Dataset for Typical Components of Satellites

1
Xi’an Institute of Optics and Precision Mechanics, Chinese Academy of Sciences, Xi’an 710119, China
2
University of Chinese Academy of Sciences, Beijing 100049, China
3
Key Laboratory of Spacecraft Optical Imaging and Measurement Technology of Xi’an, Xi’an 710119, China
*
Author to whom correspondence should be addressed.
Appl. Sci. 2024, 14(11), 4757; https://doi.org/10.3390/app14114757
Submission received: 22 April 2024 / Revised: 23 May 2024 / Accepted: 24 May 2024 / Published: 31 May 2024

Abstract

:
The successful detection of key components within satellites is a crucial prerequisite for executing on-orbit capture missions. Due to the inherent data-driven functionality, deep learning-based component detection algorithms rely heavily on the scale and quality of the dataset for their accuracy and robustness. Nevertheless, existing satellite image datasets exhibit several deficiencies, such as the lack of satellite motion states, extreme illuminations, or occlusion of critical components, which severely hinder the performance of detection algorithms. In this work, we bridge the gap via the release of a novel dataset tailored for the detection of key components of satellites. Unlike the conventional datasets composed of synthetic images, the proposed Typical Components of Satellites (TYCOS) dataset comprises authentic photos captured in a simulated space environment. It encompasses three types of satellite, three types of key components, three types of illumination, and three types of motion state. Meanwhile, scenarios with occlusion in front of the satellite are also taken into consideration. On the basis of TYCOS, several state-of-the-art detection methods are employed in rigorous experiments followed by a comprehensive analysis, which further enhances the development of space scene perception and satellite safety.

1. Introduction

With the advancement of space technology and increasing human activity in space, numerous satellites with diverse purposes are continuously being launched into the geosynchronous orbit. This surge in satellite deployment has led to an alarming proliferation of space debris and defunct satellites encircling the Earth. Among this debris, defunct satellites act as non-cooperative targets and pose a significant threat to the safety of operational satellites. Therefore, it is both urgent and imperative to achieve the on-orbit capture of these non-functional satellites to mitigate safety risks for existing active satellites [1,2,3]. A crucial preliminary step towards this goal involves conducting a comprehensive survey of the space environment to detect key components of satellites. In recent years, optical imaging devices have gained widespread usage, significantly enhancing the observational capabilities of satellites towards surrounding objects. Consequently, optical-based object detection methods have garnered substantial research attention and practical significance [4]. Common satellite parts, such as solar panels, satellite bodies, and radar transmitters, are notably of varying sizes and geometries, which makes their optical characteristics easily discernible. In addition to optical imaging, the terahertz (THz) band also plays an important role in the context of space surveillance. The terahertz wave occupies the electromagnetic spectrum between microwaves and infrared light, providing unique capabilities to remote sensing devices. Theoretically, radiation can penetrate various materials, including clothing, plastics, and non-metallic objects, making it potentially useful for detecting components hidden or embedded within satellites or debris. Additionally, terahertz imaging systems can operate in harsh weather conditions and provide continuous monitoring capabilities, even in challenging environments [5].
In recent years, with the continuous advancement of deep learning, neural networks have emerged as the predominant approach in the field of object detection [6]. The application in the aerospace domain holds the potential to expedite the intelligent evolution of space situational awareness [7,8,9]. However, the formidable cost and complexity associated with space data collection have led to the generation of most space target datasets through model simulations, overlooking the intricacies of real-space imaging [10]. In the space environment, targets are situated amidst cluttered backgrounds and are subject to various influences such as cosmic rays [11], solar storms [12], and thermal noise from electronic devices [13]. Given that neural networks rely on data, the absence of a substantial corpus of genuine on-orbit images renders current detection methods challenging to apply to real on-orbit capture tasks [14,15]. Consequently, it is imperative to establish a unified satellite dataset for key component detection that accurately simulates space capture scenarios [16].
In real-world scenarios, imaging effects are constrained by three crucial factors, namely illuminance, motion states, and occlusions. Firstly, in terms of illuminance, the continuous variation in incident sunlight and other sources of stray light might result in phenomena such as overexposure and low illumination, which directly impact the quality of captured images. Secondly, motion states introduce additional complexity due to the continuous rotation of malfunctioning satellites during scene capture, which usually results in a diverse range of apparent information being recorded. Meanwhile, when capturing images from distant scenes, key components often appear as small-sized objects that require finer-grained detection abilities [17]. Furthermore, when the motion state of the observing satellite changes, certain key components obstruct others as the observing satellite orbits around the malfunctioning target satellite. These issues make it difficult to identify key components in images and greatly limit their detection in malfunctioning target satellites, leading to missed or false detections [18]. Therefore, a dataset that accurately reproduces the spatial lighting conditions, motion states, and occlusions encountered by key satellite components must be urgently established. It would undoubtedly hold immense value in advancing neural network-based object detection applications in space [19,20,21].
However, existing satellite datasets [22,23] predominantly comprise synthetic images, posing challenges in accurately representing real illumination, motion states, and occlusion conditions of space targets. In order to advance the development of key satellite component detection methods, the TYCOS dataset, collected using a semi-physical system within a darkroom and specifically tailored for key satellite component detection in on-orbit capture missions, is introduced in this paper. The main contributions of this paper can be summarized as the following three aspects.
  • A unified dataset for the detection of key satellite components is established, meticulously crafted to accurately represent key satellite components. In addition, employing a semi-physical collection system, this dataset accurately replicates the scenarios encountered in space capture missions. In terms of illumination, it encompasses the following three distinct lighting conditions: normal illumination, low illumination, and high saturation. Regarding motion states, the dataset simulates the hovering and approaching states of the observing satellite in the capture missions, as well as the rolling state of the target satellite, effectively linking imaging effects with the motion states of targets. Furthermore, in addressing occlusion challenges, the dataset includes scenarios where the body of the target satellite occludes its own solar panels. Compared with other existing datasets, our dataset can better reflect the real-space imaging effect and reflect the real-space conditions.
  • A comprehensive validation analysis of current mainstream object detection algorithms on the dataset is conducted, in order to establish initial detection benchmarks. Eight sets of classic and advanced detection models are evaluated in this paper. Aiming to address the challenges posed by the higher demand for the detection accuracy of space targets, appropriate backbones are selected to improve the initial detection benchmarks.
  • Images capturing all spatial directions and distances of up to 5 m are included in the proposed dataset. This dataset faithfully replicates direct sunlight in satellite observation images, offering an unparalleled quantity and quality of images that depict key components of satellite models, facilitating a comprehensive evaluation of the robustness of key satellite component detection across a wide array of high-fidelity environments.
The remaining sections of this paper are organized as follows. Section 2 introduces existing datasets related to space scenes. Section 3 introduces details of the generation process of the dataset proposed in this paper. Section 4 presents the experimental process and results. Section 5 provides the conclusions.

2. Related Work

2.1. Existing Space Scene Datasets

Currently, with the sharp increase in demand for space situational awareness, many scholars have released satellite datasets aimed at advancing tasks such as target detection and attitude estimation using deep learning techniques [24,25].
Sharma et al. [26] released the Satellite Pose Estimation Dataset (SPEED). SPEED has been the most widely used satellite dataset in recent years. However, SPEED is primarily used to address satellite pose estimation problems rather than executing satellite detection tasks. Furthermore, SPEED relies on synthetic images for training and validation, which are easy to produce in bulk but cannot simulate the inherent visual characteristics and lighting variability of the images of target satellites. Therefore, there are limitations in applying SPEED in space capture missions.
In a similar vein, Tae Ha Park et al. [22] introduced SPEED+ to tackle satellite pose estimation and navigation challenges. This dataset comprises both synthetic and hardware-simulated images. However, it cannot be used for executing space target detection tasks.
The sole consolidated dataset that is presently accessible for satellite detection endeavors was made publicly available by Dung et al. [27]. However, this dataset specifically focuses on detecting satellites as a whole, excluding their key components, and comprises synthetic images gathered primarily from the internet. Since synthetic images differ significantly from real images in terms of illumination, this dataset cannot reflect the kinestate of satellites in space capture tasks.
Musallam et al. [28] introduced SPARK, a multimodal image dataset tailored for space target detection under realistic space simulation scenarios. As for modalities, it comprises RGB and depth images including 11 types of objects, 10 of which are related to satellites, and additionally 11 types of space debris. Nevertheless, in both detection and segmentation tasks, SPARK only labels satellite bodies. It overlooks the role of key components in real capture missions. Additionally, the synthetic images in SPARK still exhibit significant differences from real images in terms of the illumination and motion states of space targets.
Cao et al. [23] introduced the Satellite-DS, a simulated environment-based space target detection image dataset. This dataset was acquired within a darkroom environment constructed to mimic space conditions using hardware. It encompasses two types of satellite, nine types of key components, and three types of illuminations (normal, low, and high saturation). Additionally, it incorporates two types of motion states (approach and hover phases). However, it falls short in addressing occlusion challenges arising from the target satellite bodies obscuring their own key components. Furthermore, there is a lack of comprehensive analysis regarding the validation of current mainstream target detection algorithms on the dataset. The dataset also fails to adequately tackle the recognition difficulties stemming from extreme illuminations and the low detection rate induced by motion states.
Table 1 presents an analysis of the existing satellite datasets, listing the collection scenarios, illuminations, satellite motion states, occlusion of key components, image resolution, key component categories, task types, and open-source status. The results of the analysis can be summarized as follows. Firstly, existing satellite datasets mostly consist of synthetic images, making it difficult to reflect practical illuminations, motion states, and occlusion. However, extreme lighting, satellite motion states, and occlusions in observation and capture scenes significantly impact detection precision. Secondly, the majority of the current datasets are geared towards pose estimation in space-related scenarios, with few datasets considering key ingredient analysis, which is a deficiency that may lead to low detection rates. Thirdly, the most recent datasets lack open accessibility [29], which poses a significant obstacle for scholars to build upon existing research, thereby impeding a fair comparison of the performance of various methodologies.
Overall, there is a notable absence of unified datasets tailored specifically for the detection of key satellite components. These datasets should meticulously replicate various illuminations, motion states, and scenarios that may give rise to occlusion of key components during detection tasks.

2.2. Satellite Target Detection and Recognition Algorithms

Due to the scarcity of publicly accessible datasets for key satellite component detection that faithfully replicate space capture scenes, the research on neural network-based methods for key satellite component detection remains in its nascent stages, and there are only a few studies focusing on this area.
In key satellite component detection, Mahendrakar et al. [30] utilized YOLOv5 (You Only Look Once version 5) for locating and identifying satellite components such as satellite bodies, solar panels, or antennas, followed by image classification. However, this algorithm is currently not sufficiently reliable and is not suitable for on-orbit deployment. Therefore, ongoing and future research focuses on integrating additional preprocessing and enhancement techniques, ensemble methods, and regression techniques for bounding boxes to improve the algorithm’s detection accuracy and reliability.
Xu et al. [31] integrated extended convolutional high-resolution networks with online hard key point mining strategies to address imaging challenges in intricate space environments. Their enhanced network prioritizes occluded key points, extends the receptive field, and improves detection accuracy. Nevertheless, a disparity remains between virtual and real-space environments, and their study overlooked complex space motion scenarios.
Chen et al. [32] proposed a Region-based Convolutional Neural Network (R-CNN) that can accurately detect various key satellite components using optical images. However, the performance of the feature extraction network of R-CNN in detecting severely deformed components is still not satisfactory, making it unsuitable for on-orbit deployment.
Cao et al. [33] proposed a faster improved R-CNN for detecting small faulty satellite components under low illumination using image enhancement. However, they were unable to effectively address the issue of low detection rates for key satellite components under extreme illumination conditions.
In summary, although there has been some progress in the research on key satellite component detection methods, most detection methods have been trained using synthetic images. Even with the use of semi-physical simulation datasets, the challenges of extreme lighting conditions and occlusions leading to recognition difficulties, as well as low detection rates caused by motion states, have not been effectively addressed. Therefore, current key satellite component detection methods are unable to illustrate the impact of extreme conditions on detection accuracy in real capture scenes.

3. The TYCOS Dataset

3.1. The Image Acquisition System

Based on the shortcomings observed in the existing datasets, this work established a semi-physical acquisition system, depicted in Figure 1. The system comprised three main components: the observation system, the sun simulation system, and the target system. The observation system involved mounting the camera on the front end of a moving vehicle, utilizing the vehicle’s sliding track to achieve the continuous translation and rotation of the camera. The sun simulation system employed lighting devices fixed on tripods to illuminate the satellite model from various angles. The target system secured the satellite on a test platform, utilizing the rotation axis of the satellite model for movement. Details of each system are provided below.
Target system: The satellite models utilized in this study included the BeiDou-3 satellite, Fengyun-4 satellite, and Shenzhou-14 satellite, which are all made with zinc alloy. The detailed parameters of the satellite models are provided in Table 2, and the satellite models are shown in Figure 1.
Observation system: The observation system utilized in this study consisted primarily of a camera and a vehicle. The camera employed was the MV-CH050 industrial camera manufactured by Hikvision. It offers support for hard-trigger, soft-trigger, and free-run modes, along with automatic or manual adjustment of the gain and exposure time. Renowned for its robust performance, this camera excels in harsh environments, including extreme temperature variations and low-illumination conditions. The main parameters of the camera are detailed in Table 3.
Sun simulation system: The sun simulation system primarily comprised lighting devices and a fixed bracket. The lighting device utilized LED light sources with three adjustable brightness levels, high, medium, and low, thus effectively emulating normal illumination, low illumination, and high saturation in space. The main parameters of the lighting device are detailed in Table 4. The angle between the light rays and the target satellite was adjusted through moving the fixed bracket.

3.2. Simulation of Multiple Operating Conditions

Compared to existing datasets, the dataset proposed in this paper accurately simulates a space environment’s illumination, satellite motion states, and satellite occlusion conditions. The details are as follows:
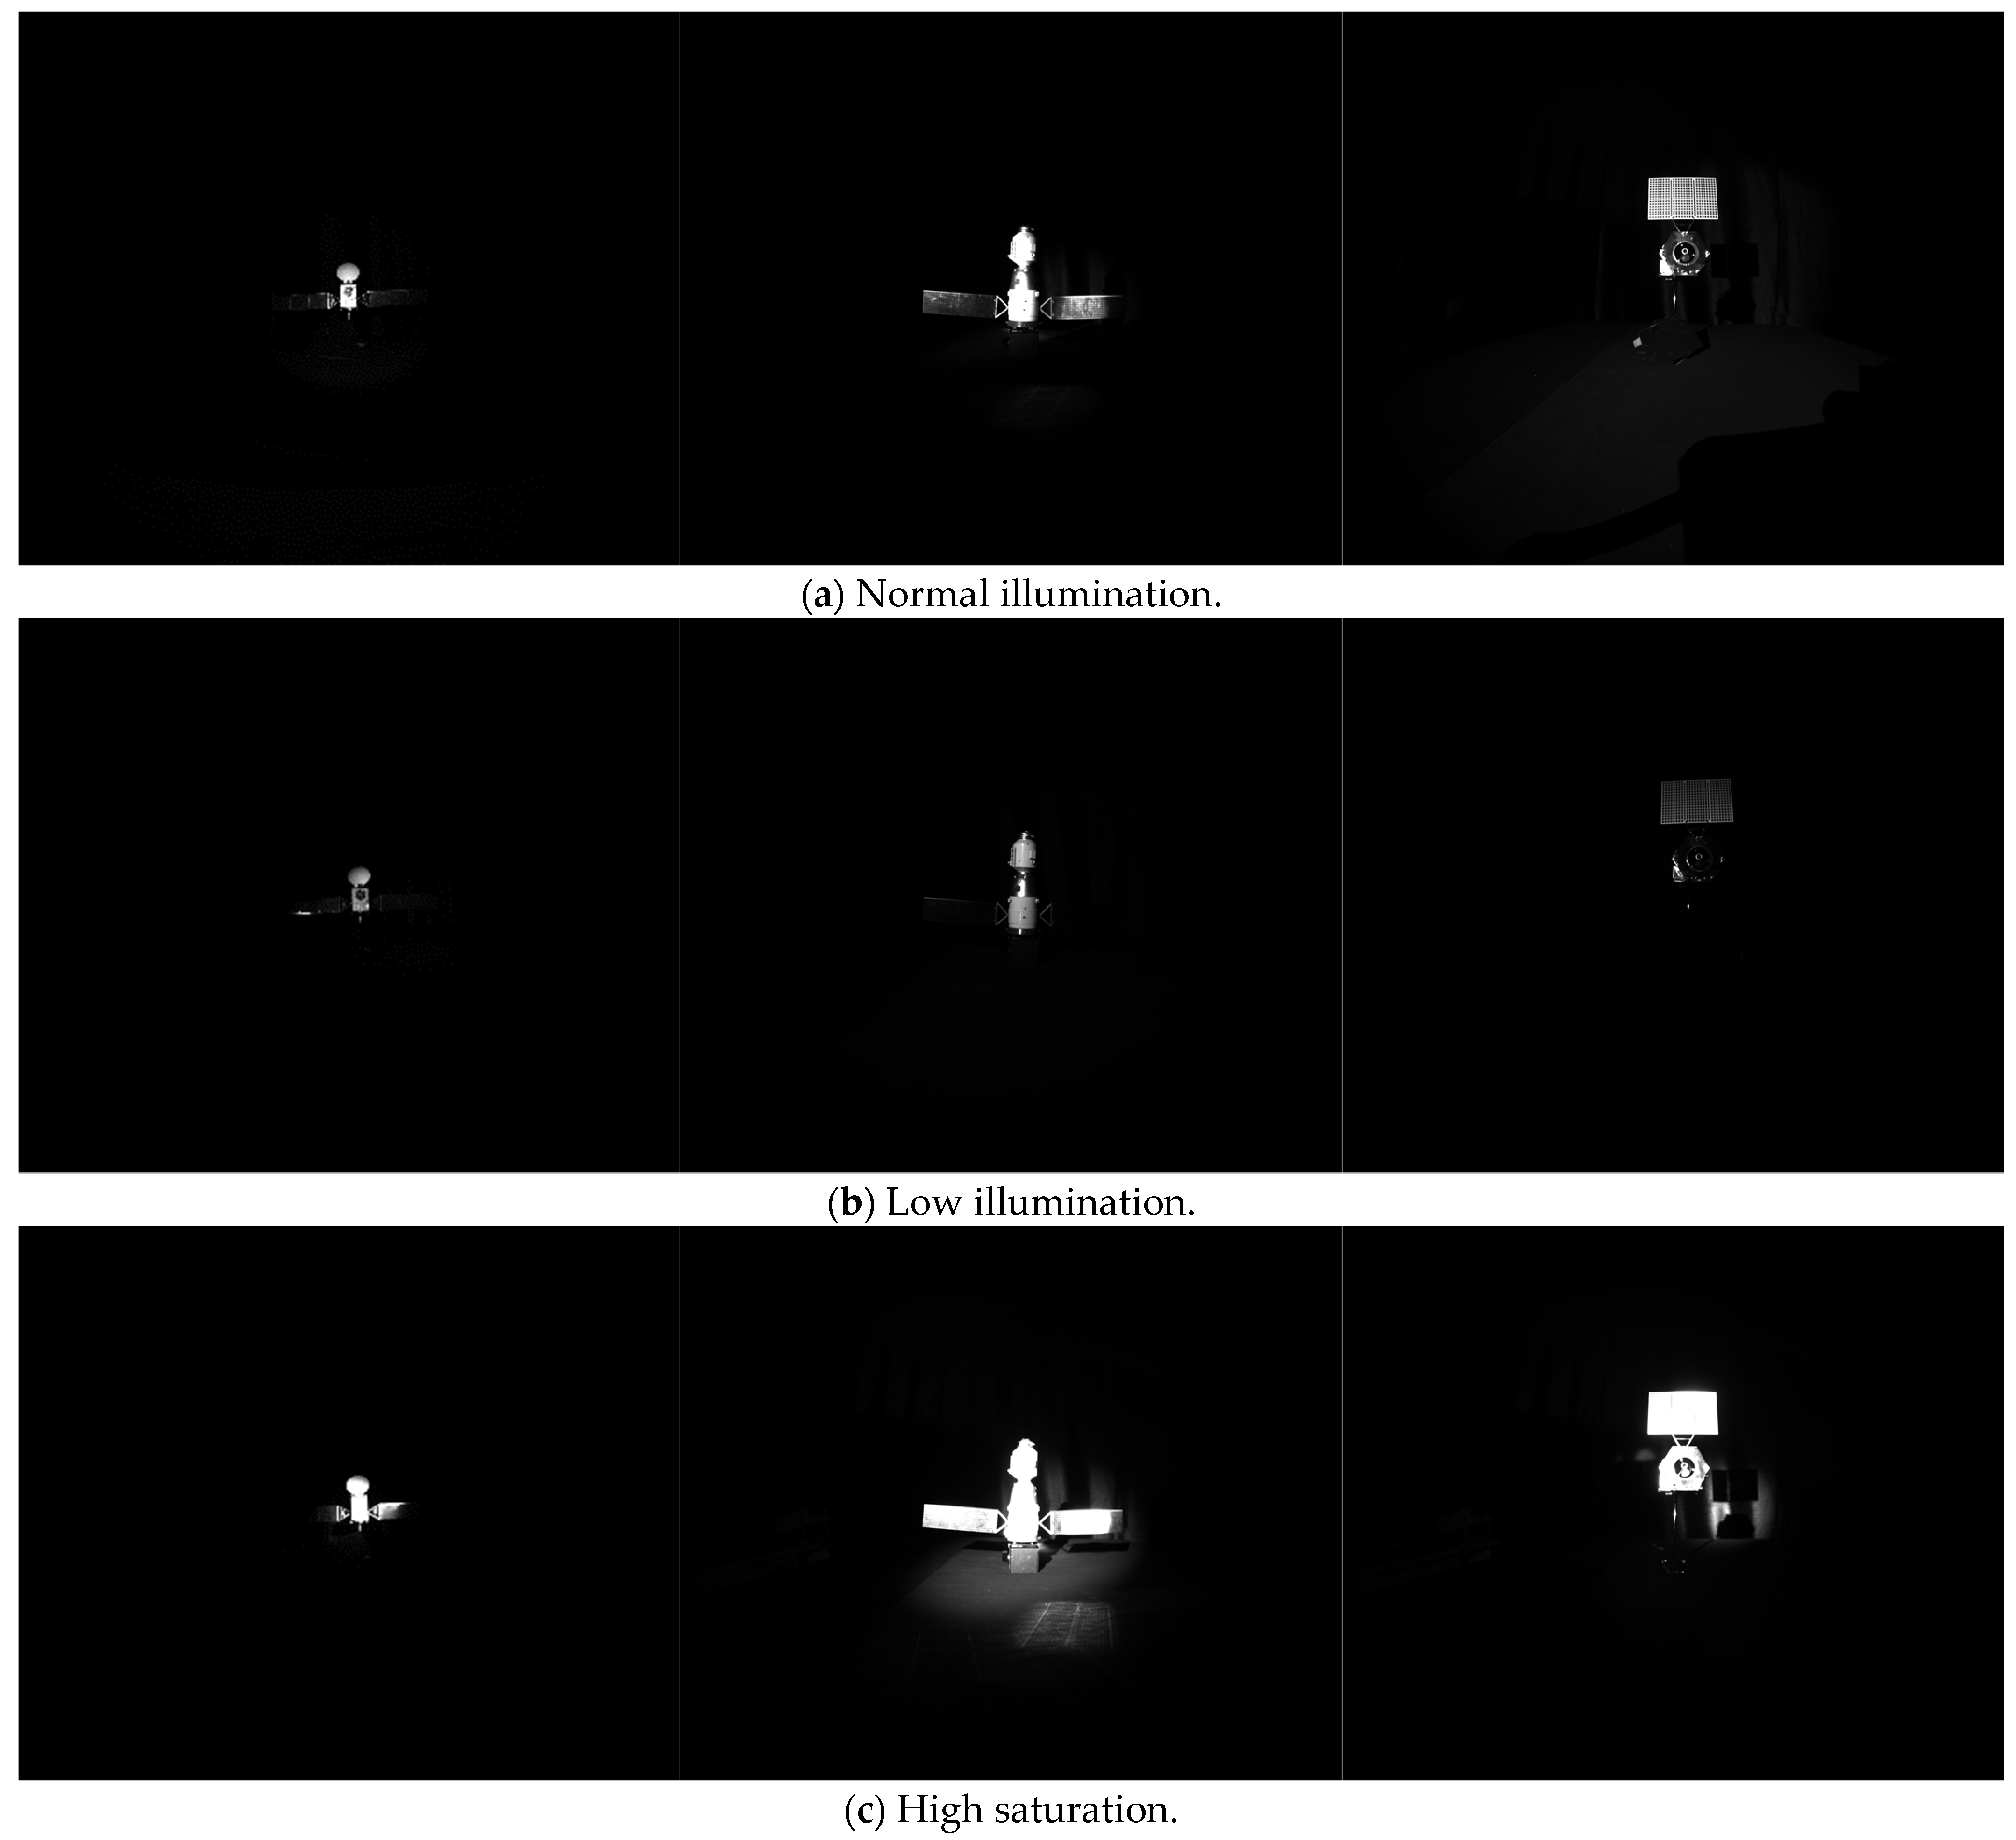
Illumination conditions: To authentically replicate practical illumination conditions in space, the semi-physical acquisition system was situated in a darkroom. A sun simulator directed light onto the satellite model at an incident angle between 10° and 20°. The sun simulator incorporated high-intensity LED light sources allowing for adjustments in brightness, irradiation coverage, and beam dimensions, thus accurately simulating the collimated, homogeneous, and spectral properties of natural solar radiation. However, in images, variations in brightness and darkness become conspicuous when sunlight falls on the satellite body and light reflected from the thermal insulation layer on the body’s surface is projected onto the camera’s imaging plane. Conversely, sunlight shining on a satellite’s solar panels often results in overexposure, leading to extreme irradiation conditions, comprising dimmed illumination and heightened saturation. As illustrated in Figure 2, we classified illumination into three distinct categories: standard lighting, dim lighting, and elevated color saturation. Normal illumination indicates a clear satellite surface, free from shadows and uneven spots. Low illumination implies that shadows and darkened regions may obscure critical satellite components. In elevated color saturation conditions, conspicuous bright spots emerge on specific sections of the satellite, resulting in critical components in those areas becoming undetectable. The above illumination types are prevalent in space and significantly influence the accuracy of key satellite component detection. However, this aspect has often been overlooked in other published datasets.
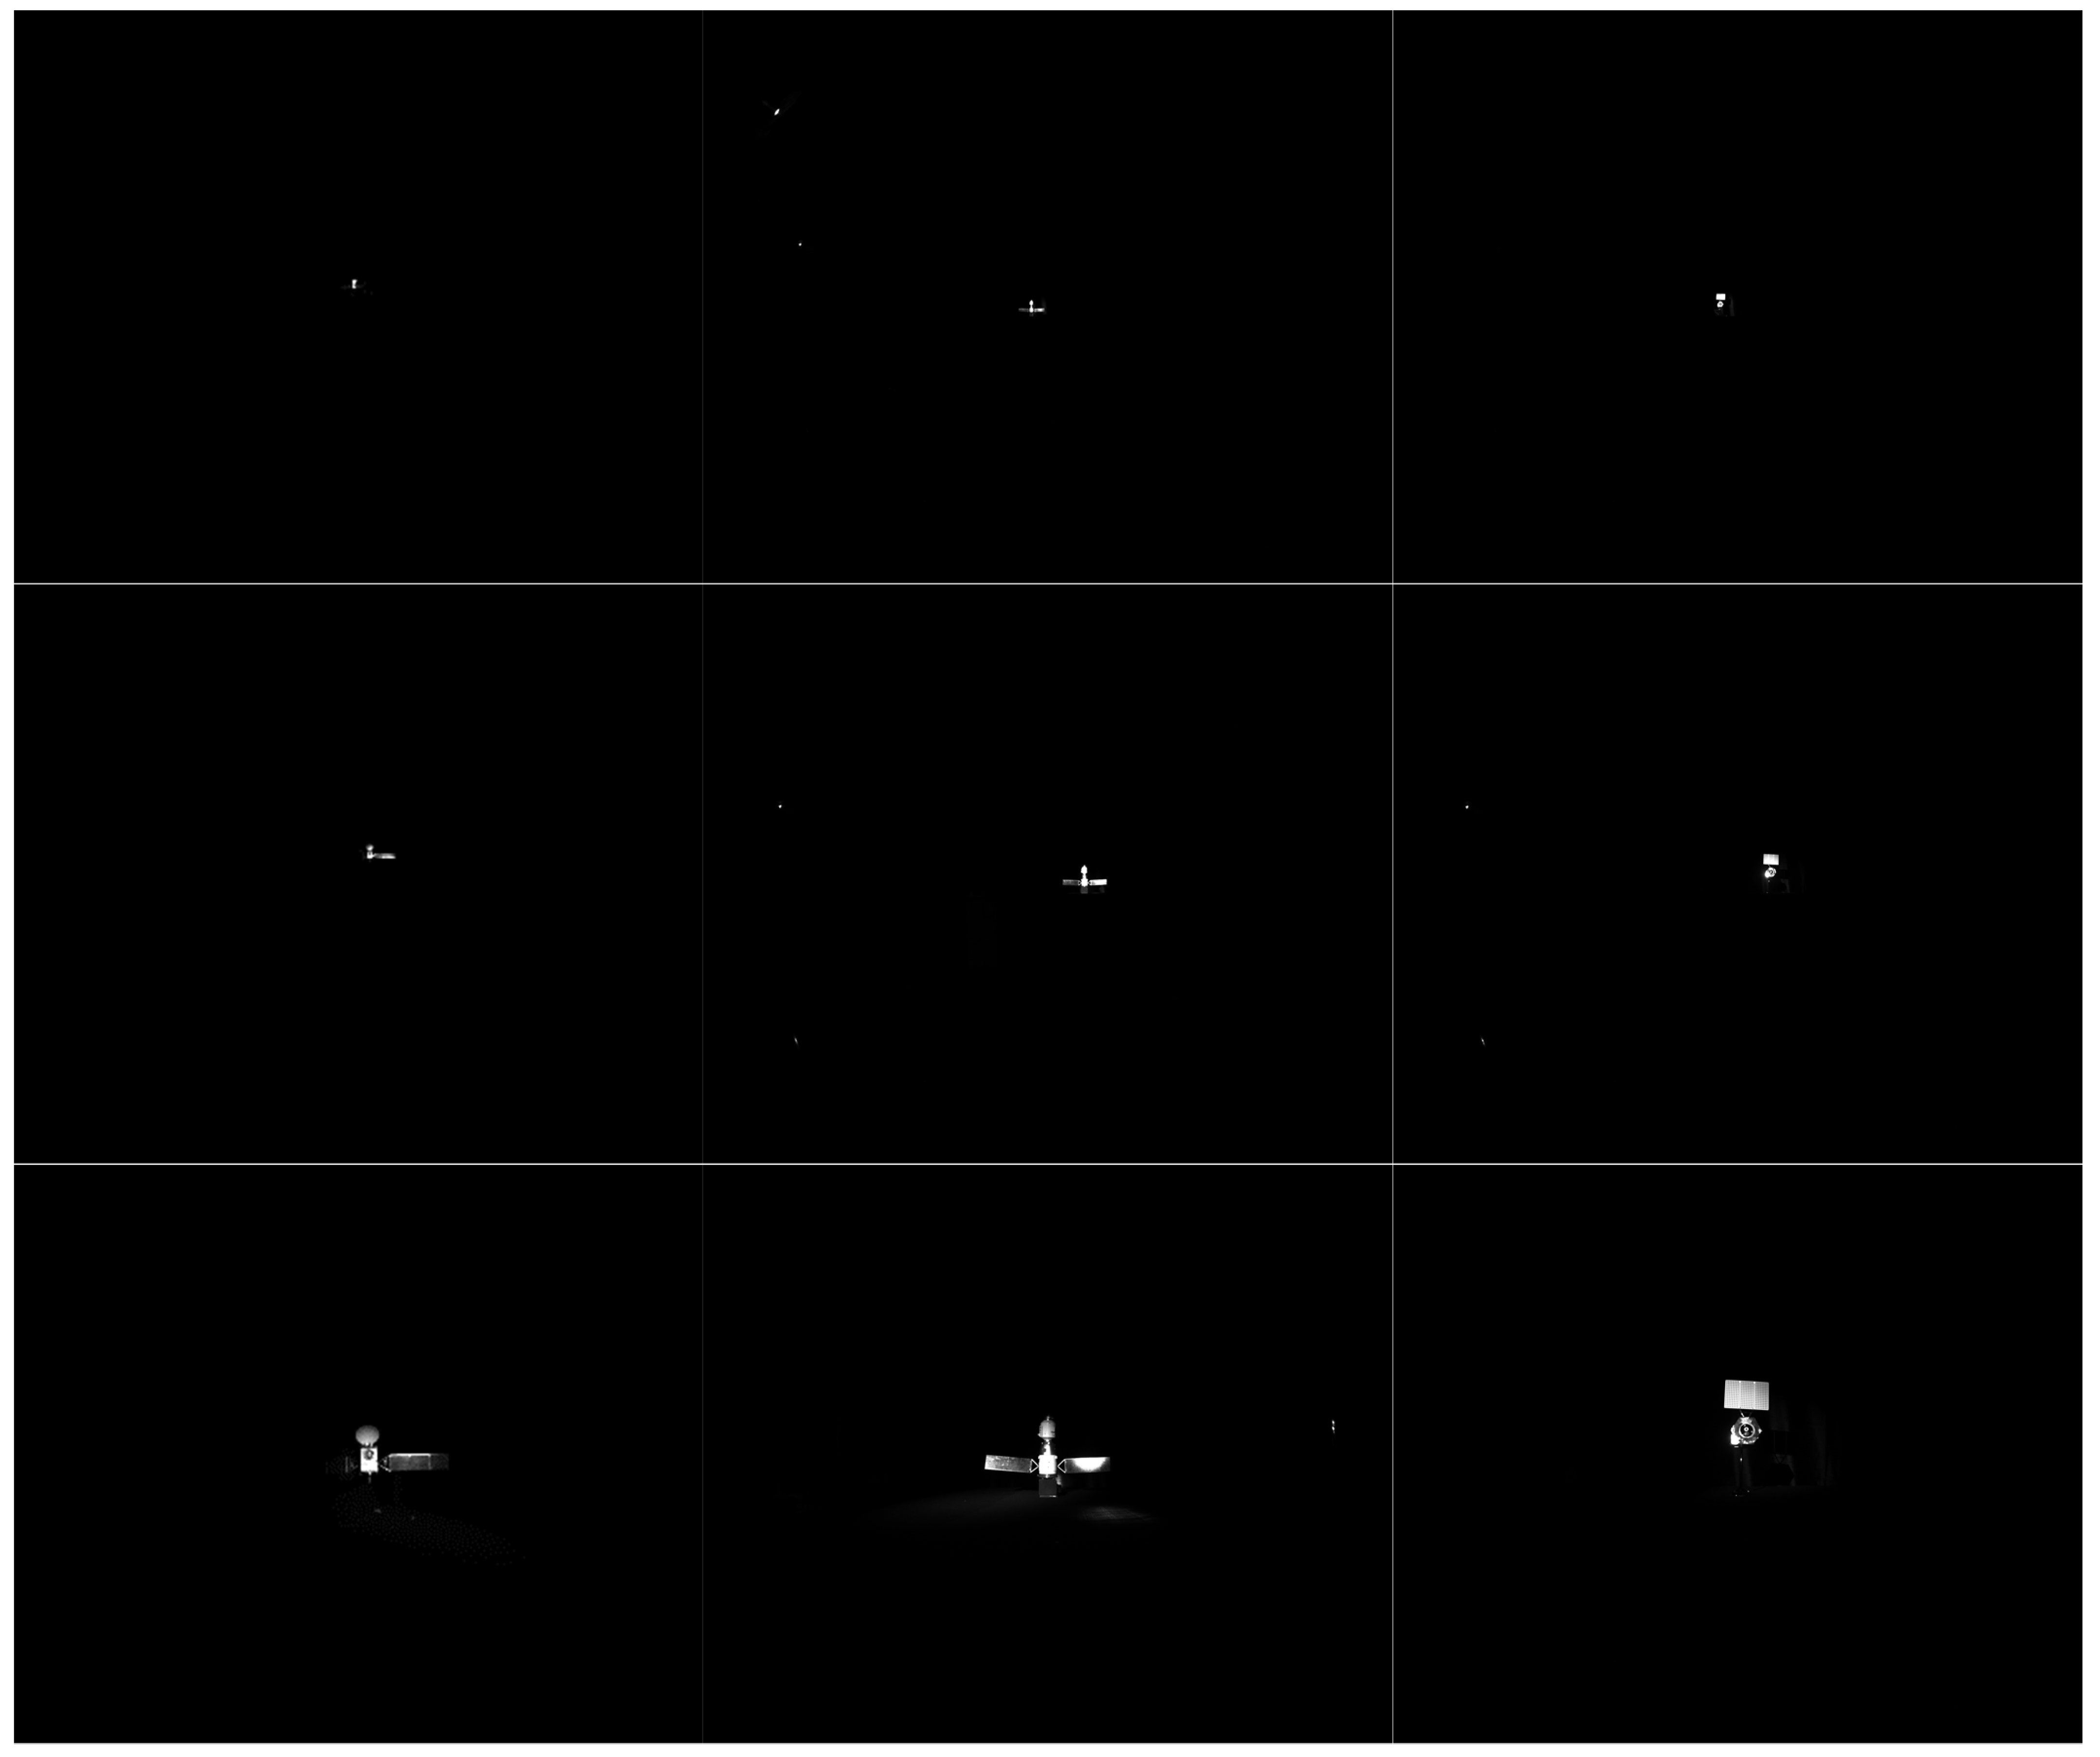
Motion state: During practical space capture missions, the relative motion between the target satellite and the observing satellite typically encompasses a hovering stage and an approaching stage, while the failed target satellite may undergo rolling in space. In the hovering stage, the observing satellite observes and identifies the target satellite. In the approaching stage, the observing satellite executes motion planning and devises strategies to capture the target. Throughout both stages, the relative distance between the target and the observing satellite fluctuates. When sunlight illuminates the surface of the target satellite and the surface material reflects sunlight onto the camera, the changing motion state exacerbates the instability of the imaging effect. This instability can lead to the missed or failed detection of critical satellite components. As depicted in Figure 1, to simulate the hovering stage, the camera was positioned 5 m away from the target to observe and identify the target satellite. To simulate the approaching state, the camera, fixed at the front end of the moving vehicle, moved towards the target satellite model at a speed of 0.5 m/s within a range of 0.5–5 m, capturing images as shown in Figure 3. To simulate the rolling state of the target, the observation camera captured the target satellite from multiple angles within 0.5 m, as illustrated in Figure 4. The motion state between the target and the observing satellite significantly impacted the detection accuracy of key satellite components. However, this aspect has often been overlooked in other published datasets.
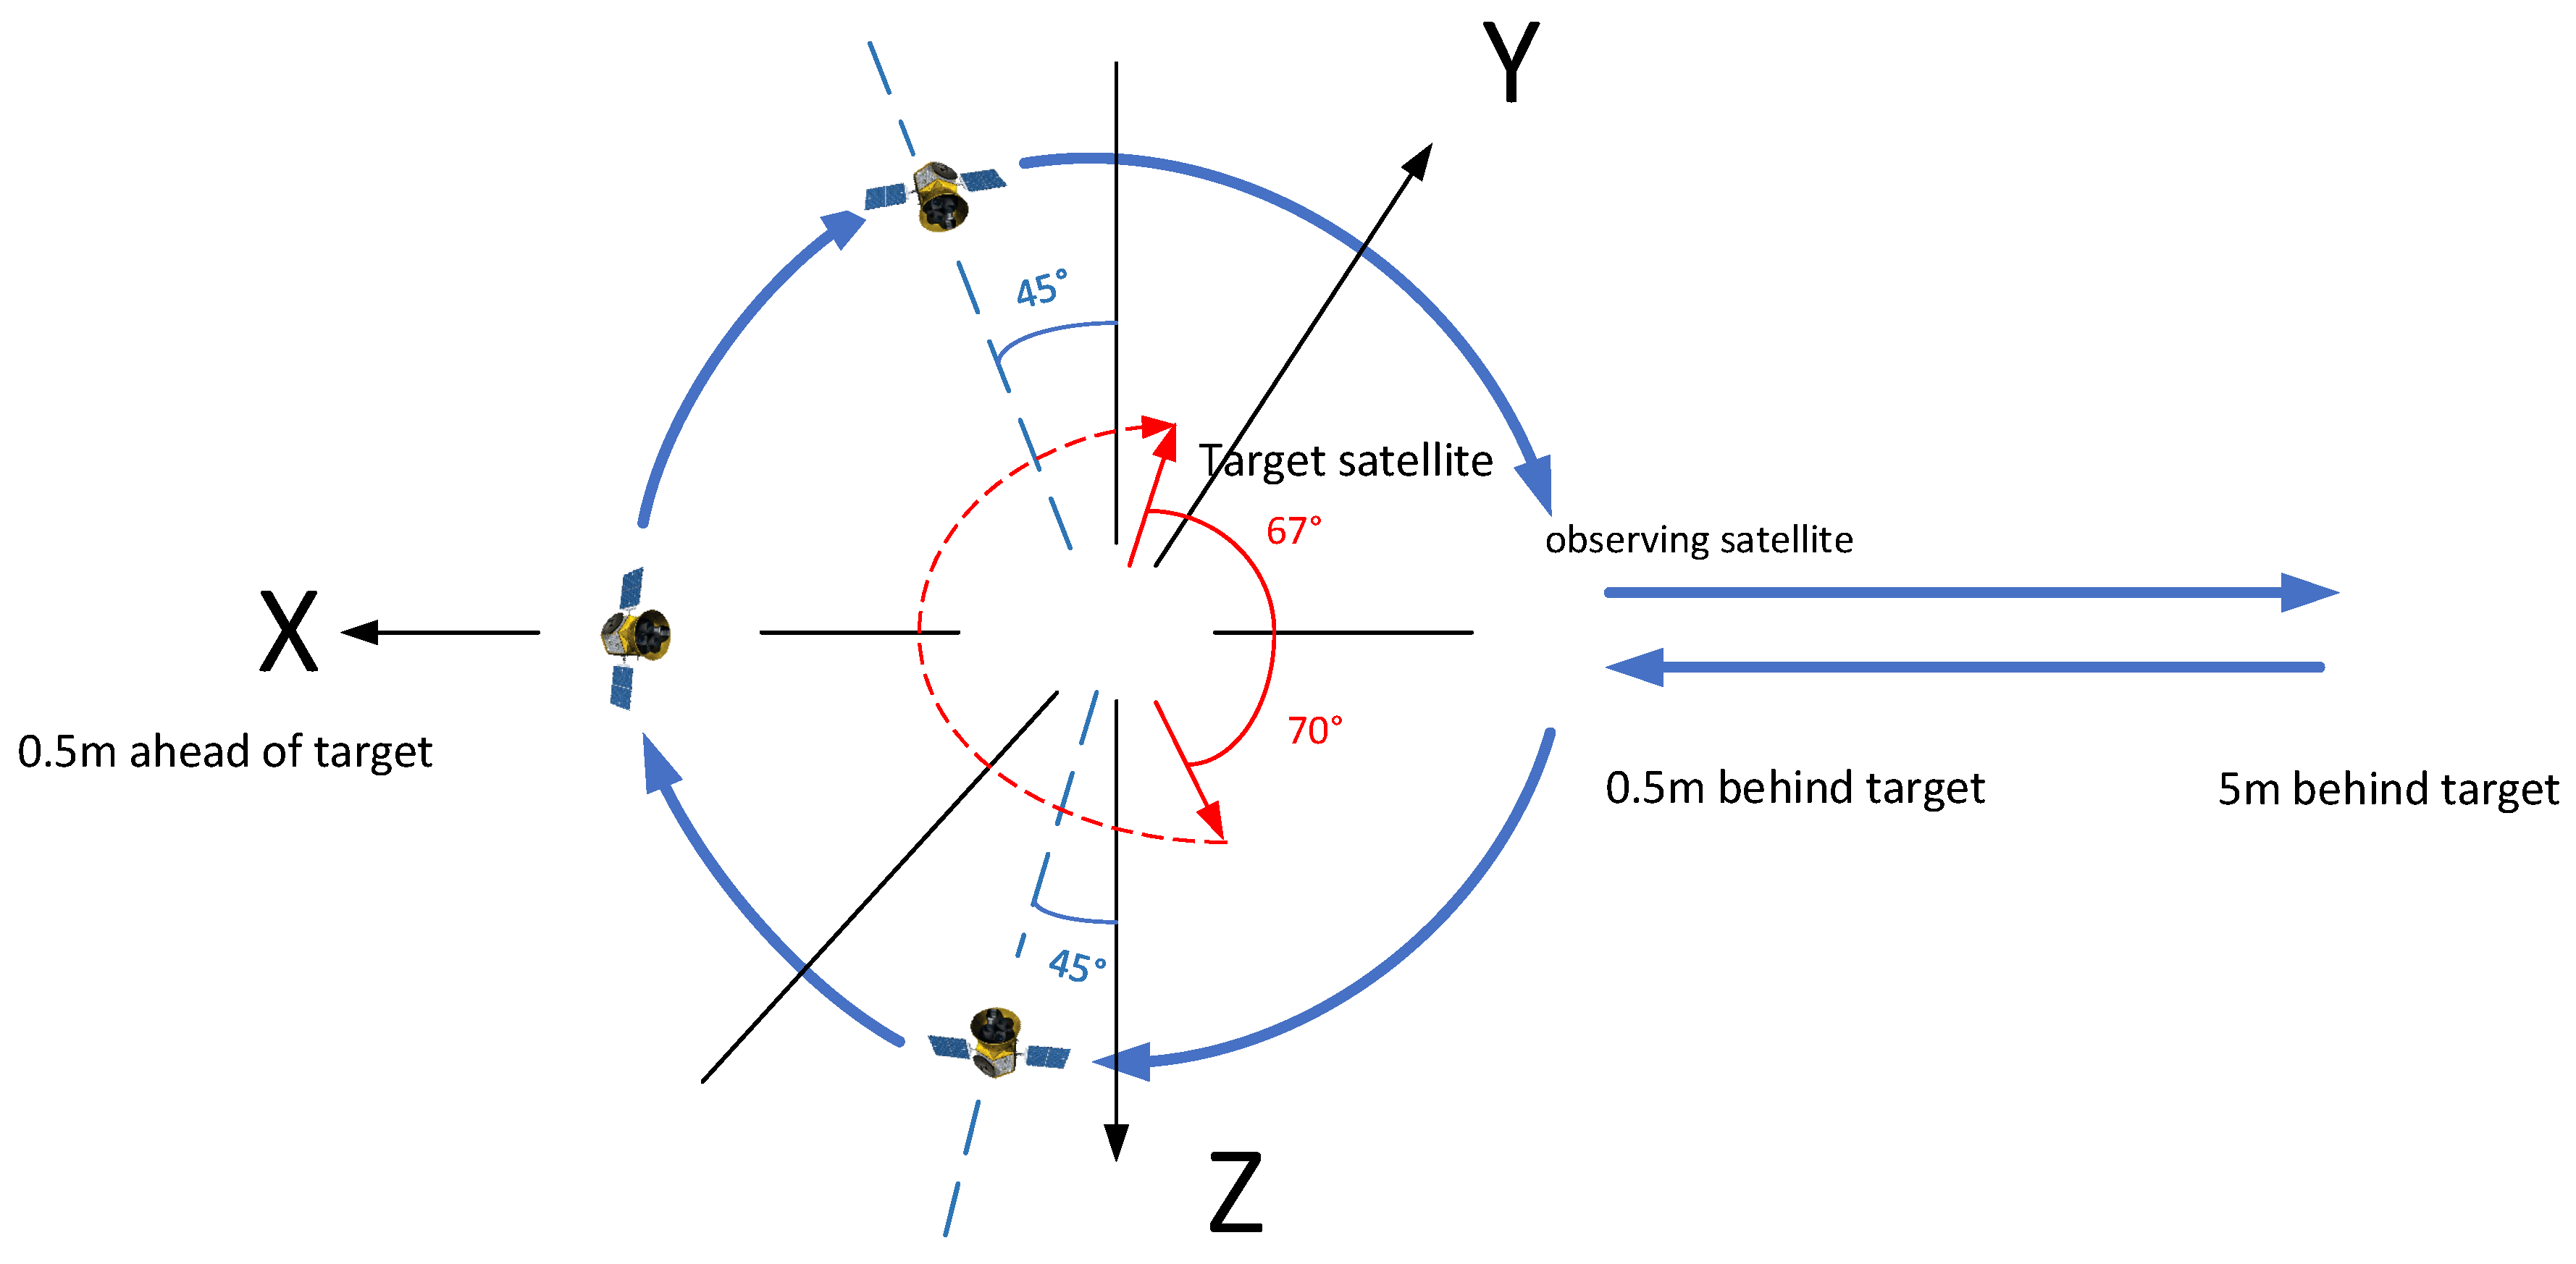
Occlusion Status: In practical capture scenarios, a flyby stage exists in the motion states between the target satellite and the observing satellite. During the flyby stage, as illustrated in Figure 5, the observing satellite maneuvers around the target satellite along the positive or negative X-axis direction. Throughout this flyby, the observing satellite may capture images with the main body of the target satellite occluding the solar panels, resulting in the missed or failed detection of critical satellite components. To simulate the flyby stage, the camera was fixed at a distance of 0.5 m from the satellite to observe the flyby of the target. The captured images, exemplified using the BeiDou satellite, are depicted in Figure 6. The flyby status between the target satellite and the observing satellite significantly impacted the detection accuracy of the key satellite components. However, this aspect has also been disregarded in other published datasets.

3.3. Data Augmentation

Data augmentation techniques offer a potent solution to the challenge of small original datasets. Through the augmentation of the data, these techniques effectively increase the number of samples in the dataset, thereby mitigating the risk of overfitting in models. Data augmentation plays a pivotal role in enhancing a model’s generalization ability, improving robustness, and optimizing training outcomes, particularly in scenarios where data are limited. There are two primary approaches to data augmentation. The first approach is offline augmentation, where all augmentations are precomputed and subsequently provided to the network for learning. This method is well-suited for smaller datasets, enabling a substantial increase in the number of images through techniques such as rotation, translation, and flipping. The second approach is online augmentation, where the original data are directly transmitted to the network for batch-wise transformation. This method is more suitable for larger datasets.
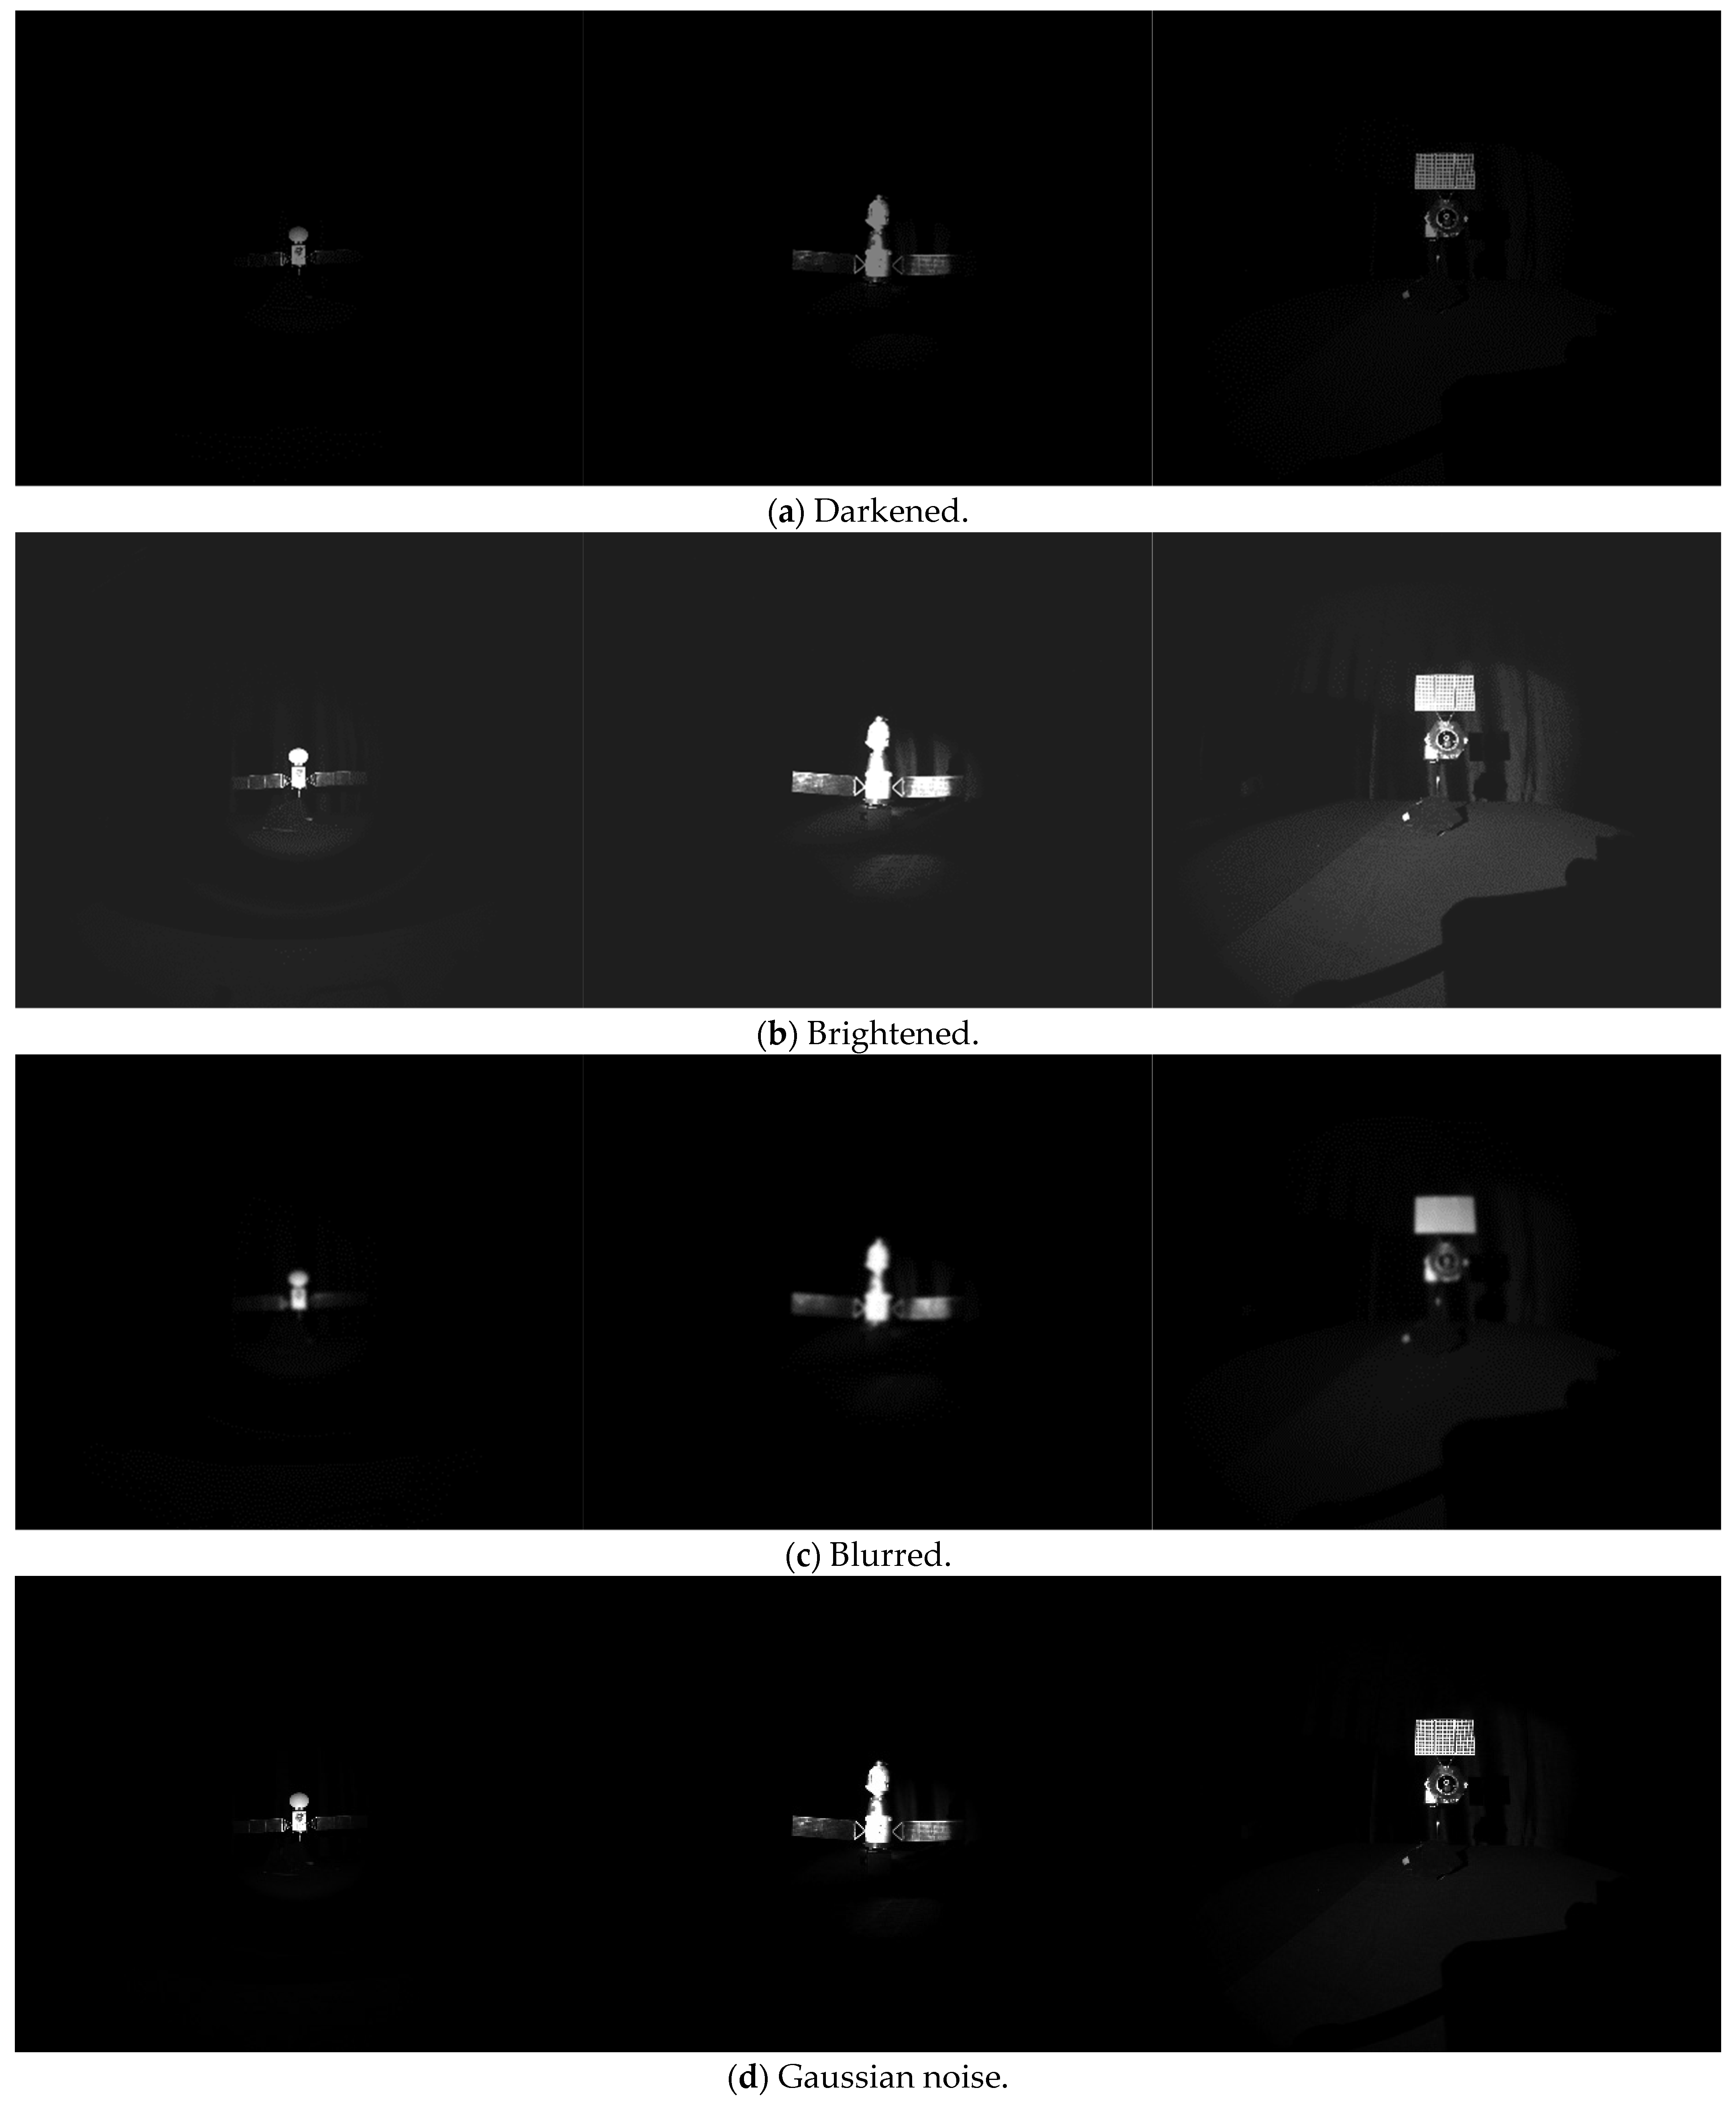
This work employed offline data augmentation techniques using the software tool PyCharm Community Edition 2023.2.3., The data augmentation techniques encompassing darkening, brightening, blurring, adding Gaussian noise, mirroring, rotating the original image by 90 degrees, and rotating by 180 degrees. Subsequently, the images with darkening, brightening, blurring, and noise were flipped by 90 and 180 degrees. Following this, brightness adjustment and noise addition were applied to the flipped images. As a result of these operations, the dataset was expanded 20 times compared to the original. Figure 7 illustrates some examples of the effects of data augmentation.
After augmentation, the dataset was split into training, testing, and validation sets at a ratio of 8:1:1. A total of 31,880 images were collected, with 25,504 used for training, 3188 for testing, and 3188 for validating. The number of dataset samples for each condition is shown in Table 5.

3.4. Image Annotation

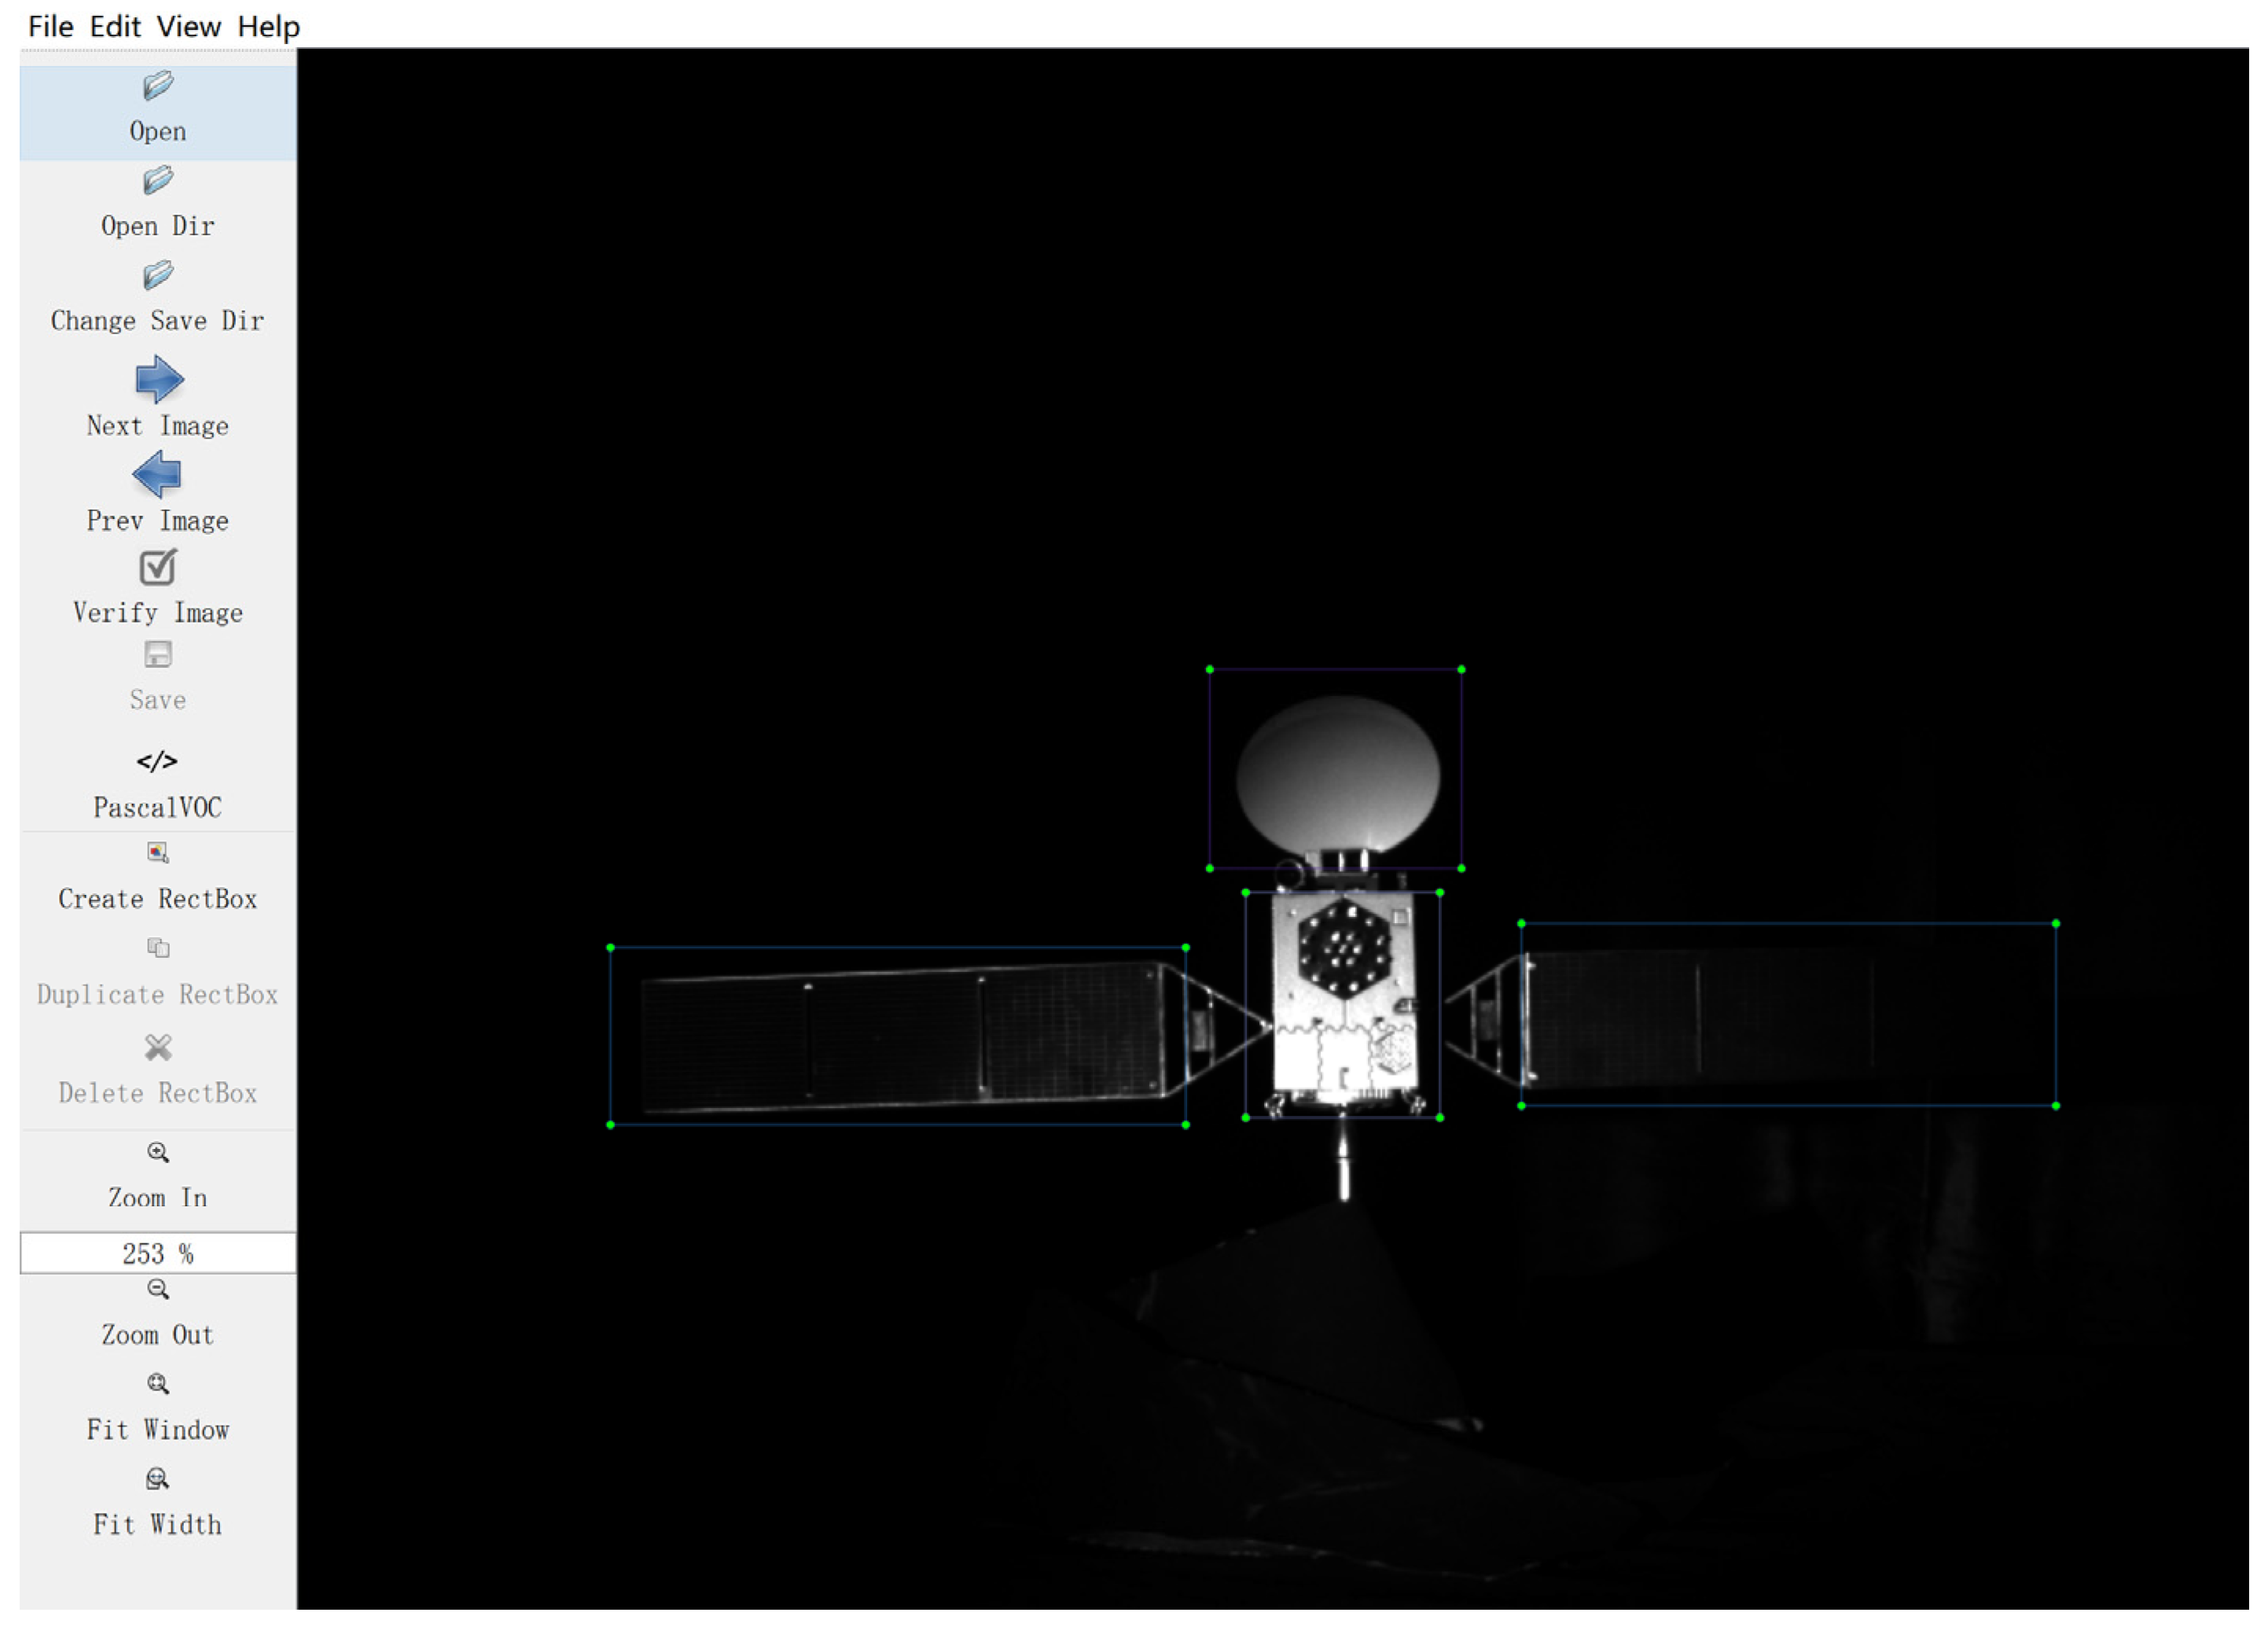
To ensure the success of space capture missions, three key components on the capture surface are annotated, including solar panel, satellite body, and radar. In addition, Labellmg [30] was utilized for marking the collected images by drawing rectangular bounding boxes around the key components. To attain high-quality spatial target annotations for each image, we engaged ten trained annotators and tasked them with annotating the three key components. This was followed with three rounds of cross-checking and correction to enhance the annotation quality. The entire annotation process, involving 25,504 images, was completed in approximately one month. The position of each key component was described with a bounding box, denoted as ( x m a x , y m a x , x m i n , y m i n ), where ( x m a x , y m a x ) represents the maximum coordinates of the bounding box vertices, and ( x m i n , y m i n ) represents the minimum coordinates of the bounding box vertices. The annotated images and their corresponding labels were structured according to the standard COCO format dataset. The annotation results are depicted in Figure 8.

4. Evaluation

To establish a general benchmark for the key satellite component detection, an analysis of recent popular models and representative classic models was conducted. Subsequently, the detection results and initial detection benchmarks were analyzed, followed by a visual analysis of the detection results of satellites under different illuminations, motion states, and occlusions.

4.1. Training Parameters

In all models for training detection methods, for the sake of fairness, the parameters such as epoch and learning rate for each benchmark were consistent. Specifically, the parameters were set as follows: epoch was set to 50, learning rate was set to 0.01, momentum was set to 0.937, and batch size was set to 8. Additionally, various techniques, including random cropping, rotation, flipping, and other data augmentation methods, were employed to reduce the risk of overfitting. We also utilized cross validation to evaluate the performance of the models during the detection model training. The basic training framework was PyTorch, and the hardware used was NVIDIA GeForce GTX 1650Ti.

4.2. Evaluation Criteria

In key component detection models, intersection over union (IoU) and average precision (AP) were selected as evaluation metrics to assess the detection benchmarks. First, IoU is defined as follows:
I I o U = b p r e d , b g t = A r e a b p r e d b g t A r e a b p r e d b g t
where b g t represents the ground-truth bounding box of the object and b p r e d represents the detected bounding box. IoU was used to evaluate the accuracy of the predicted bounding boxes.
The IoU threshold is a predefined constant represented as Ω . When IoU ( b g t , b p r e d ) > Ω , the image in b p r e d is considered a positive sample (containing an object); otherwise, it is considered a negative sample (background). Based on IoU and the IoU threshold, the precision (P) and recall (R) for object detection can be calculated as follows:
P = T T P T T P + F F P
R = T T P T T P + F F N
where T T P , F F P , and F F N represent the true positive rate, false positive rate, and false negative rate, respectively. They denote the number of positive samples predicted correctly, the number of negative samples predicted as positive, and the number of background samples incorrectly detected as positive, respectively. When calculating precision and recall, the IoU threshold Ω is generally set to 0.5.
Average precision (AP) is also a frequently used metric in object detection, and its calculation formula is as follows:
A A P = 0 1 P t d t
where P(t) represents the precision at IoU threshold Ω = t.
The mean average precision (mAP) is used as an evaluation metric, and its mathematical expression is
m m A P = n = 1 N A A P n N
where N represents the number of object categories, and A A P n represents the average precision of the algorithm for the nth class of objects.

4.3. Key Component Detection Benchmark

To establish the initial detection benchmark for the TYCOS dataset, we conducted experiments using eight models. These models encompassed various versions of the YOLO series, including the YOLOv3, YOLOv4, YOLOv5, YOLOv6, YOLOv7, YOLOv8, YOLOF, and YOLOX detection models. YOLOv3 represents an early- and single-stage model aimed at improving the real-time performance. YOLOF and YOLOX, on the other hand, are advances on YOLOv3, integrating anchor-free or encoder structures. Inspired by YOLOX, YOLOv8 adopts an anchor-free approach, which excels in detecting irregularly shaped objects, thereby further enhancing the detection accuracy and speed.
Table 6 presents the AP results for the eight detection models, with the highest AP values highlighted in bold. From Table 6, we note that the accuracy of the YOLO series models on the spatial object dataset was consistently above 75.34%, with the maximum accuracy reaching 93.94%. Regarding the accuracy for each key component, 1 (solar panel) achieved its highest accuracy in YOLOv8, reaching 91.07%; meanwhile, its lowest accuracy was observed in YOLOv3, at 64.31%. Component 2 (body) attained its highest accuracy in YOLOv8, reaching 99.67%. Similarly, 3 (radar) also achieved its highest accuracy in YOLOv8, reaching 91.09%. YOLOv8 exhibited the highest AP values among single-stage detection models, with an average increase of 16.98% compared to other detection models. In summary, the YOLOv8 single-stage detection model demonstrated advantages in detecting the key components of satellites.
In Table 6, it can be seen that the precision of detection for 1 (solar panel)—was lower compared to 2 (body) and 3 (radar). The solar panel has a rectangular shape, and there is a large variation in the aspect ratio within the image field of view, indicating that lighting, motion, and occlusion have a greater impact on the features of the solar panel.

4.4. Visualization

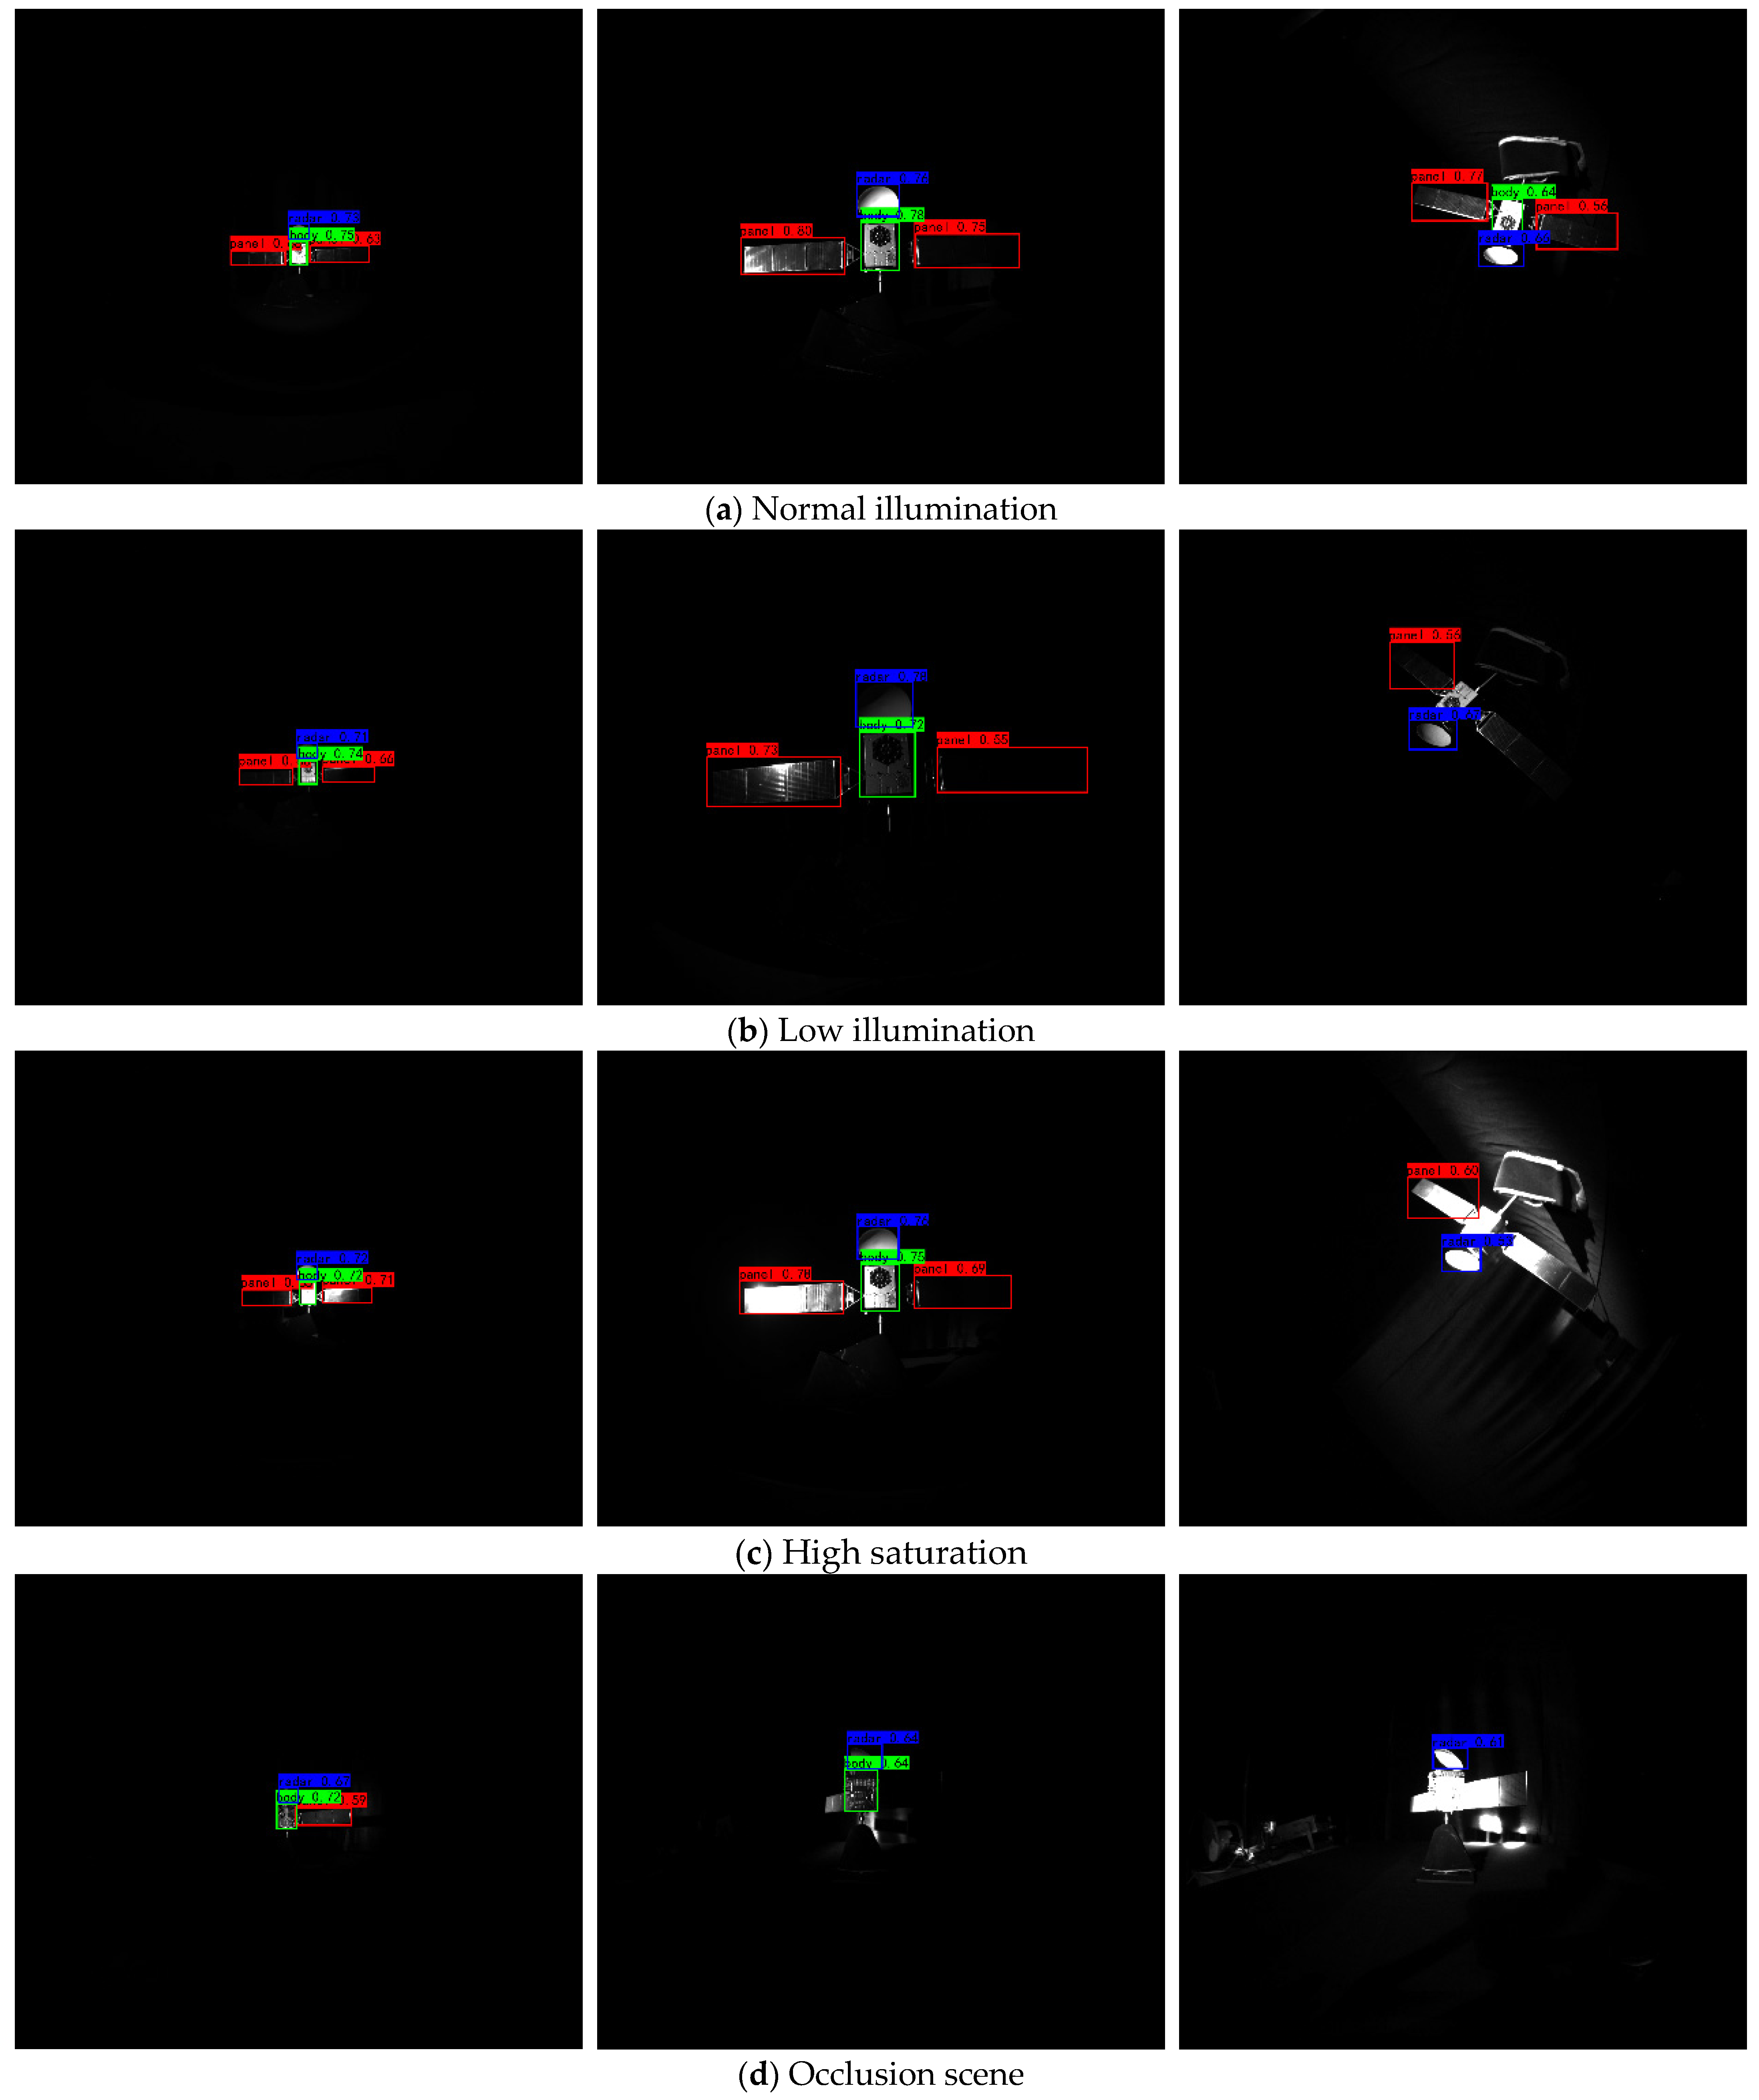
To display the superiority of our detection benchmark (YOLOv8), we visualized the detection results for 12 common scenarios encountered in satellite capture operations. Figure 9a displays the image detection results of the malfunctioning satellite during the hovering, approaching, and rolling phases under normal illumination conditions. Figure 9b presents the image detection results of the malfunctioning satellite during the hovering, approaching, and rolling phases under low illumination. Figure 9c illustrates the image detection results of the malfunctioning satellite during the hovering, approaching, and rolling phases under high saturation conditions. Lastly, Figure 9d depicts the detection results of the malfunctioning satellite under occlusion conditions in normal illumination, low illumination, and high saturation conditions.
From Figure 9a–c, it can be observed that, due to the imaging characteristics of low lighting and high saturation caused by the angle of light and the capture plane, the detection accuracy of key components was reduced or even missed. Therefore, the detection results of key components were easily affected by lighting and distance. Under extreme lighting conditions at long distance, key components such as solar panels cannot be detected. Figure 9d shows that when the solar panels of the malfunctioning satellite are partially obscured in motion, they are undetectable. Therefore, the occlusion of key regions of space object components has a significant impact on their detection and recognition.

4.5. A Quantitative Comparison with Other Datasets

To accurately demonstrate the advantages and novelty of the TYCOS dataset, quantitative comparisons were made with SPEED and SPEED+. SPEED and SPEED+ are currently publicly available unified datasets for satellite detection and key component segmentation. SPEED is constructed from synthetic images obtained from the internet, while SPEED+ is constructed from synthetic images obtained from the internet augmented with real-shot data from a semi-physical environment. To compare the challenges of the three datasets, the performance of some detection models was compared using all three datasets. The best-performing detection models (Faster R-CNN, YOLOv3, YOLOv5, YOLOv8) were trained on the SPEED, SPEED+, and TYCOS datasets. For a fair comparison, 3404 images were randomly selected from the SPEED and SPEED+ datasets, and divided into training, validation, and testing sets in an 8:1:1 ratio. Since the SPEED and SPEED+ datasets can only detect solar panels and satellite bodies, we found (as illustrated in Table 6) that the solar panel AP was lower than that of the satellite bodies and radar, indicating that the solar panels of the satellite were most affected by external interference. Therefore, we chose the solar panel AP value from the TYCOS dataset as the evaluation metric. The detection results are shown in Table 7. Due to the challenges of the dataset, the performance of all models using the TYCOS dataset was relatively low. However, since extreme lighting conditions, satellite motion states, and occlusion states in space were not considered, the SPEED and SPEED+ datasets were simpler datasets. Therefore, all models achieved the highest performance using SPEED, followed by SPEED+. This indicates that the current detection models have lower detection rates using the TYCOS dataset compared to synthetic image datasets, demonstrating that the TYCOS dataset more realistically reflects the authenticity of the space environment and is more suitable for validating modified detection models.

5. Conclusions

In this paper, we built TYCOS, a specialized dataset for the detection of typical components of space satellites. In contrast to conventional work that treats a single target as a whole, as in existing datasets, we leveraged more refined structural components as the indicators for satellite object detection. We conducted simulations of numerous typical and challenging working conditions, with the aim of representing the space targets and scenes captured with on-orbit satellites. In consideration of the future application of the dataset, we also established a benchmark for detecting typical satellite components and performed qualitative and quantitative evaluations of state-of-the-art object detection algorithms. We believe that the proposed TYCOS dataset will provide valuable guidance for the development of space scene perception and satellite safety.
In our future work, we plan to expand the number of categories and increase the size of the datasets. Additionally, we aim to design several novel satellite object detectors through a part-to-whole detection framework based on TYCOS.

Author Contributions

Conceptualization and methodology, H.B.; software and validation, Z.Z. and J.D.; formal analysis and investigation, Z.Z.; resources and data curation, J.D.; writing—original draft preparation, H.B.; writing—review and editing, C.L. and Z.Z.; visualization, J.D; supervision, J.C. and G.Z.; project administration and funding acquisition, C.L. All authors have read and agreed to the published version of the manuscript.

Funding

This research is supported financially by the Photon Plan in Xi’an Institute of Optics and Precision Mechanics of Chinese Academy of Sciences (Grant No. S24-025-III).

Institutional Review Board Statement

Not applicable.

Informed Consent Statement

Not applicable.

Data Availability Statement

The test subset of the proposed TYCOS dataset built in this work is available at: https://github.com/Patrick-Li-CAS/TYCOS (accessed on 27 April 2024). The entire dataset will be released in the near future.

Acknowledgments

We thank the editor and anonymous reviewers for their suggestions and comments that ameliorated our work.

Conflicts of Interest

The authors declare no conflicts of interest.

References

  1. Schild, M.; Noomen, R. Sun-synchronous spacecraft compliance with international space debris guidelines. Adv. Space Res. Off. J. Comm. Space Res. COSPAR 2023, 72, 2585–2596. [Google Scholar] [CrossRef]
  2. Bao, W.; Yin, C.; Huang, X.; Wei, Y.I.; Dadras, S. Artificial intelligence in impact damage evaluation of space debris for spacecraft. Front. Inf. Technol. Electron. Eng. 2022, 23, 511–514. [Google Scholar] [CrossRef]
  3. Hu, D.Q.; Chi, R.Q.; Liu, Y.Y.; Pang, B.J. Sensitivity analysis of spacecraft in micrometeoroids and orbital debris environment based on panel method. Def. Technol. 2023, 19, 126–142. [Google Scholar] [CrossRef]
  4. Xie, X.; Lang, C.; Miao, S.; Cheng, G.; Li, K.; Han, J. Mutual-Assistance Learning for Object Detection. IEEE Trans. Pattern Anal. Mach. Intell. 2023, 45, 15171–15184. [Google Scholar] [CrossRef] [PubMed]
  5. Ge, Z.; Zhang, Y.; Jiang, Y.; Ge, H.; Wu, X.; Jia, Z.; Wang, H.; Jia, K. Lightweight YOLOv7 Algorithm for Multi-Object Recognition on Contrabands in Terahertz Images. Appl. Sci. 2024, 14, 1398. [Google Scholar] [CrossRef]
  6. Law, H.; Deng, J. CornerNet: Detecting Objects as Paired Keypoints. Int. J. Comput. Vis. 2020, 128, 642–656. [Google Scholar] [CrossRef]
  7. Bechini, M.; Lavagna, M.; Lunghi, P. Dataset generation and validation for spacecraft pose estimation via monocular images processing. Acta Astronaut. 2023, 204, 358–369. [Google Scholar] [CrossRef]
  8. Khoroshylov, S.; Redka, M. Deep learning for space guidance, navigation, and control. Space Sci. Technol. 2021, 27, 38–52. [Google Scholar]
  9. Izzo, D.; Märtens, M.; Pan, B. A survey on artificial intelligence trends in spacecraft guidance dynamics and control. Astrodynamics 2019, 3, 287–299. [Google Scholar] [CrossRef]
  10. Wang, C.Y.; Bochkovskiy, A.; Liao, H.Y.M. YOLOv7: Trainable bag-of-freebies sets new state-of-the-art for real-time object detectors. In Proceedings of the IEEE/CVF Conference on Computer Vision and Pattern Recognition (CVPR), Vancouver, BC, Canada, 17–24 June 2023. [Google Scholar]
  11. Boezio, M.; Munini, R.; Picozza, P. Cosmic ray detection in space. Prog. Part. Nucl. Phys. 2020, 112, 103765. [Google Scholar] [CrossRef]
  12. Dong, A.; Liu, X. Automated detection of corona cavities from SDO images with YOLO. In Proceedings of the 2021 IEEE Seventh International Conference On Multimedia Big Data (Bigmm), Taichung, Taiwan, 15–17 November 2021; pp. 49–56. [Google Scholar]
  13. Leira, F.S.; Helgesen, H.H.; Johansen, T.A.; Fossen, T.I. Object detection, recognition, and tracking from UAVs using a thermal camera. J. Field Robot. 2021, 38, 242–267. [Google Scholar] [CrossRef]
  14. Liu, J.; Zhao, P.; Wu, C.; Chen, K.; Ren, W.; Liu, L.; Tang, Y.; Ji, C.; Sang, X. SIASAIL-I solar sail: From system design to on-orbit demonstration mission. Acta Astronaut. 2022, 192, 133–142. [Google Scholar] [CrossRef]
  15. Lei, G.; Yin, C.; Huang, X.; Cheng, Y.H.; Dadras, S.; Shi, A. Using an Optimal Multi-Target Image Segmentation Based Feature Extraction Method to Detect Hypervelocity Impact Damage for Spacecraft. IEEE Sens. J. 2021, 21, 20258–20272. [Google Scholar] [CrossRef]
  16. Jiao, L.; Zhang, R.; Liu, F.; Yang, S.; Hou, B.; Li, L.; Tang, X. New Generation Deep Learning for Video Object Detection: A Survey. IEEE Trans. Neural Netw. Learn. Syst. 2022, 33, 3195–3215. [Google Scholar] [CrossRef] [PubMed]
  17. Juliu, L.; Xiangsuo, F.; Huajin, C.; Bing, L.; Lei, M.; Zhiyong, X. Dim and Small Target Detection Based on Improved Spatio-Temporal Filtering. IEEE Photonics J. 2022, 14, 7801211. [Google Scholar] [CrossRef]
  18. Xiang, A.; Zhang, L.; Fan, L. Shadow removal of spacecraft images with multi-illumination angles image fusion. Aerosp. Sci. Technol. 2023, 140, 108453. [Google Scholar] [CrossRef]
  19. Kang, J.; Tariq, S.; Oh, H.; Woo, S.S. A Survey of Deep Learning-Based Object Detection Methods and Datasets for Overhead Imagery. IEEE Access 2022, 10, 20118–20134. [Google Scholar] [CrossRef]
  20. Chen, W.; Wang, H.; Li, H.; Li, Q.; Yang, Y.; Yang, K. Real-Time Garbage Object Detection with Data Augmentation and Feature Fusion Using SUAV Low-Altitude Remote Sensing Images. IEEE Geosci. Remote Sens. Lett. 2022, 19, 6003005. [Google Scholar] [CrossRef]
  21. Huang, C.; Yang, Z.; Wen, J.; Xu, Y.; Jiang, Q.; Yang, J.; Wang, Y. Self-Supervision-Augmented Deep Autoencoder for Unsupervised Visual Anomaly Detection. IEEE Trans. Cybern. 2022, 52, 13834–13847. [Google Scholar] [CrossRef]
  22. Park, T.H.; Mrtens, M.; Lecuyer, G.; Izzo, D.; D’Amico, S. SPEED+: Next-Generation Dataset for Spacecraft Pose Estimation across Domain Gap. In Proceedings of the IEEE Aerospace Conference (AERO), Big Sky, MT, USA, 5–12 March 2022. [Google Scholar]
  23. Zhang, C.; Guo, B.; Liao, N.; Zhong, Q.; Liu, H.; Li, C.; Gong, J. STAR-24K: A Public Dataset for Space Common Target Detection. KSII Trans. Internet Inf. Syst. 2022, 16, 365–380. [Google Scholar]
  24. Han, J.; Ding, J.; Li, J.; Xia, G.-S. Align Deep Features for Oriented Object Detection. IEEE Trans. Geosci. Remote Sens. 2022, 60, 5602511. [Google Scholar] [CrossRef]
  25. Liu, F.; Chen, R.; Zhang, J.; Xing, K.; Liu, H.; Qin, J. R2YOLOX: A Lightweight Refined Anchor-Free Rotated Detector for Object Detection in Aerial Images. IEEE Trans. Geosci. Remote Sens. 2022, 60, 5632715. [Google Scholar] [CrossRef]
  26. Kisantal, M.; Sharma, S.; Park, T.H.; Izzo, D.; Martens, M.; D’Amico, S. Satellite Pose Estimation Challenge: Dataset, Competition Design, and Results. IEEE Trans. Aerosp. Electron. Syst. 2020, 56, 4083–4098. [Google Scholar] [CrossRef]
  27. Hoang, D.A.; Chen, B.; Chin, T.J. A Spacecraft Dataset for Detection, Segmentation and Parts Recognition. arXiv 2021, arXiv:2106.08186. [Google Scholar]
  28. Musallam, M.A.; Gaudilliere, V.; Ghorbel, E.; Ismaeil, K.A.; Perez, M.D.; Poucet, M.; Aouada, D. Spacecraft Recognition Leveraging Knowledge of Space Environment: Simulator, Dataset, Competition Design and Analysis. In Proceedings of the 2021 IEEE International Conference on Image Processing Challenges (ICIPC), Anchorage, AK, USA, 19–22 September 2021. [Google Scholar]
  29. Musallam, M.A.; Ismaeil, K.A.; Oyedotun, O.; Perez, M.D.; Poucet, M.; Aouada, D. SPARK: SPAcecraft Recognition leveraging Knowledge of Space Environment. arXiv 2021, arXiv:2104.05978. [Google Scholar]
  30. Mahendrakar, T.; White, R.T.; Wilde, M.; Kish, B.; Silver, I. Real-time satellite component recognition with YOLO-V5. In Proceedings of the 35th Annual Small Satellite Conference, Online, 7–12 August 2021. [Google Scholar]
  31. Xu, J.; Song, B.; Yang, X.; Nan, X. An Improved Deep Keypoint Detection Network for Space Targets Pose Estimation. Remote Sens. 2020, 12, 3857. [Google Scholar] [CrossRef]
  32. Chen, Y.; Gao, J.; Zhang, K. R-CNN-Based Satellite Components Detection in Optical Images. Int. J. Aerosp. Eng. 2020, 2020, 8816187. [Google Scholar] [CrossRef]
  33. Cao, Y.; Cheng, X.; Mu, J.; Li, D.; Han, F. Detection Method Based on Image Enhancement and an Improved Faster R-CNN for Failed Satellite Components. IEEE Trans. Instrum. Meas. 2023, 72, 5005213. [Google Scholar] [CrossRef]
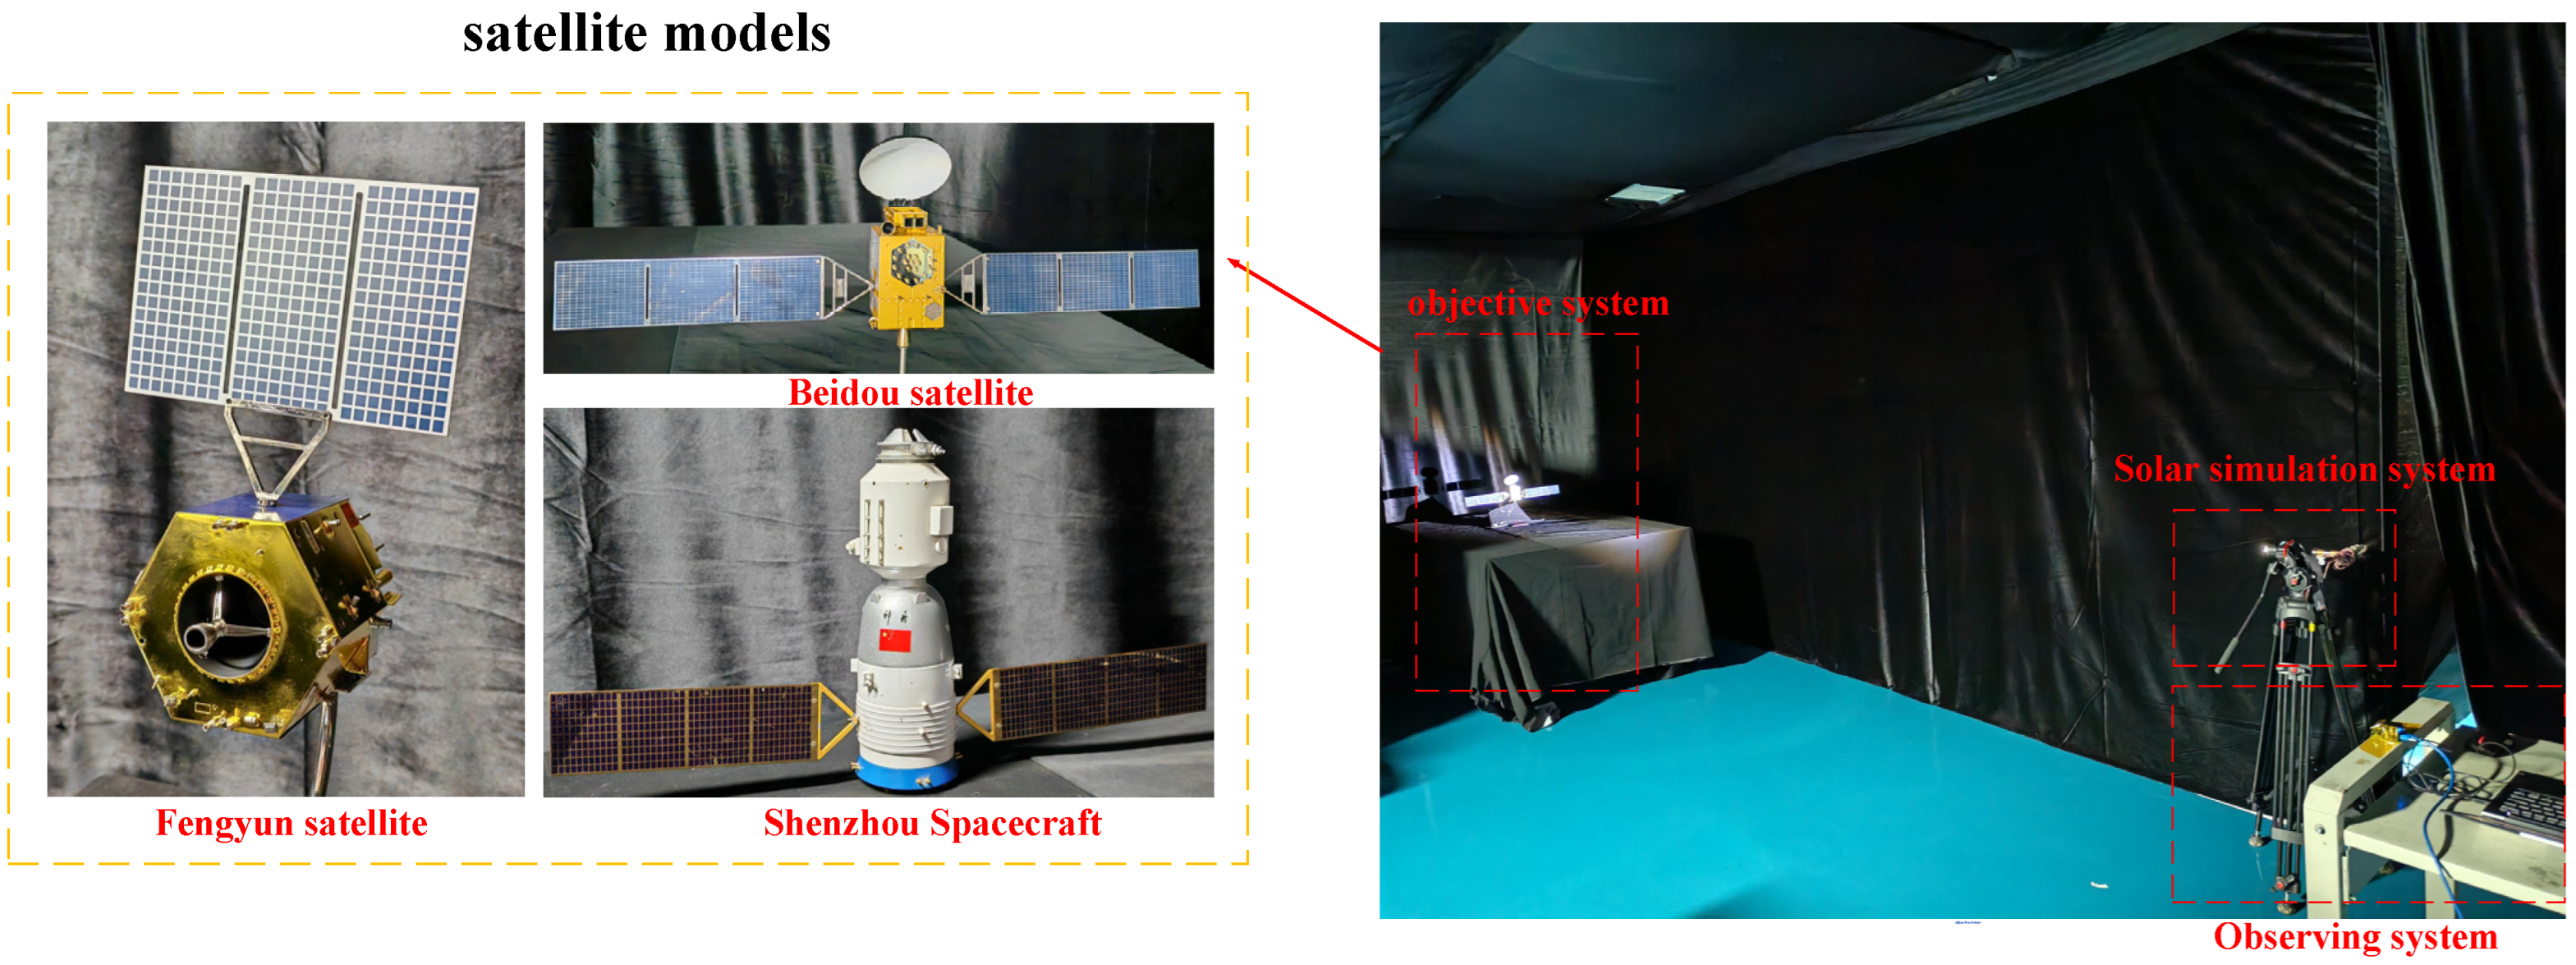
Figure 1. The semi-physical acquisition system for simulating the space environment.
Applsci 14 04757 g001
Figure 2. Examples of satellite target appearance under different illumination conditions.
Applsci 14 04757 g002
Figure 3. Examples of the satellite target in approaching and hovering states.
Applsci 14 04757 g003aApplsci 14 04757 g003b
Figure 4. Examples of the satellite target in rolling states.
Applsci 14 04757 g004aApplsci 14 04757 g004b
Figure 5. A schematic diagram of spatial target circumnavigation.
Applsci 14 04757 g005
Figure 6. An example of satellite body occlusion of flyover windsurfing board in flyover state (local clipped effect).
Applsci 14 04757 g006
Figure 7. Examples of data augmentation effects.
Applsci 14 04757 g007
Figure 8. Examples of annotation results using Labellmg.
Applsci 14 04757 g008
Figure 9. The performance of YOLOv8 in different scenarios in TYCOS.
Applsci 14 04757 g009
Table 1. A comparison and analysis of existing datasets.
DatasetSPEEDSPEED+DungSPARKSatellite-DS
SceneSyntheticSynthetic and realSyntheticSyntheticReal
IlluminationYesYesNoNoYes
Motion StatesNoNoNoNoYes
OcclusionNoNoNoNoNo
Resolution1920 × 12001920 × 12001280 × 720256 × 2561936 × 1456
Categories442119
ApplicationPose estimationPose estimationPose estimationPose estimationDetection segmentation
Open SourceYesYesYesYesNo
Table 2. The parameters of different satellite models.
SatelliteProportionDimensions
(l × w × h) (mm)
Dimensions of the
Solar Panels (mm)
Mass (kg)
BeiDou-31:35510 × 70 × 140200 × 500.79
Fengyun-41:30240 × 150 × 280153 × 1020.79
Shenzhou-141:40180 × 370 × 300164 × 501.46
Table 3. The main parameters of the MV-CH050.
ParametersValue
Detector SignalIMX250
Pixel Size3.45 μm × 3.45 μm
Target Surface Size2/3″
Resolution2432 × 2048
Dynamic Range75.4 dB
Gain0 dB~20 dB
Exposure Time15 μs 10 s
Frame Rate140 fps
Table 4. The parameters of the lighting device.
ParametersValue
LED BulbT6
Weight145 g
Sourceone
Dimensions9.5 × 6.2 × 8.8 cm
Table 5. The statistics of the number of different states in the dataset.
StatesClassificationStatisticNumber of Instances in Dataset
IlluminationsLow illumination34159564
High saturation2968
Normal illumination3181
Motion StatesApproaching states523615,940
Hovering states5191
Random roll state5513
Occlusion StatesPartial occlusion on the left side26576376
Partial occlusion on the right side2385
Complete occlusion1334
Total 31,880
Table 6. The AP results of eight detection models.
NumberModelMain Network1—Solar Panel2—Body3—RadarmAP
1YOLOv3DarkNet64.3188.1673.5475.34
2YOLOv4DarkNet66.6390.7973.6177.01
3YOLOv5DarkNet71.2493.6071.5478.79
4YOLOv6DarkNet73.5193.6872.9880.06
5YOLOv7DarkNet85.6195.3280.2187.05
6YOLOv8DarkNet91.07 199.67 191.09 193.94 1
7YOLOFDarkNet73.5492.1874.0579.92
8YOLOXDarkNet75.6097.2278.9683.93
1 The bold font shows the highest AP value.
Table 7. The AP values for solar panel detection results using different methods on three datasets.
DatasetTypeFaster-R-CNNYOLOv3YOLOv5YOLOv8
SPEEDSynthetic93.09 171.28 178.57 193.56 1
SPEED+Synthetic and real92.2068.3775.0593.12
TYCOSReal90.6164.3171.2491.07
1 The bold font shows the highest AP value.
Disclaimer/Publisher’s Note: The statements, opinions and data contained in all publications are solely those of the individual author(s) and contributor(s) and not of MDPI and/or the editor(s). MDPI and/or the editor(s) disclaim responsibility for any injury to people or property resulting from any ideas, methods, instructions or products referred to in the content.