Abstract
Recent progress in the realm of imaging technologies has swiftly disseminated fresh methodologies for representing objects, broadening the horizons for scholars such as art historians, archaeologists, conservators, and conservation scientists. Reflectance Transformation Imaging (RTI) and three-dimensional (3D) modeling via Structure from Motion (SfM) have rapidly gained popularity and are being employed by a wide range of users, expanding the possibilities for understanding objects of material cultural heritage from different perspectives. This paper explores the outcomes achieved through the application of these techniques to gain deeper insights into the surface of a bas-relief within a confined space. This methodology enhanced our understanding of the original sandstone surfaces of the bas-relief by integrating RTI and 3D visualization, thereby acquiring a novel investigative tool with enhanced illumination possibilities. A data fusion approach is proposed using photogrammetry to produce a Virtual RTI (V-RTI). In the case study reported in this paper, focusing on one inner wall of the chapel of Ellesiya at the Museo Egizio of Turin, V-RTI was employed to obtain useful surface information in a context where conventional RTI would have been impossible to achieve. Finally, the study compares the different techniques through direct qualitative and quantitative analysis, highlighting possible future developments from both instrumental and methodological points of view.
1. Introduction
Understanding the features of an artifact’s surface can enrich its analysis from various points of view, offering morphological, dimensional, and chromatic information, shedding light on the artifact’s manufacturing process and facilitating the assessment of its conservation state.
To this aim, several imaging techniques are employed in the cultural heritage documentation field. Among many, raking light finds great application, since it highlights details that are often difficult to see with the naked eye, thus serving as a complementary tool alongside the more traditional diffuse light and multiband imaging analysis [1].
Nowadays, the necessity of integrating different sources of data to achieve a more accurate and detailed reconstruction of an artifact’s geometry and aspect is emerging, as highlighted by the application of imaging methodologies that are positioned at the intersection of the two-dimensional (2D) and three-dimensional (3D) worlds. For instance, Photometric Stereo and multi-light 3D surveying are examples of hybrid approaches that can be used to extract three-dimensional information from two-dimensional data [2]. Photometric Stereo is a widely used technique for evaluating the morphology of various subjects. It extracts 3D information from 2D data by varying the incidence of light on the subject, similarly to Reflectance Transformation Imaging (RTI) [2]. Another example of the hybrid approach is multi-light 3D surveying. This method combines close-range photogrammetry and multiband photography with variable incident light, resulting in a mosaic of enhanced orthographic images that enrich the knowledge of different materials and surface features [3,4].
Furthermore, the combination of 3D data obtained with different devices offers numerous opportunities for studying large-scale objects, for which close-range techniques would be neither practical nor feasible. Cartography and topography make increasing use of integrated data from total stations, laser scanners, Simultaneous Localization and Mapping systems (SLAM), and drone photogrammetry for surveying built environments [5,6]. Therefore, data fusion seems to be the most powerful approach to get the most out of each methodology, adapting the capture process to the contexts and the available equipment.
An imaging technique that is continuously evolving to meet the demands of research in the cultural heritage field is RTI. The RTI method’s popularity has led to the continuous development of tools and algorithms since its initial application [7]. RTI is a computational digital photography method for representing artifacts in two dimensions that is extensively utilized in the domain of cultural heritage imaging.It is a tool for visualizing and extracting morphological data from an object’s surface using photographs [8,9,10,11]. This approach accentuates the design, reflectivity, and structure of various artworks, such as coins [12], archaeological objects [13,14] or museum artefacts [12,13,14]. RTI is acquired using a stationary point camera, while the position of the light source is systematically adjusted by the operator prior to each image, following a predefined geometric scheme. The movement of the light source is arranged using a predefined geometric pattern, similar to the metal structure of an umbrella, yielding images ranging from raking (10°) to nadiral lighting (90°), encompassing intermediate angles as well (30°, 45°, and 60°). The workflow of RTI starts with the photographic acquisition of the object under study. Initially, images undergo color balance and export, before undergoing processing in dedicated software. This may include Relight [15], which utilizes a black sphere to mark the position of the light source in space [16].
Generally, there are a few common ways to collect suitable images for RTI. The traditional method, called Highlight-RTI (H-RTI), consists of manually moving a hand-held strobe at different heights to produce highlights on a black sphere placed near the subject [17,18]. In recent years, Dome RTI (D-RTI) has been introduced, in which data are collected using a dome at the center of which the object is located and then lit by automatically switching different light bulbs on and off [17,19,20,21]. Lately, also robotic arm-based systems have been presented in order to acquire images of large surfaces [17,22].
A significant advancement of RTI application in the field of cultural heritage relies on its integration with other imaging techniques, leading to the development of new approaches. Some examples are High Dynamic Range RTI, Multi-Spectral RTI, Fluorescence RTI, and Focus Variation RTI [17]. In all of the above-mentioned approaches, RTI is combined with other techniques to enrich the results that can be obtained. However, they have not overcome RTI’s limitations in the acquisition process, such as the requirement for a controlled environment for data acquisition, or the need to work with small to medium-sized objects.
In this context, the integration of advanced imaging techniques continues to evolve, enhancing the researcher’s ability to study cultural heritage artifacts in innovative ways. One such cutting-edge approach is the application of Virtual RTI (V-RTI) for the study and investigation of historical artifacts [23,24]. Indeed, this technique can bridge the gap between 2D and 3D data outputs and expand the possibilities of traditional photographic documentation [24], offering a versatile and dynamic multi-dimensional method for surface data digitization. V-RTI is based on the combination of RTI with Structure from Motion (SfM), which reconstructs three-dimensional information from overlapping 2D images [25,26,27], providing valuable insights into an object’s geometry and surface. Integrating these techniques within a single framework enables researchers to capture, visualize, and document the morphology of an artifact within particularly confined contexts, in which traditional RTI cannot be applied.
The process of collecting RTI data is heavily reliant on the location of the object under study, since the need to place the light source at a significant distance (equaling three or four times the object diameter) to ensure a uniform illumination. This condition is not always feasible, especially in cases when objects are wider than 1 m or placed within obstructed or confined locations. This circumstance often occurs in close proximity to archaeological sites, where artifacts may be occluded by environmental elements, or in museum galleries, storages, and archives, where large, fixed objects are confined by their built environment. This poses a significant challenge limiting the feasibility of the technique and therefore its availability to heritage professionals in the study of artifacts. V-RTI can help overcome some of these limitations imposed by the acquisition requirement of traditional RTI, due to its non-invasive nature, versatility, and cost-effectiveness, and since it can be deployed in many contexts. In a recent study, a hybrid approach for the creation of V-RTI adopting photogrammetry is proposed as an alternative to the current standard H-RTI method, including the rendering of the textured model in order to produce a V-RTI that can be easily navigated using a free viewer, like RTI Viewer [24]. This technique can be performed using both conventional (Digital Single Lens Reflex or mirrorless) and mobile phone cameras, establishing itself as an accessible and lightweight research tool for archaeologists, conservation scientists, and non-specialist users. Therefore, the use of V-RTI proves to be a successful approach to achieve correct illumination for large or inaccessible subjects for which a raking light would have been necessary, but not applicable in practice [24].
While V-RTI using SfM has shown to be a promising technique, it is not yet widely adopted as a common practice. Indeed, although the V-RTI appears to be an interesting informative tool, some conditions currently limit its full exploitation, including the challenge of capturing shadow-free and ambient light-independent images essential for the generation of a neutral and optimal texture. In this context, the primary goal of this research is to advance the methodology of V-RTI by addressing its current limitations and expanding its applicability within the field of cultural heritage. By integrating polarized light into the V-RTI workflow and using frontal light, this study aims to overcome these challenges and ensure accurate texture reproduction regardless of the ambient light conditions.
This paper aims to highlight the potential of a hybrid technique that integrates SfM photogrammetry and RTI to create a V-RTI and to provide a flexible methodology that can be employed to collect surface data of objects, particularly in confined contexts. The approach was applied in a case study regarding one inner wall of the chapel of Ellesiya at Museo Egizio of Turin, in which V-RTI was employed to collect useful surface information in a context where conventional RTI would have been impossible to achieve. The case study presented illustrates the potential of data fusion and aims to provide a possible solution to the issue of studying wall inscriptions in confined or obstructed sites. Finally, the study compares the different techniques through direct quantitative and qualitative analysis, highlighting possible future developments from both instrumental and methodological points of view. The quality of the photogrammetric 3D model of the bas-relief of Ellesiya was evaluated by comparison with a ground-truth obtained by a Structured Light Scanner. Then, the proposed workflow is applied to test artifacts, namely a small painting on copper, to visually compare equivalent portions that have been digitized using both the RTI and V-RTI techniques, in order to demonstrate the potential of this innovative methodology.
Ultimately, this study aims to provide cultural heritage experts with a more flexible and powerful tool for surface data collection, fostering deeper insights into an artifact morphology and thus contributing to its study and preservation.
2. Materials
In this section, the materials studied in this paper are presented. First, in order to compare V-RTI to traditional RTI, a small test object was selected. Then, the case study in which the proposed novel hybrid approach that integrates SfM photogrammetry and RTI to create a V-RTI, regarding the chapel of Ellesiya, an ancient Egyptian rock-cut temple dating back to around 1420 BCE and now housed at Museo Egizio in Turin, is presented.
2.1. Small Test Object for RTI vs. V-RTI Comparison
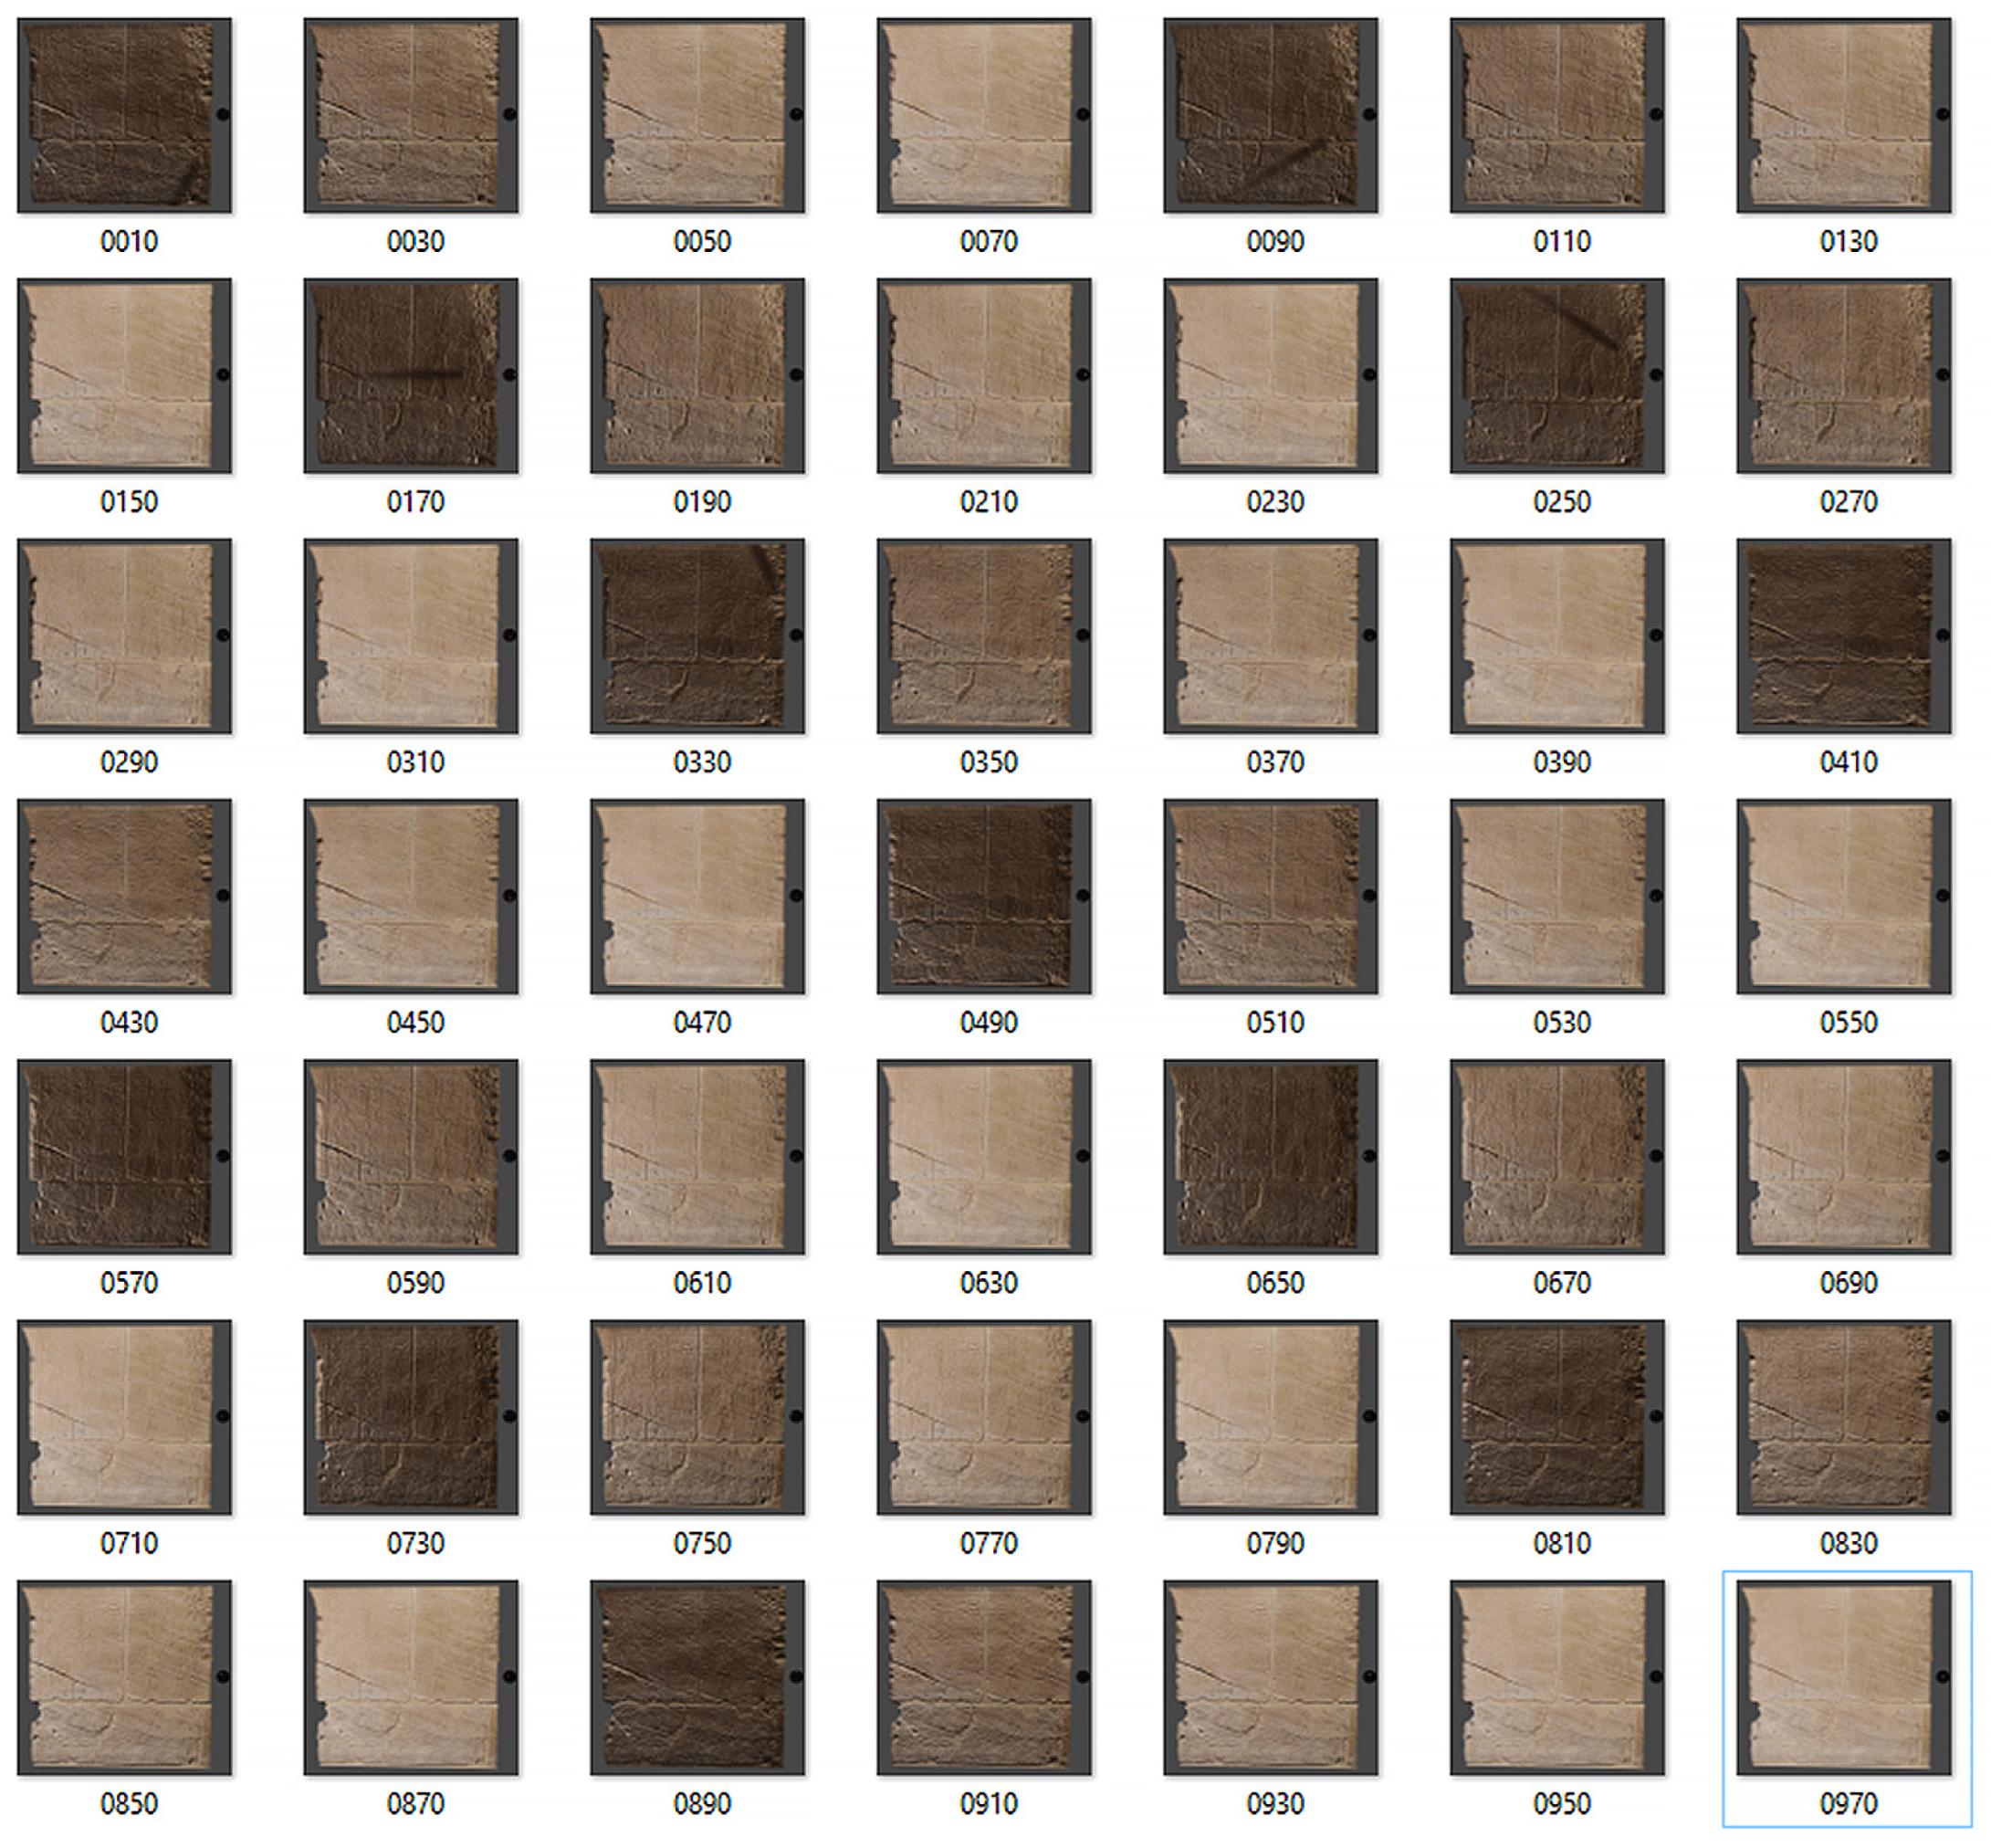
To compare V-RTI with traditional RTI, a small painting on copper was chosen. This small work, measuring 9 × 12 cm, was created by an unknown artist in recent years and was chosen as a test object because the surface is characterized by many intricate details and an irregular texture (Figure 1). Differences in thickness and color layering, variations in surface roughness, and defects in the flatness of the plate make this object ideal for evaluating the potential of V-RTI to reproduce these characteristics, so this object was chosen because of its morphological properties rather than its actual artistic value.
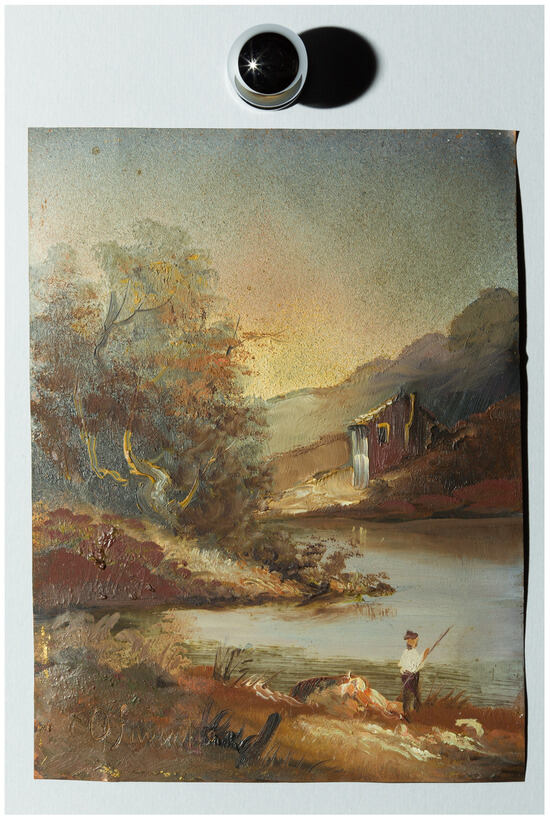
Figure 1.
Image of the small painting on copper used as test artifact, with reflective black sphere.
2.2. An Ancient Egyptian Bas-Relief
The subject under examination in this study is the chapel of Ellesiya, situated in a reconstructed state in the Museo Egizio in Turin since 1970. It was originally built during the reign of King Thutmosis III (1479–1425 BCE) at Ellesiya, a site close to Aniba, ancient Miam, the seat of Egyptian colonial power in Nubia. The chapel was dedicated to the deified king, Amun of Karnak, and Horus of Miam. The temple’s inner layout has an inverted T-shape featuring a broad transversal hall and a rectangular niche, at the rear of which three rock-cut statues of the deities venerated in this chapel are situated. The inner walls are decorated with scenes in bas-relief, once painted, depicting the king making offerings to both Egyptian and Nubian deities. Scenes including the images and names of Amun were defaced during the reign of Amenhotep IV Akhenaten (1351–1334 BCE), but they were later restored under Ramses II (1279–1213 BCE). In the medieval Christian period, the chapel was transformed into an oratory.
Due to the construction of the High Dam at Aswan (the Sadd el-Ali) and the subsequent flooding of the Nile valley in the south, almost all of Nubia was lost under the waters of the reservoir. As one of the historic monuments that would have been submerged, the Ellesiya chapel was removed from its original location in 1965 and the cut-out blocks bearing reliefs and hieroglyphic texts were transported to Turin, where they were partly reassembled in 1969–70. These operations happened in the framework of the international UNESCO Campaign to Save the Monuments of Nubia, during which the Ellesiya chapel was officially gifted to Italy by the Egyptian government as a token of appreciation for the financial and logistical help provided by Italy to said campaign [28,29]. The Ellesiya chapel has been documented a few times in the past. A complete black and white photographic survey—together with documentation of the architectural and epigraphical features—was carried out before the chapel was removed from its original location [30].
After the reconstruction of the chapel in Turin, several photographic campaigns were undertaken to document the structure and its diverse features in the museum [31,32].
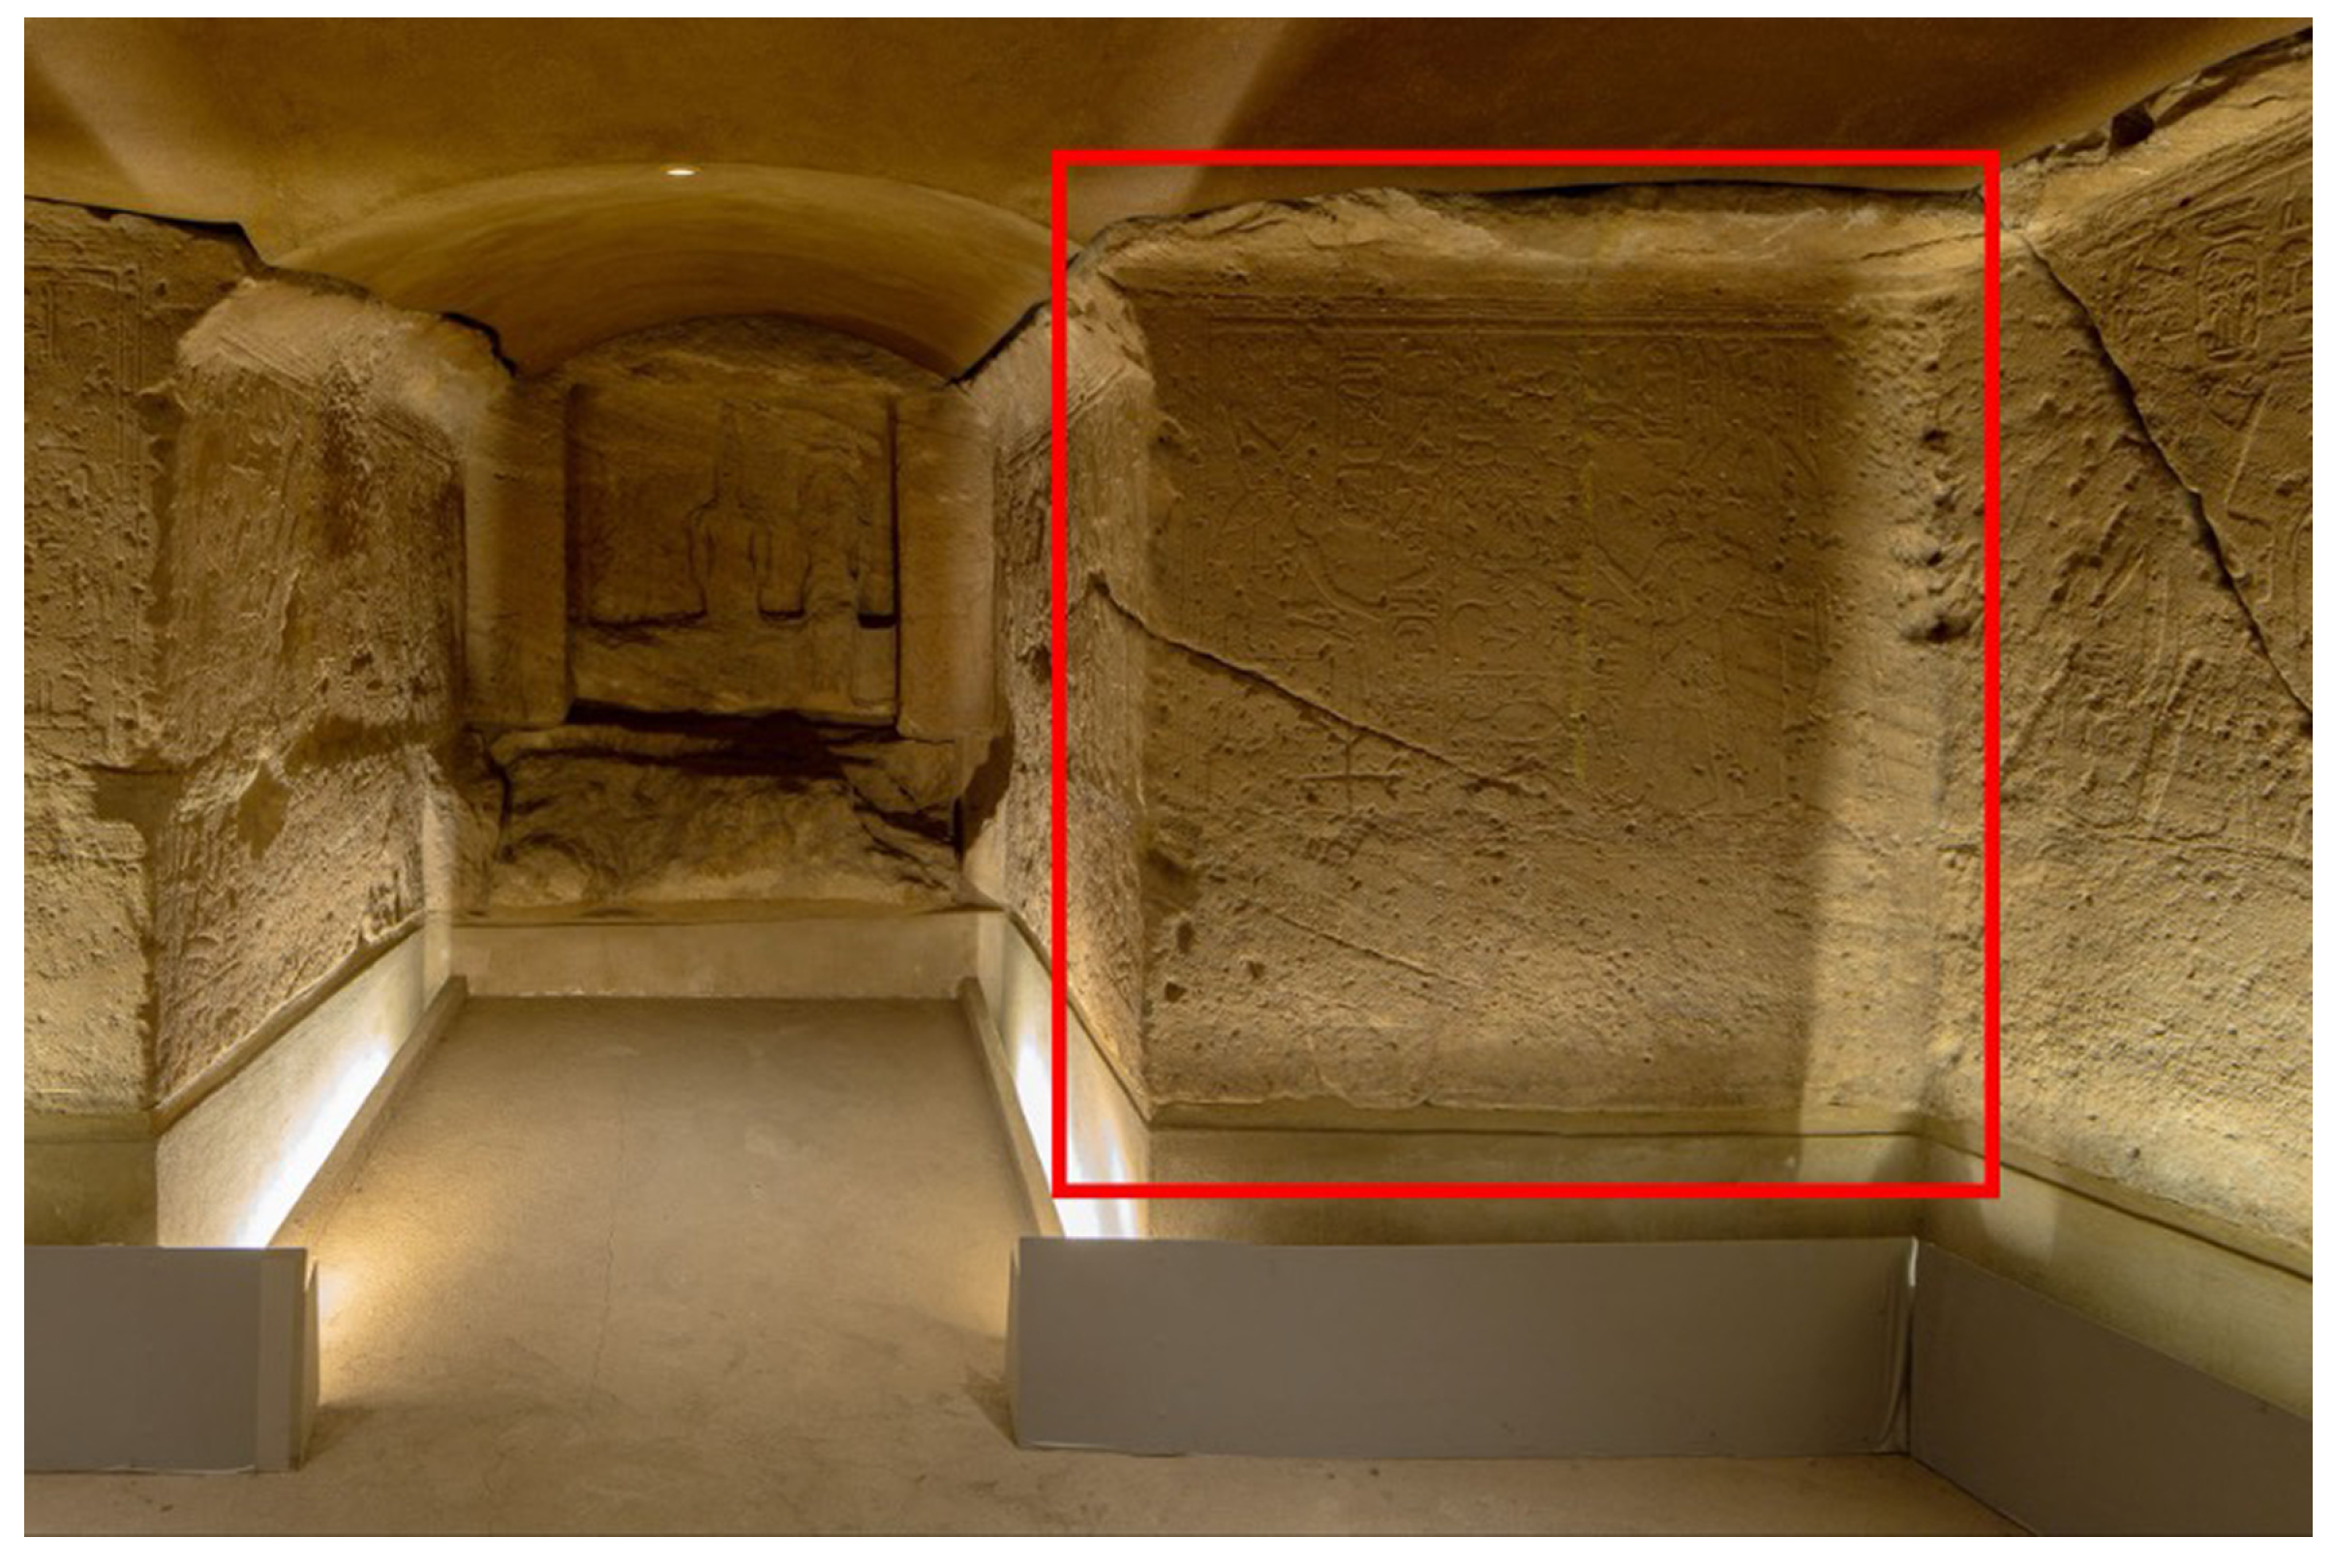
In 2023, the Centro per la Conservazione ed il Restauro dei Beni Culturali (CCR) “La Venaria Reale”, Italy, carried out a comprehensive documentation campaign based on the use of advanced technologies, including high-definition multiband imaging to detect pigment remnants that have become invisible to the naked eye, such as Egyptian blue. This project facilitated the testing of V-RTI, a digital photographic workflow combining principles from RTI and photogrammetry to enhance surface visualization and improve the documentation’s level of detail, particularly in confined spaces like the bas-relief under study in the Ellesiya chapel (Figure 2).

Figure 2.
Interior view of the Ellesiya chapel, Museo Egizio, Turin. The red rectangle indicates the selected wall for this case study.
The current lighting setup illuminates the chapel’s walls mainly from the floor, altering the perception of the raised relief hieroglyphs, figures, and other iconographic elements. To accurately depict convex and concave forms, especially of a rather shallow bas-relief, the present case study underscores the importance of selecting top lighting, ideally with an incidence of 45° from the top, which not only appears more natural and less ambiguous but is also the conventional light incidence in the context of epigraphical documentation.
3. Methods
This section presents a description of the equipment, a review of the data acquisition, and eventually, an overview of the data processing is described.
3.1. V-RTI: Data Acquisition
Various techniques are available for generating RTI, such as using a fixed dome [21] or motorized rotating arcs for light positioning, as well as the adoption of photogrammetry; while extensively applied in the large-scale digitization of museum artifacts [33], the latter is also useful for metrology validation [34,35] and multiband analysis [4].
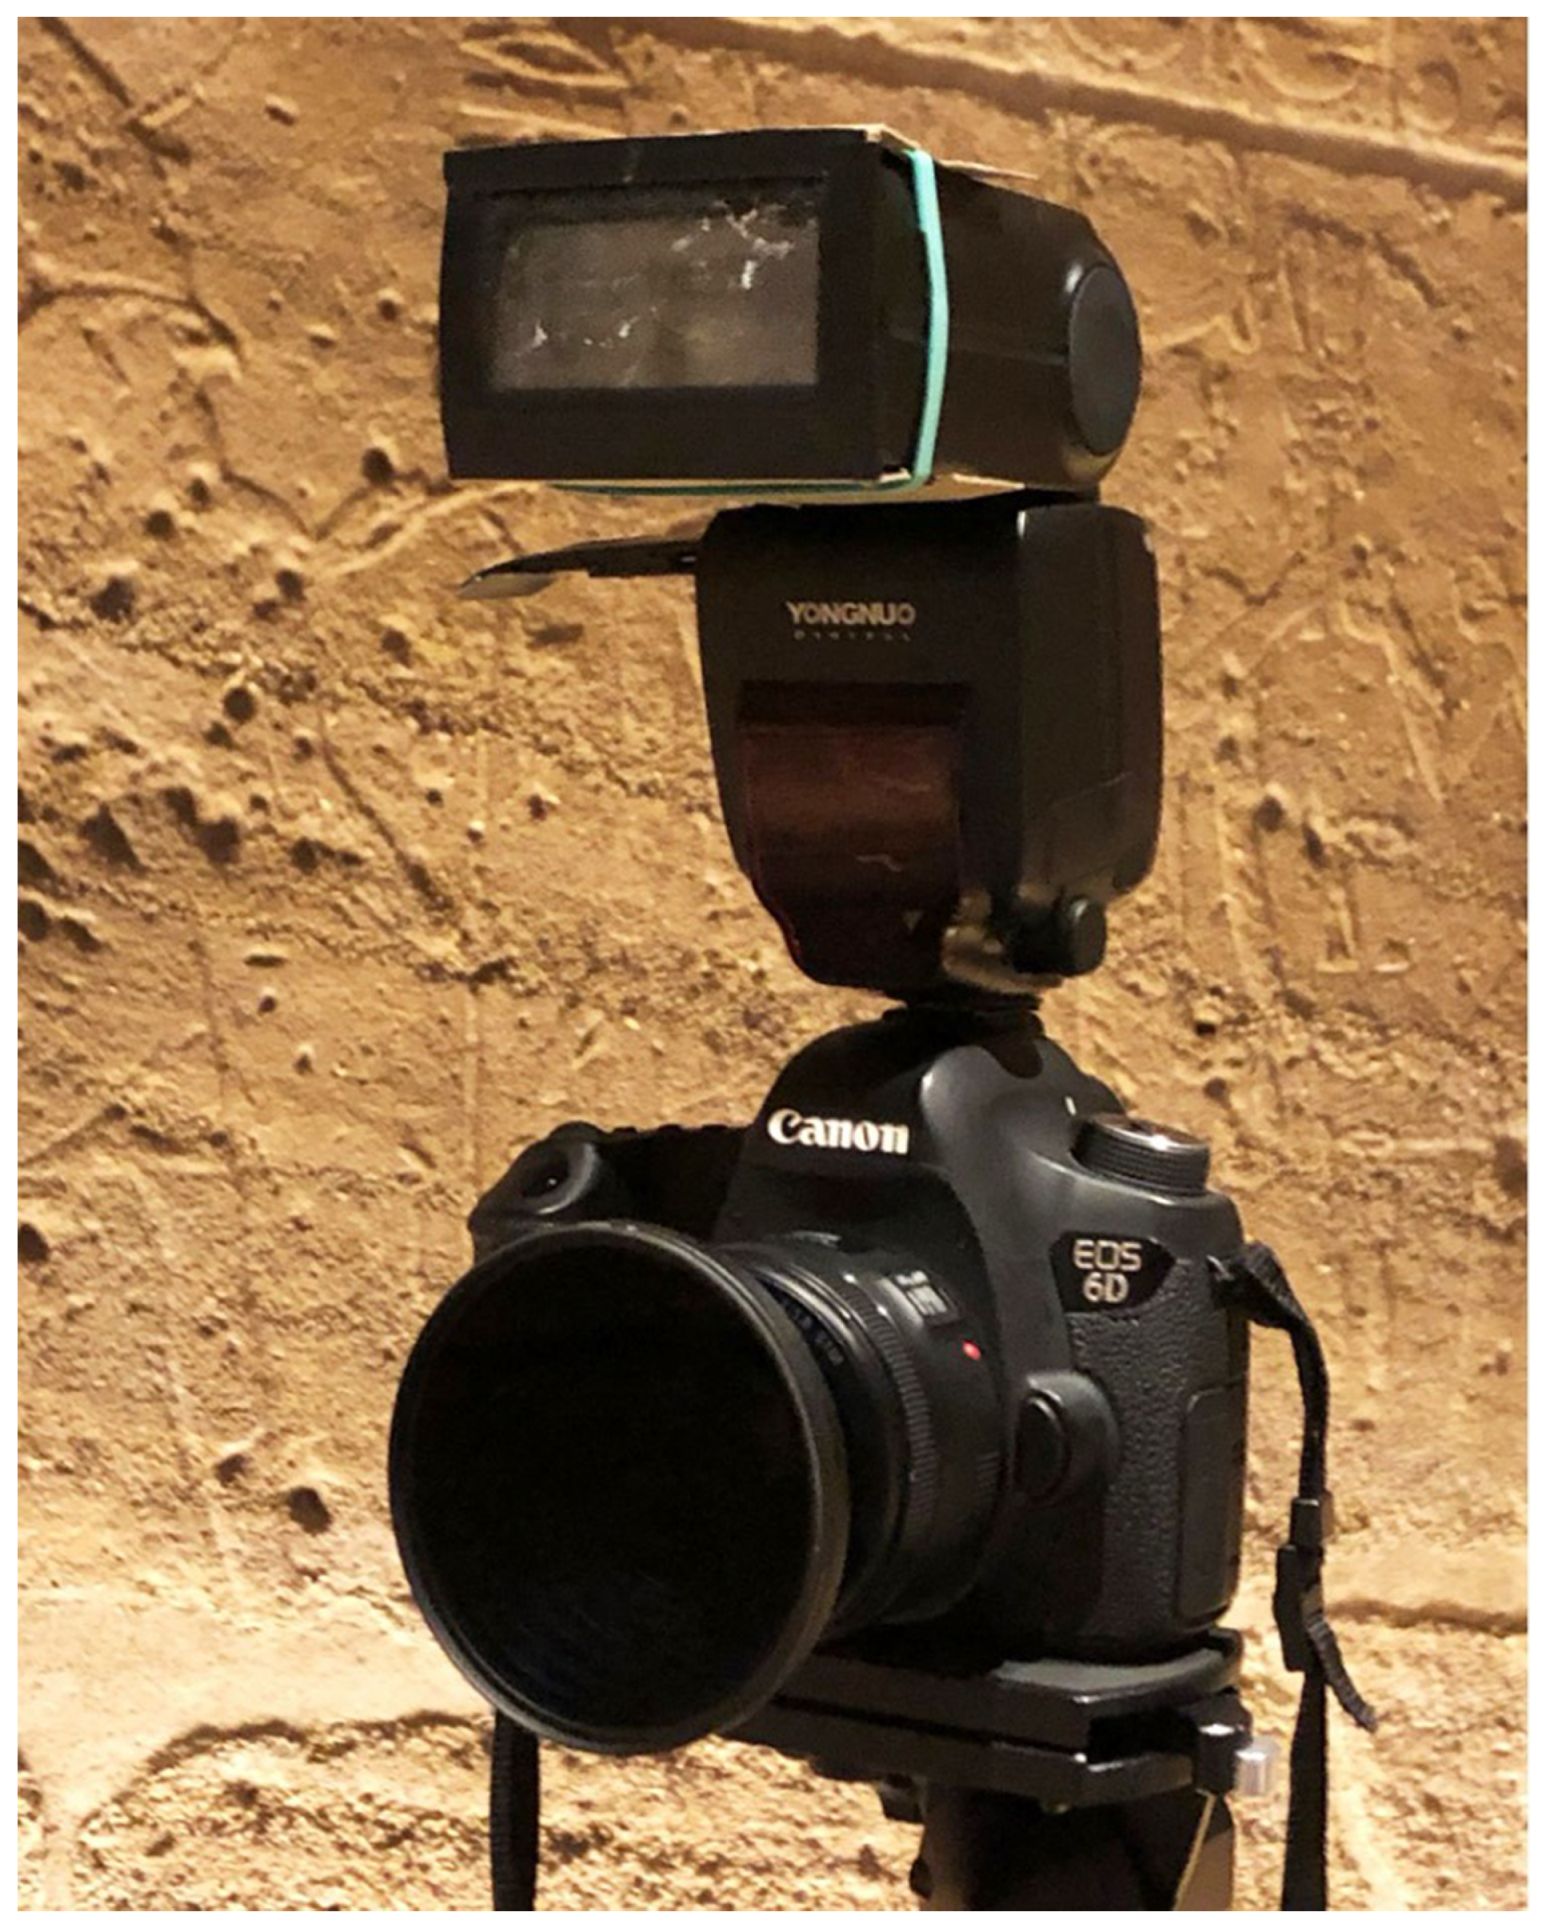
The procedure outlined here comprises four main steps: photogrammetric acquisition, SfM, rendering in a Virtual Reality (VR) environment, and the computation of V-RTI. Unlike traditional RTI setups in which an off-camera strobe is manually handled around the subject, the lighting is exclusively provided by an on-camera flash in V-RTI. To reduce the risk of producing unwanted reflections, the light source is polarized using a custom-shaped polarizing sheet, while a circular polarizer filter is placed in front of the lens to regulate specular light reflection until it is fully blocked (Figure 3). In V-RTI, it is no longer the light that is moving, but the camera.
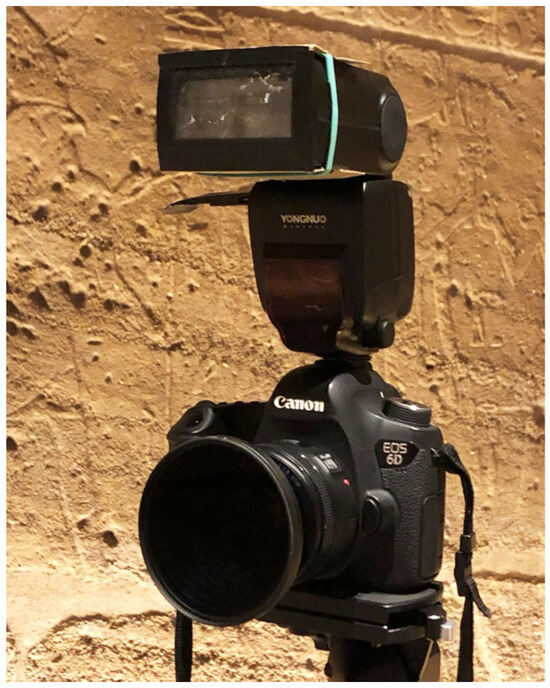
Figure 3.
Polarization filters on both camera and flash.
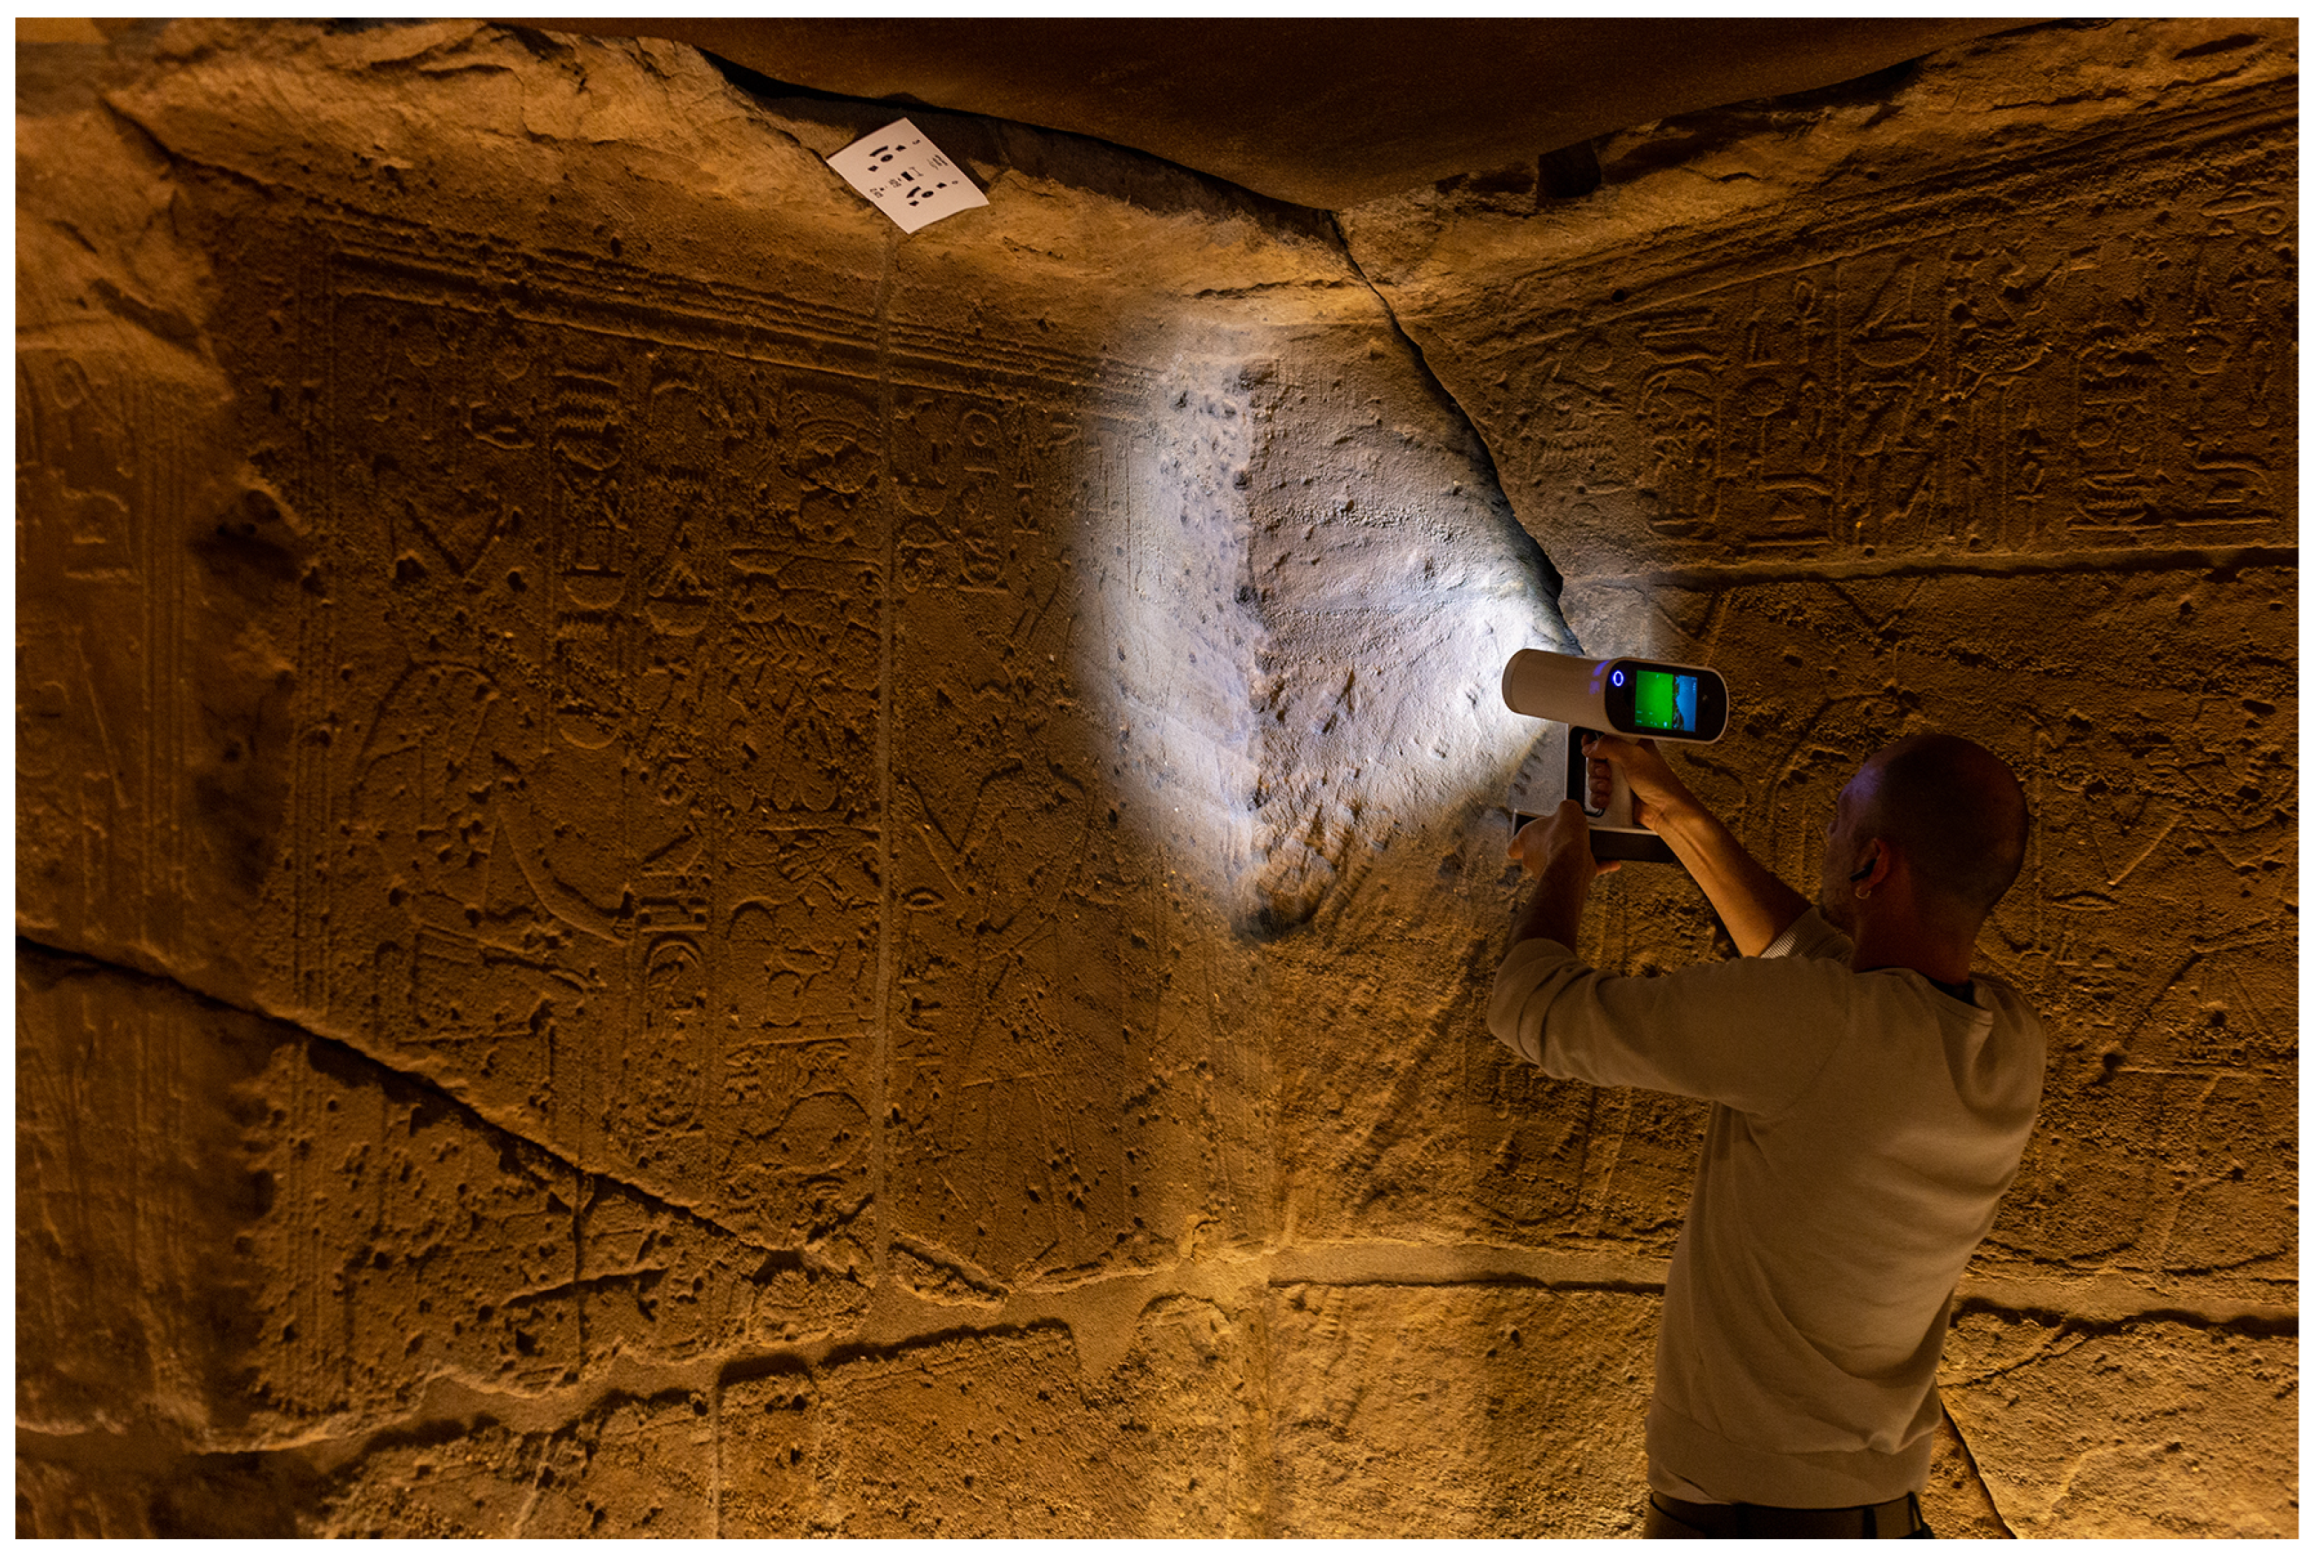
3.1.1. Photogrammetric Image Acquisition of Ellesiya Bas-Relief
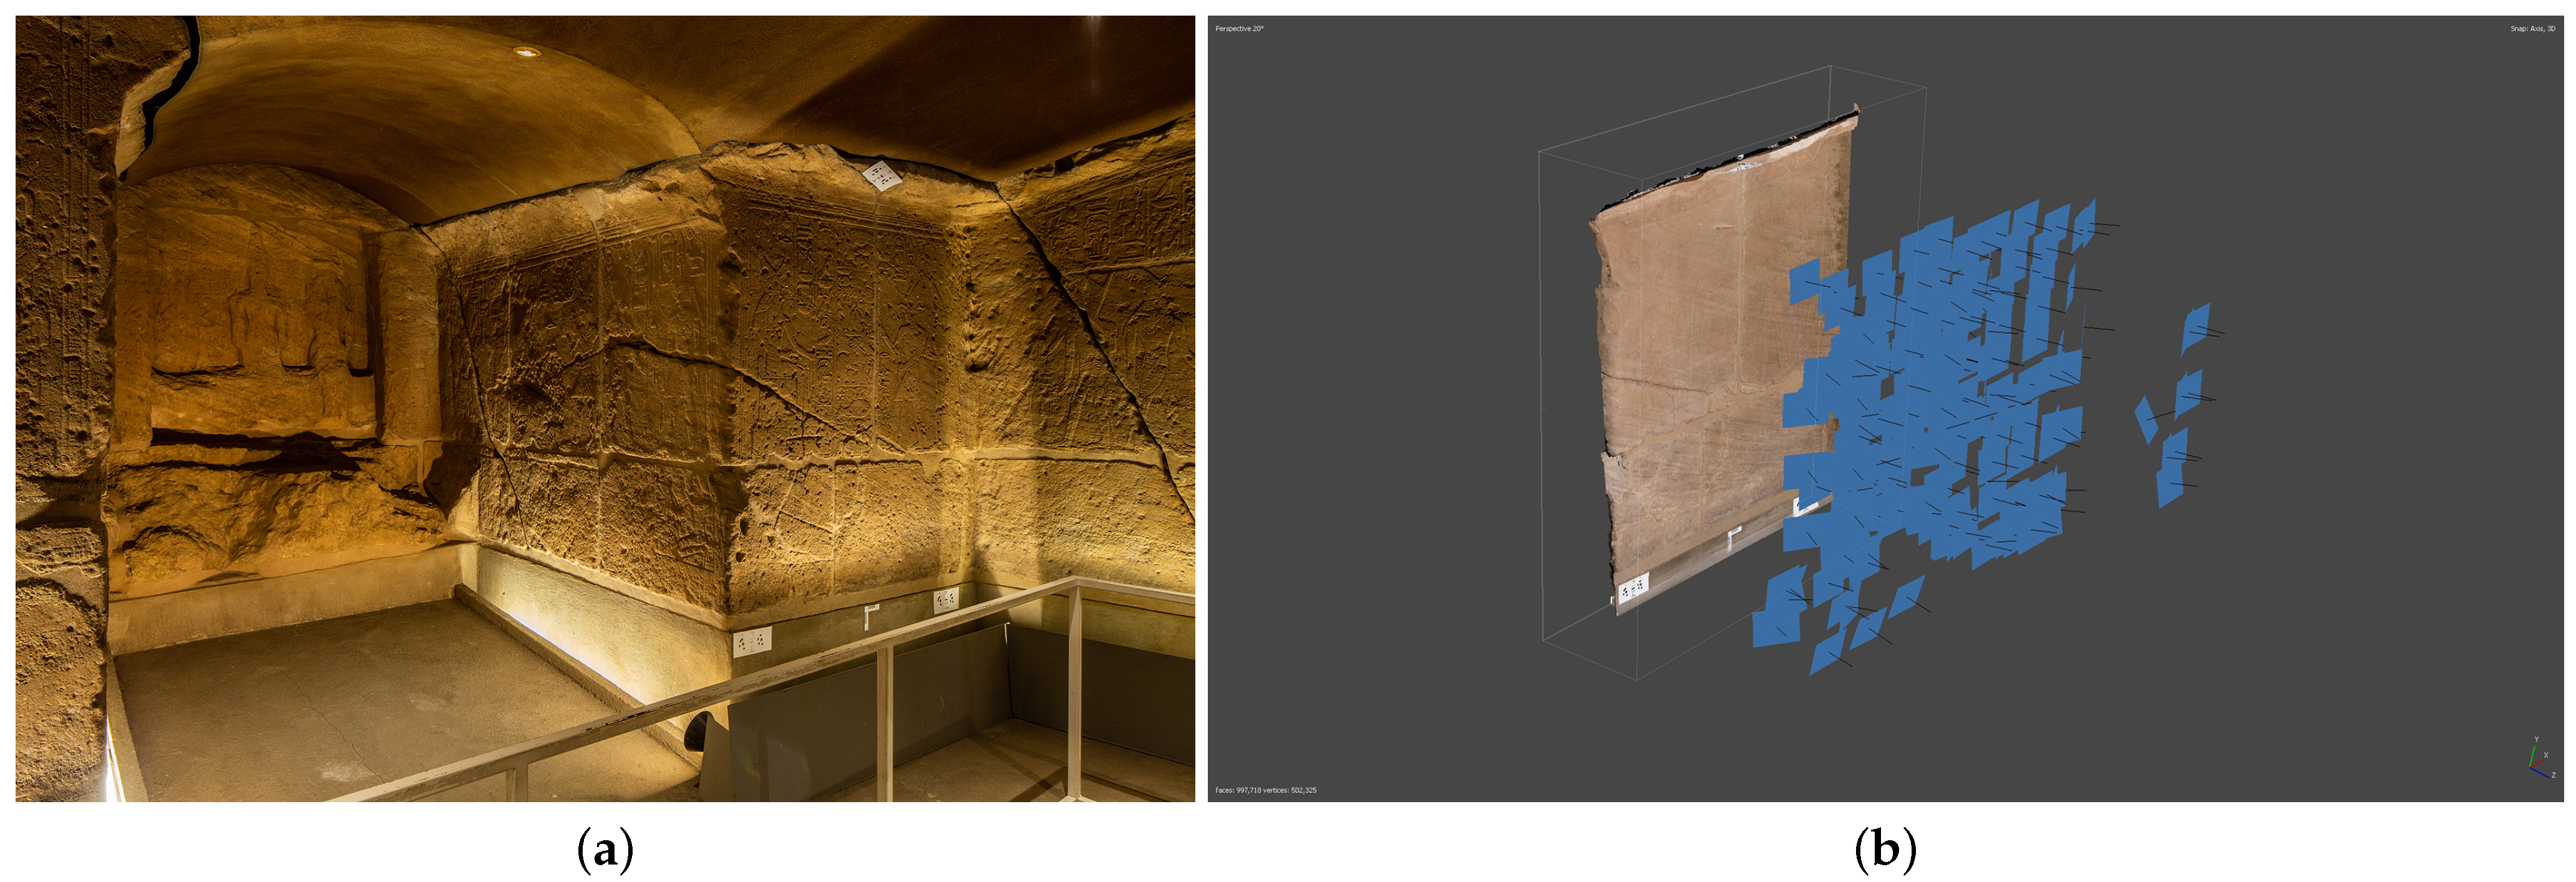
Orthogonal point-of-view images were obtained using the tools listed in Table 1, with the camera located at approximately 1.20 m from the wall. The object under study is a bas-relief measuring around 170 (width) × 180 (height) cm. Due to the dimension and placement of the wall relief, the application of RTI was prevented by the close proximity to the floor, ceiling, and adjacent wall (Figure 4a). The acquisition required a progression by vertical and horizontal orthogonal photographs, with a overlap in both directions (Figure 4b). A further set of images was collected at different distances and inclinations, supporting the correct alignment of the first dataset. Camera parameters were set as follows: exposure time 1/160, aperture value f/11, and ISO 400.

Table 1.
Specifications of the tools used for the photogrammetric survey.
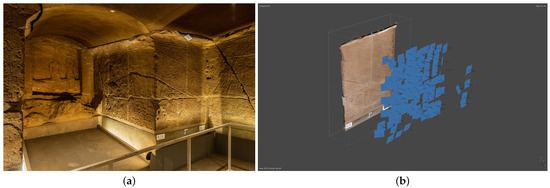
Figure 4.
(a) Interior view of the chapel of Ellesiya; (b) camera positions in Metashape.
3.1.2. Photogrammetric Image Acquisition of Small Test Object
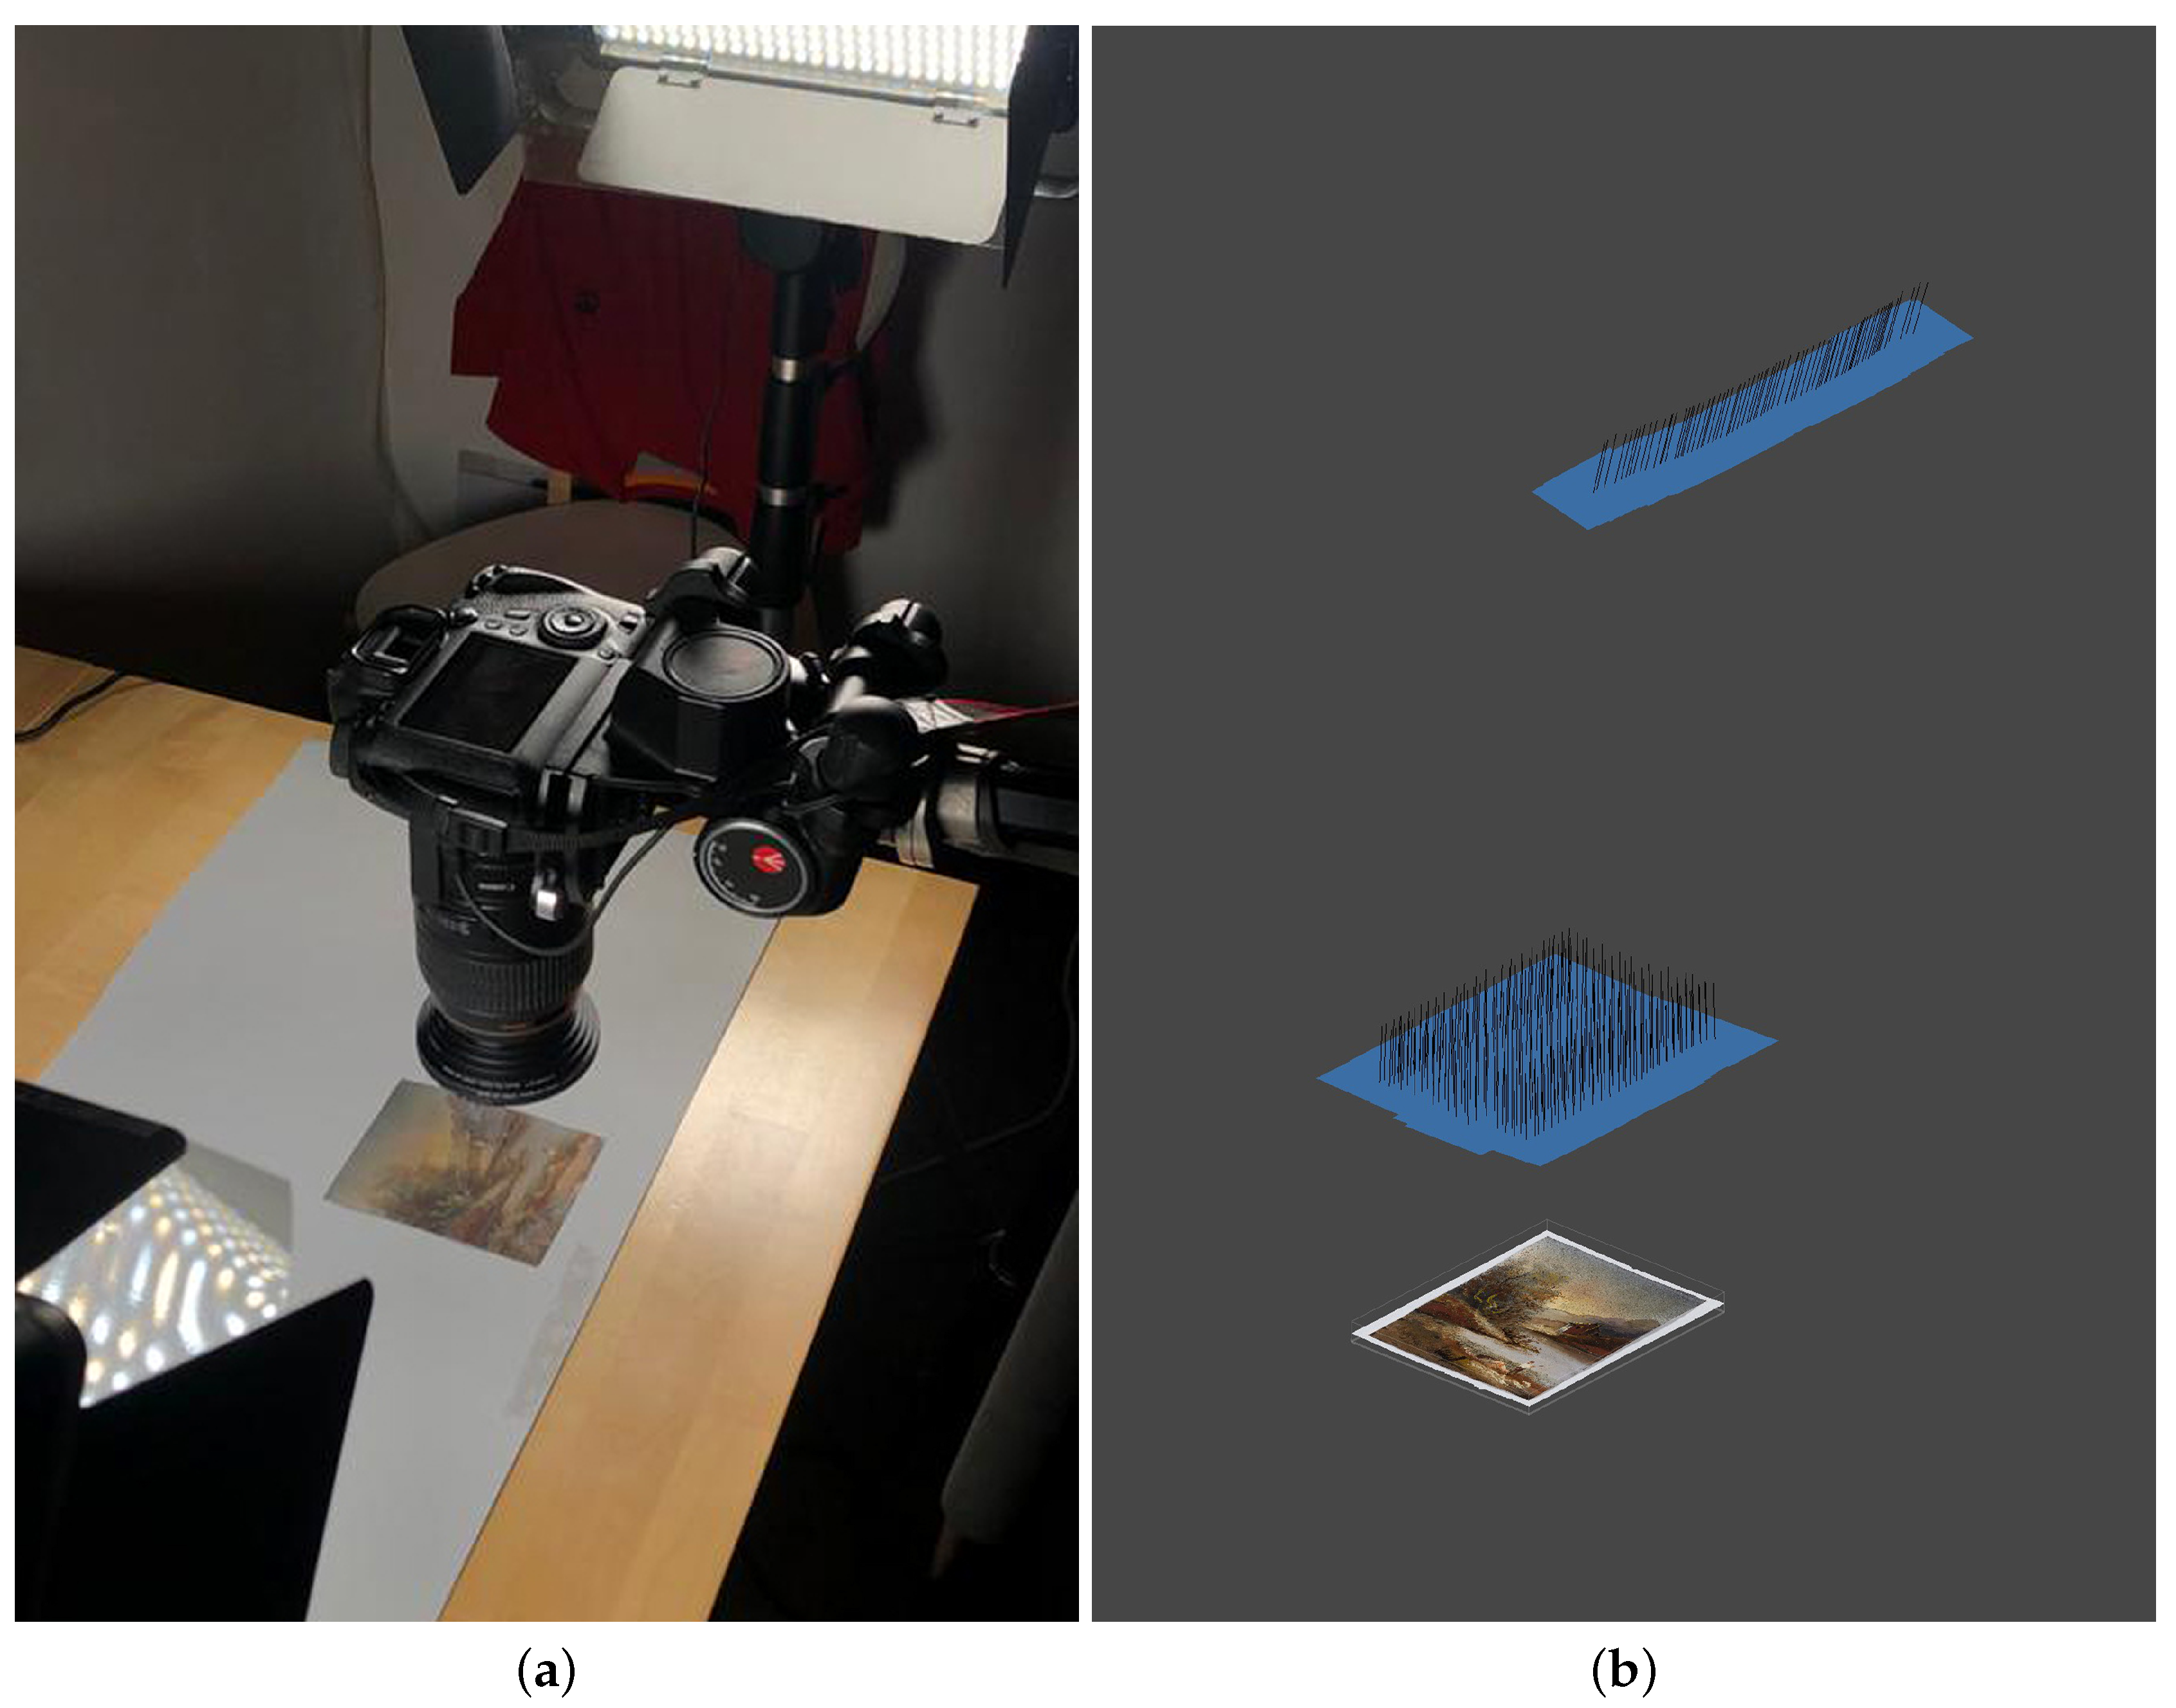
The model of the test object was obtained by 294 orthogonal photographs and 77 oblique views. The first batch of 294 images was orthogonally captured close to the minimum focus distance (approximately 31 cm) to maximize the Ground Sampling Distance (GSD) (0.0007 cm/px), thereby optimizing the resolution of the Canon EOS 6D DSLR equipped with a Canon 100 mm f/2.8 macro lens (Figure 5a). The second set of 77 images was acquired at a significantly greater distance to ensure proper alignment of the first dataset (Figure 5b).
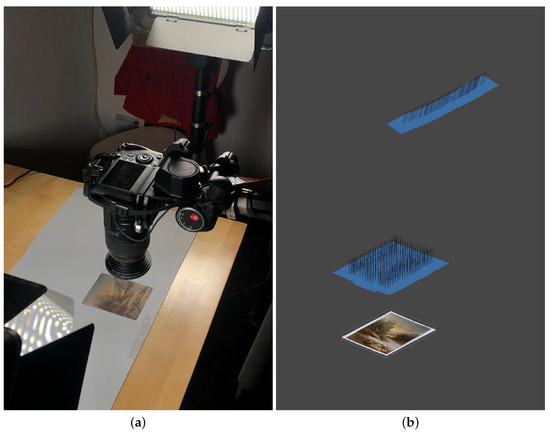
Figure 5.
(a) Acquisition scene of the small test artifact; (b) camera positions in Metashape.
In order to collect as much information as possible and to allow for the correct alignment of the images, a 70% overlap was maintained throughout the acquisition. In order to speed up the shooting process, the painting was placed on cardboard, moving it between shots, while the camera was mounted horizontally on a tripod. The illumination provided by two polarized LED panels reduced the influence of surface reflections, while the use of a low sensitivity value (160 ISO) contained digital image noise. By adopting a f/18 aperture, it was possible to minimize the impact of depth of field issues when shooting subjects from such close distances [36].
3.2. Data Processing: A Novel Approach to Generate V-RTI
Data processing was divided into several steps. Firstly, a pre-processing of the raw data obtained was undertaken, as described below. Following that, a description of the SfM and V-RTI elaborations is presented.
3.2.1. Pre-Processing Image Data
Following the acquisition phase, the files were processed to begin the actual processing stage. The ColorChecker image was converted to .dng to create a color profile. All images in the dataset, including the colorimetric target, were then processed in Adobe Camera Raw, a Photoshop plug-in that enables the editing of raw files.
Images were selected, colorimetrically adjusted, and balanced with Neutral 5 (patch 22, reflectance 18.4%, RGB values 122, 122, 121). Exposure and contrast can be corrected by compensating for any loss of light due to variations in the flash output. The files were then exported as .jpeg with minimal compression to maximize the quality/weight ratio for further processing [37].
3.2.2. Structure from Motion
A standard photogrammetric SfM-based workflow was followed [38] employing Metashape 2.1, a stand-alone software for photogrammetric processing of digital images [39].
The process of photogrammetry involves a series of steps. Initially, images are processed to rectify distortions and to find distinctive feature points to establish reliable correspondences between photographs. Subsequently, the geometry of the scene is estimated by generating the depth maps from which a surface mesh is then calculated and textured (Figure 6).

Figure 6.
The sequential steps of SfM. From the left: tie points, dense cloud, mesh, and textured model.
In particular, the methodology presented is based on the following steps: markers detection; scale bars application; tie point extraction; gradual selection; camera optimization; dense point cloud generation; polygonal mesh generation; and texturization of the 3D model. Eventually, the model was exported in .obj format.
3.2.3. VR Environment
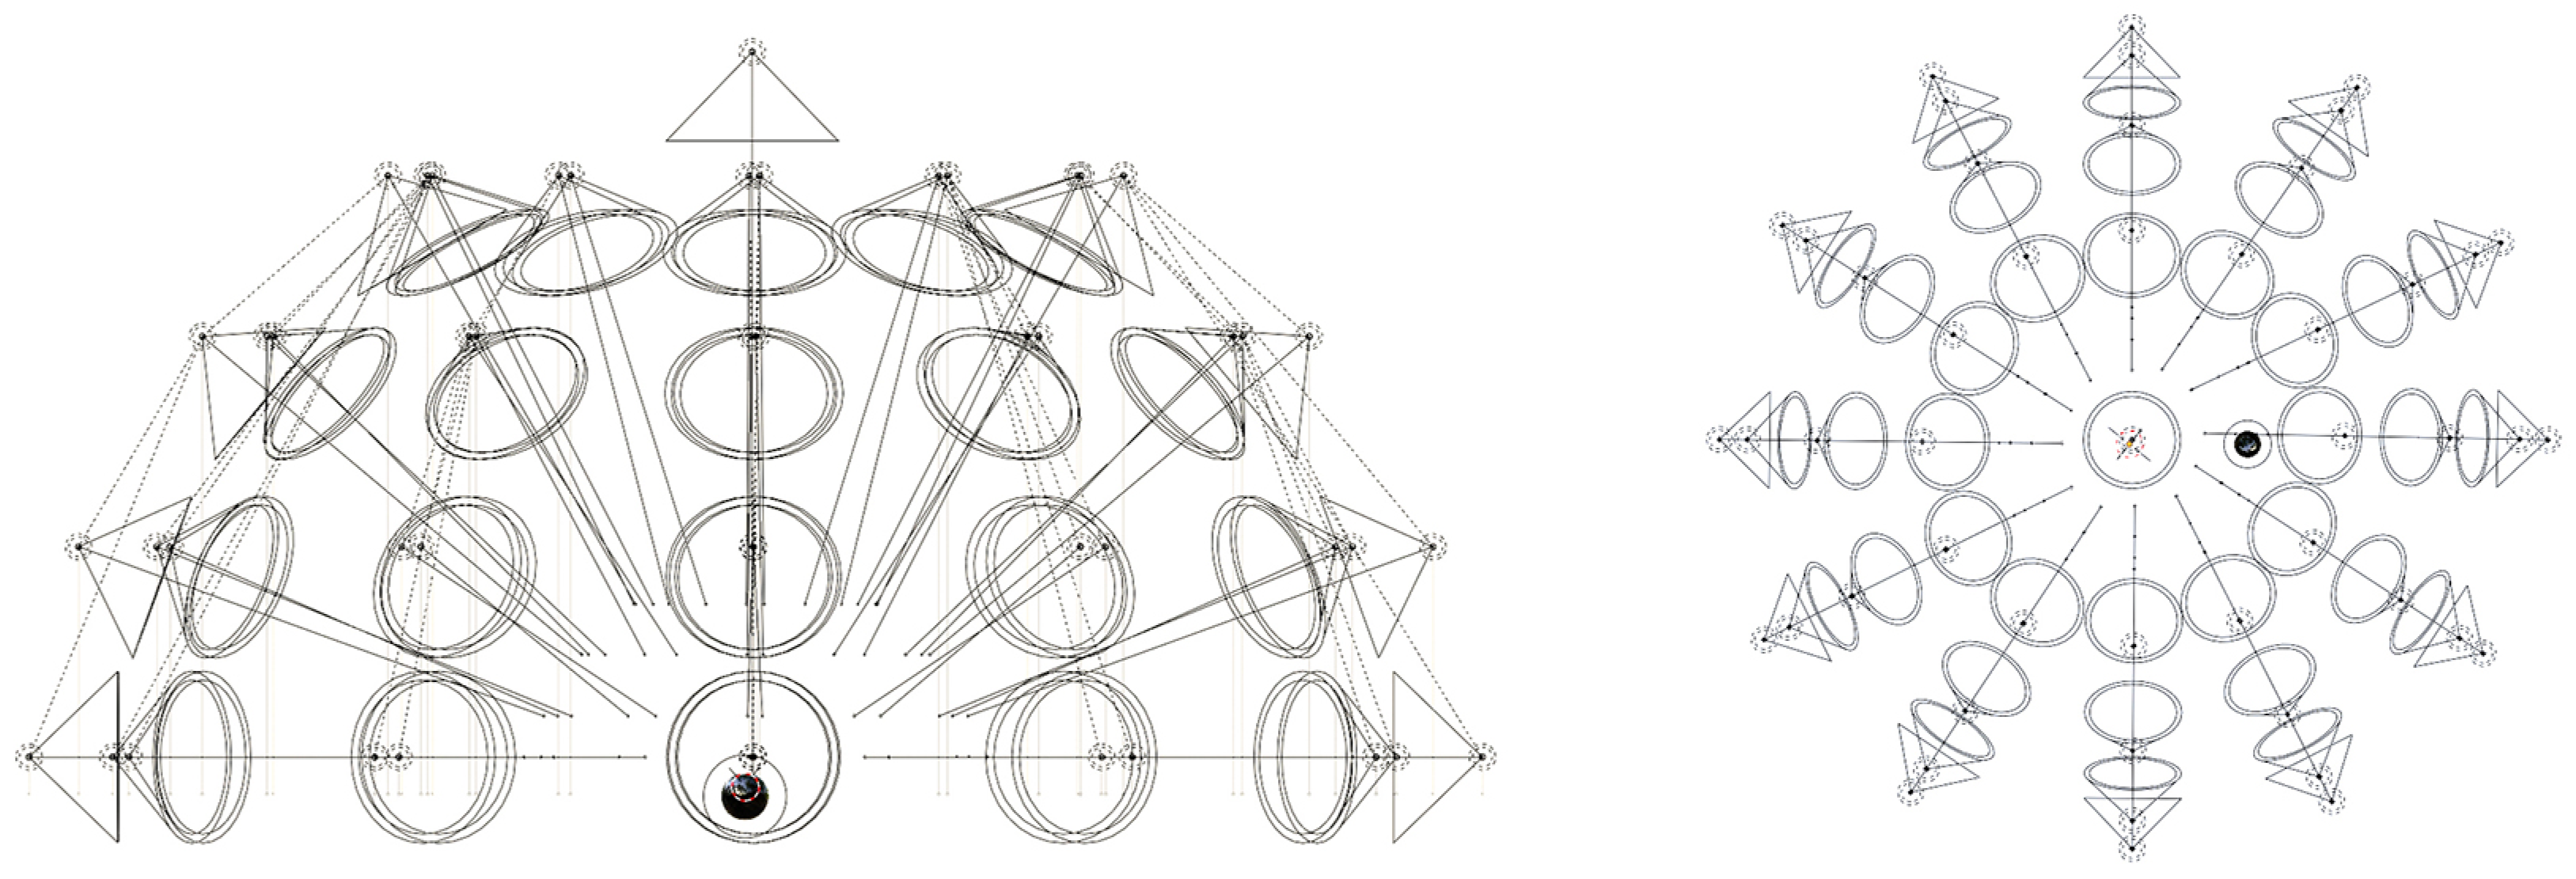
The textured model is imported into modeling software (e.g., Blender [40]) and scaled within a virtual lighting set to simulate the shooting sequence of an H-RTI. For this study, a virtual dome consisting of 49 lighting points was designed to collect as many images of the model illuminated from different angles (Figure 7).
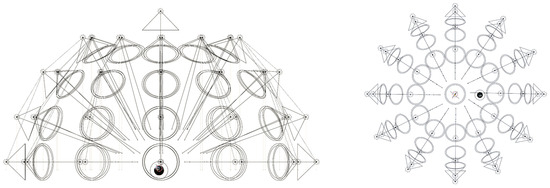
Figure 7.
The virtual dome in Blender.
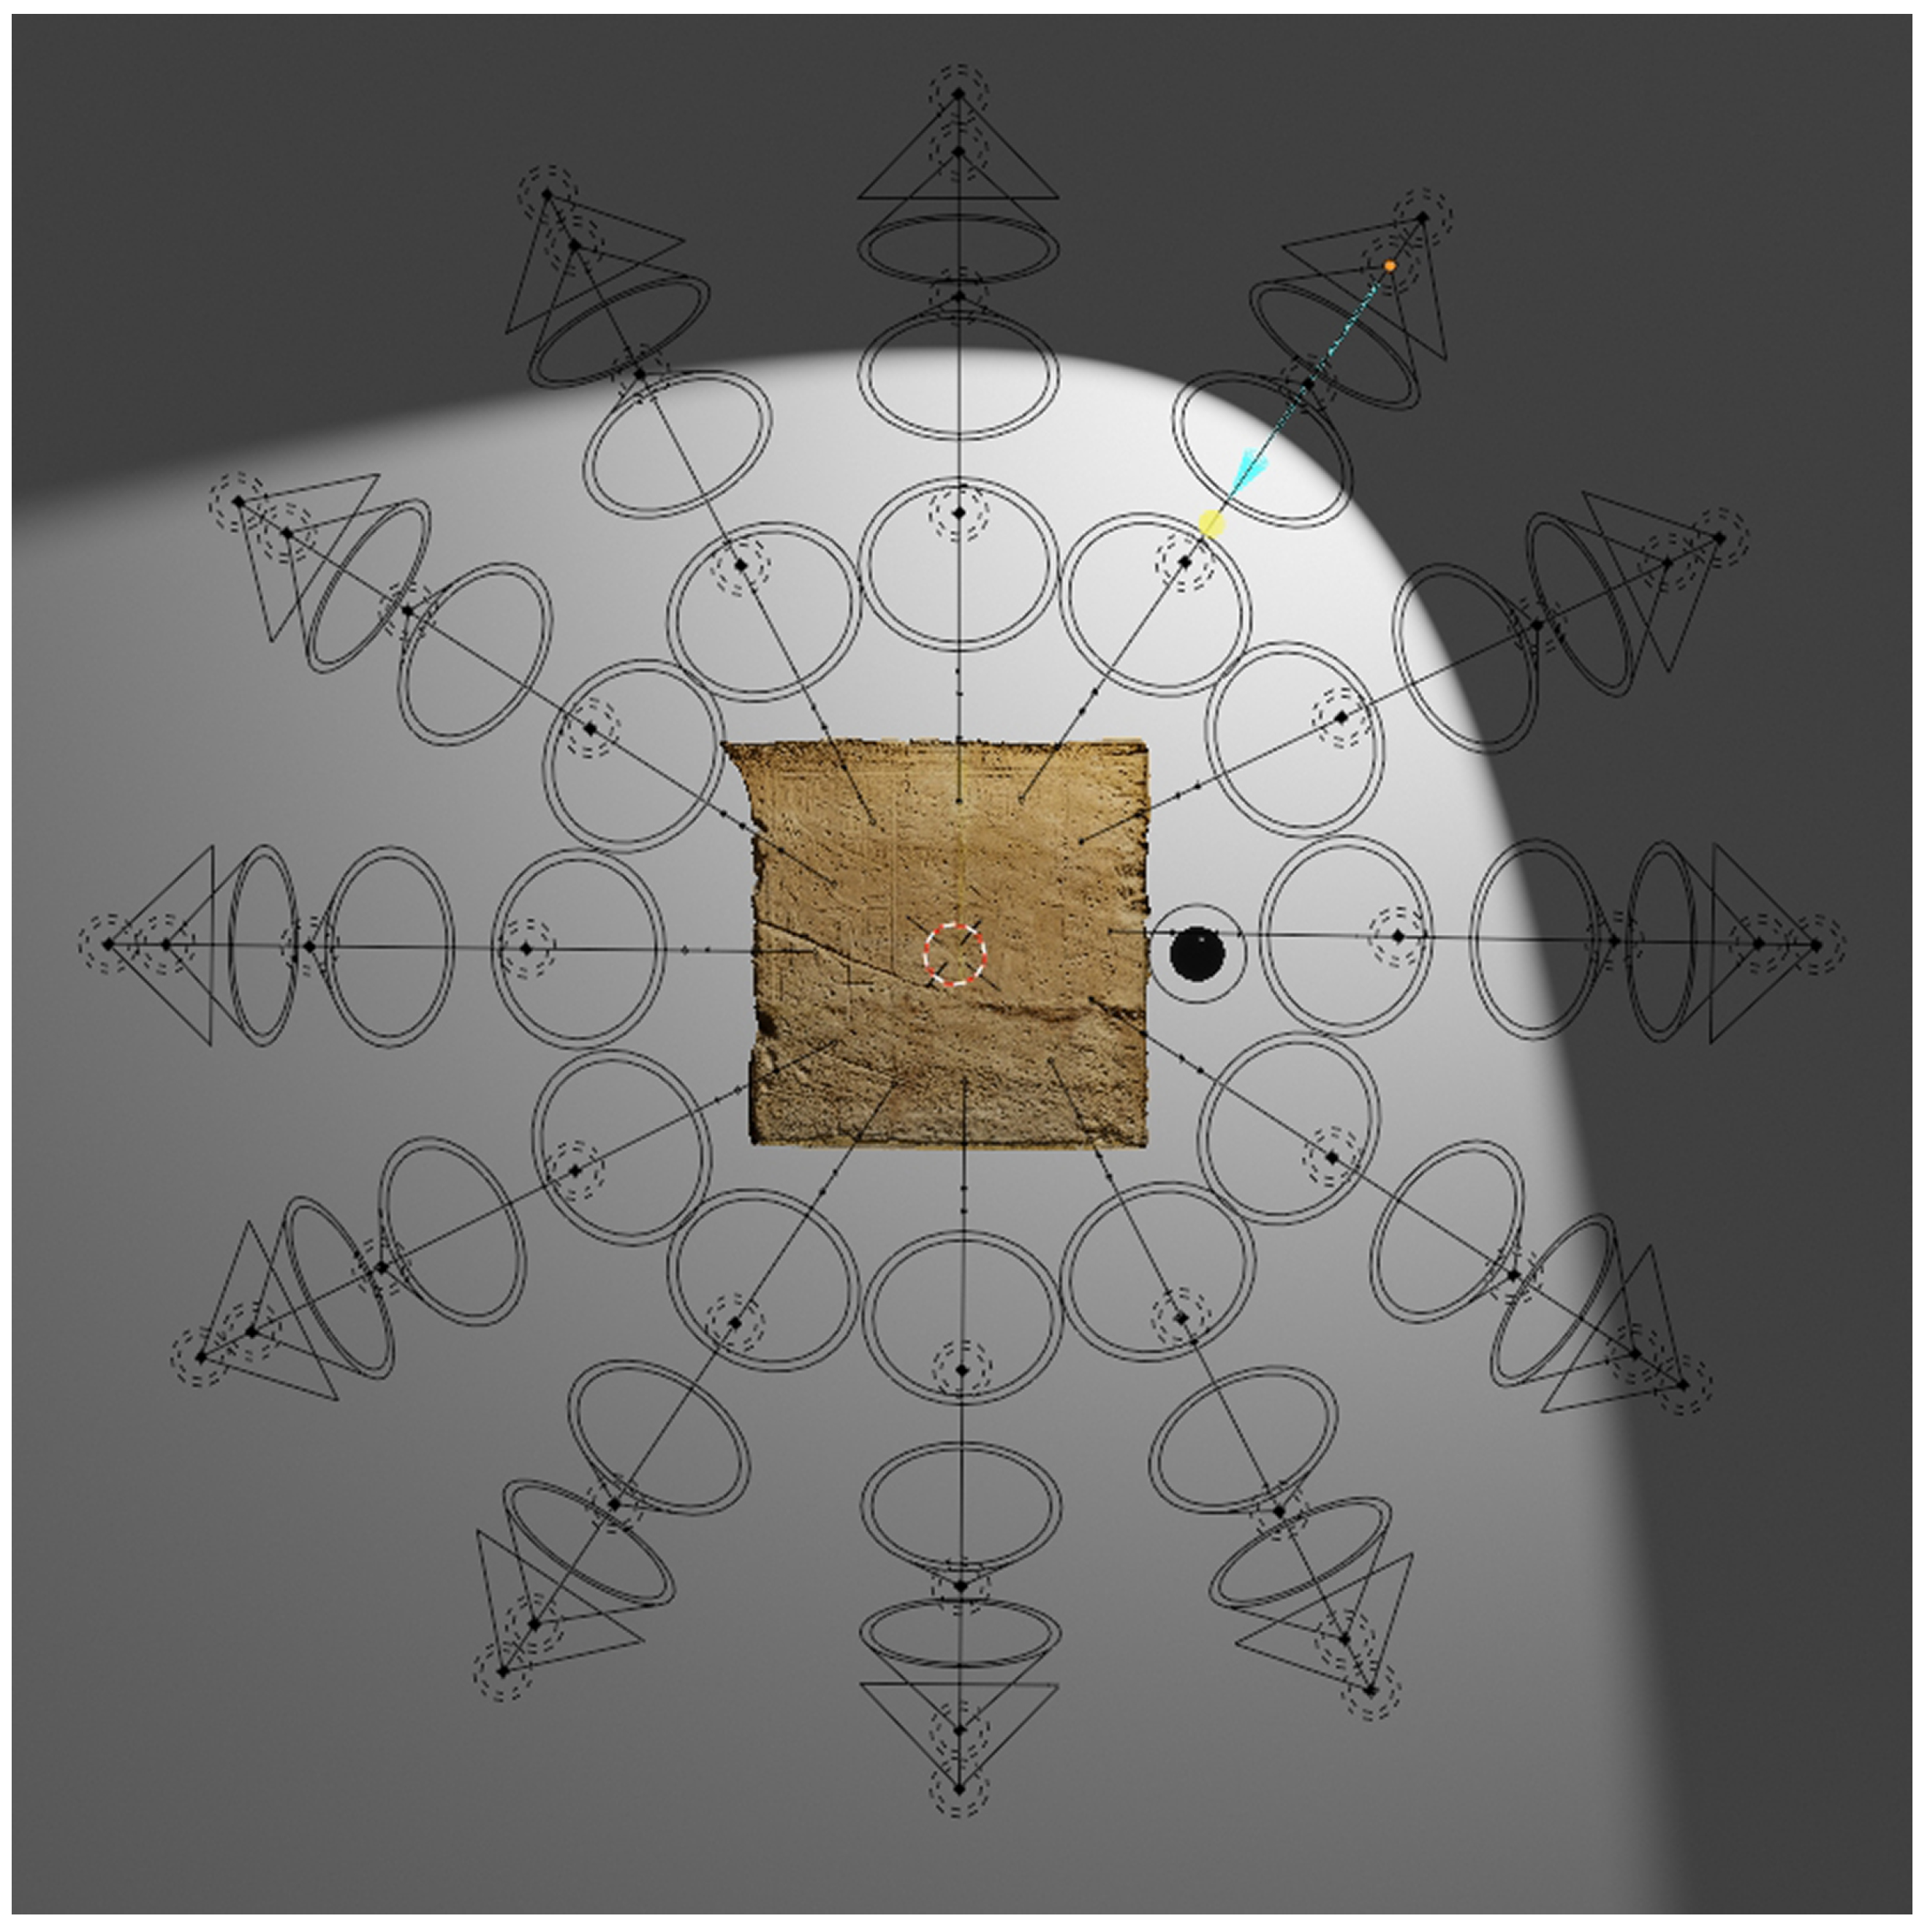
The virtual dome is built around the object in order to simulate the movement of the strobe as in a traditional RTI approach, and the different spotlights are turned on and off each time. Subsequently, high-resolution images are rendered and then processed for the final stage (Figure 8). The virtual environment includes a black reflective sphere alongside the model (Figure 9). The sphere helps to determine the optimal position for lighting in space and on the surface. Rendering procedures can be automated by saving a Blender animation, and managing the activation and deactivation of lights automatically until the sequence is processed. This saves time on future projects. Once the VR project is built, different 3D models can be imported, adapted, and rendered, scaling their dimensions according to the virtual dome.
Figure 8.
The rendered sequence after the Blender animation. The picture selected in the blue box is the nadiral light.
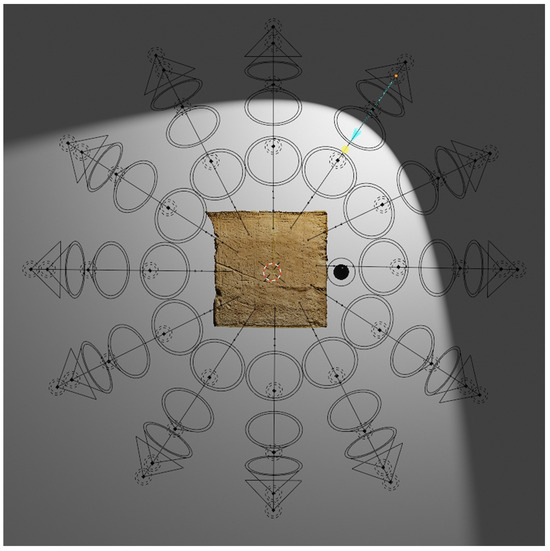
Figure 9.
The 3D model under different light positions during the rendering phase.
3.2.4. Computing the V-RTI
Once the images are exported, they are imported into Relight [15] to create an RTI rendering. Firstly, the process involves the identification of the black shiny spheres showing the highlights corresponding to the different light angles, which are essential for the software to generate the interactive model. Subsequently, the finalized RTI is exported and the resulting file can be accessed either locally using the RTI Viewer (Figure 10), or online by adopting a user-friendly visualization platform such as Ariadne [41]). Additionally, a .lp file outlining the lighting sequence can be exported to save time for future processing.
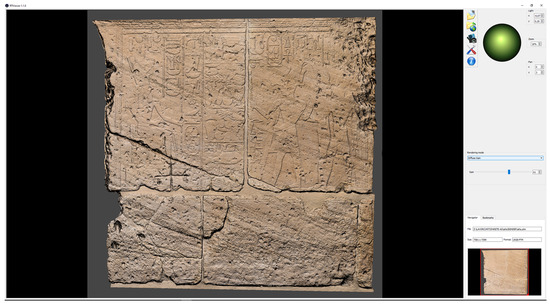
Figure 10.
The exported V-RTI shown in RTI Viewer.
3.3. V-RTI Validation: Ground-Truth Comparisons
Two ground-truth comparisons were made to better assess the quality of the V-RTI. In the first case, the distances and standard deviation between the SfM model and the Structured Light Scanner (SLS) model of the Ellesiya chapel were calculated, assuming the scanner as the ground-truth for the comparison. In the second evaluation, a direct comparison of the same parts of the copper painting acquired both in RTI and in V-RTI were juxtaposed to empirically show the differences between both techniques.
3.3.1. SfM vs. SLS
In order to assess the dimensional accuracy of the V-RTI model of the Ellesiya bas-relief, a 3D model was acquired with an SLS Artec Leo to be used as the ground-truth. The Artec Leo is equipped with a Vertical Cavity Surface Emitting Laser (VCSEL) light to detect the morphology and 12 LEDs (Light Emitting Diodes) to generate the visible texture. The data captured with this technology are usually of excellent quality in terms of precision and accuracy as SLSs are originally calibrated by the manufacturer (Table 2).
Table 2.
Structured Light Scanner specifications as defined by the manufacturer.
To evaluate the achieved outcomes, a comparison was conducted between the two meshes using Cloud Compare [42]. The purpose of this comparison is to measure the dimensional discrepancy between the V-RTI model generated by SfM and the one obtained with an SLS Artec Leo (Figure 11). These were aligned within the same coordinate system, by applying an Iterative Closest Point (ICP) registration process. Following this, a deviation map was calculated to assess any disparities between the two surfaces.

Figure 11.
The SLS during the acquisition. The default scanning range of the Artec Leo is 0.35 to 1.2 m.
3.3.2. RTI vs. V-RTI
In order to visually compare equivalent portions of an object that has been digitized using both the RTI and V-RTI techniques, a small test object was selected as a case study. Thus, since it was not possible to perform traditional RTI on the wall of the Ellesiya chapel, the case study presented here involved a small painting on copper measuring 9 × 12 cm. The painting was notable for its intricate details, which allowed for a direct comparison between the two methodologies [43].
RTI acquisition involved 64 shots, resulting in a final resolution of 3648 × 5472 px. Based on focus distance (56 cm), camera lens (100 mm), object size (9 × 12 cm), and sensor dimension (24 × 36 mm), the resulting GSD was 0.004 (cm/px).
The chosen frames highlighted variations in brush strokes, surface irregularities, and disparities in pigment application. Three distinct visualizations were generated to facilitate a comparative analysis of the same areas represented with both techniques. The visualization methods employed for this comparison were Diffuse Gain, Coefficient Unsharp Mask, and Normal Map. Parameters such as lighting angle, resolution, and export settings were identical for each frame.
4. Results
This section illustrates the results of this research, presenting the outcome of the two ground-truth comparisons performed to assess the quality of the V-RTI. Firstly, the results of the photogrammetry acquisition are reported. Then, the results of the comparison between SFM and SLS are presented. Then, a direct comparison of the same parts acquired both in RTI and in V-RTI is performed to highlight the differences between both techniques. Finally, the results of the novel approach to the creation of V-RTI are reported.
4.1. Photogrammetry and SfM vs. SLS Comparison
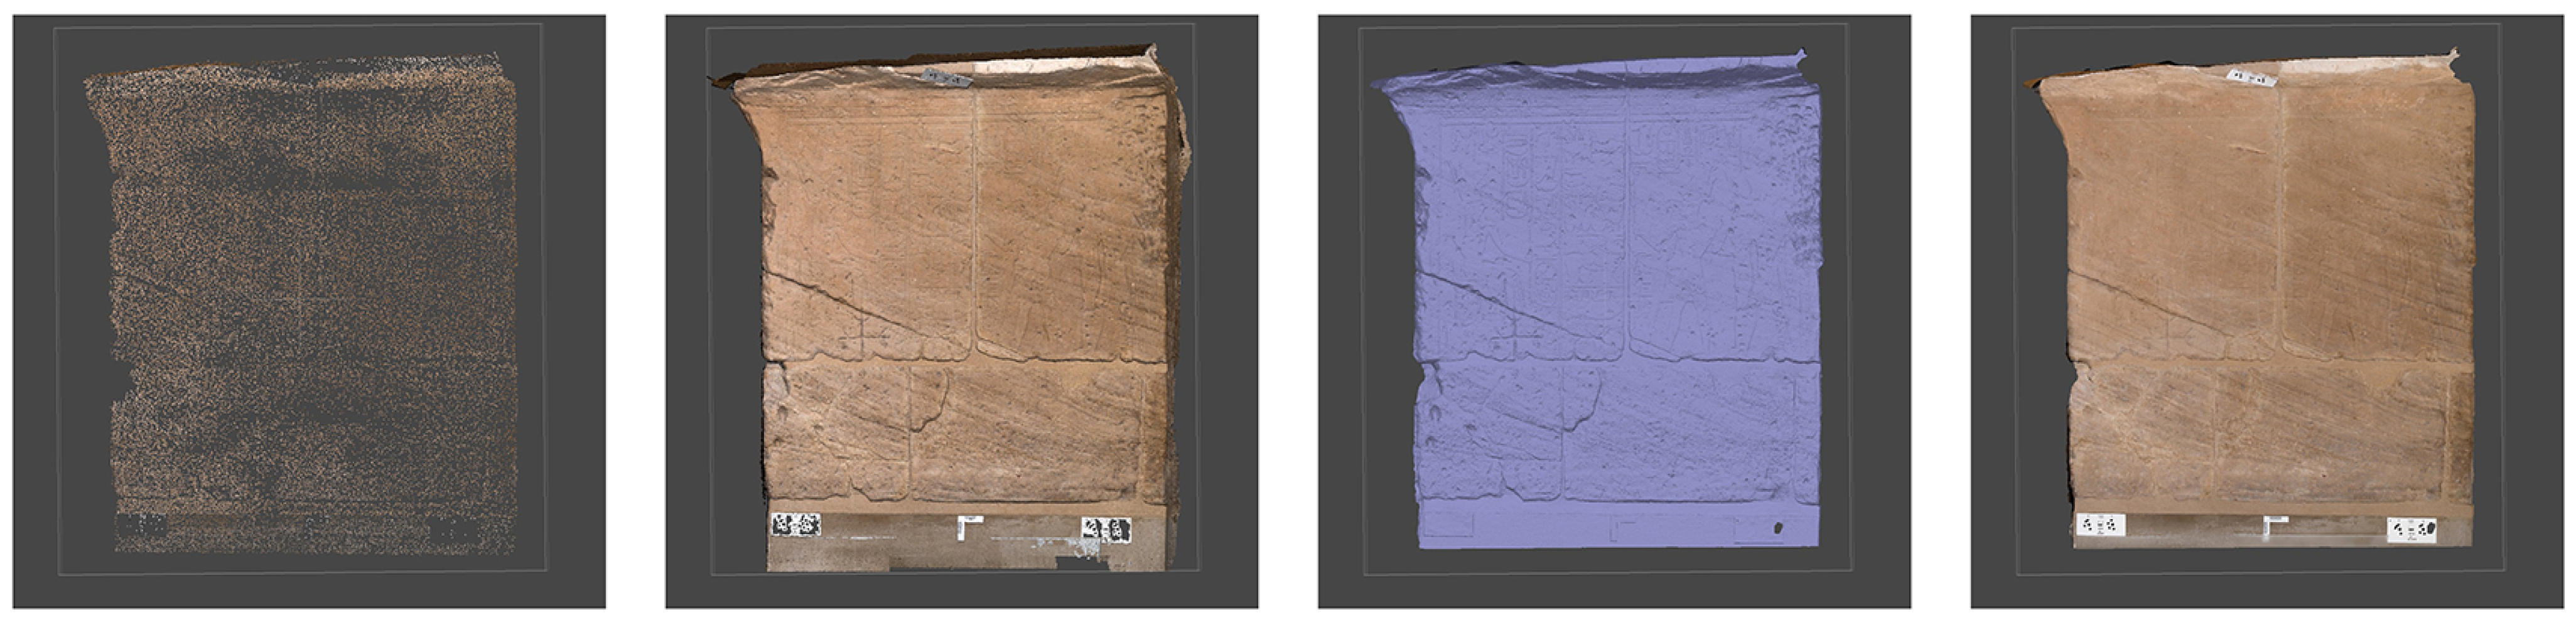
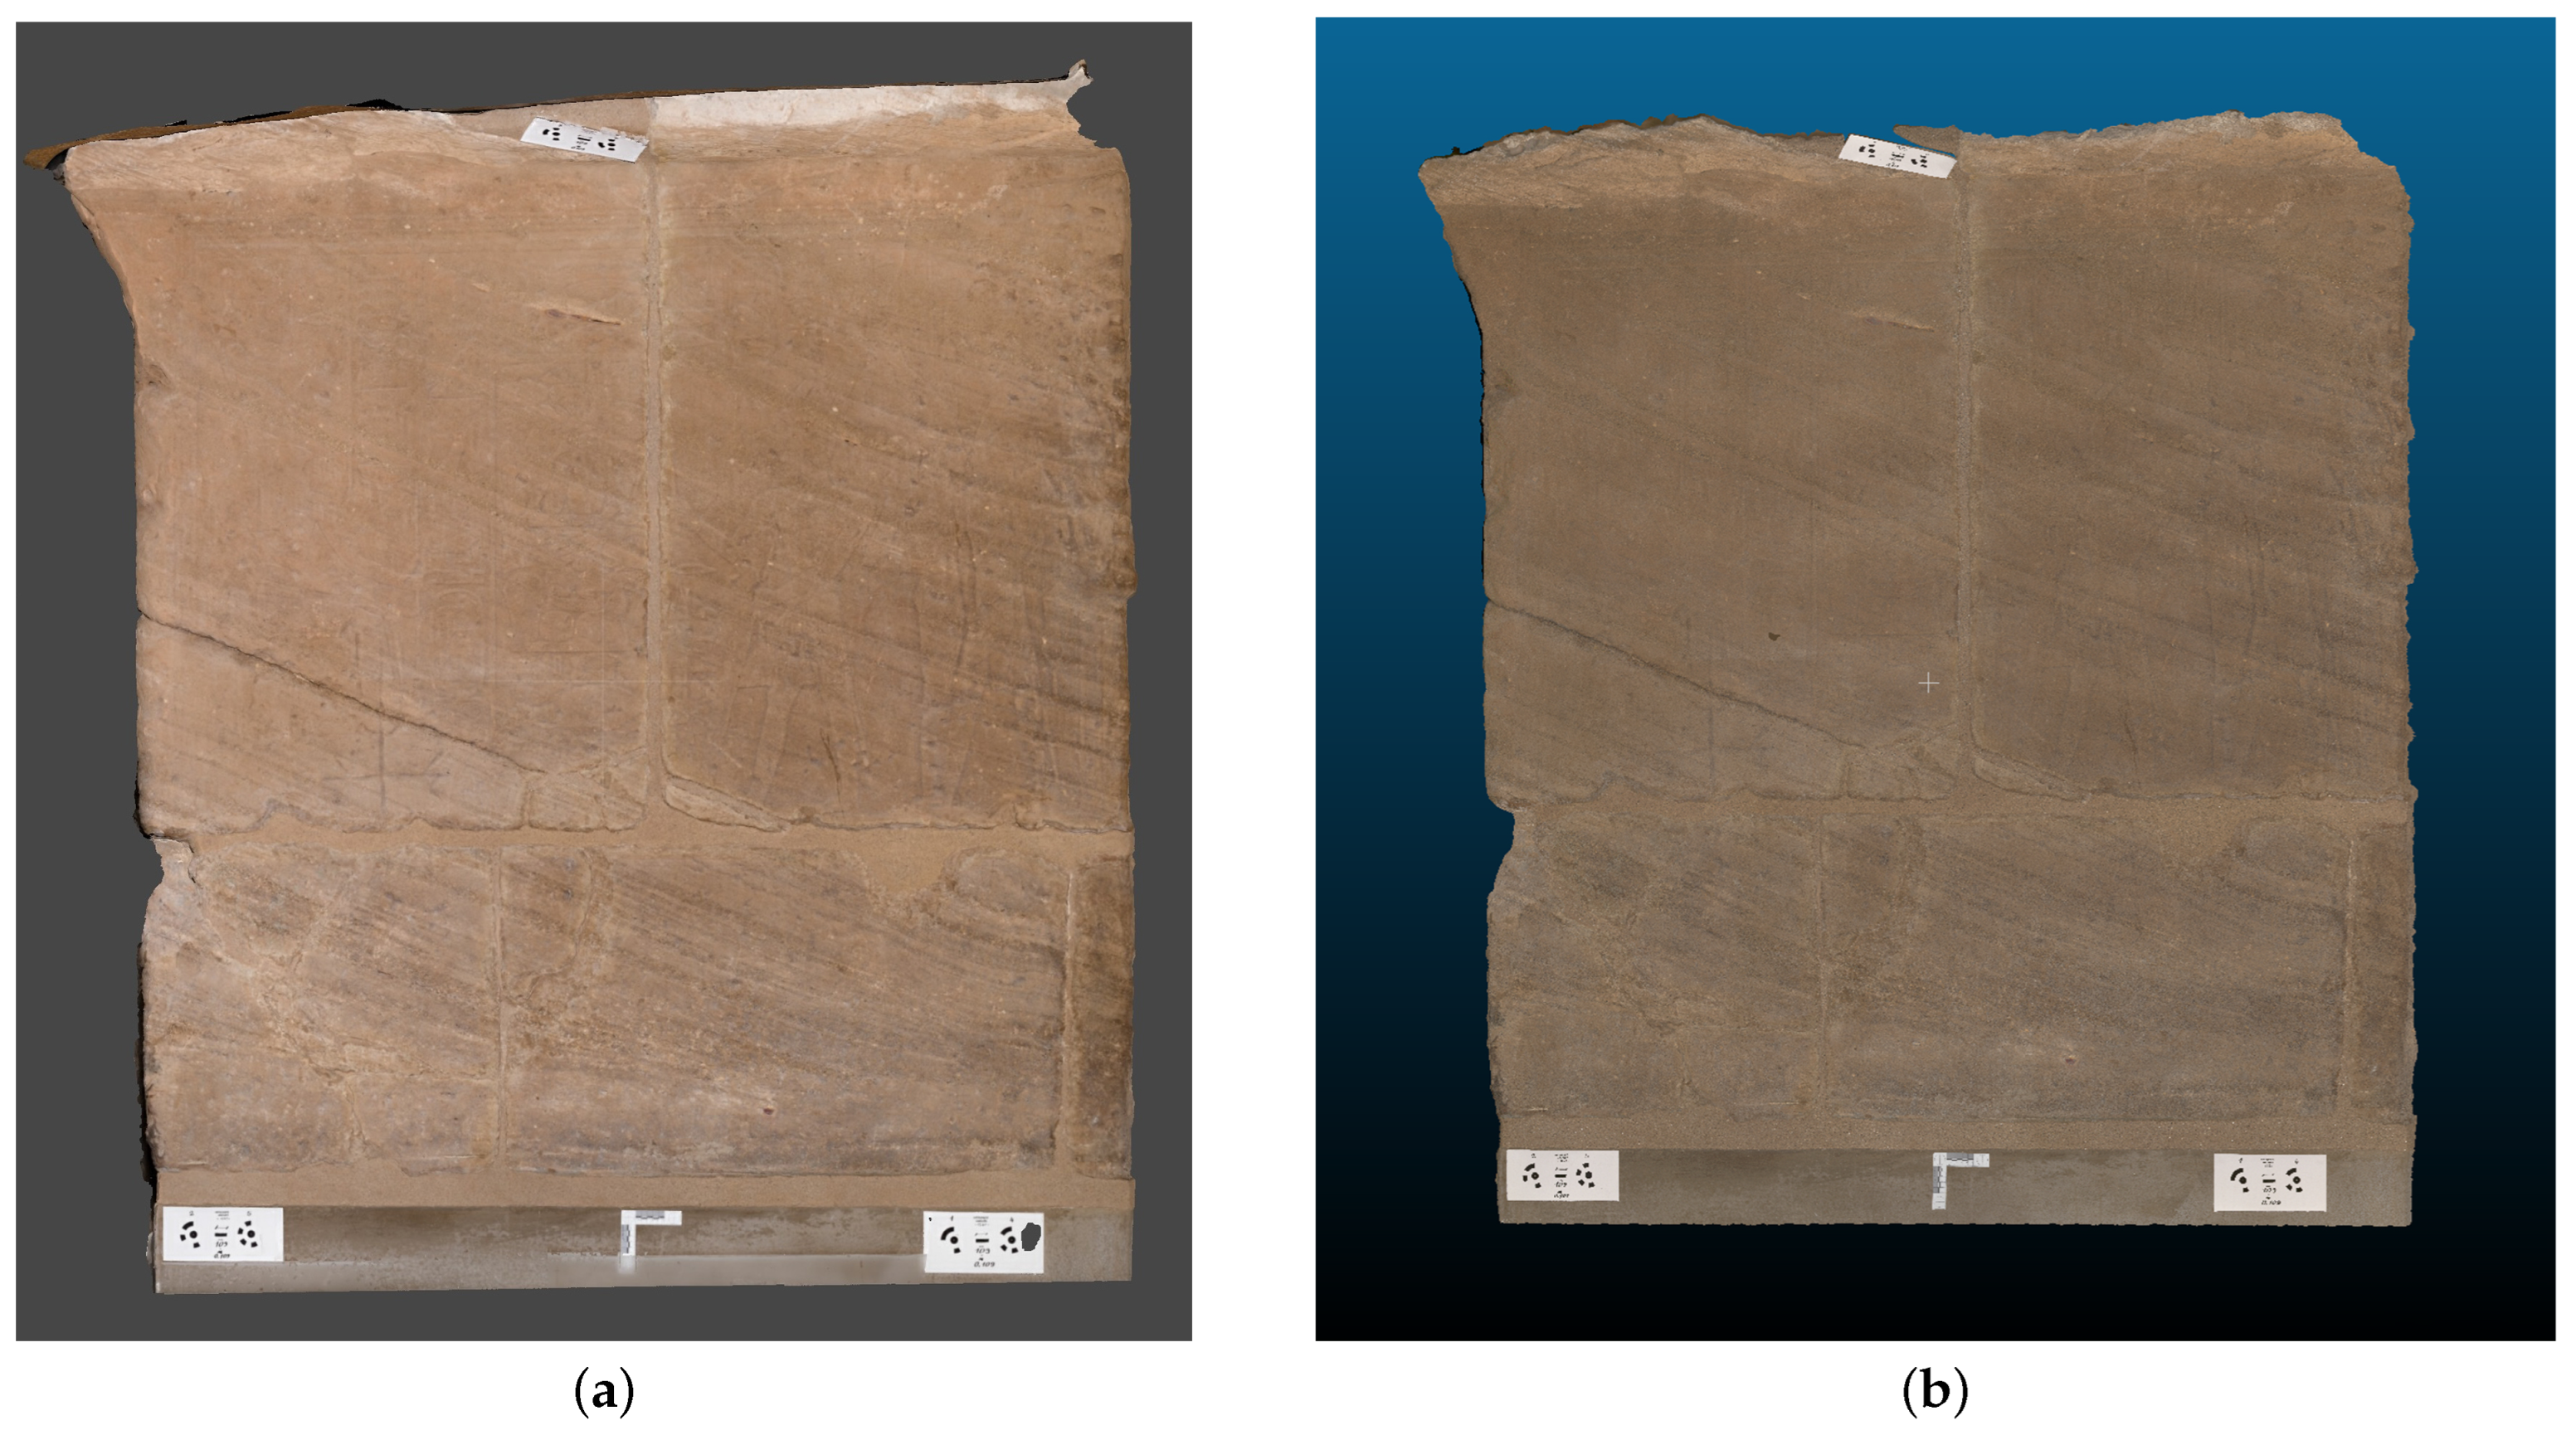
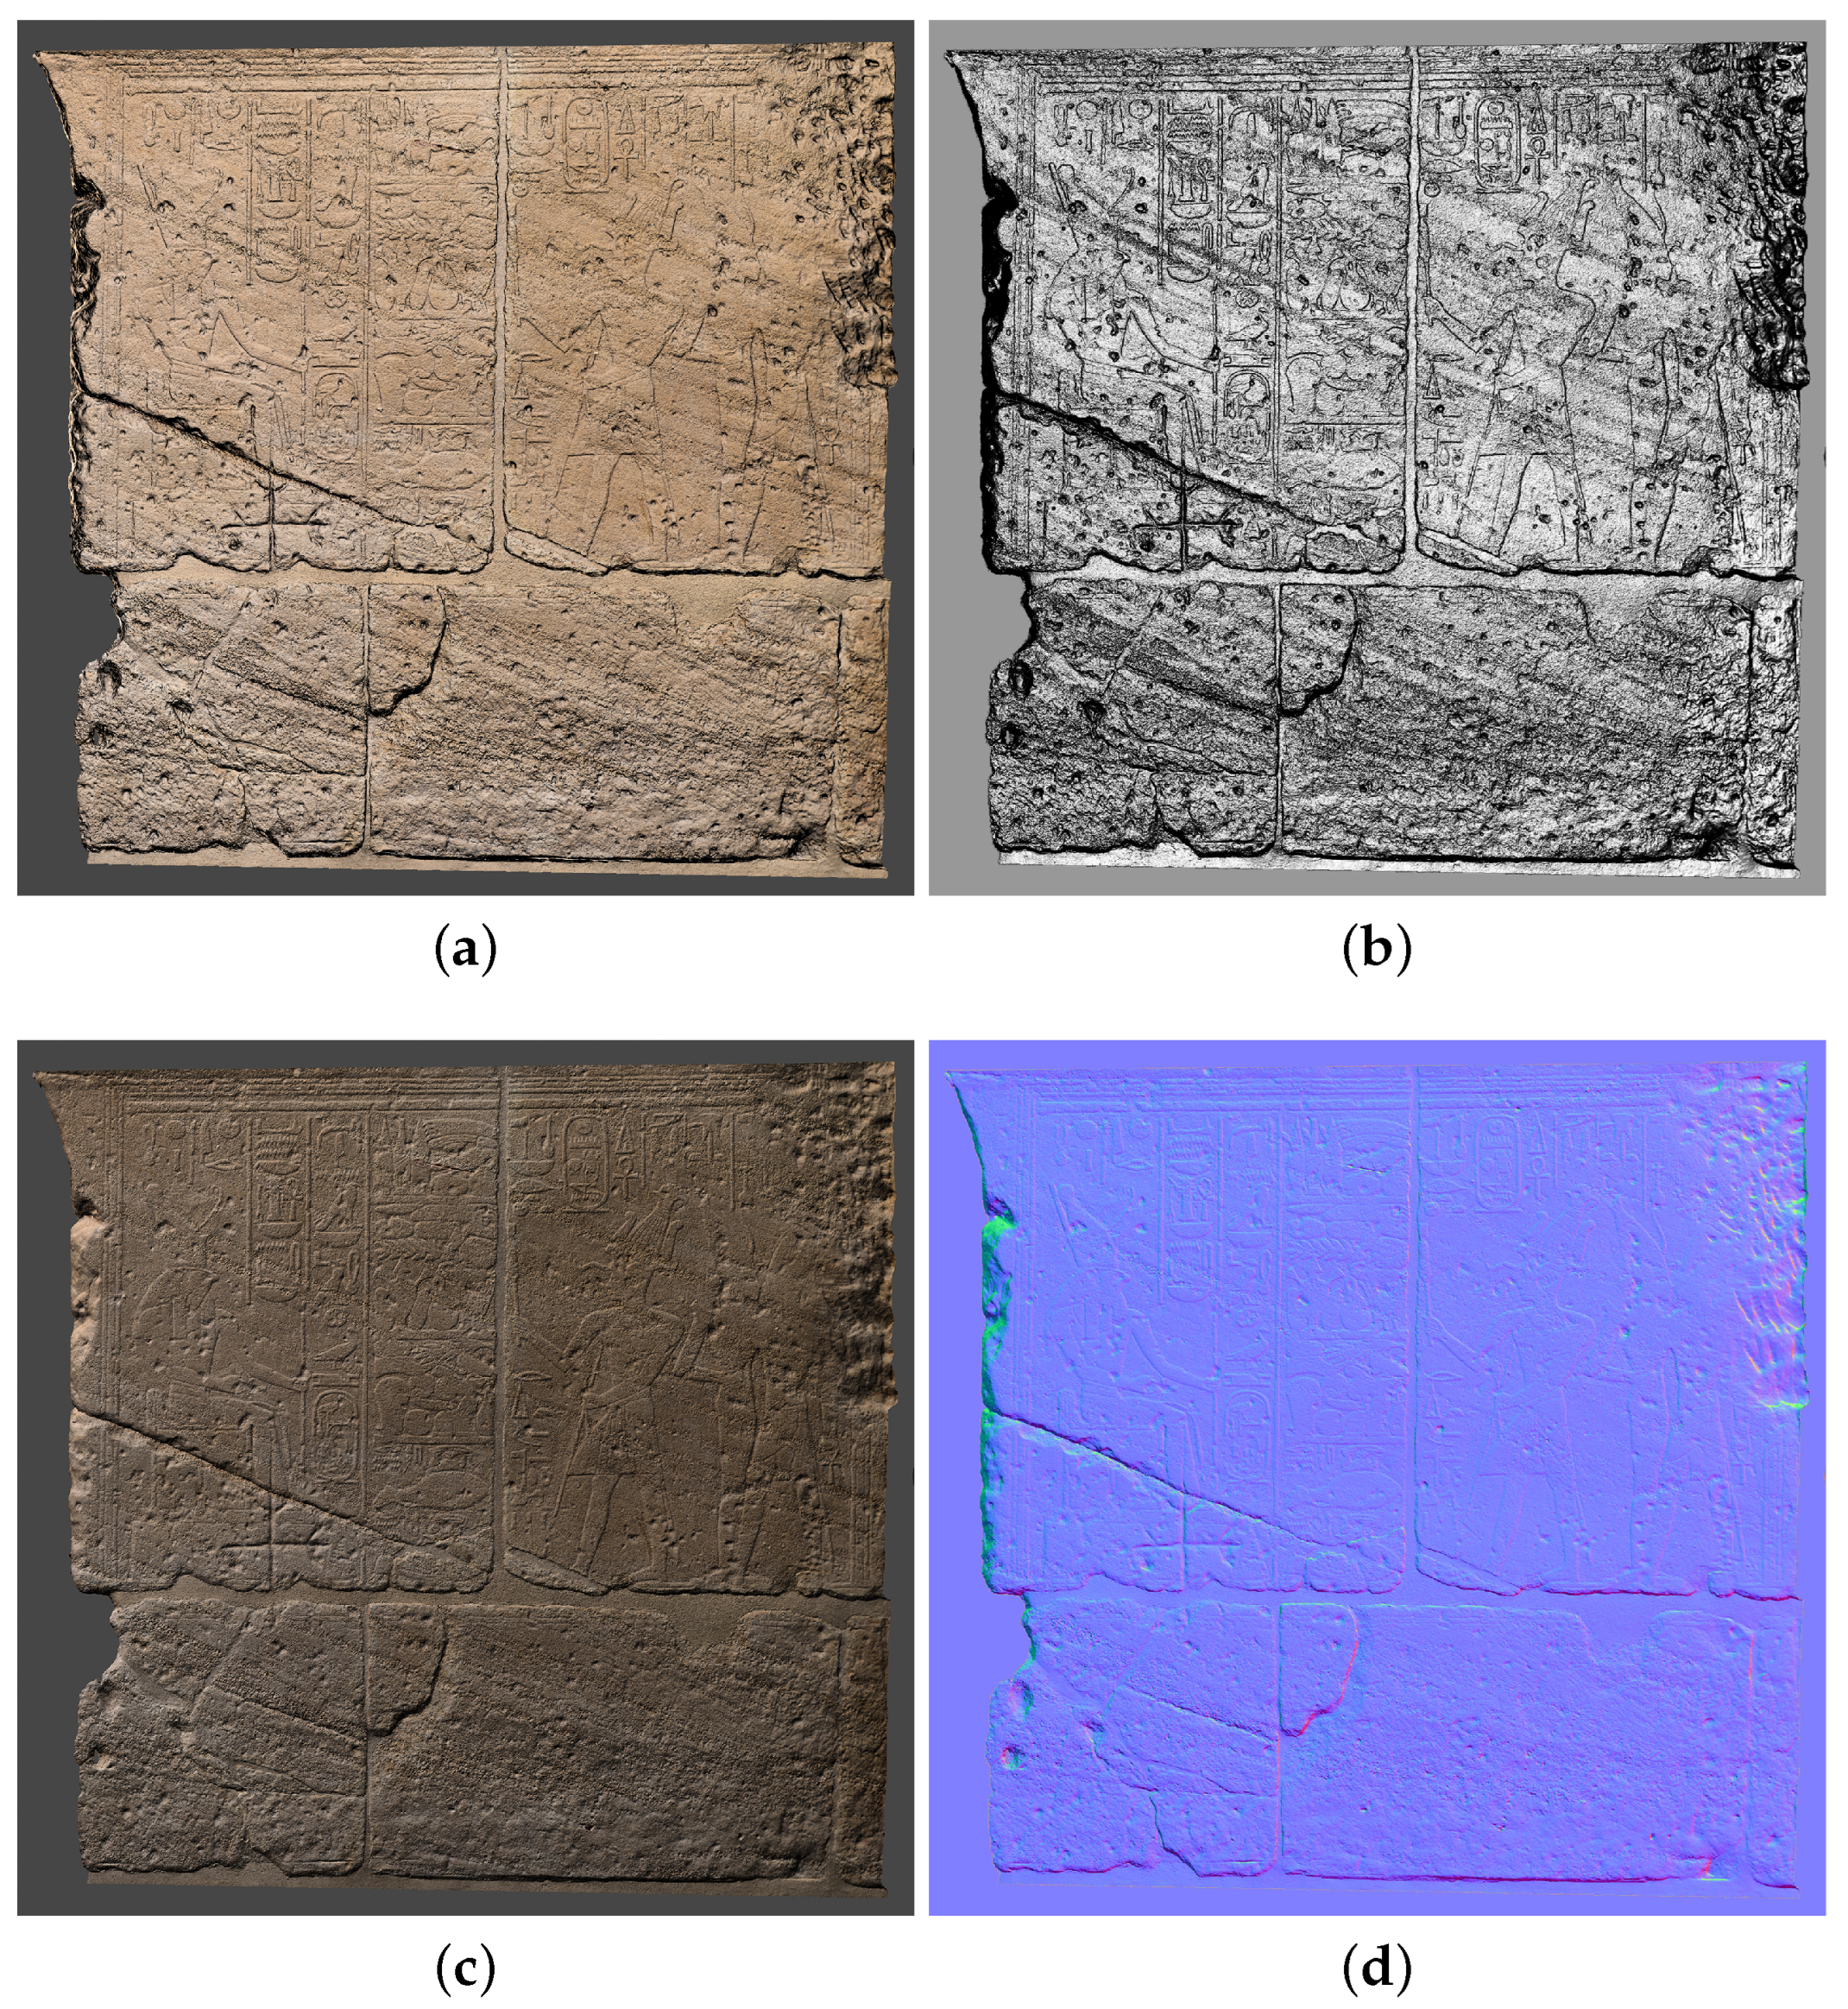
Figure 12a reports the result of the photogrammetric reconstruction of the bas-relief of the Ellesiya chapel. The 3D model’s properties are listed in Table 3. The proposed methodology and the setup employed in this paper have proven to be successful for the digitalization of the Ellesiya chapel. It is worth noticing that all images have been successfully aligned, and the obtained model reports a high-quality photorealistic texture.
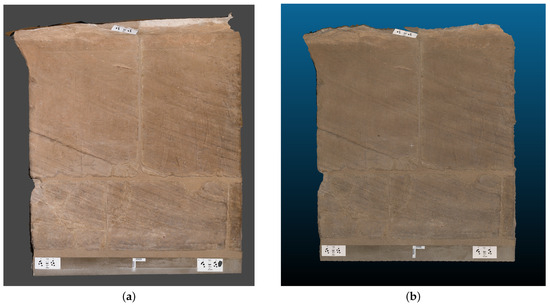
Figure 12.
Textured 3D model of the Ellesiya bas-relief by (a) photogrammetry and (b) Structured Light Scanner. Capture views from Metashape (a), and Cloud Compare (b).
Table 3.
The properties of the 3D model of the Ellesiya chapel obtained by photogrammetry.
Figure 12b reports the result of the reconstruction of the Ellesiya bas-relief by the SLS, which was employed as ground-truth for comparison.
The comparison performed between the SfM and SLS models highlighted the difference in the 3D data quality generated by the two technologies. Indeed, photogrammetry led to a 3D model with a minor level of detail than SLS in terms of polygon density: the SfM model is composed of 41 mln of polygons, while the SLS model is composed of 50 mln polygons.
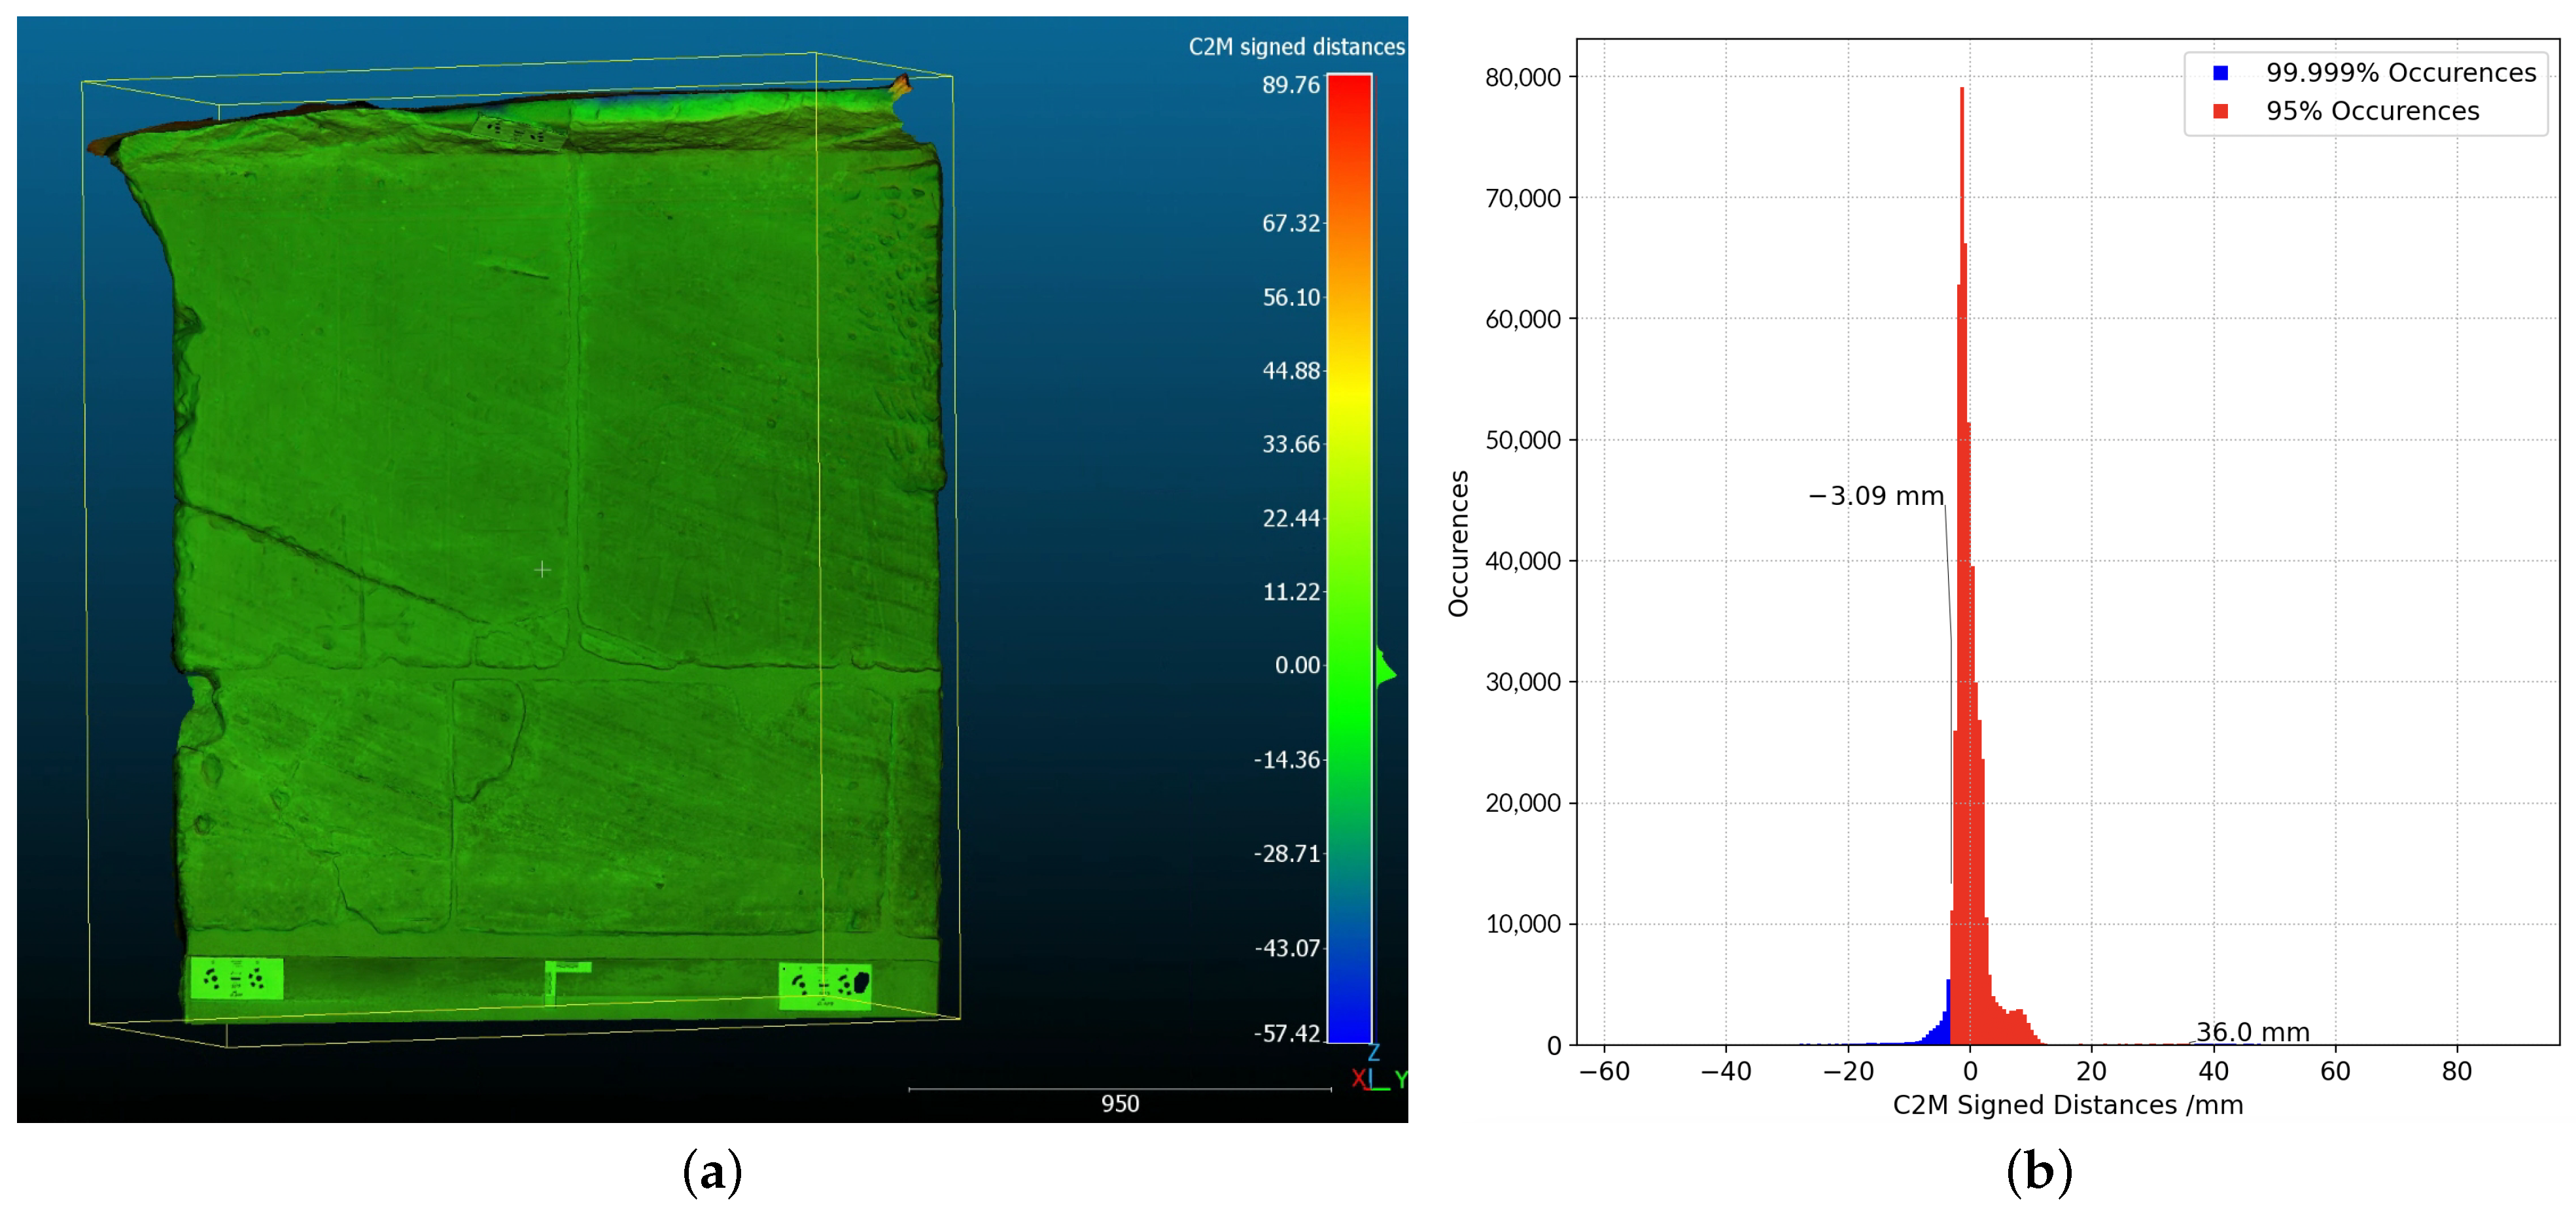
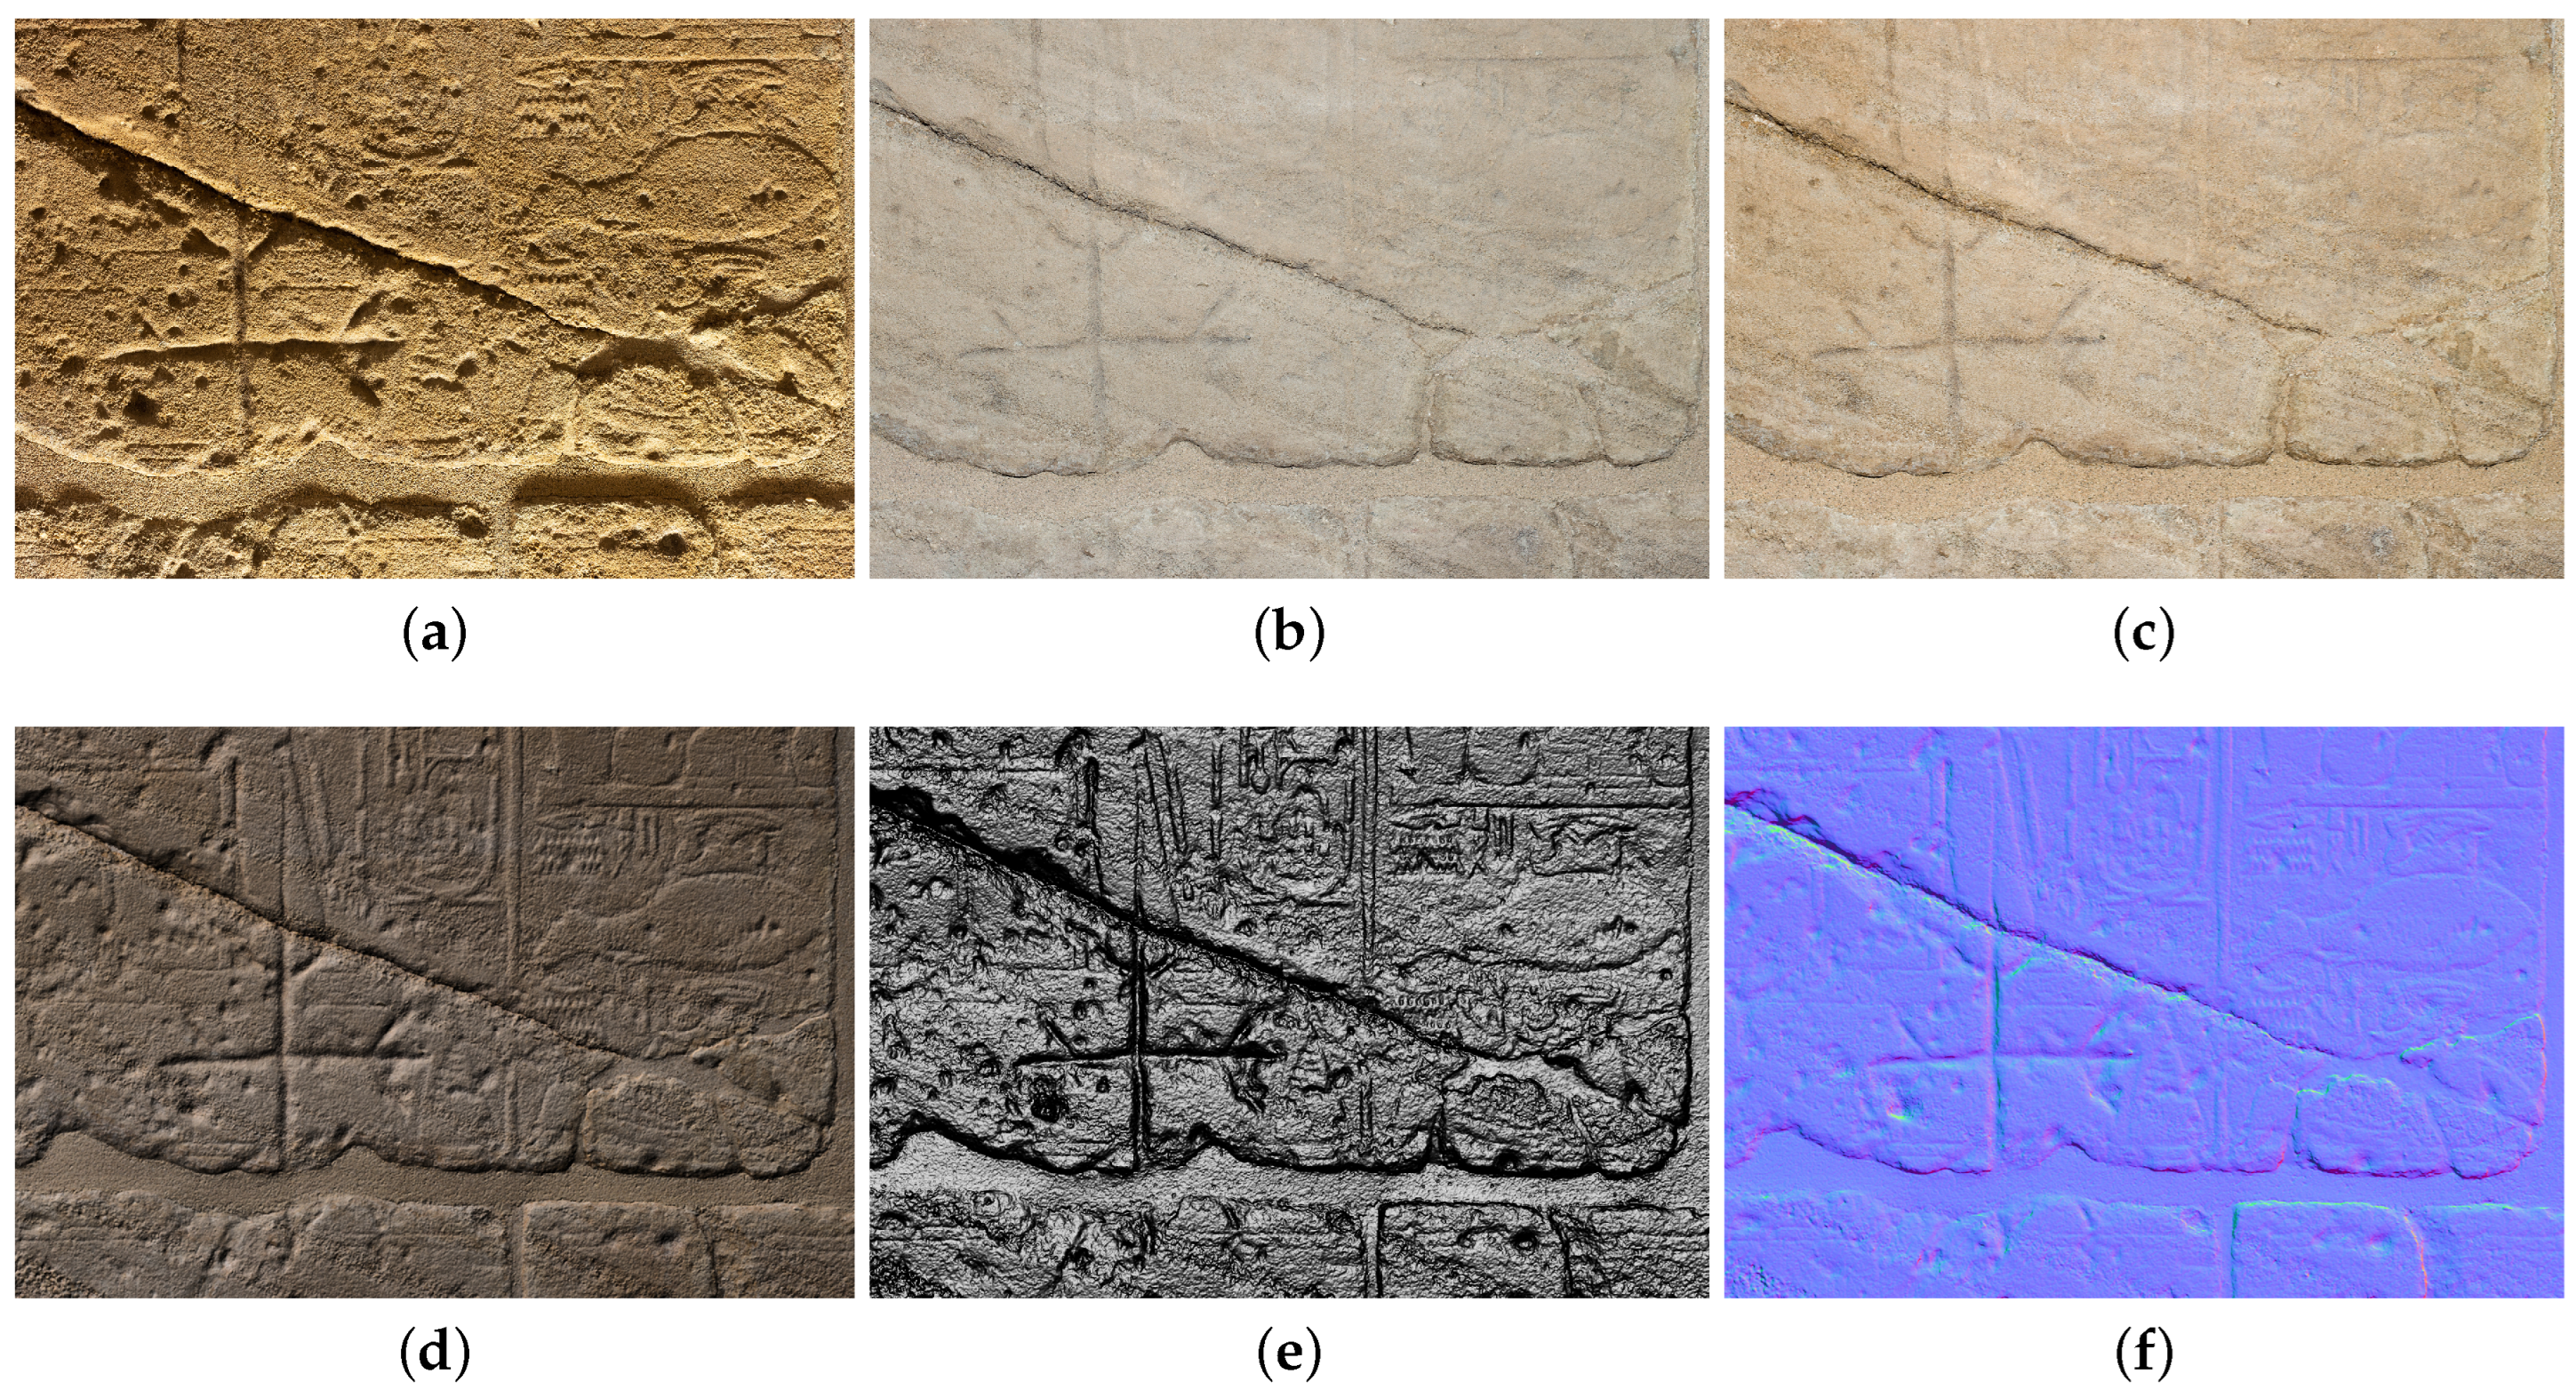
In addition, the deviation map calculated by CloudCompare between the SfM and SLS models is reported in Figure 13a. The map is reported alongside the corresponding colored histogram of the distances in mm. The positive values are assigned to the points of the 3D SfM model that lie above the reference surface (SLS model). Negative values are assigned to points that are below the surface of the reference model. The areas with points close to 0 (green color) represent the points with the smallest discrepancies and higher accuracy.

Figure 13.
(a) Colored deviation map computed between SfM and SLS meshes; (b) histograms of computed distances (mm) from the 3D surface comparison; by Cloudcompare.
The values represented in the histogram are included within the confidence interval. All distances fall in the range between mm and mm. It is worth noticing that, as reported in Figure 13b, of the points present distance values in the range between mm and mm.
Furthermore, Figure 14 shows the confidence map generated by Metashape. The map is reported alongside the corresponding color scale, with values included in a range of 0–100 confidence. The map provides insights into areas of the model where the reconstruction is less accurate (values close to 0) or more reliable (values close to 100).
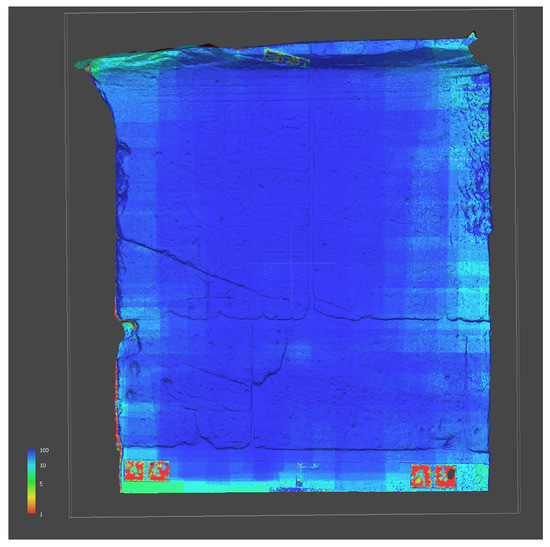
Figure 14.
Confidence map from Metashape; blue and red, respectively, show the highest and lowest image overlap.
4.2. RTI vs. V-RTI
The second comparison on the small copper plate aimed at evaluating the quality of V-RTI and RTI on the same object through direct observation, from a qualitative point of view.
Table 4 shows the values of the SfM model obtained on the copper painting; the model was then employed to create the V-RTI.
Table 4.
Specifications of 3D Model of the copper painting obtained by photogrammetry.
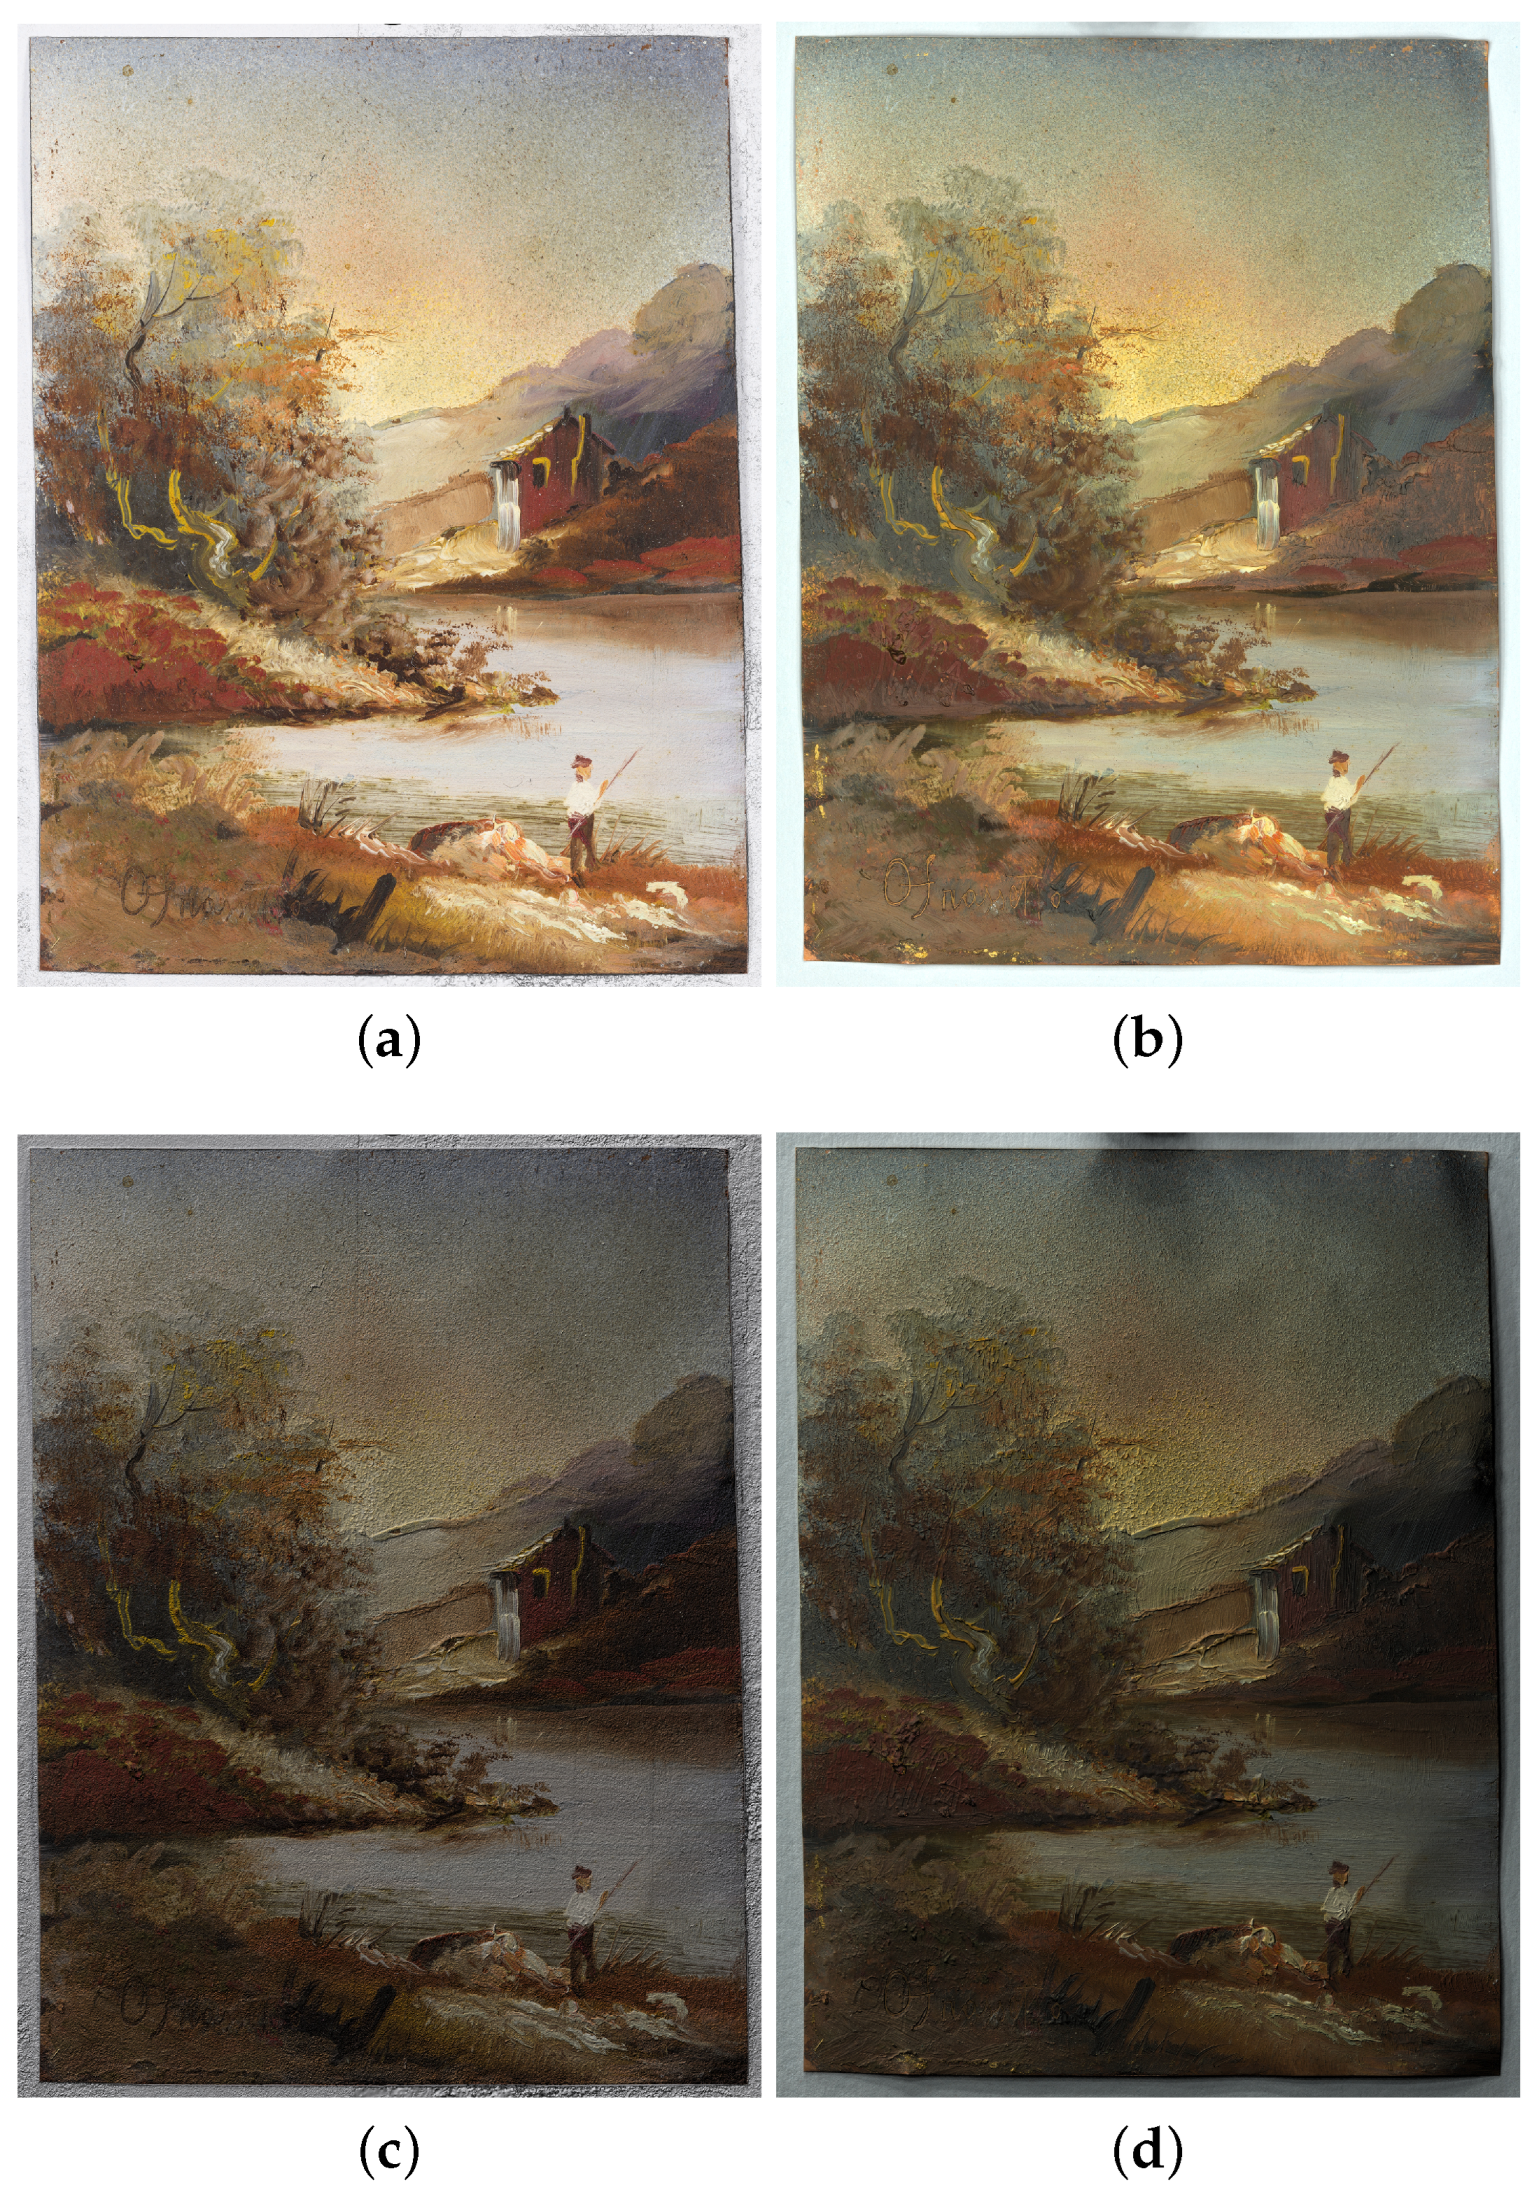
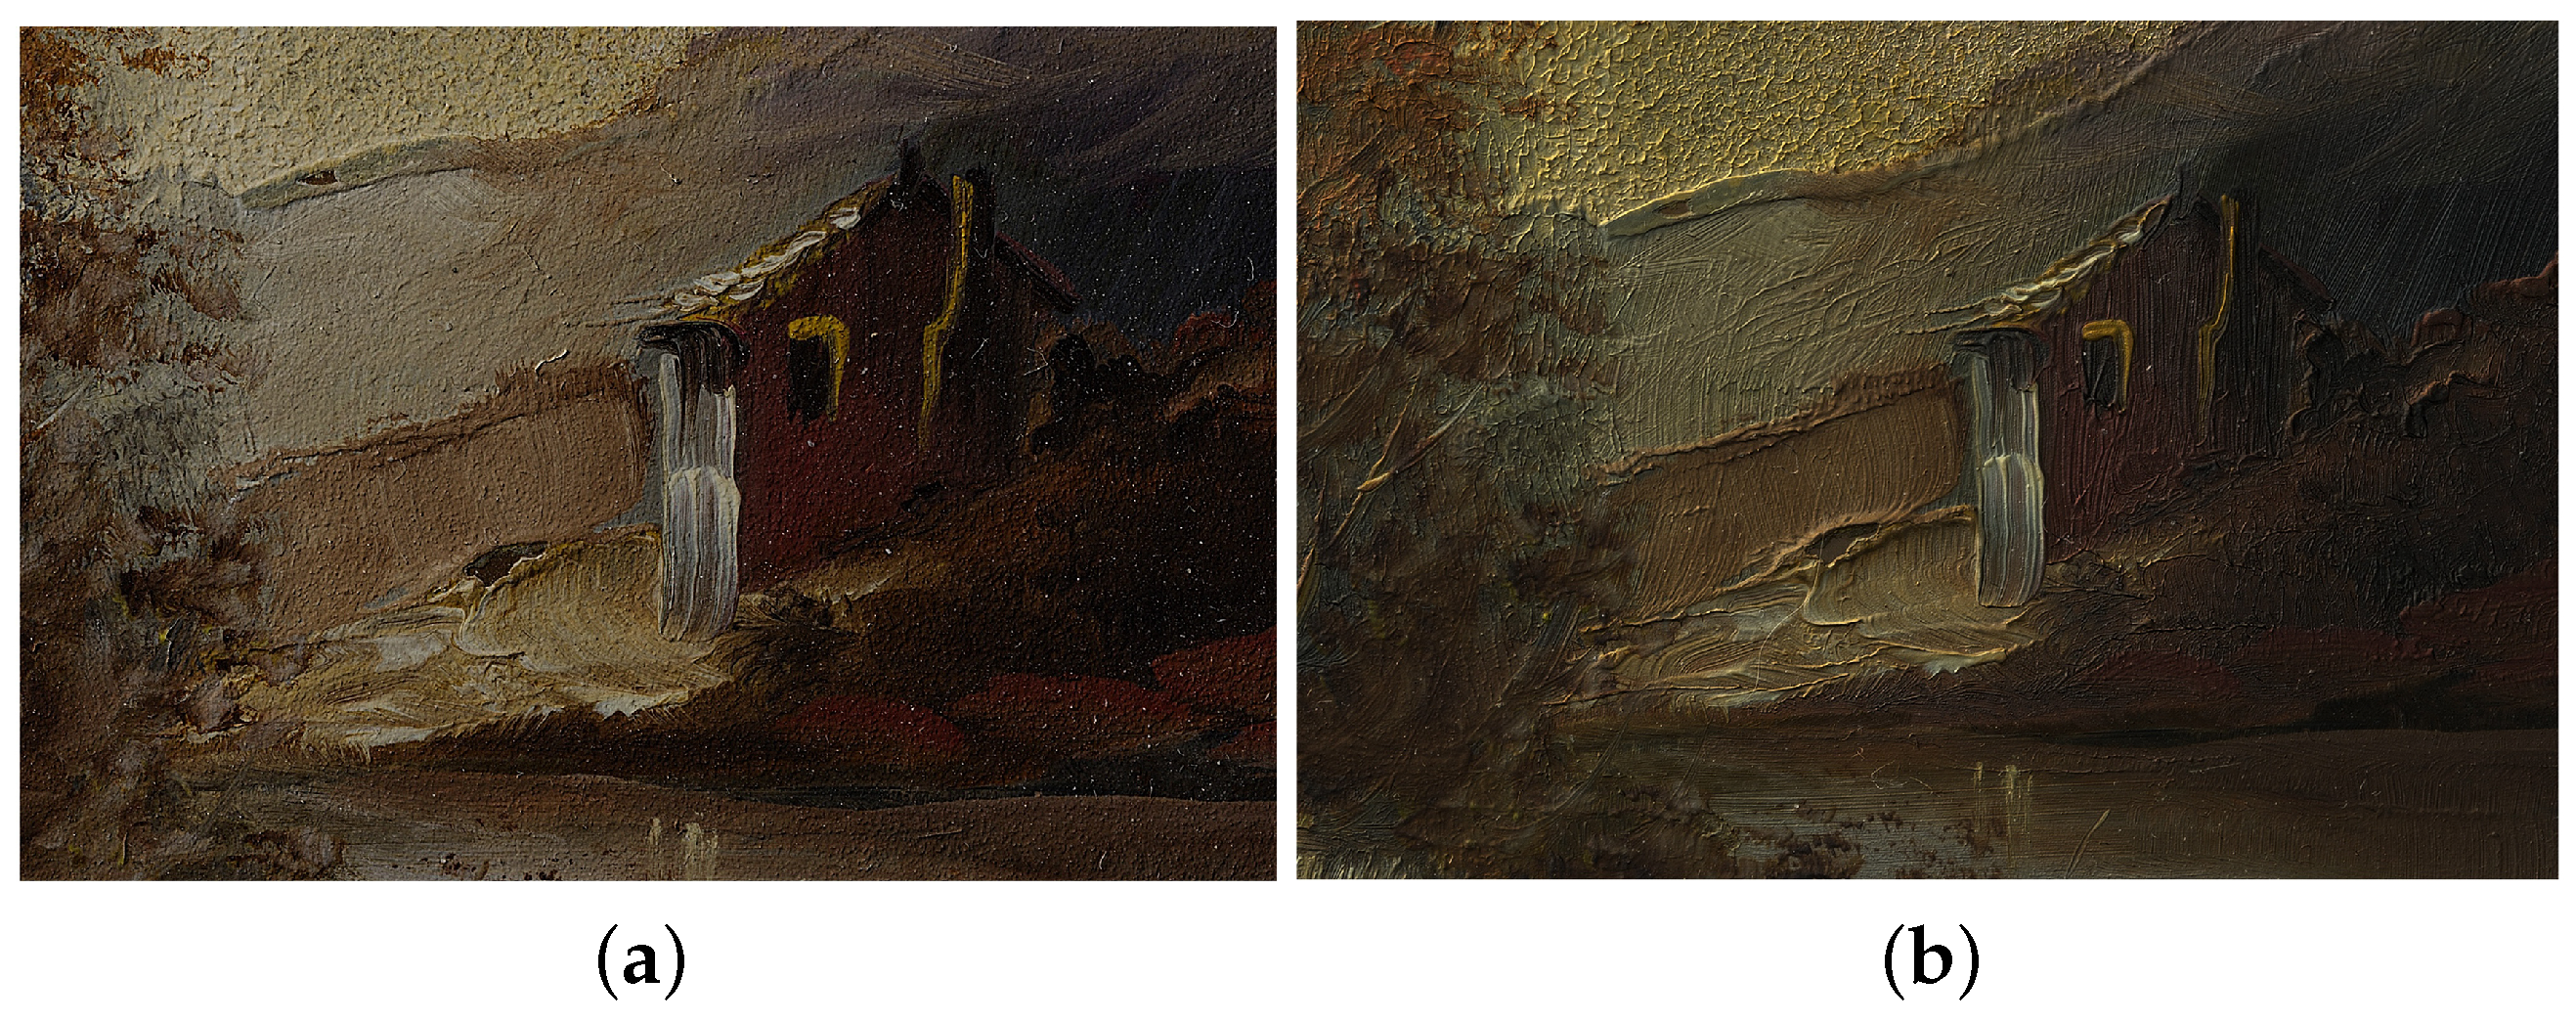
Figure 15 reports the results obtained on the copper painting by the proposed approach with V-RTI, alongside the RTI results obtained with the traditional approach. The final resolution of these images, exported using the RTI Viewer software, is 3902 pixels (width) by 5050 pixels (height) for the V-RTI and 3547 pixels (width) by 4600 pixels (height) for the RTI. Figure 15a,b were produced by setting a nadiral light (x:0 and y:0). Figure 15c,d are the result of the Diffuse Gain algorithm by setting a raking light to compare non-planar defects in the substrate. The Specular Enhancement of Figure 15e,f is produced with a frontal light in order to assess the quality of the surface reconstruction and the rendering of small details (e.g., changes in the brush direction when applying color). Finally, the Normal Maps in Figure 15g,h serve to illustrate the discrepancies in depth rendering. Figure 16 shows detail at the highest magnification in the various modes. Figure 17 shows the results obtained after the elaboration of V-RTI on the wall of Ellesiya. Figure 17a–c show the illumination from above, i.e., in the opposite direction to that found in the museum, while Figure 18d provides a Normal Map of the entire wall.
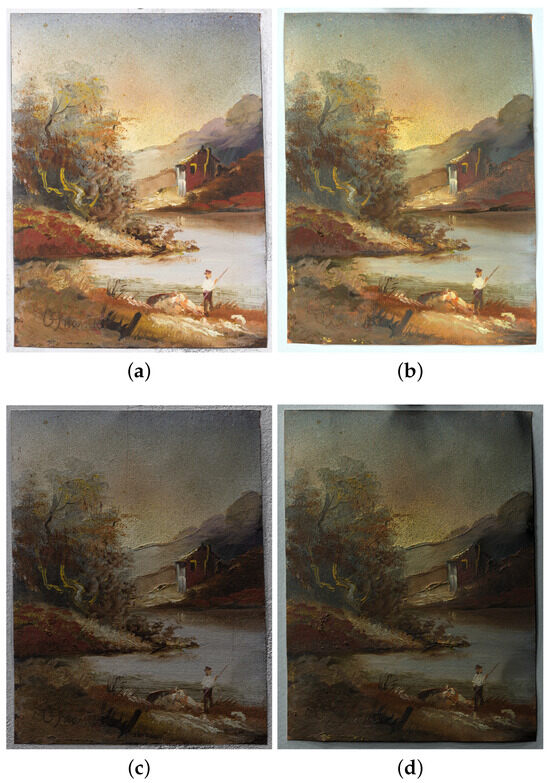
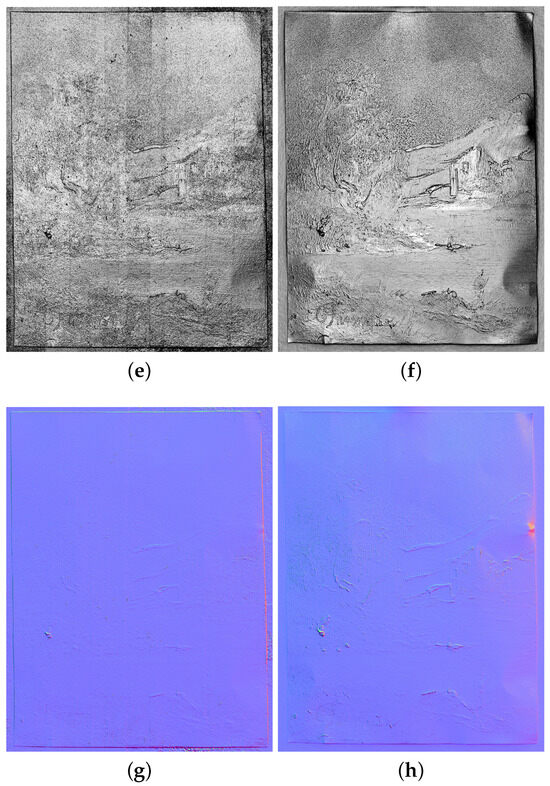
Figure 15.
Comparison of V-RTI (a,c,e,g) and RTI (b,d,f,h) on the copper painting: (a,b) default visualization, frontal light; (c,d) Diffuse Gain, raking light; (e,f) Specular Enhancement, frontal light; (g,h) normal maps.

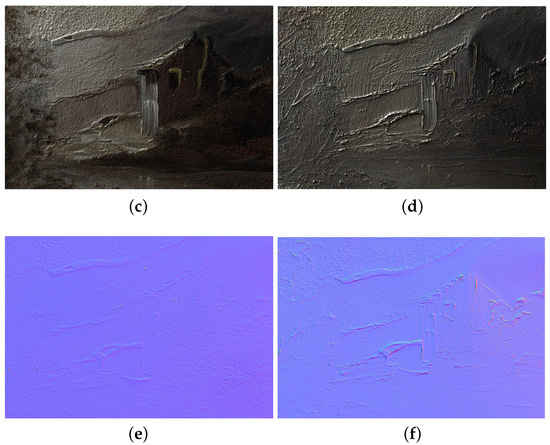
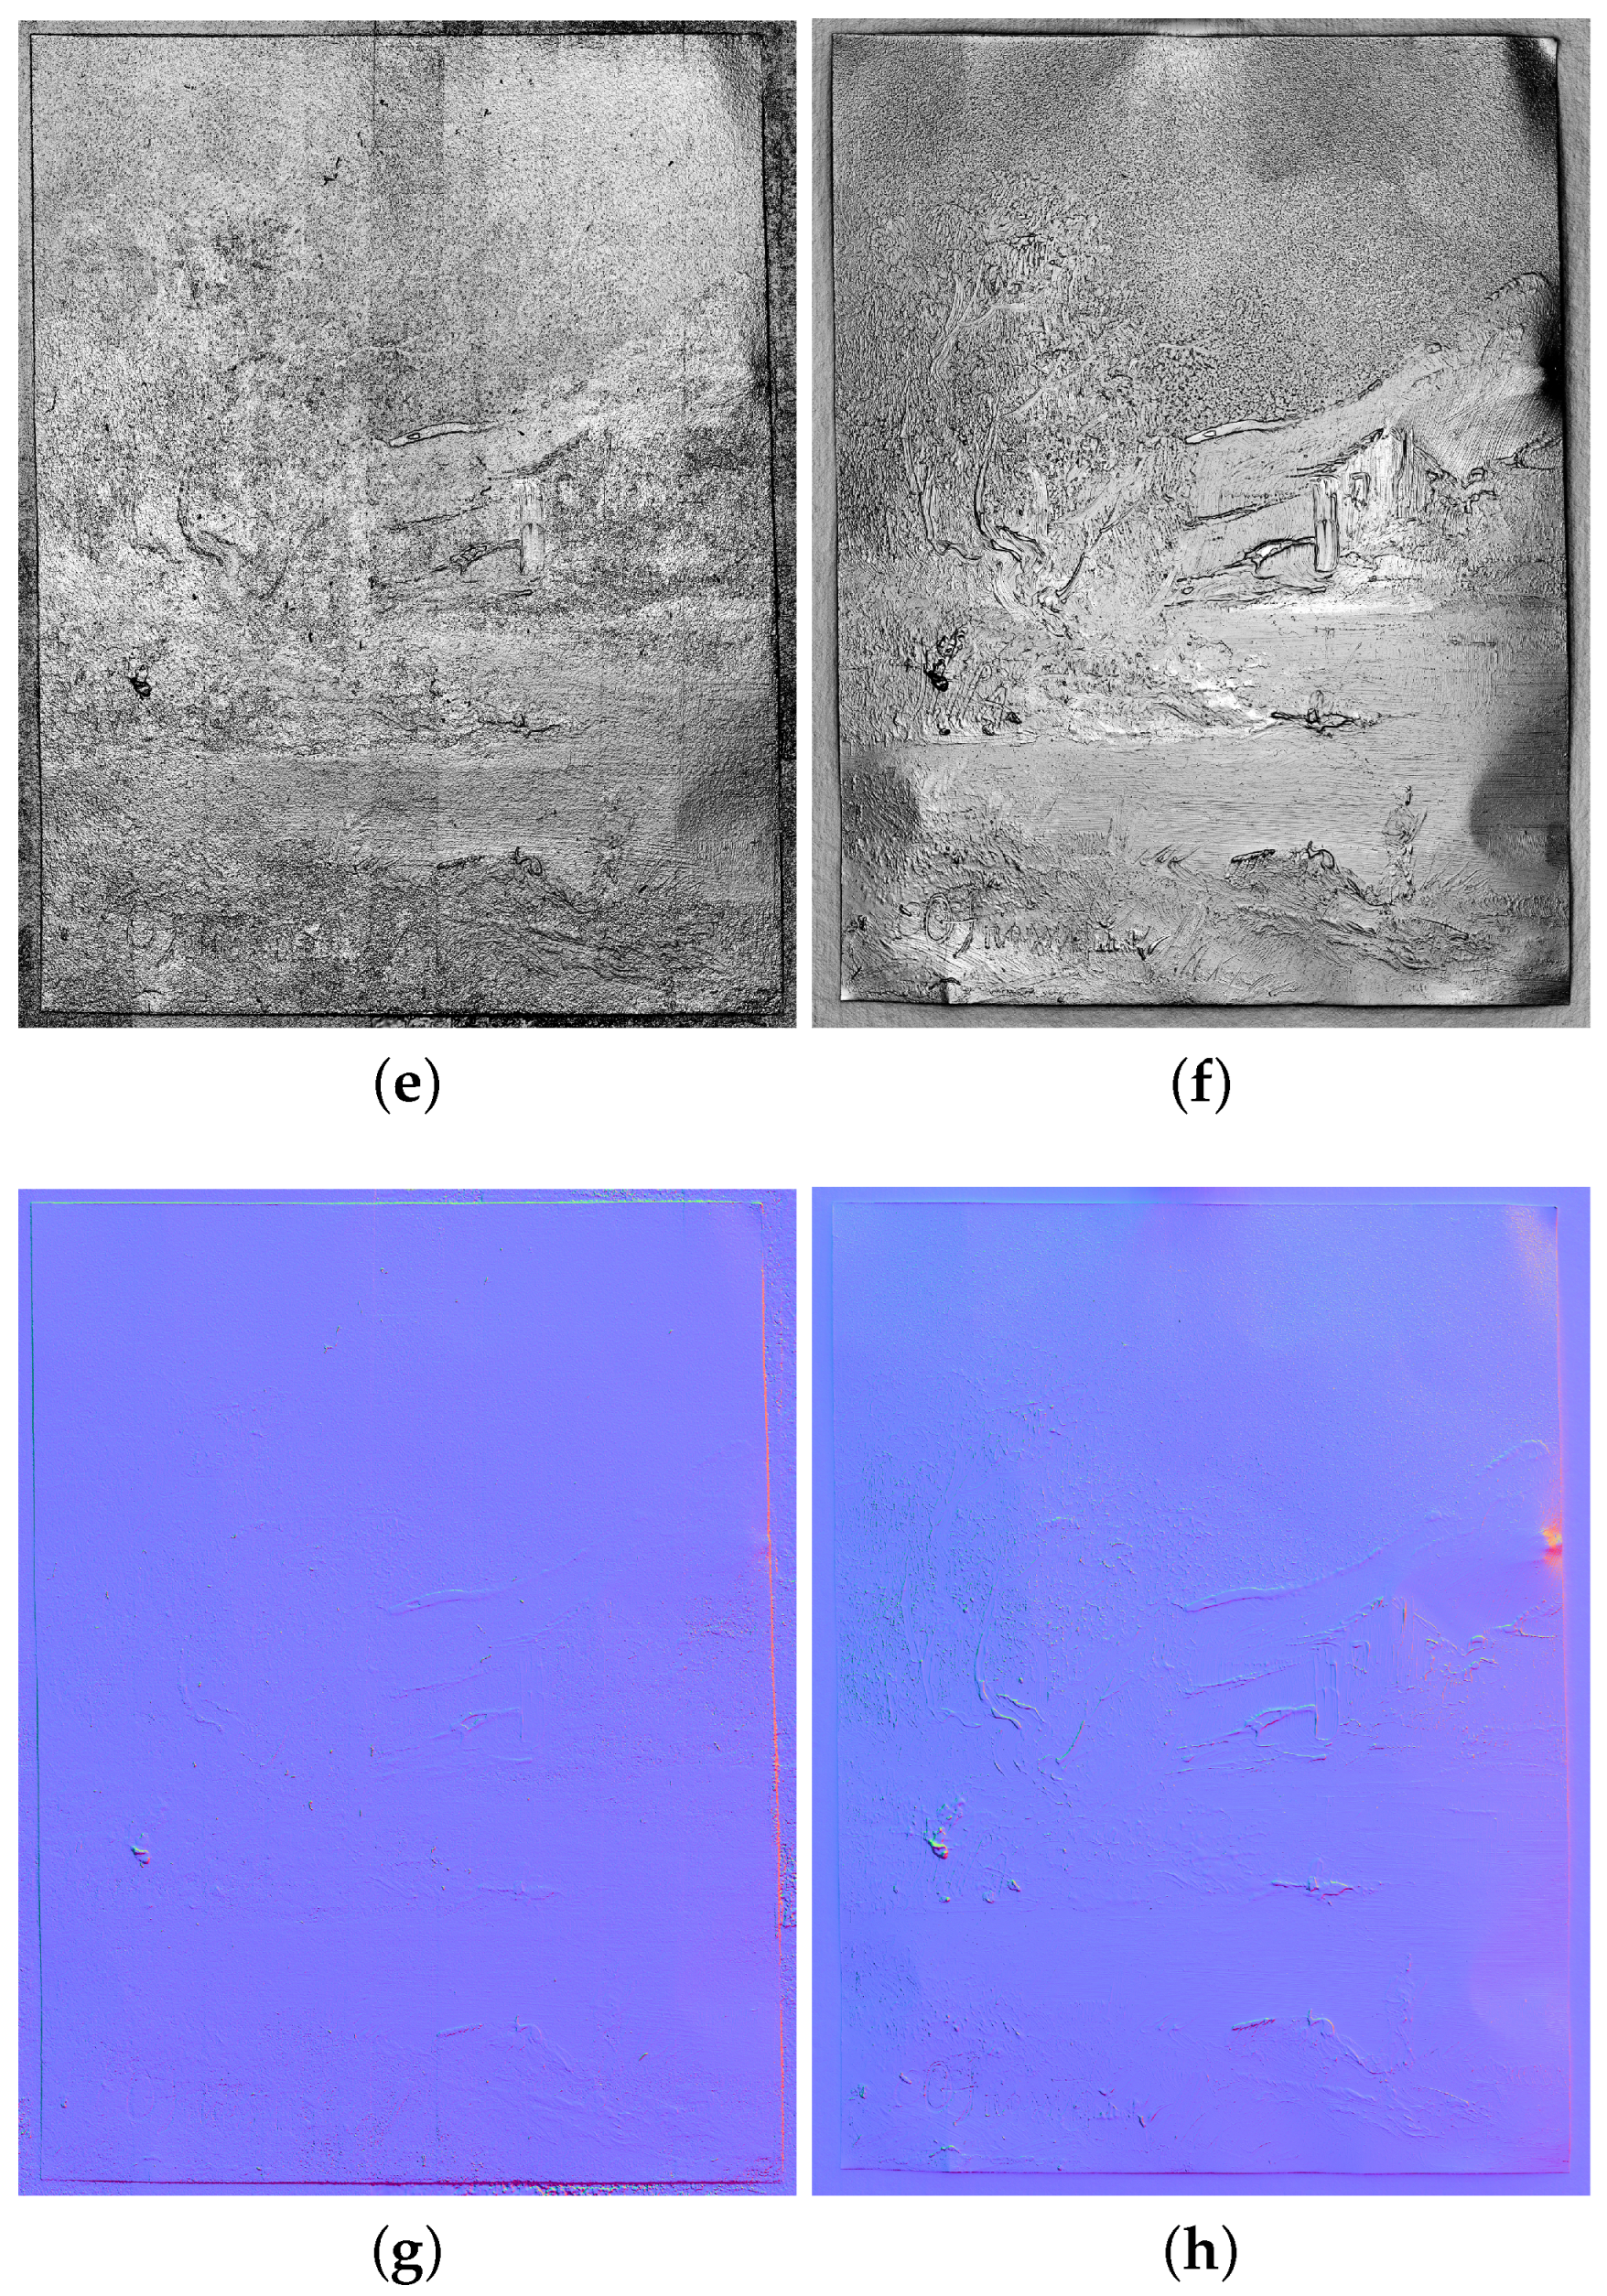
Figure 16.
Comparison of a small detail of V-RTI (a,c,e) and RTI (b,d,f) on the copper painting at 100 per cent of magnification: (a,b) Diffuse Gain; (c,d) Specular Enhancement; (e,f) normal maps.
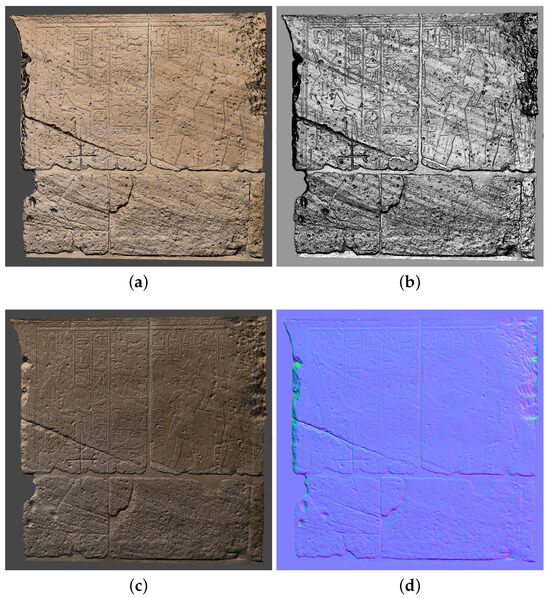
Figure 17.
Different outputs from V-RTI on the wall of Ellesiya. (a) Diffuse Gain; (b) Specular Enhancement; (c) Diffuse Gain (raking light); (d) normal map.
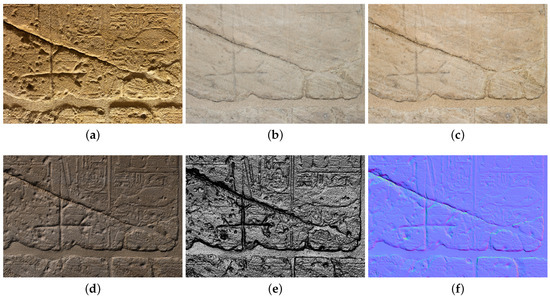
Figure 18.
(a) Museum lighting; (b) non-polarized frontal light; (c) polarized frontal light; (d) V-RTI Diffuse Gain; (e) V-RTI Specular Enhancement; (f) V-RTI normal map.
4.3. V-RTI
The proposed novel approach was successfully applied to the case of the Ellesiya chapel. Figure 17 reports the result on the wall.
In order to highlight the several steps involved in the processing, Figure 18 illustrates a specific area of the wall under different lighting conditions.
In particular, Figure 18a shows the wall in the museum’s current lighting configuration. This type of lighting, particularly with regard to the wall inscriptions, tends to invert the volumes, which may result in a misinterpretation of the reliefs. The light produced by a non-polarized frontal flash eliminated the ambient light component, thereby blurring both surface relief and material properties (Figure 18b). Subsequently, by rotating the polarizer by 90°, an image was recorded to verify the influence of this particular enlightenment in the rendering of materials (Figure 18c). To recover an appropriate light, a V-RTI image illuminated by a raking light from the top was generated using the Diffuse Gain algorithm (Figure 18d). Then, the Specular Enhancement algorithm, depicted in Figure 18e, was implemented to enhance the visualization of surface morphology and to facilitate its interpretation. Finally, a normal map was generated to assess the quality of detail and the regularity of the final mesh.
5. Discussion
This article explores a relatively new approach to RTI through the application of photogrammetry to generate rendered images of three-dimensional models, namely V-RTI.
V-RTI has demonstrated its usefulness in scenarios where the RTI acquisition is prevented by spatial constraints. The atypical conditions commonly encountered in museums, archaeological sites, and large-scale artworks (exceeding 1 m) often restrict the feasibility of RTI analysis, thus hindering crucial art historical, archaeological, and scientific research.
The current challenge with V-RTI is the achievement of a uniform and shadow-free texture, which frequently results in the final product being constrained to the visualization of the polygonal mesh only [24]. However, in this particular case study, the use of a polarized strobe has enabled the capture of reflection-free images, even with frontal lighting, thereby ensuring accurate texture representation regardless of ambient lighting conditions. This advancement represents a significant improvement compared to the previous study in which V-RTI had been applied [24].
To evaluate the proposed approach, several tests were performed.
First, a methodology that integrates photogrammetry and RTI to create a V-RTI was employed in the chapel of Ellesiya in the Museo Egizio of Turin, Italy. The quality of the obtained 3D model by photogrammetry was evaluated by comparison with a ground-truth obtained by a Structured Light Scanner (Artec Leo).
Regarding the photogrammetric data acquisition, the use of a frontal polarized on-camera flash offered several advantages during the acquisition phase: the ability to work freehand without additional equipment and the possibility of capturing images free of both reflections and shadows, which is useful for rendering high-quality textures and improving surface definition (Figure 18d–f).
The implementation of frontal lighting not only expedited the process but also mitigated the impact of shadows (Figure 18b), ensuring accurate documentation of the surface morphology even in the presence of ambient lighting (Figure 18a). By adopting this approach, it was possible to gather detailed information about the materiality of the wall, which would otherwise be difficult to record in the current lighting or in the absence of polarized light (Figure 18c).
Regarding the dimensional comparison between the SfM and SLS models, the deviation map (Figure 13a) shows a significantly high discrepancy, mainly located at the edges, between the two models that can be attributed to an incorrect reconstruction of the SfM model. This is a common issue encountered in the acquisition of flat surfaces, occurring when the dataset is not supported by an adequate number of oblique and peripheral images. In addition, as illustrated in the Confidence Map generated by Metashape (Figure 14), the surface bending of the SfM model may have been caused by a poor image overlapping at the edges of the wall.
As expected from previous cases reported in the literature [44,45,46], the SfM model derived from photographs taken using a 20.2 Megapixel sensor produced less detail and more distortion in the mesh than that obtained using SLS. However, this does not necessarily mean that an image-based method cannot produce similar data density and geometric accuracy. In terms of mesh density, a finer result could be obtained by significantly reducing the operating distance, and implementing a high-resolution sensor while increasing the number of oblique images.
In addition, to directly compare RTI and V-RTI outputs, a qualitative comparison of equivalent portions of a small test artifact that has been digitized using both techniques was performed, with the aim of demonstrating the potential of this innovative methodology.
V-RTI exhibited Specular Enhancement deficits in the rendering of metallic materials (Figure 16c), a defect inherent in the use of polarized light, which tends to produce an opaque result. Conversely, the ability to fully control the specular reflection is a significant advantage in the final rendering of the model, resulting in a more faithful and useful representation (Figure 16a,b). As illustrated in Figure 15g,h, the normal map generated by the two methods reveals a lack of detail in the V-RTI model, which is a disadvantage when compared to the RTI. Even though there are no other studies in the literature that directly compare RTI and V-RTI outputs, this result could be supported by previous studies in which RTI and 3D scanning have been used for surface evaluation, highlighting the greater performance of RTI [47]. However, despite V-RTI having some limitations in terms of the quality of the output, it can be a powerful tool in cases in which RTI cannot be applied.
Eventually, the examination of a wall of the chapel of Ellesiya served as a case study, illustrating the potential of V-RTI generated with a frontal and polarized light. In environments where RTI is unfeasible due to workspace and lighting limitations, V-RTI offers a fresh perspective on objects and surfaces that are otherwise challenging to analyze. The method applied here appears promising in addressing these challenges, although with a trade-off in quality, as photogrammetry offered inferior detail compared to RTI. This approach made it possible to not only gather geological information but also to document all the different human or natural interventions that now characterize the wall relief and that would have been hard to discern without this imaging method (Figure 17).
Unlike RTI, V-RTI requires a more complex processing methodology. After the photographic acquisition, the images are prepared for elaboration, which involves several steps and the use of multiple softwares. Furthermore, some 3D modeling knowledge is necessary to ensure control over the entire process, particularly with regard to the design of the virtual dome and the use of animation in Blender. Although these challenges may present an obstacle to the implementation of V-RTI, the possibility of using open-source software (RawTherapee for 2D data, Meshroom for 3D reconstruction, Blender for virtual rendering environment, and Relight for the RTI calculation, among others) enhances the accessibility of this technique.
The methodology used in this study, from data collection to its subsequent treatment integrating new image processing methods, has been adapted to the specific conditions of the chapel of Ellesiya. Nevertheless, this approach holds significant potential for future research and can be applied to other types of cultural heritage artifacts. For instance, it can be particularly beneficial in providing new insights into the study of other areas of archaeological interest where the environmental conditions are identical to those of the case study, as well as in other sites where the documentation of fine and shallow engravings involves similar limitations as those found in our study. Additionally, this methodology could be suitable also for applications on very large objects, such as parts of archaeological sites with extensive surfaces, painted walls, frescoes, or ancient cave walls with paintings, in which RTI cannot be applied, but where it would be possible to reconstruct a 3D model, even using drones or digitization techniques, and then apply V-RTI. Furthermore, in future works, V-RTI could be combined with other analytical techniques such as multiband analysis and high-definition imaging, as well as statistical methods for multivariate analysis like Principal Component Analysis (PCA). These combinations can provide valuable metrical data despite modest 3D resolutions, enhancing the analytical capabilities of the methodology. This adaptability underscores the versatility and broader applicability of our methodology in the field of cultural heritage preservation and documentation.
Author Contributions
Conceptualization, F.D.I. and L.E.S.; Methodology, F.D.I.; Validation, L.E.S. and S.C.; Formal Analysis, F.D.I. and J.A.; Investigation, F.D.I., L.E.S. and F.T.; Data Curation, F.D.I., L.E.S. and F.T.; Writing—Original Draft Preparation, F.D.I.; Writing—Review and Editing, L.E.S., J.A., F.P. and S.G.; Visualization, F.D.I. and L.E.S.; Supervision, F.P. and S.G.; Project Administration, S.G. All authors have read and agreed to the published version of the manuscript.
Funding
This publication is part of the project PNRR-NGEU which has received funding from the MUR-DM352/2022.
Data Availability Statement
The raw data supporting the conclusions of this article will be made available by the authors on request.
Acknowledgments
The authors wish to acknowledge the Museo Egizio of Turin for providing a suitable case study and limitless time to achieve the results shown in this article, as well as the CCR “La Venaria Reale” for providing precious equipment to process the digital output.
Conflicts of Interest
The authors declare no conflicts of interest.
Abbreviations
The following abbreviations are used in this manuscript:
| RTI | Reflectance Transformation Imaging |
| 3D | Three-dimensional |
| SfM | Structure from Motion |
| V-RTI | Virtual Reflectance Transformation Imaging |
| 2D | Two-dimensional |
| SLAM | Simultaneous Localization and Mapping system |
| H-RTI | Highlights Reflectance Transformation Imaging |
| D-RTI | Dome Reflectance Transformation Imaging |
| CCR | Centro per la Conservazione ed il Restauro dei Beni Culturali “La Venaria Reale” |
| VR | Virtual Reality |
| GSD | Ground Sampling Distance |
| LED | Light Emitting Diodes |
| VCSEL | Vertical Cavity Surface Emitting Laser |
| ICP | Iterative Closest Point |
| PTM | Polynomial Texture Mapping |
| SLS | Structured Light Scanner |
References
- Matteini, M. The Extraordinary Role of the Imaging Techniques in the Conservation and Valorization of Cultural Heritage. In Electronic Imaging & the Visual Arts. EVA 2018 Florence; Firenze University Press: Firenze, Italy, 2018; pp. 127–129. [Google Scholar] [CrossRef]
- Karami, A.; Menna, F.; Remondino, F. Combining photogrammetry and photometric stereo to achieve precise and complete 3D reconstruction. Sensors 2022, 22, 8172. [Google Scholar] [CrossRef] [PubMed]
- Cantó, A.; Lerma, J.L.; Martínez Valle, R.; Villaverde, V. Multi-light photogrammetric survey applied to the complex documentation of engravings in Palaeolithic rock art: The Cova de les Meravelles (Gandia, Valencia, Spain). Herit. Sci. 2022, 10, 169. [Google Scholar] [CrossRef]
- Es Sebar, L.; Lombardo, L.; Buscaglia, P.; Cavaleri, T.; Lo Giudice, A.; Re, A.; Borla, M.; Aicardi, S.; Grassini, S. 3D multispectral imaging for cultural heritage preservation: The case study of a wooden sculpture of the Museo Egizio di Torino. Heritage 2023, 6, 2783–2795. [Google Scholar] [CrossRef]
- Santoro, V.; Patrucco, G.; Lingua, A.; Spanò, A. Multispectral Uav Data Enhancing the Knowledge of Landscape Heritage. Int. Arch. Photogramm. Remote Sens. Spat. Inf. Sci. 2023, 48, 1419–1426. [Google Scholar] [CrossRef]
- Alsadik, B.; Gerke, M.; Vosselman, G.; Daham, A.; Jasim, L. Minimal camera networks for 3D image based modeling of cultural heritage objects. Sensors 2014, 14, 5785–5804. [Google Scholar] [CrossRef] [PubMed]
- Lech, P.; Klebowski, M.; Beldyga, M.; Ostrowski, W. Application of a stand-alone RTI measuring system with an integrated camera in cultural heritage digitisation. J. Archaeol. Sci. Rep. 2024, 53, 104318. [Google Scholar]
- Frank, E.; Heath, S.; Stein, C. Integration of photogrammetry, reflectance transformation imaging (RTI), and multiband imaging (MBI) for visualization, documentation, and analysis of archaeological and related materials. ISAW Pap. 2021, 21. [Google Scholar]
- Frood, E.; Howley, K. Applications of Reflectance Transformation Imaging (RTI) in the Study of Temple Graffiti; Cambridge Scholars Publishing: Cambridge, UK, 2014. [Google Scholar]
- Piquette, K.E. Documenting archaeological surfaces with Reflectance Transformation Imaging (RTI). In Science in the Study of Ancient Egypt; Routledge: New York, NY, USA, 2015; pp. 298–304. [Google Scholar]
- Kleinitz, C. Reflectance Transformation Imaging (RTI) in der Bestandsdokumentation der Sekundärbilder Und-Inschriften von Musawwarat es Sufra im Rahmen des Musawwarat Graffiti Project; Der Antike Sudan. Mitteilungen der Sudanarchäologischen Gesellschaft zu Berlin e. V.: Berlin, Germany, 2012; pp. 7–20. [Google Scholar]
- Min, J.; Jeong, S.; Park, K.; Choi, Y.; Lee, D.; Ahn, J.; Har, D.; Ahn, S. Reflectance transformation imaging for documenting changes through treatment of Joseon dynasty coins. Herit. Sci. 2021, 9, 105. [Google Scholar] [CrossRef]
- Florindi, S.; Revedin, A.; Aranguren, B.; Palleschi, V. Application of reflectance transformation imaging to experimental archaeology studies. Heritage 2020, 3, 1279–1286. [Google Scholar] [CrossRef]
- Newman, S.E. Applications of reflectance transformation imaging (RTI) to the study of bone surface modifications. J. Archaeol. Sci. 2015, 53, 536–549. [Google Scholar] [CrossRef]
- Relight, RTI Sofware. Available online: https://vcg.isti.cnr.it/relight/#download (accessed on 3 May 2024).
- Mudge, M.; Malzbender, T.; Schroer, C.; Lum, M. New reflection transformation imaging methods for rock art and multiple-viewpoint display. In Proceedings of the VAST 2006: 7th International Symposium on Virtual Reality, Archaeology and Cultural Heritage, Nicosia, Cyprus, 4 November 2006; Ioannides, M., Arnold, D., Niccolucci, F., Mania, K., Eds.; Volume 6, pp. 195–202. [Google Scholar]
- Khawaja, M.A.; George, S.; Marzani, F.; Hardeberg, J.Y.; Mansouri, A. An interactive method for adaptive acquisition in Reflectance Transformation Imaging for cultural heritage. In Proceedings of the IEEE/CVF International Conference on Computer Vision, Paris, France, 2–3 October 2023; pp. 1690–1698. [Google Scholar]
- Mytum, H.; Peterson, J.R. The application of reflectance transformation imaging (RTI) in historical archaeology. Hist. Archaeol. 2018, 52, 489–503. [Google Scholar] [CrossRef]
- Kinsman, T. An easy to build reflectance transformation imaging (RTI) system. J. Biocommun. 2016, 40, 10–13. [Google Scholar] [CrossRef]
- Hughes-Hallett, M.; Young, C.; Messier, P. A review of RTI and an investigation into the applicability of micro-RTI as a tool for the documentation and conservation of modern and contemporary paintings. J. Am. Inst. Conserv. 2021, 60, 18–31. [Google Scholar] [CrossRef]
- Vietti, A.; Parvis, M.; Donato, N.; Grassini, S.; Lombardo, L. Development of a low-cost and portable device for Reflectance Transformation Imaging. In Proceedings of the 2023 IEEE International Instrumentation and Measurement Technology Conference (I2MTC), Kuala Lumpur, Malaysia, 22–25 May 2023; pp. 1–6. [Google Scholar]
- Luxman, R.; Castro, Y.E.; Chatoux, H.; Nurit, M.; Siatou, A.; Le Goïc, G.; Brambilla, L.; Degrigny, C.; Marzani, F.; Mansouri, A. LightBot: A multi-light position robotic acquisition system for adaptive capturing of cultural heritage surfaces. J. Imaging 2022, 8, 134. [Google Scholar] [CrossRef]
- Di Iorio, F.; Es Sebar, L.; Lombardo, L.; Vietti, A.; Aicardi, S.; Pozzi, F.; Grassini, S. An improved methodology for extending the applicability of Reflectance Transformation Imaging to confined sites. In Proceedings of the 2023 IMEKO International Conference on Metrology for Archaeology and Cultural Heritage (MetroArchaeo 2023), Rome, Italy, 19–21 October 2023; pp. 137–141. [Google Scholar]
- Greaves, A.M.; Duffy, S.; Peterson, J.R.; Tekoğlu, Ş.R.; Hirt, A. Carved in stone: Field trials of virtual reflectance transformation imaging (V-RTI) in classical Telmessos (Fethiye). J. Field Archaeol. 2020, 45, 542–555. [Google Scholar] [CrossRef]
- Remondino, F. Heritage recording and 3D modeling with photogrammetry and 3D scanning. Remote Sens. 2011, 3, 1104–1138. [Google Scholar] [CrossRef]
- Es Sebar, L.; Angelini, E.; Grassini, S.; Parvis, M.; Lombardo, L. A trustable 3D photogrammetry approach for cultural heritage. In Proceedings of the 2020 IEEE International Instrumentation and Measurement Technology Conference (I2MTC), Dubrovnik, Croatia, 25–28 May 2020; pp. 1–6. [Google Scholar]
- Parvis, M.; Es Sebar, L.; Grassini, S.; Angelini, E. Monitoraggio dello stato di conservazione delle opere d’arte della Collezione Gori. Metall. Ital. 2020, 4, 73–77. [Google Scholar]
- Tamborrino, R.; Wendrich, W. Cultural heritage in context: The temples of Nubia, digital technologies and the future of conservation. J. Inst. Conserv. 2017, 40, 168–182. [Google Scholar] [CrossRef]
- Hassan, F.A. The Aswan high dam and the international rescue Nubia campaign. Afr. Archaeol. Rev. 2007, 24, 73–94. [Google Scholar] [CrossRef]
- Desroches Noblecourt, C.; Donadoni, S.; Al-Din Moukhtar, J.; El-Achiery, H.; Aly, M.; Dewachter, M. Le Speos d’El-Lessiya I-II, Collection Scientifique; Centre de Documentation et d’Études sur l’Ancienne Égypte: Le Caire, Egypt, 1968; pp. 62–63. [Google Scholar]
- Curto, S. Il Tempio di Ellesija.Museo Egizio di Torino: Quaderno 6; Museo egizio di Torino: Turin, Italy, 1970. [Google Scholar]
- Curto, S. Lo Speos di Ellesija: Un Tempio della Nubia Salvato dalle Acque del Lago Nasser; Scala: Firenze, Italy, 2010. [Google Scholar]
- Farella, E.; Morelli, L.; Grilli, E.; Rigon, S.; Remondino, F. Handling critical aspects in massive photogrammetric digitization of museum assets. Int. Arch. Photogramm. Remote Sens. Spat. Inf. Sci. 2022, 46, 215–222. [Google Scholar] [CrossRef]
- Es Sebar, L.; Grassini, S.; Parvis, M.; Lombardo, L. A low-cost automatic acquisition system for photogrammetry. In Proceedings of the 2021 IEEE International Instrumentation and Measurement Technology Conference (I2MTC), Glasgow, UK, 17–20 May 2021; pp. 1–6. [Google Scholar]
- Es Sebar, L.; Lombardo, L.; Parvis, M.; Angelini, E.; Re, A.; Grassini, S. A metrological approach for multispectral photogrammetry. ACTA IMEKO 2021, 10, 111–116. [Google Scholar] [CrossRef]
- Zakrzewski, S.; Shortland, A.; Rowland, J. Science in the Study of Ancient Egypt; Routledge: New York, NY, USA; London, UK, 2015. [Google Scholar]
- Dyer, J.; Verri, G.; Cupitt, J. Multispectral Imaging in Reflectance and Photo-Induced Luminscence Modes: A User Manual; The British Museum: London, UK, 2013. [Google Scholar]
- Rahrig, M.; Herrero Cortell, M.Á.; Lerma, J.L. Multiband Photogrammetry and Hybrid Image Analysis for the Investigation of a Wall Painting by Paolo de San Leocadio and Francesco Pagano in the Cathedral of Valencia. Sensors 2023, 23, 2301. [Google Scholar] [CrossRef] [PubMed]
- Agisoft. Metashape, Photogrammetry Reconstruction Software. Available online: https://www.agisoft.com/ (accessed on 3 May 2024).
- Blender Online Community Blender—A 3D Modelling and Rendering Package. 2018. Available online: http://www.blender.org/ (accessed on 3 May 2024).
- Ariadne, The Visual Media Service Provides Easy Publication and Presentation on the web. Available online: https://visual.ariadne-infrastructure.eu/ (accessed on 3 May 2024).
- CloudCompare, 3D Point Cloud and Mesh Processing Software, Open Source Project. Available online: https://www.danielgm.net/cc/ (accessed on 3 May 2024).
- Porter, S.T.; Huber, N.; Hoyer, C.; Floss, H. Portable and low-cost solutions to the imaging of Paleolithic art objects: A comparison of photogrammetry and reflectance transformation imaging. J. Archaeol. Sci. Rep. 2016, 10, 859–863. [Google Scholar] [CrossRef]
- Croci, S.; Es Sebar, L.; Lombardo, L.; Di Iorio, F.; Buscaglia, P.; Taverni, F.; Aicardi, S.; Grassini, S. Dimensional accuracy assessment of 3D models based on photogrammetry and 3D scanner: A case study from the Museo Egizio of Turin. In Proceedings of the 2024 IEEE International Instrumentation and Measurement Technology Conference (I2MTC), Glasgow, UK, 20–23 May 2024. [Google Scholar]
- Ruiz, R.M.; Torres, M.T.M.; Allegue, P.S. Comparative analysis between the main 3d scanning techniques: Photogrammetry, terrestrial laser scanner, and structured light scanner in religious imagery: The case of the holy christ of the blood. ACM J. Comput. Cult. Herit. (JOCCH) 2021, 15, 18. [Google Scholar] [CrossRef]
- Gebler, O.F.; Goudswaard, M.; Hicks, B.; Jones, D.; Nassehi, A.; Snider, C.; Yon, J. A comparison of structured light scanning and photogrammetry for the digitisation of physical prototypes. Proc. Des. Soc. 2021, 1, 11–20. [Google Scholar] [CrossRef]
- Min, J.; Ahn, J.; Ahn, S.; Choi, H.; Ahn, S. Digital imaging methods for painting analysis: The application of RTI and 3D scanning to the study of brushstrokes and paintings. Multimed. Tools Appl. 2020, 79, 25427–25439. [Google Scholar] [CrossRef]


Disclaimer/Publisher’s Note: The statements, opinions and data contained in all publications are solely those of the individual author(s) and contributor(s) and not of MDPI and/or the editor(s). MDPI and/or the editor(s) disclaim responsibility for any injury to people or property resulting from any ideas, methods, instructions or products referred to in the content. |
© 2024 by the authors. Licensee MDPI, Basel, Switzerland. This article is an open access article distributed under the terms and conditions of the Creative Commons Attribution (CC BY) license (https://creativecommons.org/licenses/by/4.0/).