
The Fault Diagnosis of a Plunger Pump Based on the SMOTE + Tomek Link and Dual-Channel Feature Fusion

Abstract
1. Introduction
- (1)
- Most of the existing research on intelligent fault diagnosis methods for plunger pumps is based on the premise of balanced data. When the proportion of fault samples is much smaller than that of healthy samples or the size of different types of samples is greatly different, the accuracy and stability of the diagnostic model will be significantly reduced.
- (2)
- (3)
2. Method Principles
2.1. Convolutional Neural Network
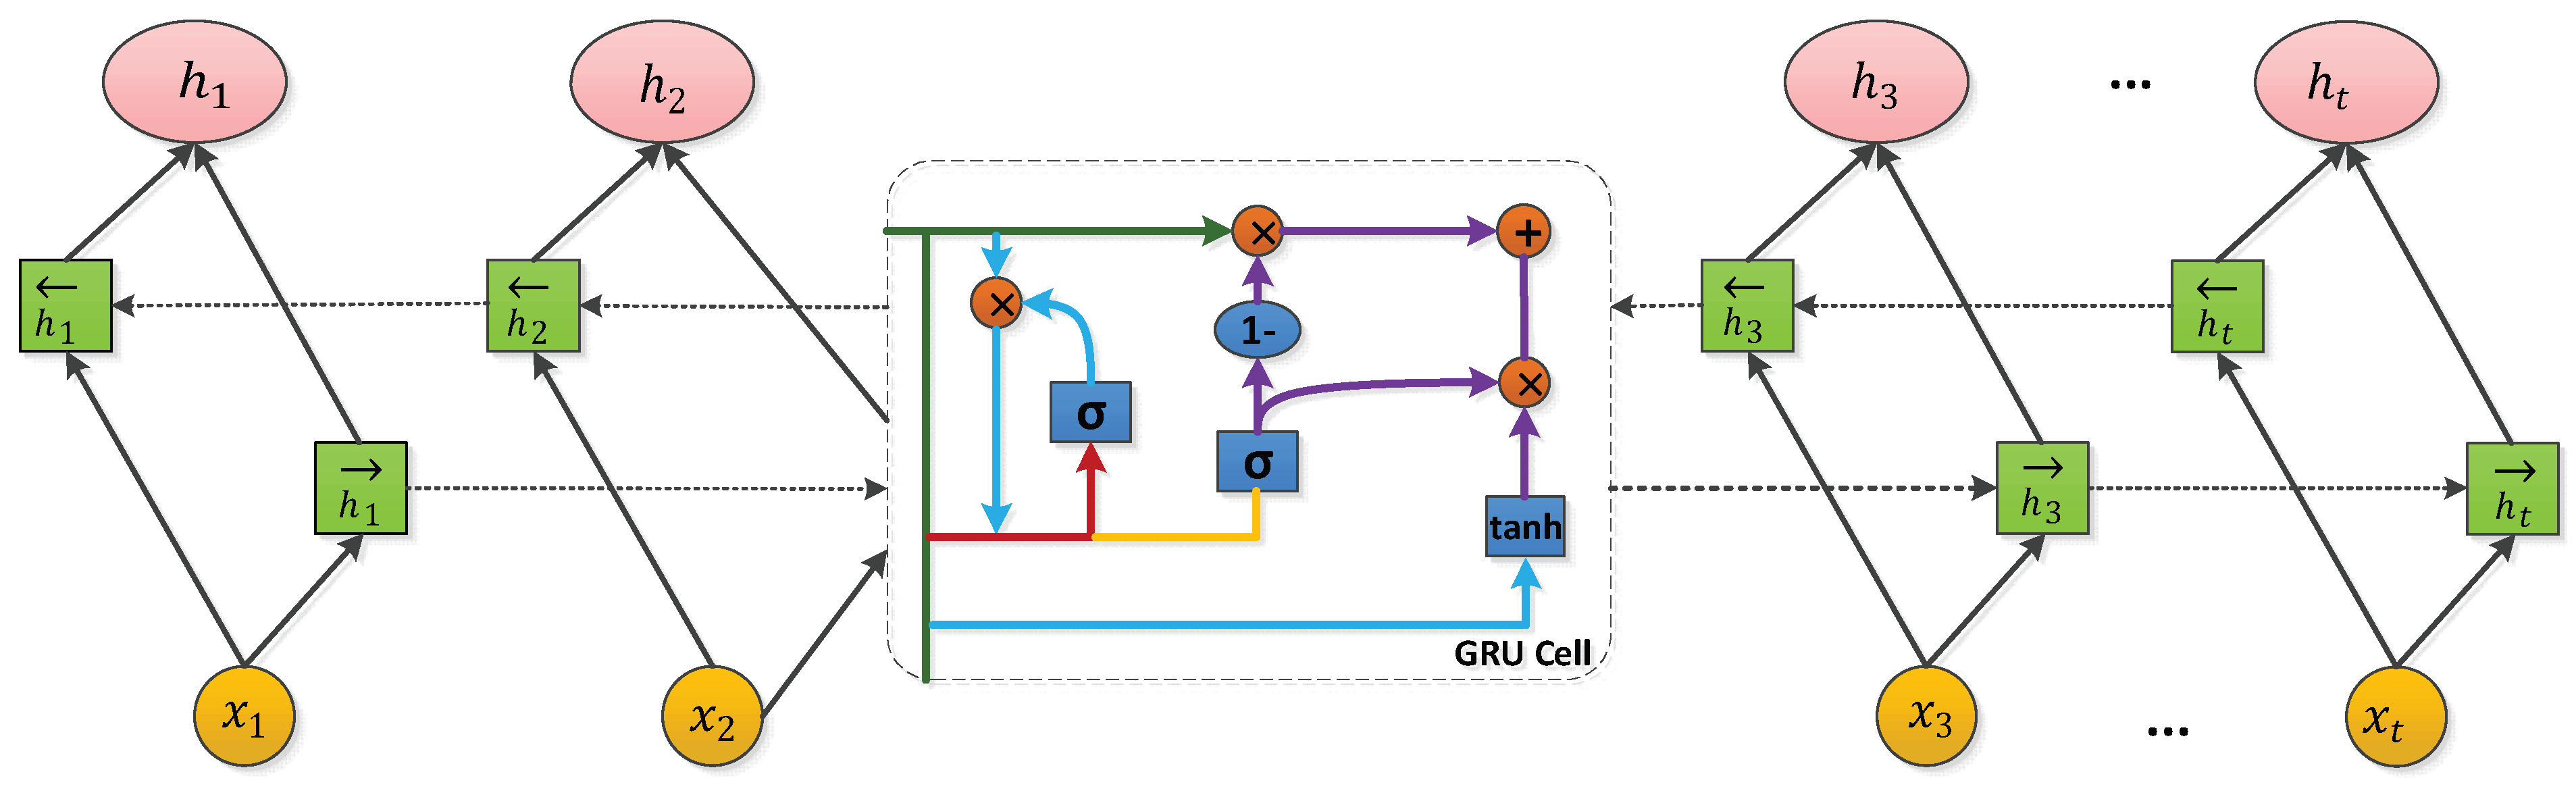
2.2. Bidirectional Gated Recursive Unit
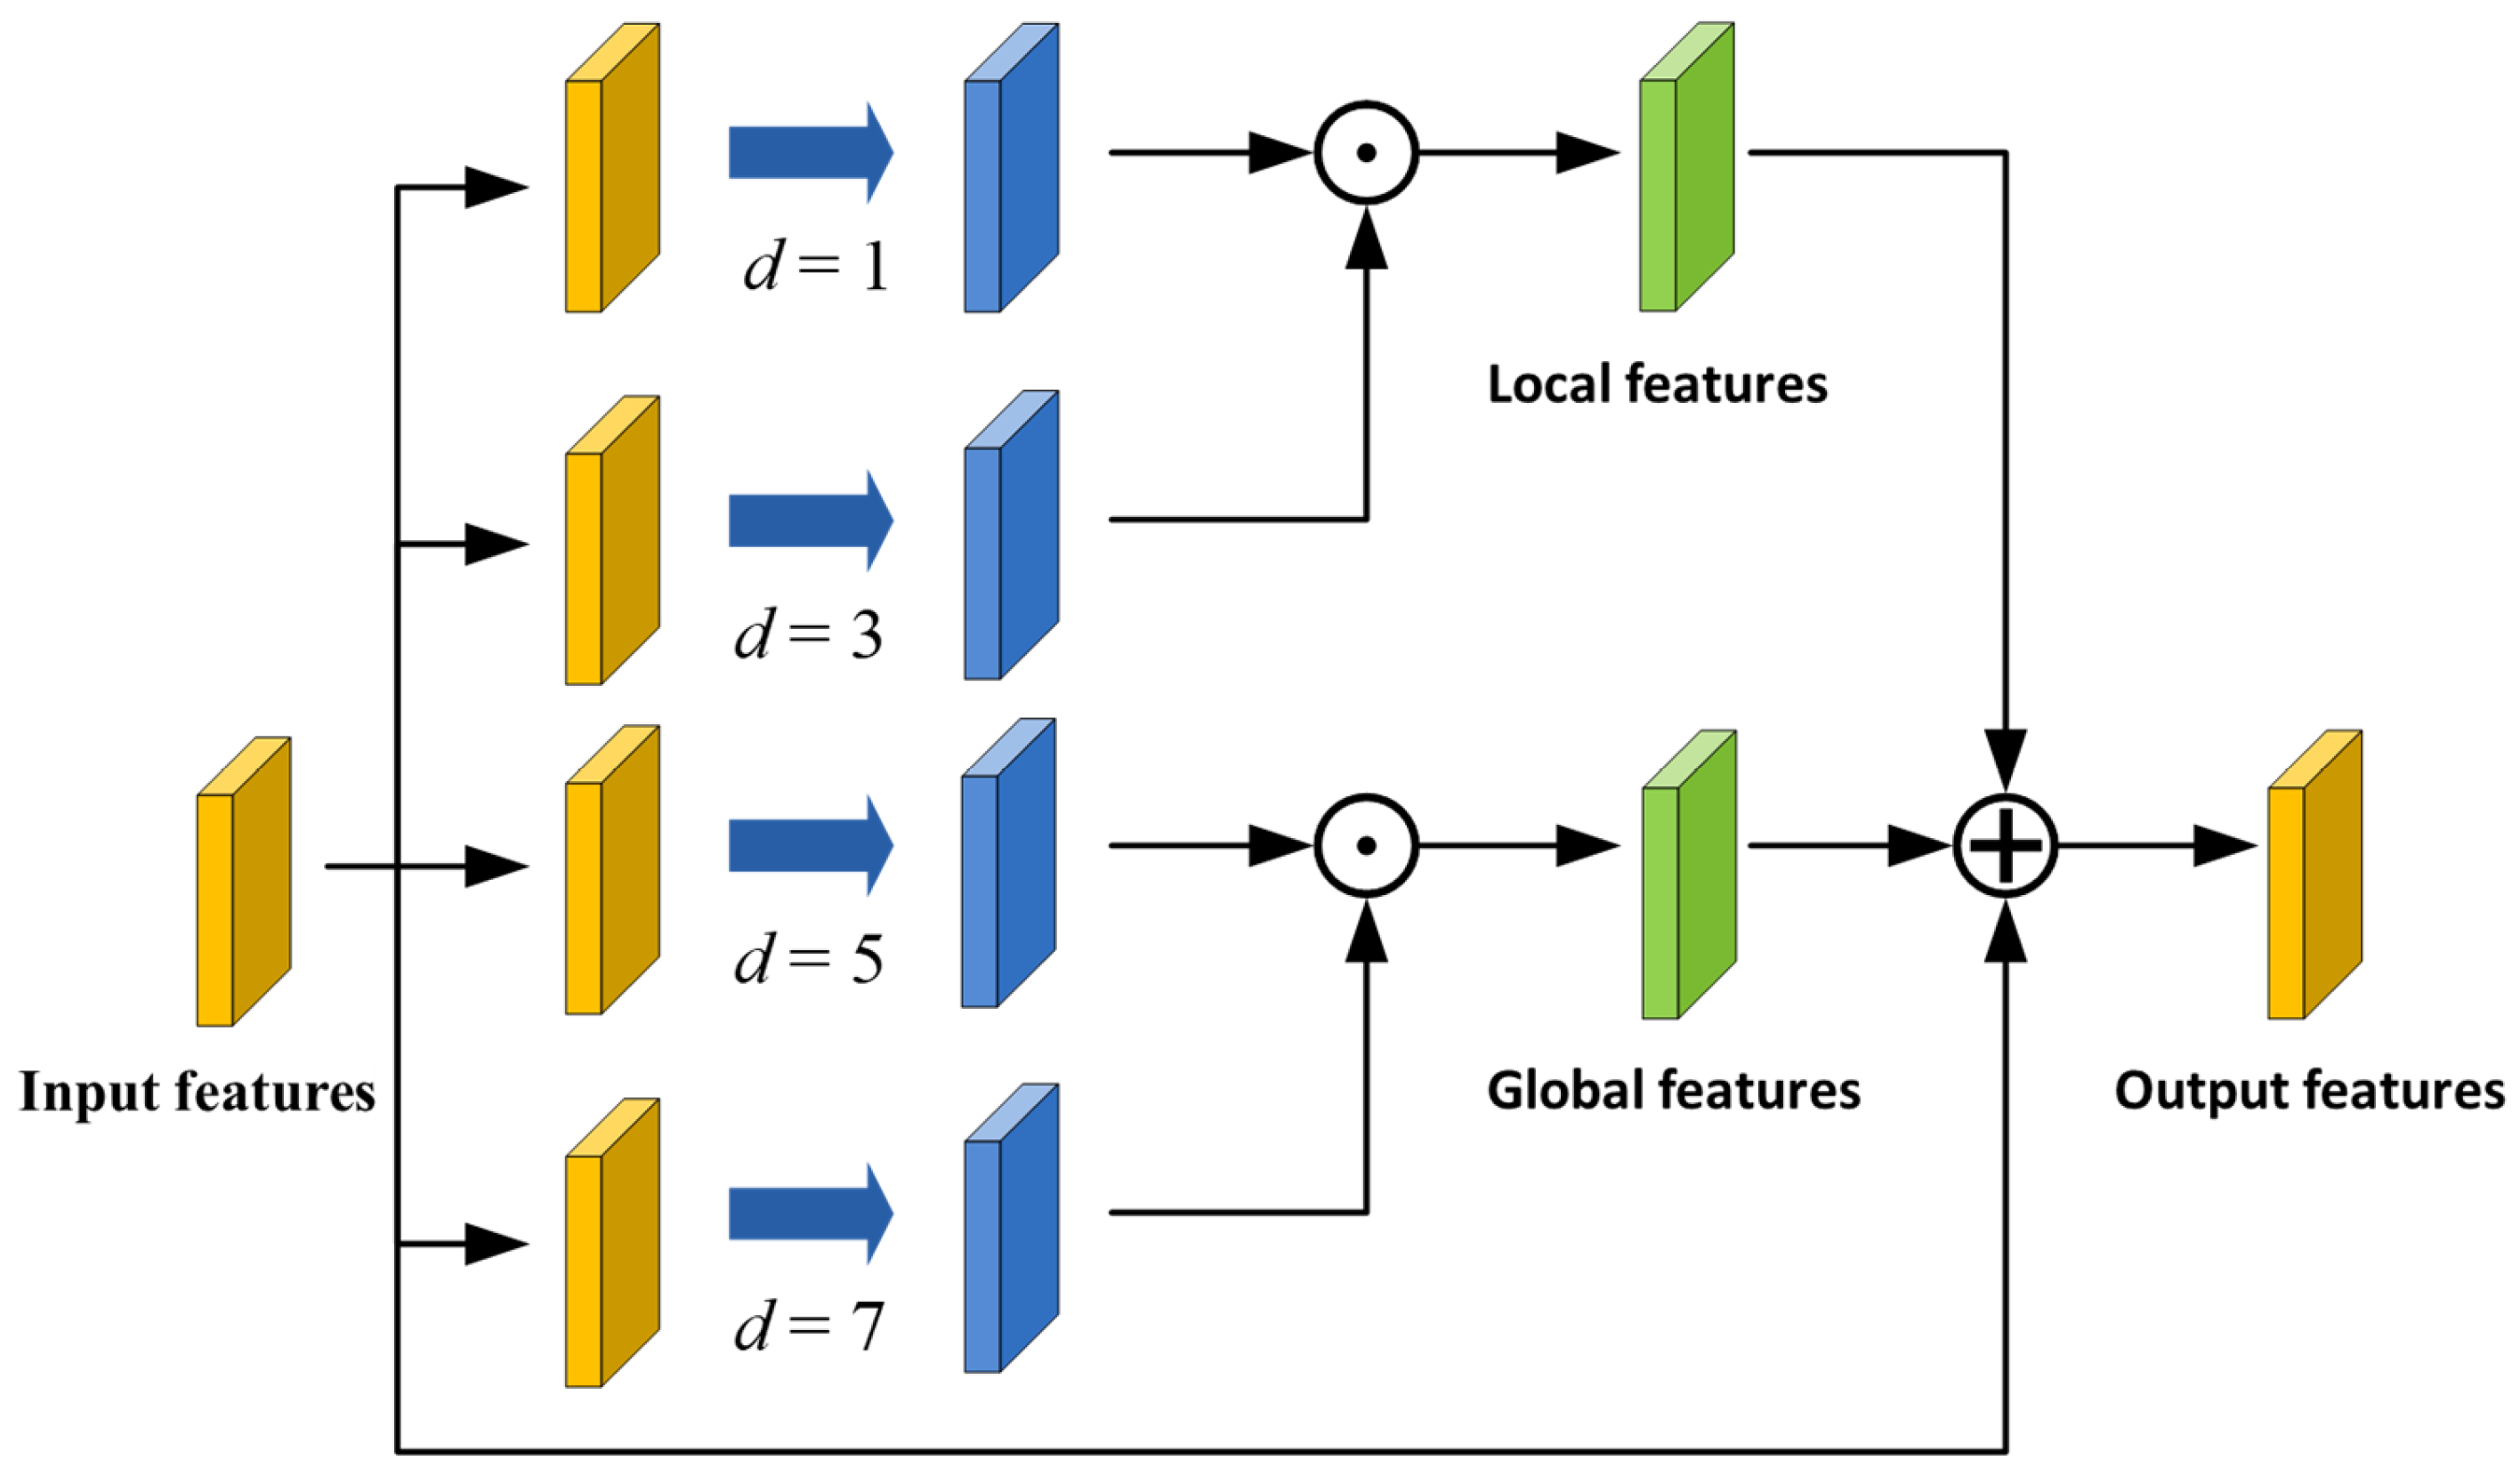
2.3. Global–Local Feature Complementary Module
3. Unbalanced Data Processing Method Based on Oversampling and Undersampling
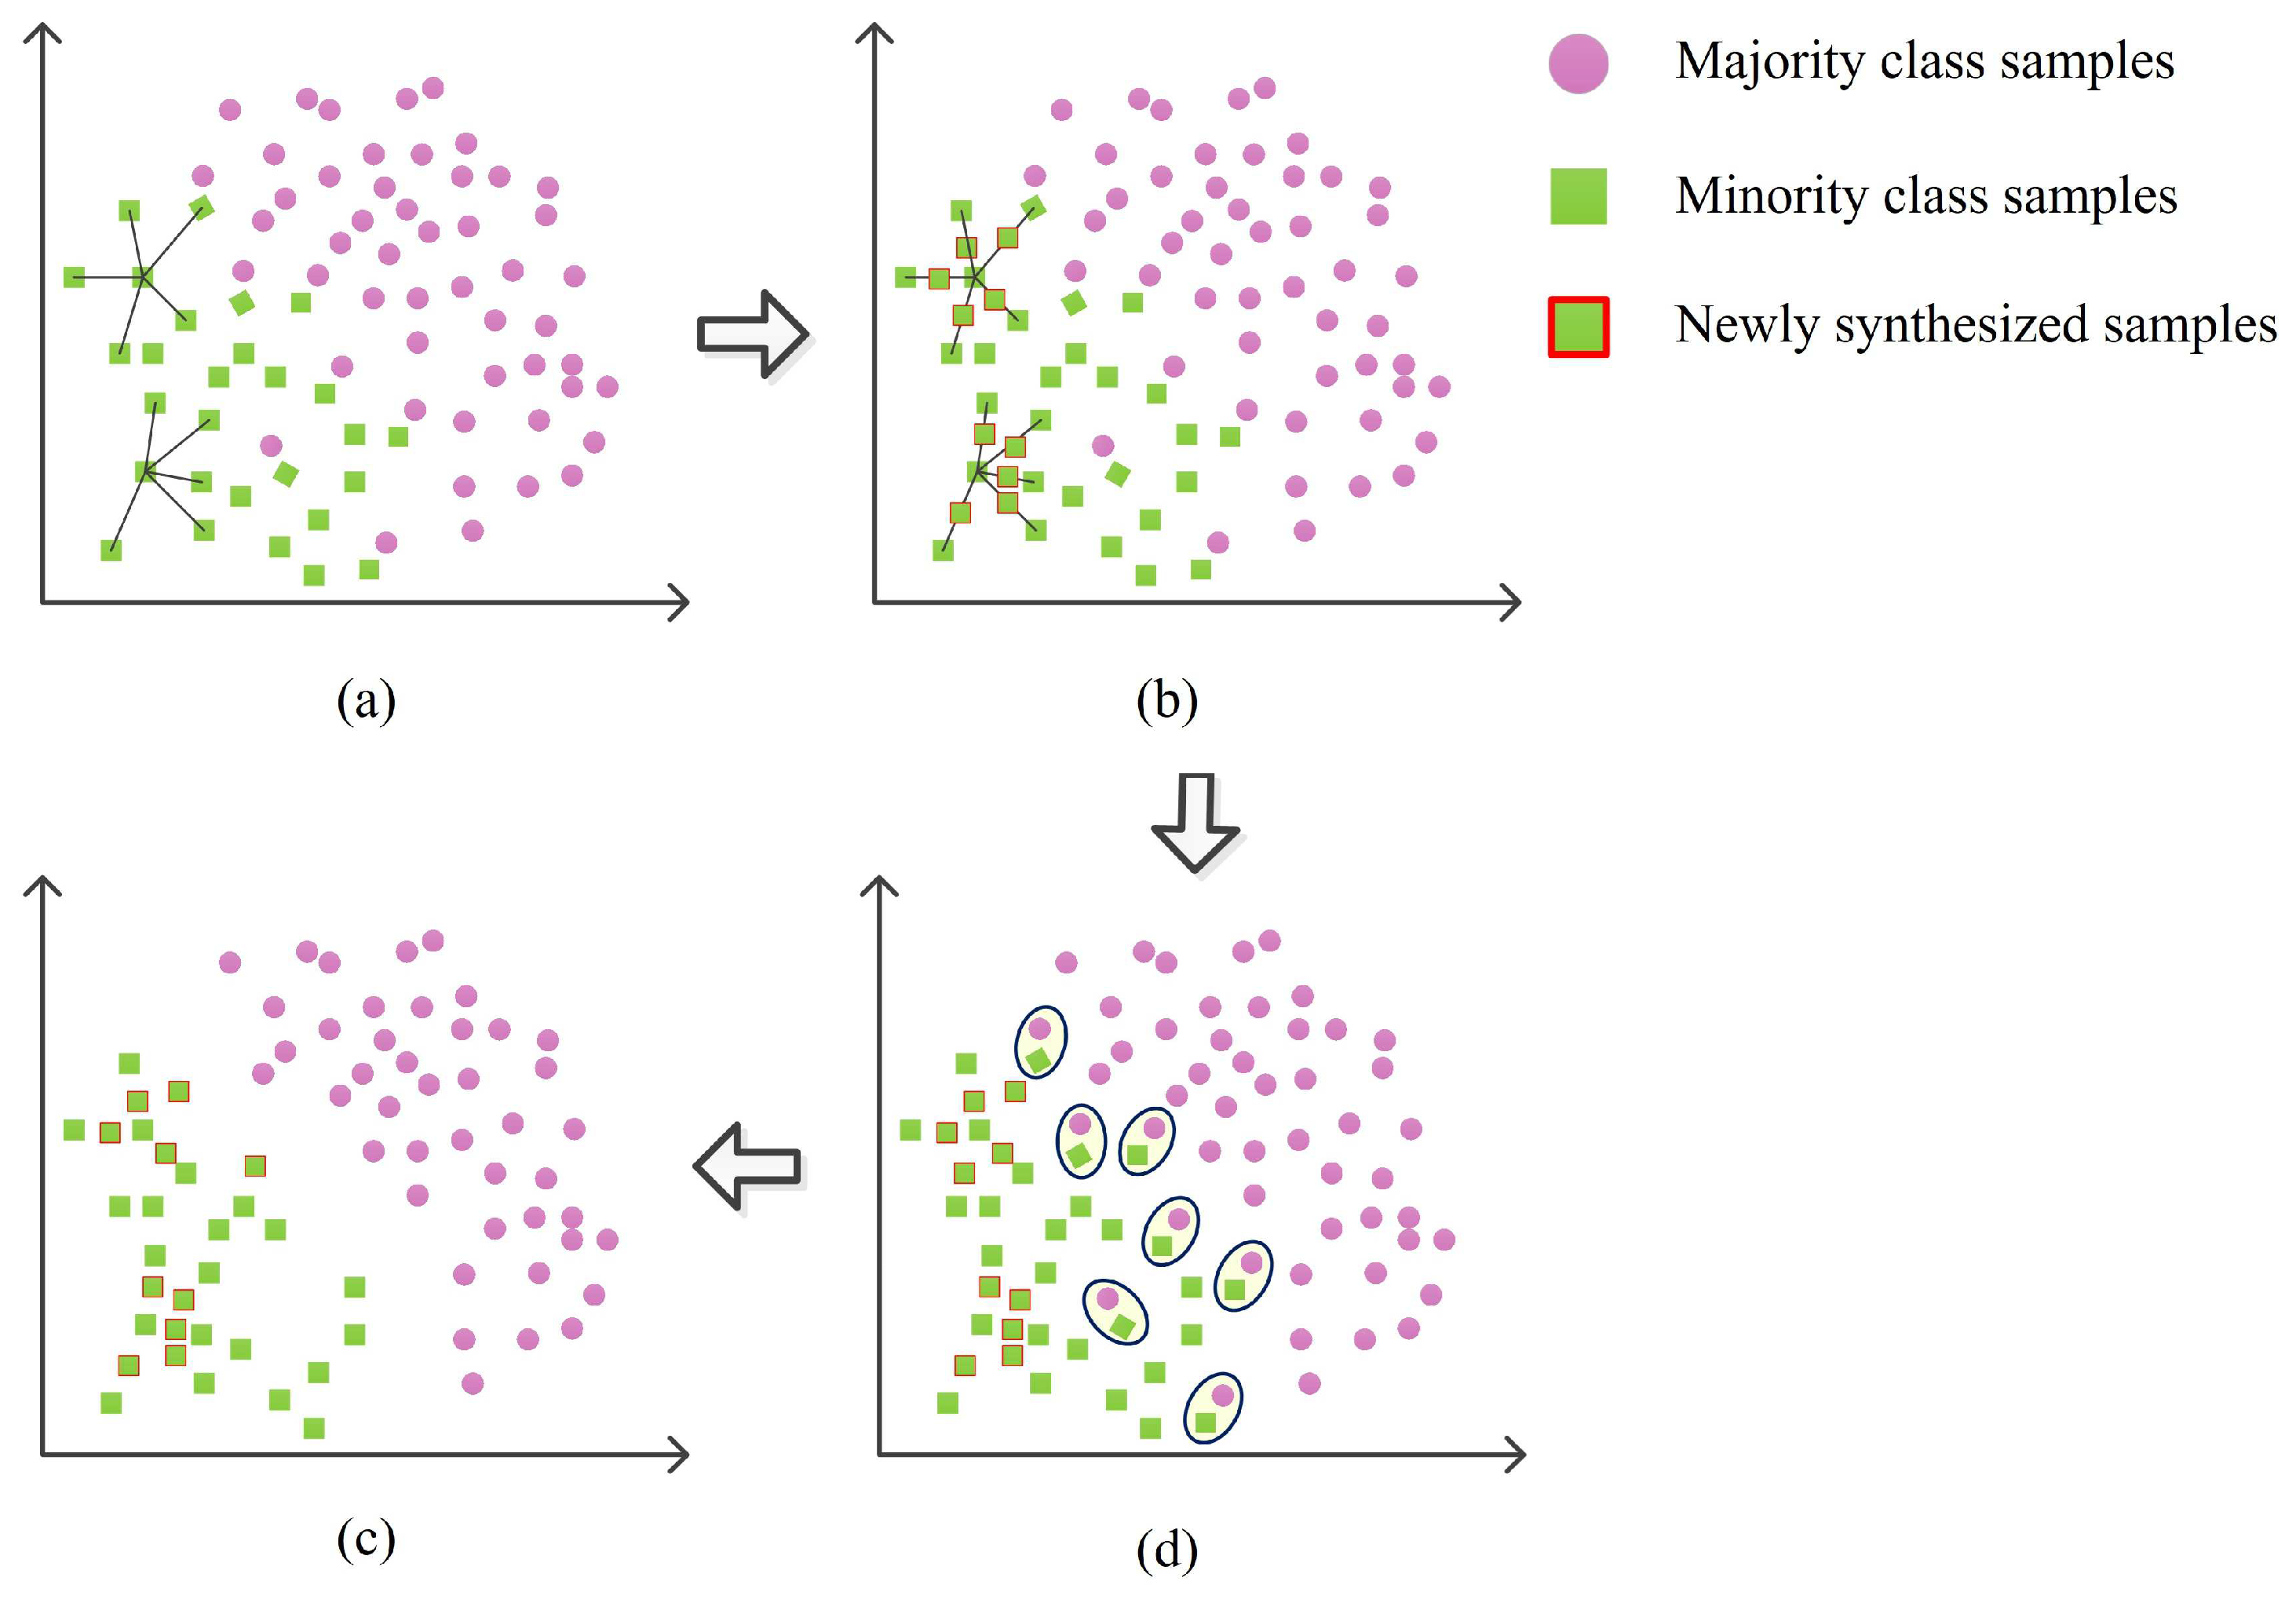
- (1)
- Randomly select a sample from a minority class and determine k as the number of nearest neighbor samples. If there is no certainty, then k = 5.
- (2)
- Select a neighbor of the sample, generate a new composite sample by interpolation, and then add it to a few categories.
- (3)
- Repeat step (2) until enough synthetic samples are generated.
- (4)
- The Tomek link algorithm is used to detect the distance between two samples to calculate whether they belong to the same category.
- (5)
- If there is no other sample of the same class between two samples of different classes, then there is a Tomek link between the two samples. Delete the Tomek link pair.
- (6)
- Combine the generated synthetic sample with the original sample retained to obtain a new balanced dataset.
4. CNN-BiGRU-Attention Unbalanced Classifier for the Fault Diagnosis of a Plunger Pump
4.1. Feature Extraction Layer
4.2. Feature Fusion Layer
4.3. Fault Classification Layer
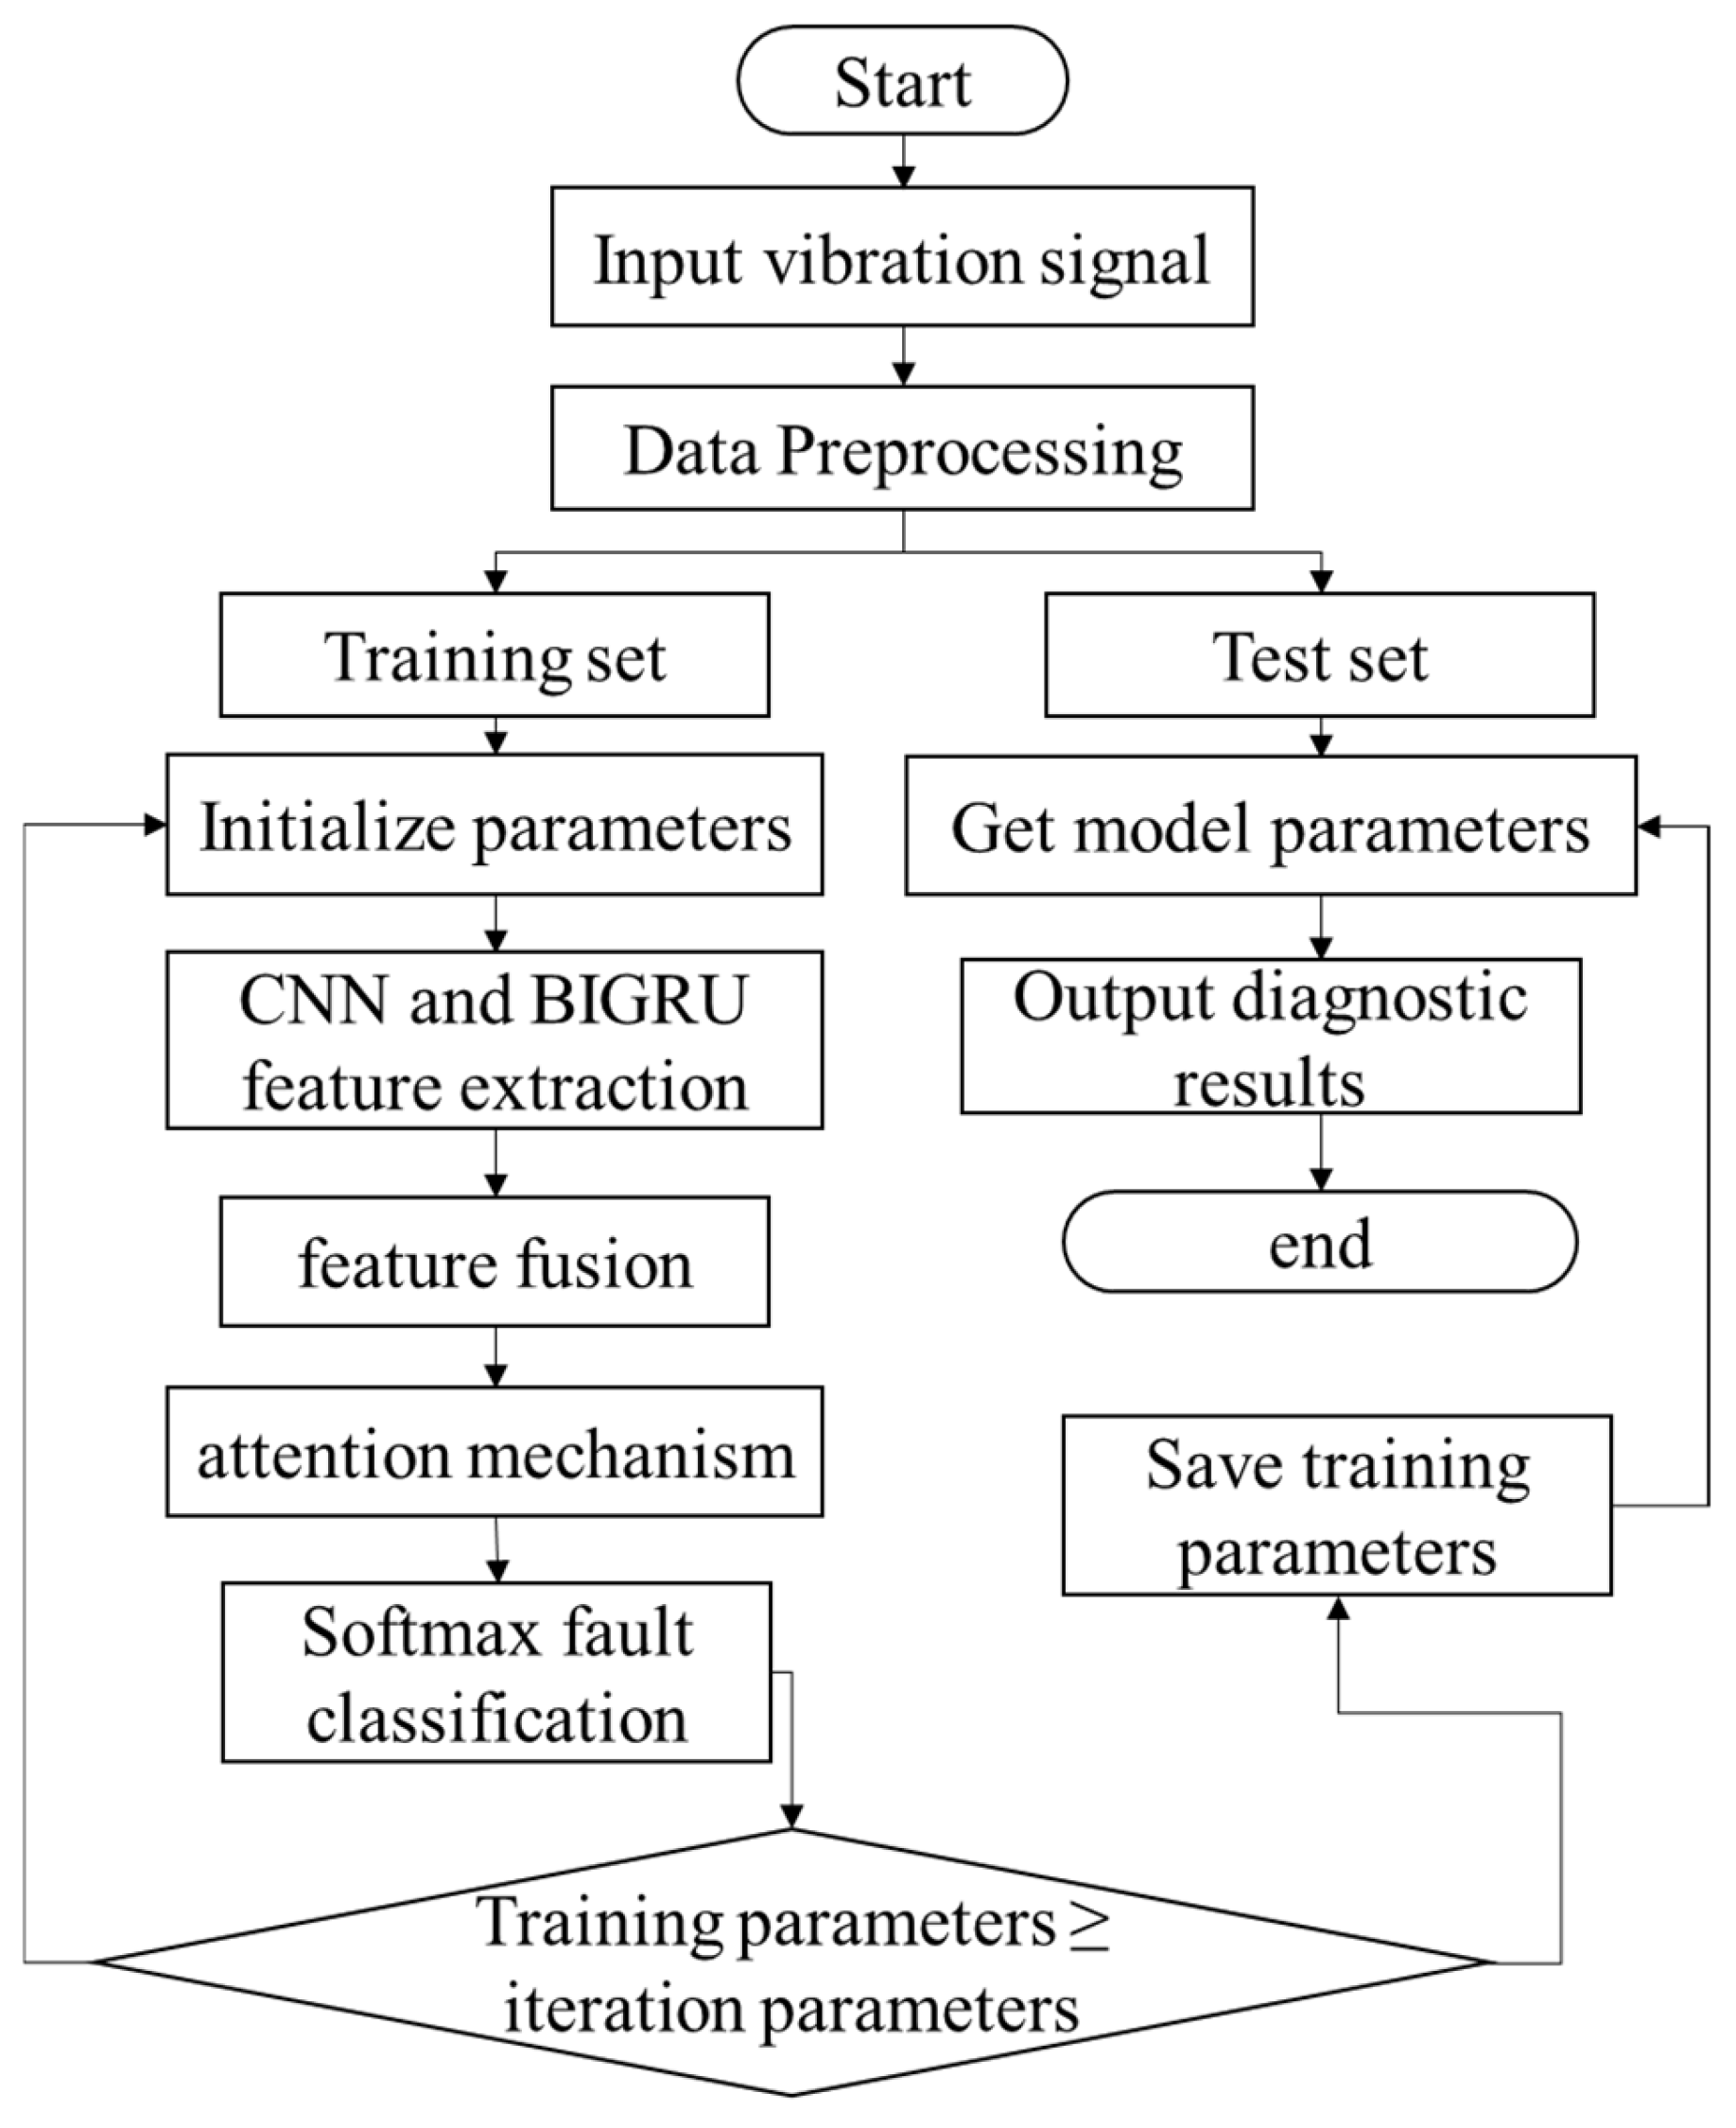
4.4. Model Training
- (1)
- Obtain the original vibration data of the plunger pump and randomly divide the data samples into a training set and a test set according to a 7:3 ratio.
- (2)
- Initialize the CNN and BiGRU weights and bias items and input the data of the training set into the CNN and the BiGRU in batches at the same time for fault feature learning.
- (3)
- A CNN and BiGRU were used to extract the spatial and temporal characteristics of vibration data and then feature fusion was carried out, and the fused features were input into the attention layer and, finally, into the softmax layer.
- (4)
- Use softmax to classify the faults of the plunger pump and fine-tune the model parameters according to the changes in loss value and accuracy.
- (5)
- Input the test set into the trained model and output the diagnostic results.
5. Experiment and Analysis
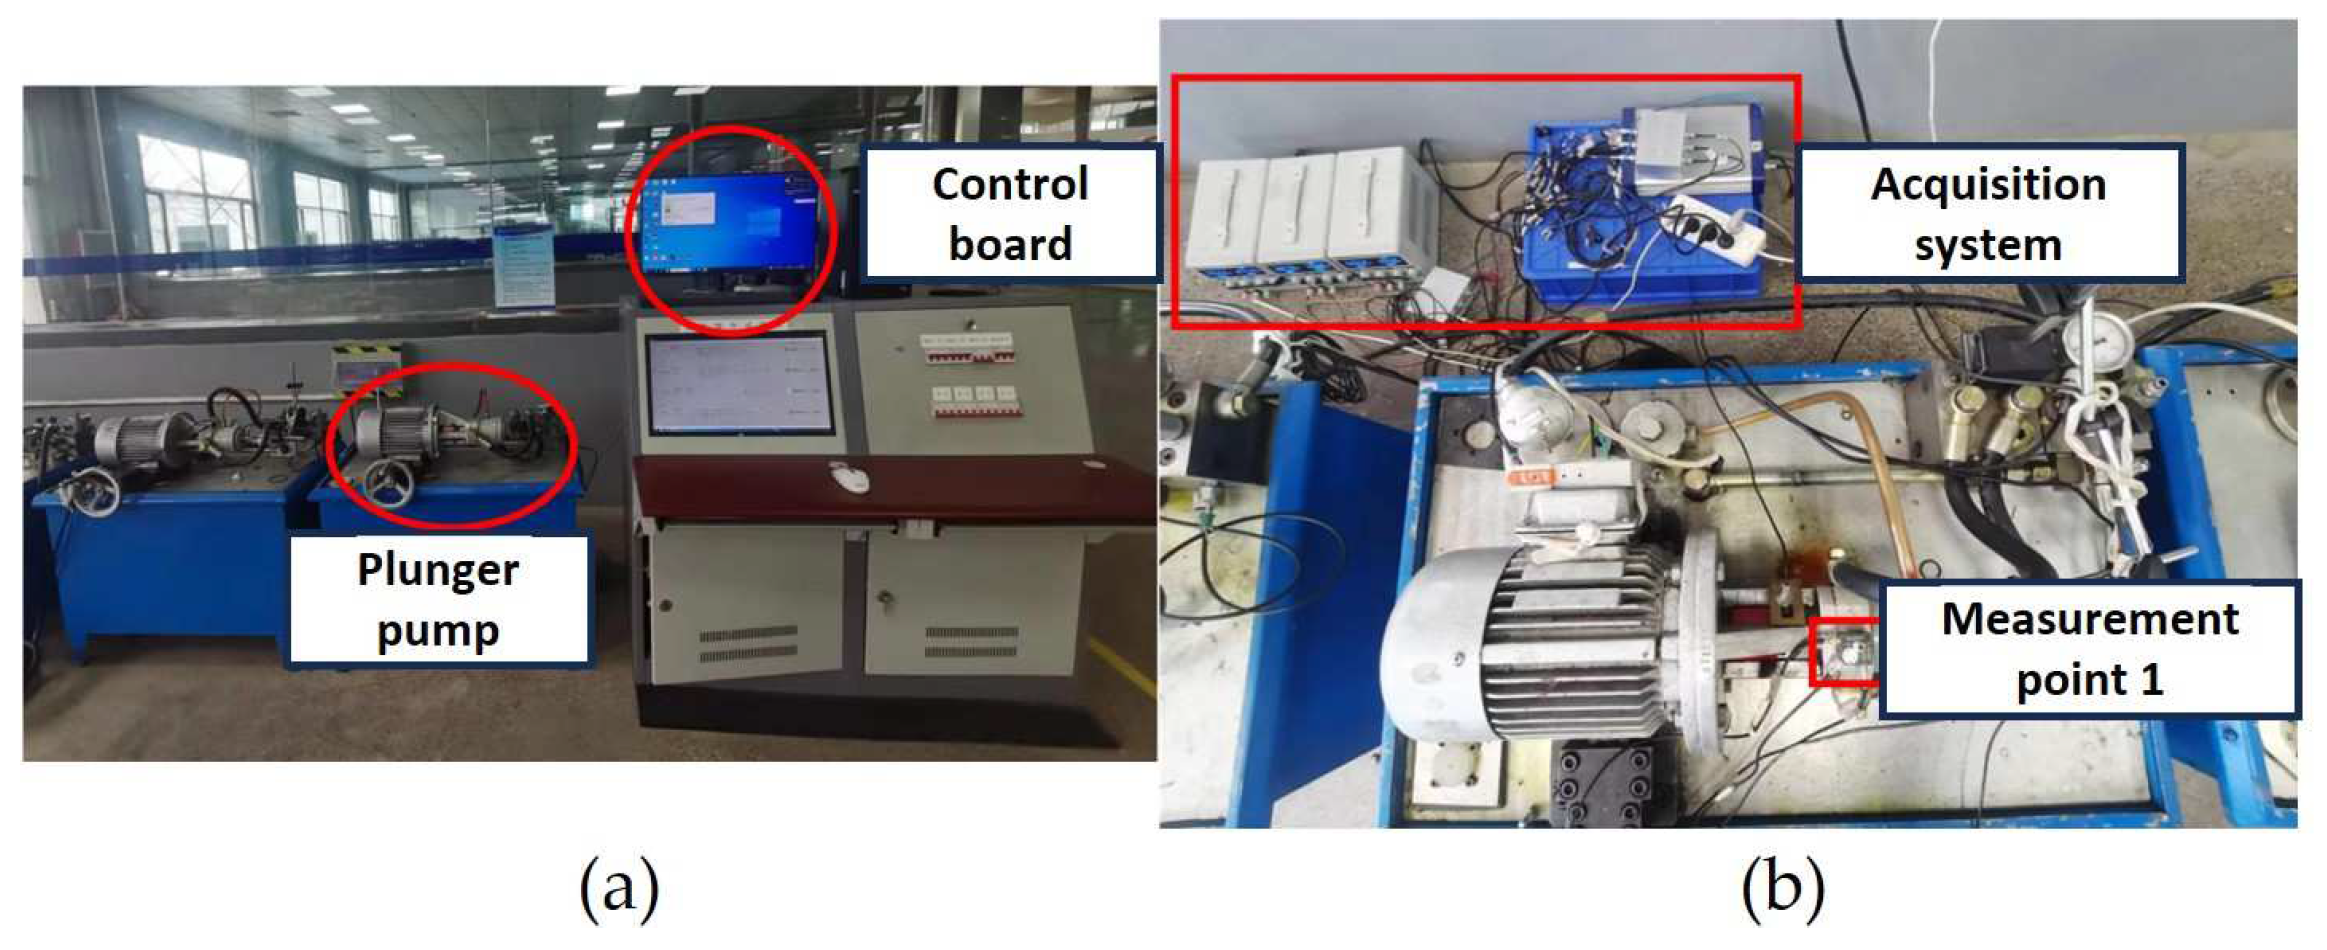
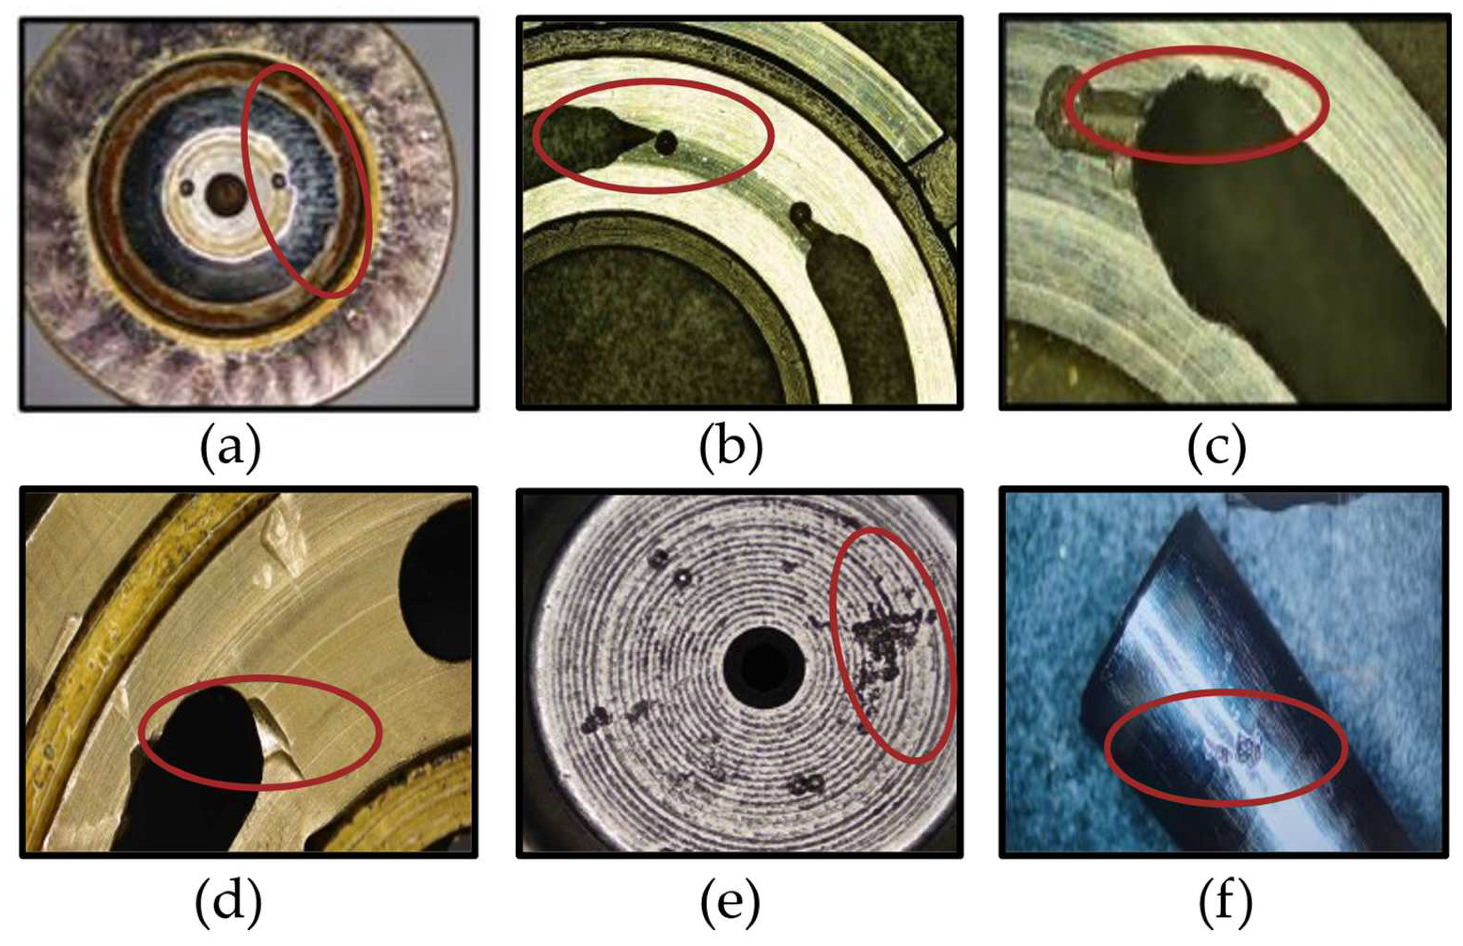
5.1. Experimental Platform and Dataset
5.2. Performance Analysis of an Unbalanced Dataset in the Dual-Channel Feature Fusion Model
5.2.1. Reconstruction of Unbalanced Datasets
5.2.2. Experimental Results
5.3. SMOTE + Tomek Link Mixed Sampling Performance Analysis
5.3.1. Resampling Data
5.3.2. Evaluation Indicators
- (1)
- Precision
- (2)
- Recall
- (3)
- F1-score
- (4)
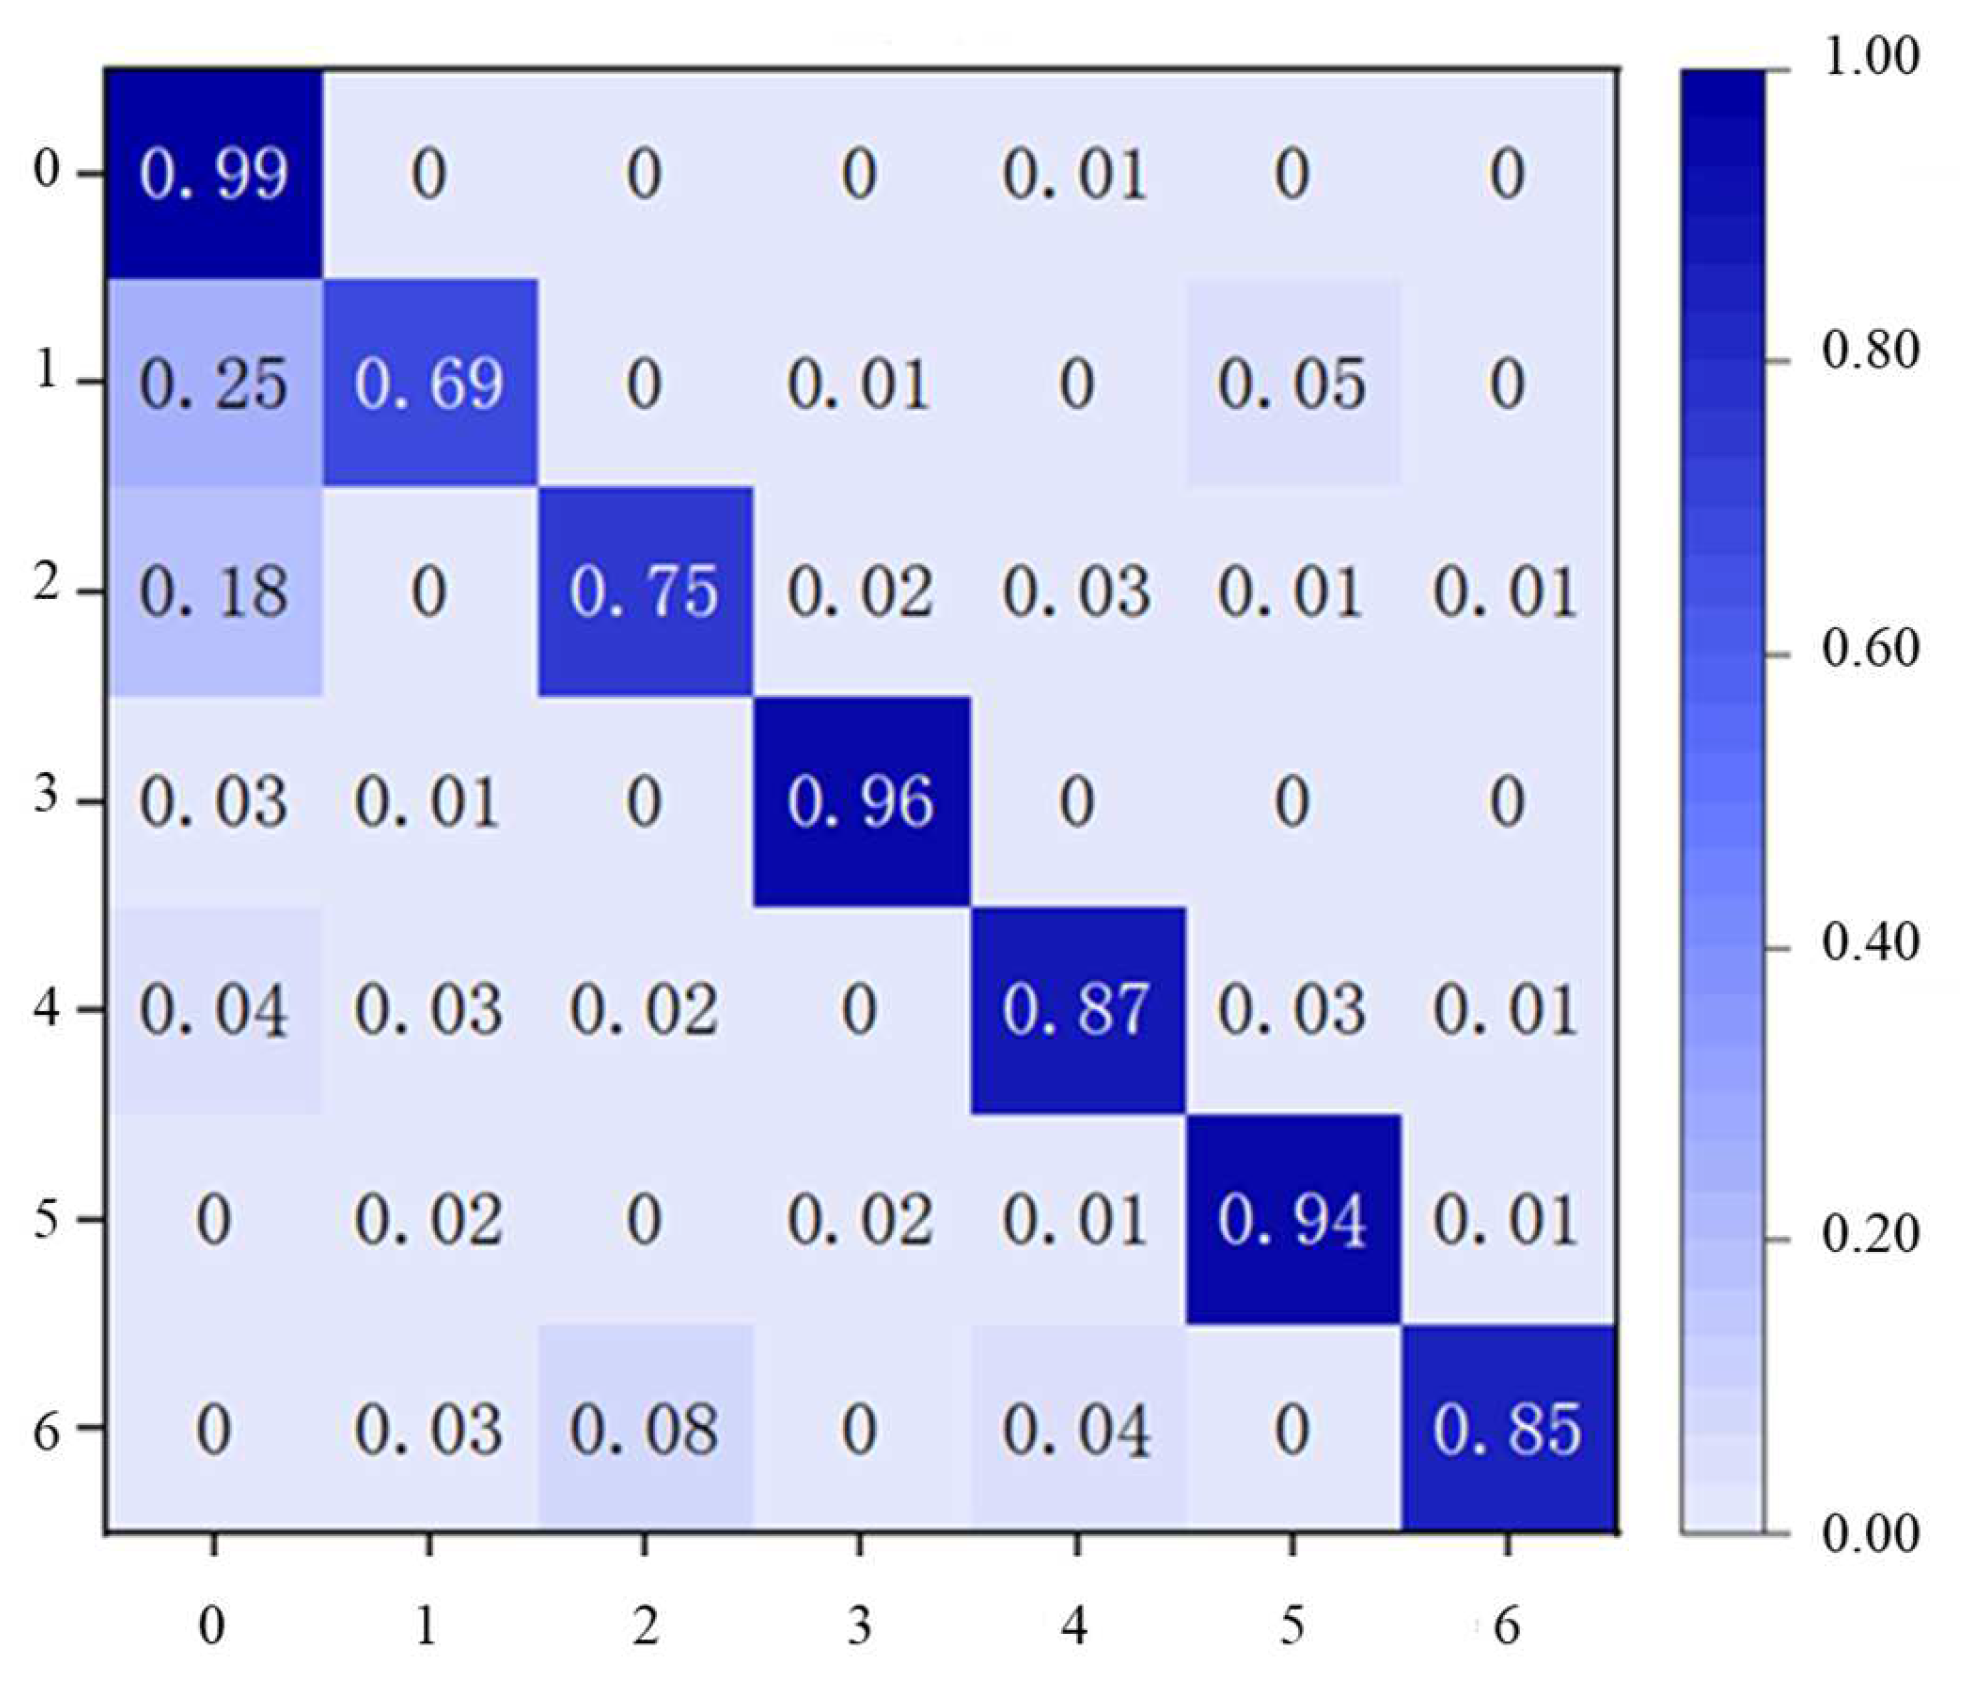
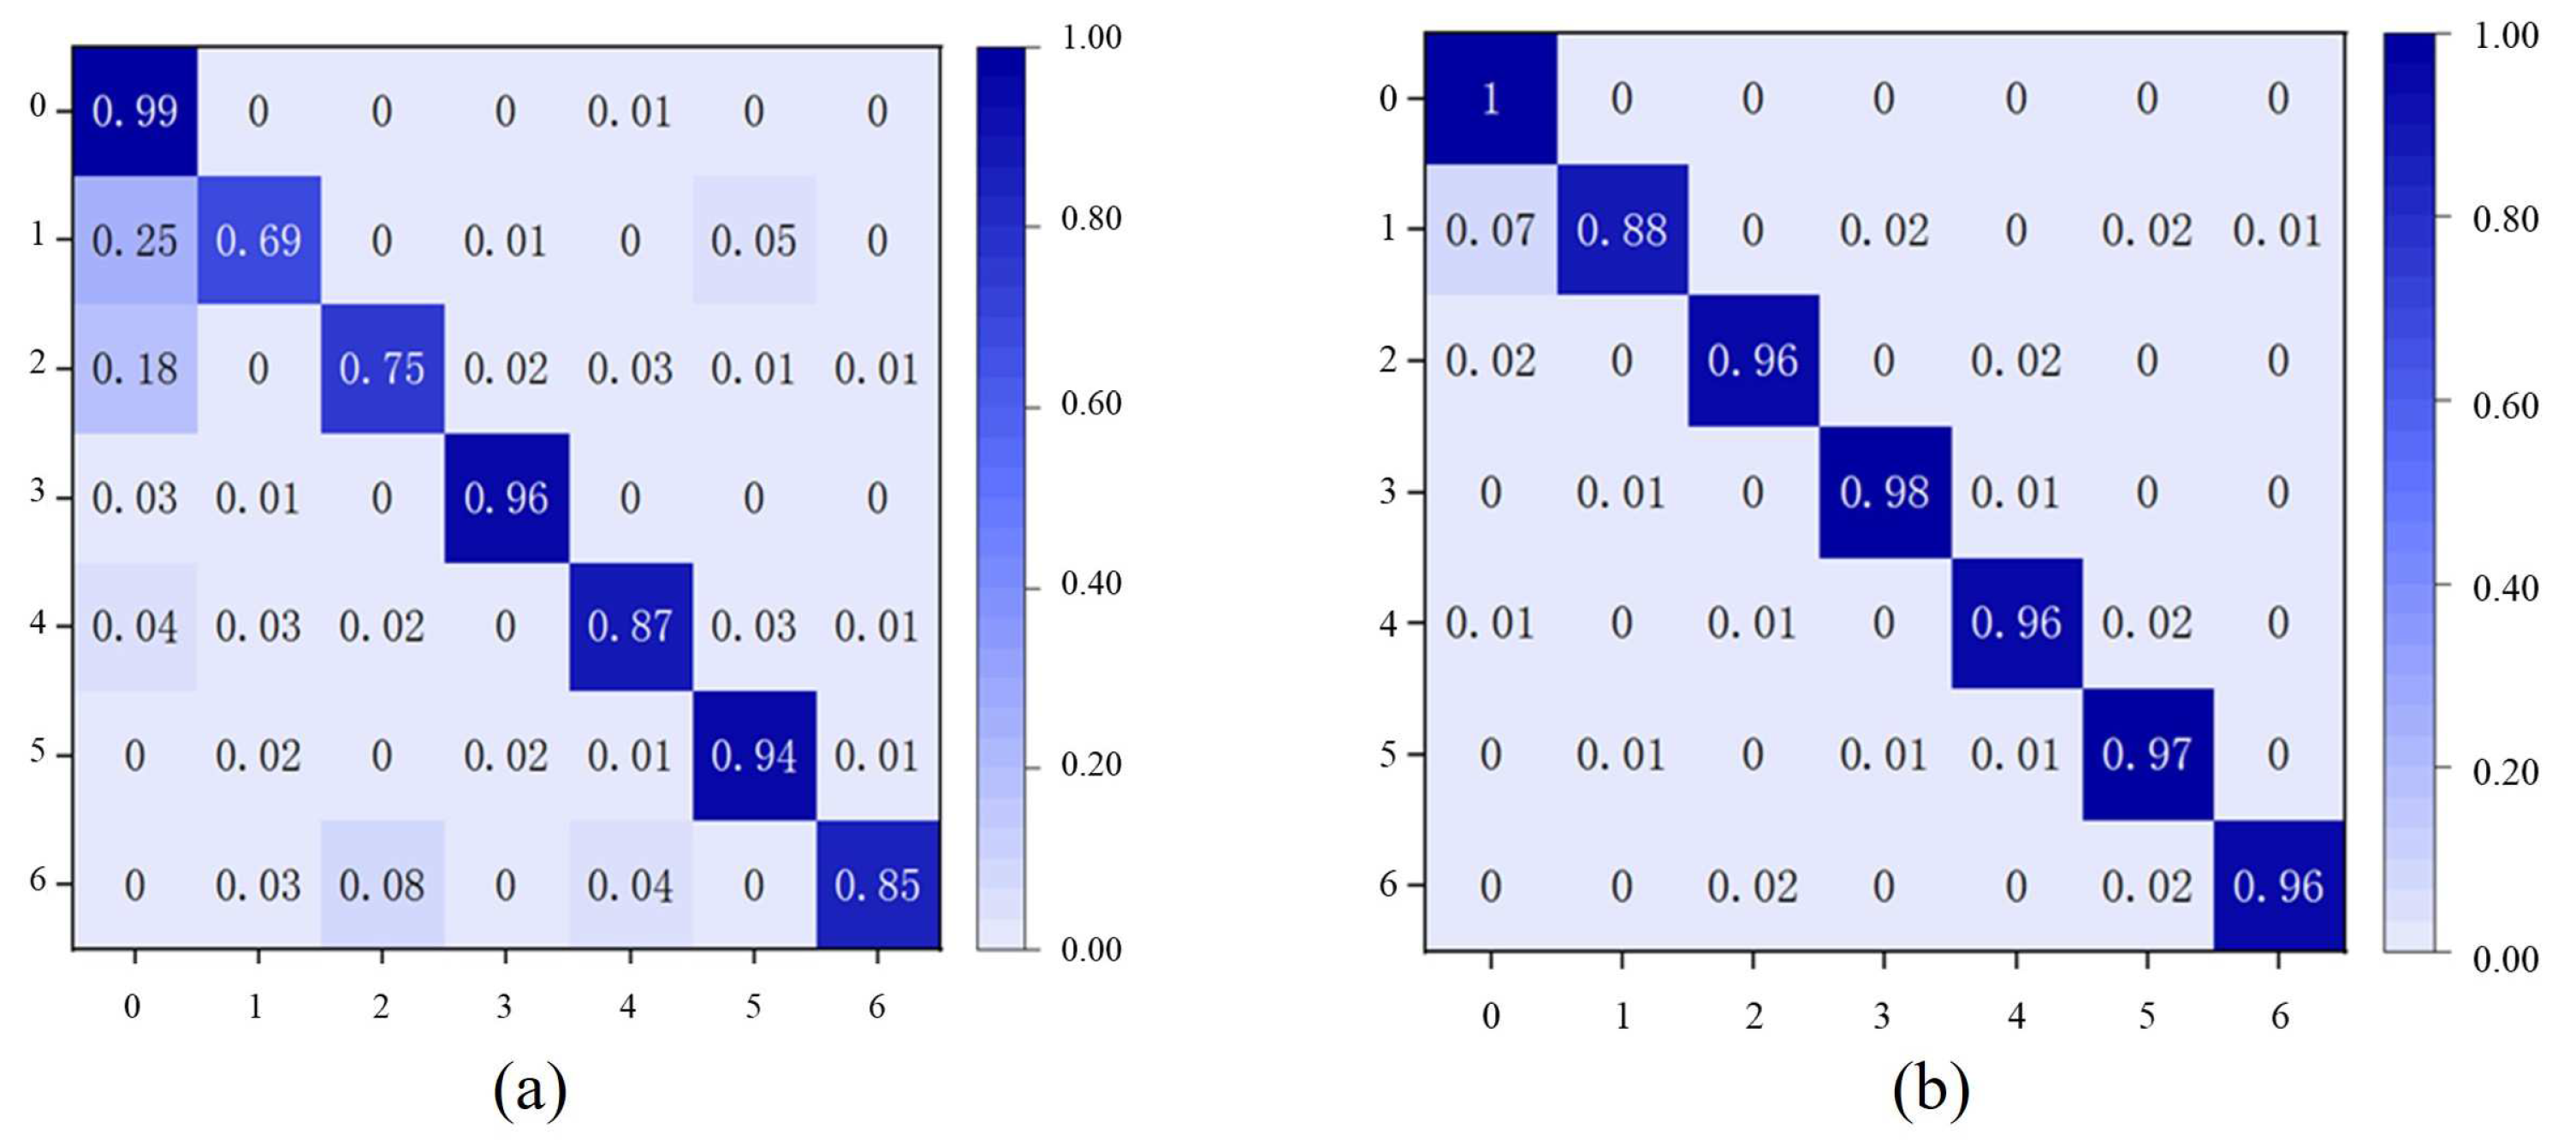
- Confusion matrix
5.3.3. Comparative Experiment of Different Mixed Sampling Methods
5.4. Comparative Analysis of Different Datasets in Different Models
5.4.1. Different Evaluation Index Results of an Unbalanced Dataset and a Balanced Dataset on the CBA Model
5.4.2. Classification Performance of Imbalanced and Balanced Datasets on CBA Models
5.4.3. The Classification Performance of Balanced Datasets on Different Models
6. Conclusions
Author Contributions
Funding
Institutional Review Board Statement
Informed Consent Statement
Data Availability Statement
Conflicts of Interest
References
- Jeyalakshmi, K. Weighted synthetic minority over-sampling technique (WSMOTE) algorithm and ensemble classifier for hepatocellular carcinoma (HCC) in liver disease system. Turk. J. Comput. Math. Educ. (TURCOMAT) 2021, 12, 7473–7487. [Google Scholar]
- Lin, W.C.; Tsai, C.F.; Hu, Y.H.; Jhang, J.S. Clustering-based undersampling in class-imbalanced data. Inf. Sci. 2017, 409, 17–26. [Google Scholar] [CrossRef]
- Duan, F.; Zhang, S.; Yan, Y.; Cai, Z. An oversampling method of unbalanced data for mechanical fault diagnosis based on MeanRadius-SMOTE. Sensors 2022, 22, 5166. [Google Scholar] [CrossRef] [PubMed]
- Xu, Y.; Zhao, Y.; Ke, W.; He, Y.L.; Zhu, Q.X.; Zhang, Y.; Cheng, X. A multi-fault diagnosis method based on improved SMOTE for class-imbalanced data. Can. J. Chem. Eng. 2023, 101, 1986–2001. [Google Scholar] [CrossRef]
- Rao, S.; Zou, G.; Yang, S.; Khan, S.A. Fault diagnosis of power transformers using ANN and SMOTE algorithm. Int. J. Appl. Electromagn. Mech. 2022, 70, 345–355. [Google Scholar] [CrossRef]
- Yang, K.; Yu, Z.; Wen, X.; Cao, W.; Chen, C.P.; Wong, H.S.; You, J. Hybrid classifier ensemble for imbalanced data. IEEE Trans. Neural Netw. Learn. Syst. 2019, 31, 1387–1400. [Google Scholar] [CrossRef] [PubMed]
- Bernardo, A.; Della Valle, E. Smote-ob: Combining Smote and Online Bagging for Continuous Rebalancing of Evolving Data Streams. In Proceedings of the 2021 IEEE International Conference on Big Data (Big Data), Orlando, FL, USA, 15–18 December 2021. [Google Scholar]
- Fernández, A.; Garcia, S.; Herrera, F.; Chawla, N.V. SMOTE for learning from imbalanced data: Progress and challenges, marking the 15-year anniversary. J. Artif. Intell. Res. 2018, 61, 863–905. [Google Scholar] [CrossRef]
- Torgo, L.; Ribeiro, R.P.; Pfahringer, B.; Branco, P. Smote for regression. In Progress in Artificial Intelligence: 16th Portuguese Conference on Artificial Intelligence, Angra do Heroísmo, Portugal, 9–12 September 2013; Springer: Berlin/Heidelberg, Germany, 2013. [Google Scholar]
- Blagus, R.; Lusa, L. SMOTE for high-dimensional class-imbalanced data. BMC Bioinform. 2013, 14, 106. [Google Scholar] [CrossRef] [PubMed]
- Chawla, N.V.; Bowyer, K.W.; Hall, L.O.; Kegelmeyer, W.P. SMOTE: Synthetic minority over-sampling technique. J. Artif. Intell. Res. 2002, 16, 321–357. [Google Scholar] [CrossRef]
- Liu, S.; Huang, J.; Ma, J.; Luo, J. Class-incremental continual learning model for plunger pump faults based on weight space meta-representation. Mech. Syst. Signal Process. 2023, 196, 110309. [Google Scholar] [CrossRef]
- Wei, X.; Chao, Q.; Tao, J. Fault diagnosis of high speed piston pump based on LSTM and CNN. Acta Aeronaut. Astronaut. Sin. 2021, 42, 435–445. [Google Scholar]
- Goodfellow, I.; Pouget-Abadie, J.; Mirza, M.; Xu, B.; Warde-Farley, D.; Ozair, S.; Courville, A.; Bengio, Y. Generative adversarial nets. In Proceedings of the Advances in Neural Information Processing Systems 27, Montreal, QC, Canada, 8–13 December 2014. [Google Scholar]
- Salimans, T.; Goodfellow, I.; Zaremba, W.; Cheung, V.; Radford, A.; Chen, X. Improved techniques for training gans. In Proceedings of the Advances in Neural Information Processing Systems 29, Barcelona, Spain, 5–10 December 2016. [Google Scholar]
- Ye, Y.; Wang, L.; Wu, Y.; Chen, Y.; Tian, Y.; Liu, Z.; Zhang, Z. Gan quality Index (GQI) by Gan-Induced Classifier. In Proceedings of the International Conference on Learning Representations (ICLR), Vancouver, BC, Canada, 30 April–3 May 2018. [Google Scholar]
- Levent, E. Bearing Fault Detection by One-Dimensional Convolutional Neural Networks. Math. Probl. Eng. 2017, 2017, 8617315. [Google Scholar]
- Krizhevsky, A.; Sutskever, I.; Hinton, G.E. ImageNet Classification with Deep Convolutional Neural Networks; NIPS, Curran Associates Inc.: New York, NY, USA, 2012; pp. 1–38. [Google Scholar]
- Liu, J.; Yang, Y.; Lv, S.; Wang, J.; Chen, H. Attention-based BiGRU-CNN for Chinese question classification. J. Ambient. Intell. Humaniz. Comput. 2019, 1–12. [Google Scholar] [CrossRef]
- Bhagat, R.C.; Patil, S.S. Enhanced SMOTE Algorithm for Classification of Imbalanced Big-Data Using Random Forest. In Proceedings of the 2015 IEEE International Advance Computing Conference (IACC), Banglore, India, 12–13 June 2015. [Google Scholar]
- Gu, Q.; Wang, X.M.; Wu, Z.; Ning, B.; Xin, C.S. An improved SMOTE algorithm based on genetic algorithm for imbalanced data classification. J. Digit. Inf. Manag. 2016, 14, 92–103. [Google Scholar]
- Muntasir Nishat, M.; Faisal, F.; Jahan Ratul, I.; Al-Monsur, A.; Ar-Rafi, A.M.; Nasrullah, S.M.; Reza, M.T.; Khan, M.R.H. A comprehensive investigation of the performances of different machine learning classifiers with SMOTE-ENN oversampling technique and hyperparameter optimization for imbalanced heart failure dataset. Sci. Program. 2022, 2022, 3649406. [Google Scholar] [CrossRef]
- Keller, A.; Pandey, A. SMOTE and ENN Based XGBoost Prediction Model for Parkinson’s Disease Detection. In Proceedings of the 2021 2nd International Conference on Smart Electronics and Communication (ICOSEC), Trichy, India, 7–9 October 2021. [Google Scholar]


| Type | Label | Raw Dataset | SMOTE + Tomek Link Post-Equilibrium Dataset |
|---|---|---|---|
| Normal | 0 | 4600 | 4495 |
| Plunger ball head wear | 1 | 129 | 4253 |
| Triangular hole plugging | 2 | 200 | 4060 |
| Valve plate wear | 3 | 270 | 4423 |
| Cylinder block wear | 4 | 217 | 4227 |
| Bowl wear | 5 | 281 | 3836 |
| Plunger wall pitting | 6 | 242 | 4432 |
| Datasets | Normal Working Condition | Abnormal Condition | Scale |
|---|---|---|---|
| Raw datasets | 4600 | 1339 | 3.4:1 |
| SMOTE + Tomek Link post-equilibrium datasets | 4531 | 4400 | 1.03:1 |
| Real Situation | Forecast Result (Q) | |
|---|---|---|
| Positive Example | Counter Example | |
| Positive example | TP | FN |
| Counter example | FP | TN |
| Method | SMOTE + ENN | SMOTE + Tomek Link |
|---|---|---|
| Accuracy rate | 94.82% | 96.93% |
| Working Condition | Recall | Precision | F1-Score |
|---|---|---|---|
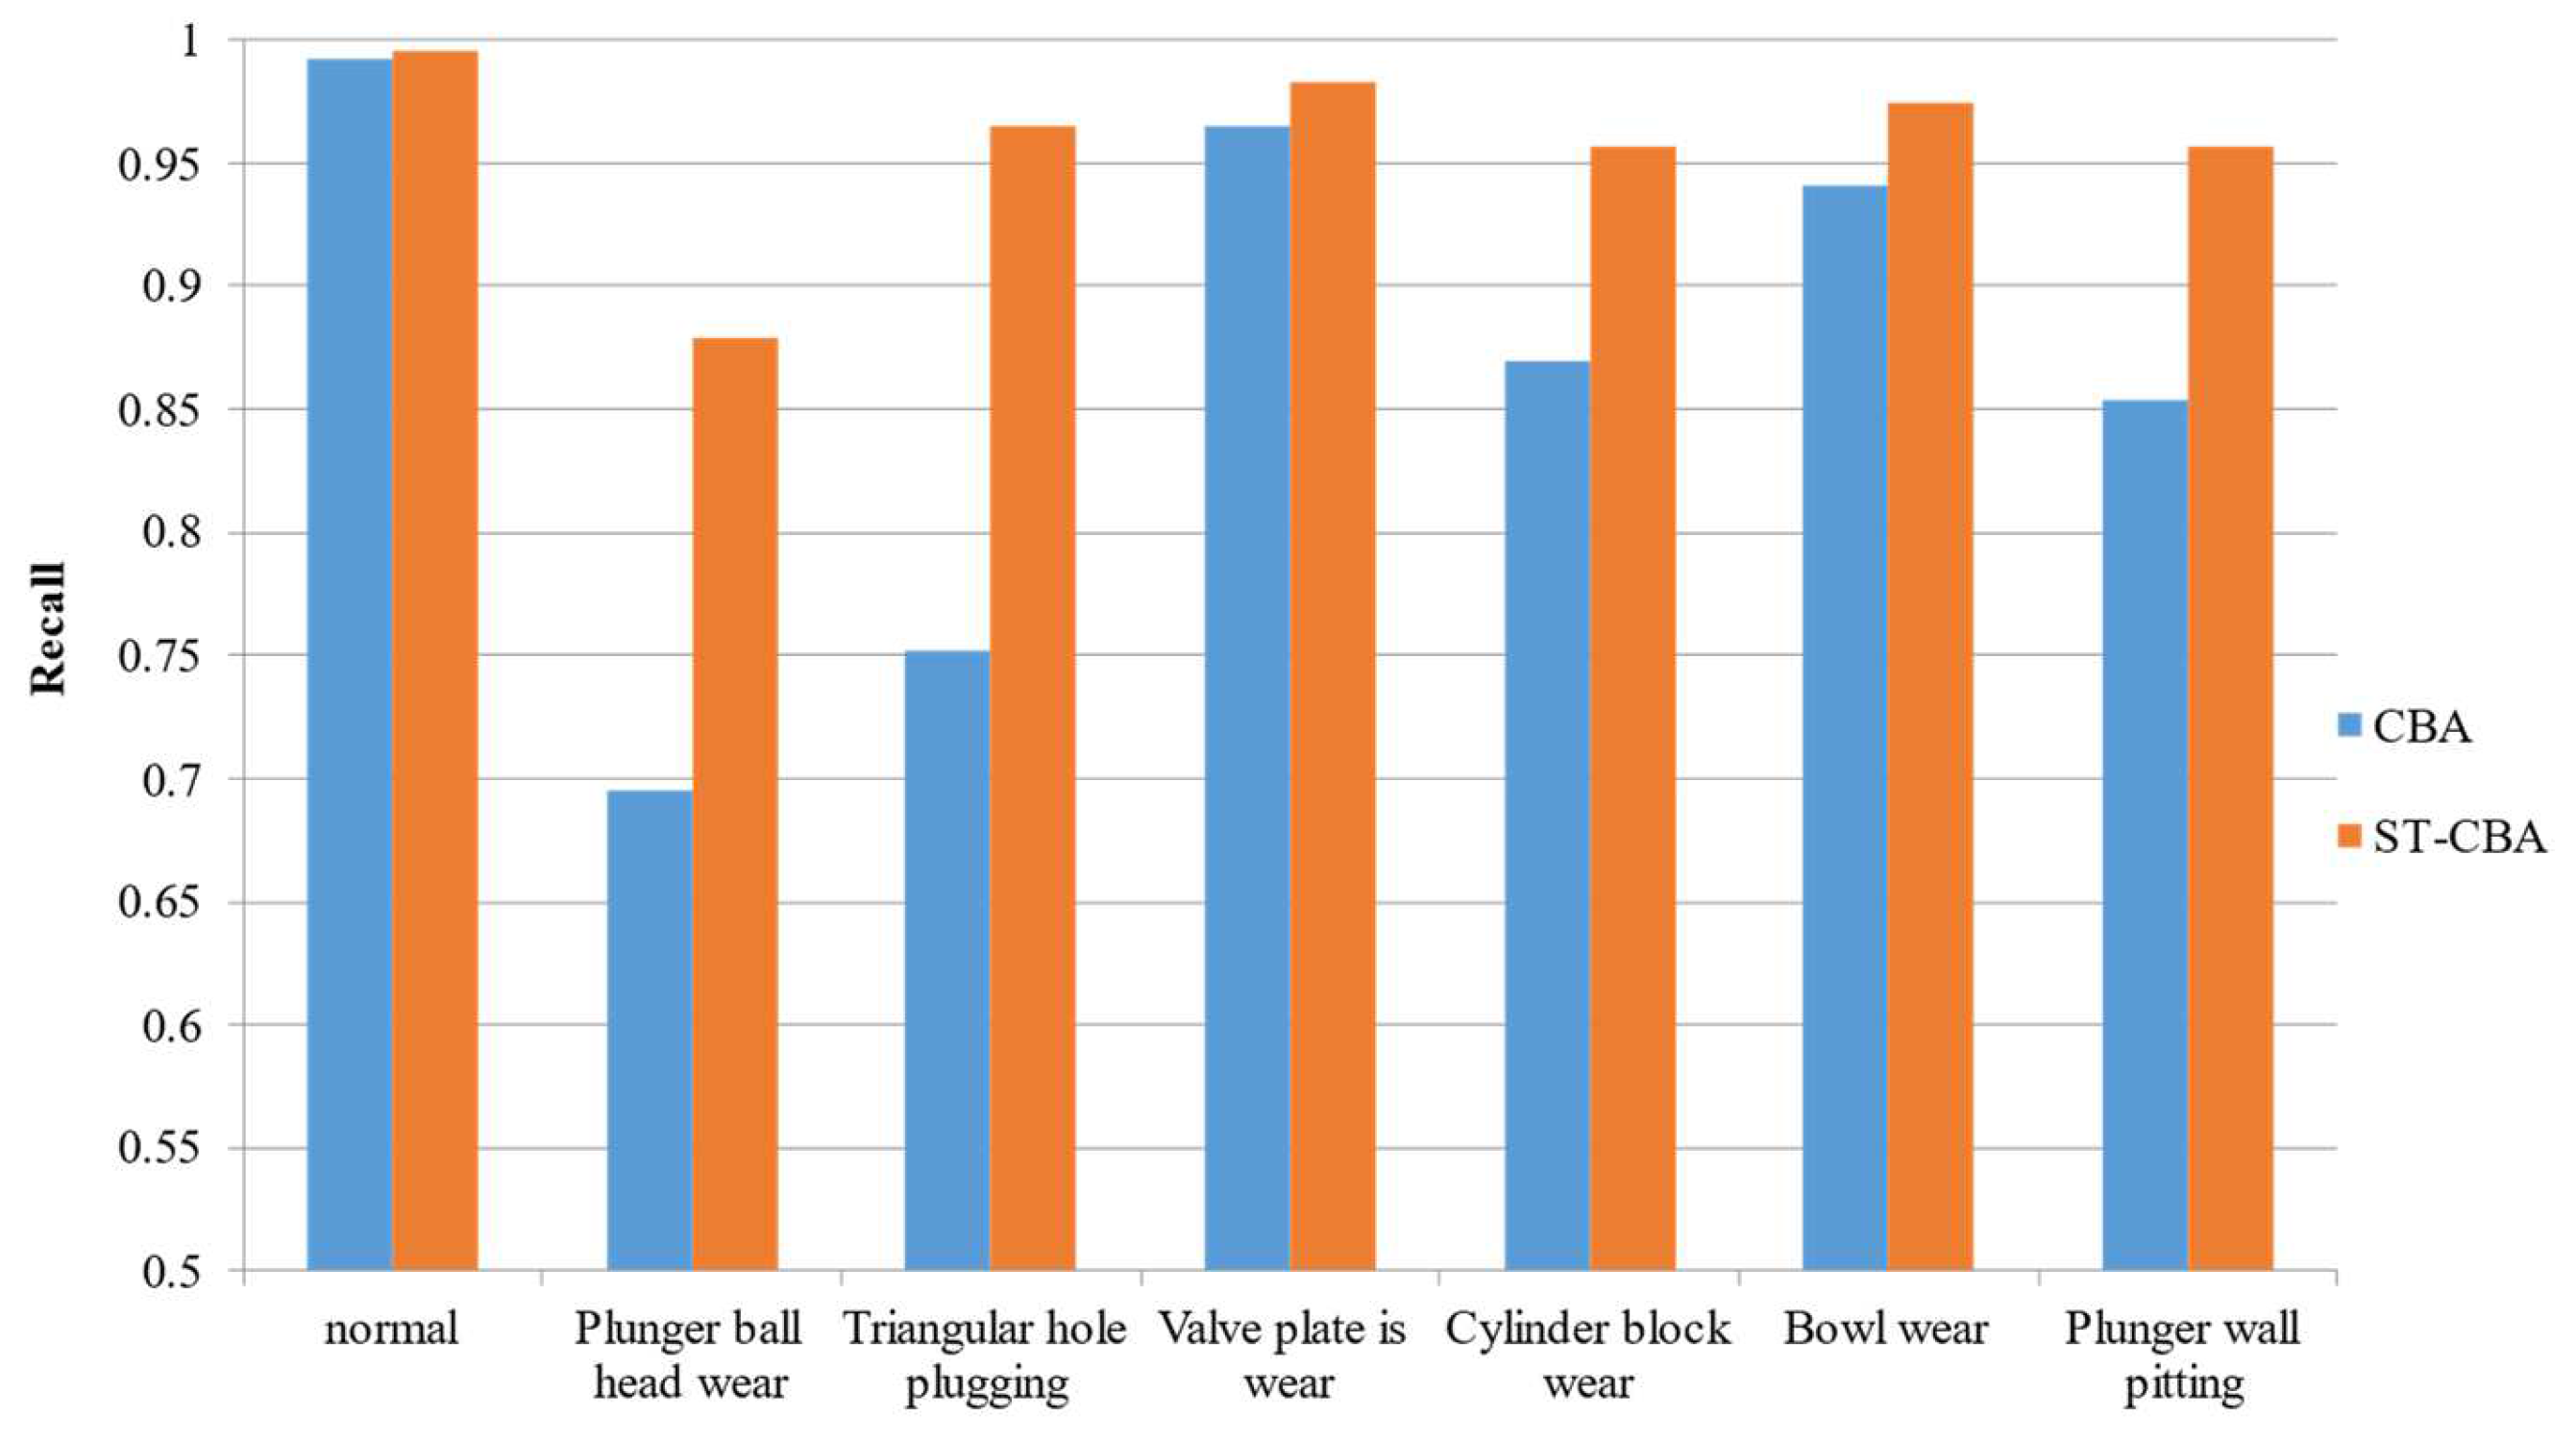
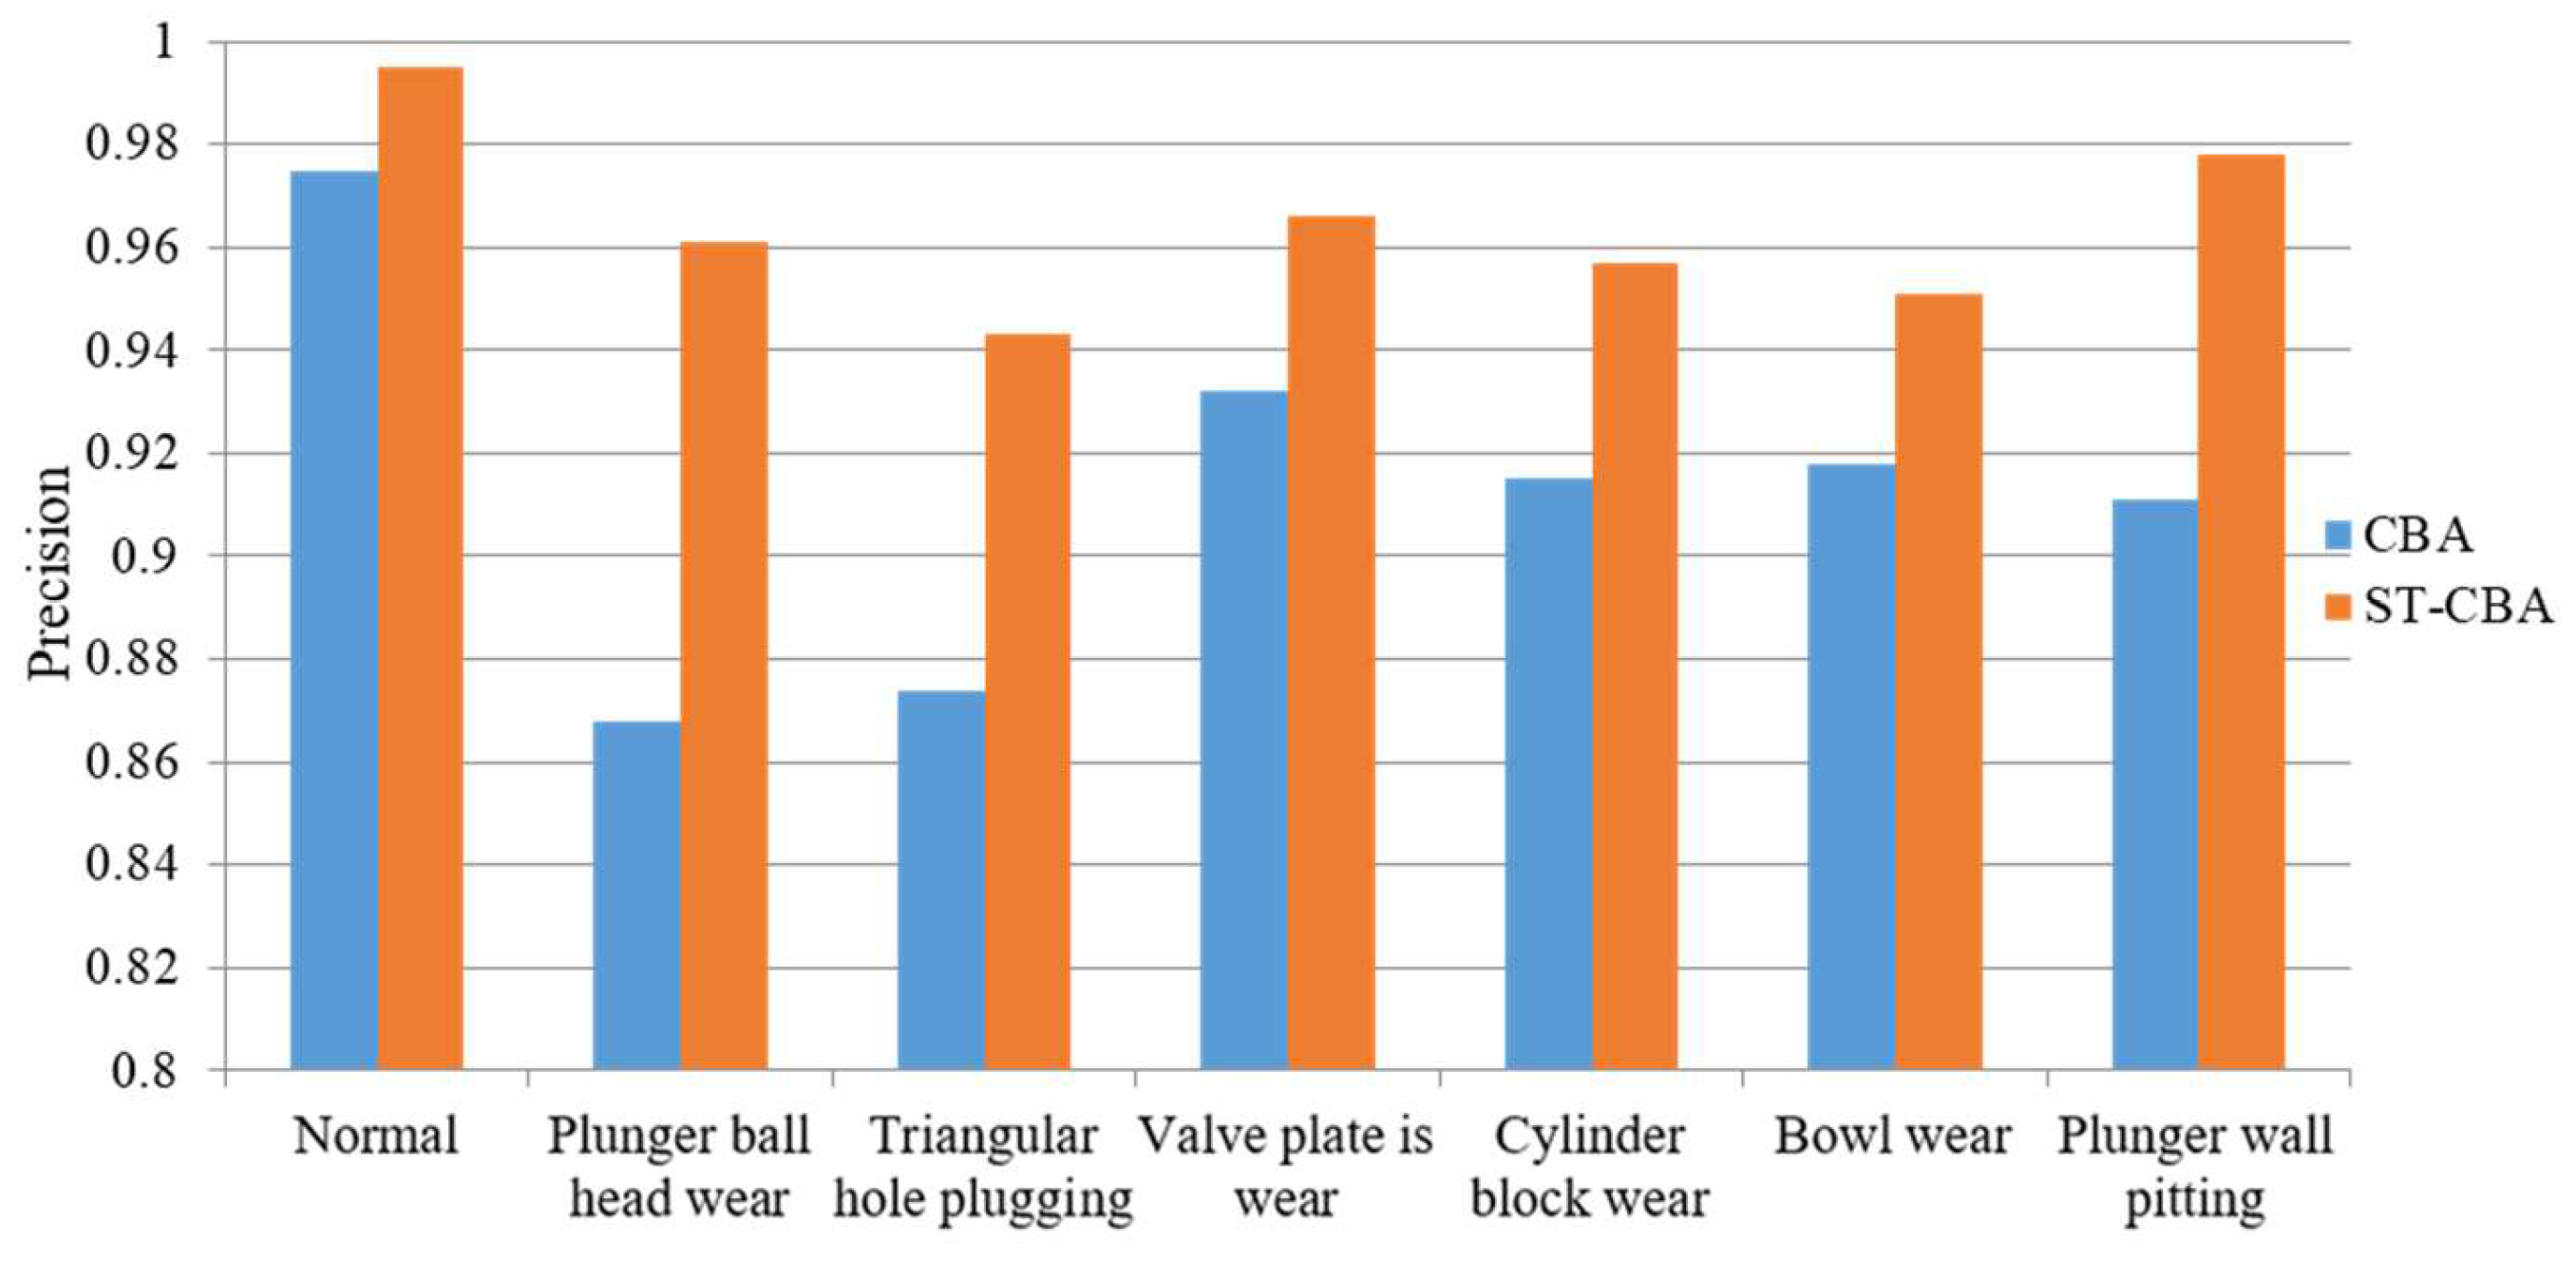
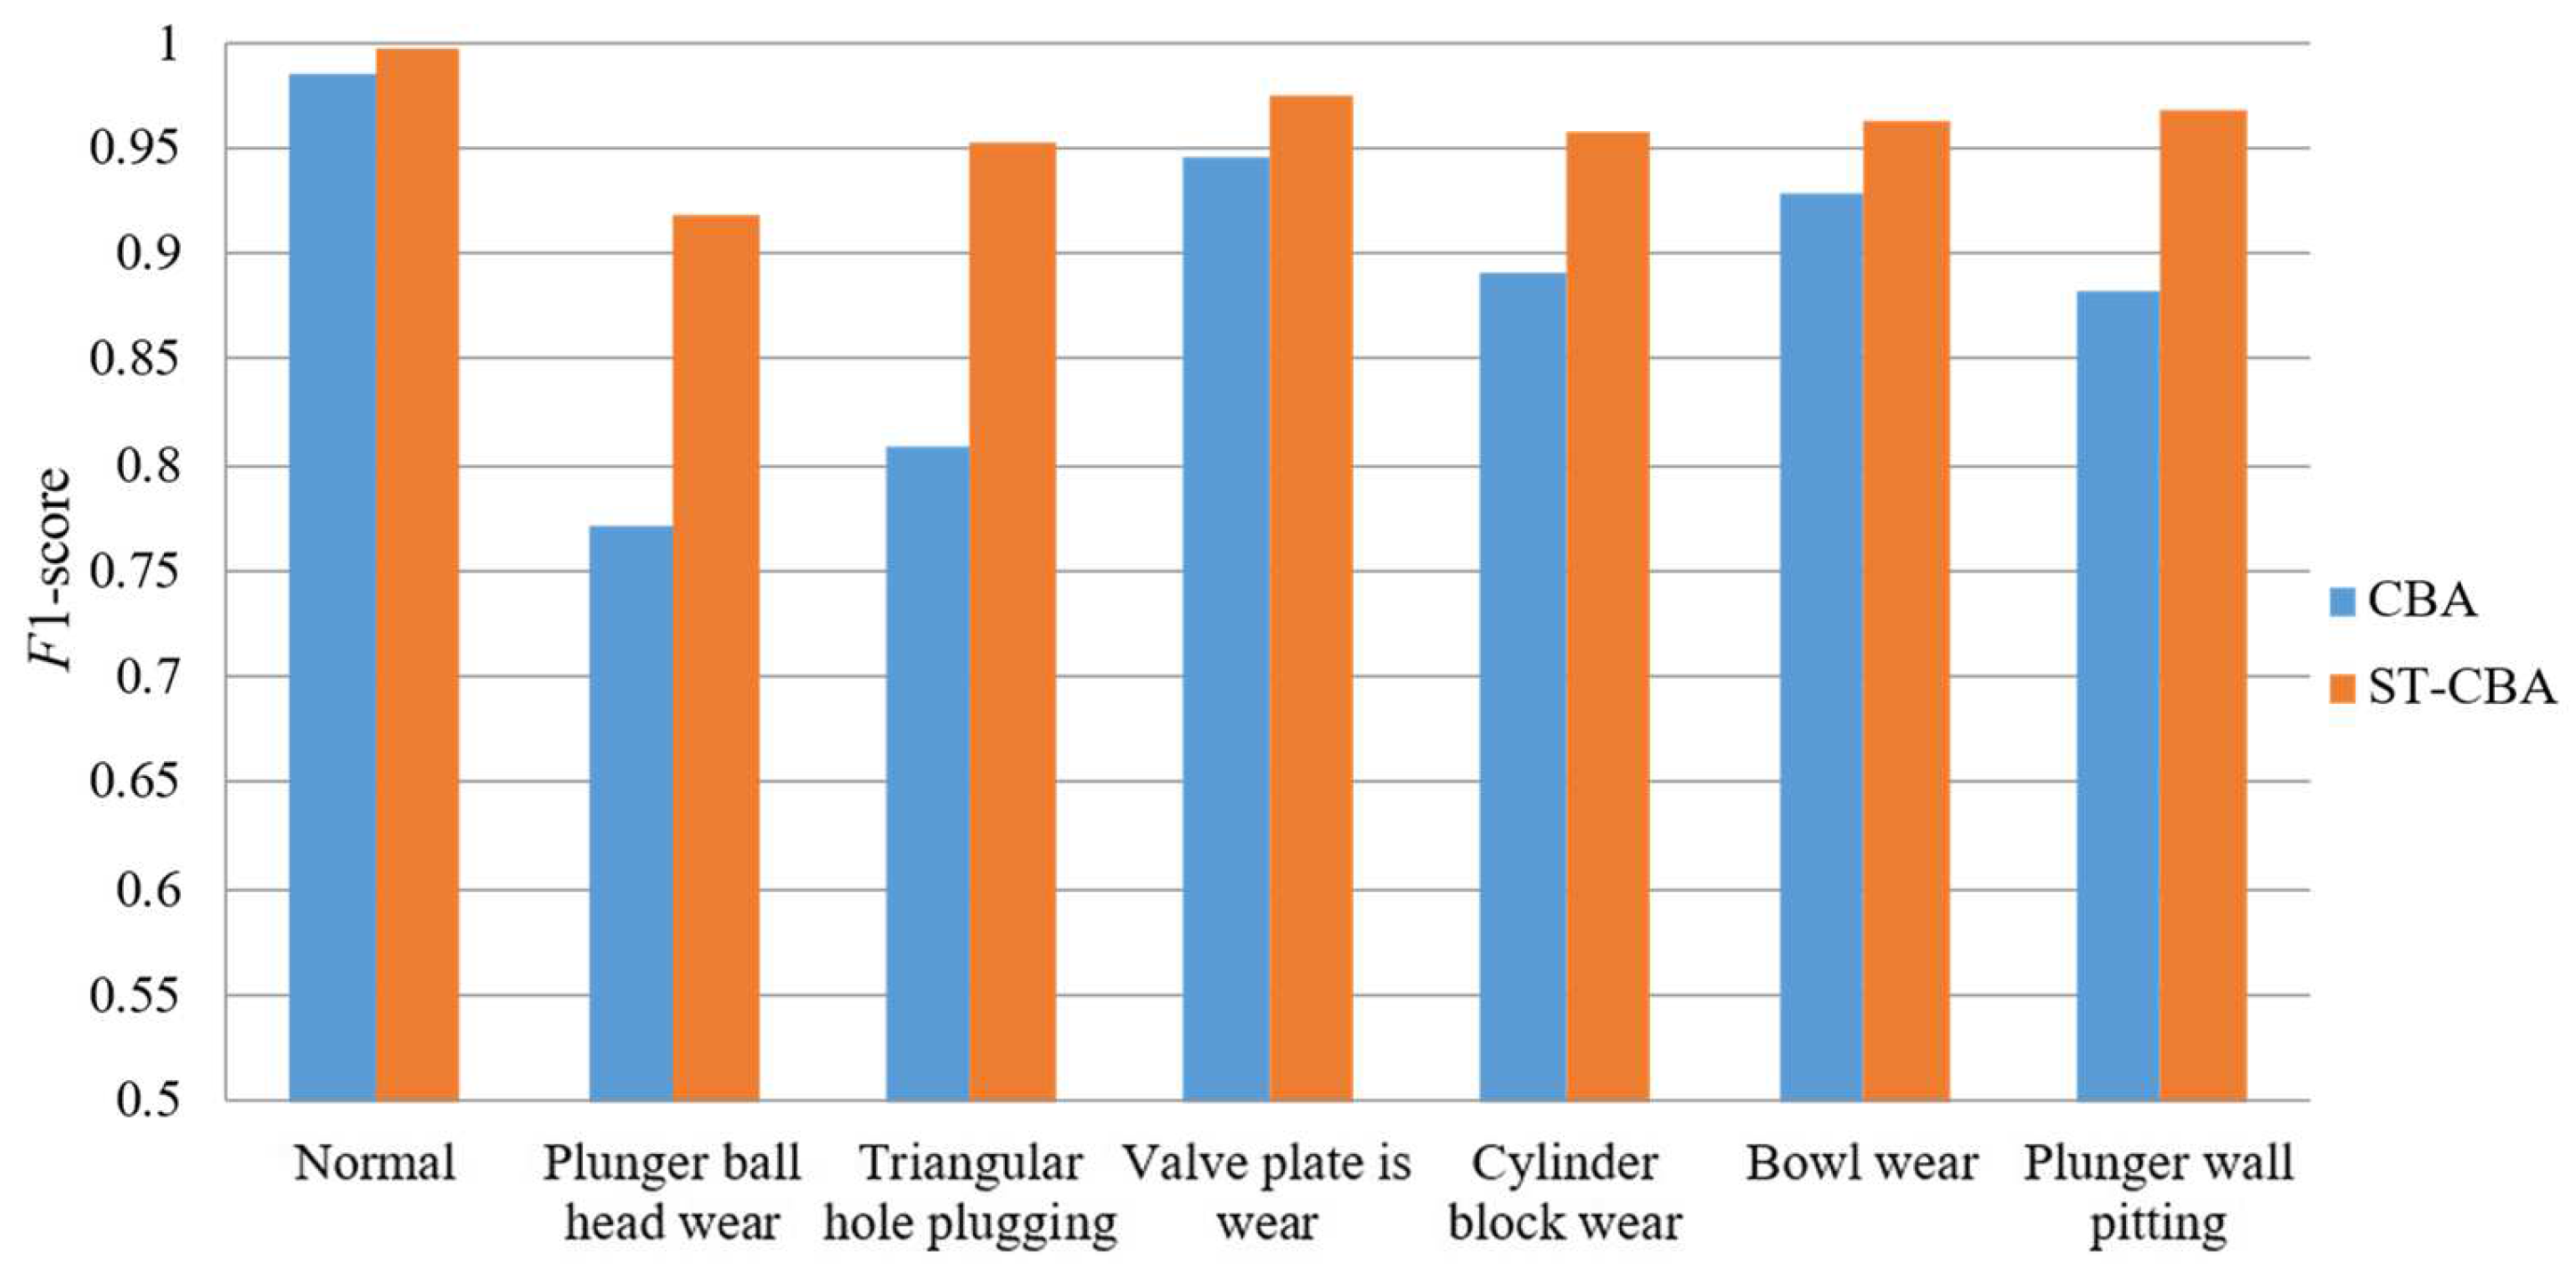
| Normal | 0.992 | 0.975 | 0.984 |
| Plunger ball head wear | 0.695 | 0.868 | 0.772 |
| Triangular hole plugging | 0.752 | 0.874 | 0.809 |
| Valve plate wear | 0.965 | 0.932 | 0.945 |
| Cylinder block wear | 0.869 | 0.915 | 0.891 |
| Bowl wear | 0.941 | 0.918 | 0.929 |
| Plunger wall pitting | 0.854 | 0.911 | 0.882 |
| Working Condition | Recall | Precision | F1-Score |
|---|---|---|---|
| Normal | 0.996 | 0.995 | 0.996 |
| Plunger ball head wear | 0.879 | 0.961 | 0.918 |
| Triangular hole plugging | 0.965 | 0.943 | 0.953 |
| Valve plate wear | 0.983 | 0.966 | 0.974 |
| Cylinder block wear | 0.957 | 0.957 | 0.957 |
| Bowl wear | 0.975 | 0.951 | 0.963 |
| Plunger wall pitting | 0.957 | 0.978 | 0.967 |
| Evaluation Indicators | Recall | Precision | F1-Score |
|---|---|---|---|
| Average improvement rate | 9.2% | 5.1% | 7.3% |
| Model Methods | Reference [13] | ST-CBA | GLFC | BiGRU | CLA | CNN |
|---|---|---|---|---|---|---|
| Accuracy | 91.68% | 95.86% | 89.29% | 88.43% | 81.00% | 82.14% |
Disclaimer/Publisher’s Note: The statements, opinions and data contained in all publications are solely those of the individual author(s) and contributor(s) and not of MDPI and/or the editor(s). MDPI and/or the editor(s) disclaim responsibility for any injury to people or property resulting from any ideas, methods, instructions or products referred to in the content. |
© 2024 by the authors. Licensee MDPI, Basel, Switzerland. This article is an open access article distributed under the terms and conditions of the Creative Commons Attribution (CC BY) license (https://creativecommons.org/licenses/by/4.0/).
Share and Cite
Yang, X.; Xu, X.; Wang, Y.; Liu, S.; Bai, X.; Jing, L.; Ma, J.; Huang, J. The Fault Diagnosis of a Plunger Pump Based on the SMOTE + Tomek Link and Dual-Channel Feature Fusion. Appl. Sci. 2024, 14, 4785. https://doi.org/10.3390/app14114785
Yang X, Xu X, Wang Y, Liu S, Bai X, Jing L, Ma J, Huang J. The Fault Diagnosis of a Plunger Pump Based on the SMOTE + Tomek Link and Dual-Channel Feature Fusion. Applied Sciences. 2024; 14(11):4785. https://doi.org/10.3390/app14114785
Chicago/Turabian StyleYang, Xiwang, Xiaoyan Xu, Yarong Wang, Siyuan Liu, Xiong Bai, Licheng Jing, Jiancheng Ma, and Jinying Huang. 2024. "The Fault Diagnosis of a Plunger Pump Based on the SMOTE + Tomek Link and Dual-Channel Feature Fusion" Applied Sciences 14, no. 11: 4785. https://doi.org/10.3390/app14114785
APA StyleYang, X., Xu, X., Wang, Y., Liu, S., Bai, X., Jing, L., Ma, J., & Huang, J. (2024). The Fault Diagnosis of a Plunger Pump Based on the SMOTE + Tomek Link and Dual-Channel Feature Fusion. Applied Sciences, 14(11), 4785. https://doi.org/10.3390/app14114785