Article

Temporal Evolution, Oscillation and Coherence Characteristics Analysis of Global Solar Radiation Distribution in Major Cities in China’s Solar-Energy-Available Region Based on Continuous Wavelet Transform

College of Science, Northeast Forestry University, Hexing Road 26, Harbin 150040, China
*
Author to whom correspondence should be addressed.
These authors contributed equally to this work.
Appl. Sci. 2024, 14(11), 4794; https://doi.org/10.3390/app14114794
Submission received: 22 April 2024 / Revised: 25 May 2024 / Accepted: 30 May 2024 / Published: 1 June 2024
(This article belongs to the Section Environmental Sciences)

Abstract

:

Featured Application

The findings of this study can serve as a valuable reference for the cross-regional integration and optimal utilization of energy resources. Simultaneously, they also contribute to enhancing the accuracy of global solar radiation forecasting by integrating meteorological data and air quality conditions.

Abstract

The majority of the energy required for human survival is derived either directly or indirectly from solar radiation, thus it is important to investigate the periodic fluctuations in global solar radiation over time. In this study, six cities—Harbin, Shenyang, Beijing, Shanghai, Wuhan, and Guangzhou—located in the utilizable areas of solar energy in China, were selected, and the periodicity of the daily global solar radiation of these six cities with time were investigated by means of wavelet power spectrum analysis. Furthermore, Harbin, which has the lowest monthly average of global solar radiation in the cold of winter, was selected to explore the temporal evolution relationship between global solar radiation and other meteorological factors, and air quality factors by wavelet coherence analysis. Among the meteorological factors, the correlation between global solar radiation and sunshine duration exhibits the highest level of consistency. Global solar radiation demonstrates a positive association with atmospheric temperature/wind speed/precipitation over the annual cycle. Conversely, it displays a negative correlation with atmospheric pressure during this time frame. Additionally, on shorter timescales, global solar radiation is negatively correlated with air humidity and precipitation. Among air quality factors, the relationship between global solar radiation and CO/NO2/O3/PM2.5/PM10/SO2 primarily manifests in the broader annual cycle time scale. Within this context, global solar radiation shows a positive correlation with O3, while displaying negative associations with the other five air quality indicators. These findings contribute to urban environmental planning and the effective management and utilization of solar radiation, thereby providing valuable insights to guide the future development of cross-regional comprehensive energy utilization projects under diverse climatic and geographical conditions. Additionally, they serve as a reference for subsequent research aimed at enhancing the accuracy of global solar radiation prediction models.

1. Introduction

The amount of solar radiation received by Earth’s atmospheric system plays a vital role in maintaining the energy balance of the climate system and ecosystem [1]. Solar radiation serves as the primary driving force behind atmospheric motion, water cycle, and terrestrial activities [2], while also serving as a crucial metric for assessing solar resource reserves [3]. The utilization of solar energy resources has emerged as a significant choice in addressing issues related to energy scarcity, climate change, and the imperative for energy conservation and emission reduction due to its status as an important renewable energy source characterized by clean, abundant storage capacity, environmental friendliness, sustainability, and long-term viability [4]. By embracing the widespread adoption of solar power on a large scale, we can effectively diminish our reliance on fossil fuels while simultaneously meeting the escalating global demand for energy and successfully mitigating or alleviating the mounting challenges posed by dwindling conventional energy sources and environmental pollution caused by traditional forms of energy [5,6,7,8].
Solar radiation is a crucial factor that impacts the development and utilization of solar energy resources, serving as the primary energy source for various physical and biochemical processes on the Earth’s surface. However, solar radiation variability is easily influenced by environmental pollution, atmospheric cloud cover, atmospheric water vapor content, and other factors, leading to significant fluctuations [9,10,11]. Moreover, due to latitude variations, terrain characteristics, and climate conditions, the distribution of solar energy resources becomes relatively complex, with distinct variations in solar radiation values across different regions [12]. Therefore, analyzing the spatio-temporal dynamic distribution of solar radiation holds immense significance for planning and implementing solar energy technology.
In recent decades, scholars from various countries have conducted numerous studies on the variability characteristics of solar surface radiation and its correlation with other meteorological and air quality factors [13,14,15,16]. Rudy Calif et al. used a variety of methods to study the intermittency and multifractal properties of global solar radiation data, which helps to select the location of solar power plants and predict electricity generation [17]. Hsieh Tsung-En et al. conducted a comprehensive analysis of global solar radiation data collected from 30 meteorological stations across Taiwan during the period from 2004 to 2018. Through rigorous statistical methods, they determined that there exists a gradual increase in annual global radiation from northeast to southwest in Taiwan. These findings serve as valuable references for the effective utilization of solar energy resources in Taiwan [18]. Shen Yanbo et al. conducted an analysis on the long-term variation trend of surface solar radiation in three northeastern provinces, utilizing monthly data on surface solar radiation and temperature. Furthermore, they employed the equilibrium theory in order to quantitatively examine the impact of solar radiation on temperature within the atmospheric system [19]. The impact of climate change on wind and solar power generation at high concentrations of greenhouse gases in Texas was quantified by Lgnacio Losada Carreño et al. The spatio-temporal differences observed in the findings underscore the significance of employing high-resolution data sets for studying the potential effects of climate change on wind and solar energy [20]. Yang Xin et al. conducted an analysis on the impact of atmospheric aerosol pollution on terrestrial solar radiation in China. The findings demonstrate a significant correlation between visibility, PM2.5 levels, regional mean atmospheric aerosol optical thickness, and surface solar radiation in eastern China. Moreover, it is evident that aerosol pollution exerts a substantial negative influence on surface available energy [21]. The study conducted by Luo Hao et al. examined the seasonal variations in visibility, Air Quality Index (AQI), and particulate matter (PM10 and PM2.5), as well as their correlation with surface solar radiation. The findings indicate a significant association between scattered radiation and air quality based on visibility measurements [22]. Zhao Qun et al. employed the principal component analysis method in order to investigate the impact of haze severity on daily global solar radiation in Tianjin. The findings indicate that varying levels of air quality pollution result in a decrease in global solar radiation, with severe pollution leading to a reduction exceeding 45% [23]. Zhou Lihua et al. conducted an analysis on the spatio-temporal variation of surface solar radiation and aerosol extinction in order to elucidate the recent increase in surface O3 concentration. The findings confirm that the rise in surface solar radiation intensity in northern China primarily stems from a reduction in aerosol concentration, rather than variations in cloud cover. Furthermore, it is evident that the current measures for ozone control are inadequate, necessitating more stringent emission reduction policies in order to mitigate ozone pollution [24]. These studies demonstrate a temporal pattern in surface solar radiation, characterized by an alternating trend of interdecadal decrease and increase. However, it exhibits robust stability in its annual cycle and regional distribution. Furthermore, there exists a complex relationship between global solar radiation and other meteorological factors, as well as air quality factors. Current research primarily focuses on the correlation between surface solar radiation and one or several variables, yet systematic investigations into the interaction between global solar radiation and various meteorological factors, along with air quality factors, are lacking.
Wavelet transforms have been extensively employed in meteorological research due to its excellent temporal and frequency domain localization characteristics [25,26,27,28,29]. Sreedevi Varre et al. used several different wavelet transform methods to investigate the multiscale relationship between evaporation at two weather stations in northwestern Iran and five climate variables: average temperature, pressure, relative humidity, wind speed, and solar radiation. Their findings provide compelling evidence of a significant correlation between meteorological variables and evapotranspiration [30]. Elena E. Benevolenskaya et al. analyzed the correlation between solar spectral irradiance, solar radiation, and magnetic flux in sunspot regions by using a cross and coherent wavelet transform. Their findings indicate that solar activity influences solar spectral irradiance; however, this effect is dependent on the wavelength of the solar irradiance [31]. The authors Sajid Hussain et al. employed a wavelet cross-spectrum and wavelet coherence analysis in order to propose a validation method for solar radiation models that deviate from time domain analysis. This approach enables the joint or separate validation of solar radiation models in both the phase domain and time domain [32]. Chang Tianpau et al. applied the wavelet transform theory in order to investigate temporal oscillation and the correlation among temperature, wind speed, and solar radiation in Taipei city. They discovered that there exists an inverse relationship between global solar radiation around Taipei City and wind speed, which exhibits a complementary pattern in terms of energy utilization [33]. Although several studies have involved the global solar radiation factor, there is a dearth of systematic and comprehensive analyses utilizing the wavelet transform method.
The Morlet wavelet, being non-orthogonal, can be characterized as a complex sinusoidal function enveloped by a Gaussian centered at a specific frequency. By employing the Morlet complex wavelet as the mother wavelet, the original sequence undergoes a time-scale transformation resulting in complex wavelet coefficients. The oscillation periods of the time series at different time scales can be unveiled through an examination of both the modulus and the real parts of these coefficients [34]. By employing the Morlet wavelet as the mother wavelet, Gao Mingming et al. conducted an analysis on the periodic oscillation of land subsidence and groundwater level time series in Beijing using a continuous wavelet transform. They discovered a spatial consistency between subsidence concentration in the northern part of Beijing Plain and the underground precipitation funnel. The prolonged reduction in groundwater extraction area within this subsidence region has resulted in a continuous decline of water levels, leading to irreversible and permanent water level depletion. Monitoring wells located outside the settlement zone exhibit evident changes in elastic deformation characteristics (seasonal patterns) during settling periods [35]. The temporal evolution characteristics of PM2.5 concentration in the Yangtze River Delta Urban Agglomeration were analyzed by Wang Jiajia et al., utilizing a continuous wavelet transform with Morlet as the parent function. The findings indicate a step-like spatial decrease of PM2.5 from northwest to southeast, accompanied by significant multi-scale time variation [36]. Chen Xiaobing et al. employed the Morlet continuous wavelet transform in order to investigate the local intermittent oscillation of PM2.5 in Chengdu. The findings reveal that the primary oscillation period exhibits temporal variability. Notably, there exist multiple oscillation periods within the ranges of 14–32 d, 62–104 d, 105–178 d, and 216–389 d, with a dominant period of 298 d observed throughout the entire evolution process. Furthermore, during short-period oscillation analysis, two abrupt changes were detected in the main period, with the strongest energy observed at a scale of 63 h. Both independent analyses consistently concluded that disregarding the multiscale characteristics exhibited by PM2.5 over time evolution would be imprudent, as they may play a crucial role in future haze predictions [34]. The aforementioned studies provide empirical evidence for the distinctive advantages of the Morlet wavelet as a mother function in the analysis of multi-scale periodic oscillations in time series.
In this study, the Morlet wavelet power spectrum was first used to investigate the cyclical oscillation characteristics of global solar radiation from January 2011 to December 2020 for six important cities in China, Harbin, Shenyang, Beijing, Wuhan, Shanghai and Guangzhou, which are located in the geographical solar-energy-utilizable areas at different longitudes and latitudes. By conducting a seasonal analysis, we further focused on Harbin city as our research subject, as it had the highest energy demand and lowest solar radiation during cold winters. Subsequently, the wavelet coherence analysis method was utilized in order to investigate the correlation between daily global solar radiation and other meteorological factors, as well as air quality factors, in Harbin City from January 2014 to December 2020. The findings of this study are important for establishing rational urban environmental regulations and solar energy development policies, as well as providing a useful reference for the implementation of cross-regional comprehensive energy utilization projects under diverse climatic and geographical conditions. Simultaneously, it serves as a foundation for further research aimed at enhancing the accuracy of global solar radiation prediction models.

2. Study Area and Data

2.1. Study Area

The abundance of solar energy resources is the primary factor affecting the large-scale development and utilization of solar energy, and it is also one of the most important factors for evaluating the potential of solar energy. Annual global solar radiation is the main evaluation index used to measure the abundance of solar energy resources in a certain area. The annual global solar radiation in China can be roughly divided into east and west sections by drawing a straight line between Xilinhot in Inner Mongolia and Tengchong in Yunnan. The annual global solar radiation in eastern China is weaker than that in western China as a whole. Figure 1 shows the distribution of annual global solar radiation in different regions of China after classification by 500 MJ/m2 [37]. According to GB/T 31155-2014 [38], China’s national standard for solar energy resource grade, annual global solar radiation is divided into four grades: A, B, C, and D. See Table 1 for the specific classification standards. The rational utilization of solar energy resources in the utilizable area is of great importance. Therefore, Harbin (125°42′ E~130°10′ E, 44°04′ N~46°40′ N), Shenyang (122°43′ E~123°31′ E, 41°07′ N~42°45′ N), Beijing (115°25′ E~117°30′ E, 39°26′ N~41°03′ N), Wuhan (113°41′ E~115°05′ E, 29°58′ N~31°22′ N), Shanghai (120°42′ E~122°12′ E, 30°40′ N~31°53′ N), and Guangzhou (112°57′ E~114°03′ E, 44°04′ N~46°40′ N), which are all located near the available areas, were selected as the research objects to carry out a study on the distribution law of solar energy.

2.2. Data Source

The daily global solar radiation data for the six selected cities and the meteorological information data of Harbin in this paper were all obtained from the daily data set of basic elements from the China Meteorological Radiation International Exchange Station, issued by National Meteorological Information Center of China (http://data.cma.cn/, accessed on 21 April 2021). All air quality data in Harbin were collected from the China Air Quality Online Monitoring and Analysis Platform (https://www.aqistudy.cn/, accessed on 2 February 2022).

3. Wavelet Analysis

3.1. Continuous Wavelet Transform

A continuous wavelet transform (CWT) can simultaneously extract the frequency and time scale information of signals in a variety of wavelet scales, so it is widely used to extract the periodic characteristics of time series in meteorological analysis. Generally, the continuous wavelet transform is defined as follows [28]:
W x a , b = 1 a x t φ t b a d t
where W x a , b is the wavelet coefficient; a and b are the scale parameter and translation parameter, respectively; x t is the time series; t is time; and φ t b a is the daughter wavelet, which is obtained from the mother wavelet φ t after translation and scaling in the time series.
The wavelet square variance is the integral of the square norm of wavelet coefficients in the time domain, which can represent the energy distribution of periodic waves on different scales. For a particular scale, the larger the wavelet square variance, the stronger the oscillation intensity. The wavelet square variance is defined as follows [28]:
V a r a = W x a , b 2 d t

3.2. Morlet Wavelet

The selection of the mother wavelet function is the key step of wavelet analysis. Morlet wavelet is a complex wavelet, which is more advantageous than a real wavelet in application. The phase difference between the real part and the imaginary part of the Morlet wavelet is π/2, which can eliminate the oscillation caused by the modulus of the real wavelet transform. In addition, the mode and phase can be easily separated from the wavelet coefficients. When analyzing time series data, the Morlet wavelet is employed as the parent wavelet, enabling the simultaneous extraction of amplitude and phase information through the modulus and real part of complex wavelet coefficients. This facilitates a visual representation of the oscillation period inherent in the time series. A Morlet wavelet is usually defined as follows [36]:
φ t = π 1 / 4 e i ω t e t 2 / 2
where π 1 / 4 is the normalization parameter, and ω is the dimensionless angular frequency.
When ω = 6 , the scale of the wavelet transform is approximately equal to the frequency of the Fourier transform. At this time, the real part of the wavelet coefficient R W x a , b can accurately reflect the energy distribution of the time series, and the real part modulus square of the wavelet coefficient W x a , b 2 can reflect the intensity of the periodic vibration in the time series, which is usually called the wavelet power spectrum.

3.3. Wavelet Coherence Analysis

Wavelet coherence is mainly used to analyze the correlation of two time series, x t and y t , at a specific spatial scale and time. The wavelet coherence of the two time series is expressed as follows [33]:
W x y 2 a , b = W ¯ x y a , b 2 W ¯ x a , b 2 W ¯ y a , b 2
where W x y a , b is the coherence coefficient of two time series, x t and y t ; W ¯ x y a , b is a smoothed cross-spectrum of x t and y t sequences; and W ¯ x a , b and W ¯ y a , b are the smoothed wavelet spectra of time series x t and y t , respectively. The value of the coherence coefficient ranges from 0 to 1. A larger value indicates stronger coherence, while a smaller value indicates weaker coherence.

4. Results and Discussions

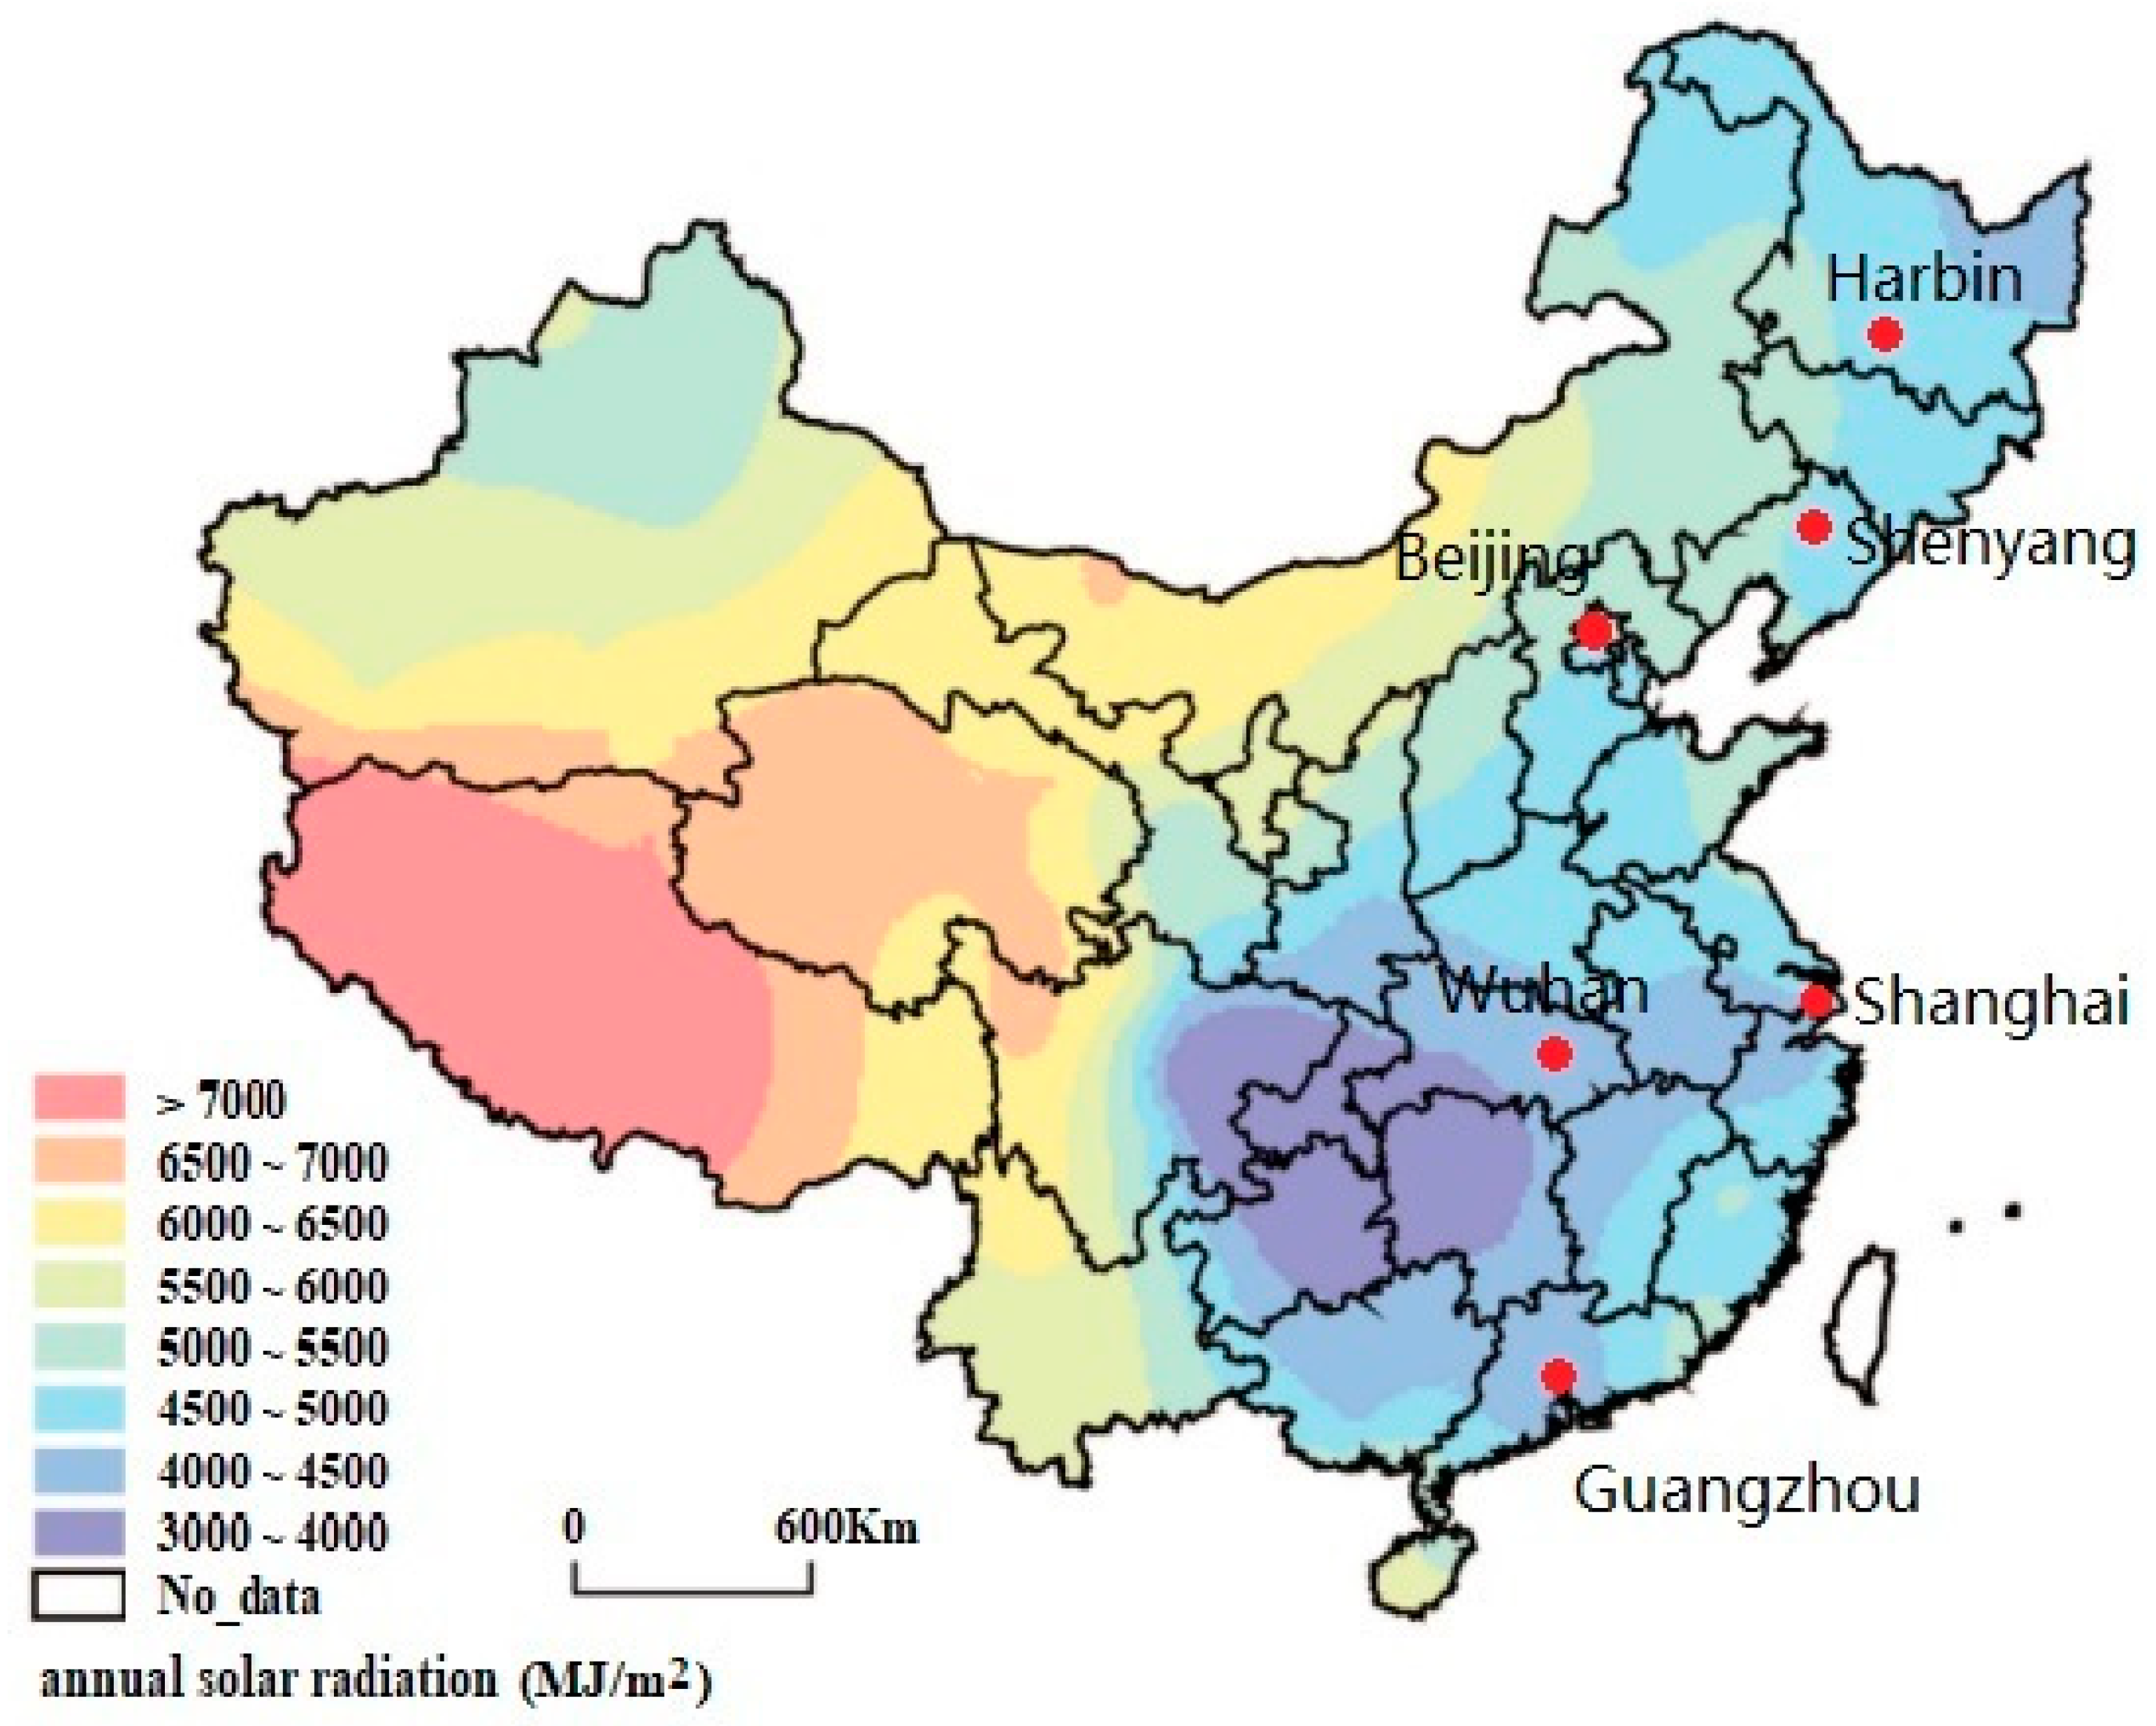
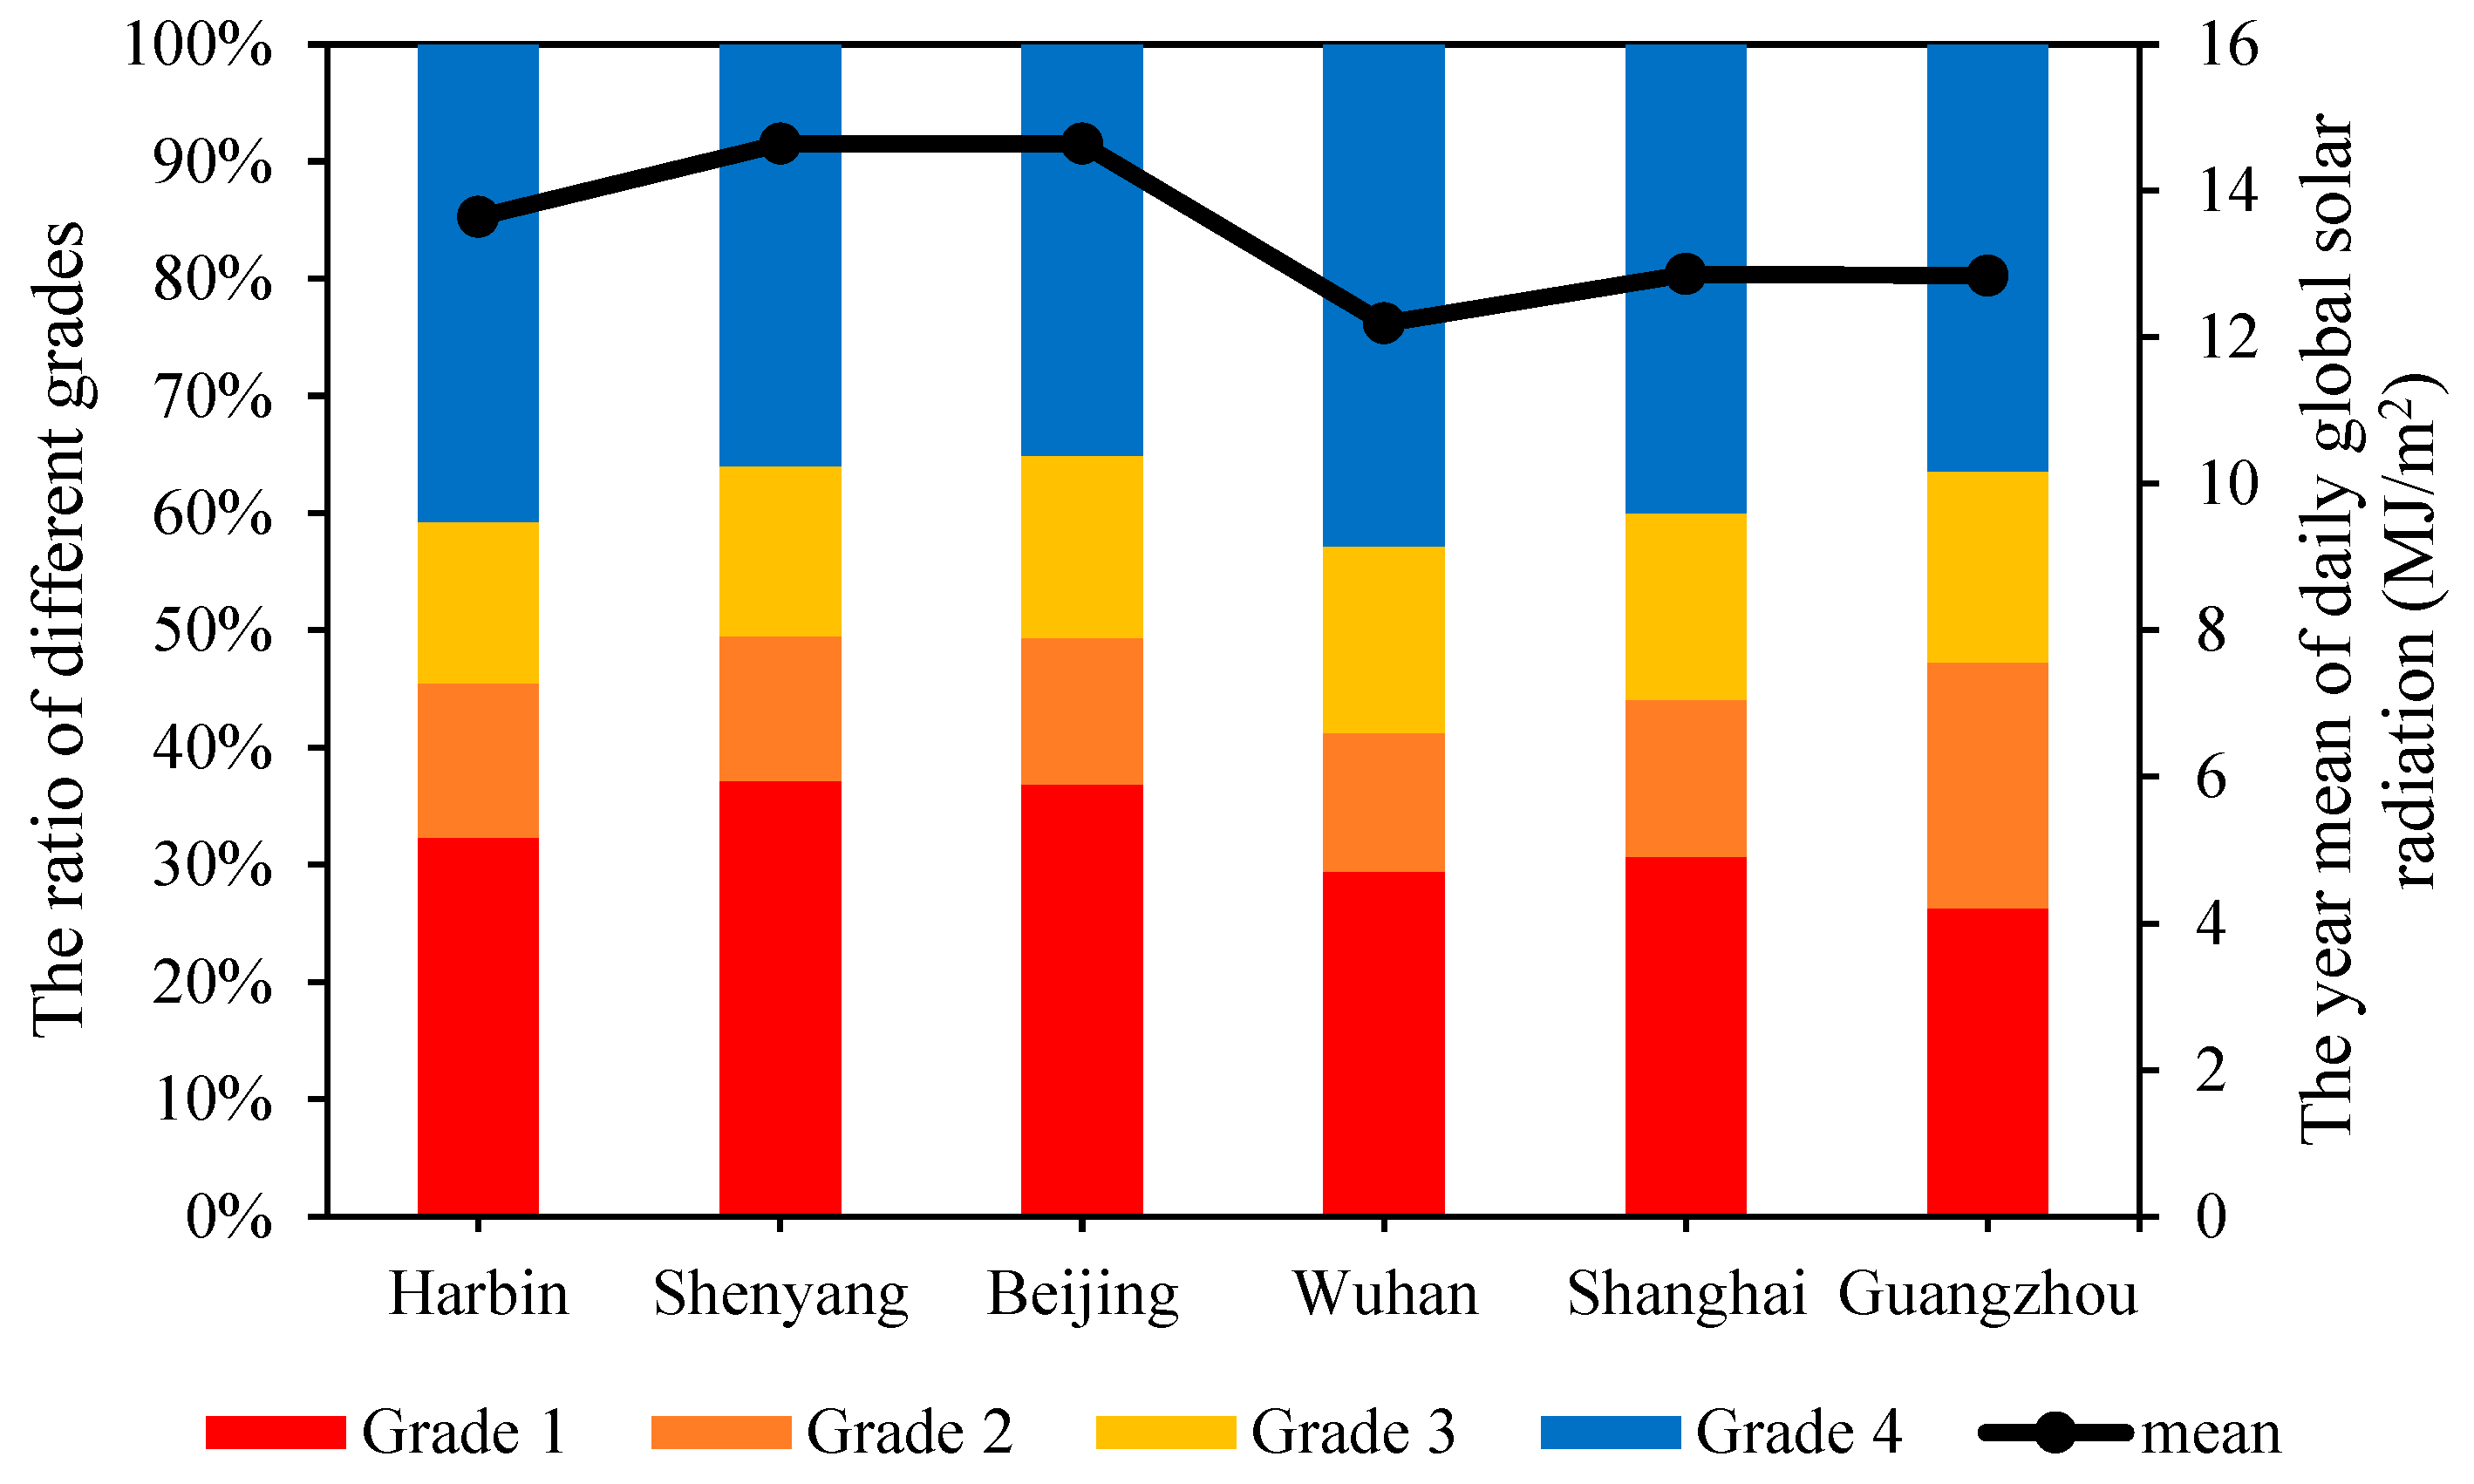
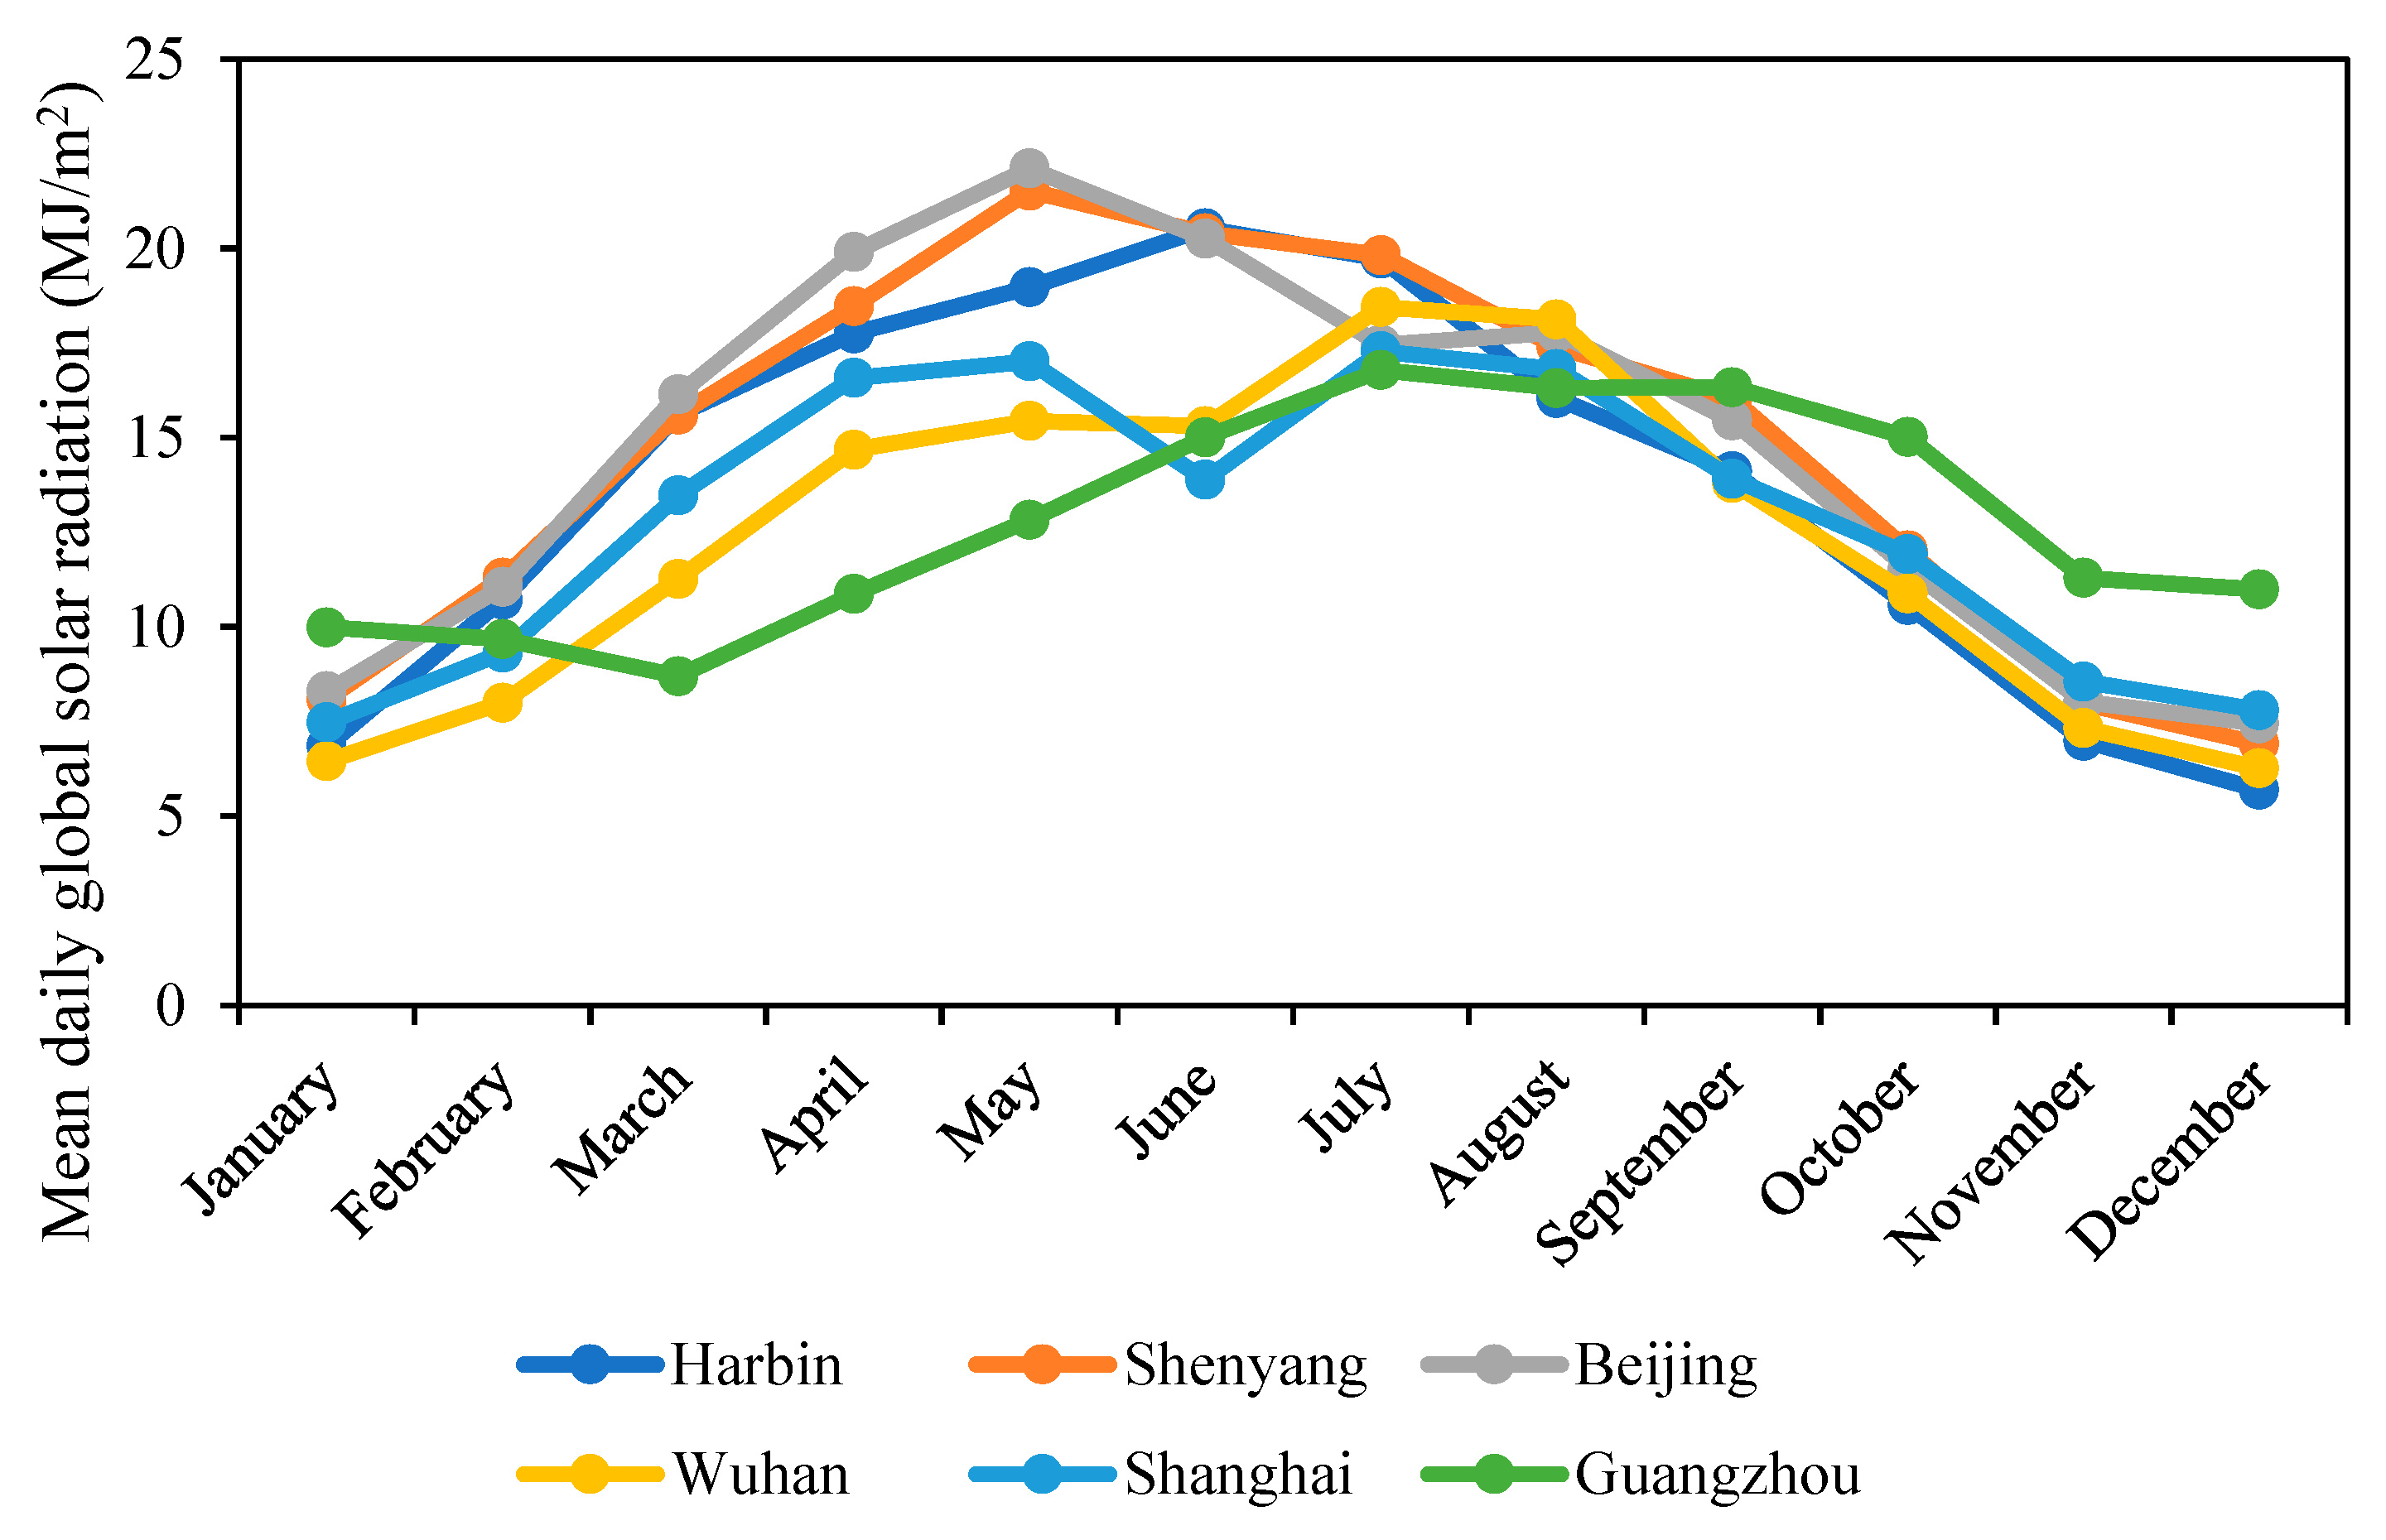
4.1. Spatial Variation of Global Solar Radiation

The average value obtained by dividing the annual global solar radiation threshold in Table 1 by 365 days was used as the classification threshold of daily global solar radiation, and the classification standards are detailed in Table 2. The annual average daily global solar radiation and the proportion of daily global solar radiation on different grades in the six cities are shown in Figure 2.
It can be seen from Figure 2 that the ten-year mean daily global solar radiation of Harbin, Shenyang, Beijing, Wuhan, Shanghai, and Guangzhou were 13.64 MJ/m2, 14.64 MJ/m2, 14.64 MJ/m2, 12.19 MJ/m2, 12.86 MJ/m2, and 12.84 MJ/m2, respectively. Among them, Shenyang had the highest number of daily global solar radiation at Grade 1—in the past ten years, it reached 1357 days—followed by Beijing with 1348 days, and the fewest number of days in this level was 960 days in Guangzhou. Additionally, Guangzhou had slightly more days of daily global solar radiation at Grade 2, reaching 766, while the other five cities showed little difference in this grade, ranging from 432 days to 489 days. Furthermore, the number of days with daily global solar radiation at Grade 3 for the six cities in the past ten years was very close, the least is Harbin, 504 days, and the most is Guangzhou, 595 days. Moreover, Wuhan had the most days at Grade 4, with 1565 days of daily global solar radiation at at this grade in the past ten years, followed by Harbin with 1488 days, and Shanghai ranked the third with 1462 days; Guangzhou, Shenyang, and Beijing were relatively close, with 1332 days, 1314 days, and 1283 days, respectively. Grade 4 indicates that the daily global solar radiation is relatively poor, and the number of days in this grade is the most important factor affecting the development and utilization of solar energy resources in a city.

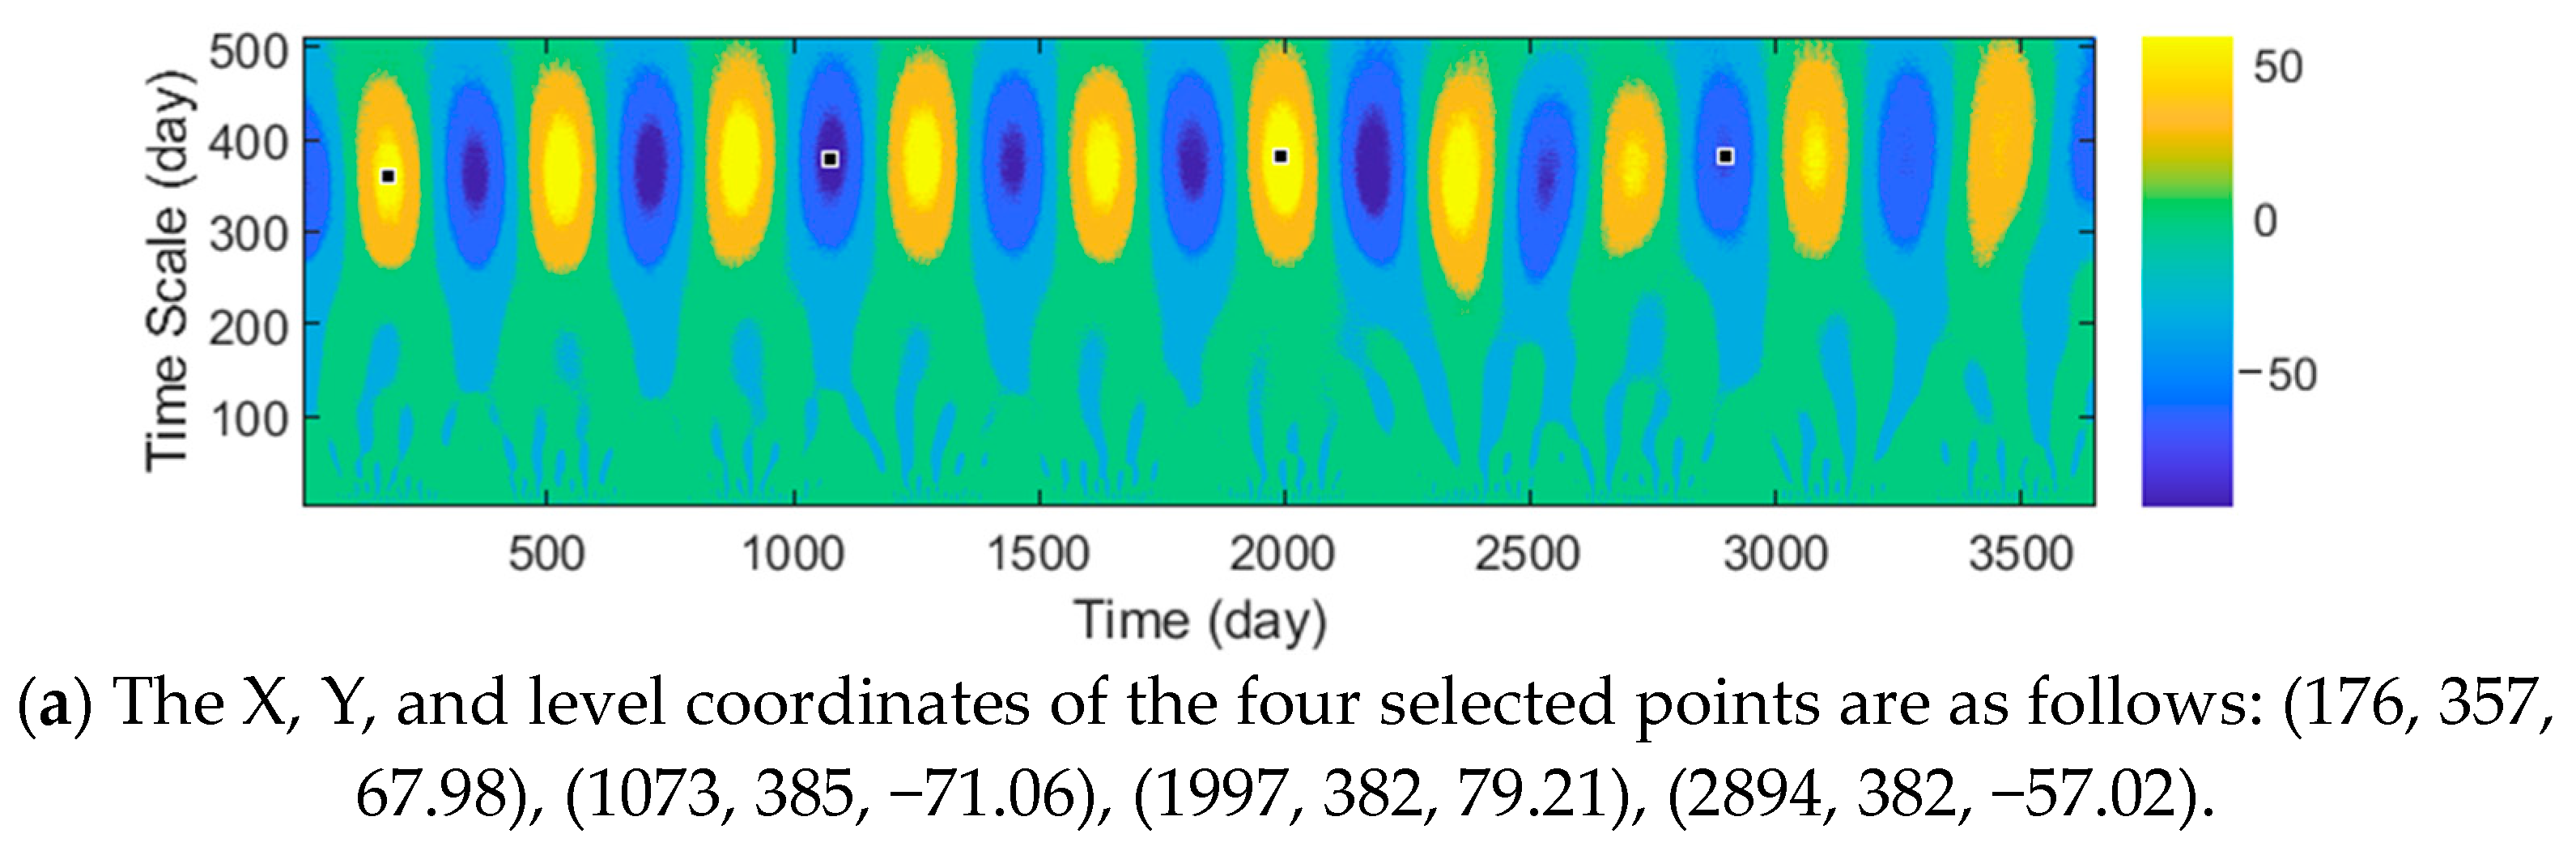
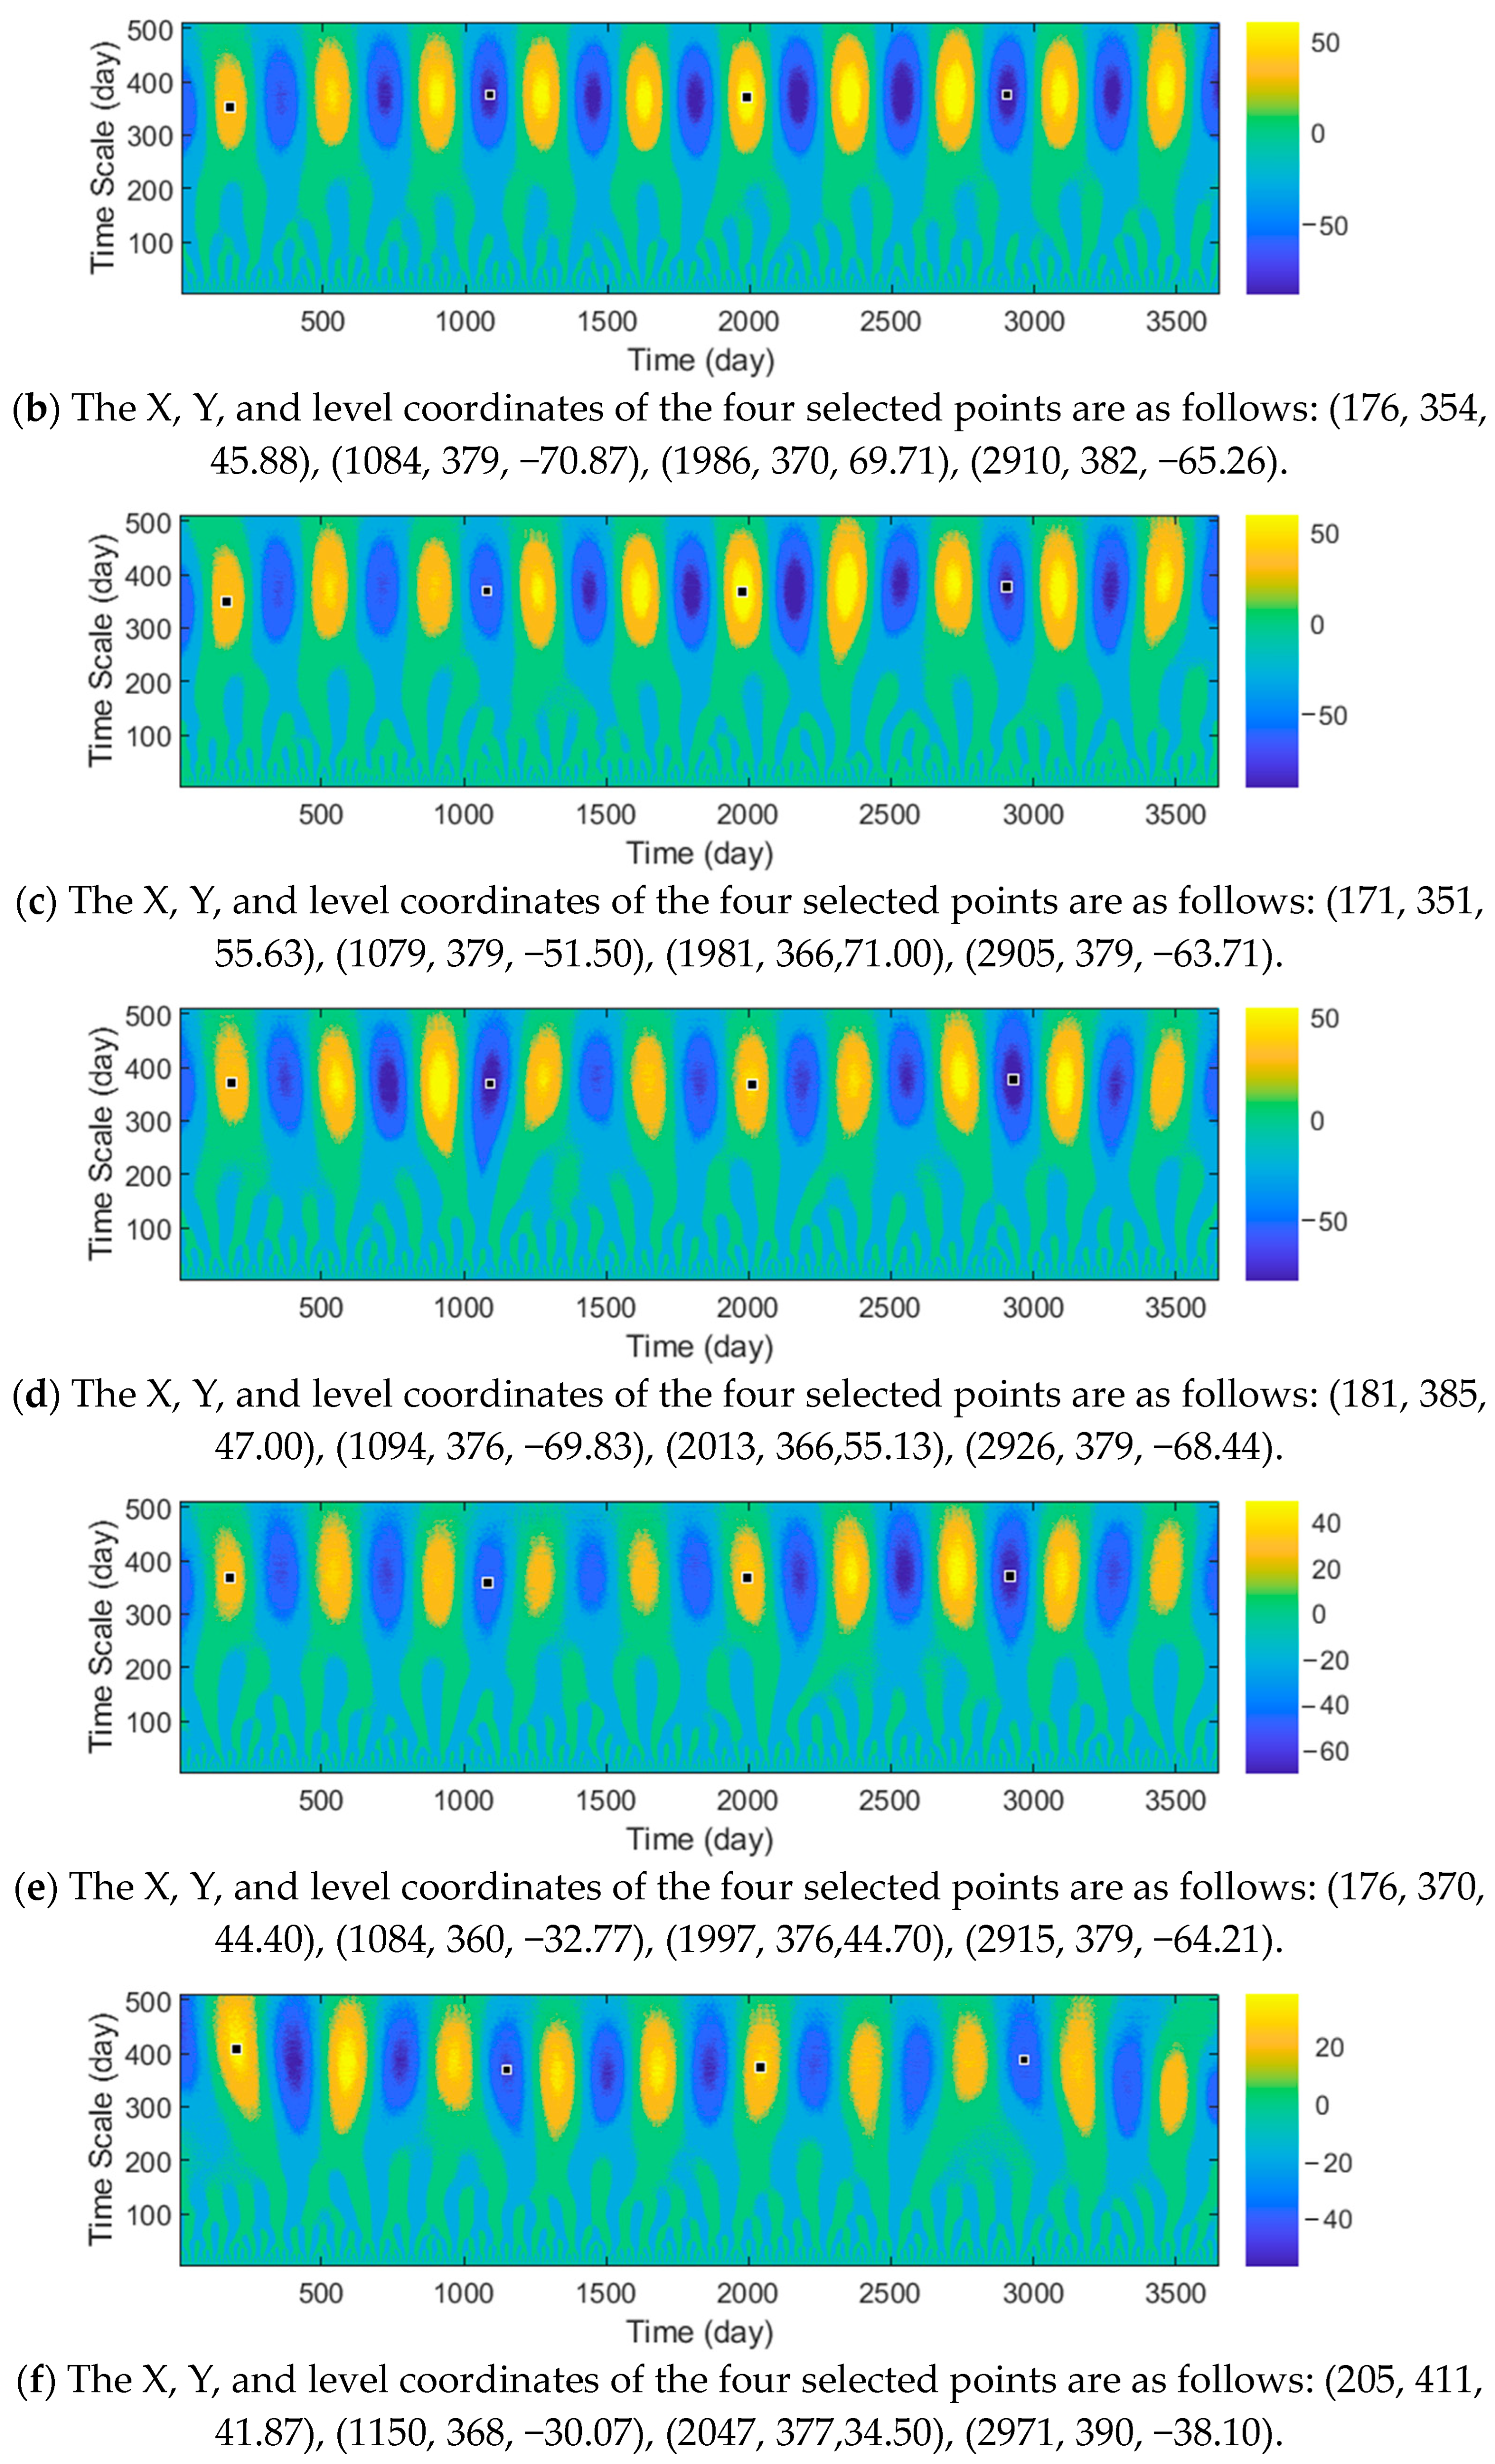
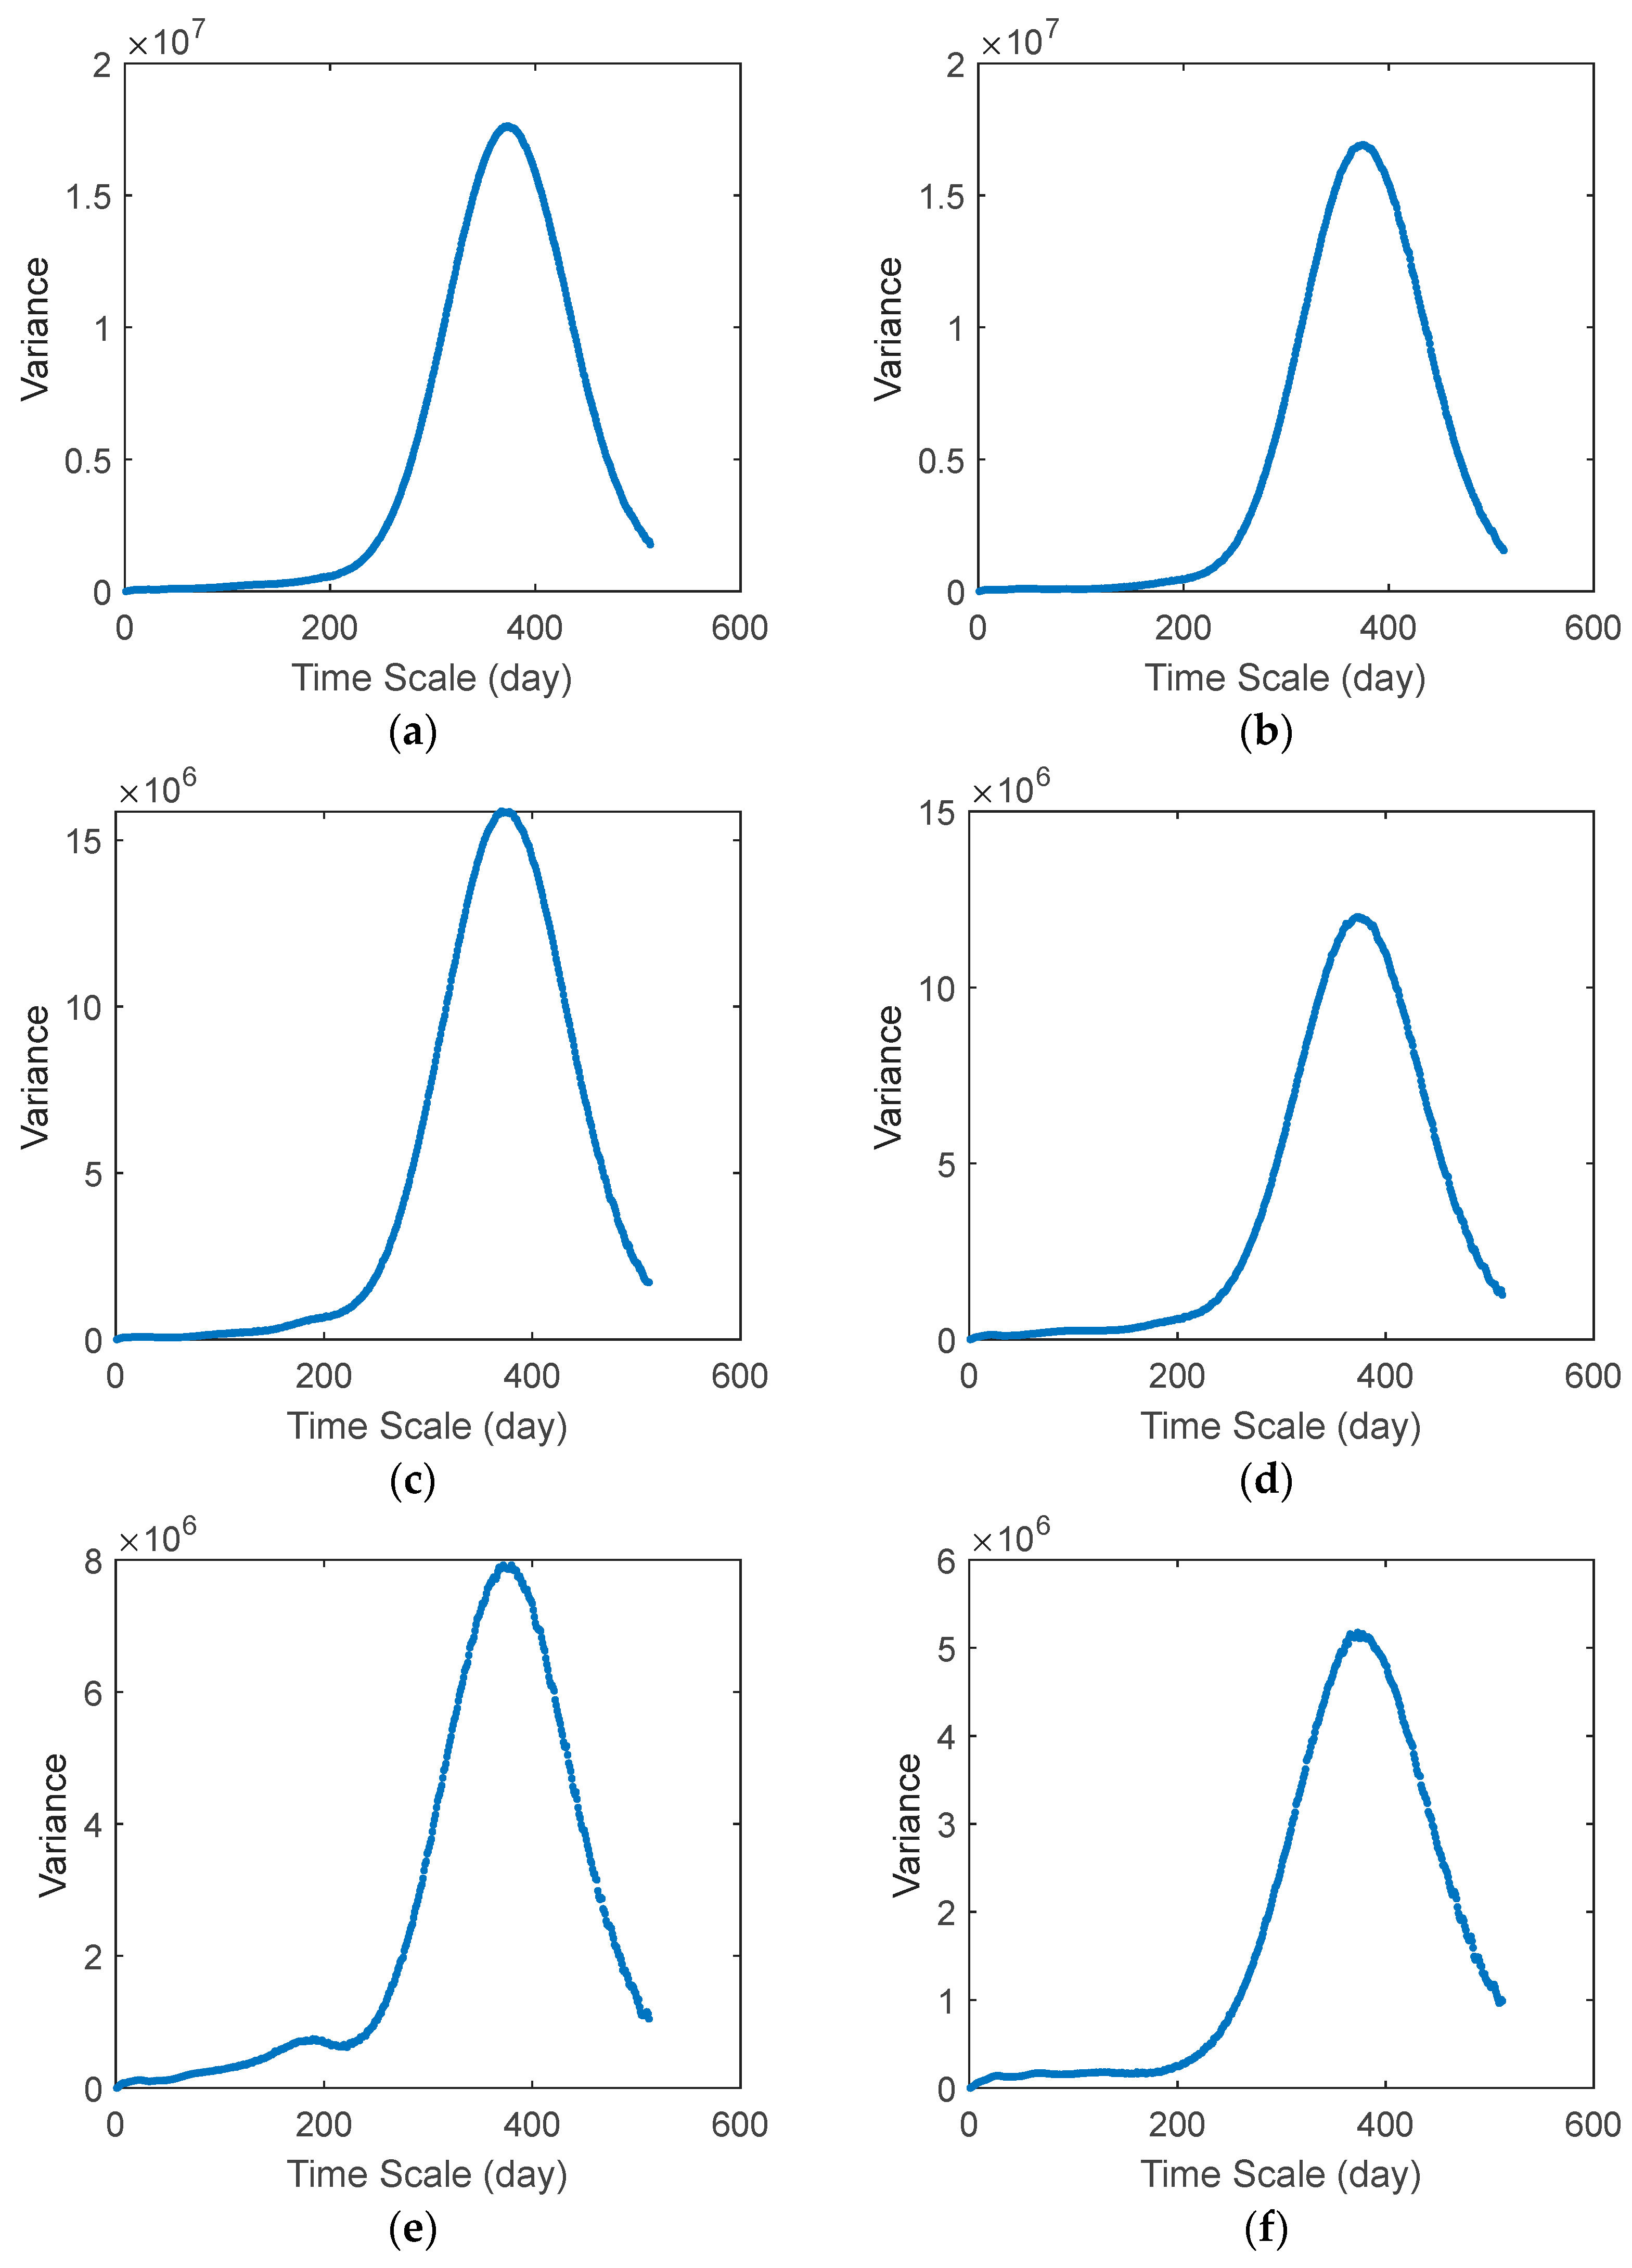
4.2. Periodicity Characteristics of Global Solar Radiation

The periodic variation of meteorological elements is a common phenomenon. The investigation into the periodic fluctuation of solar radiation holds significant importance for effectively harnessing solar energy resources and developing rational composite energy application schemes. The real part contour maps of continuous Morlet wavelet transform coefficients for Harbin, Shenyang, Beijing, Wuhan, Shanghai, and Guangzhou are depicted in Figure 3a–f, showcasing the periodic variations in daily global solar radiation over time comprehensively. The horizontal axis represents time in days, while the vertical axis signifies the wavelet scale. The color bars in the six figures are very similar, from top to bottom, indicating that the daily global solar radiation gradually decreases. At the two endpoints, bright yellow indicates the maximum daily global solar radiation, while dark blue indicates the minimum. It can be seen that the daily global solar radiation of these six cities exhibits distinct characteristics of annual cyclical oscillation. According to the data of the daily global solar radiation for the six cities shown in the figures, the two warm centers of Beijing appeared the earliest, around 20 June 2011 and 3 June 2016, respectively, about 5 days ahead of Shenyang, which ranked second. The two warm centers in Harbin and Shanghai appeared on almost the same date, both appearing near June 25 2011 and 19 June 2016, respectively. The two warm centers in Wuhan appeared near each other on June 30 2011 and 5 July 2016. The latest warm center appeared in Guangzhou; the two warm centers appeared on 24 July 2011 and 8 August 2016, respectively, significantly lagging behind the other five cities. The two cold centers in Harbin appeared the earliest, near 7 December 2013 and 3 December 2018. Subsequently, Beijing experienced its coldest temperatures on 13 December 2013 and 14 December 2018; Shenyang on 18 December 2013 and 19 December 2018; Shanghai on 8 December 2013 and 24 December 2018; Wuhan on 28 December 2013 and 4 January 2019; and Guangzhou on 22 February 2014 and 18 February 2019. It is evident that while the order of morning and evening warm and cold centers for daily global solar radiation in these six cities may be not absolute or consistent within each city, the overall trend indicates a gradual delay from north to south with changing geographical latitudes. In terms of daily global solar radiation at the cold and warm centers, Harbin exhibited the highest value, followed by Beijing, Shenyang, Wuhan, Shanghai, and Guangzhou. Cold centers can be categorized into an equivalent tier consisting of Harbin, Shenyang, and Wuhan with relatively low levels of daily global solar radiation; while Beijing, Shanghai, and Guangzhou follow with higher values. The largest disparity in daily global solar radiation between warm and cold centers was observed in Harbin, while the smallest difference was found in Guangzhou. The values of the warm and cold centers of daily global solar radiation do not exhibit a simple geographical pattern, as observed in contrast to their occurrence time. This suggests that other geographical and meteorological factors may also influence the values of the warm and cold centers.
Figure 4a–f are the variance curves corresponding to the wavelet coefficients real part in Figure 3a–f, where the abscissa represents the wavelet time scale and the ordinate represents the variance. It can be observed that, except for Shanghai—which exhibits a weak sub-peak near the 183 day, indicating a semi-annual period—the real part variance curves of wavelet coefficients for the other five cities only exhibit a main peak near an annual period. Among them, Harbin and Shenyang demonstrate remarkable stability with minimal fluctuations, whereas Beijing, Wuhan, and Guangzhou display slight variations within a range of 0 to 183 days without any discernible cyclical pattern. Furthermore, it is worth mentioning that all six cities exhibit large variance values near the annual cycle, indicating a high level of stability in global solar radiation throughout the annual period. Additionally, there is an evident gradual decrease in geographical location from north to south regarding this trend.

4.3. Seasonal Variation of Global Solar Radiation

Figure 5 shows the monthly average value of the daily global solar radiation of Harbin, Shenyang, Beijing, Wuhan, Shanghai, and Guangzhou during the ten years from January 2011 to December 2020. It can be observed that the highest monthly average values of daily global solar radiation for these cities were recorded in June (20.52 MJ/m2), May (21.52 MJ/m2), May (22.11 MJ/m2), July (18.45 MJ/m2), July (17.28 MJ/m2), and July (16.79 MJ/m2), respectively, throughout the year. Notably, Beijing experienced the maximum monthly average value of daily global solar radiation among all six cities in May. The lowest monthly average values of the daily global solar radiation in six cities over a ten-year period were as follows: Harbin in December (5.70 MJ/m2), Shenyang in December (6.91 MJ/m2), Beijing in December (7.45 MJ/m2), Wuhan in December (6.27 MJ/m2), Shanghai in January (7.48 MJ/m2), and Guangzhou in March (8.70MJ/m2). Among these cities, Harbin had the lowest monthly average value of daily global solar radiation during the month of December. Except for Shanghai, which exhibited a relatively pronounced fluctuation in June, the monthly average value of daily global solar radiation in the remaining five cities demonstrated almost continuous variations. This is consistent with the semi-annual cyclical fluctuation shown in the wavelet coefficients variance graph for Shanghai in Figure 4. The primary challenge for achieving optimal utilization of solar energy resources lies in integrating energy usage during months characterized by low average solar radiation but high energy demand. Therefore, Harbin, which experiences the lowest monthly average daily global solar radiation among these six cities, and a strong demand for energy consumption in the cold winter climate, was selected for further investigation.

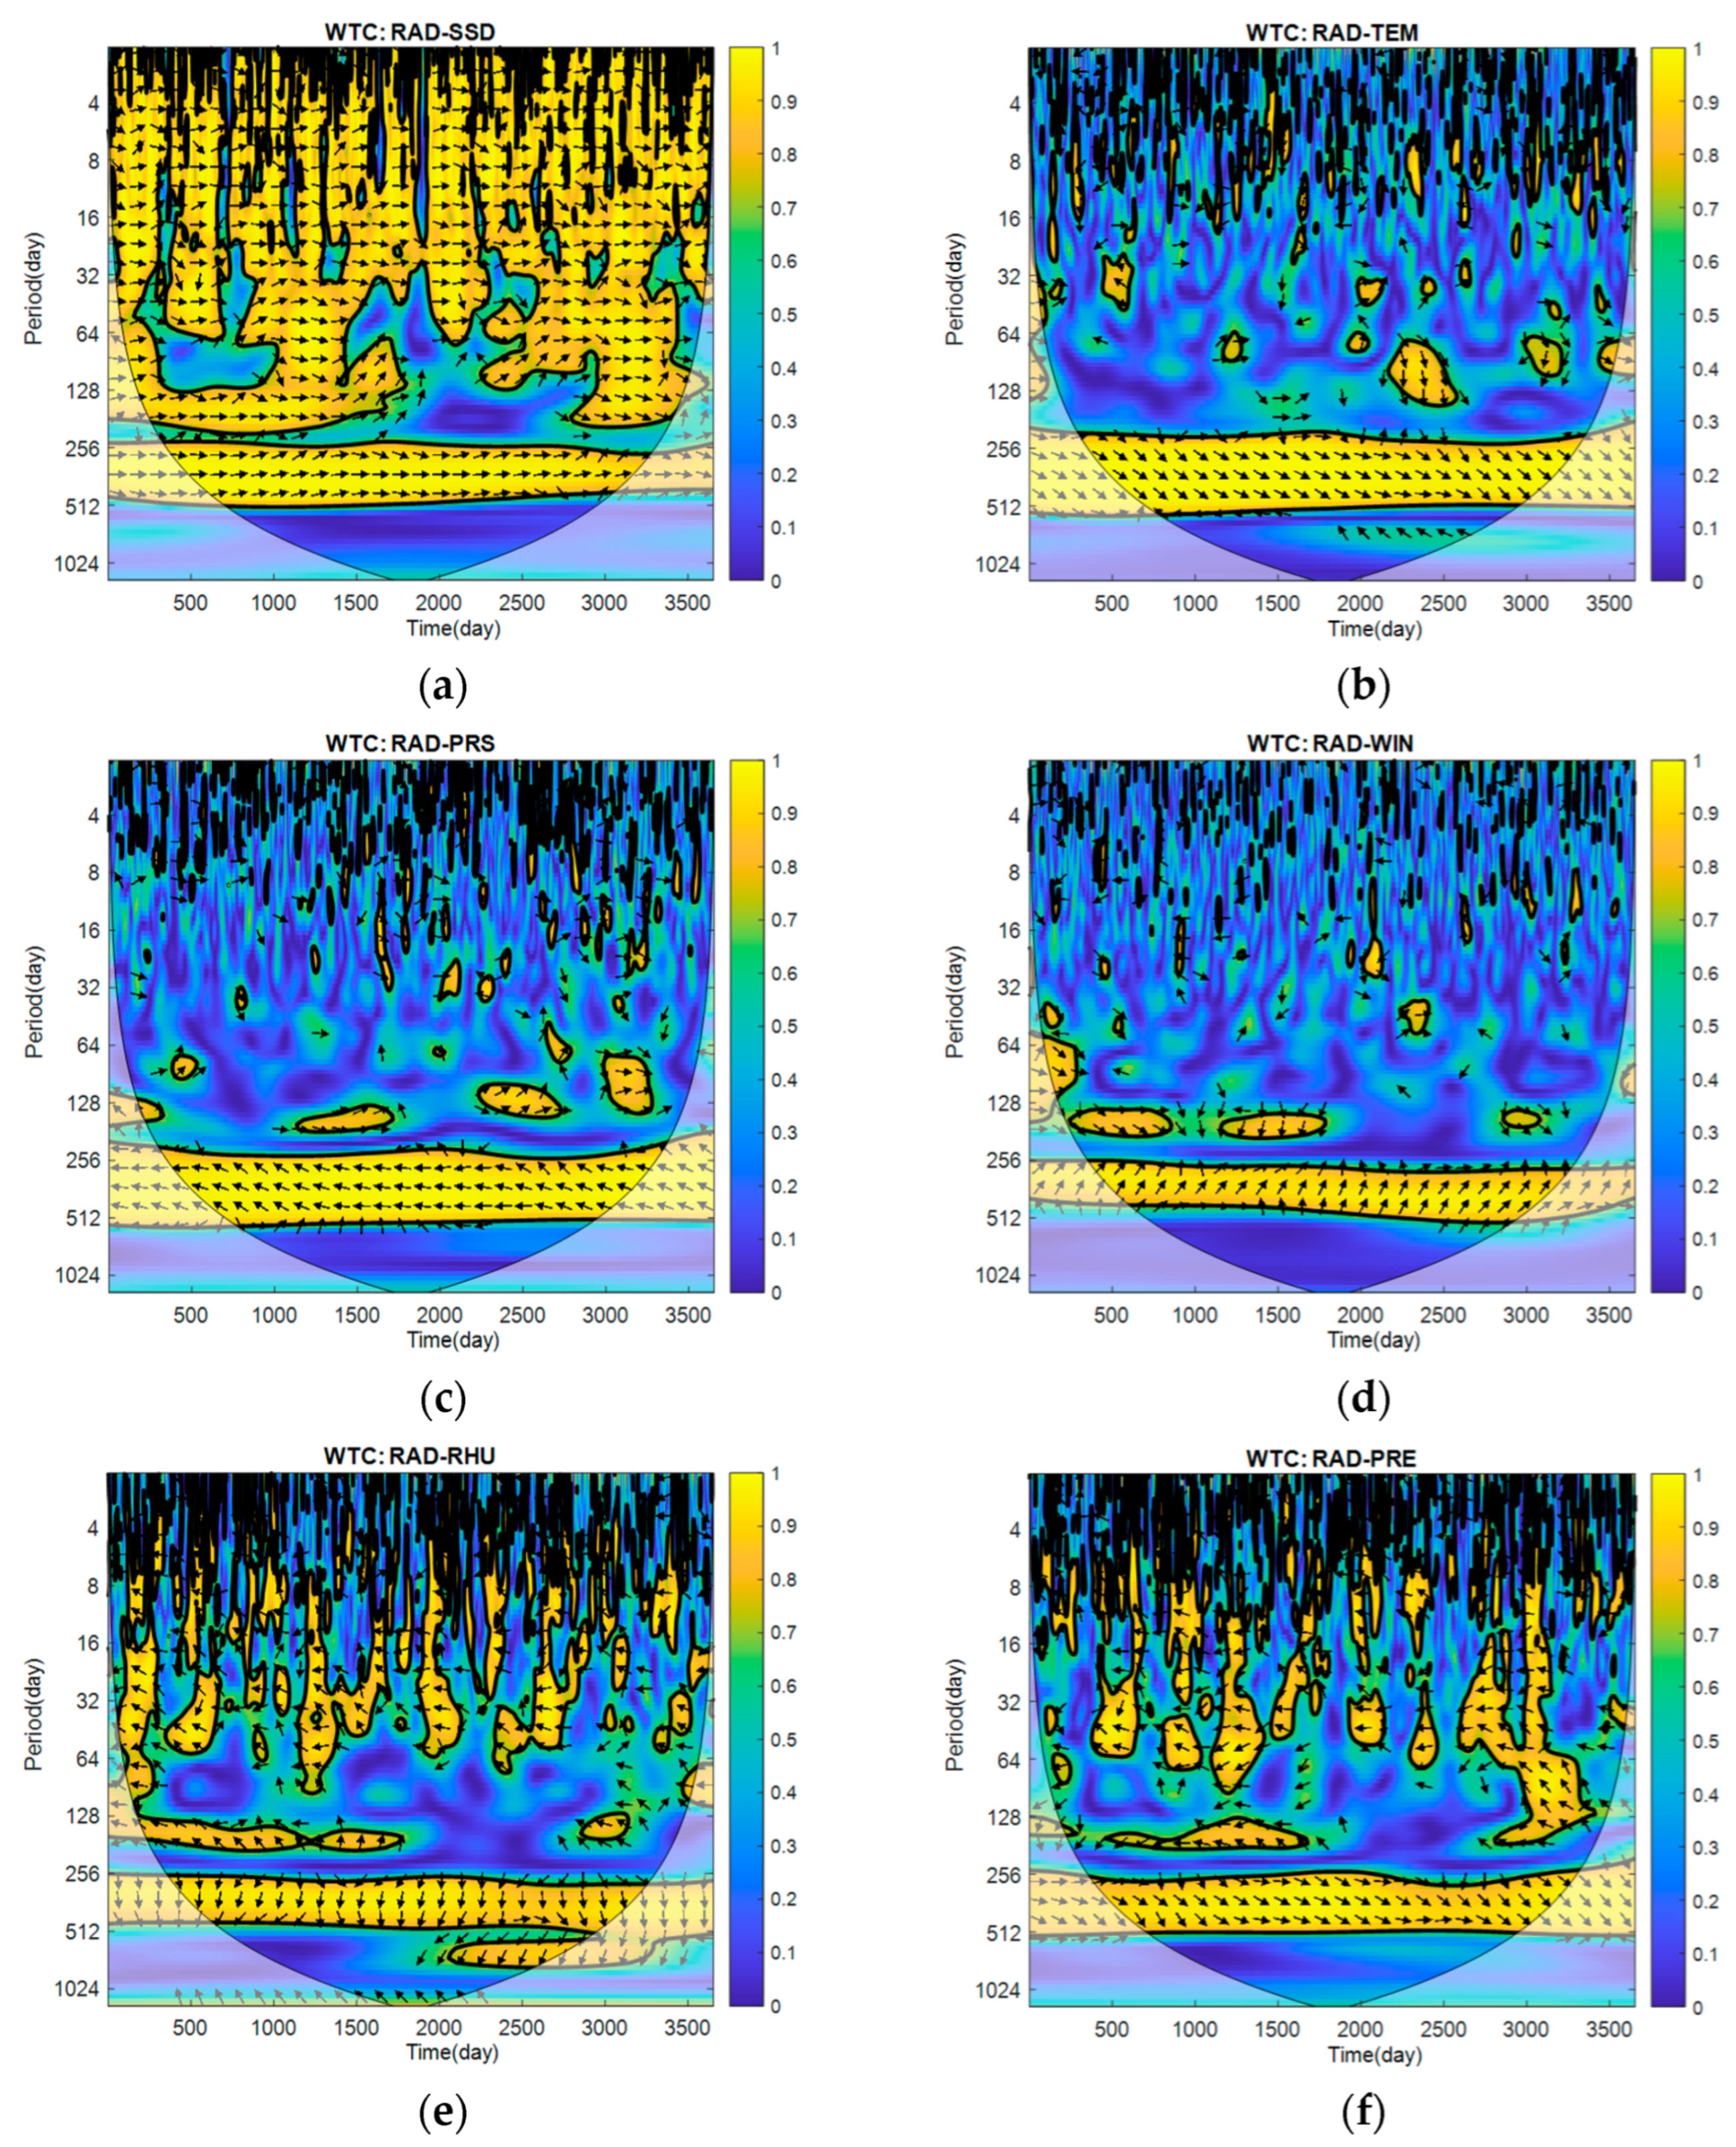
4.4. Wavelet Coherence Analysis of Daily Global Solar Radiation with other Meteorological Factors

In this study, the wavelet coherence method was used to analyze the correlation between global solar radiation and various meteorological factors (including sunshine duration, air temperature, atmospheric pressure, wind speed, humidity, and precipitation) in Harbin from January 2011 to December 2020. The results are illustrated in Figure 6a–f, which effectively demonstrate the association between daily global solar radiation and different meteorological variables across distinct time periods and scales.
As can be seen from Figure 6, the coherence spectra of six pairs of meteorological factors, consisting of global daily radiation with sunshine duration, air temperature, atmospheric pressure, wind speed, humidity, and precipitation, have all shown that they have a significant high region between 256 and 512 days, indicating that their correlations are mainly concentrated around the annual cycle. The analysis of Figure 6a reveals a strong positive correlation between daily global solar radiation and sunshine duration across almost all study periods. It can be seen from the figure that in the period of 0–512 days, most arrows are only going east, which indicates that the two series have the same phase relationship during the entire period, with significant coherence and no obvious dominant relationship. However, it is not difficult to find from Figure 6b–d that the relationship between daily global solar radiation and the three meteorological factors, air temperature, atmospheric pressure, and wind speed, predominantly exhibits an annual cycle pattern, with no consistent significant correlation observed on other temporal scales. In the coherence spectrum of daily global solar radiation and air temperature, it can be observed that in the high region of the annual cycle, the arrows point to the southeast, with a phase angle of about 30°~45°. This suggests that daily global solar radiation is 1 to 1.5 months ahead of daily average air temperature, and that they are positively correlated. The wavelet coherence spectrum between daily global solar radiation and atmospheric pressure reveals a significant northwestward arrow in the high region of 256 to 512 days, indicating that the phases of the two sequences are approximately opposite and negatively correlated. This means that during seasons with high global solar radiation, the atmospheric pressure tends to be lower, whereas in winter, when global solar radiation is low, the air pressure relatively increases. Further, in the coherent image of global solar radiation and wind speed, the arrows of the annual period point to the northeast, and the phase angle is about 300 degrees, indicating that the two sequences are positively correlated in the annual cycle and that the wind speed is about 2 months ahead of the global solar radiation. Figure 6e shows the wavelet coherence spectrum between global solar radiation and relative humidity. These two sequences show some correlation throughout the study time period, with the most stable coherence near the annual period, all arrows indicate a southward direction, indicating that daily global solar radiation was about 90 days ahead of the relative humidity. On time scales shorter than the annual cycle, most arrows point towards the northwest, suggesting that relative humidity approximately reverses global solar radiation in the short term. Figure 6f shows the wavelet coherence spectrum between global solar radiation and precipitation, which also shows the most stable high region near the annual cycle, and global solar radiation dominates the precipitation for about 30–45 days.
According to the wavelet coherence spectrum analysis between the global solar radiation and six other meteorological factors in Harbin over the last ten years, global solar radiation and the other six series have strong correlations over the annual period, but their dominant relationships are different. Global solar radiation and sunshine time show good phase consistency across the whole time period, in which the correlation between the two meteorological factors is the strongest. In the annual period, global solar radiation slightly ahead of atmospheric temperature and precipitation, and shows a complete negative correlation with atmospheric pressure. Furthermore, wind speed leads global solar radiation by 1 to 3 months, while the relationship between global solar radiation and air humidity is more intricate, with no apparent dependency. In addition, both air humidity and precipitation are approximately negatively correlated with global solar radiation over shorter time periods, which is completely different from the correlation shown in the annual period.

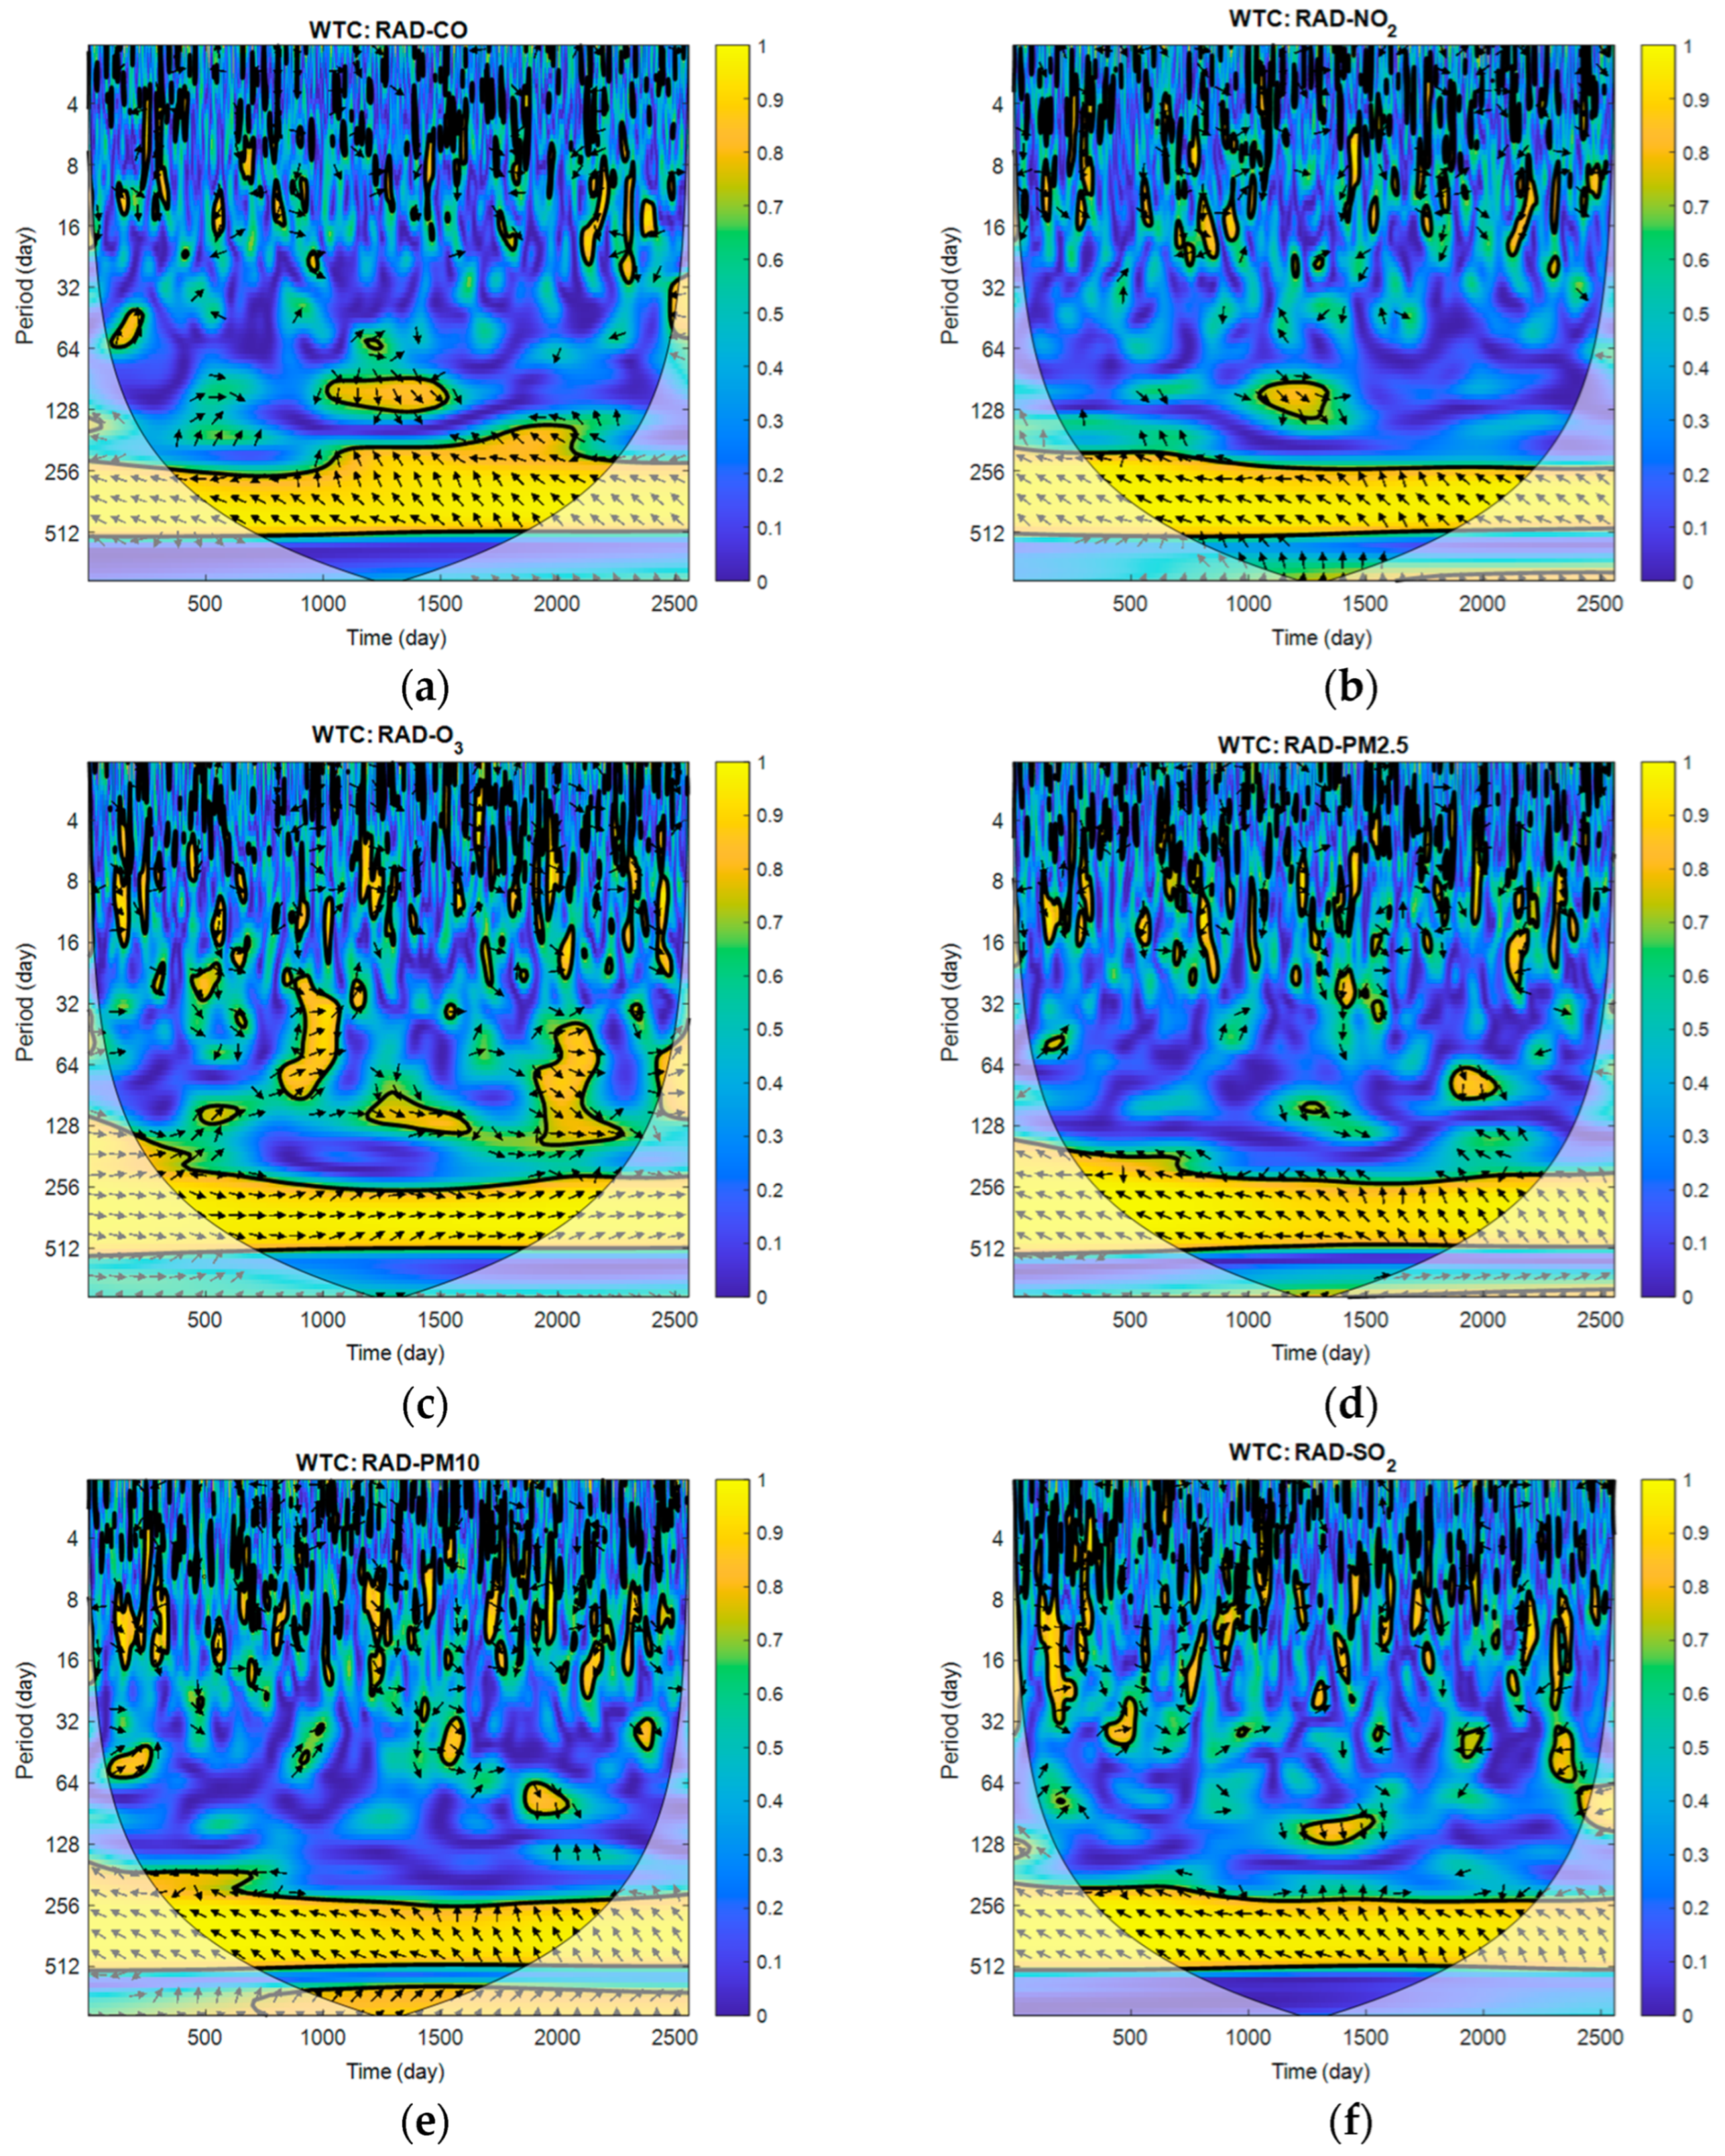
4.5. Wavelet Coherence Analysis of Daily Global Solar Radiation with Air Pollutants

Many environmental factors, especially air pollutants, have a negative impact on the efficiency of photovoltaic power generation. In this section, we investigate the correlation between global solar radiation and major air pollutants (including CO, NO2, O3, PM2.5, PM10, and SO2) in Harbin from January 2014 to December 2020. Figure 7a–f illustrates the corresponding research results. It is evident from the figure that the coherence between global solar radiation and several air pollutants primarily manifests on the annual cycle time scale. Among them, five air pollutants, including CO, NO2, PM2.5, PM10, and SO2, exhibited very similar correlations with global solar radiation. Over the time span of 256 to 512 days, the arrows in their wavelet coherence spectra consistently point towards the northwest, at an angle ranging from 210 to 225 degrees. This indicates that all five air pollutants are approximately negatively correlated with global solar radiation. Additionally, only O3 demonstrated a positive correlation with global solar radiation on the annual cycle time scale, and there was no obvious dependency between them.
After conducting the aforementioned analysis, we observed a negative correlation between air quality and global solar radiation in Harbin on the whole. This finding aligns with the fact that Harbin experiences a cold winter climate, limited sunshine duration, and the significant emission of air pollutants due to fossil fuel-based heating practices.

5. Conclusions

In this study, the temporal variation of global solar radiation in six important cities located in the solar-energy-available region of China was investigated. Furthermore, Harbin, as the most representative city, was selected in order to examine the correlation between global solar radiation, and other prominent meteorological and air quality factors, using wavelet coherence analysis. The results indicate that global solar radiation exhibits multi-scale characteristics, and there exists a correlation between global solar radiation and other meteorological factors, as well as atmospheric pollutants on various time scales. The research findings can be summarized as follows:
(1)
From the macro perspective, the cities of Harbin, Shenyang, and Beijing, characterized by lower average annual temperatures, exhibit higher annual global solar radiation compared to Wuhan, Shanghai, and Guangzhou, which are geographically closer to the equator. Notably, among these six cities, Wuhan—renowned as one of China’s four furnaces—possesses the lowest annual solar energy reserves. The coherence spectrum analysis of global solar radiation and other meteorological factors in Harbin reveals a strong correlation between global solar radiation and sunshine duration throughout the entire temporal domain. Although the atmospheric temperature is also positively correlated with the global solar radiation, the latter exerts dominant with more intricate influencing factors. This explains the phenomenon of lower global solar radiation in southern China, despite its higher annual average atmospheric temperature.
(2)
There exists a positive correlation trend in the annual cycle between global solar radiation and wind speed, with the latter leading by approximately 2 months. This suggests that Harbin’s wind energy reserves are also at a low level during winter when global solar radiation is low. Consequently, combining wind power and solar power generation may not be a feasible energy supply strategy in Harbin.
(3)
The correlation spectra between global solar radiation and six common atmospheric pollutants indicate that, with the exception of O3 and global solar radiation, the remaining five atmospheric pollutants exhibit a significant negative correlation with global solar radiation. This observation aligns with the actual conditions in Harbin, where decreased air transmission resulting from increased air pollution caused by heightened fossil fuel consumption during the cold winter has led to a reduction in levels of global solar radiation. By implementing comprehensive planning strategies that prioritize the utilization of natural gas and other clean energy sources instead of coal, oil, and other fossil fuels during periods when solar energy reserves are limited in Harbin’s winters, not only can the overall availability of global solar radiation in the region be enhanced, but also some degree of air quality improvement can be achieved.
(4)
Global solar radiation exhibits a negative correlation with atmospheric pressure in the annual cycle, as well as with air humidity and precipitation over shorter time periods. Despite the unavoidable influences of the three meteorological factors on global solar radiation, these relatively stable correlation relationships can be utilized for the long-term and short-term prediction of global solar radiation.
This present study provides insights into the dominant relationship between daily global solar radiation and six meteorological factors, as well as six air quality factors, on both long and short time scales. These findings are valuable for the selection process of relevant factors that influence changes in regional global solar radiation during prediction, and assigning appropriate weights based on their relative importance. For instance, short-term forecasting models should prioritize factors that are correlated with global solar radiation on shorter time scales, while long-term forecasting models should consider their correlations across multiple time scales. Furthermore, studying the spatio-temporal variation of global solar radiation within available areas for harnessing solar energy provides a foundation for formulating comprehensive cross-regional programs and policies for utilizing solar energy resources effectively. The proposed research methodology possesses broad applicability for the analysis and planning of comprehensive solar energy resource utilization across diverse regions and climatic conditions.

Author Contributions

Conceptualization, H.X. and H.N.; methodology, G.L.; software, H.N.; writing—original draft preparation, H.X.; writing—review and editing, G.L.; investigation, D.Q.; resources, H.N.; supervision, H.N.; funding acquisition, H.N. All authors have read and agreed to the published version of the manuscript.

Funding

This work is supported by the Fundamental Research Funds for the Central Universities (No. 2572022BC03), the Innovation Training program for college students of Northeast Forestry University (No. 202210225163), and the Project of National Natural Science Foundation of China (No. 31570712).

Institutional Review Board Statement

Not applicable.

Informed Consent Statement

Not applicable.

Data Availability Statement

Restrictions apply to the availability of the data. Meteorological factor data were obtained from the National Meteorological Information Center of China and are available [from the authors/at http://data.cma.cn/, accessed on 21 April 2021] with the permission of the National Meteorological Information Center of China. Air quality factor data were obtained from the China Air Quality Online Monitoring and Analysis Platform and are available [from the authors/at https://www.aqistudy.cn/, accessed on 2 February 2022] with the permission of the China Air Quality Online Monitoring and Analysis Platform.

Acknowledgments

The authors would like to express their gratitude to the National Meteorological Information Center for providing the meteorological data for this study.

Conflicts of Interest

The authors declare no conflicts of interest.

References

  1. Gilgen, H.; Wild, M.; Ohmura, A. Means and Trends of Shortwave Irradiance at the Surface Estimated from Global Energy Balance Archive Data. J. Clim. 1998, 11, 2042–2061. [Google Scholar] [CrossRef]
  2. Luo, L.C.; Hamilton, D.; Han, B.P. Estimation of total cloud cover from solar radiation observations at Lake Rotorua, New Zealand. Sol. Energy 2010, 84, 501–506. [Google Scholar] [CrossRef]
  3. Tang, W.J.; Yang, K.; Qin, J.; Li, X.; Niu, X.L. A 16-year dataset (2000–2015) of high-resolution (3h, 10km) global surface solar radiation. Earta Syst. Sci. Data 2019, 11, 1905–1915. [Google Scholar] [CrossRef]
  4. Mukrimin, S.G. Solar power and application methods. Renew. Sustain. Energy 2016, 57, 776–785. [Google Scholar] [CrossRef]
  5. Demirbas, M.F. Electricity production using solar energy. Energy Sources Part A-Recovery Util. Environ. Eff. 2007, 29, 563–569. [Google Scholar] [CrossRef]
  6. Hepbasli, A.; Alsuhaibani, Z. A key review on present status and future directions of solar energy studies and applications in Saudi Arabia. Renew. Sustain. Energy Rev. 2011, 15, 5021–5050. [Google Scholar] [CrossRef]
  7. Radzi, A.R.; Nor, A.C.S.; Syahrullail, S. Recent progress on concentrating direct absorption solar collector using nanofluids. J. Therm. Anal. Calorim. 2019, 137, 903–922. [Google Scholar] [CrossRef]
  8. Li, G.Q.; Li, M.; Taylor, R.; Hao, Y.; Giorgio, B.; Markides, C.N. Solar energy utilisation: Current status and roll-out potential. Appl. Therm. Eng. 2022, 209, 118285. [Google Scholar] [CrossRef]
  9. Chen, J.L.; Li, G.S. Estimation of monthly average daily solar radiation from measured meteorological data in Yangtze River Basin in China. Int. J. Climatol. 2013, 33, 487–498. [Google Scholar] [CrossRef]
  10. Mohammadi, K.; Khorasanizadeh, H.; Shamshirband, S.; Tong, C.W. Expression of Concern: Influence of introducing various meteorological parameters to the Angstrom-Prescott model for estimation of global solar radiation. Environ. Earth Sci. 2019, 78, 1. [Google Scholar] [CrossRef]
  11. Zeki, A.D.; Hussein, A.K.; Sopian, K.; Al-Goul, M.A.; Hussain, A. Effect of dust pollutant type on photovoltaic performance. Renew. Sustain. Energy Rev. 2015, 41, 735–744. [Google Scholar] [CrossRef]
  12. Coskun, C.; Oktay, Z.; Dincer, I. Estimation of monthly solar radiation distribution for solar energy system analysis. Energy 2011, 36, 1319–1323. [Google Scholar] [CrossRef]
  13. Matuszko, D. Long-term variability in solar radiation in Krakow based on measurements of sunshine duration. Int. J. Climatol. 2014, 34, 228–234. [Google Scholar] [CrossRef]
  14. Shen, Y.B.; Wang, B. Effect of surface solar radiation variations on temperature in South-East China during recent 50 years. Chin. J. Geophys. Chin. Ed. 2011, 54, 1457–1465. [Google Scholar] [CrossRef]
  15. Qi, Y.; Fang, S.B.; Zhou, W.Z. Correlative analysis between the changes of surface solar radiation and its relationship with air pollution, as well as meteorological factor in eastern and western China in recent 50 years. Acta Phys. Sin. 2015, 64, 089201. [Google Scholar] [CrossRef]
  16. Sweerts, B.; Pfenninger, S.; Yang, S.; Folini, D.; Zwaan, B.V.; Wild, M. Estimation of losses in solar energy production from air pollution in China since 1960 using surface radiation data. Nat. Energy 2019, 4, 657–663. [Google Scholar] [CrossRef]
  17. Rudy, C.; Francois, G.S.; Huang, Y.X.; Ted, S. Intermittency study of high frequency global solar radiation sequences under a tropical climate. Sol. Energy 2013, 98, 349–365. [Google Scholar] [CrossRef]
  18. Tsung, E.H.; Bianca, F.; Keh, C.C. Generation of a Typical Meteorological Year for Global Solar Radiation in Taiwan. Energies 2023, 16, 2986. [Google Scholar] [CrossRef]
  19. Shen, Y.B.; Wang, C.H.; Chen, Y. Variation of surface solar radiation and its influence on temperature change in three provinces of Northeast China. Sci. Geogr. Sin. 2023, 11, 2045–2052. [Google Scholar] [CrossRef]
  20. Lgnacio, L.C.; Michael, T.C.; Michael, R.; Moetasim, A.; Fulden, B.; Sue, E.H.; Caroline, D.; Bri-Mathias, H.; Carlo, B. Potential impacts of climate change on wind and solar electricity generation in Texas. Clim. Chang. 2020, 163, 745–766. [Google Scholar] [CrossRef]
  21. Yang, X.; Zhao, C.F.; Zhou, L.J.; Wang, Y.; Liu, X.H. Distinct impact of different types of aerosols on surface solar radiation in China. J. Geophys. Res. Atmos. 2016, 121, 6459–6471. [Google Scholar] [CrossRef]
  22. Luo, H.; Han, Y.; Lu, C.S.; Yang, J.; Wu, Y.H. Characteristics of surface solar radiation under different air pollution conditions over Nanjing, China: Observation and simulation. Adv. Atmos. Sci. 2019, 36, 1047–1059. [Google Scholar] [CrossRef]
  23. Zhao, Q.; Yao, W.X.; Zhang, C.X.; Wang, X.; Wang, Y. Study on the influence of fog and haze on solar radiation based on scattering-weakening effect. Renew. Energy 2019, 134, 178–185. [Google Scholar] [CrossRef]
  24. Zhou, L.H.; Sun, L.; Luo, Y.; Xia, X.; Huang, L.; Liao, Z.Y.; Yan, X.H. Air pollutant concentration trends in China: Correlations between solar radiation, PM2.5 and O3. Air Qual. Atmos. Health 2023, 16, 1721–1735. [Google Scholar] [CrossRef]
  25. Mohamed, A.E. On the Linear and Nonlinear Interaction between Wind and Wave. J. Coast. Res. 2008, 24, 519–526. [Google Scholar] [CrossRef]
  26. Sabrine, J.; Manel, E.; Habib, A. Variability of Precipitation in Arid Climates Using the Wavelet Approach: Case Study of Watershed of Gabes in South-East Tunisia. Atmosphere 2017, 8, 178. [Google Scholar] [CrossRef]
  27. Song, X.S.; Zhang, C.H.; Zhang, J.Y.; Zou, X.J.; Mo, Y.C.; Tian, Y.M. Potential linkages of precipitation extremes in Beijing-Tianjin-Hebei region, China, with large-scale climate patterns using wavelet-based approaches. Theor. Appl. Climatol. 2020, 141, 1251–1269. [Google Scholar] [CrossRef]
  28. Najaf, I.; Zeeshan, F.; Farrukh, S.; Xin, H.; Umer, S.; Ma, L. The nexus between COVID-19, temperature and exchange rate in Wuhan city: New findings from partial and multiple wavelet coherence. Sci. Total Environ. 2020, 729, 138916. [Google Scholar] [CrossRef]
  29. Sun, Q.Q.; Zhang, P.; Wei, H.; Liu, A.X.; You, S.C.; Sun, D.F. Improved mapping and understanding of desert vegetation-habitat complexes from intraannual series of spectral endmember spare using cross-wavelet transform and logistic regression. Remote Sens. Environ. 2020, 236, 111516. [Google Scholar] [CrossRef]
  30. Sreedevi, V.; Vahid, N. Multiscale coherence analysis of reference evapotranspiration of north-western Iran using wavelet transform. J. Water Clim. Chang. 2022, 13, 505–521. [Google Scholar] [CrossRef]
  31. Elena, E.B.; Shapovalov, S.N.; Kostuchenko, I.G. Solar Spectral Irradiance and Total Solar Irradiance at a Solar Minimum. Geomagn. Aeron. 2014, 54, 926–932. [Google Scholar] [CrossRef]
  32. Sajid, H.; Ali, A.A. A new approach for model validation in solar radiation using wavelet, phase and frequency coherence analysis. Appl. Energy 2016, 164, 639–649. [Google Scholar] [CrossRef]
  33. Chang, T.P.; Liu, F.J.; Ko, H.H.; Huang, M.C. Oscillation characteristic study of wind speed, global solar radiation and air temperature using wavelet analysis. Appl. Energy 2017, 190, 650–657. [Google Scholar] [CrossRef]
  34. Chen, X.B.; Yin, L.R.; Fan, Y.L.; Song, L.H.; Ji, T.T.; Liu, Y.; Tian, J.W.; Zheng, W.F. Temporal evolution characteristics of PM2.5 concentration based on continuous wavelet transform. Sci. Total Environ. 2020, 699, 134244. [Google Scholar] [CrossRef] [PubMed]
  35. Gao, M.L.; Gong, H.L.; Chen, B.B.; Li, X.J.; Zhou, C.F.; Shi, M.; Si, Y.; Chen, Z.; Duan, G.Y. Regional land subsidence analysis in eastern Beijing plain by InSAR time series and wavelet transforms. Remote Sens. 2018, 10, 365. [Google Scholar] [CrossRef]
  36. Wang, J.J.; Lu, X.M.; Yan, Y.T.; Zhou, L.G.; Ma, W.C. Spatiotemporal characteristics of PM2.5 concentration in the Yangtze River Delta urban agglomeration, China on the application of big data and wavelet analysis. Sci. Total Environ. 2020, 724, 138134. [Google Scholar] [CrossRef]
  37. Li, K.; He, F.N. Analysis on Mainland China’s Solar Energy Distribution and Potential to Utilize Solar Energy as an Alternative Energy Source. Prog. Geogr. 2010, 29, 1049–1054. [Google Scholar] [CrossRef]
  38. GB/T 31155-2014; Classification of Solar Energy Resources—Global Radiation. Standards Press of China: Beijing, China, 2014. Available online: https://openstd.samr.gov.cn/bzgk/gb/newGbInfo?hcno=8327621DA9761762427A760CC5F3FE73 (accessed on 6 June 2023).
Figure 1. Schematic diagram of annual solar radiation distribution in mainland China.
Applsci 14 04794 g001
Figure 2. Classified statistical of daily global solar radiation for the six cities (the grades are categorized based on Table 2).
Applsci 14 04794 g002
Figure 3. The real contour map of wavelet coefficients of daily global solar radiation in (a) Harbin, (b) Shenyang, (c) Beijing, (d) Wuhan, (e) Shanghai, and (f) Guangzhou.
Applsci 14 04794 g003aApplsci 14 04794 g003b
Figure 4. The variance of Morlet wavelet coefficients for daily global solar radiation in (a) Harbin, (b) Shenyang, (c) Beijing, (d) Wuhan, (e) Shanghai, and (f) Guangzhou.
Applsci 14 04794 g004
Figure 5. Monthly variation of daily global solar radiation for the six cities.
Applsci 14 04794 g005
Figure 6. Wavelet coherent power spectrum between daily global solar radiation and other meteorological factors, including (a) RAD-SSD, (b) RAD-TEM, (c) RAD-PRS, (d) RAD-WIN, (e) RAD-RHU and (f) RAD-PRE (where the abbreviations RAD, SSD, TEM, PRS, WIN, RHU, and PRE, respectively, represent global solar radiation, sunshine duration, air temperature, atmospheric pressure, wind speed, humidity, and precipitation).
Applsci 14 04794 g006
Figure 7. Wavelet coherent power spectrum between daily global solar radiation and air pollutants, including (a) RAD-CO, (b) RAD-NO2, (c) RAD-O3, (d) RAD-PM2.5, (e) RAD-PM10 and (f) RAD-SO2.
Applsci 14 04794 g007
Table 1. Grade of annual global solar radiation [38].
GradeThreshold (MJ/m2)Rank Symbol
Rich area G 6300 A
Relatively rich area 5040 G < 6300 B
Available area 3780 G < 5040 C
Poor area G < 3780 D
G represents the annual irradiation amount of global solar radiation, and the annual average value is adopted (30 year average is generally taken).
Table 2. Classification standard of daily global solar radiation [38].
GradeThreshold (MJ/m2)Grade
Rich D G 17.26 1
Relatively rich 13.81 D G < 17.26 2
Available 10.36 D G < 13.81 3
Poor D G < 10.36 4
DG represents the daily global solar radiation.
Disclaimer/Publisher’s Note: The statements, opinions and data contained in all publications are solely those of the individual author(s) and contributor(s) and not of MDPI and/or the editor(s). MDPI and/or the editor(s) disclaim responsibility for any injury to people or property resulting from any ideas, methods, instructions or products referred to in the content.

