

Filtering Efficiency and Design Properties of Medical- and Non-Medical-Grade Face Masks: A Multiscale Modeling Approach


Abstract
1. Introduction
2. Materials and Methods
2.1. Experimental Procedure
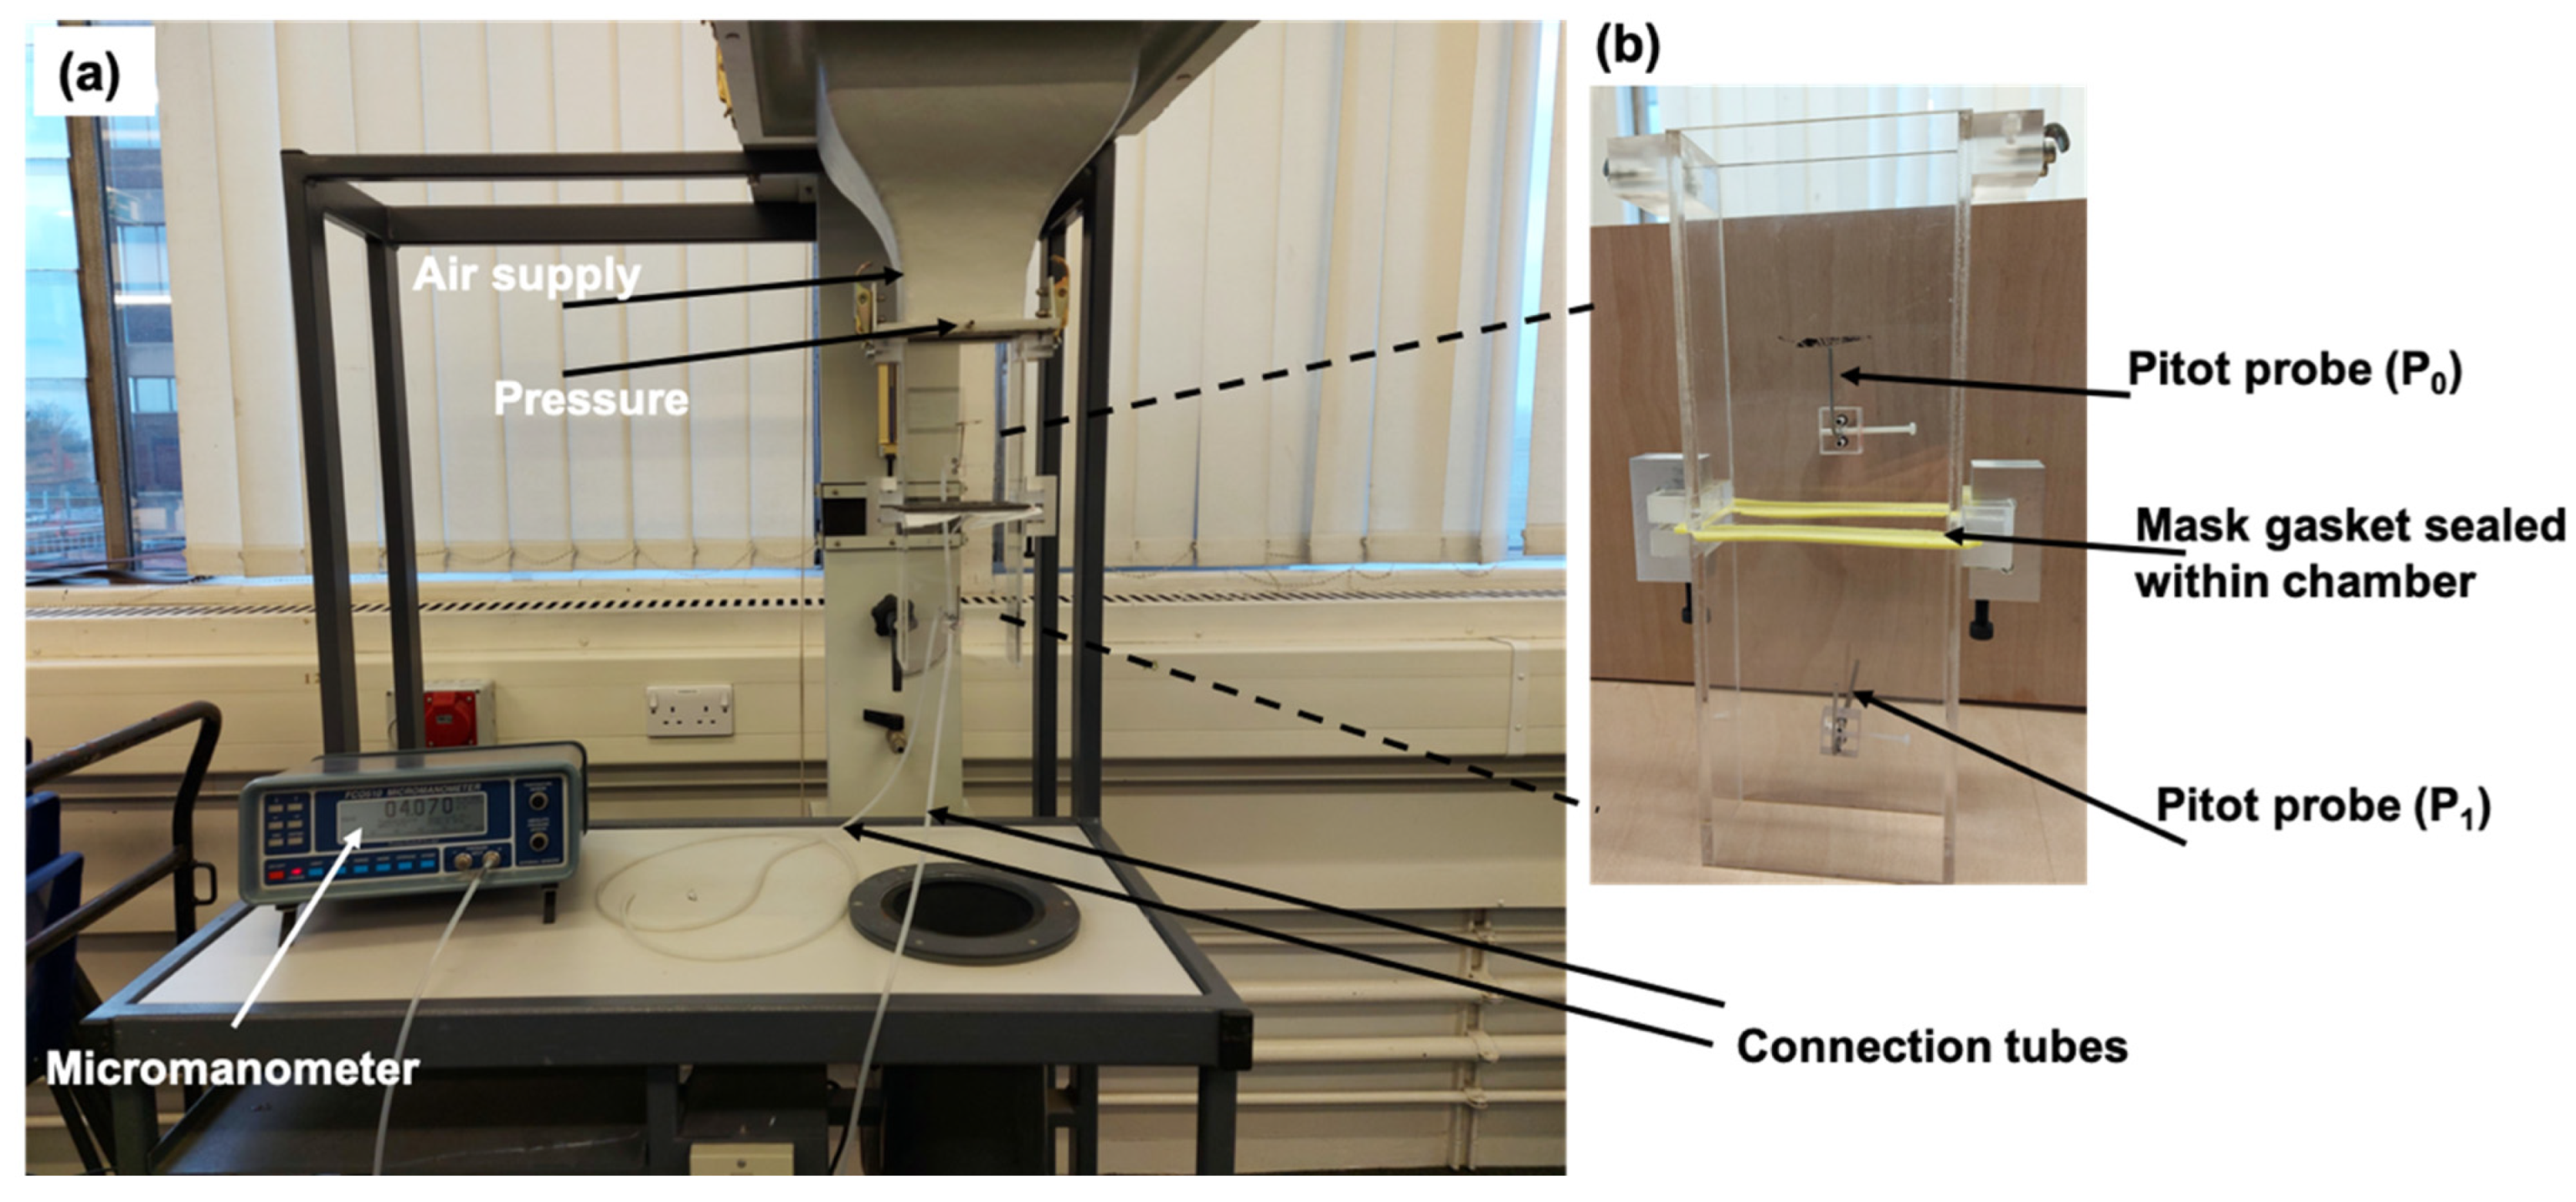
2.1.1. Air Flow Velocity Measurement Setup
2.1.2. Mathematical Analysis
2.1.3. Pressure/Velocity Measurement
Velocity Measurement Using Pitot Tubes
2.1.4. Particle Aerosol Spray
2.1.5. Mask Temperature Sensor
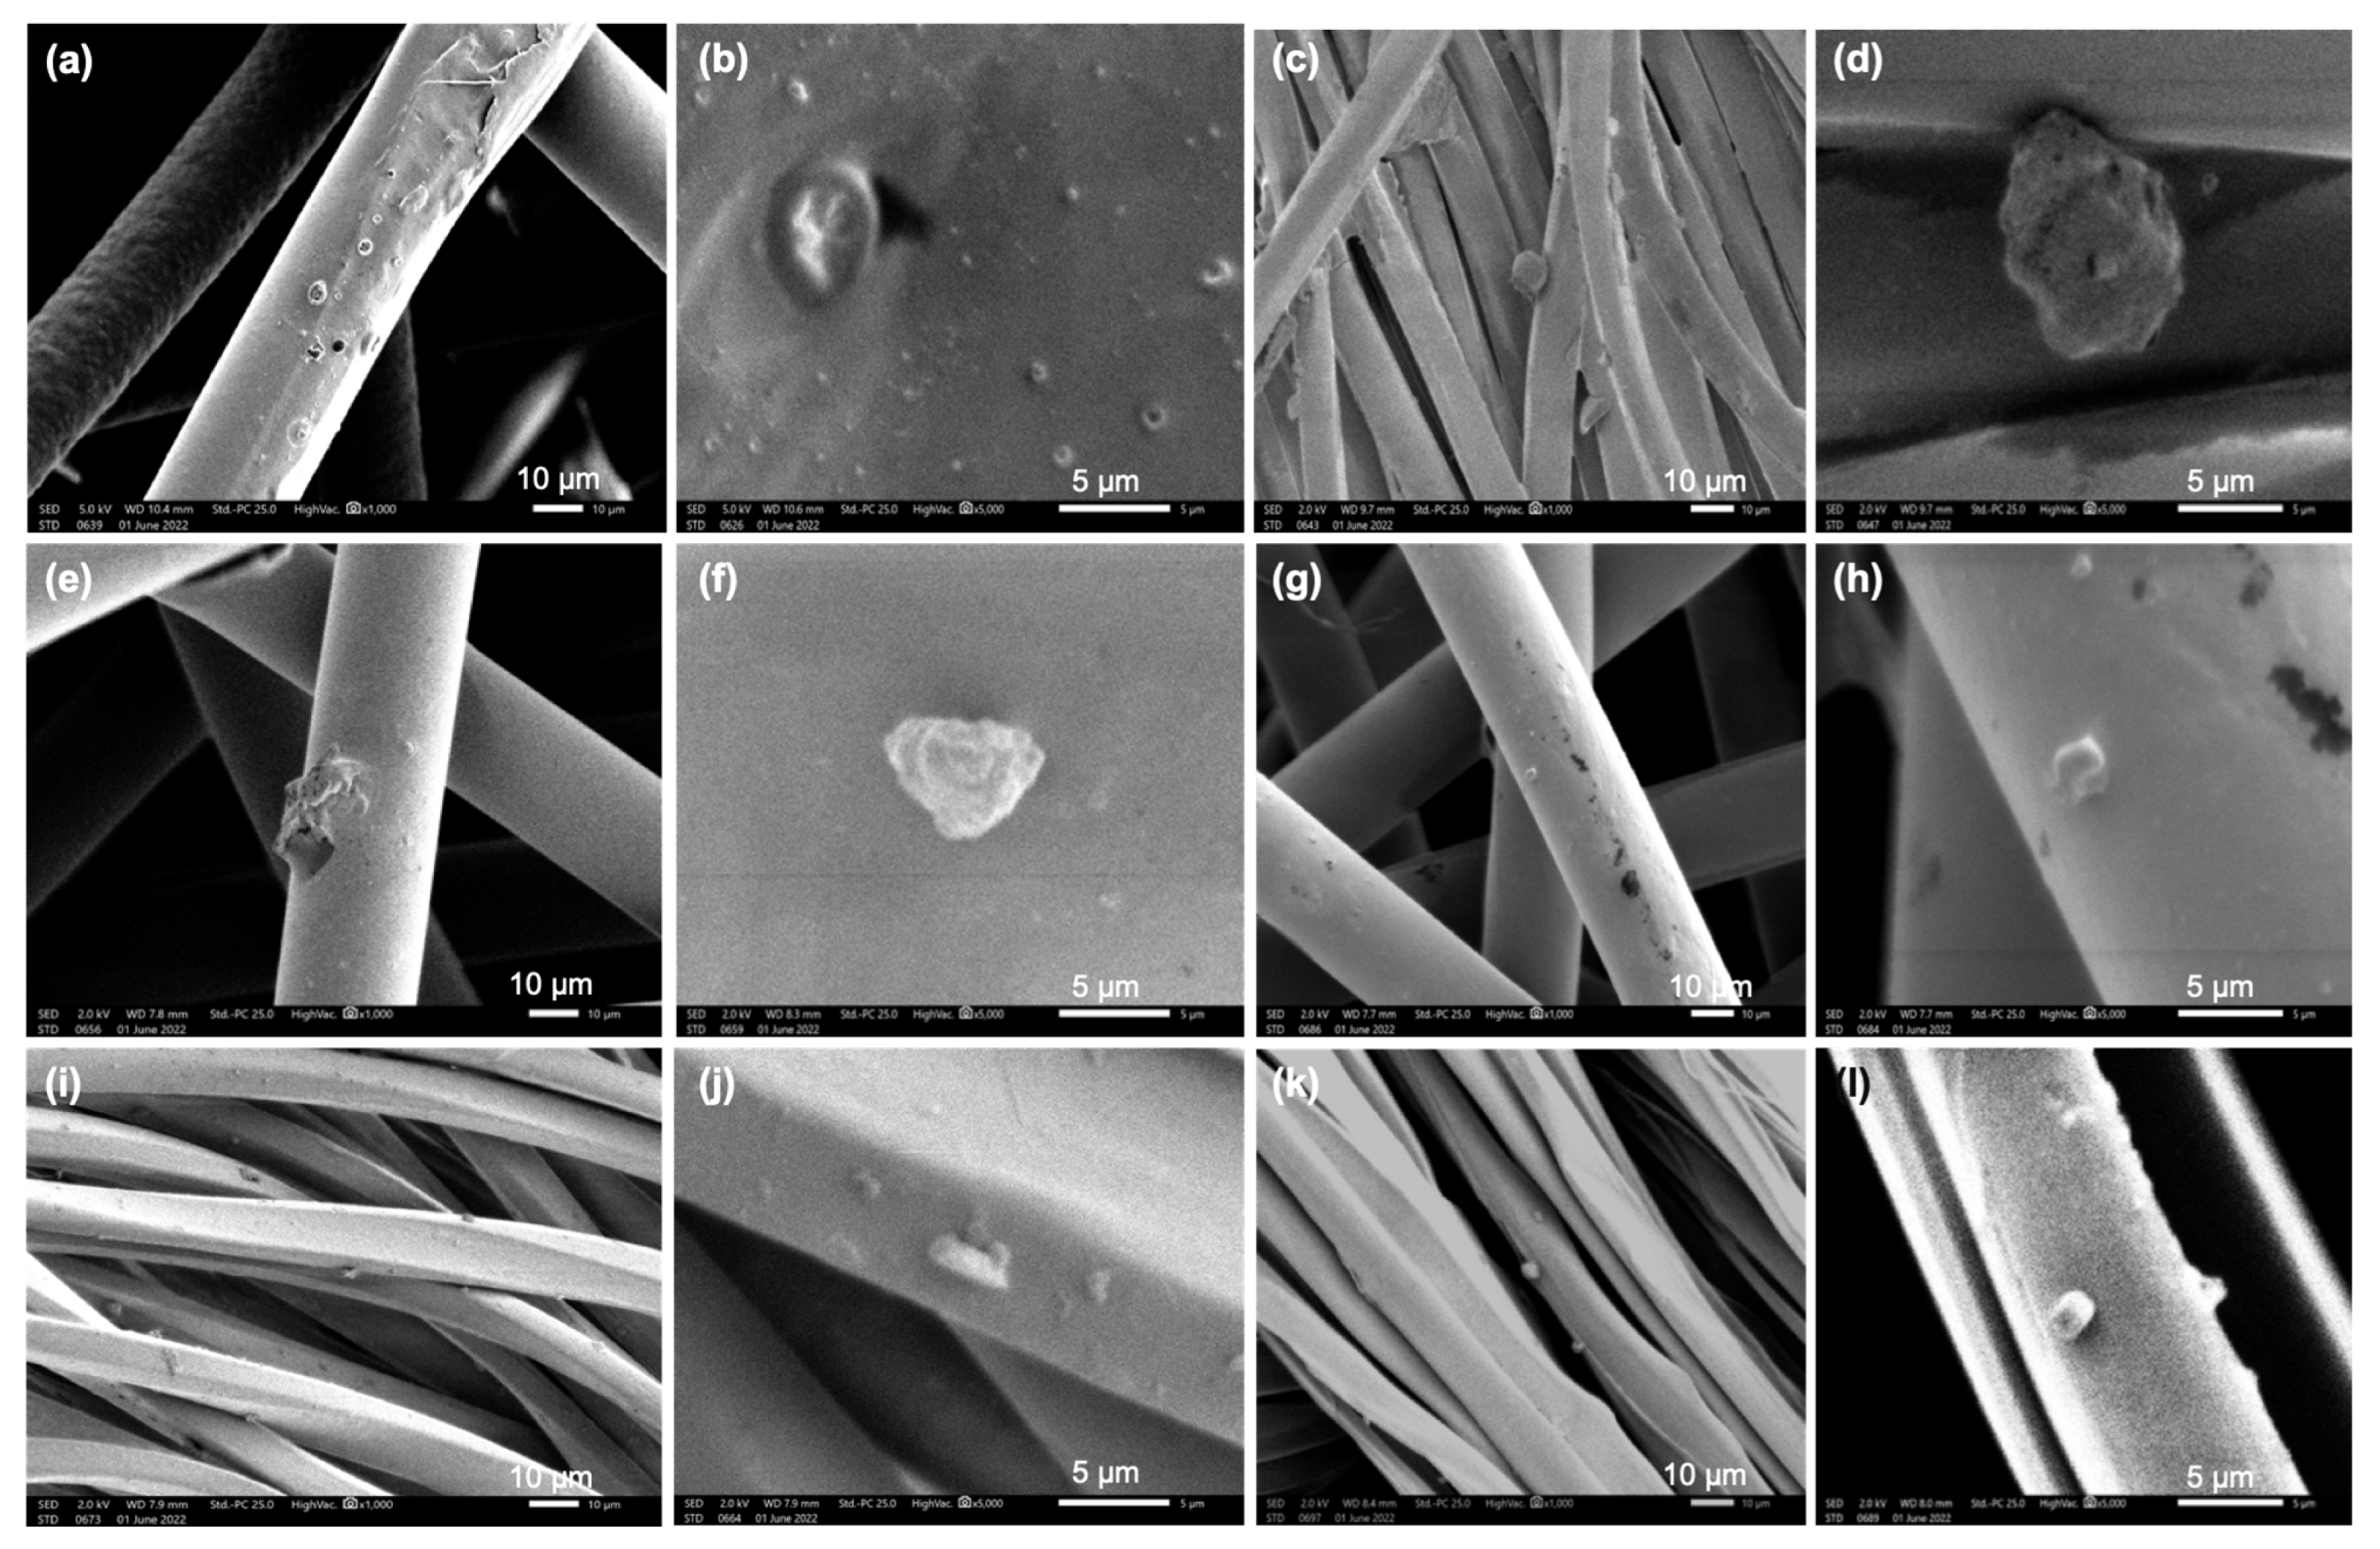
2.1.6. SEM Analysis of Mask Surfaces Sprayed with Micro-Particles
2.2. Mask Filter Model
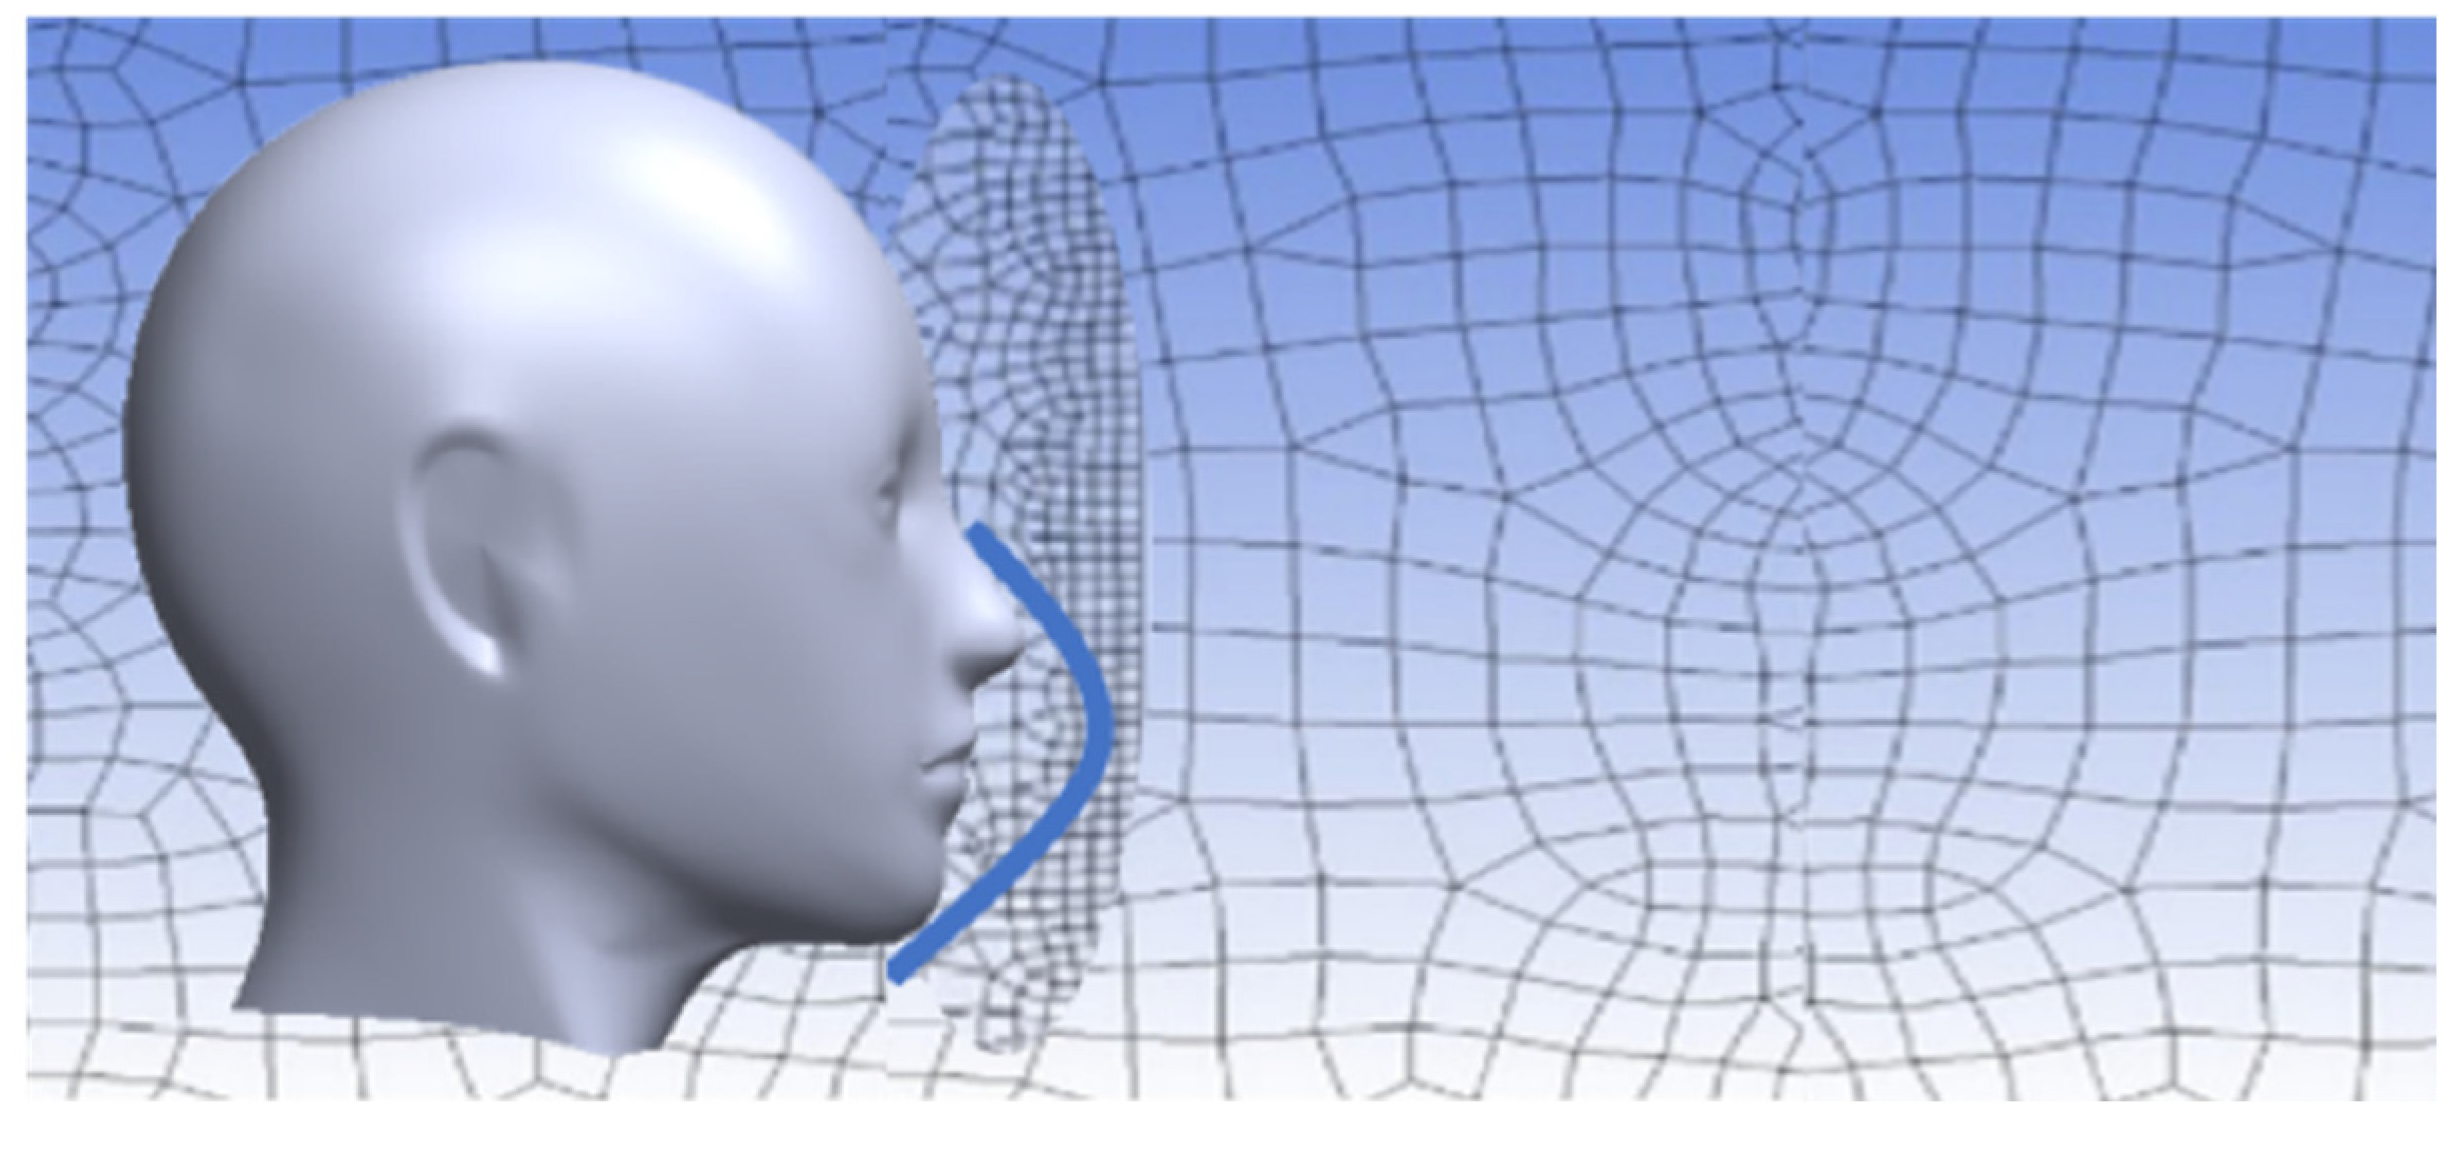
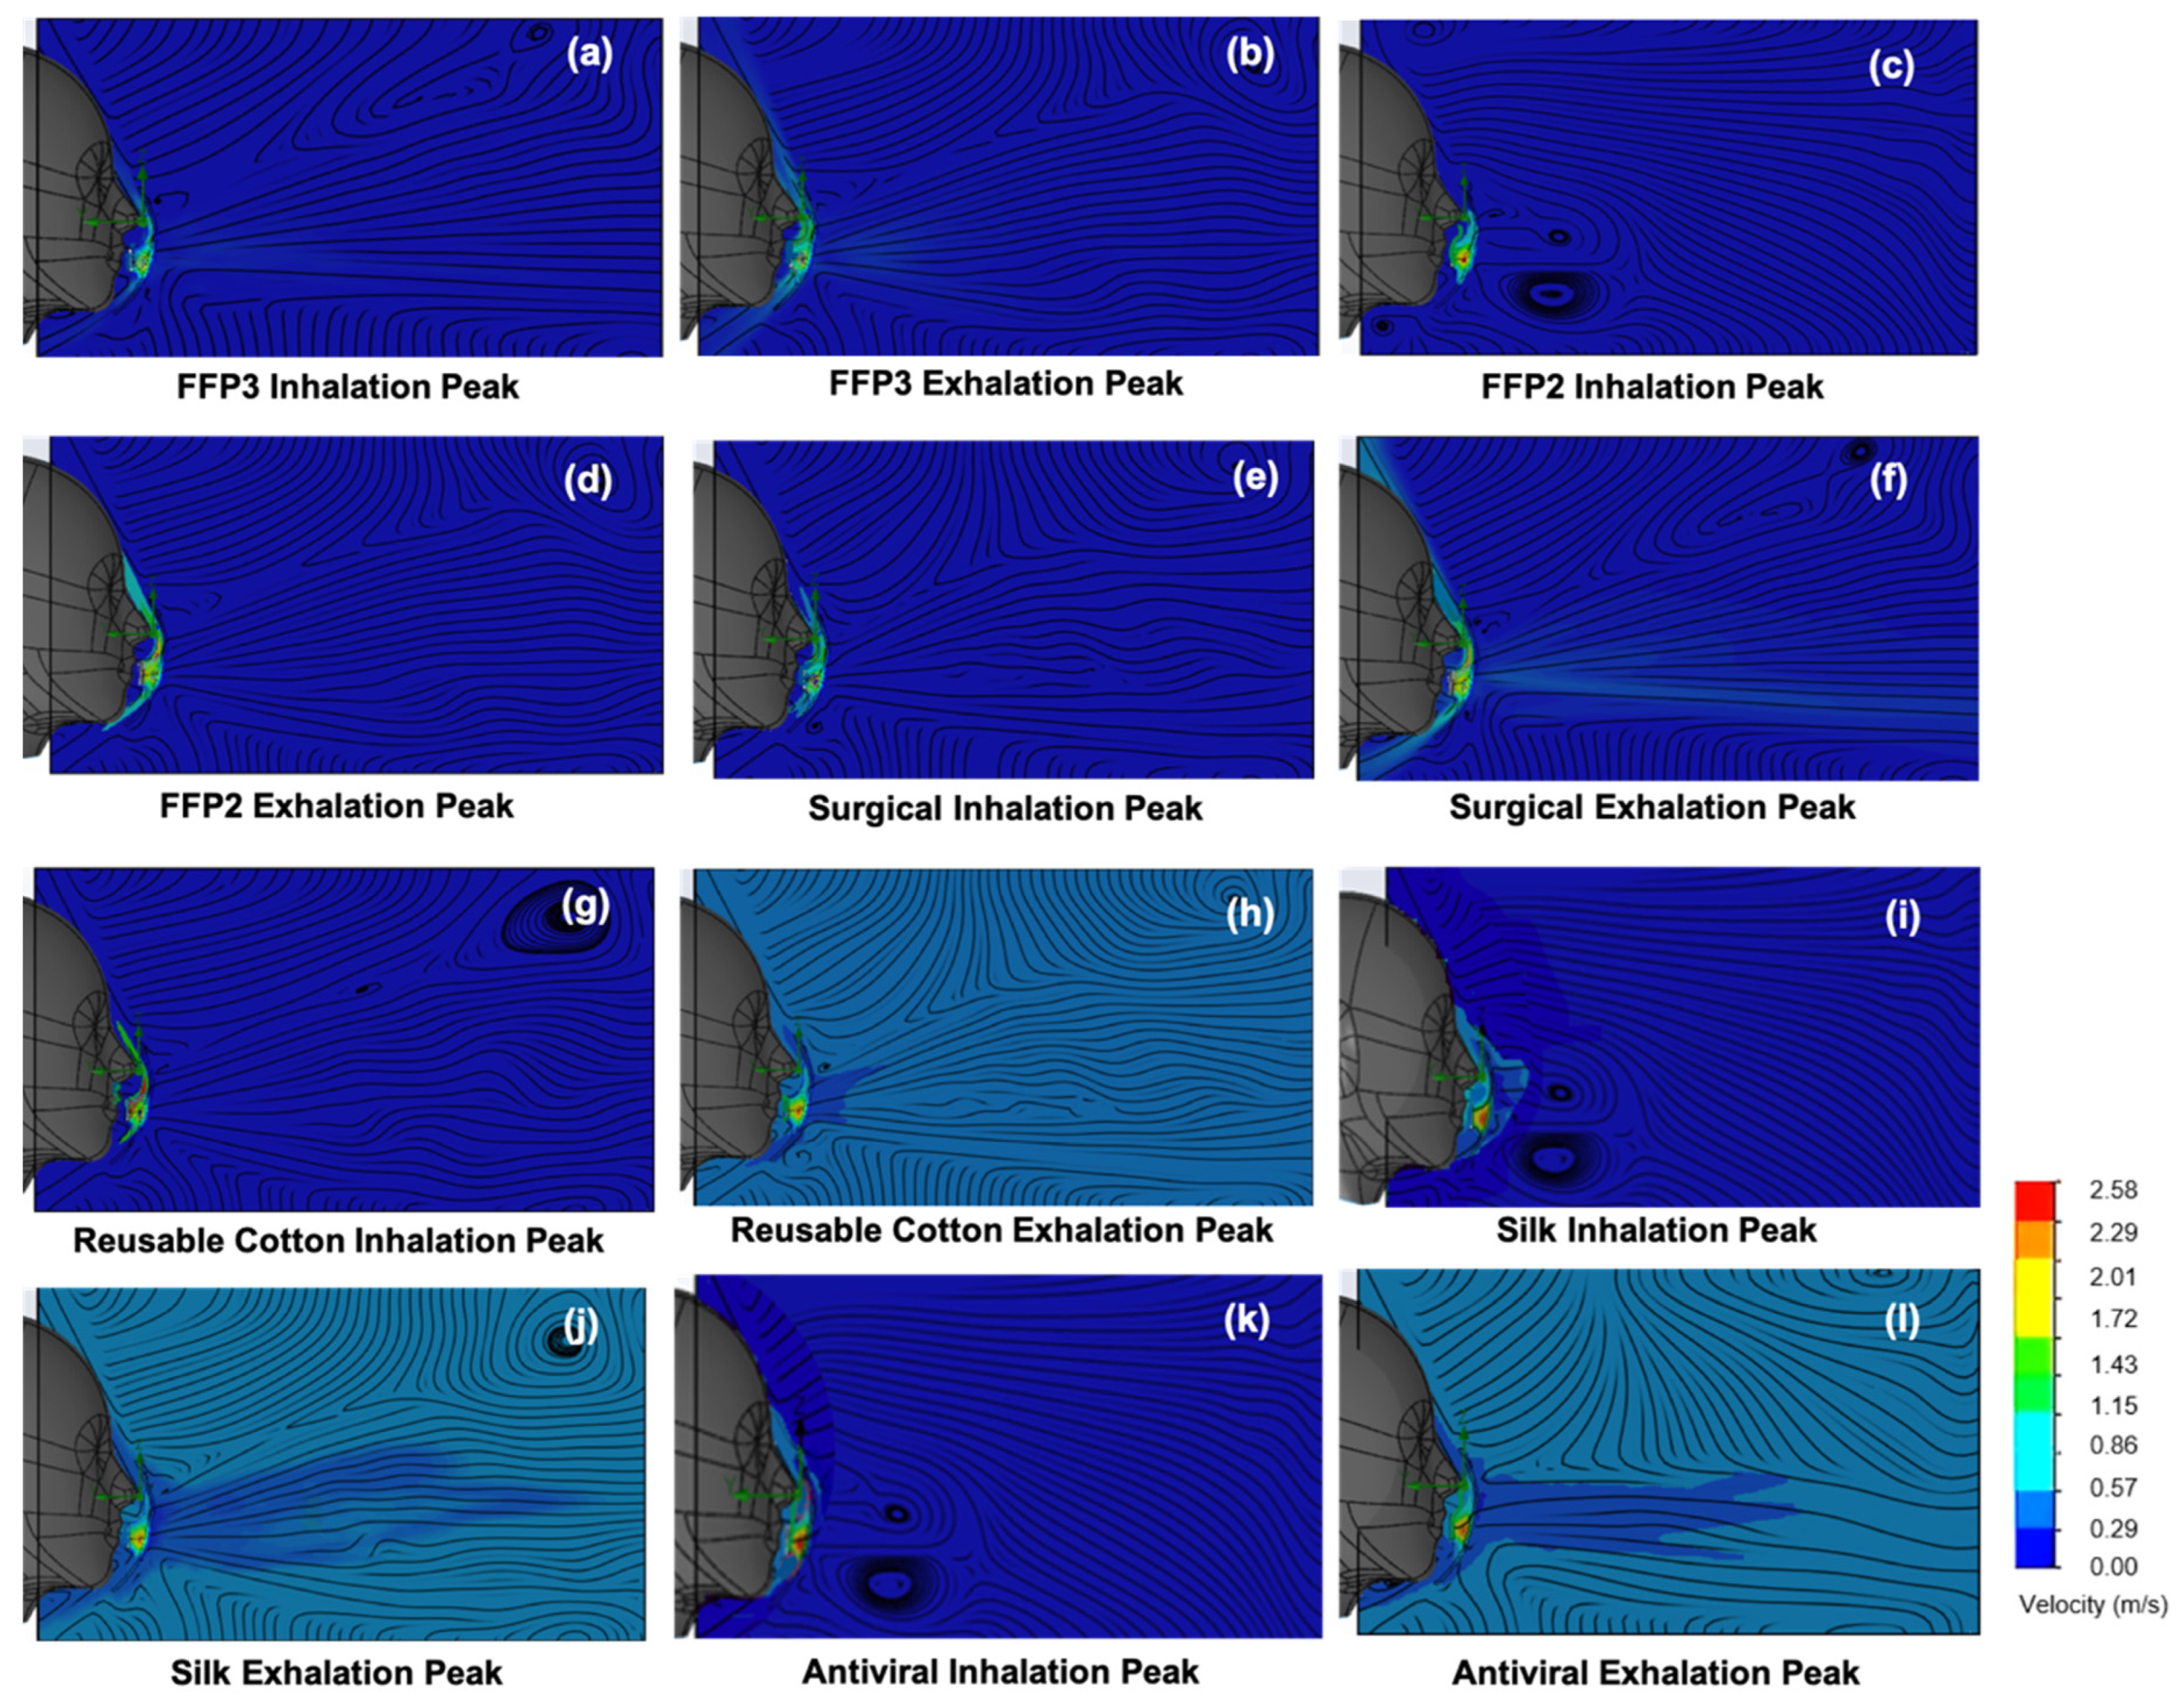
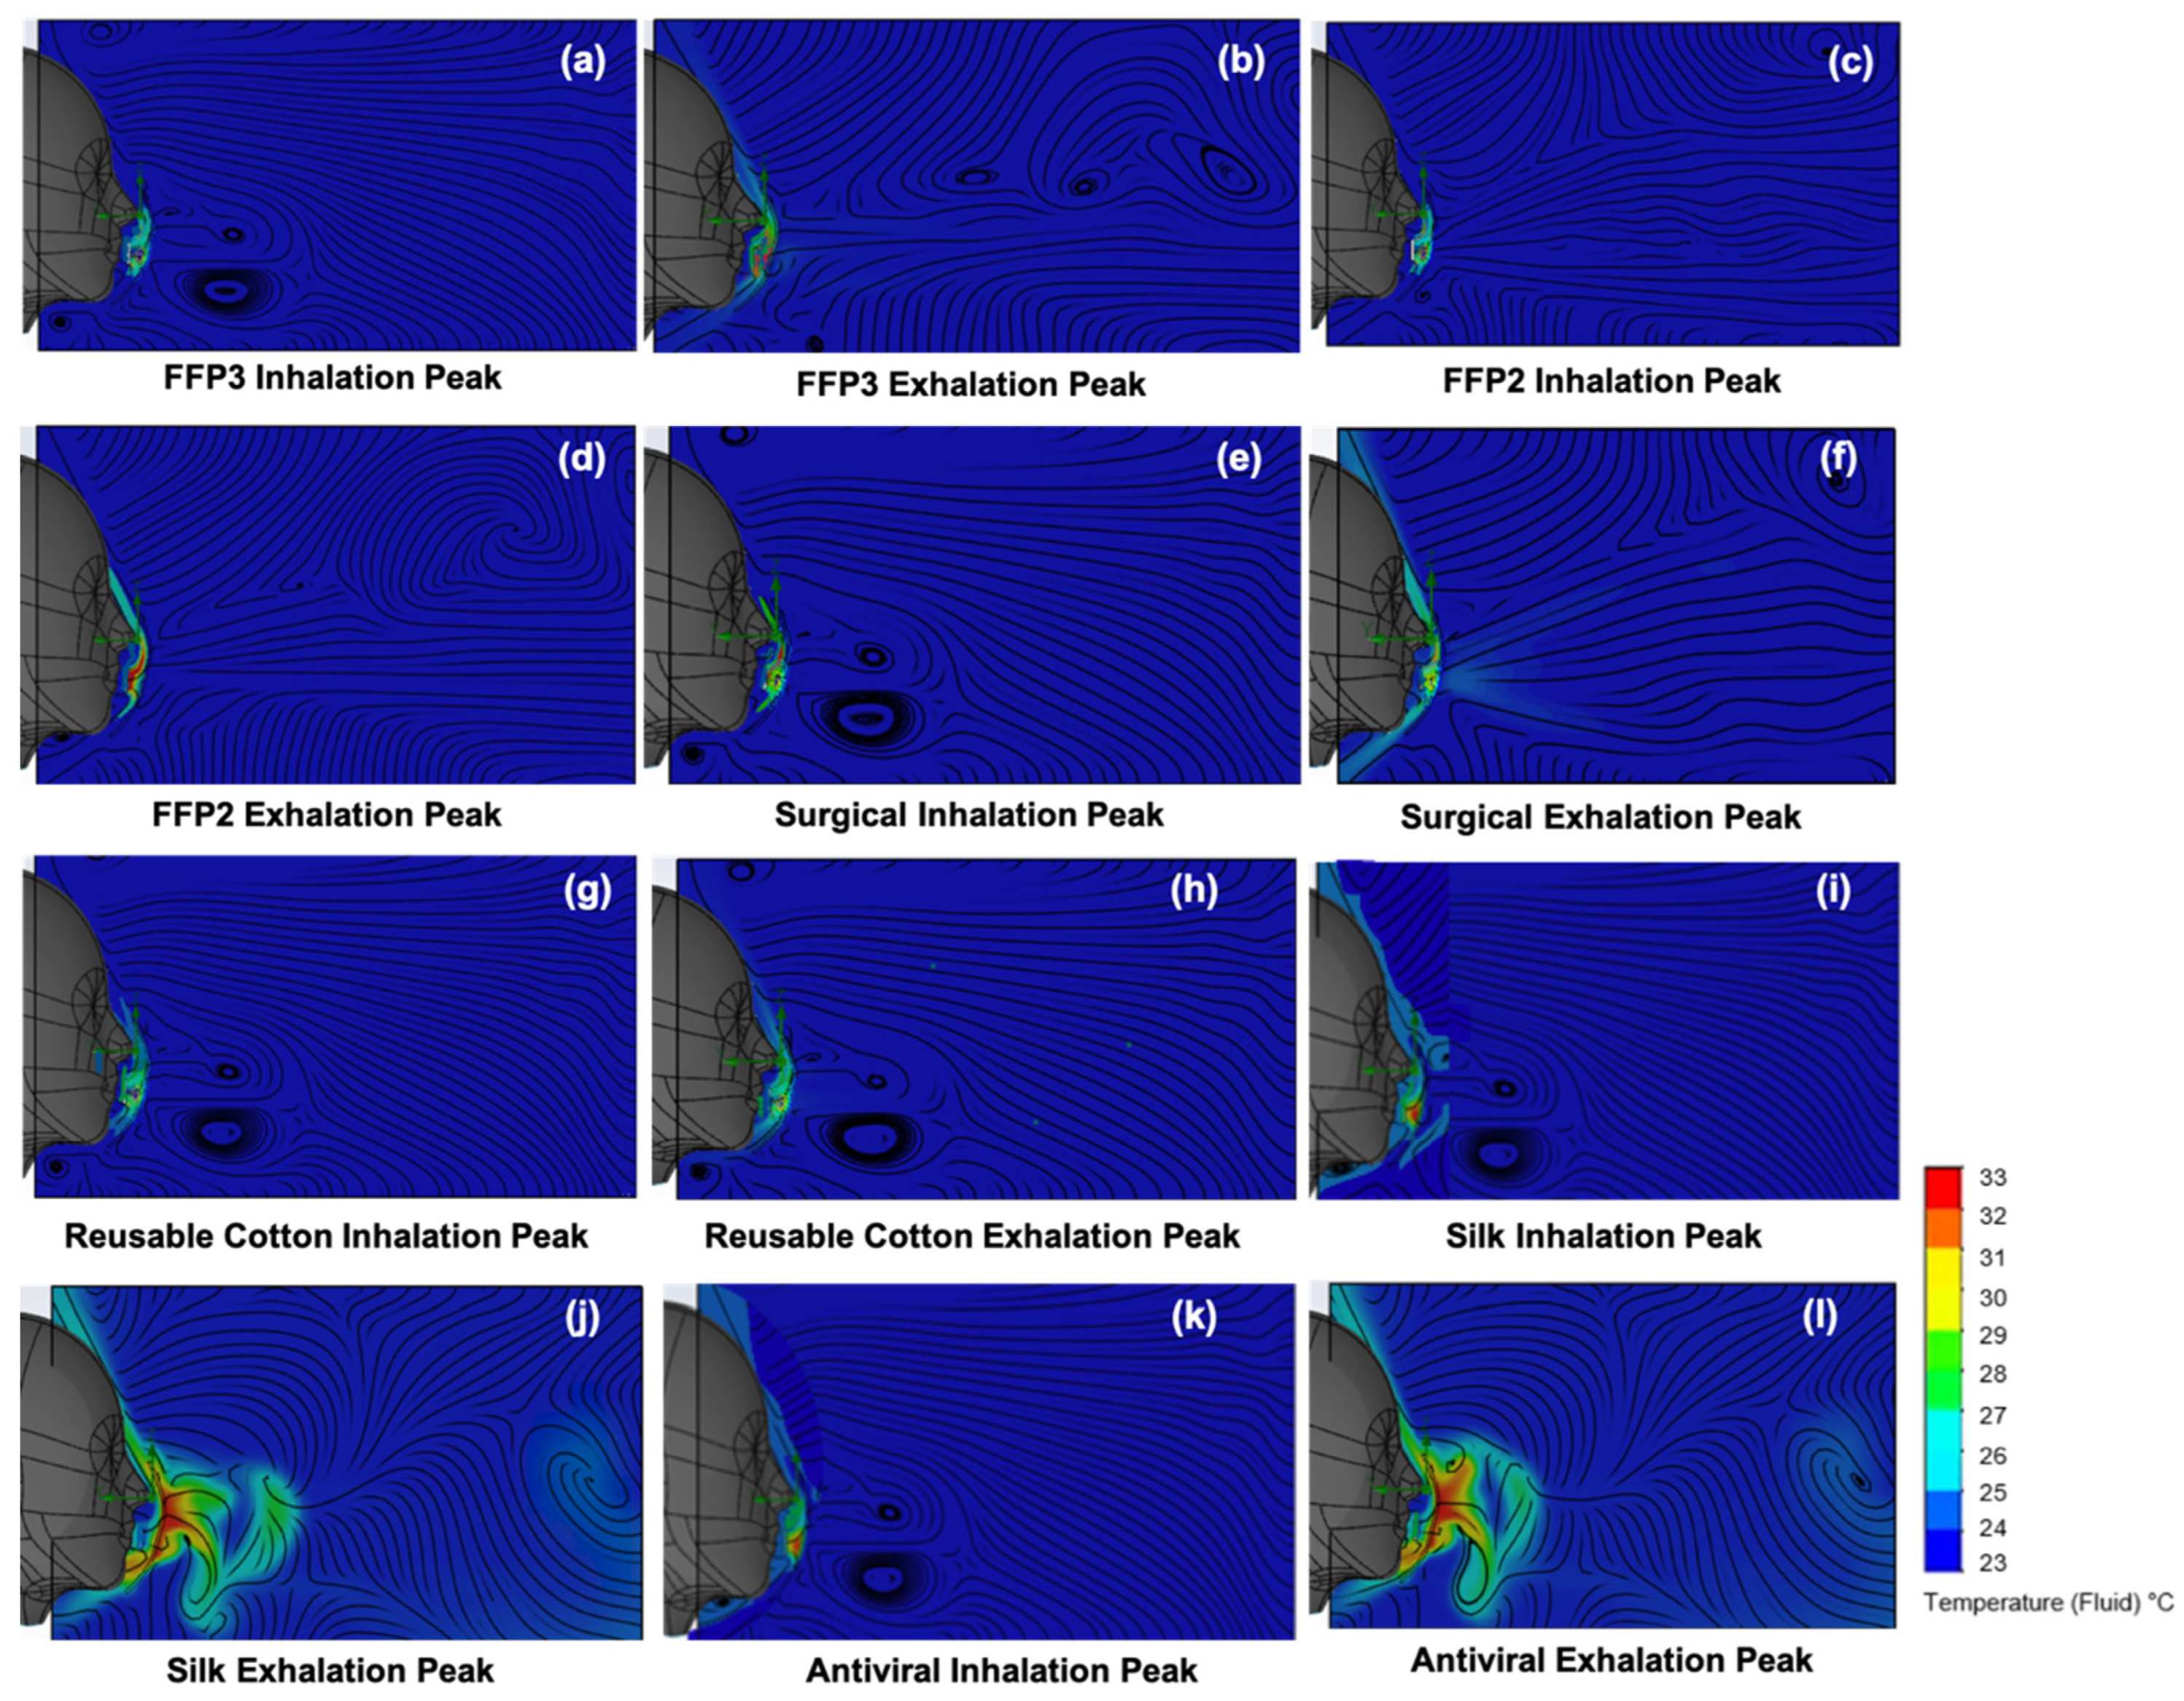
Temperature and Velocity Simulations
2.3. Materials
3. Results and Discussion
3.1. Interactive Temperature and Humidity Influences
3.2. Temperature and Velocity Simulations
4. Conclusions
Author Contributions
Funding
Institutional Review Board Statement
Informed Consent Statement
Data Availability Statement
Acknowledgments
Conflicts of Interest
Abbreviations
| Surgical | Medical-grade IIR surgical |
| Silk | Pure mulberry folded silk |
| FFP2 | Filtering face piece 2 |
| FFP3 | Filtering face piece 3 |
| F | Filtration efficiency |
| CFD | Computational fluid dynamics |
| SEM | Scanning electron microscopy |
References
- Dargahi, A.; Jeddi, F.; Ghobadi, H.; Vosoughi, M.; Karami, C.; Sarailoo, M.; Hadisi, A.; Mokhtari, S.A.; Haghighi, S.B.; Sadeghi, H.; et al. Evaluation of masks’ internal and external surfaces used by health care workers and patients in coronavirus-2 (SARS-CoV-2) wards. Environ. Res. 2021, 196, 110948. [Google Scholar] [CrossRef] [PubMed]
- Jayaweera, M.; Perera, H.; Gunawardana, B.; Manatunge, J. Transmission of COVID-19 virus by droplets and aerosols: A critical review on the unresolved dichotomy. Environ. Res. 2020, 188, 109819. [Google Scholar] [CrossRef] [PubMed]
- Facciolà, A.; Laganà, P.; Caruso, G. The COVID-19 pandemic and its implications on the environment. Environ. Res. 2021, 201, 111648. [Google Scholar] [CrossRef] [PubMed]
- McDonald, F.; Horwell, C.J.; Wecker, R.; Dominelli, L.; Loh, M.; Kamanyire, R.; Ugarte, C. Facemask use for community protection from air pollution disasters: An ethical overview and framework to guide agency decision making. Int. J. Disaster Risk Reduct. 2020, 43, 101376. [Google Scholar] [CrossRef]
- Cheng, V.C.; Wong, S.C.; Chuang, V.W.; So, S.Y.; Chen, J.H.; Sridhar, S.; To, K.K.; Chan, J.F.; Hung, I.F.; Ho, P.L.; et al. The role of community-wide wearing of face mask for control of coronavirus disease 2019 (COVID-19) epidemic due to SARS-CoV-2. J. Infect. 2020, 81, 107–114. [Google Scholar] [CrossRef] [PubMed]
- Burnett, R.; Chen, H.; Szyszkowicz, M.; Fann, N.; Hubbell, B.; Pope III, C.A.; Apte, J.S.; Brauer, M.; Cohen, A.; Weichenthal, S.; et al. Global estimates of mortality associated with long-term exposure to outdoor fine particulate matter. Proc. Natl. Acad. Sci. USA 2018, 115, 9592–9597. [Google Scholar] [CrossRef]
- Tcharkhtchi, A.; Abbasnezhad, N.; Seydani, M.Z.; Zirak, N.; Farzaneh, S.; Shirinbayan, M. An overview of filtration efficiency through the masks: Mechanisms of the aerosols penetration. Bioact. Mater. 2021, 6, 106–122. [Google Scholar] [CrossRef] [PubMed]
- World Health Organization (WHO) Coronavirus (COVID-19). Available online: https://data.who.int/dashboards/covid19/cases (accessed on 26 May 2024).
- Prather, K.A.; Wang, C.C.; Schooley, R.T. Reducing transmission of SARS-CoV-2. Science 2020, 368, 1422–1424. [Google Scholar] [CrossRef] [PubMed]
- Hewawaduge, C.; Senevirathne, A.; Jawalagatti, V.; Kim, J.W.; Lee, J.H. Copper-impregnated three-layer mask efficiently inactivates SARS-CoV2. Environ. Res. 2021, 196, 110947. [Google Scholar] [CrossRef]
- Zhang, S.; Liu, H.; Tang, N.; Zhou, S.; Yu, J.; Ding, B. Spider-web-inspired PM0. 3 filters based on self-sustained electrostatic nanostructured networks. Adv. Mater. 2020, 32, e2002361. [Google Scholar] [CrossRef]
- Kang, D.H.; Kim, N.K.; Kang, H.W. Electrostatic charge retention in PVDF nanofiber-nylon mesh multilayer structure for effective fine particulate matter filtration for face masks. Polymers 2021, 13, 3235. [Google Scholar] [CrossRef] [PubMed]
- Victor, F.S.; Kugarajah, V.; Bangaru, M.; Ranjan, S.; Dharmalingam, S. Electrospun nanofibers of polyvinylidene fluoride incorporated with titanium nanotubes for purifying air with bacterial contamination. Environ. Sci. Pollut. Res. Int. 2021, 28, 37520–37533. [Google Scholar] [CrossRef] [PubMed]
- Bayersdorfer, J.; Giboney, S.; Martin, R.; Moore, A.; Bartles, R. Novel manufacturing of simple masks in response to international shortages: Bacterial and particulate filtration efficiency testing. Am. J. Infect. Control. 2020, 48, 1543–1545. [Google Scholar] [CrossRef] [PubMed]
- Podgórski, A.; Bałazy, A.; Gradoń, L. Application of nanofibers to improve the filtration efficiency of the most penetrating aerosol particles in fibrous filters. Chem. Eng. Sci. 2006, 61, 6804–6815. [Google Scholar] [CrossRef]
- Zangmeister, C.D.; Radney, J.G.; Vicenzi, E.P.; Weaver, J.L. Filtration efficiencies of nanoscale aerosol by cloth mask materials used to slow the spread of SARS-CoV-2. ACS Nano 2020, 14, 9188–9200. [Google Scholar] [CrossRef] [PubMed]
- Richardson, A.W.; Eshbaugh, J.P.; Hofacre, K.C.; Gardner, P.D. Respirator Filter Efficiency Testing against Particulate and Biological Aerosols under Moderate to High Flow Rates; Battelle Memorial Institute: Columbus, OH, USA, 2006. [Google Scholar]
- Guha, S.; McCaffrey, B.; Hariharan, P.; Myers, M.R. Quantification of leakage of sub-micron aerosols through surgical masks and facemasks for pediatric use. J. Occup. Environ. Hyg. 2017, 14, 214–223. [Google Scholar] [CrossRef] [PubMed]
- Aydin, O.; Emon, B.; Cheng, S.; Hong, L.; Chamorro, L.P.; Saif, M.T. Performance of fabrics for home-made masks against the spread of COVID-19 through droplets: A quantitative mechanistic study. Extreme Mech. Lett. 2020, 40, 100924. [Google Scholar] [CrossRef]
- Wilson, N.; Corbett, S.; Tovey, E. Airborne transmission of COVID-19. BMJ 2020, 20, 370. [Google Scholar] [CrossRef]
- Konda, A.; Prakash, A.; Moss, G.A.; Schmoldt, M.; Grant, G.D.; Guha, S. Aerosol filtration efficiency of common fabrics used in respiratory cloth masks. ACS Nano 2020, 14, 6339–6347. [Google Scholar] [CrossRef]
- Schilling, K.; Gentner, D.R.; Wilen, L.; Medina, A.; Buehler, C.; Perez-Lorenzo, L.J.; Pollitt, K.J.; Bergemann, R.; Bernardo, N.; Peccia, J.; et al. An accessible method for screening aerosol filtration identifies poor-performing commercial masks and respirators. J. Expo. Sci. Environ. Epidemiol. 2021, 31, 943–952. [Google Scholar] [CrossRef]
- Drewnick, F.; Pikmann, J.; Fachinger, F.; Moormann, L.; Sprang, F.; Borrmann, S. Aerosol filtration efficiency of household materials for homemade face masks: Influence of material properties, particle size, particle electrical charge, face velocity, and leaks. Aerosol Sci. Technol. 2021, 55, 63–79. [Google Scholar] [CrossRef]
- Kwong, L.H.; Wilson, R.; Kumar, S.; Crider, Y.S.; Reyes Sanchez, Y.; Rempel, D.; Pillarisetti, A. Review of the breathability and filtration efficiency of common household materials for face masks. ACS Nano 2021, 15, 5904–5924. [Google Scholar] [CrossRef] [PubMed]
- Hinds, W.C.; Zhu, Y. Aerosol Technology, 3rd ed.; John Wiley & Sons, Inc.: New York City, NY, USA, 2022. [Google Scholar]
- Corbin, J.C.; Smallwood, G.J.; Leroux, I.D.; Oliaee, J.N.; Liu, F.; Sipkens, T.A.; Gree, R.G.; Murnaghan, N.F.; Koukoulas, T.; Lobo, P. Systematic experimental comparison of particle filtration efficiency test methods for commercial respirators and face masks. Sci. Rep. 2021, 11, 21979. [Google Scholar] [CrossRef] [PubMed]
- Zhao, M.; Liao, L.; Xiao, W.; Yu, X.; Wang, H.; Wang, Q.; Lin, Y.L.; Kilinc-Balci, F.S.; Price, A.; Chu, L.; et al. Household materials selection for homemade cloth face coverings and their filtration efficiency enhancement with triboelectric charging. ACS Nano Lett. 2020, 20, 5544–5552. [Google Scholar] [CrossRef] [PubMed]
- Allison, A.L.; Ambrose-Dempster, E.; Bawn, M.; Casas Arredondo, M.; Chau, C.; Chandler, K.; Dobrijevic, D.; Domenech Aparisi, T.; Hailes, H.C.; Lettieri, P.; et al. The impact and effectiveness of the general public wearing masks to reduce the spread of pandemics in the UK: A multidisciplinary comparison of single-use masks versus reusable face masks. UCL Open Environ. 2021, 3, e022. [Google Scholar] [CrossRef] [PubMed]
- O’Kelly, E.; Pirog, S.; Ward, J.; Clarkson, P.J. Ability of fabric face mask materials to filter ultrafine particles at coughing velocity. BMJ Open. 2020, 10, e039424. [Google Scholar] [CrossRef] [PubMed]
- Matsuyama, S.; Nao, N.; Shirato, K.; Kawase, M.; Saito, S.; Takayama, I.; Nagata, N.; Sekizuka, T.; Katoh, H.; Kato, F.; et al. Enhanced isolation of SARS-CoV-2 by TMPRSS2-expressing cells. Proc. Natl. Acad. Sci. USA 2020, 117, 7001–7003. [Google Scholar] [CrossRef] [PubMed]
- EN 149:2001+A1:2009 (E); Respiratory Protective Devices—Filtering Half Masks to Protect against Particles—Requirements, Testing, Marking. European Committee for Standardization (CEN): Brussels, Belgium, 2009.
- Lewitt, E.H. Hydraulics and Fluid Mechanics: A Text-Book Covering the Syllabuses of the B. Sc.(Eng.), ICE and I. Mech. E. Examinations in this Subject, 10th ed.; Pitman & Sons Ltd.: London, UK, 1970. [Google Scholar]
- Sanchez, E. Filtration Efficiency of Surgical Masks. USF Tampa Graduate Theses and Dissertations, 2010. Available online: https://scholarcommons.usf.edu/etd/1760 (accessed on 26 May 2024).
- Lei, Z.; Yang, J.; Zhuang, Z.; Roberge, R. Simulation and evaluation of respirator faceseal leaks using computational fluid dynamics and infrared imaging. Ann. Occup. Hyg. 2013, 57, 493–506. [Google Scholar] [CrossRef] [PubMed]
- Zhang, X.; Li, H.; Shen, S.; Cai, M. Investigation of the flow-field in the upper respiratory system when wearing N95 filtering facepiece respirator. J. Occup. Environ. Hyg. 2016, 13, 372–382. [Google Scholar] [CrossRef]
- Rasekh, M.; Pisapia, F.; Howkins, A.; Rees, D. Materials analysis and image-based modelling of transmissibility and strain behaviour in approved face mask microstructures. Sci. Rep. 2022, 12, 17361. [Google Scholar] [CrossRef]
- Memarzadeh, F. Improved strategy to control aerosol-transmitted infections in a hospital suite. ASHRAE Trans. 2011, 117, 1–10. [Google Scholar]
- Kowalski, W.J.; Bahnfleth, W.P. Airborne respiratory diseases and mechanical systems for control of microbes. HPAC Heat. Pip. Air Cond. 1998, 7, 11. [Google Scholar]
- Courtney, J.M.; Bax, A. Hydrating the respiratory tract: An alternative explanation why masks lower severity of COVID-19. Biophys. J. 2021, 120, 994–1000. [Google Scholar] [CrossRef]
- Walker, F.C.; Sridhar, P.R.; Baldridge, M.T. Differential roles of interferons in innate responses to mucosal viral infections. Trends Immunol. 2021, 42, 1009–1023. [Google Scholar] [CrossRef]
- Cherrie, J.W.; Wang, S.; Mueller, W.; Wendelboe-Nelson, C.; Loh, M. In-mask temperature and humidity can validate respirator wear-time and indicate lung health status. J. Expo. Sci. Environ. Epidemiol. 2019, 29, 578–583. [Google Scholar] [CrossRef]
- Popov, T.A.; Kralimarkova, T.Z.; Dimitrov, V.D. Measurement of exhaled breath temperature in science and clinical practice. Breathe 2012, 8, 186–192. [Google Scholar] [CrossRef]
- Grinshpun, S.A.; Haruta, H.; Eninger, R.M.; Reponen, T.; McKay, R.T.; Lee, S.A. Performance of an N95 filtering facepiece particulate respirator and a surgical mask during human breathing: Two pathways for particle penetration. J. Occup. Environ. Hyg. 2009, 6, 593–603. [Google Scholar] [CrossRef] [PubMed]
- Gupta, J.K.; Lin, C.H.; Chen, Q. Characterizing exhaled airflow from breathing and talking. Indoor Air 2010, 20, 31–39. [Google Scholar] [CrossRef] [PubMed]
- Lee, H.C.; Wahab, A.K. Performance of different turbulence models in predicting flow kinematics around an open offshore intake. SN Appl. Sci. 2019, 1, 1266. [Google Scholar] [CrossRef]
- Bahmanzadeh, H.; Abouali, O.; Faramarzi, M.; Ahmadi, G. Numerical simulation of airflow and micro-particle deposition in human nasal airway pre-and post-virtual sphenoidotomy surgery. Comput. Biol. Med. 2015, 61, 8–18. [Google Scholar] [CrossRef]
- Napoli, N.J.; Rodrigues, V.R.; Davenport, P.W. Characterizing and modeling breathing dynamics: Flow rate, rhythm, period, and frequency. Front. Physiol. 2022, 12, 2305. [Google Scholar] [CrossRef] [PubMed]
- Russo, J.S.; Khalifa, E. Computational study of breathing methods for inhalation exposure. HVAC&R Res. 2011, 17, 419–431. [Google Scholar] [CrossRef]
- Rofail, P.; Afify, R.; El-Gamal, H. Computational and experimental investigations of a novel reusable face mask for treating sinusitis disease. Ain Shams Eng. J. 2021, 12, 2965–2979. [Google Scholar] [CrossRef]
- Zhang, X.; Li, H.; Shen, S.; Rao, Y.; Chen, F. An Improved FFR Design with a Ventilation Fan: CFD Simulation and Validation. PLoS ONE 2016, 11, e0159848. [Google Scholar] [CrossRef]


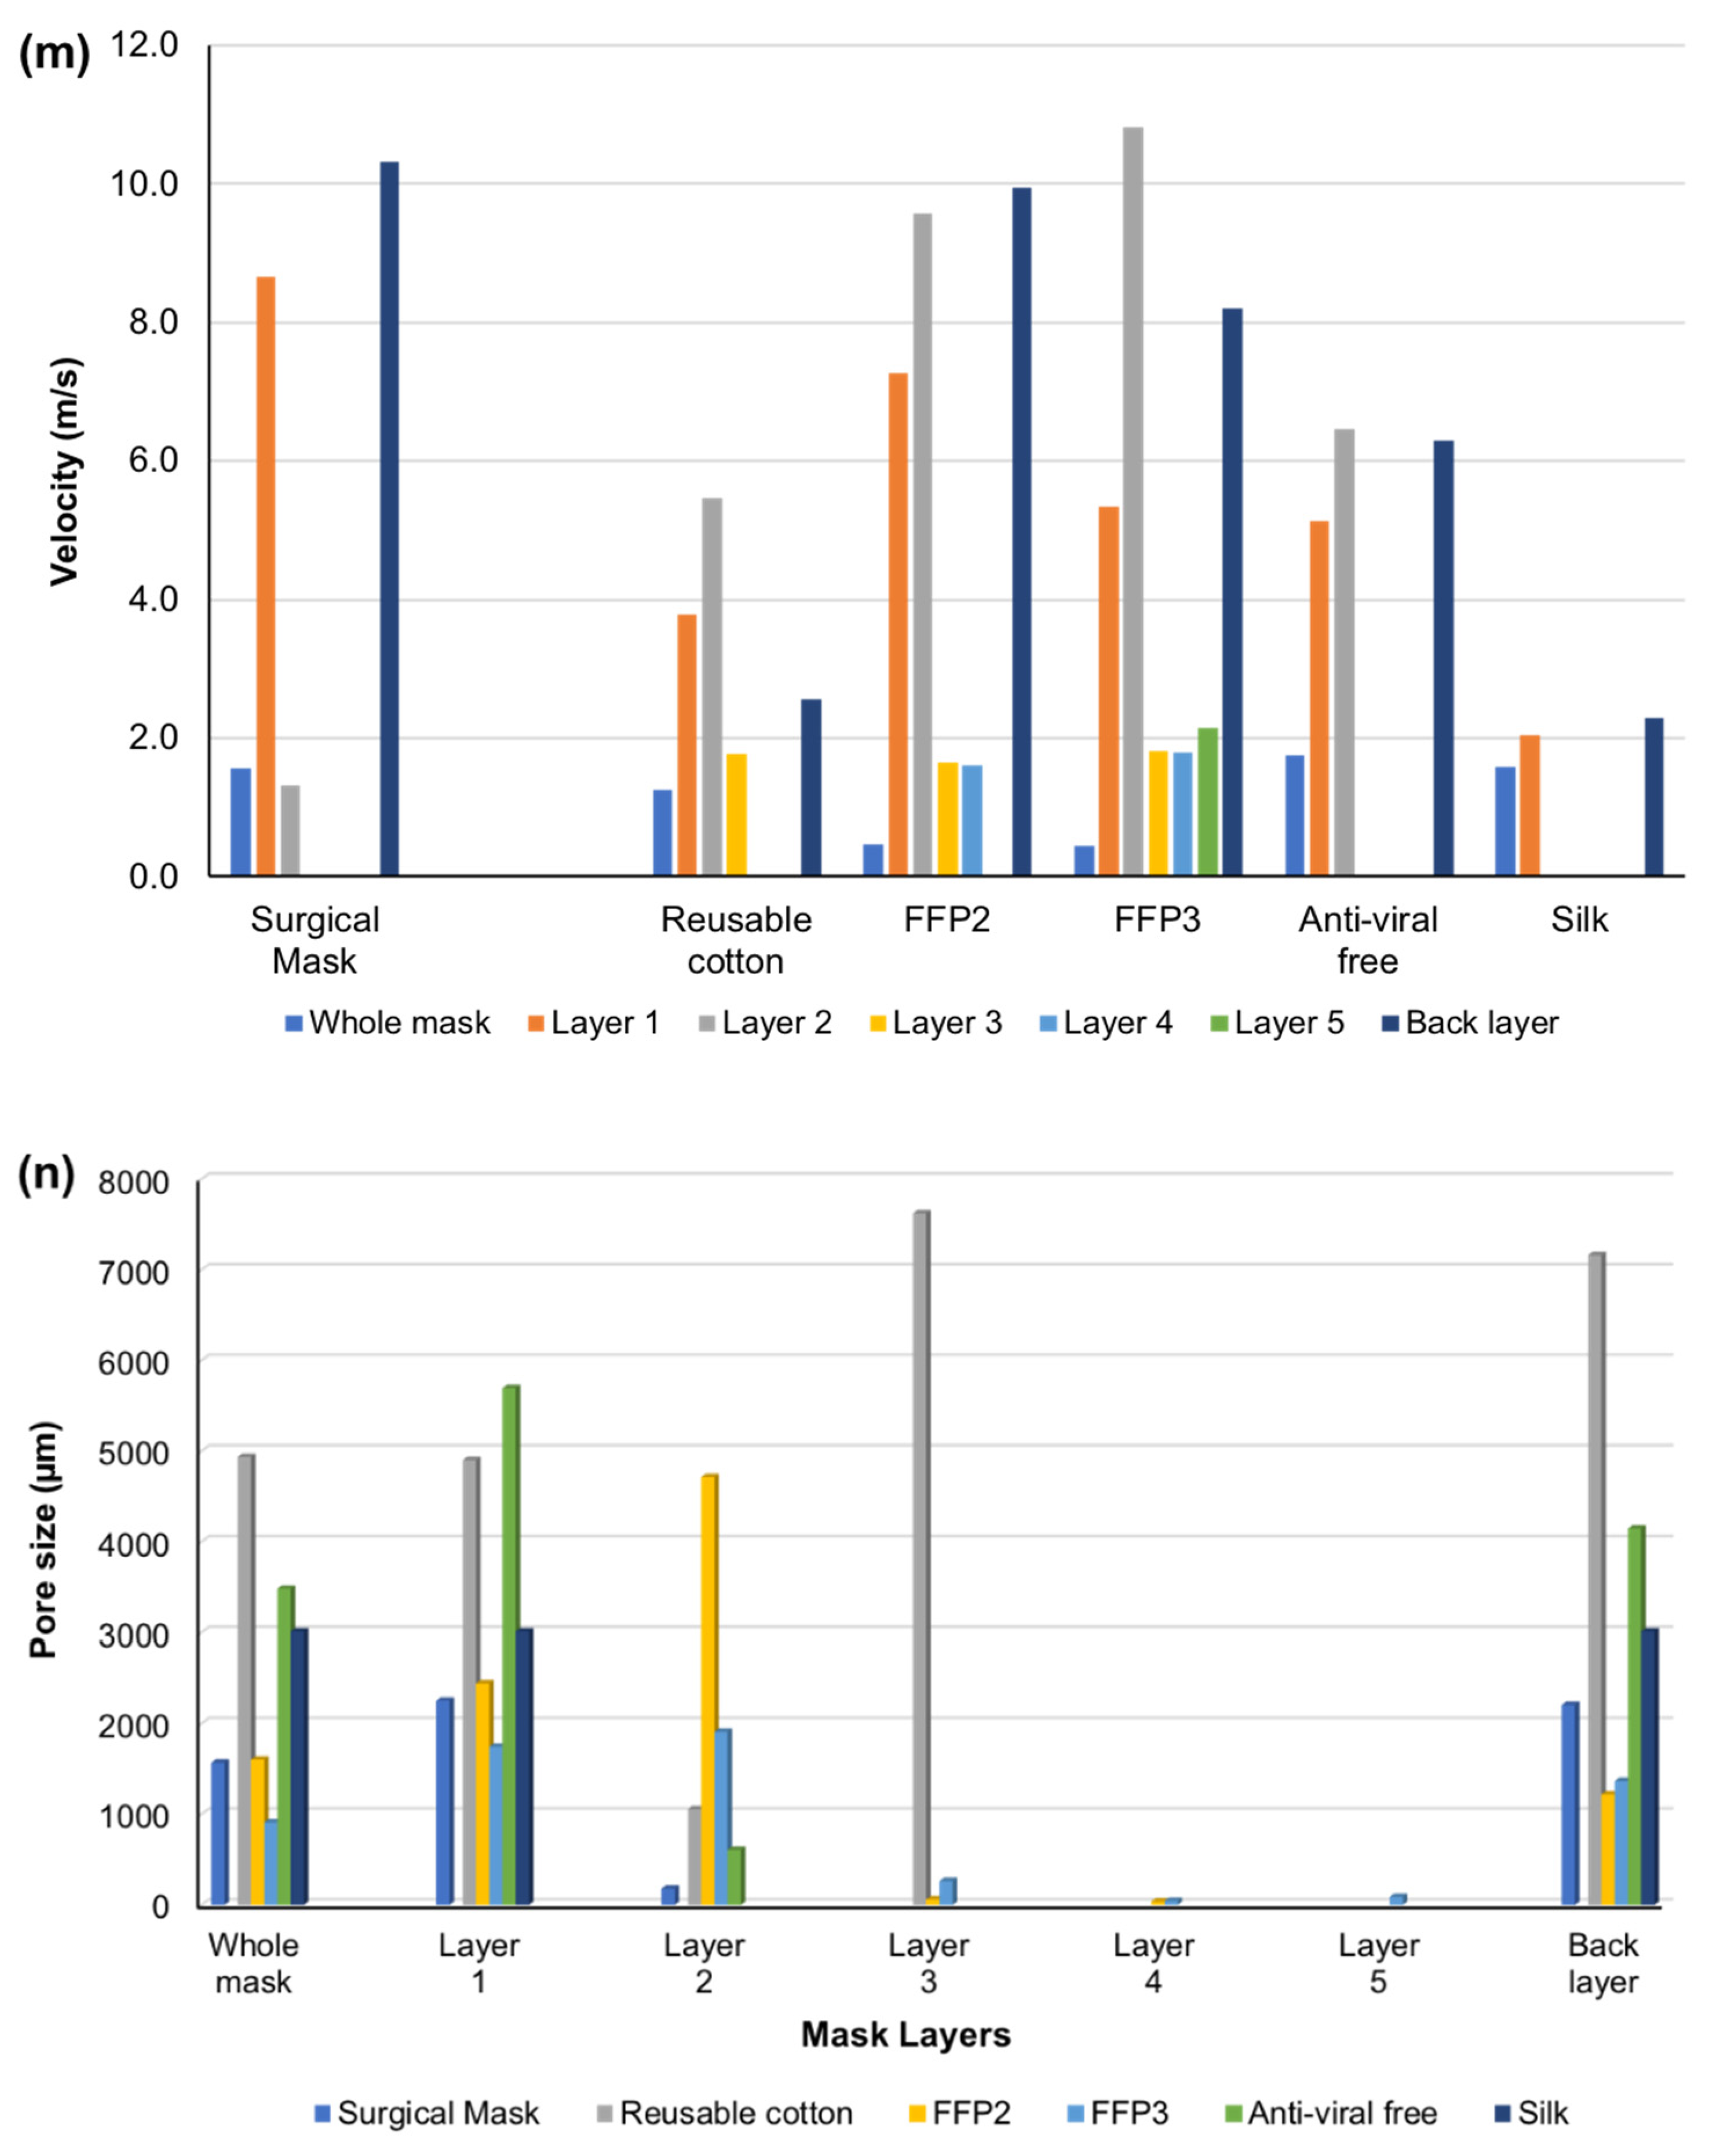
| Mask Types | Mask Layers | V0 (m/s) | V1 (m/s) | V (m/s) Calculated | Average Pore Size (µm) | Pictures |
|---|---|---|---|---|---|---|
| Surgical | 1st layer | 37.76 | 8.65 | 36.42 | 2254 |  |
| 2nd layer | 38.65 | 1.31 | 39.20 | 180 | ||
| 3rd layer | 37.61 | 6.2 | 36.60 | 2207 | ||
| Whole mask | 38.55 | 1.56 | 39.12 | 1570 | ||
| Reusable Cotton | 1st layer | 38.01 | 3.78 | 38.72 | 4902 |  |
| 2nd layer | 37.85 | 5.46 | 37.96 | 1056 | ||
| 3rd layer | 38.60 | 1.77 | 39.16 | 7624 | ||
| 4th layer (Filter holder) | 38.59 | 2.56 | 39.10 | 7163 | ||
| Whole mask | 38.52 | 1.25 | 39.18 | 4936 | ||
| FFP2 | 1st layer | 38.21 | 7.27 | 37.72 | 2445 |  |
| 2nd layer | 37.27 | 9.57 | 36.74 | 4715 | ||
| 3rd layer | 38.90 | 1.64 | 39.39 | 63 | ||
| 4th layer | 38.71 | 1.61 | 39.39 | 39 | ||
| 5th layer | 37.81 | 9.94 | 36.40 | 1221 | ||
| Whole mask | 39.02 | 0.46 | 39.39 | 1603 | ||
| FFP3 | 1st layer | 38.65 | 5.33 | 37.96 | 1746 |  |
| 2nd layer | 38.28 | 10.82 | 36.56 | 1911 | ||
| 3rd layer | 38.65 | 1.82 | 39.05 | 265 | ||
| 4th layer | 38.70 | 1.80 | 38.95 | 46 | ||
| 5th layer | 38.61 | 2.15 | 38.91 | 89 | ||
| 6th layer | 37.53 | 8.20 | 36.71 | 1368 | ||
| Whole mask | 39.80 | 0.44 | 39.35 | 912 | ||
| Antiviral | 1st layer | 38.61 | 5.14 | 38.55 | 5696 |  |
| 2nd layer | 38.65 | 6.45 | 38.23 | 608 | ||
| 3rd layer | 38.55 | 6.29 | 38.55 | 4147 | ||
| Whole mask | 38.42 | 1.75 | 38.47 | 3484 | ||
| Silk | 1st layer | 38.50 | 2.05 | 39.10 | 3013 |  |
| 2nd layer | 38.57 | 2.28 | 38.97 | 3013 | ||
| Whole mask | 39.01 | 1.58 | 39.18 | 3013 | ||
| Without mask | (control) | 34.69 | 34.69 | - | - |
| Mask Type | V0 (m/s) | V1 (m/s) | Filtration Efficiency (F Total) % |
|---|---|---|---|
| Medical-grade IIR Surgical | 38.55 | 1.56 | 88 |
| Reusable cotton | 38.52 | 1.25 | 90 |
| FFP2 | 39.02 | 0.46 | 96 |
| FFP3 | 39.80 | 0.44 | 97 |
| Antiviral | 38.42 | 1.75 | 86 |
| Silk | 39.01 | 1.58 | 88 |
| Without mask (Control) | 34.69 | 34.69 | 0 |
| Mask Type | Average Temperature (Inside Mask) °C | Humidity (Inside Mask) % | Body Temperature (before Wearing Mask) °C | Body Temperature (While Wearing Mask) °C |
|---|---|---|---|---|
| Surgical | 28.9 | 79.6 | 36.5 | 36.8 |
| Surgical | 29.0 | 91.9 | 37.0 | 37.0 |
| Surgical | 31.4 | 71.3 | 36.9 | 37.1 |
| Surgical | 29.7 | 98.6 | 36.6 | 36.6 |
| Surgical | 28.8 | 82.3 | 36.3 | 36.4 |
| Surgical | 29.4 | 95.1 | 36.6 | 36.7 |
| Surgical | 31.0 | 91.2 | 36.8 | 37.1 |
| Surgical | 29.2 | 83.0 | 36.0 | 36.5 |
| FFP3 | 31.6 | 91.0 | 36.8 | 37.0 |
| FFP3 | 30.3 | 75.0 | 36.8 | 36.7 |
| FFP3 | 31.0 | 70.1 | 36.5 | 36.6 |
| FFP3 | 31.6 | 79.4 | 35.8 | 36.2 |
Disclaimer/Publisher’s Note: The statements, opinions and data contained in all publications are solely those of the individual author(s) and contributor(s) and not of MDPI and/or the editor(s). MDPI and/or the editor(s) disclaim responsibility for any injury to people or property resulting from any ideas, methods, instructions or products referred to in the content. |
© 2024 by the authors. Licensee MDPI, Basel, Switzerland. This article is an open access article distributed under the terms and conditions of the Creative Commons Attribution (CC BY) license (https://creativecommons.org/licenses/by/4.0/).
Share and Cite
Rasekh, M.; Pisapia, F.; Hafizi, S.; Rees, D. Filtering Efficiency and Design Properties of Medical- and Non-Medical-Grade Face Masks: A Multiscale Modeling Approach. Appl. Sci. 2024, 14, 4796. https://doi.org/10.3390/app14114796
Rasekh M, Pisapia F, Hafizi S, Rees D. Filtering Efficiency and Design Properties of Medical- and Non-Medical-Grade Face Masks: A Multiscale Modeling Approach. Applied Sciences. 2024; 14(11):4796. https://doi.org/10.3390/app14114796
Chicago/Turabian StyleRasekh, Manoochehr, Francesca Pisapia, Sassan Hafizi, and David Rees. 2024. "Filtering Efficiency and Design Properties of Medical- and Non-Medical-Grade Face Masks: A Multiscale Modeling Approach" Applied Sciences 14, no. 11: 4796. https://doi.org/10.3390/app14114796
APA StyleRasekh, M., Pisapia, F., Hafizi, S., & Rees, D. (2024). Filtering Efficiency and Design Properties of Medical- and Non-Medical-Grade Face Masks: A Multiscale Modeling Approach. Applied Sciences, 14(11), 4796. https://doi.org/10.3390/app14114796