Article

A Study of Cavitation Erosion in Artificial Submerged Water Jets

1
Institute of Ocean Engineering and Technology, Zhejiang University, Zhoushan 316021, China
2
Donghai Laboratory, Zhoushan 316021, China
*
Author to whom correspondence should be addressed.
Appl. Sci. 2024, 14(11), 4804; https://doi.org/10.3390/app14114804
Submission received: 29 March 2024 / Revised: 21 April 2024 / Accepted: 31 May 2024 / Published: 2 June 2024
(This article belongs to the Special Issue Fluid Mechanics: From Theories to Applications)

Abstract

:
The artificially submerged cavitation water jet is effectively utilized by ejecting a high-pressure water stream into a low-pressure water stream through concentric nozzles and utilizing the cavitation phenomenon generated by the shear layer formed between the two streams. In this study, we investigated the cavitation characteristics of artificially submerged cavitation water jets by combining numerical simulations and erosion experiments. The results indicate that an appropriate standoff distance can generate more cavitation clouds on the workpiece surface, and the erosion characteristics of the artificially submerged cavitation water jet are most pronounced at a dimensionless standoff distance of SD = 30. The shear effect formed between the two jets plays a crucial role in generating initial cavitation bubbles within the flow field of the artificially submerged cavitation water jet. Moreover, increasing the convergent angle between the two jets can significantly enhance the cavitation effect between them and lead to a more substantial cavitation effect. Simultaneously, increasing the pressure of the high-pressure inner nozzle also contributes to enhancing the cavitation effect of the artificially submerged cavitation water jet.

1. Introduction

When the local pressure falls below the saturated vapor pressure, vapor bubbles form in water, a phenomenon known as the cavitation effect [1]. Cavitation water jets offer numerous advantages, including cost-effectiveness, cleanliness, environmental friendliness, efficiency, and safety, and have found wide-ranging applications in various industrial fields such as mechanical treatment, oil drilling, and microbial degradation [2]. Traditional submerged cavitation water jets typically involve a continuous jet, wherein a high-velocity water stream is injected into a stationary body of water, resulting in intense shear cavitation and the generation of a significant number of vapor bubbles. However, in non-submerged conditions, when the cavitation water jet is exposed directly to the atmospheric environment, the cavitation effect diminishes rapidly at the nozzle outlet, making it difficult for cavitation vapor bubbles to reach the surface of the target object. To enhance the cavitation effect in non-submerged conditions, most studies employ an artificially created underwater environment by injecting a low-pressure water jet in the same direction around the periphery of the cavitation water jet, thus forming a water-loop-type submerged environment [3].
The exploration and examination of the cavitation water jet effect can be traced back to the late nineteenth century. Rayleigh [4] published a renowned paper titled “On the pressure developed in a liquid during the collapse of a spherical cavity”. In this work, he systematically proposed the theory of cavitation jets and derived the well-known equation for the radial motion of vapor bubbles in the early twentieth century. The equation of motion for an ideal spherical cavity was established by solving the collapse of a single cavity in an infinite domain of a homogeneous, viscosity-free, incompressible liquid using the energy balance principle. Noltingk and Neppiras [5] derived the kinetic equation for a cavity containing a compressible gas. They extended the understanding of cavitation by considering gas compressibility within the cavity. Ivany [6] investigated the collapse of spherical bubbles in compressible liquids through numerical solutions of the hydrodynamic equations. Their findings indicated that higher values of shear viscosity result in slower bubble collapse. When the vacuole reaches a critical scale, its wall velocity exceeds the speed of sound, the pressure within surpasses 1000 MPa, and the temperature exceeds 1000 K. This implies that at a certain scale, the vacuole harbors substantial potential energy. Upon collapse, this energy is rapidly released with high intensity, leading to material damage due to concentrated impacts on the workpiece surface, resulting in cavitation [7]. However, despite these advancements, the mechanism of cavitation erosion remains incompletely understood due to the complexity of turbulent structures and cavitation phenomena, and a universally accepted theory is yet to be established.
Numerous experimental studies have been conducted on cavitation water jets, with erosion tests and high-speed visualization being commonly used methods. Erosion tests provide an intuitive and reliable means to examine the impact effect of the jet and study its cavitation performance. In a study by Laguna-Camacho [8], cavitation erosion tests were performed on different materials, employing optical microscopy to identify wear mechanisms and observe damage characteristics under cavitation water jet and abrasive water jet erosion. Soyama [9] investigated the effect of various nozzle geometries on the erosion rate and determined the relationship between mass loss and erosion time at optimum target distances by varying the nozzle throat diameter as well as the diameter of the expansion section. The findings revealed that the erosion rate is dependent on the nozzle geometry, with the maximum erosion rates varying by over 600% across different nozzles. Hattori [10] conducted erosion tests and measured the impact load of bubble collapse using a standard cavitation liquid injector. The incubation period was evaluated based on the cumulative damage rule by measuring the cavitation impact load acting on the specimen surface. The development of the cavitation cloud is closely linked to the water jet erosion process.
To date, numerous experimental studies have been conducted on cavitation jets. However, cavitation jets are characterized by intense turbulent flow, typically occurring in regions of higher speed and lower pressure. The cavitation effect involves complex inter-phase interactions, making it challenging to capture detailed information using conventional experimental methods. With the rapid development of computational fluid dynamics (CFD), numerical simulation has emerged as an important approach for studying the characteristics of cavitation jets [11,12,13]. Numerical simulations offer the ability to visualize flow structures that may not be observable experimentally and capture intricate flow details, prompting many researchers to conduct extensive studies on cavitation jets using computational methods. For instance, Chen [14] applied computational fluid dynamics methods to optimize nozzle geometry. The optimized parameters led to a 9.41% increase in the axial maximum vapor fraction at a depth of 50 m underwater, significantly enhancing the cavitation effect. Qiu et al. [15] investigated submerged cavitation jets in a narrow cylindrical bore under different back pressure conditions. The results indicated that, for a given pressure boundary, the impact force increases with the spacing of the target plate. Furthermore, the influence of spacing on the impact force diminishes as the target plate moves farther away. Wu et al. [16] studied the effects of various structural parameters on the cavitation effect and compared the numerical simulation results with experimental findings. Their research demonstrated that increasing the length and diameter of the resonator promotes cavitation occurrence and enhances the structural stability of the flow domain. When performing numerical simulations, the choice of turbulence model significantly impacts the accuracy of the results. The Reynolds-averaged Navier–Stokes (RANS) method may not yield accurate simulation results, particularly when dealing with the unsteady behavior of cavitation effects [17]. The Large Eddy Simulation (LES) method has been employed to simulate cavitation effects around hydrofoils or provide high-resolution turbulence simulations within nozzles [18]. However, the computational requirements of the LES method limit its industrial applicability. To strike a balance between computational resources and accuracy, a hybrid approach combining the RANS method and LES method has been utilized for simulating cavitation effects, such as the Scale-Adaptive Simulation (SBES) model, which can capture the instability and periodicity of cavitation clouds [19]. Moreover, the SBES model can capture more turbulent details when simulating super-cavitation flows generated by high-speed submerged water [20].
However, most of the literature on cavitation water jets predominantly focuses on theoretical studies and engineering applications conducted under submerged conditions. In comparison, artificial submerged cavitation water jets have received relatively limited research attention [21,22]. Accurately predicting the periodic distribution pattern of cavitation clouds and cavitation erosion in artificially submerged cavitation water jets remains a challenging task.
Several researchers have tried to produce an artificially submerged jet in the air by injecting a high-speed water jet into a concentric low-speed water jet for cutting rocks or cleaning. However, the aspect of the cavitating jet in the air was not clear [23,24,25]. The objective of this study is to investigate the cavitation erosion characteristics of artificially submerged cavitation water jets. Numerical simulations of artificially submerged cavitation jets at various standoff distances were conducted using the SBES turbulence model along with the ZGB cavitation model. This analysis aimed to assess how standoff distance affects the periodic distribution pattern of the cavitation cloud within the flow field and on the workpiece surface. Additionally, erosion experiments were conducted to validate the numerical simulation results. Furthermore, the cavitation erosion characteristics of the artificially submerged cavitation water jet under various structural parameters and high-pressure inner nozzle pressure were analyzed using the mass loss method.

2. Numerical Simulation

2.1. Turbulence Model

We utilized the widely adopted commercial computational fluid dynamics (CFD) software, ANSYS Fluent 2020R2, for our simulation. ANSYS Fluent has a proven track record of success in cavitation analysis, including applications related to water jet pump tip leakage vortex and water jet phenomena [26,27,28]. The Stress-Blended Eddy Simulation (SBES) model employed in this study is chosen based on the SST k-ω model, as it has demonstrated its capability to simulate the super-cavitation flow generated by high-speed water jets within the injection pressure range of 5–25 MPa [29]. The SBES turbulence model is specifically developed to capture the dynamic behavior of turbulence in distinct flow regions. It enables a seamless and efficient transition from Reynolds-averaged Navier–Stokes (RANS) to Large Eddy Simulation (LES) in the separated shear layer. The fundamental principle of the SBES model involves utilizing the RANS method to solve the flow field near the wall while employing the LES method to solve the flow region further away from the wall. This approach enhances computational accuracy and captures more intricate details of the flow field while mitigating the issue of excessive mesh requirements.
The blended stress τ S B E S between RANS and LES methods can be achieved by the following equation:
τ S B E S = f s h τ R A N S + ( 1 f s h ) τ L E S ,
The shielding function, denoted as f s h , plays a crucial role in determining the transition between the RANS and Large Eddy Simulation LES methods. It explicitly controls the switching mechanism between these two methods. The stress tensors, τ R A N S and τ L E S , represent the modeled turbulent stresses in the RANS and LES frameworks, respectively. The turbulent viscosity μ t S B E S can be determined as follows:
μ t S B E S = f s h μ t R A N S + ( 1 f s h ) μ t L E S ,
where μ t R A N S and μ t L E S were calculated by the SST k-ω model and the Wall-Adapting Local Eddy-viscosity model (WALE), respectively.

2.2. Cavitation Model

The mixture model implemented in ANSYS Fluent is widely employed as a multiphase flow modeling method for simulating complex flows that consist of multiple immiscible fluids. Its applicability extends to various phenomena, including liquid–gas interaction, free surface flow, and dispersed phase flow [30,31,32]. The fundamental assumption of the mixing model is that the fluid phases are thoroughly mixed, thereby sharing identical velocity and pressure fields. Each phase is treated as an individual component, and their interactions are quantified through interphase momentum and mass transfer terms. The mass transfer rate is calculated by the vapor transport equation:
ρ v α v t + ρ v α v u j x j = M e M c ,
where ρv and αv represent the vapor phase density and vapor phase volume fraction; Me and Mc denote evaporation and condensation rates, respectively. The mass transfer rate between phases can be determined using various mass transfer equation models (TEM), such as the Schnerr–Sauer model, ZGB model, and Singhal models. Among these models, employing the ZGB cavitation model for simulating cavitation flow can offer improved calculation accuracy and faster convergence speed [33]. The equations for the ZGB cavitation model are as follows:
M e = F vap 3 α nuc 1 α v ρ v R b 2 P v P 3 ρ l ,   if   P < P V
M c = F cond 3 α v ρ v R b 2 P P v 3 ρ l ,   if   P P V
where ρv, ρl, P, and Pv denote the vapor phase density, the liquid phase density, the total pressure, and the vapor phase pressure, respectively. The Fvap, α n u c , Rb, and F c o n d represent the evaporation coefficient, the volume of gas nucleus in the liquid, the radius of the bubble, and the condensation coefficient, respectively. The default values for these variables are Fvap = 50, α n u c = 5 ∗ 10−4, Rb = 10−6, and F c o n d = 0.01.

2.3. Mesh Configuration and Boundary Conditions in Flow Domain

As shown in Figure 1a, d is the diameters of the inner nozzle; L1, L2, and δ denote the throat length, divergent segment length, and divergent angle of the inner nozzle; β is the convergent angle of the outer nozzle; and D stands for the inner clearance between the inner and outer nozzle. The standoff distance is S, which is the same for the inner and external nozzle [34]. To fully capture the cavitation cloud distribution pattern on the workpiece wall, the workpiece diameter ɸw should be large enough relative to the nozzle diameter. The dimensionless standoff distance SD is the ratio of standoff distance to the diameter of the inner nozzle. The nozzle and workpiece dimensions are listed in Table 1.
The computational domain and boundary conditions are illustrated in Figure 1b. The model created using SOLIDWORKS is imported into ANSYS ICEM to generate high-quality hexahedral structured meshes, as illustrated in Figure 1c. To ensure an accurate representation of the boundary layer near the inner wall of the nozzle, it is recommended to position the center of the first computational cell in the logarithmic law region, where the dimensionless wall distance, denoted as y+, should fall within the range of 20 ≤ y+ ≤ 200 [35]. In the Reynolds number, Re = UL/v*, U represents the flow velocity at the nozzle throat, L is the thickness of the first layer of meshes on the inner wall of the nozzle throat, and v* is the kinematic viscosity. A flow velocity of 150 m/s is selected as the flow velocity at the nozzle throat. The thickness of the first mesh layer on the inner wall of the nozzle throat is set to 0.05 mm, and the mesh size increases outward by a factor of 1.1, y+ resulting in a value of approximately 30.
The non-slip wall condition is applied to the surface of the nozzle. The artificial submerged cavitation water jet consists of two channels: a high-pressure channel and a low-pressure channel. The inlet conditions for both channels are set as pressure inlet. As the outer flow field surrounding the water jet corresponds to an air domain, the inlet of the outer flow field is specified as a pressure inlet with a gauge pressure of 0 MPa, while the inlet air volume fraction is set to 1. The outlet boundary condition of the flow field is defined as the pressure outlet with a pressure set to 0 MPa. The calculation of velocity and pressure is iteratively decoupled using the pressure-based SIMPLE (Semi-Implicit Pressure Linked Equation Method) solver. The simulation employs a physics time step of ΔT = 1 ∗ 10−6, with 20 internal iterations conducted within each physics time step. Moreover, the momentum equation’s space discretization adopts the bounded central difference scheme, while the time discretization employs the bounded second-order implicit scheme. To capture the periodicity of cavitation in an artificially submerged cavitation water jet, a total physics time exceeding 10 ms is allocated for each mesh level.

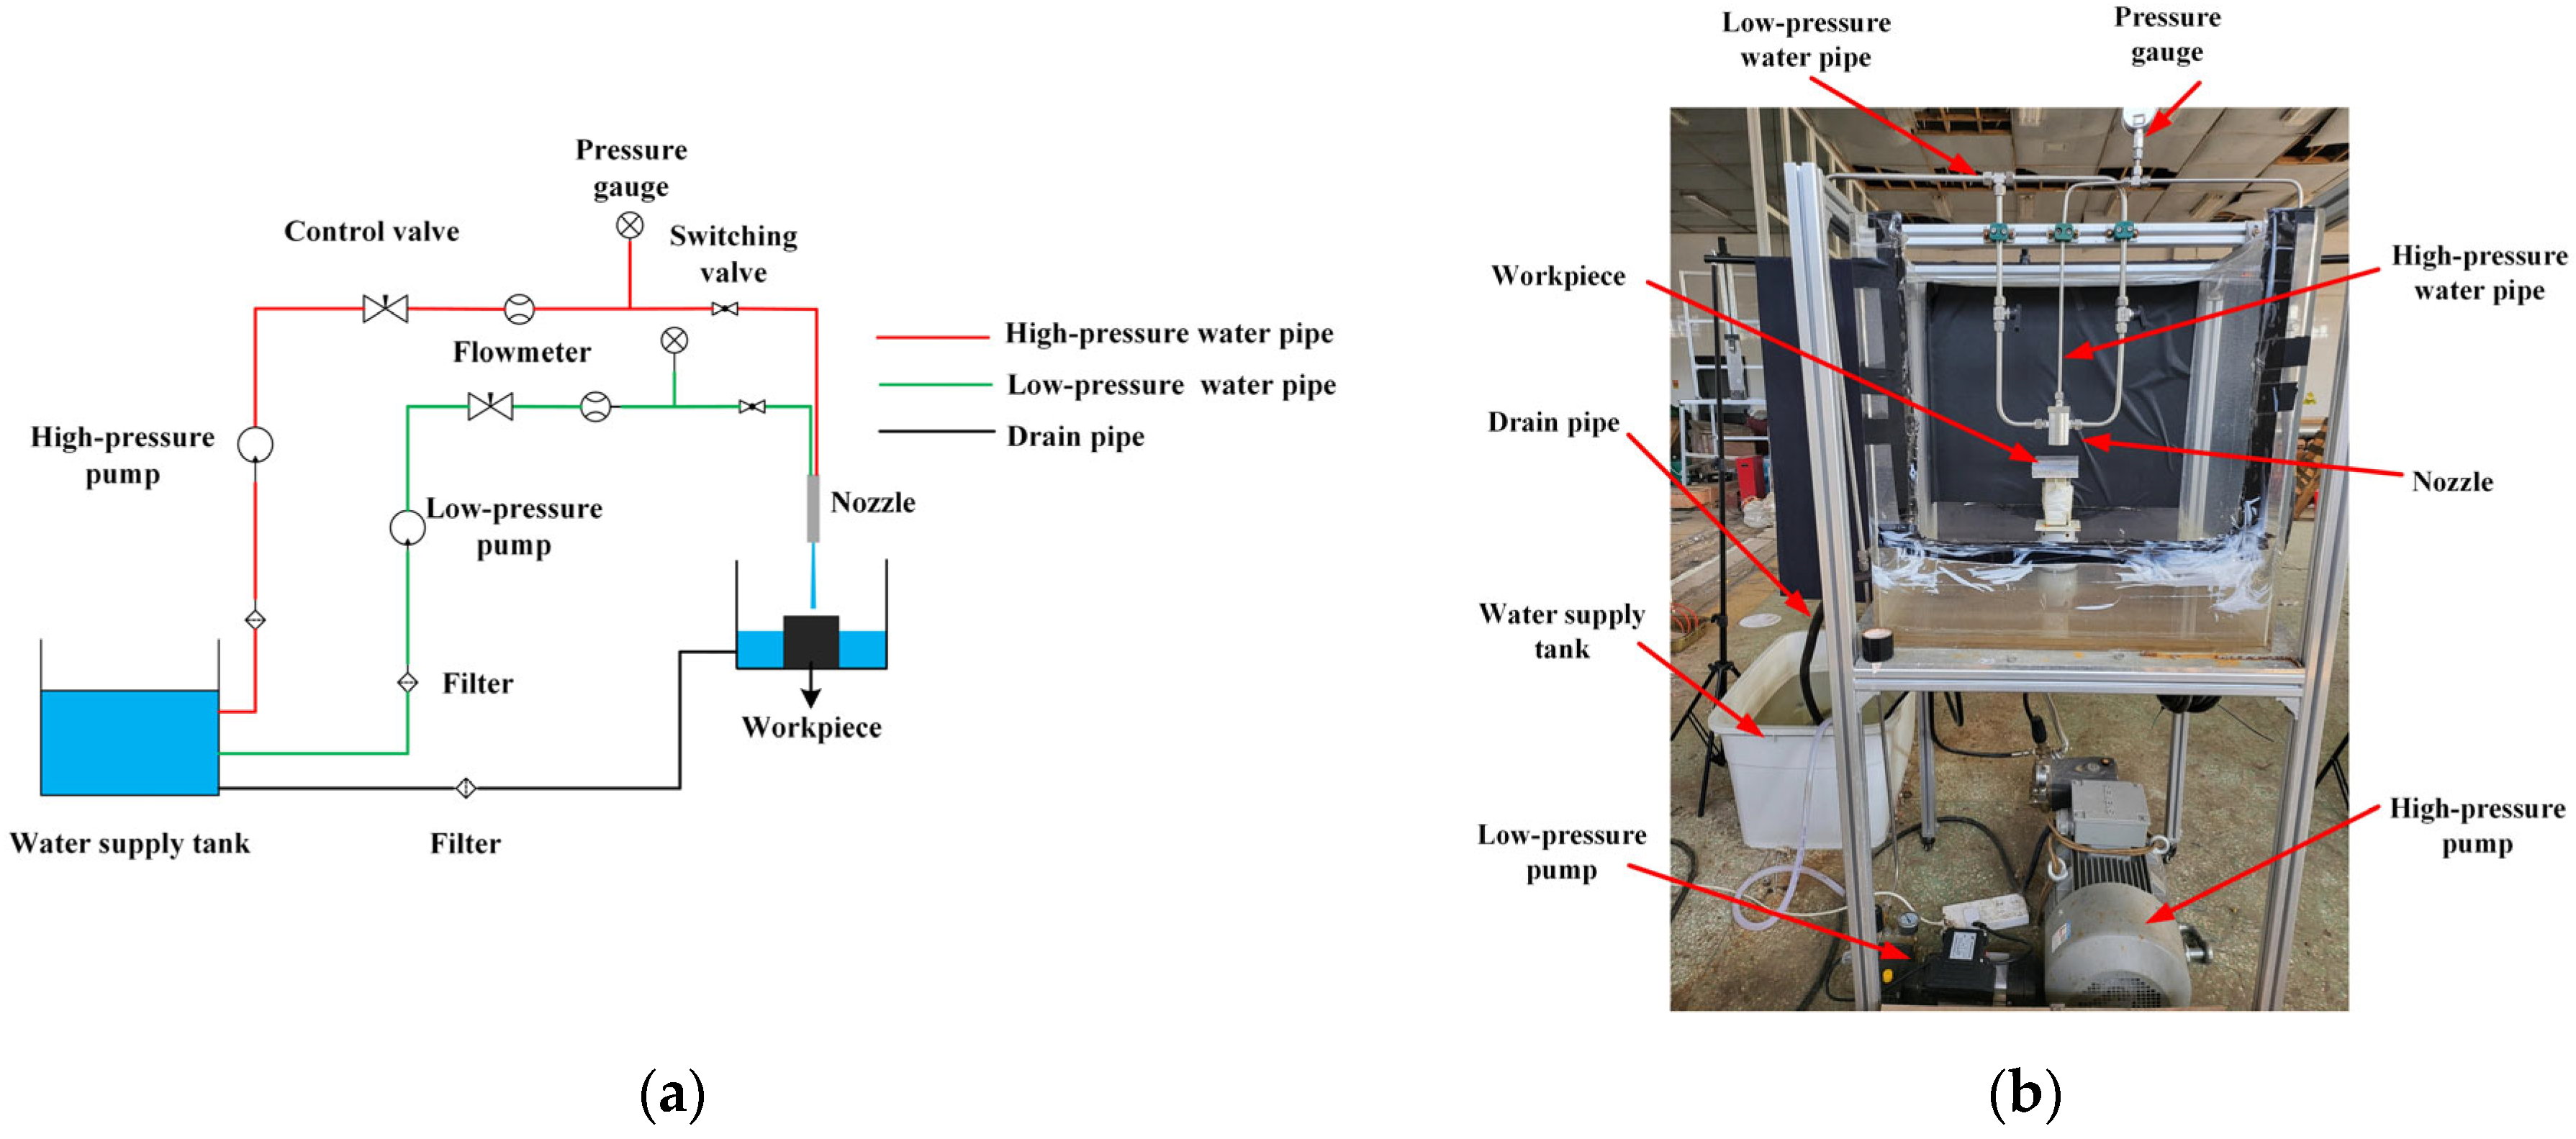
2.4. Experimental Procedure

The schematic diagram and physical diagram of the experimental setup are presented in Figure 2. The experimental apparatus consists of various components, including nozzles, a high-pressure plunger pump, a centrifugal pump, pressure regulating valves, pressure gauges, control valves, flow meters, a water storage tank, and an experimental water tank. In the experiment, a high-pressure plunger pump was utilized to generate upstream pressure, reaching a maximum of 30 MPa, and providing a flow rate of 15 L/min. The outlet pressure was monitored using a pressure gauge. Ordinary tap water was employed, with an inlet filter installed to eliminate impurities and ensure proper pump operation. Neglecting pressure losses in the pipeline between the high-pressure pump and the nozzle, the flow meter was used to measure the water flow rate. The artificial submerged cavitation water jet nozzle comprises two concentric parts: an inner section for the high-pressure water jet and an outer section for the coaxial low-pressure water jet. The nozzle was securely mounted on a bracket to prevent any displacement during the experiment. The analysis of the erosion mechanism of the artificially submerged cavitation jet was carried out by using a Phantom camera to obtain the macroscopic surface morphology of the workpiece surface before and after the erosion experiments. The cavitation intensity of the artificial submerged cavitation jet was evaluated by measuring the mass loss in Aluminum 1060 (Chinese Industrial Standard). The chemical composition and physical properties of the workpiece are shown in Table 2 and Table 3 [36].

3. Results and Discussion

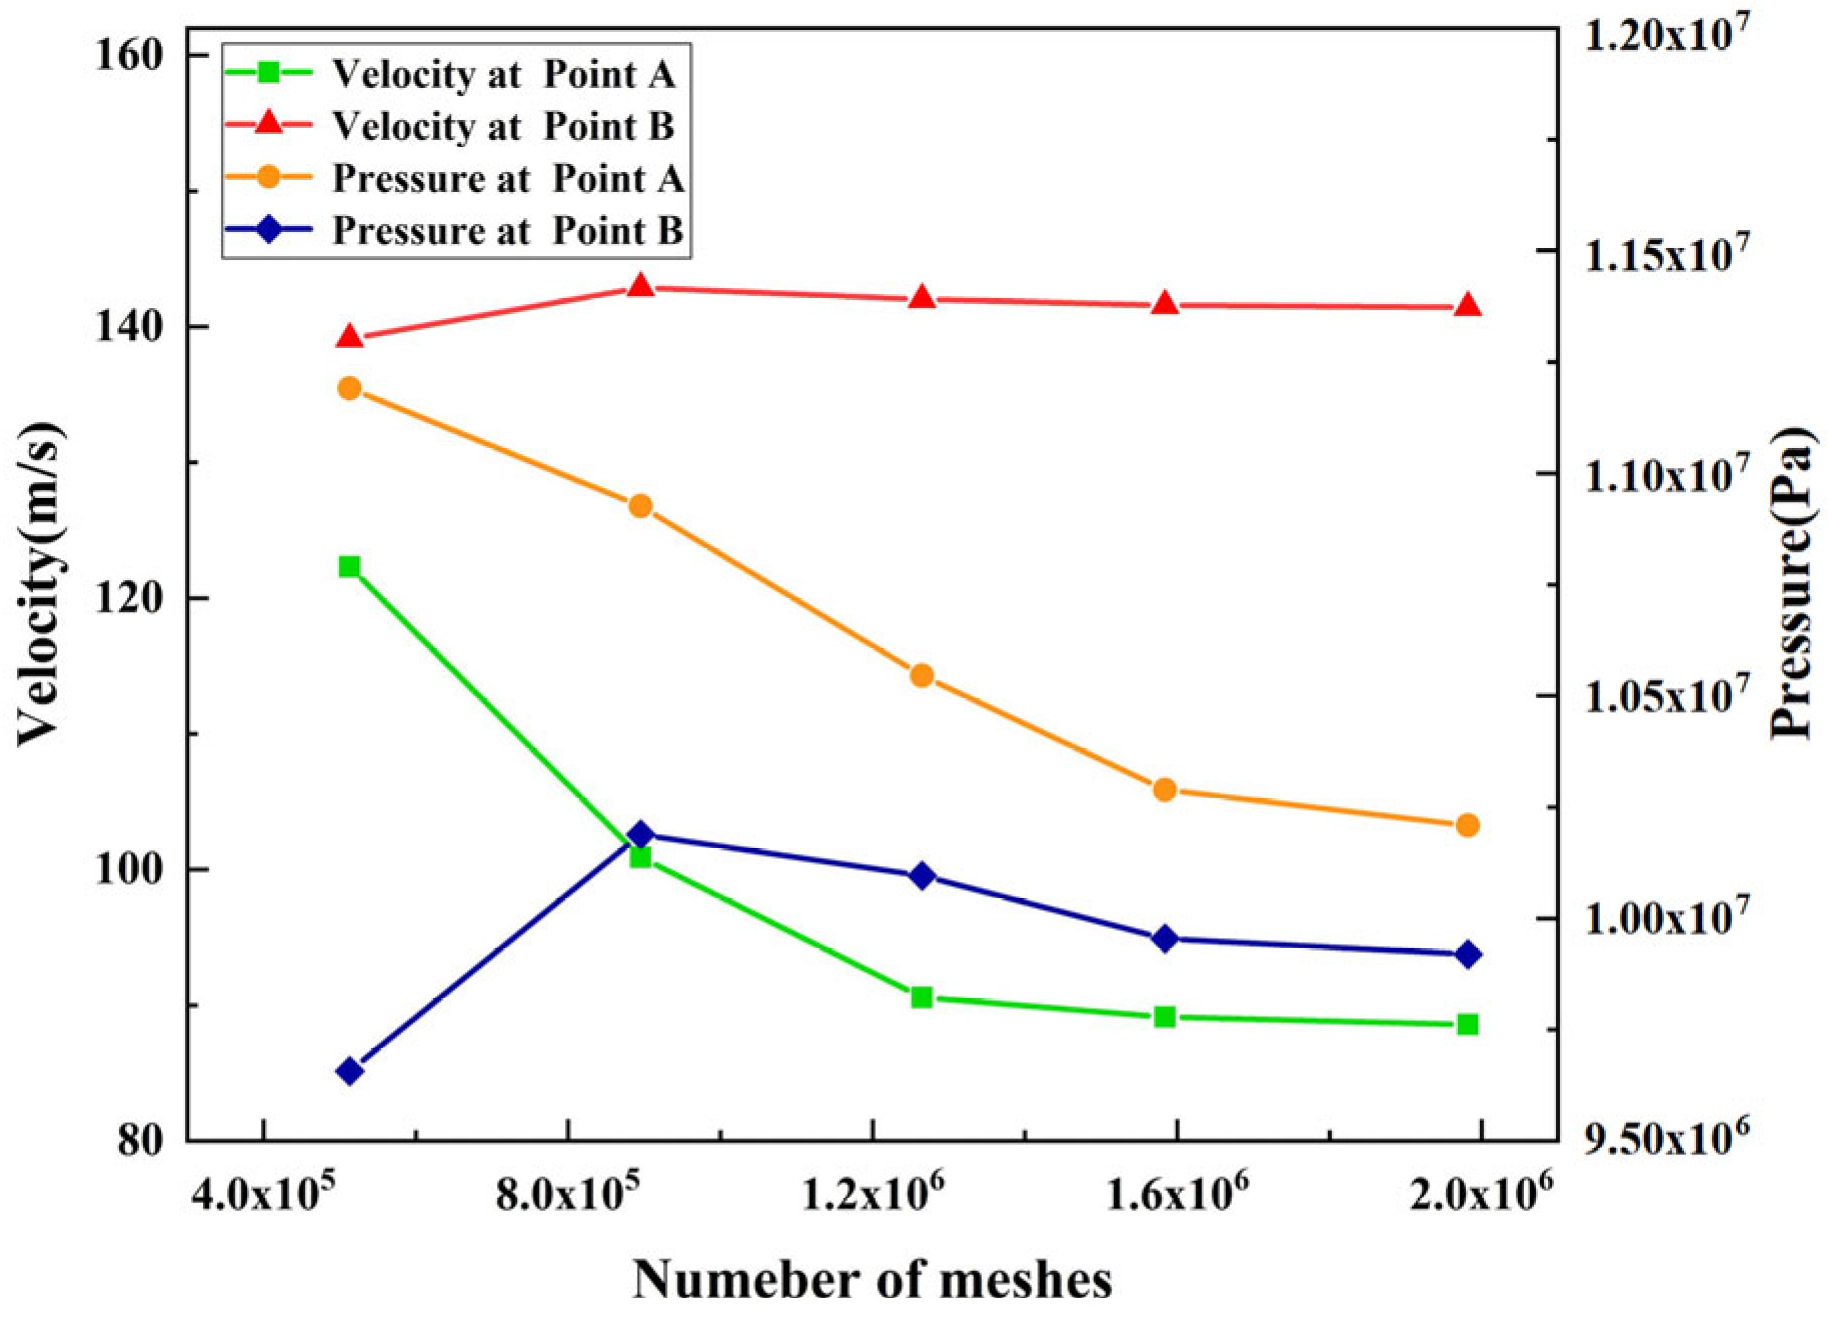
3.1. Mesh Independence Analysis

For the simulation of fluid dynamics, mesh independence verification is essential. The mesh independence analysis based on the above conditions is shown in Figure 3, where high-pressure inlet PH and low-pressure inlet PL are set to 10 MPa and 0.02 MPa, respectively. The increase in the number of meshes mainly comes from the nozzle throat section. It is observed that with the increase in the number of meshes, there is very little change at two designated points in velocity and pressure. The velocity and pressure at point A (x/d = 30, y/d = 0) and point B (x/d = 40, y/d = 0) tend to stabilize when the number of meshes exceeds 1584125. To achieve a balance between computational accuracy and time efficiency, the cavitation phenomenon of the artificially submerged cavitation water jet is investigated with 1584125 meshes.

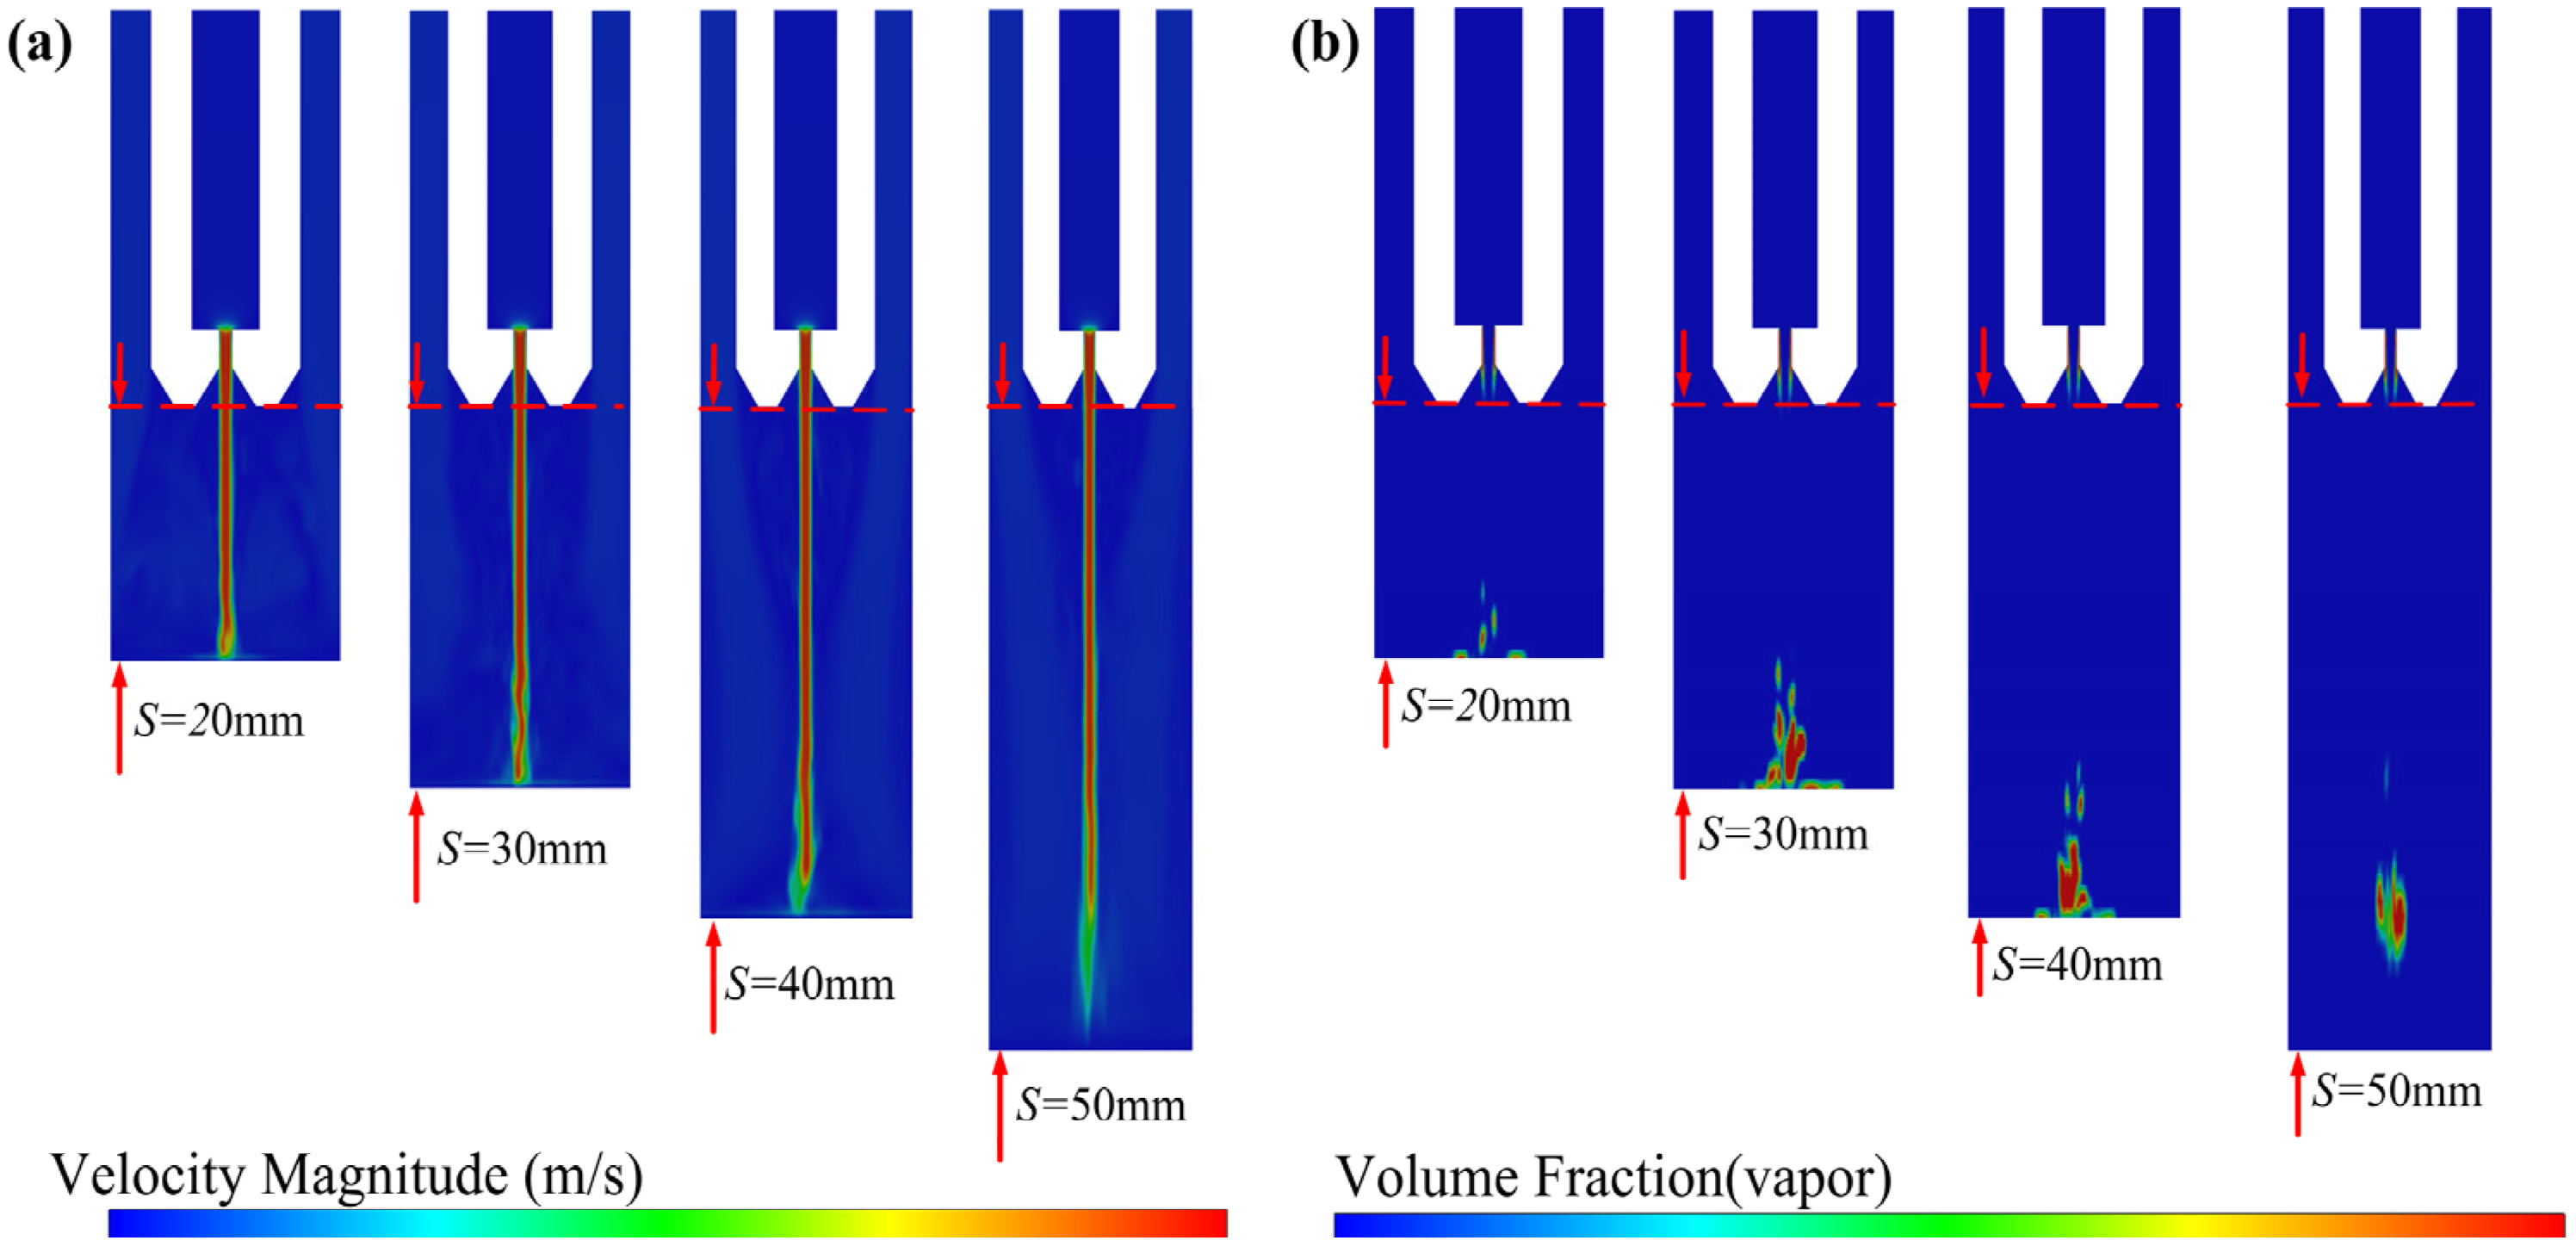
3.2. Effects of Dimensionless Standoff Distance between Nozzle and Workpiece

Figure 4 illustrates the velocity contour map and vapor volume fraction distribution at different standoff distances between the nozzle and workpiece in the flow field. As shown in Figure 4, it is evident that as the standoff distance of the artificially submerged cavitation water jet increases, the core jet beam within the jet flow field extends further. Due to spatial limitations, the number and size of cavitation clouds within the flow field decrease at shorter standoff distances. At a dimensionless standoff distance of SD = 20, the core jet beam approaches the workpiece surface inside the flow field. Only a small number of smaller cavitation clouds are produced in the flow field, indicating that due to the limitations of the standoff distance, the initial cavitation bubbles within the flow field fail to grow completely before contacting the workpiece surface and thus collapse. At dimensionless standoff distances of SD = 30 and SD = 40, the number and volume of cavitation clouds inside the flow field increase, providing conducive conditions for the growth and development of initial cavitation bubbles and space. At a dimensionless standoff distance of SD = 50, the cavitation cloud within the flow field remains a certain distance away from the workpiece surface, indicating that fully developed cavitation nuclei are likely to collapse before contacting the workpiece surface. In brief, standoff distance that is either too short or too long may diminish the cavitation generated within the flow field and its consequential impact on the workpiece surface.
Due to the unsteady characteristics of cavitation clouds and the potential impact of time on numerical simulation results, further exploration of the distribution patterns of cavitation clouds in the artificially submerged cavitation jet flow field at different time points is necessary. The periodic variation in vapor volume fraction distribution in the flow field is depicted in Figure 5 when the dimensionless standoff distance is SD = 20. For short target distances, cavitation clouds within the flow field exhibit fewer numbers and smaller volumes at different time points. The Space limitations prevent initial cavitation bubbles from experiencing optimal development conditions and growth processes within the flow field. The initial cavitation bubbles in the flow field rapidly contact the wall, leading to their collapse and dissipation.
At the dimensionless standoff distance of SD = 30, the periodic variation in vapor volume fraction distribution in the flow field is depicted in Figure 6. Compared to SD = 20, both the number and volume of cavitation clouds within the flow field increased at this dimensionless standoff distance. An evident periodic pattern is observed in the development process of cavitation clouds within the flow field. At T = 4ΔT, initial cavitation bubbles emerge within the flow field. Over time, cavitation bubbles gradually enlarge, forming larger cavitation nuclei within the flow field, as depicted in Figure 6 at T = 36ΔT.
At the dimensionless standoff distance of SD = 40, the periodic variation in vapor volume fraction distribution in the flow field is depicted in Figure 7. A comparison of the vapor volume fraction cloud diagrams within the flow field at T = 16ΔT and T = 36ΔT reveals that with a further increase in the target distance by 10 mm, the cavitation core with the highest volume fraction within the flow field progressively enlarges as it approaches the wall, exhibiting a decreasing trend. The cavitation effect may be weakened compared to the case when SD = 30.
Figure 8 illustrates the periodic variation in vapor volume fraction distribution on the workpiece surface at the dimensionless standoff distance of SD = 20. An observation of the figure indicates that at shorter target distances, the cavitation cloud generated within the flow field continuously and intensely impacts the workpiece surface, resulting in the formation of a cavitation cloud on the workpiece surface. Consequently, a distinctive annular region is formed. However, an analysis of the vapor volume fraction distribution reveals that the volume of cavitation cloud on the workpiece surface is not significant. This suggests that, despite favorable conditions for the growth and development of the initial cavitation bubbles, it does not thrive optimally due to spatial constraints. Before reaching full development as a cavitation core with the highest vapor volume fraction, the cavitation cloud within the flow field starts contacting the workpiece surface and subsequently collapses.
Figure 9 depicts the periodic variation in vapor volume fraction distribution on the workpiece surface at the dimensionless standoff distance of SD = 30. A comparison of the vapor volume fraction cloud diagrams within the flow field at T = 12ΔT and T = 24ΔT reveals that with a 10 mm increase from the standoff distance to the workpiece surface, the cavitation cloud generated within the flow field exhibits a more pronounced periodicity on the workpiece surface. Additionally, it requires 12ΔT for the vapor volume fraction to increase from 0.2 to 0.5. Simultaneously, there is a significant increase in the annular area of the cavitation cloud at the wall, indicating an augmentation in the volume of the cavitation cloud within the flow field following a relatively robust development process. Furthermore, observation reveals that at T = 12ΔT, the cavitation cloud at the workpiece surface manifests in an overlapping ring shape, while the shape of the cavitation cloud at the center resembles that at T = 0. This indicates that at this juncture, as the cavitation cloud on the workpiece surface spreads from the preceding cycle, a new periodic cavitation cloud emerges and interacts with the workpiece surface, perpetuating a continuous impact on the workpiece surface.
Figure 10 depicts the periodic variation in vapor volume fraction distribution on the workpiece surface at the dimensionless standoff distance of SD = 40. An observation of the figure indicates that when the standoff distance to the workpiece surface is increased by another 10 mm, the periodicity of the cavitation cloud generated near the workpiece surface maintains a distinct pattern. However, presently, there is a reduction in both the number and volume of cavitation clouds near the workpiece surface compared to SD = 30, along with a decrease in the diffusion strike range on the workpiece surface. A total of 12ΔT was required for the transition from the point-like cavitation cloud appearing on the workpiece surface at T = 0 to the annular cavitation cloud with the highest volume fraction emerging at T = 12ΔT. In comparison to the conditions when SD = 30, the period of cavitation clouds is 12ΔT. While the periodicity of cavitation clouds remains relatively unchanged at this juncture, an examination of their distribution reveals a reduction in the number of cavitation clouds. This indicates that the initial cavitation bubbles within the flow field have commenced collapsing and shrinking independently after undergoing a full growth and development stage before engaging with the workpiece surface for impact. Consequently, the internal cavitation effect in the flow field at this point is not as pronounced as when SD = 30.
With an increase in the dimensionless standoff distance, the distribution of cavitation clouds near the wall diminishes, consequently weakening the cavitation effect. At T = 16ΔT, the figure depicts the reappearance of a point-like cavitation cloud like that observed at T = 0 in the central area of the workpiece surface. In comparison to the annular cavitation cloud formed in the central area near the workpiece surface at the dimensionless standoff distance of SD = 30, both the volume and number of cavitation clouds have decreased. This reduction indicates a decrease in the continuity and density of the cavitation cloud distribution on the workpiece surface.
With the gradual increase in the dimensionless standoff distance, the cavitation effect of the cavitation cloud on the workpiece surface initially undergoes enhancement before gradually diminishing. This observation indicates that the dimensionless standoff distance that is excessively long exerts a more pronounced adverse effect on the cavitation effect compared to one that is too short.

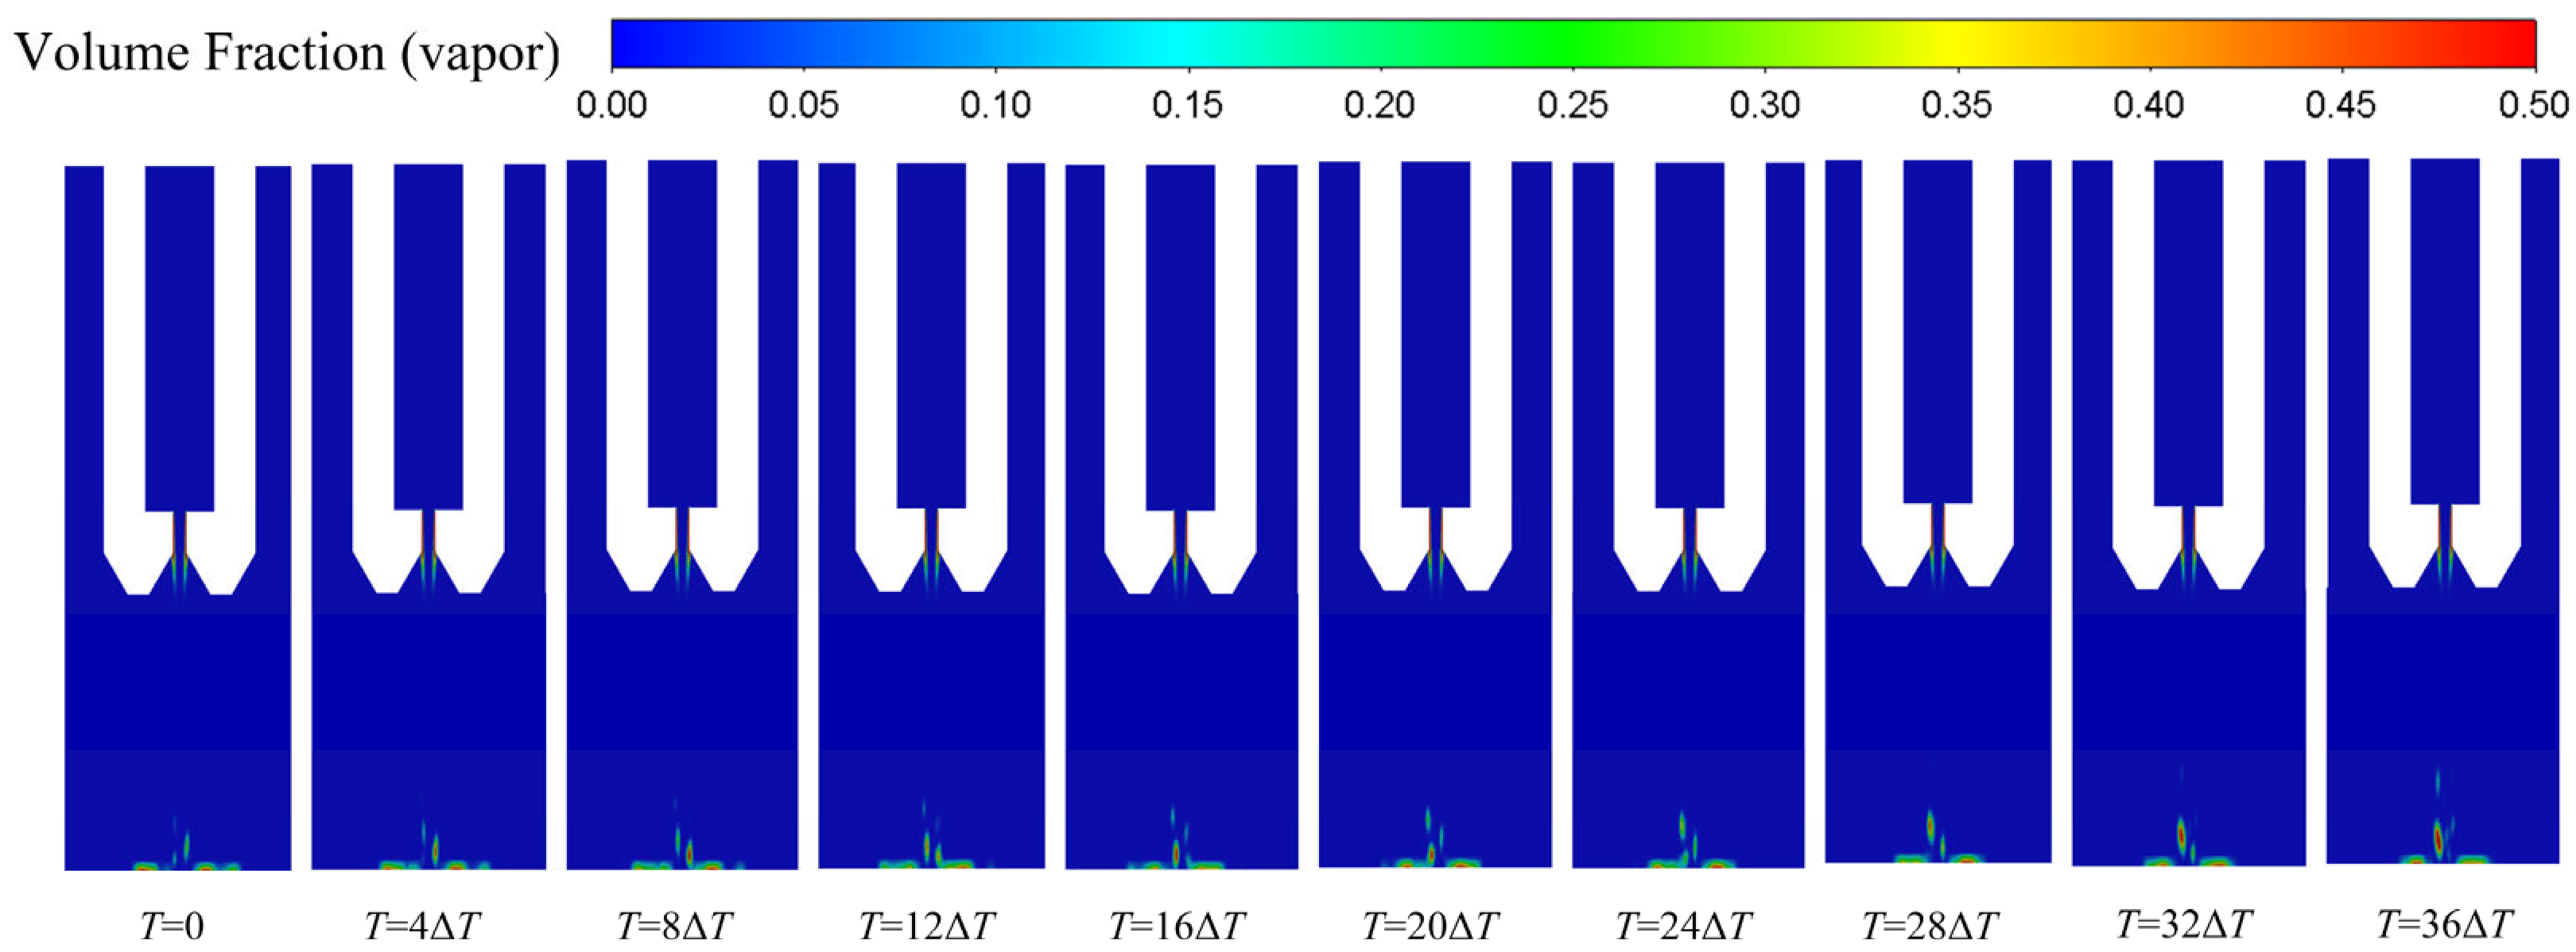
3.3. Effects of Nozzle Structure and High-Pressure Inlet Condition at Different Dimensionless Standoff Distance between the Nozzle and Workpiece

In this section, we investigate the influence of various dimensionless standoff distances on the cavitation effect induced by artificially submerged cavitation water jet using the mass loss method. Simultaneously, we analyze the impact of alterations in the high-pressure inner nozzle pressure and nozzle structural parameters on the erosion effect on the workpiece surface. Initially, the inlet pressure of the high-pressure inner nozzle is modulated via a frequency converter while maintaining the low-pressure outer nozzle pressure at PL = 0.02 MPa. The erosion period spans 30 min, facilitating the generation of influence curves delineating alterations in the inner nozzle pressure and the dimensionless standoff distance, affecting both the mass loss of the workpiece and the dimensionless standoff distance of the artificially submerged cavitation water jet across various structural parameters. To avoid the influence of the errors generated during the experiment on the accuracy of the results, each group of experiments was conducted three times under the same conditions. When the high-pressure inner nozzle pressure is set to PH = 5 MPa, illustrated in Figure 11, the workpiece mass loss Δm progressively rises with the incremental dimensionless standoff distance, reaching a peak at SD = 30, after which it rapidly declines. Prior to SD ≤ 30, it is evident that at δ = 30° and β = 30°, the heightened shear between the two jet beams results in an increased formation of primordial cavitation bubbles within the flow field, intensifying the cavitation effect exerted by the jet on the workpiece surface. Conversely, at SD = 40 mm, with δ = 0° and β = 0°, the cavitation effect on the specimen is most pronounced. This suggests that while augmenting the outer convergent angle can enhance the cavitation intensity within the flow field, it also somewhat impedes the full development of cavitation bubbles within the flow field.
When the high-pressure inner nozzle pressure PH = 10 MPa, as shown in Figure 12, the workpiece mass loss Δm exhibits the same trend characteristics with a gradual increase in the dimensionless standoff distance, and the peak loss occurs at SD = 30. Similarly, regardless of the dimensionless standoff distance, the cavitation effect on the workpiece surface produced by the nozzles with three structural parameters is intensified with the pressure elevation of the high-pressure inner nozzle, with the best elevation effect at δ = 30° and β = 30°. At SD = 40, the cavitation effect is best when the nozzle structural parameters are δ = 0° and β = 0°; as the pressure of the high-pressure inner nozzle is elevated, the cavitation phenomenon inside the flow field is strengthened, the cavitation cloud’s action distance is lengthened, and the cavitation effect is more intense.
When the high-pressure inner nozzle pressure PH = 15 MPa, as shown in Figure 13, all the structural parameters of the artificially submerged water jet on the workpiece surface erosion effect are substantially improved. As observed in the figure, when SD = 10, the artificial submerged cavitation jet flow field is mainly generated by the initial cavitation bubbles from the high-pressure nozzle outlet occupying a dominant position. The two beams of the jet do not completely converge, and the strong shear effect between the jet does not occur completely. So, although there is a certain amount of cavitation effect on the workpiece surface, small erosion pits are formed. As the pressure of the inner nozzle at this point is relatively high, the depth of the etching pit on the workpiece surface is larger, which is due to the high pressure of the jet dominating and limiting the growth and development of time and space; the high-pressure inner nozzle outlet of the initial cavitation bubbles on the workpiece surface only play a small part of the role. At SD = 50, the workpiece surface is farther from the nozzle outlet. The flow field inside the initial cavitation bubbles after the full development may have collapsed before contacting the surface of the workpiece surface, and only a small portion of the cavitation bubble successfully strikes the workpiece, resulting in cavitation. As can be seen in Figure 13, the workpiece surface at this point presents a wide range of scattered erosion pits, and the depth of the pits is not large. This indicates that with an increase in the dimensionless standoff distance, the jet gradually diffuses outward. The flow field inside the cavitation bubble spreads to the surroundings, and it is difficult for the high-pressure core of the jet beam to act on the workpiece surface. At this point, the pits of the workpiece surface are mainly formed by the shear effect of a large number of cavitation bubbles. However, due to the excessively long dimensionless standoff distance, the cavitation strength is greatly reduced.

4. Conclusions

This paper investigates and analyzes the effect of dimensionless standoff distance on the periodic distribution of cavitation clouds within the flow field of artificially submerged cavitation water jet and on the workpiece surface using numerical simulation methods. The results of numerical simulations are corroborated by erosion experiments, and the impacts of the nozzle structural parameters and the high-pressure inner nozzle on the erosion characteristics of the artificially submerged cavitation water jet are examined. The findings indicate that an appropriate dimensionless standoff distance SD = 30 can generate more cavitation clouds on the workpiece surface in the numerical simulation results, and the erosion characteristics of the artificially submerged cavitation water jet are most pronounced at SD = 30 in the erosion experiments. The shear effect formed between the two jets plays a crucial role in generating primary cavitation bubbles within the flow field of the artificially submerged cavitation jets. Moreover, increasing the convergent angle between the two jets can significantly enhance the cavitation effect between them, resulting in a more intense cavitation effect. The erosion effect of the artificially submerged cavitation water jet is strongest when δ = 30° and β = 30°, as more cavitation bubbles are generated inside the flow field due to the increase in the convergent angle that strengthens the shear effect between the two jets. Additionally, increasing the pressure of the high-pressure internal nozzle contributes to enhancing the cavitation effect of the artificially submerged cavitating jet. This paper aims to expand the applications of artificially submerged cavitation water jets, encompassing cutting, blasting, and cleaning.

Author Contributions

Conceptualization, H.L. and J.C.; methodology, H.L. and J.C.; software, J.G. and H.L.; validation, H.Z., H.G. and Y.L.; writing—original draft preparation, H.L.; writing—review and editing, Y.L. and H.G. All authors have read and agreed to the published version of the manuscript.

Funding

This work was funded by the Pipe China Eastern Crude Oil Storage and Transportation Co., Ltd. (No. GWHT20220003812), and the Eyas Program Incubation Project of Zhejiang Provincial Administration for Market Regulation (No. CY2023107).

Institutional Review Board Statement

Not applicable.

Informed Consent Statement

Not applicable.

Data Availability Statement

The data presented in this study are available upon request from the corresponding author.

Conflicts of Interest

The authors declare that this study received funding from Pipe China Eastern Crude Oil Storage and Transportation Co., Ltd. The funder was not involved in the study design, collection, analysis, interpretation of data, the writing of this article or the decision to submit it for publication.

References

  1. Young, F.R. Cavitation; World Scientific: Singapore, 1999. [Google Scholar]
  2. Soyama, H. Cavitation peening: A review. Metals 2020, 10, 270. [Google Scholar] [CrossRef]
  3. Soyama, H. High-speed observation of a cavitating jet in air. J. Fluids Eng. 2005, 127, 1095–1101. [Google Scholar] [CrossRef]
  4. Rayleigh, L. VIII. On the pressure developed in a liquid during the collapse of a spherical cavity. Lond. Edinb. Dublin Philos. Mag. J. Sci. 1917, 34, 94–98. [Google Scholar] [CrossRef]
  5. Noltingk, B.E.; Neppiras, E.A. Cavitation produced by ultrasonics. Proc. Phys. Society. Sect. B 1950, 63, 674. [Google Scholar] [CrossRef]
  6. Ivany, R.D.; Hammitt, F.G. Cavitation bubble collapse in viscous, compressible liquids—Numerical analysis. J. Basic Eng. 1965, 87, 977–985. [Google Scholar] [CrossRef]
  7. Ye, L.; Zhu, X.; Liu, Y. Numerical study on dual-frequency ultrasonic enhancing cavitation effect based on bubble dynamic evolution. Ultrason. Sonochem. 2019, 59, 104744. [Google Scholar] [CrossRef] [PubMed]
  8. Laguna-Camacho, J.; Lewis, R.; Vite-Torres, M.; Mendez-Mendez, J.V. A study of cavitation erosion on engineering materials. Wear 2013, 301, 467–476. [Google Scholar] [CrossRef]
  9. Soyama, H. Effect of nozzle geometry on a standard cavitation erosion test using a cavitating jet. Wear 2013, 297, 895–902. [Google Scholar] [CrossRef]
  10. Hattori, S.; Hirose, T.; Sugiyama, K. Prediction method for cavitation erosion based on measurement of bubble collapse impact loads. Wear 2010, 269, 507–514. [Google Scholar] [CrossRef]
  11. Ashrafizadeh, S.M.; Ghassemi, H. Experimental and numerical investigation on the performance of small-sized cavitating venturis. Flow Meas. Instrum. 2015, 42, 6–15. [Google Scholar] [CrossRef]
  12. Coutier-Delgosha, O.; Stutz, B.; Vabre, A.; Legoupil, S. Analysis of cavitating flow structure by experimental and numerical investigations. J. Fluid Mech. 2007, 578, 171–222. [Google Scholar] [CrossRef]
  13. Wang, Z.; Huang, B.; Zhang, M.; Wang, G. Experimental and numerical investigation of ventilated cavitating flow structures with special emphasis on vortex shedding dynamics. Int. J. Multiph. Flow 2018, 98, 79–95. [Google Scholar] [CrossRef]
  14. Chen, Y.; Hu, Y.; Zhang, S. Structure optimization of submerged water jet cavitating nozzle with a hybrid algorithm. Eng. Appl. Comput. Fluid Mech. 2019, 13, 591–608. [Google Scholar] [CrossRef]
  15. Qiu, T.; Wang, K.; Lei, Y.; Wu, C.; Liu, Y.; Chen, X.; Guo, P. Investigation on effects of back pressure on submerged jet flow from short cylindrical orifice filled with diesel fuel. Energy 2018, 162, 964–976. [Google Scholar] [CrossRef]
  16. Wu, X.-Y.; Zhang, Y.-Q.; Tan, Y.-W.; Li, G.-S.; Peng, K.-W.; Zhang, B. Flow-visualization and numerical investigation on the optimum design of cavitating jet nozzle. Pet. Sci. 2022, 19, 2284–2296. [Google Scholar] [CrossRef]
  17. Dular, M.; Coutier-Delgosha, O. Numerical modelling of cavitation erosion. Int. J. Numer. Methods Fluids 2009, 61, 1388–1410. [Google Scholar] [CrossRef]
  18. Luo, X.; Qian, Z.; Wang, X.; Yu, A. Mode vortex and turbulence in ventilated cavitation over hydrofoils. Int. J. Multiph. Flow 2022, 157, 104252. [Google Scholar] [CrossRef]
  19. Li, X.-s.; Wu, Q.-t.; Miao, L.-y.; Yak, Y.-y.; Liu, C.-b. Scale-resolving simulations and investigations of the flow in a hydraulic retarder considering cavitation. J. Zhejiang Univ.-Sci. A 2020, 21, 817–833. [Google Scholar] [CrossRef]
  20. Liu, C.; Yan, Q.; Wood, H.G. Numerical investigation of passive cavitation control using a slot on a three-dimensional hydrofoil. Int. J. Numer. Methods Heat Fluid Flow 2020, 30, 3585–3605. [Google Scholar] [CrossRef]
  21. Marcon, A.; Melkote, S.N.; Yoda, M. Effect of nozzle size scaling in co-flow water cavitation jet peening. J. Manuf. Process. 2018, 31, 372–381. [Google Scholar] [CrossRef]
  22. Straka, W.A.; Meyer, R.S.; Fontaine, A.A.; Welz, J.P. Cavitation inception in quiescent and co-flow nozzle jets. J. Hydrodyn. Ser. B 2010, 22, 813–819. [Google Scholar] [CrossRef]
  23. Vickers, G.; Harrison, P.; Houlson, R. Extending the range of cavitation cleaning jets. In Proceedings of the Fifth International Symposium on Jet Cutting Technology, Hannover, Germany, 2–4 June 1980; pp. 403–412. [Google Scholar]
  24. Vijay, M.; Zou, C.; Hu, S.; Remisz, J.; Tavoularis, S. A study of the practicality of cavitating water jets. Jet Cut. Technol. 1992, 13, 75–99. [Google Scholar]
  25. Vijey, M.; Brierley, W. Cutting rocks and other materials by cavitating and non-cavitating jets. In Proceedings of the 4th International Symposium on Jet Cutting Technology, Canterbury, UK, 12–14 April 1978; pp. 51–66. [Google Scholar]
  26. Guo, Q.; Huang, X.; Qiu, B. Numerical investigation of the blade tip leakage vortex cavitation in a waterjet pump. Ocean Eng. 2019, 187, 106170. [Google Scholar] [CrossRef]
  27. Peng, K.; Tian, S.; Li, G.; Huang, Z.; Zhang, Z. Cavitation in water jet under high ambient pressure conditions. Exp. Therm. Fluid Sci. 2017, 89, 9–18. [Google Scholar] [CrossRef]
  28. Zhu, R.; Zhu, H.; Zhang, X. Numerical investigation about the unsteady behavior of a free submerged cavitation jet using the SBES approach. Ocean Eng. 2023, 281, 115010. [Google Scholar] [CrossRef]
  29. Yang, Y.; Shi, W.; Tan, L.; Li, W.; Chen, S.; Pan, B. Numerical research of the submerged high-pressure cavitation water jet based on the RANS-LES hybrid model. Shock Vib. 2021, 2021, 6616718. [Google Scholar] [CrossRef]
  30. Kawamura, T.; Sakoda, M. Comparison of bubble and sheet cavitation models for simulation of cavitating flow over a hydrofoil. In Proceedings of the Fifth International Symposium on Cavitation (Cav2003), Osaka, Japan, 1–4 November 2003. [Google Scholar]
  31. Kozubková, M.; Rautová, J.; Bojko, M. Mathematical model of cavitation and modelling of fluid flow in cone. Procedia Eng. 2012, 39, 9–18. [Google Scholar] [CrossRef]
  32. Som, S.; Aggarwal, S.K.; El-Hannouny, E.; Longman, D. Investigation of nozzle flow and cavitation characteristics in a diesel injector. J. Eng. Gas Turbines Power 2010, 132, 042802. [Google Scholar] [CrossRef]
  33. Yang, Y.; Li, W.; Shi, W.; Zhang, W.; A. El-Emam, M. Numerical investigation of a high-pressure submerged jet using a cavitation model considering effects of shear stress. Processes 2019, 7, 541. [Google Scholar] [CrossRef]
  34. Mednikov, A.; Zilova, O.; Tkhabisimov, A.; Dasaev, M.; Grigoriev, S. Parametric Studies of Effect of Cavitation Jet Modes on Wear Rate of Surface of Structural Materials. Metals 2022, 13, 48. [Google Scholar] [CrossRef]
  35. Lin, Y.; Guo, J.; Li, H.; Wang, Z.; Chen, Y.; Huang, H. Improvement of hydrodynamic performance of the disk-shaped autonomous underwater helicopter by local shape modification. Ocean Eng. 2022, 260, 112056. [Google Scholar] [CrossRef]
  36. Dong, J.; Li, S.; Meng, R.; Zhong, X.; Pan, X. Research on Cavitation Characteristics of Two-Throat Nozzle Submerged Jet. Appl. Sci. 2022, 12, 536. [Google Scholar] [CrossRef]
Figure 1. (a) Schematic diagram of the geometric size of the nozzle structure; (b) layout and boundary conditions of simulation domain; (c) hexahedral-structured meshes.
Applsci 14 04804 g001
Figure 2. (a) Schematic diagram and (b) physical diagram of the experimental device.
Applsci 14 04804 g002
Figure 3. Variation in velocity and pressure at point A and point B for different numbers of meshes.
Applsci 14 04804 g003
Figure 4. (a) Velocity contour map and (b) vapor volume fraction distribution at different dimensionless standoff distances between the nozzle and workpiece in the flow field.
Applsci 14 04804 g004
Figure 5. Periodic variation in vapor volume fraction distribution in the flow field when SD = 20.
Applsci 14 04804 g005
Figure 6. Periodic variation in vapor volume fraction distribution in the flow field when SD = 30.
Applsci 14 04804 g006
Figure 7. Periodic variation in vapor volume fraction distribution in the flow field when SD = 40.
Applsci 14 04804 g007
Figure 8. Periodic variation in vapor volume fraction distribution on the workpiece surface when SD = 20.
Applsci 14 04804 g008
Figure 9. Periodic variation in vapor volume fraction distribution on the workpiece surface when SD = 30.
Applsci 14 04804 g009
Figure 10. Periodic variation in vapor volume fraction distribution on the workpiece surface when SD = 40.
Applsci 14 04804 g010
Figure 11. Variation in mass loss with dimensionless standoff distance for artificially submerged cavitation water jet nozzle at different structural parameters when PH = 5 MPa.
Applsci 14 04804 g011
Figure 12. Variation in mass loss with dimensionless standoff distance for artificially submerged cavitation water jet nozzle at different structural parameters when PH = 10 MPa.
Applsci 14 04804 g012
Figure 13. Variation in mass loss with dimensionless standoff distance for artificially submerged cavitation water jet nozzle at different structural parameters when PH = 15 MPa.
Applsci 14 04804 g013
Table 1. Artificial submerged cavitation water jet nozzle dimension.
ParameterValue
d1 mm
L13 mm
L23 mm
δ0, 30°
β0, 30°
D3 mm
S20, 30, 40, 50 mm
ɸw80 mm
SD20, 30, 40, 50
Table 2. Chemical composition of the workpiece (mass%).
AlSiCuMgZnMnTiFe
99.6≤0.25≤0.05≤0.03≤0.05≤0.03≤0.03≤0.35
Table 3. Physical properties of the workpiece.
Density/kg∙m−3Elasticity
Modulus/GPa
Tensile
Strength/MPa
Offset Yield
Strength/MPa
Surface
Roughness/μm
Vickers Hardness
HV0.2
27107180351.531
Disclaimer/Publisher’s Note: The statements, opinions and data contained in all publications are solely those of the individual author(s) and contributor(s) and not of MDPI and/or the editor(s). MDPI and/or the editor(s) disclaim responsibility for any injury to people or property resulting from any ideas, methods, instructions or products referred to in the content.

