Article

Behavior of Circular Hollow Steel-Reinforced Concrete Columns under Axial Compression

1
School of Civil Engineering, Shenyang Jianzhu University, Shenyang 110168, China
2
School of Transportation, Civil Engineering & Architecture, Foshan University, Foshan 528051, China
3
School of Civil Engineering, Dalian Jiaotong University, Dalian 116028, China
*
Author to whom correspondence should be addressed.
Appl. Sci. 2024, 14(11), 4833; https://doi.org/10.3390/app14114833
Submission received: 11 May 2024 / Revised: 29 May 2024 / Accepted: 29 May 2024 / Published: 3 June 2024

Abstract

:
The circular hollow steel-reinforced concrete (HSRC) column consists of an inner circular hollow steel tube and outer circular hollow reinforced concrete (RC). This design provides several advantages, including being lightweight, having a wide sectional profile, and having a high flexural stiffness. This paper aims to investigate the behavior of the circular HSRC columns under axial compression through testing and finite element (FE) modeling. An FE model was established to simulate the circular HSRC columns under axial compression, which was validated against the test data. Additionally, the load distribution and the interface stress between the outer hollow RC and inner steel tube were analyzed. Subsequently, a systematic parametric analysis was conducted on the diameter (d) and thickness (t) of the steel tube; slenderness ratio (λ); strength of concrete (fcu); yield strength of steel tube (fsy), longitudinal rebar (fly), and stirrup (fgy); as well as the stirrup spacing (s). The critical influencing factors of the circular HSRC columns under axial compression were identified. fcu, λ, d, fly, and fsy dramatically influence the bearing capacity, and the stiffness is notably affected by λ and fcu. Finally, three simplified design methods were summarized and evaluated for calculating the bearing capacity of the circular HSRC columns under axial compression.

1. Introduction

The circular hollow steel-reinforced concrete (HSRC) column is a new type of composite concrete-steel member, consisting of outer circular hollow reinforced concrete (RC) and an inner circular hollow steel tube, as illustrated in Figure 1a. These composite members have been extensively used in high-rise buildings and bridge structures [1]. Circular HSRC columns exhibit superior stiffness and ductility compared to concrete-filled steel tubular (CFST) columns thanks to the outer RC. Additionally, they possess lower weight than concrete-encased CFST columns, attributed to the inner hollow steel tube [2]. Moreover, the constraints offered by the outer RC effectively mitigates the occurrence of external buckling in the steel tube (Figure 1b). As depicted in Figure 2, the construction process of circular HSRC columns bears resemblance to that of the concrete-encased CFST columns.
Previous literature primarily concentrates on the restraint and contact between the steel tube and concrete in hollow steel-reinforced concrete (HSRC) members. Wang et al. [1] examined the mechanical behavior of square, octagonal, and box-HSRC columns under axial and eccentric compression. However, they did not consider the restraining effect of the steel tube on the concrete due to the shape of the internal steel tube’s cross-section. Likewise, Won et al. [3] stated that the embedded hollow steel tube not only restricted the peripheral hollow RC section of HSRC members during axial compression, but also enhanced their ductility and prevented brittle failure. In a separate study, Han et al. [4] investigated the restraining effect of the steel tube on the concrete in circular HSRC members using FE analysis. Additionally, Han et al. [5] performed triaxial constraint tests on 14 fan-shaped circular HSRC specimens, providing experimental and theoretical evidence that the embedded hollow steel tube section exerted an internal triaxial constraint on the hollow RC section. Furthermore, Alajarmeh et al. [6] investigated the behavior of circular HSRC columns with a glass-fiber-reinforced polymer (GFRP) reinforcement section under axial compression. They developed a restraint model that accounts for the interaction between longitudinal and transverse reinforcements during transverse restraint. Ren et al. [7] performed eccentric compression tests on eight square HSRC columns and determined that the primary parameter influencing the stress at the interface between the inner steel tube and outer RC was e/B.
Various calculation methods are available for determining the bearing capacity of composite columns under axial compression, including the Australian standard AS 5100.6-2004 [8], the American Institute of Steel Construction code ANSI/AISC [9], the Chinese code DBJ/T13-51-2010 [10], the Architectural Institute of Japan (AIJ) design method [11], and Eurocode 4 [12]. The findings indicate that the above methods tend to be conservative when calculating the bearing capacity of short and slender columns under axial compression. Consequently, some studies have proposed new calculation methods, primarily categorized as the stress-equilibrium method ([2,13,14]) and the nominal slenderness ratio method ([2,11,13,14]). The stress-equilibrium method is employed to calculate the axial compressive bearing capacity of hollow composite members, steel-reinforced concrete members, and box-HSRC members. The AIJ design method [11] incorporates a formula for calculating the axial compressive strength using the nominal slenderness ratio method.
There are few reports available on the behavior of circular HSRC columns under axial compression. This study conducted a test investigation of circular HSRC columns subjected to axial compression and established a validated finite element (FE) model based on the software platform ABAQUS (version 6.14). The load-bearing mechanism and influence parameters of the axial compressive loaded circular HSRC were disclosed and analyzed. The composite interactions between the outer RC and inner steel tube were investigated throughout the entire loading process. Finally, three simplified formulas for calculating the axial bearing capacity of circular HSRC columns were proposed and evaluated based on the principles of limit equilibrium and superposition.
Due to the large slender ratio of the specimen, the concrete cannot be fully vibrated during production, resulting in a deviation between the actual strength and the compressive strength of the concrete cube, which leads to an increase in the deviation of the simulated FE value of the bearing capacity test. The limitations of this study is the lack of research on the impact of concrete shrinkage on strength, and that short-term loading during the experiment does not consider any rheological properties.

2. Experimental Procedures and Results

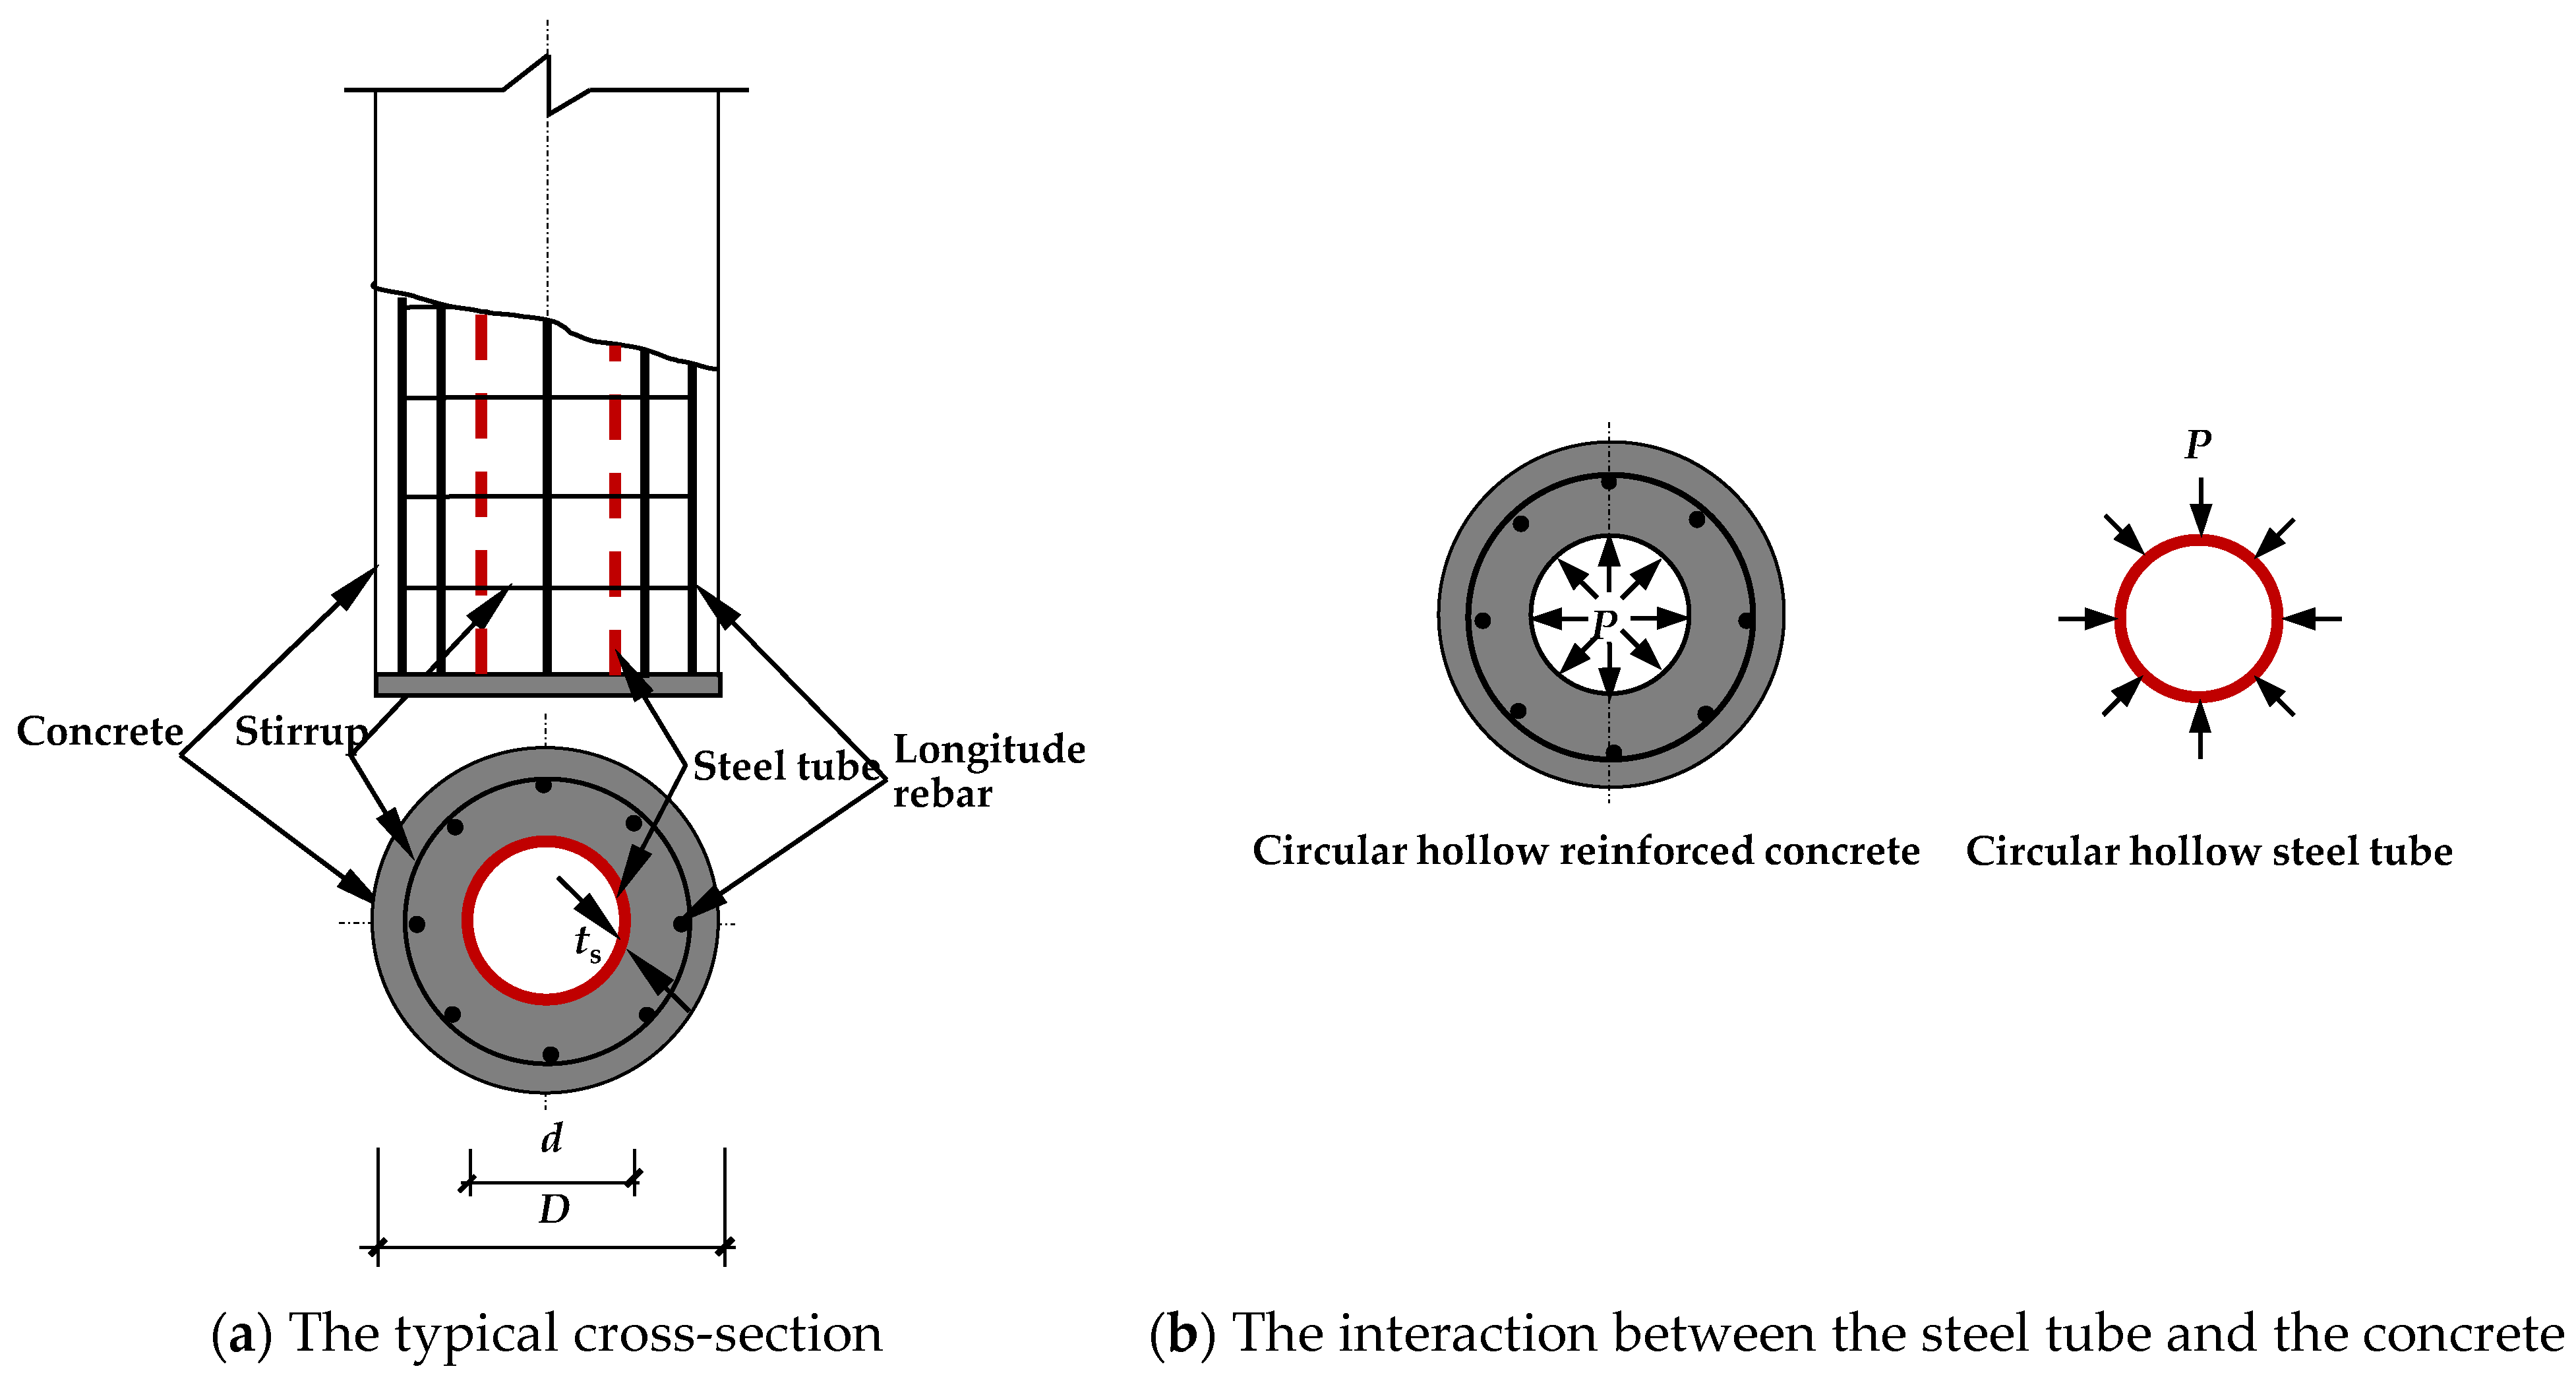
2.1. Experimental Design

Six circular HSRC columns were designed and tested under axial compression. The outer diameter (D) of the specimens was 200 mm, and the diameter (d) and thickness (ts) of the inner hollow steel tube were 80 and 2.78 mm, respectively. Table 1 presents the details of the specimens. The circular HSRC columns were reinforced with eight longitudinal rebars with a diameter of 12.0 mm and stirrups with a diameter of 6.4 mm and spacing of 100 mm. The labels of circular HSRC columns were detailed in Table 1. The first number represents the parameter as the column height (H), where “1” represents H = 1600 mm and “2” represents H = 3200 mm; the second number represents the parameter as the diameter (d) of the steel tube in the circular hollow steel tube part, where “1” represents d = 80 mm and “2” represents d = 100 mm; the last number represents two comparative specimens with the same parameters. Taking specimen 1-1-1 as an example, it represents the first circular HSRC specimen with a column height of 1600 mm and a steel tube diameter of 80 mm.

2.2. Material Properties

Table 2 lists the measured material properties of the steel coupons, including the steel tube, the longitudinal rebars, and the stirrups, where d is the diameter of the steel tube or the reinforcement; ts indicates the thickness of the steel tube; fy and fu represent the yielding strength and ultimate strength, respectively; and Es and νs are the elastic modulus and the Poisson’s ratio, respectively. Table 3 presents the mix proportions of the concrete, the measured strength of the concrete cube at the testing time (fcu,test), its elastic modulus, and its Poisson’s ratio.

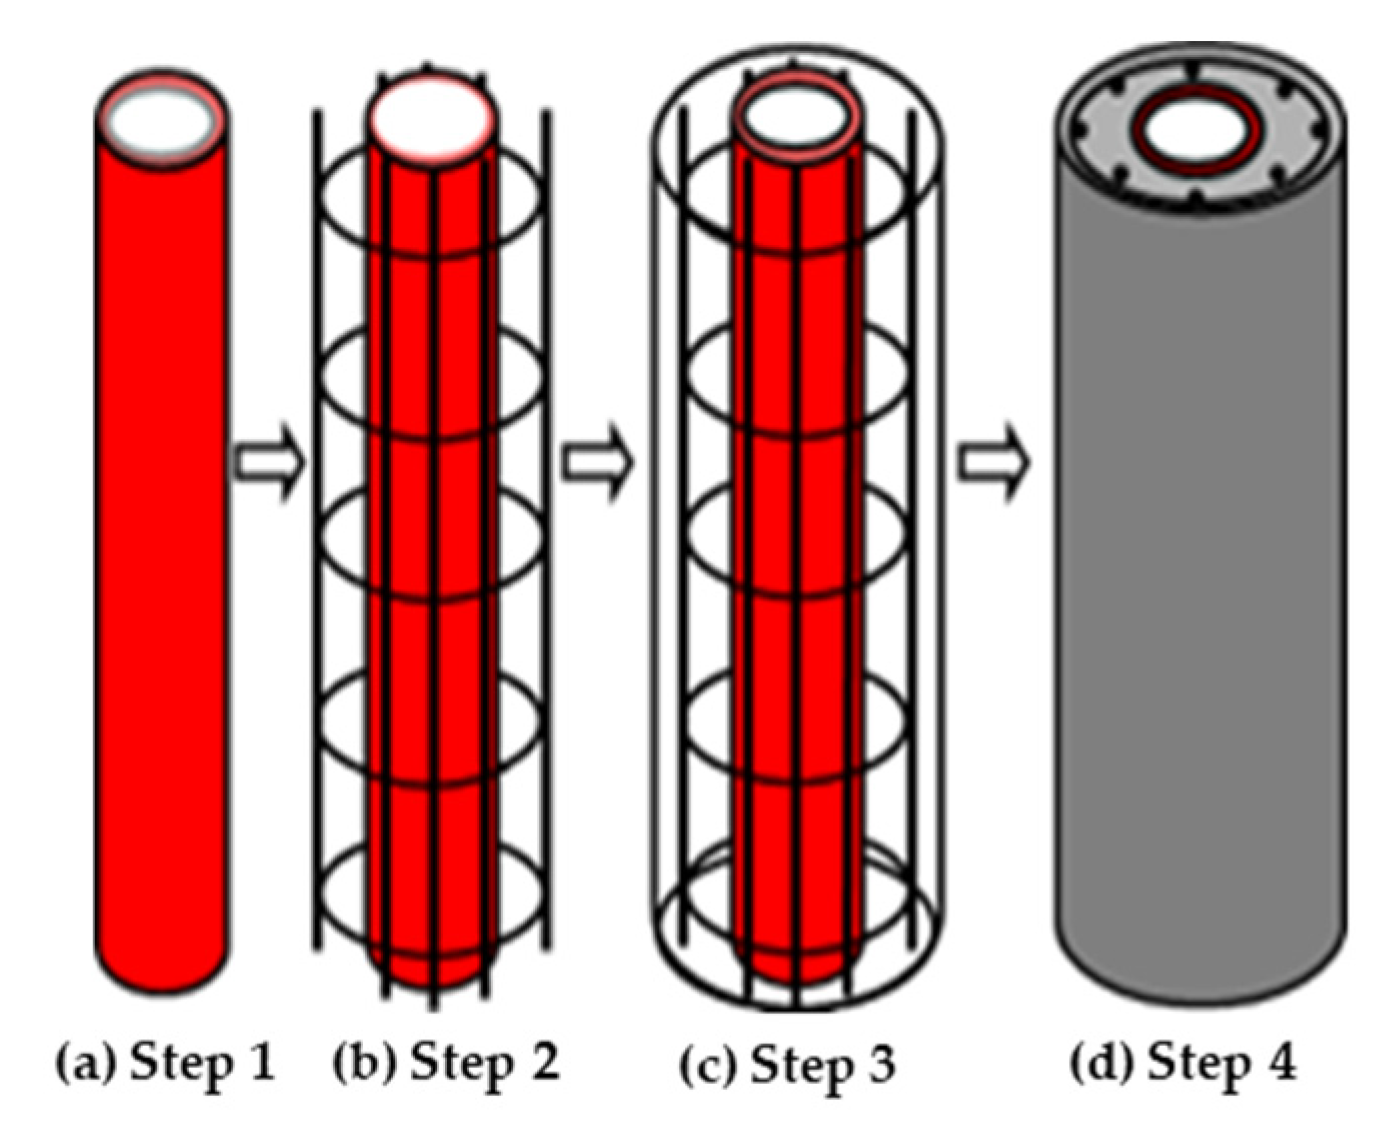
2.3. Specimen Preparation

Figure 2 shows the construction process, which was generally divided into four stages: (a) The hollow steel tube was located at the correct position (Welding on rigid end plates); (b) the rebar was bounded (The steel bars are welded to the fixed hollow steel tube end plate according to the position shown in the Figure 2b); (c) the supporting formwork was sized on the outside (The end plate on the other side is welded to the hollow steel tube and rebar in the same way); (d) the concrete was poured in the formwork. The loading force is first applied to the end plate and indirectly transmitted to the rebars and hollow steel tube.

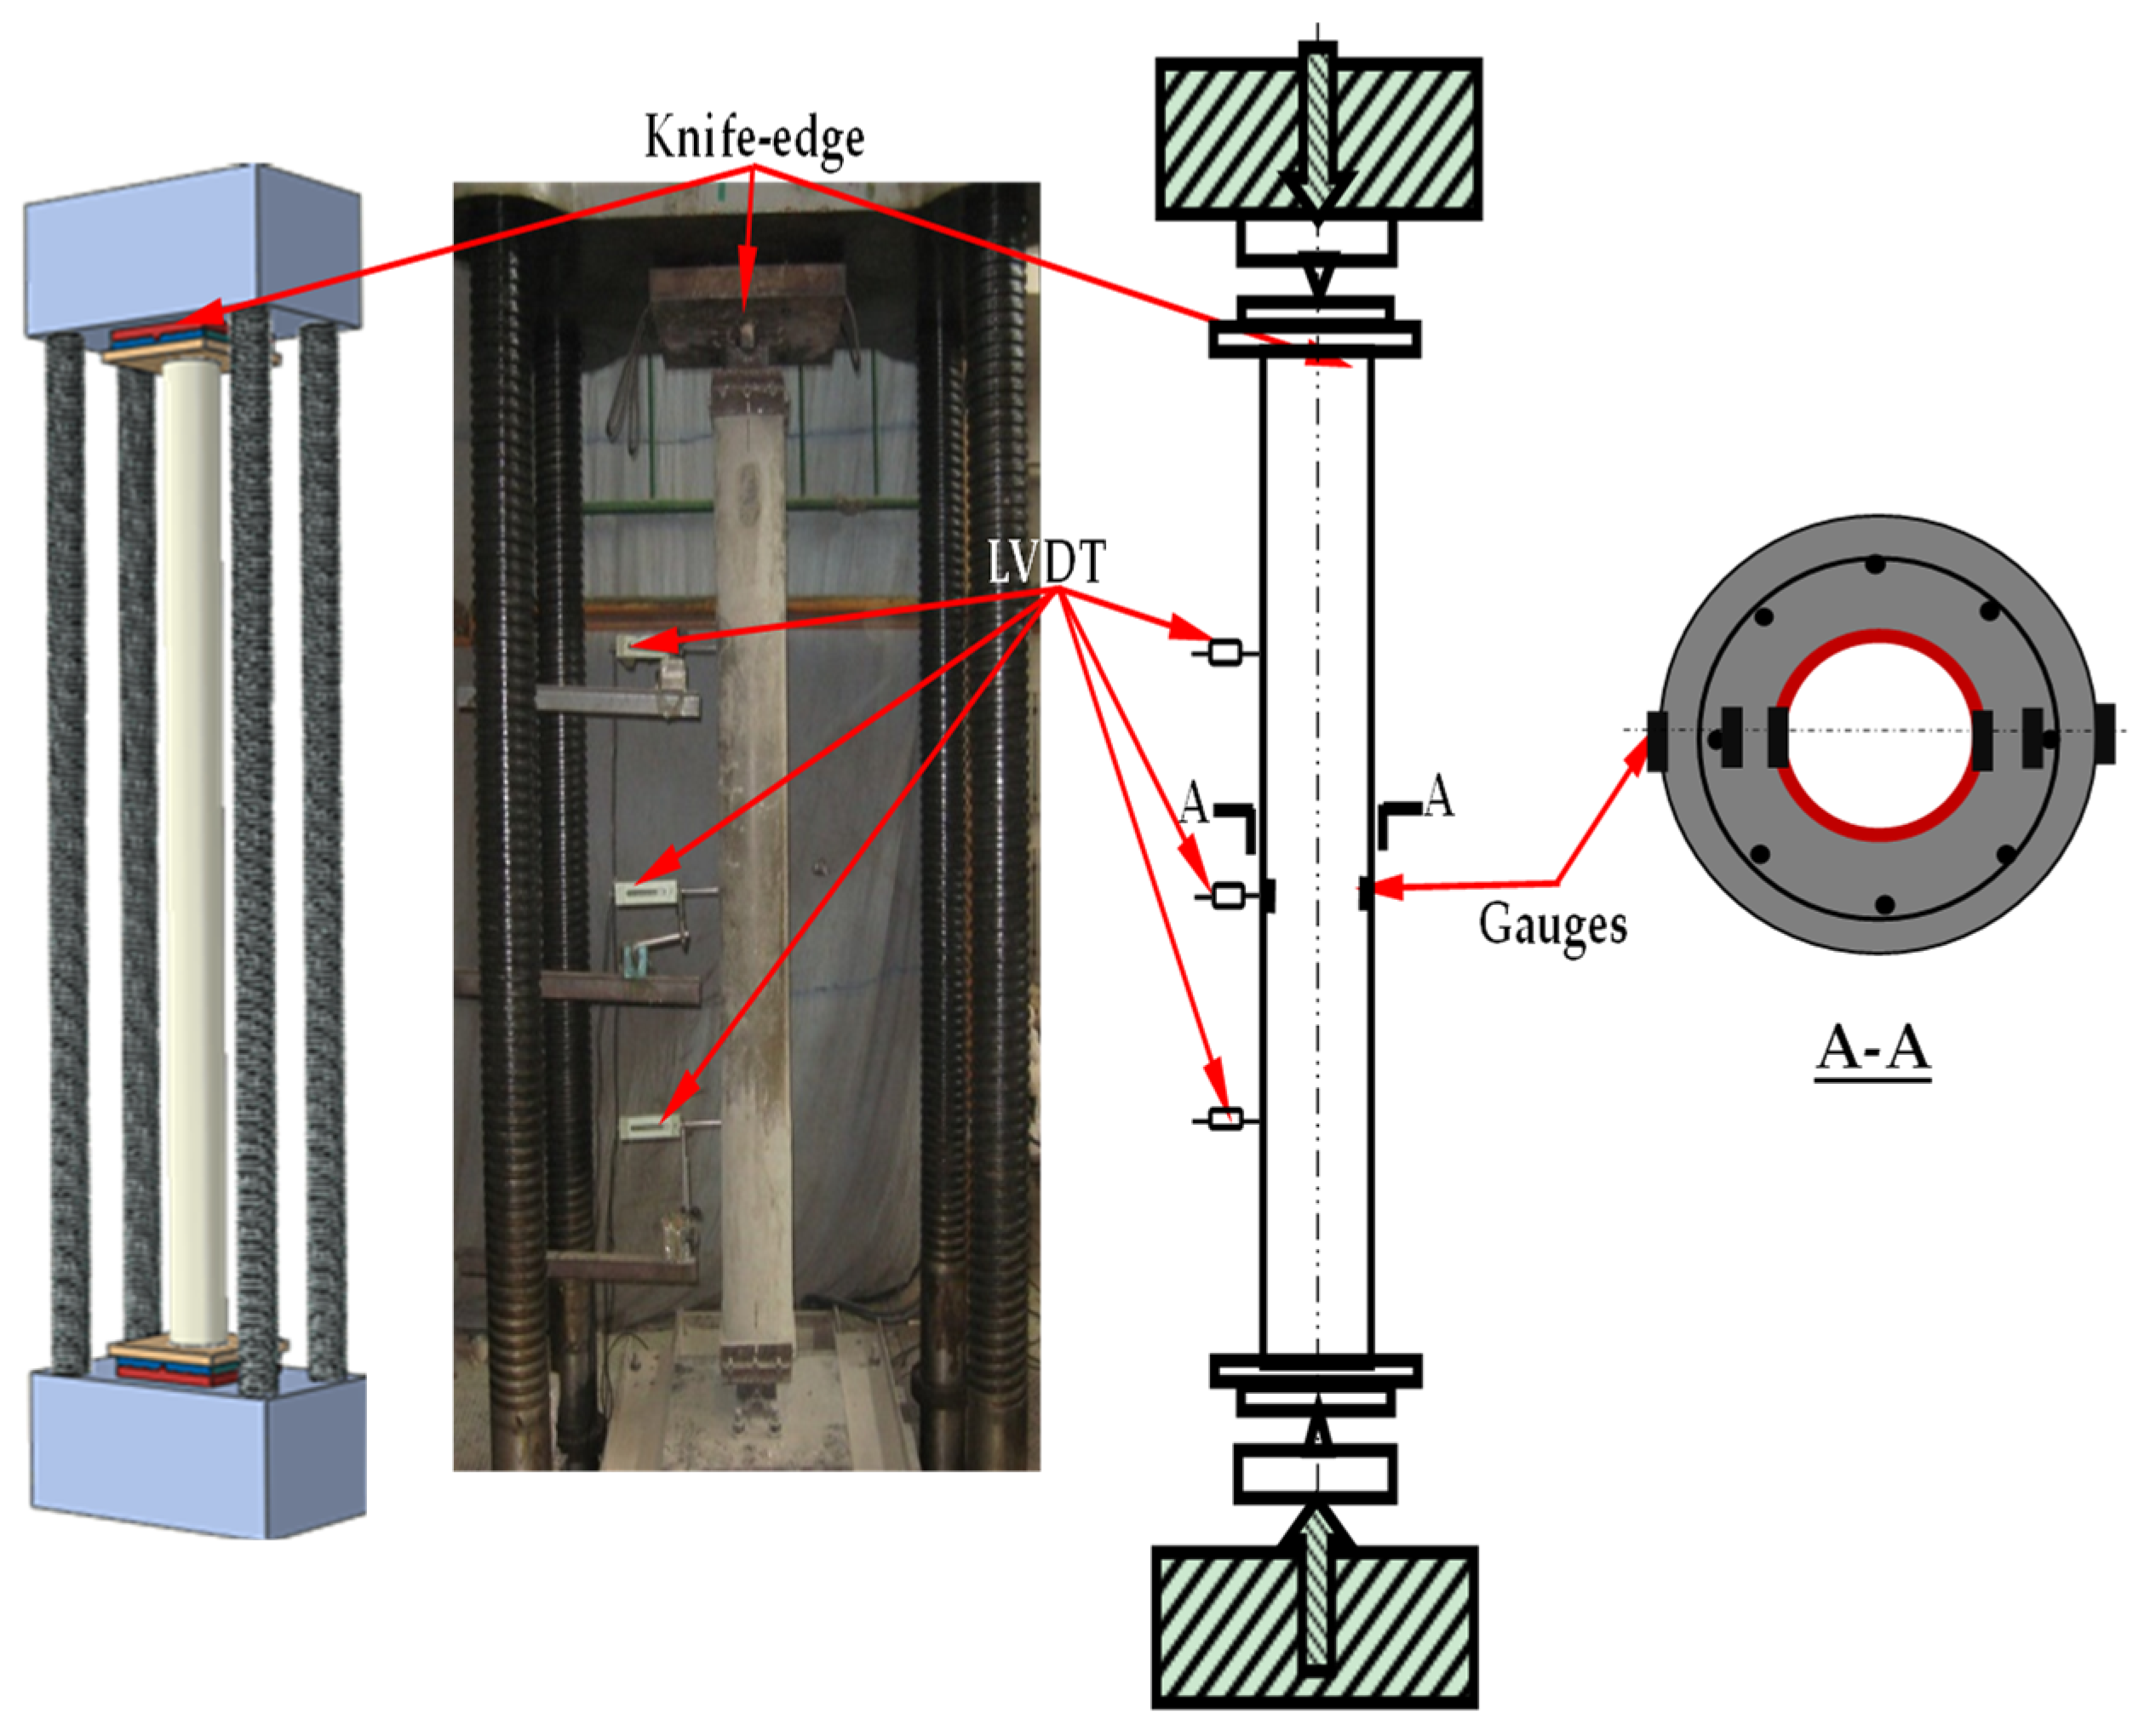
2.4. Test Setup and Measurements
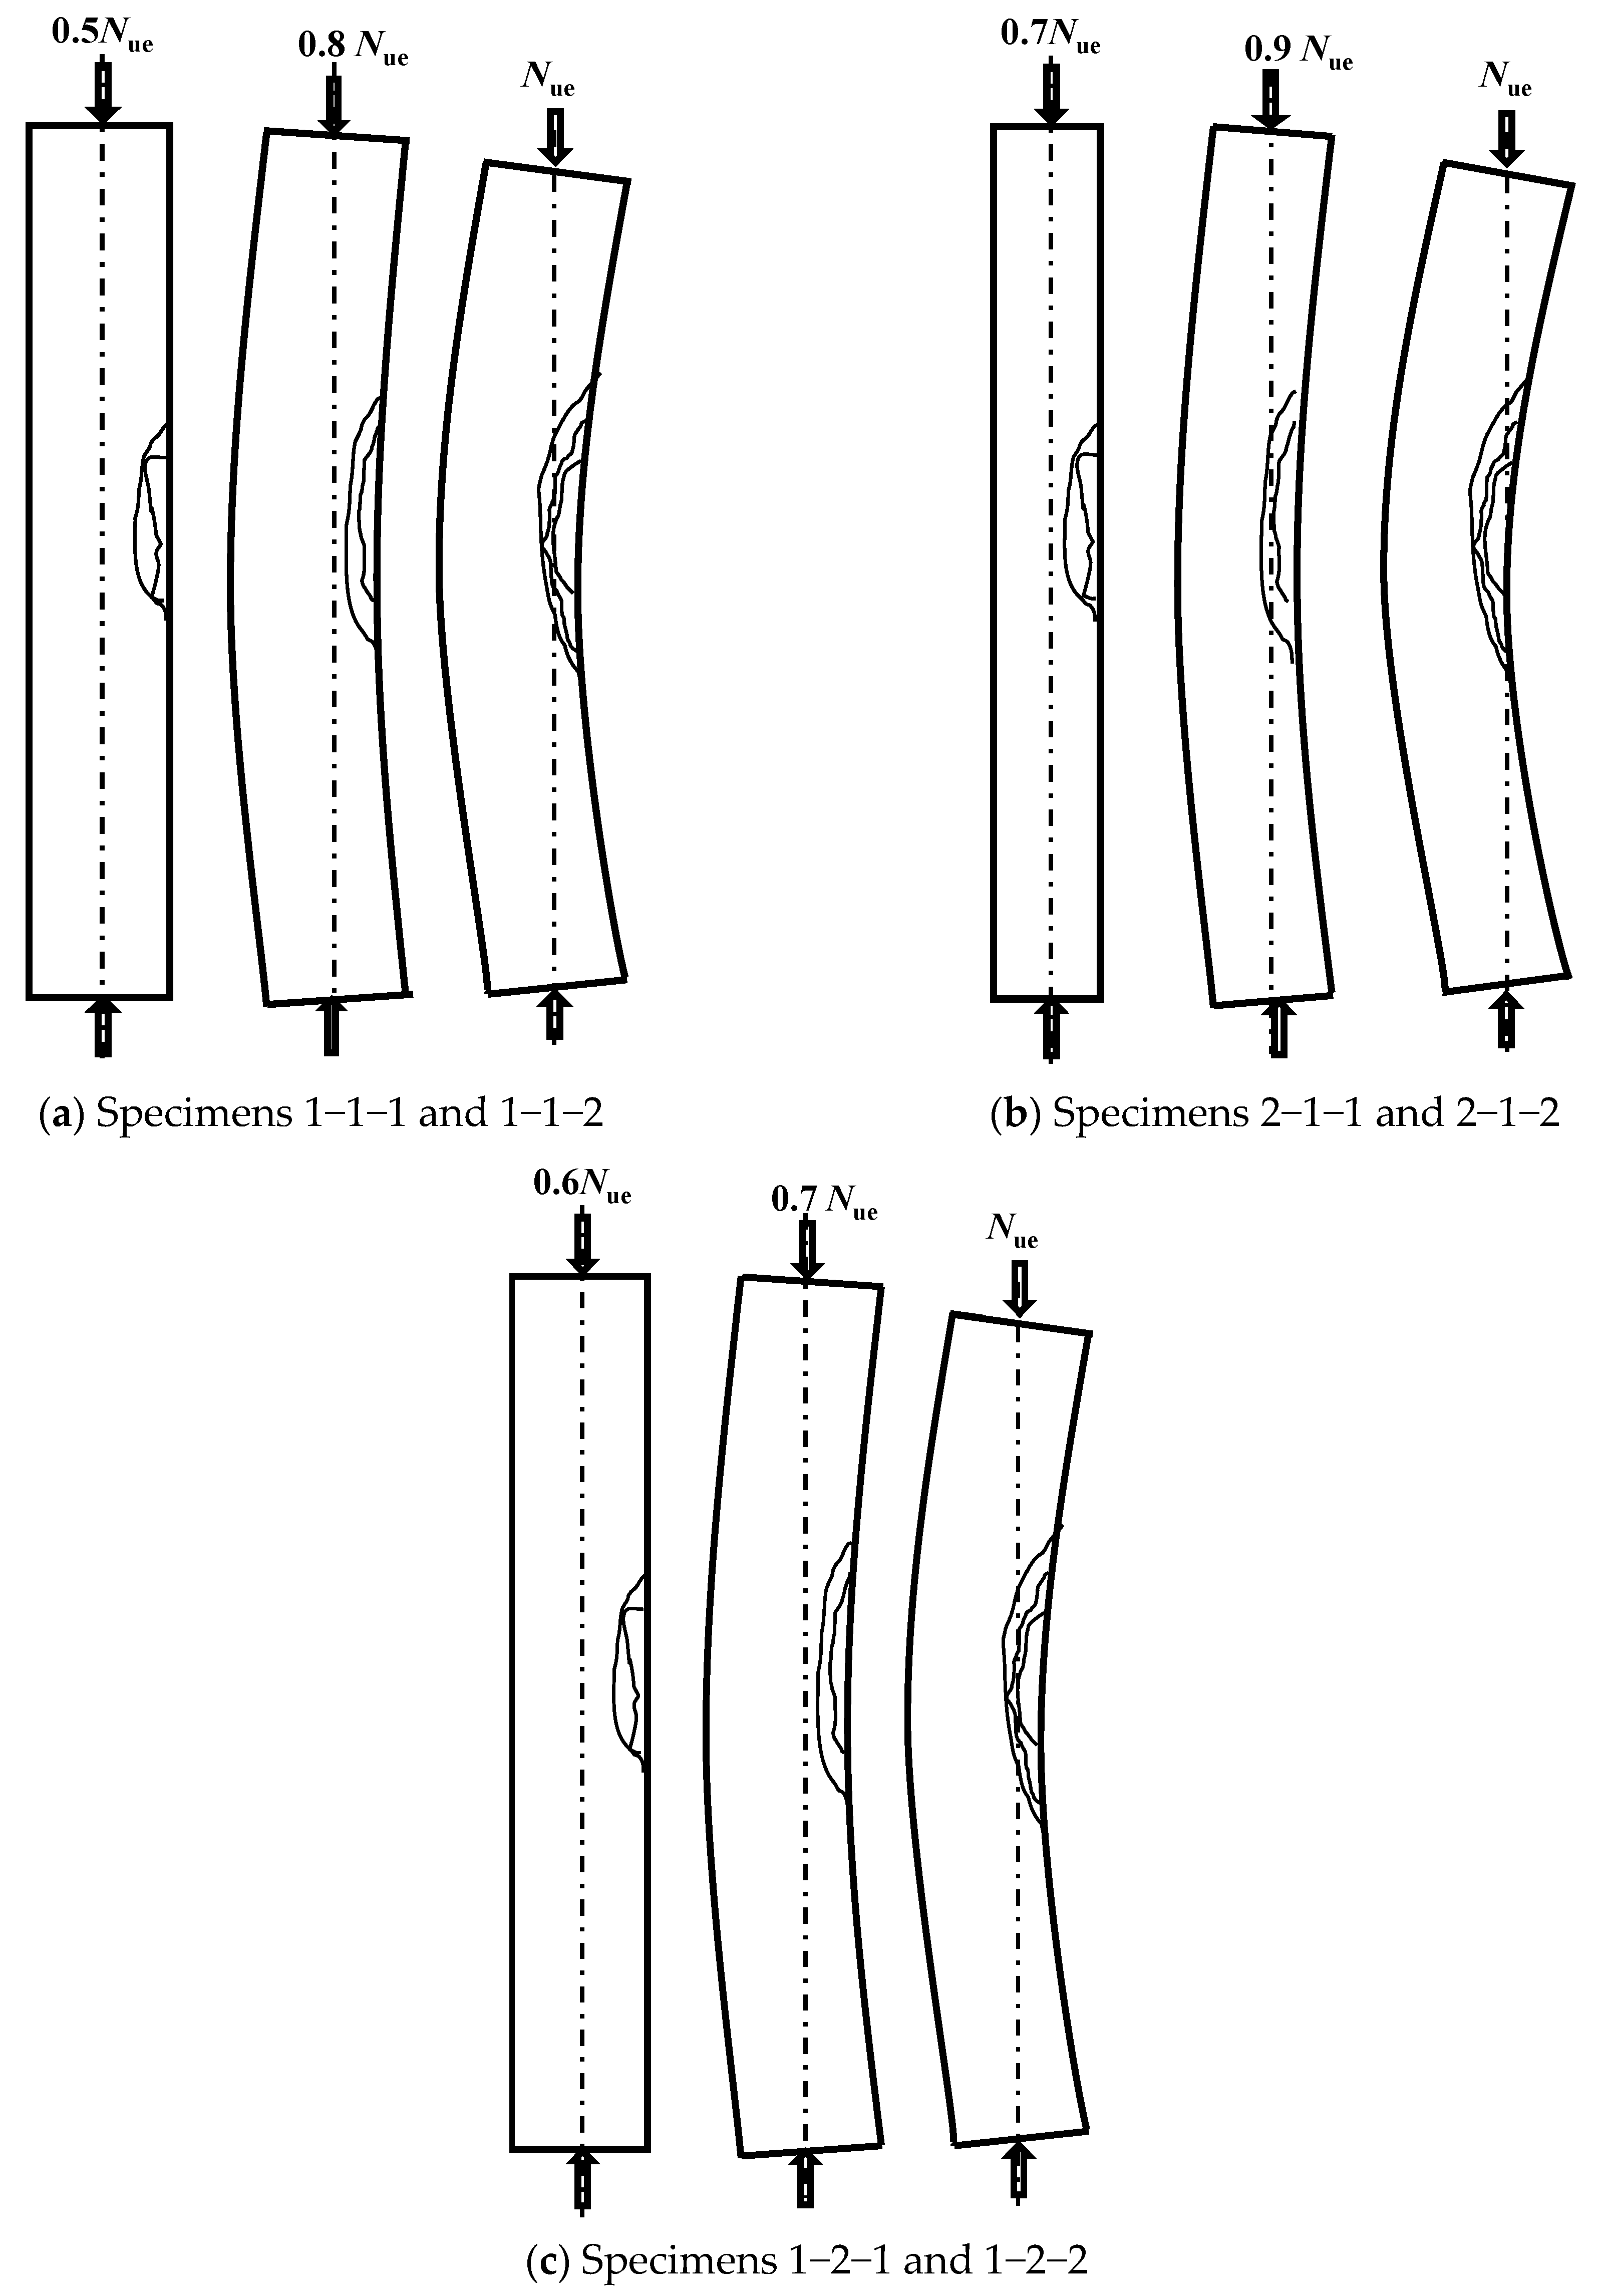
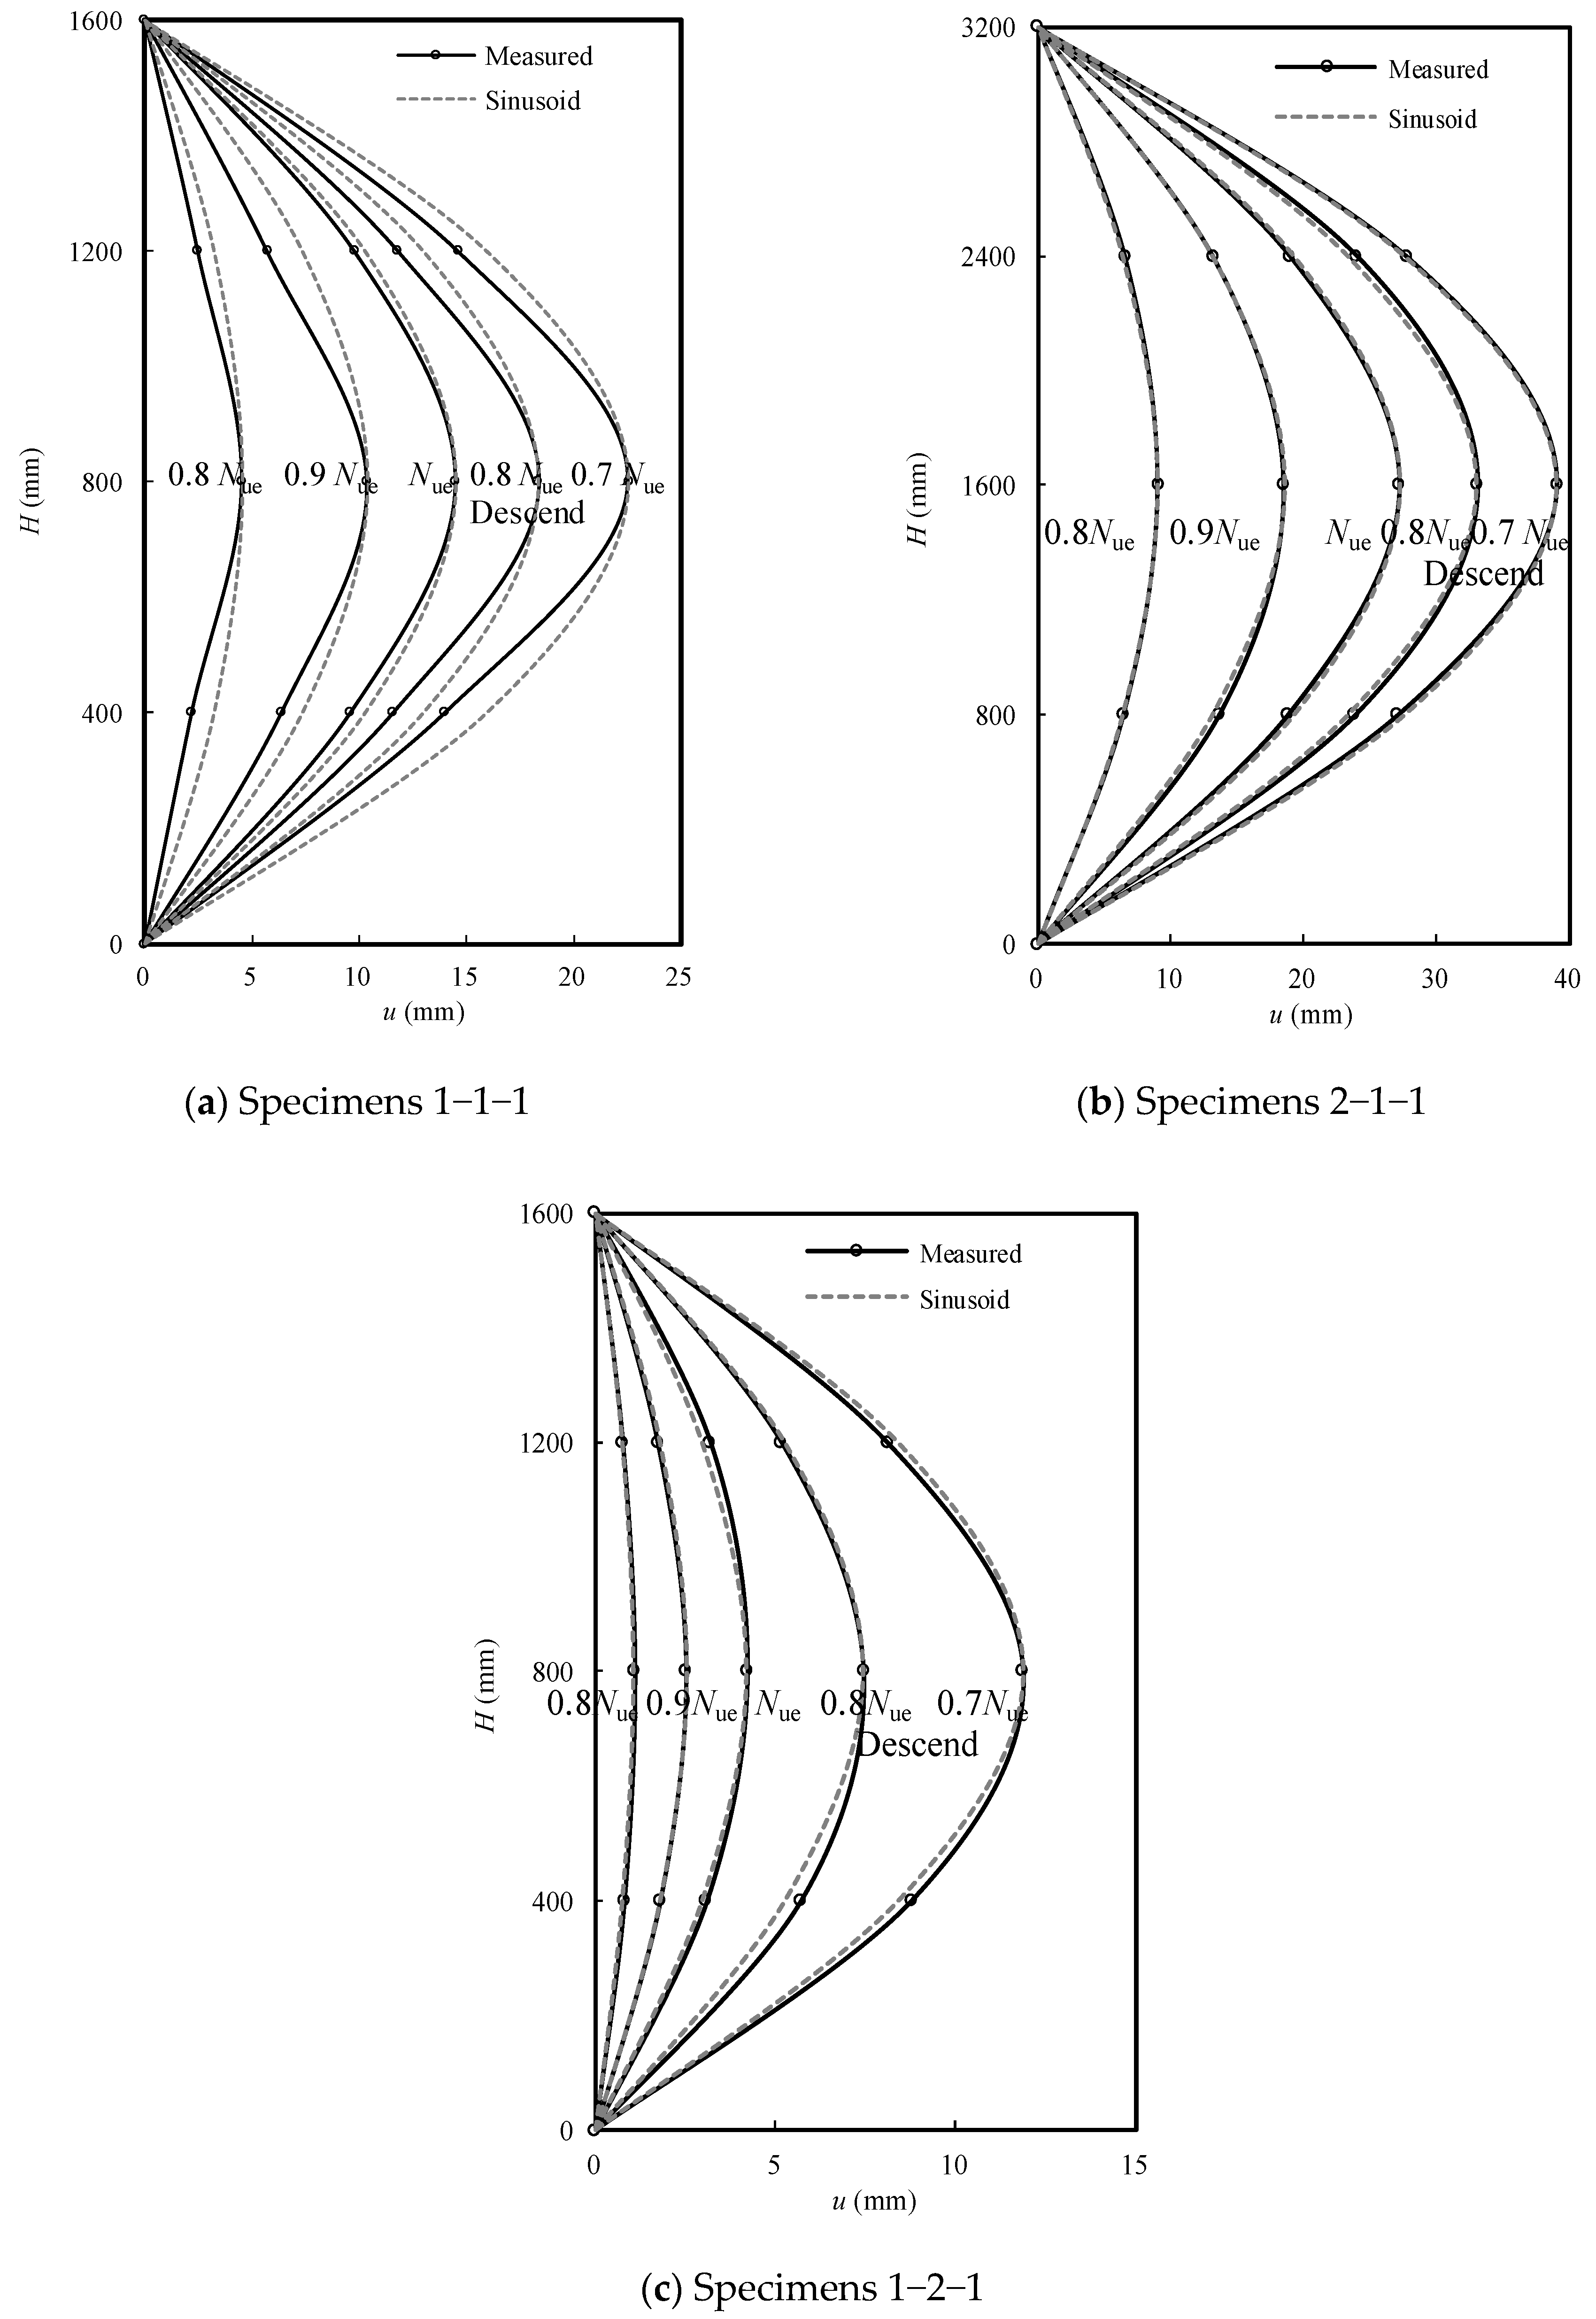
Figure 3 depicts the test setup and instrumentation. A testing machine with a capacity of 5000 kN was used for the compression tests, and three displacement transducers were placed at 1/4H, 1/2H, and 3/4H to monitor the deflection of the composite column. Six groups of axial and longitudinal strain gauges were attached to the surface of the concrete, steel tube, and longitudinal rebar at the 1/2H of the specimen. Figure 3 presents detailed information, including the test setup and the positions of the displacement transducers and the strain gauges. The “knife edge” can enable small biases, which could achieve an unstable bending deformation mode in the desired direction.

2.5. Failure Modes

Figure 4 presents the measured load–deflection (Num) curves. The bearing capacity decreases by 20.1% from the measured value as the column height (H) increases from 1600 mm to 3200 mm; The bearing capacity decreases by 0.3% as the diameter (d) of the built-in circular hollow steel tube increases from 80 mm to 100 mm. When the load increases to about 50% for specimen 1-1-1, 70% for specimen 2-1-1, and 60% for specimen 1-2-1 of the ultimate load, the concrete in the right mid-height area of the specimen started to crush, accompanied by a cracking sound. When the load reached about 80% for specimen 1-1-1, 90% for specimen 2-1-1 and 70% for specimen 1-2-1 of the ultimate load, the whole specimen began to deform, and the concrete fragmentation area on the right side of the specimen continued to expand. As the ultimate bearing capacity was reached, the concrete in the mid-height area on the right side of the specimen was crushed and peeled off. As the load decreased to approximately 90% of the ultimate bearing capacity, the concrete in the left area of the specimen started to crack and burst, and the concrete in the mid-height area on the right side of the specimen was completely crushed. Figure 5 presents the failure process of the testing. The crushing area measured in the concrete of the axial compression specimen was compared with the strain distribution provided by FEM in Figure 6. The distribution of cracks in the concrete predicted by the finite element method is very similar to the experimental distribution of cracks, indicating that the proposed finite element model can represent the compression conditions of the concrete sample well. Figure 6 also illustrates the failure modes of the specimen as a whole, including the concrete, steel bars, and internal steel tube, determined through experiments and finite element methods. The inward buckling of the CHSRC axial compression specimen occurs at the middle height of the column; Generally speaking, there is good consistency between predicted data and experimental results.
Figure 7 plots the measured data curves of height against the lateral deflection of the columns, indicating that the deflection curves of the columns are consistent with half-wave sine curves.

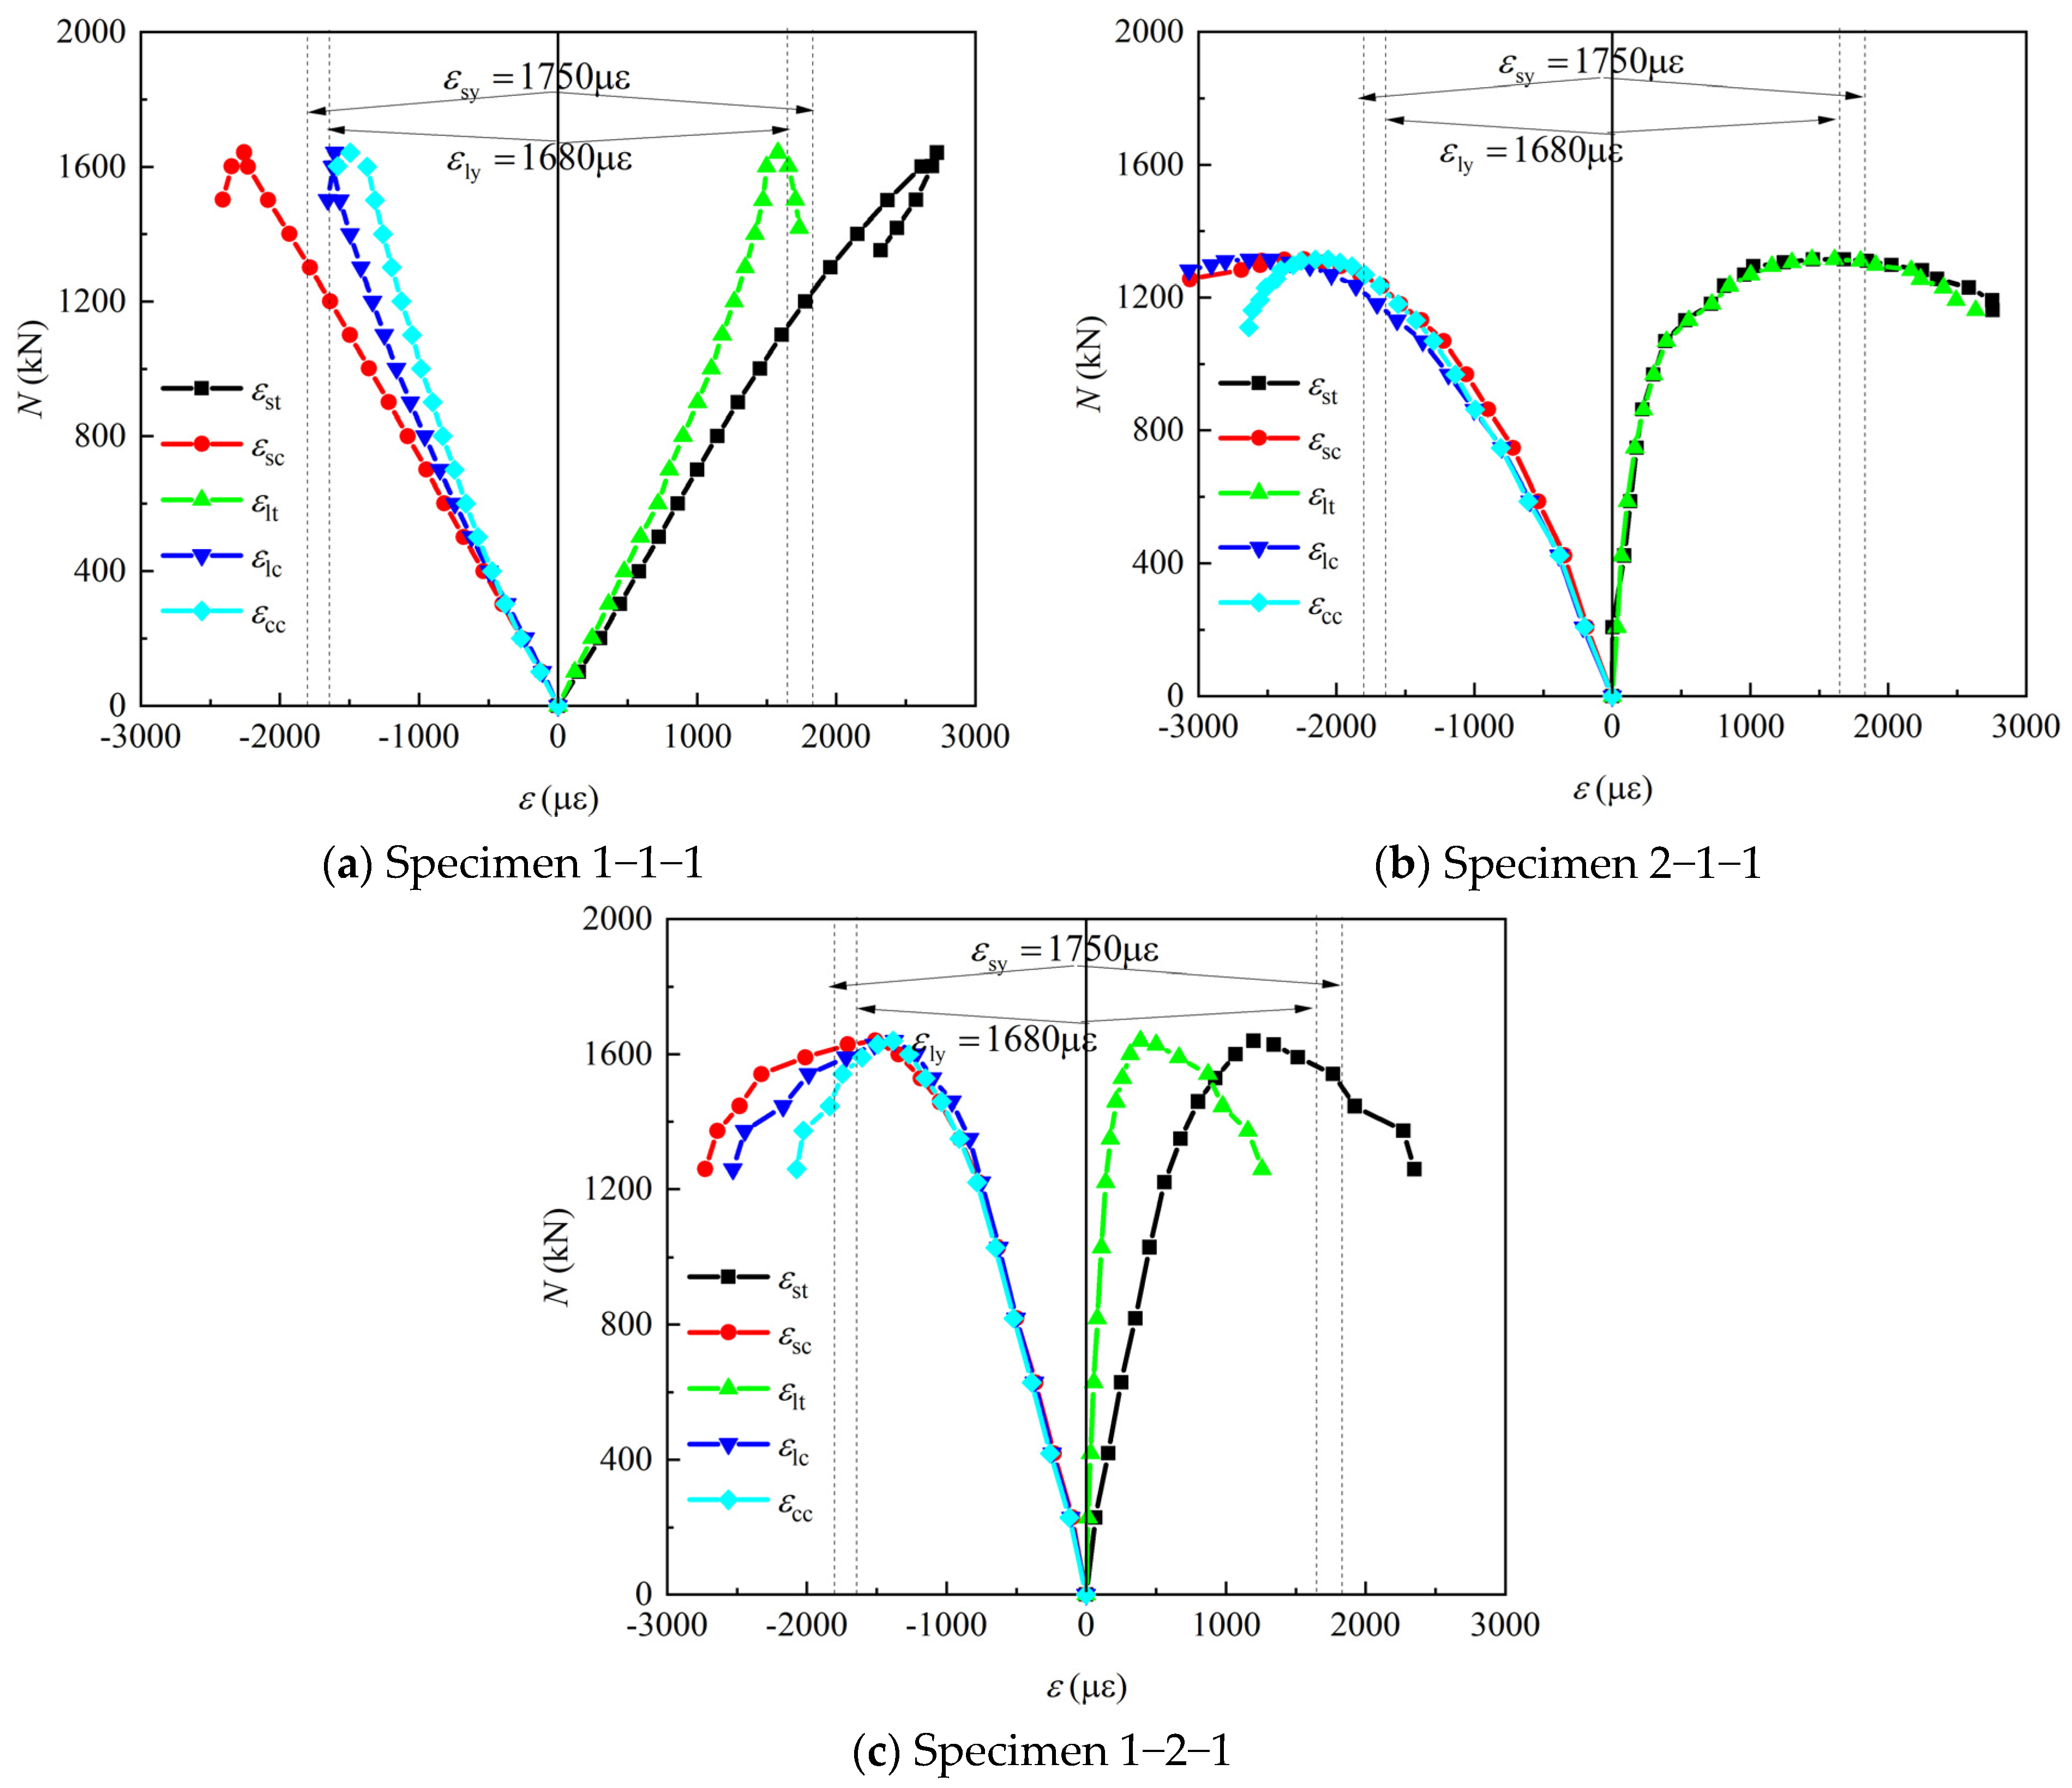
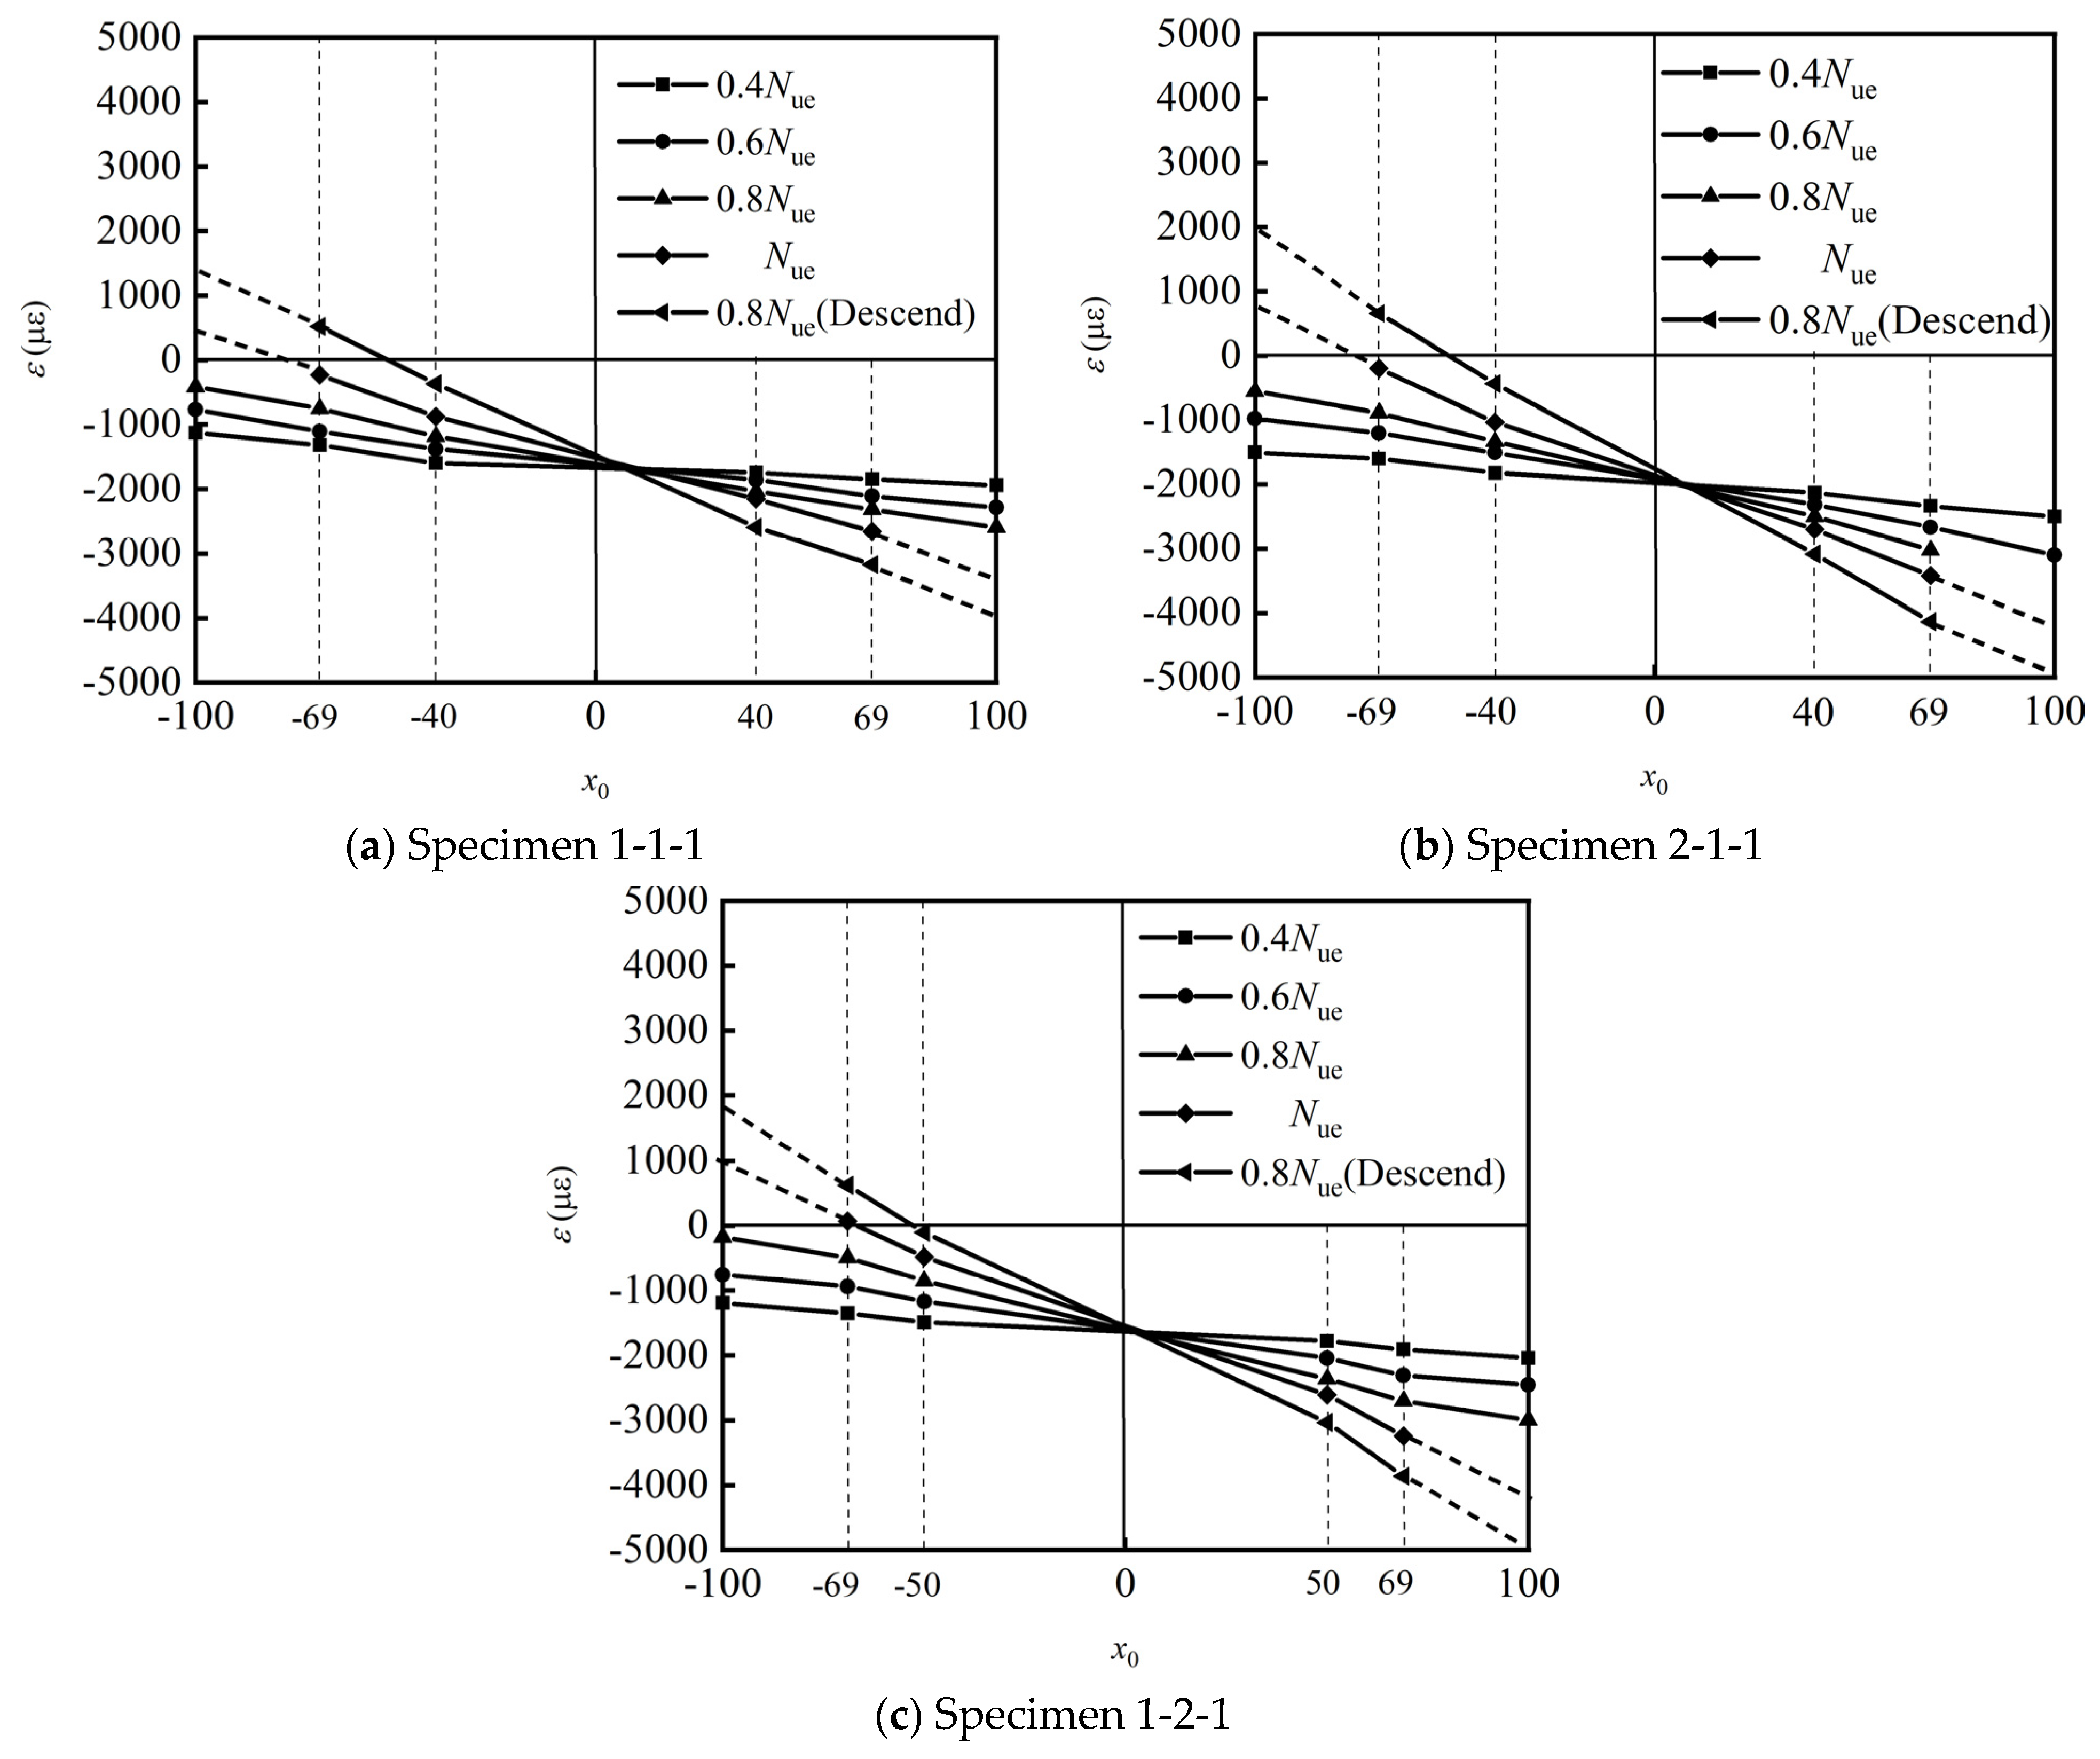
2.6. Strain Analysis

Figure 8 delineates the measured axial load against the strain (Nε) for the circular HSRC columns, where εst and εsc are the axial and longitude strains of the steel tube, respectively; εlt and εlc represent the axial and longitude strains of the longitude rebar; while εcc denotes the compressive strain of the concrete. Figure 9 also depicts the distribution of strains across the mid-height sections of circular HSRC column 1−1−1, 2−1−1, and 1−2−1, including the concrete, the longitudinal rebar, and the steel tube at multiple load levels of 0.4Nue, 0.6Nue, 0.8Nue, Nue, and −0.8Nue (descend), where x0 represents the position of the strain gauges. Dash lines in the Figure 9 indicates that the location where strain may develop is because at this point, the concrete has already been crushed or cracked. It can be found that the assumption of a plane cross-section is acceptable, indicating that the components in this new cross-section can work together. Before the ultimate load, the overall compressive strain of the specimen in the section is longitudinal strain, with a small strain difference. When the specimen reaches its ultimate load and undergoes unstable bending, its curvature exacerbates the second-order effect, resulting in a strain difference of over 1000 με on both sides of the steel tube.
According to the relationship between N and ε, since the εsc of the steel tube was close to the εlc of the longitudinal rebar, the steel tube and the RC could work together well. When the strain reached the peak point, both εlt and εlc reached their corresponding yield strain (εly), but both εst and εsc exceeded their corresponding yield strain (εsy), indicating that the strength of the steel components can be fully utilized. The Nε relationships implied that the development of the external compressive strain (εcc) of the concrete lags behind that of the steel tube (εsc) and the longitudinal rebar (εlc).

2.7. Ultimate Compressive Strength

Table 1 presents the measured ultimate compressive strengths (Nue) of the circular HSRC columns. To this end, a strength index (SI) is defined to quantify the Nue for the circular HSRC columns:
S I = N u e / φ A c f c k + A s f y s + A l f y l
where φ is the stability coefficient given in Table A1; fck indicates the characteristic compressive strength of the concrete, equal to 0.67fcu [14], fcu represent cube strength compressive strength of the concrete; and fys and fyl stand for the yield strength of the steel tube and the longitudinal rebar, respectively. According to Table 1, the calculated value of SI are all higher than 1.0, indicating a strong interaction between the steel tube and the RC components. Based on a comparison of specimens 1-1 and 2-1, as the height increases, the specimen is more susceptible to instability, resulting in decreases in bearing capacity and SI value. Based on comparisons of specimens 1-1 and 1-2, as the diameter of the built-in hollow steel tube increases, the cross-sectional area of the steel tube increases, and the axial compression bearing capacity of the specimen increases, resulting in a decrease in SI value.

2.8. Ductility Index

The ductility index (DI) suggested by Li et al. [15] was also used to quantify the ductility of the circular HSRC columns:
D I = Δ 85 % Δ u e
where Δue is the axial deformation corresponding to Nue, and Δ85% denotes the axial deformation when the load declines to 0.85Nue. According to Table 1, the values of DI indicate that the members still have good ductility after failure. Compared with column specimens 1-1 and 2-1, as the height increases, the mid-span displacement of the specimens also increases, resulting in a larger DI value; in comparison with specimens 1-1 and 1-2, as the diameter of the built-in hollow steel tube increases, the cross-sectional area of the steel tube increases, while the cross-sectional area of the concrete decreases. The ductility of steel is higher than that of concrete, and this DI value increases.

3. Finite Element Modeling

The finite element model is based on the Abaqus/Standard module [16], and the material nonlinearity and the interaction between the inner steel tube and the outer RC components are considered. Figure 10 presents a schematic of the finite element model of the circular HSRC column, including the concrete, longitudinal bars, stirrups, steel tube, and endplates.

3.1. Material Models

3.1.1. Steel

The behavior of the steel tube is described using a five-stage stress–strain model [17], indicating isotropic hardening behavior in the composite members. The reinforcements have a double broken linear stress–strain relationship. At the plastic hardening [7], the modulus of the longitudinal rebar is 0.01El (where El is the elastic modulus of the longitudinal rebar, and the value is 204 Gpa), and the modulus of the stirrup is 0.01Eg (where Eg is the elastic modulus of the stirrup, and the value is 196 Gpa).

3.1.2. Concrete

The constitutive behavior of the concrete is described by the damage plasticity model [18]. According to ACI 318-11 [19], the elastic modulus of concrete (Ec) is defined as 4730 (fc′)0.5, where fc’ is the compressive strength of concrete cylinders. A fracture energy model was proposed by Hillerborg et al. [20] to simulate the tensile-softening behavior of concrete. The concrete can be considered as the inner confined zone and the outer unconfined zone. Referring to the constitutive model, Xiao et al. [21] compared unconfined and confined models and reported similar ultimate strength. Thus, the unconstrained constitutive model [18] of concrete can be used for the constitutive relationship for concrete materials.

3.2. Element Type, Meshing, and Boundary Conditions

The steel tube is simulated by the shell element (S4R) in the form of a four-node reduction integral to ensure accuracy, and the Simpson integral of nine points is adopted for the thickness of the shell element. The longitudinal reinforcement and stirrups are composed of two-node, three-dimensional, linear truss elements (T3D2), combined into the reinforced skeleton embedded in the concrete. The concrete adopts eight-node, hexahedron, linear, reduced-integration, 3-D solid elements (C3D8R).
Two endplates have been added to facilitate the model support. The loading point is set at H/1000 from center of the endplate in the x-axis direction to consider the influence of initial defects on the axial bearing capacity of the composite columns (see Figure 10). The influence of the second-order effect on bearing capacity was not considered, and adding initial eccentricity only caused instability and failure of the long column. The loading point of the upper endplate limits the displacement in the x-direction and y-direction, while the loading point of the lower plate limits the displacement in the x-direction, y-direction, and z-direction. Displacement-loading is performed by setting the displacement in the z-direction of the reference point, which is shown in Figure 10, and the convergence criterion is shown in Table A5. The shell solid-coupling contact method is adopted between the steel tube and the endplate, and a tie constraint is adopted for the concrete and the endplate. Between the steel tube and the concrete, the contact surface is the inner surface of the hollow concrete and the outer surface of the hollow steel tube. The normal direction is “hard” contact, and the bond-slip in the tangent direction adopts the penalty function. The friction coefficient is set at 0.6 [7]. The steel skeleton composed of longitudinal rebars and stirrup is embedded into the concrete section.

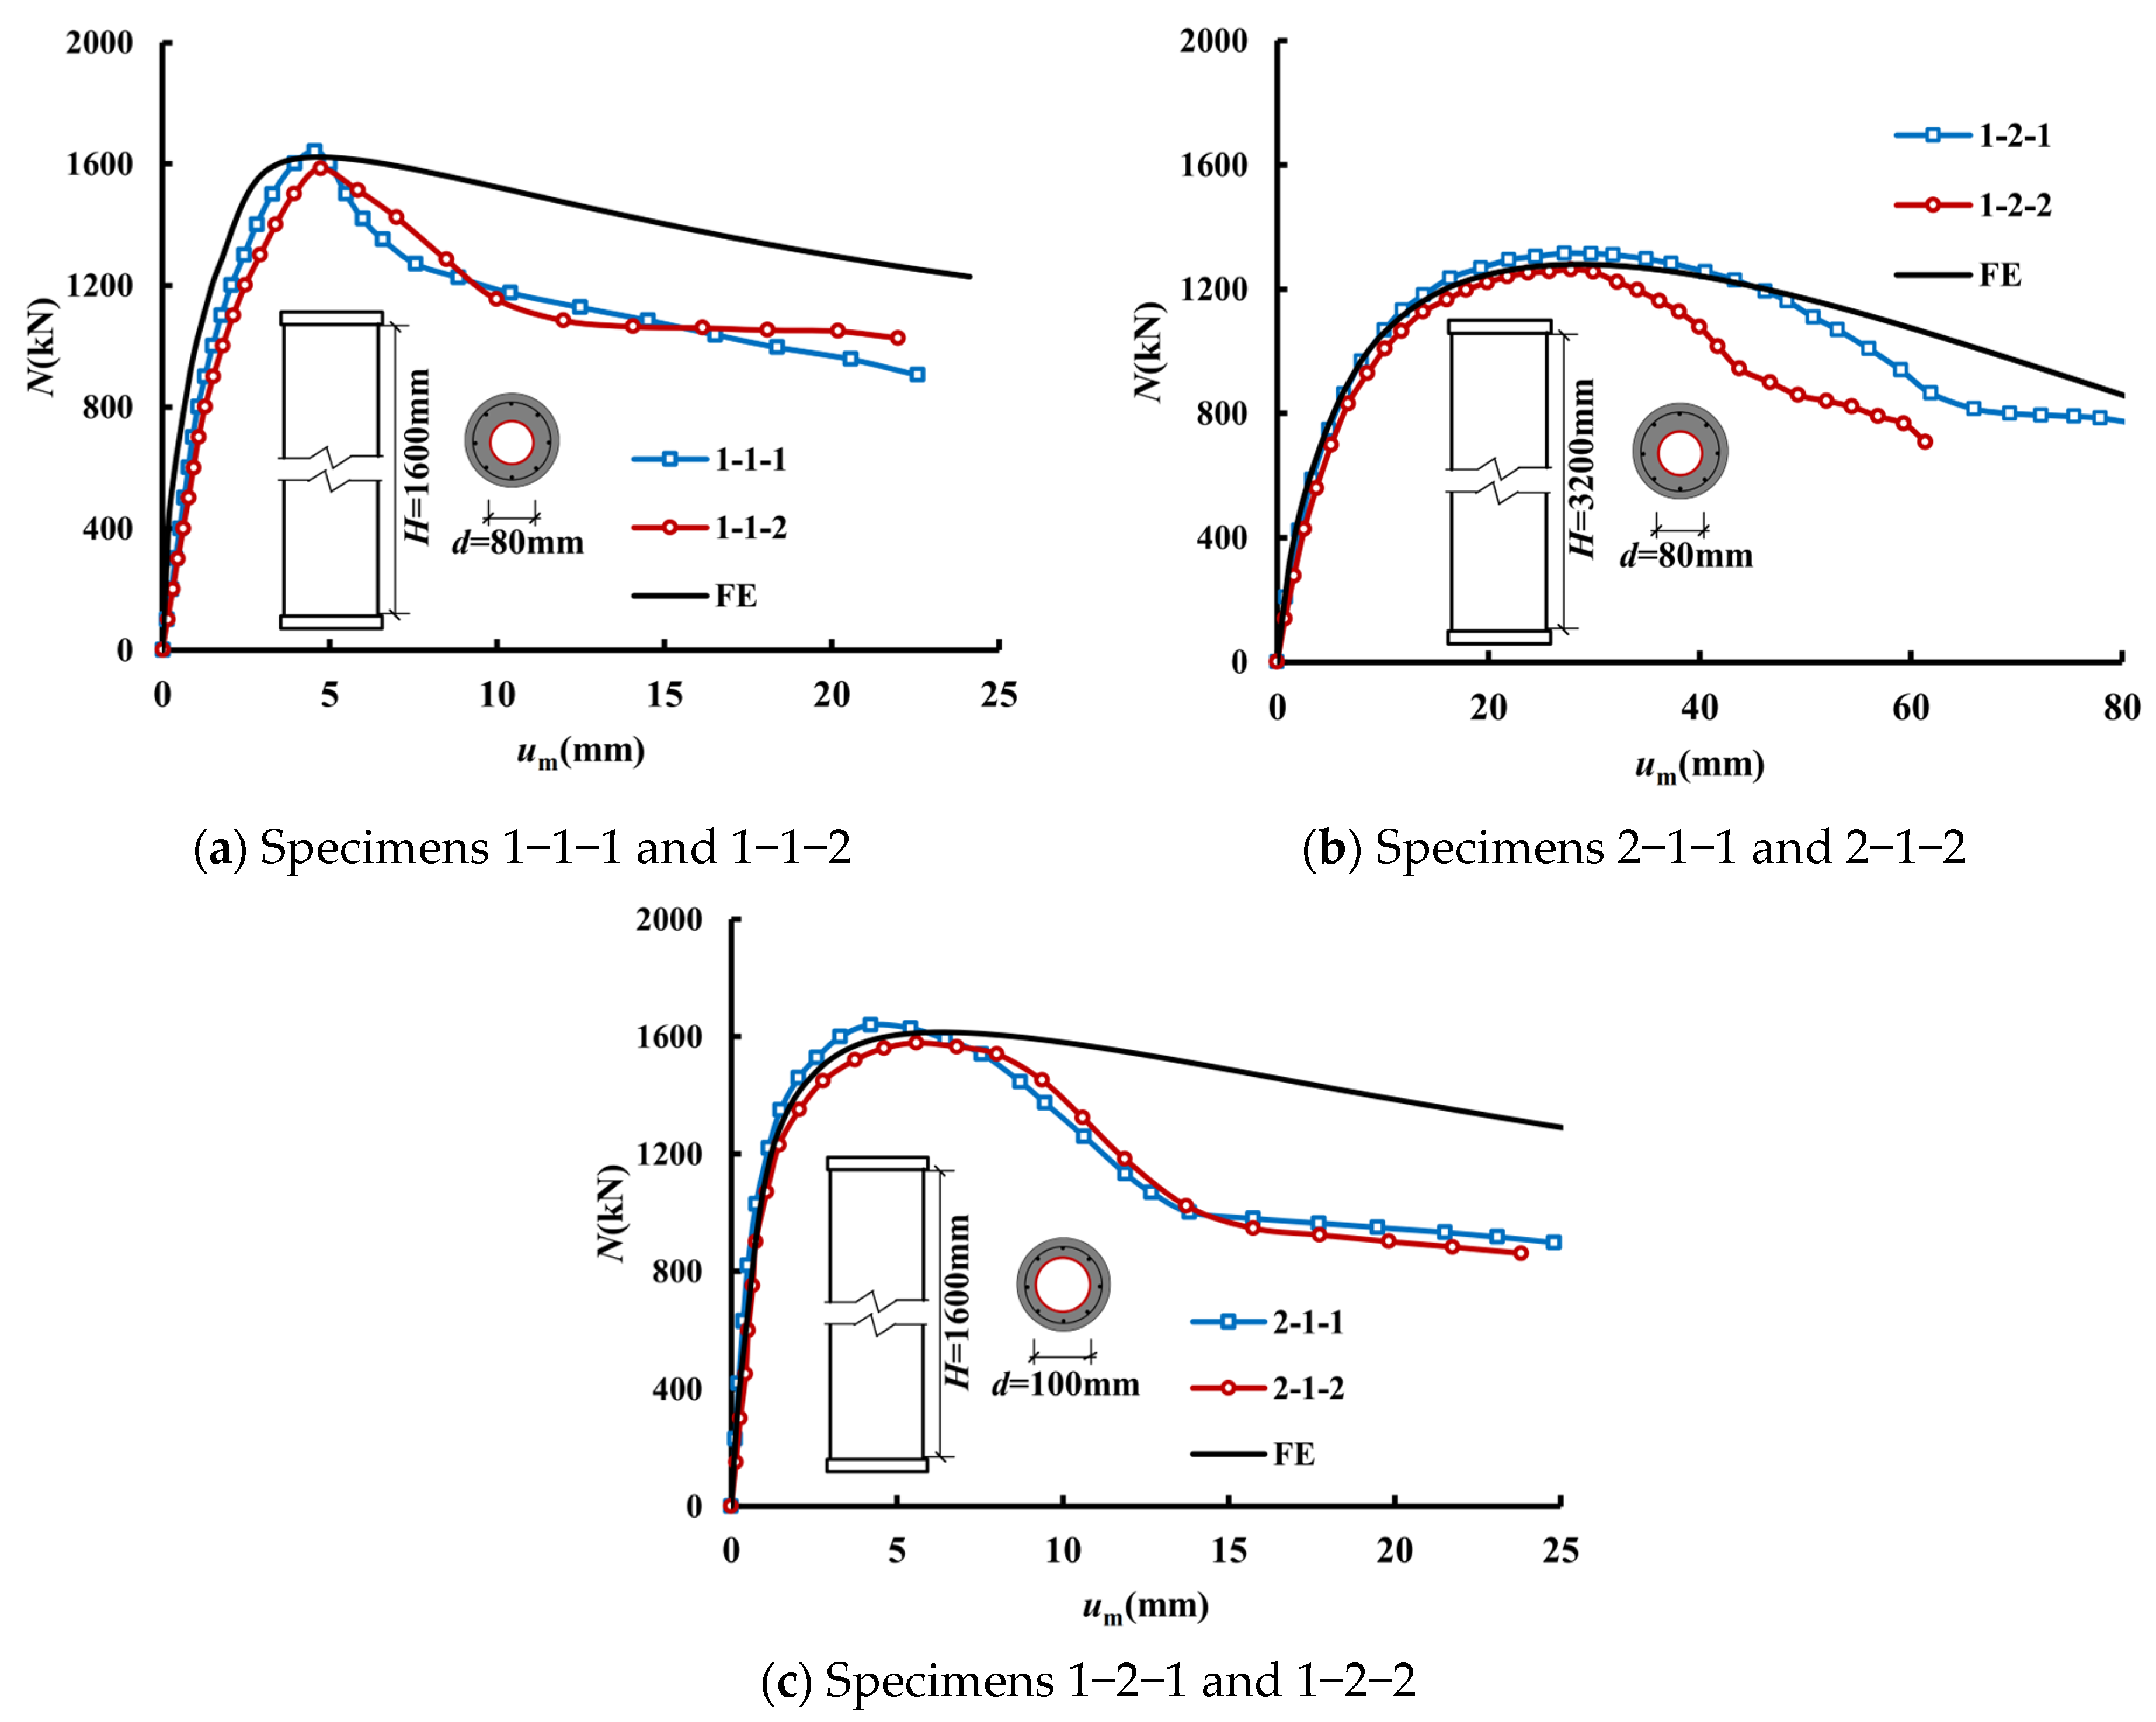
3.3. Verification of Finite Element Model

Figure 4 compares the simulated load–deflection (Num) curves with the measured ones. The Num curves obtained from the FE simulation agree with the experimental results. The simulated bearing capacity (NuFEM) and the average measured (Nue) bearing capacity of circular HSRC column specimen 1-1 under axial compression are 1622.4 kN and 1613.5 kN, respectively, corresponding to a standard deviation of 2.8%. Furthermore, regarding the stiffness in the initial stages, the stiffness computed by the FE model is 774.2 kN/mm, while the measured stiffness of circular HSRC column specimen 1-1-1 and circular HSRC column specimen 1-1-2 is 795.2 kN/mm and 644.5 kN/mm, respectively. The simulated bearing capacity (NuFEM) and the average measured (Nue) bearing capacity of circular HSRC column specimen 1-2 under axial compression are 1279.5 kN and 1289.2 kN, respectively, corresponding to a standard deviation of 0.8%, the stiffness computed by the FE model is 270.5 kN/mm, while the measured stiffness of circular HSRC column specimen 1-2-1 and circular HSRC column specimen 1-2-2 is 263.1 kN/mm and 191.8 kN/mm, respectively. The simulated bearing capacity (NuFEM) and the average measured (Nue) bearing capacity of circular HSRC column specimen 2-1 under axial compression are 1613.8 kN/mm and 1613.5 kN/mm, respectively, corresponding to a standard deviation of 0.3%, the stiffness computed by the FE model is 615.3 kN/mm, while the measured stiffness of circular HSRC column specimen 2-1-1 and circular HSRC column specimen 2-1-2 is 634.9 kN/mm and 555.4 kN/mm, respectively, to verify the accuracy of the developed finite element model.
Figure 6 depicts the failure mode comparison of the specimen. Because we used a small eccentricity to simulate the unstable deformation of axially compressed columns during loading, the failure mode of the column under axial compression is similar to eccentric compression [7], with cracks forming on the left side and the concrete part of the right side being crushed.

4. Analytical Behavior

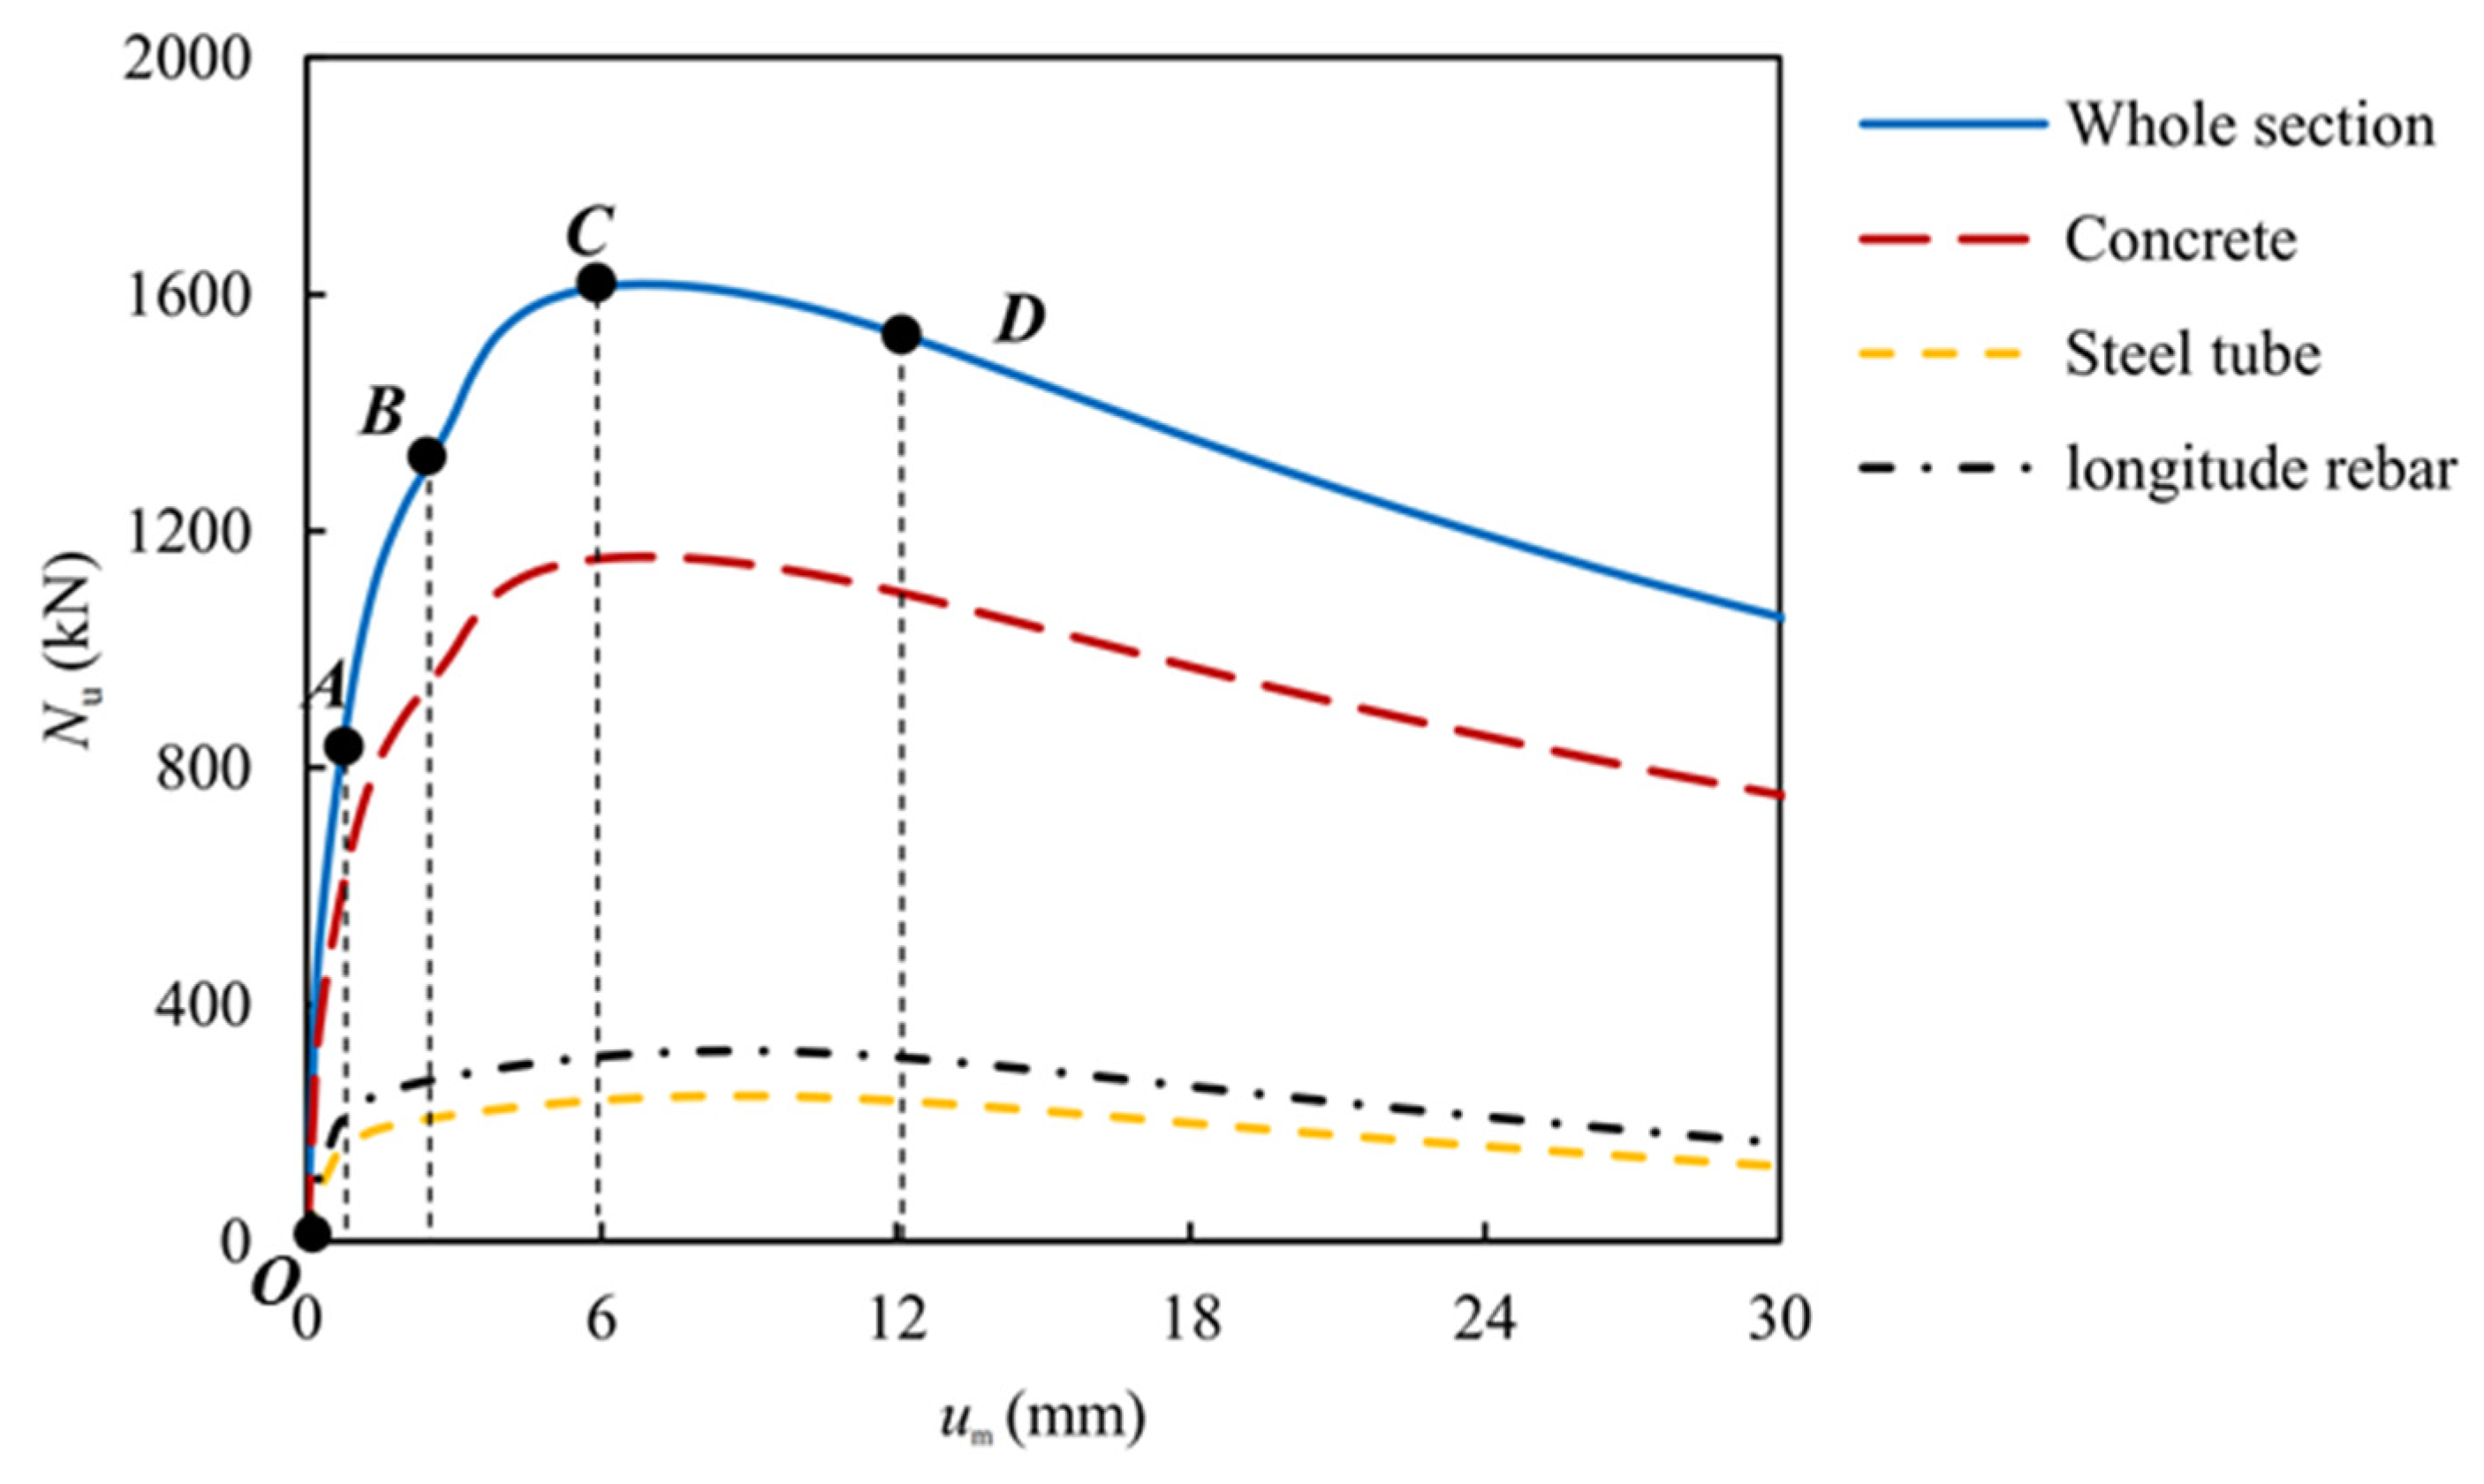
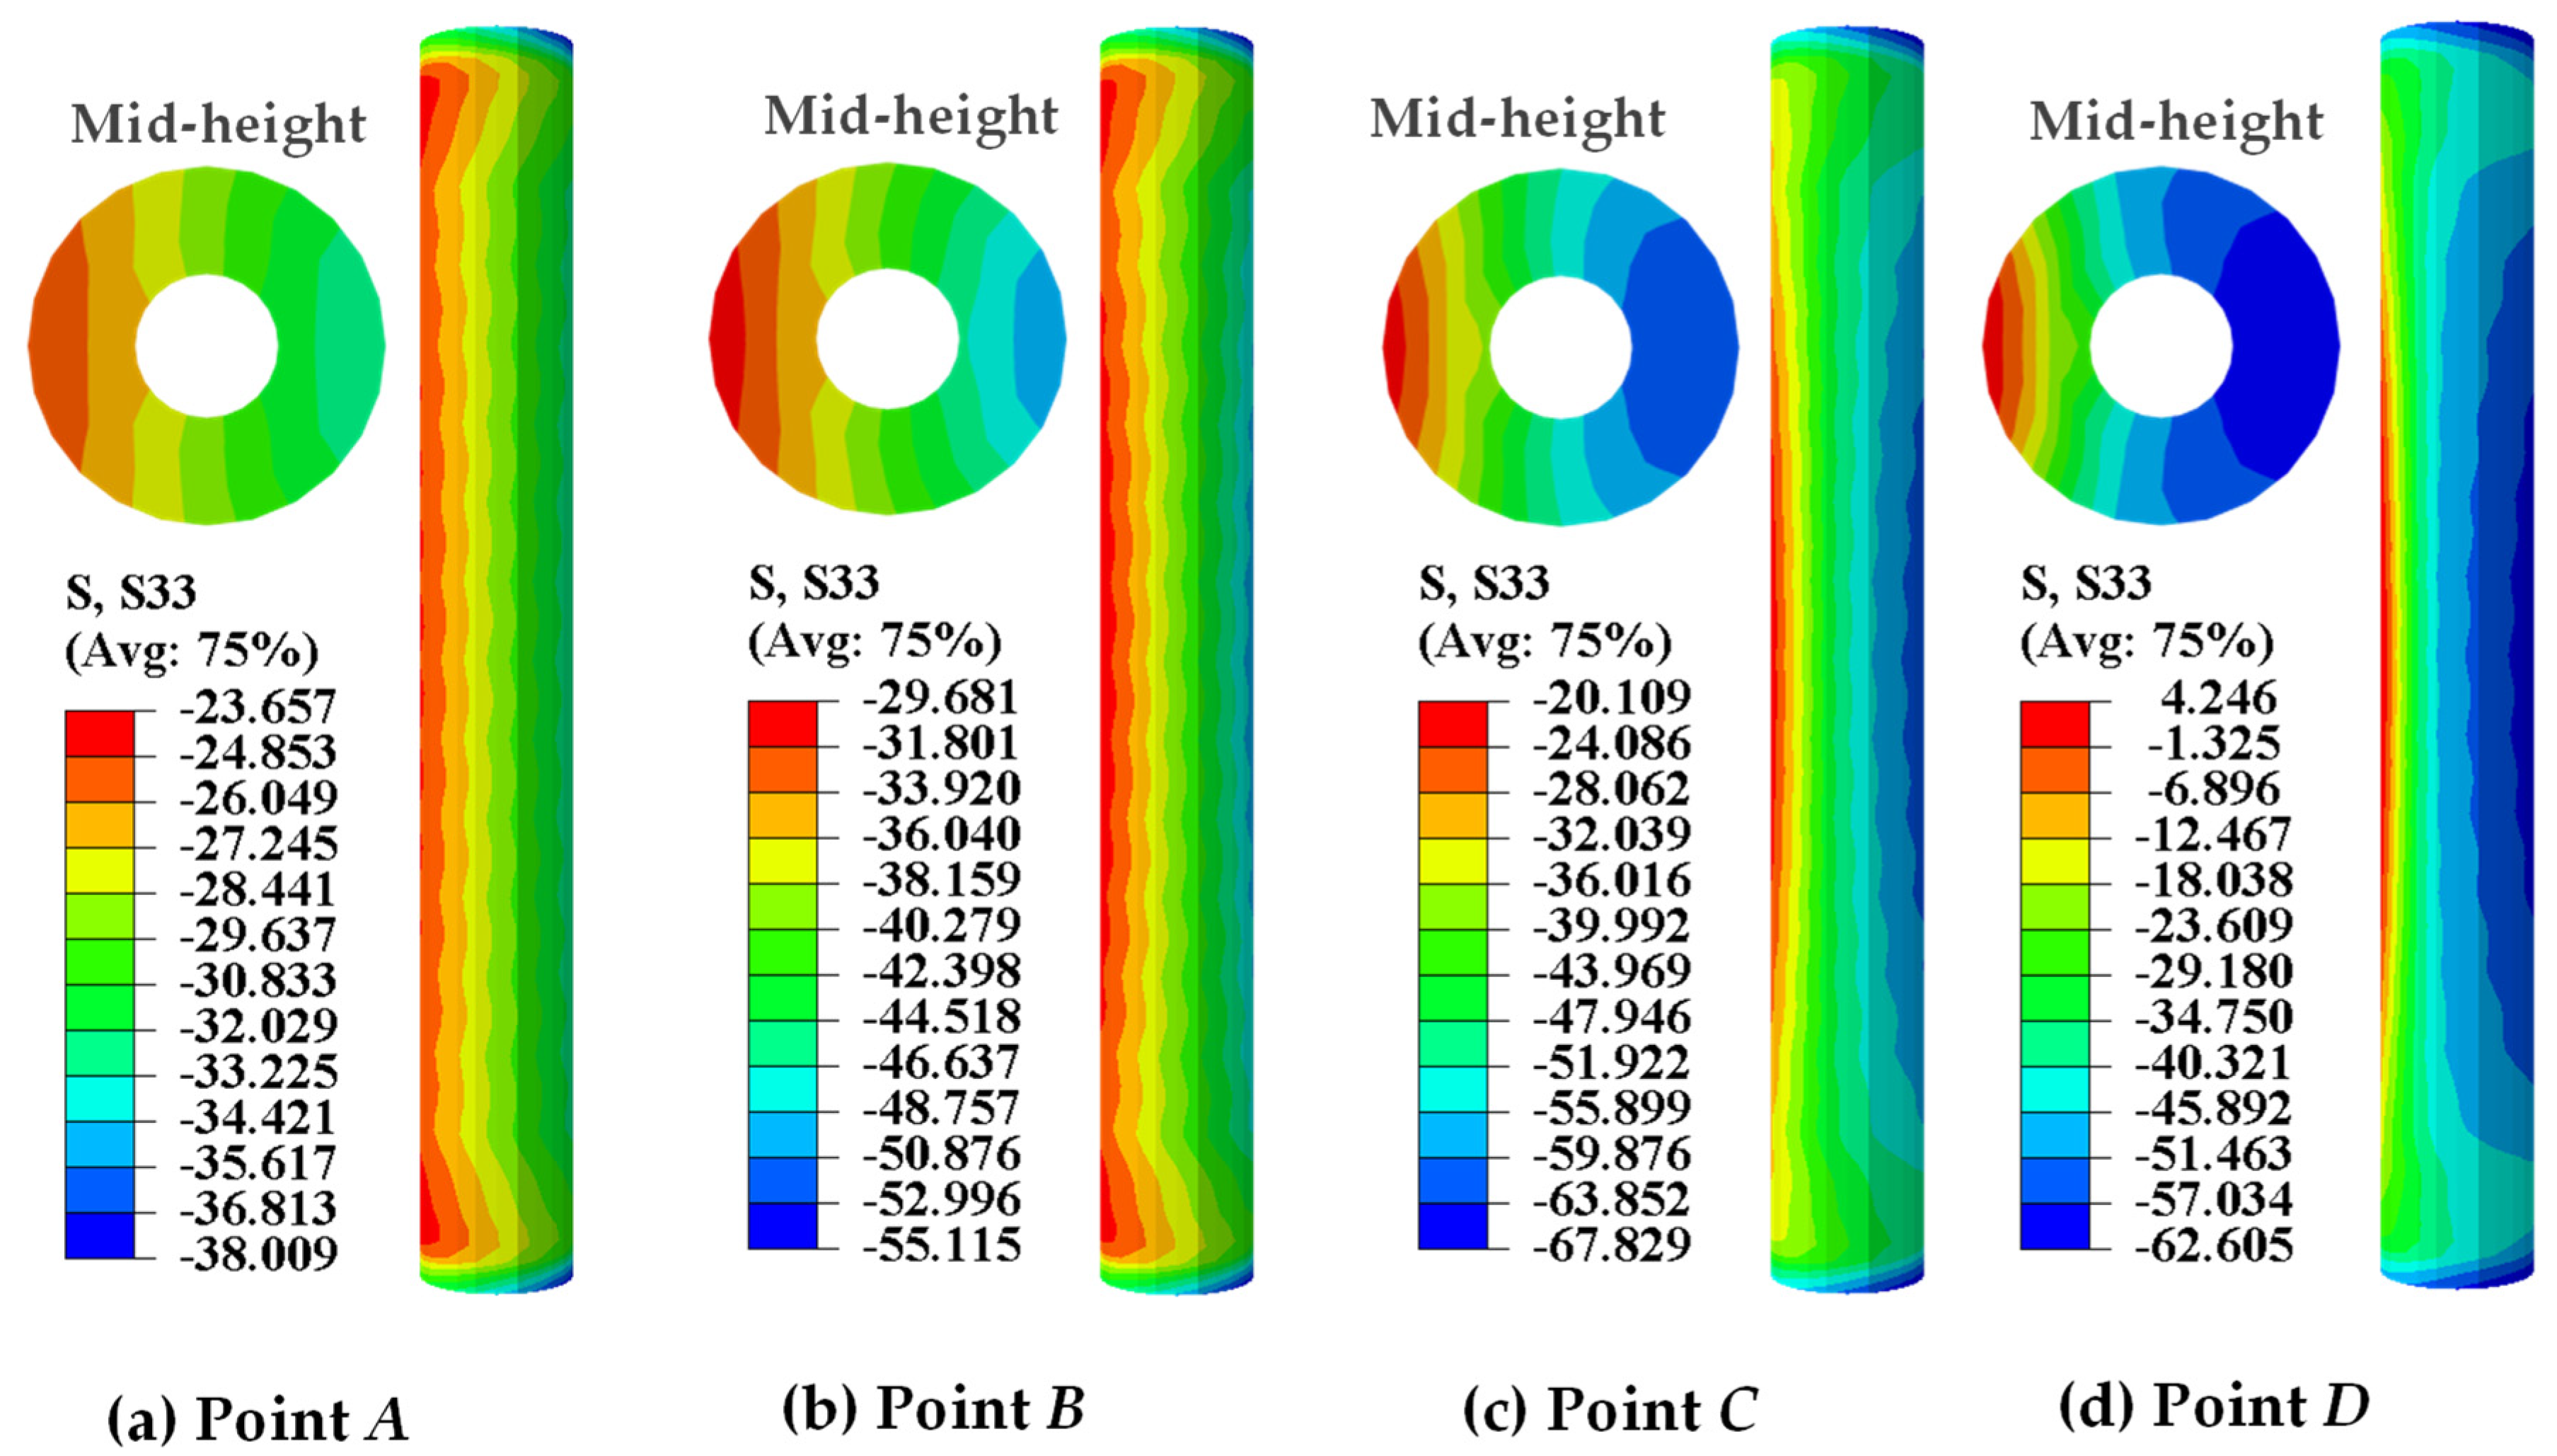
4.1. Complete Mechanism of Circular HSRC Columns

The finite element model of circular HSRC column 1-1 was taken as a representative example to analyze the load–deflection curves (Num) so as to study the mechanism under axial compression. Figure 11 depicts schematics of the characteristic points of the typical example. Four characteristic points are selected on the Num curve: Point A is the boundary point of the elastic stage of the column, at which the concrete begins to crush; point B indicates the yield of the longitude rebar; point C is where the specimen reaches the peak load; point D is when the left side of the mid-height column is cracked and crushed on the right side.
The whole process of loading can be divided into four stages:
(1) Stage 1 (OA), elastic stage I: the whole specimen is in the elastic stage. The load on the circular HSRC column increases linearly with its deflection.
(2) Stage 2 (AB), elastic stage II: the longitudinal rebar and the steel tube are still in the elastic stage, and there is still a linear relationship between the load on the circular HSRC column and its deflection.
(3) Stage 3 (BC), elastic–plastic stage: the load on the circular HSRC column increases nonlinearly with its deflection, and the bearing capacity of the column reaches a maximum.
(4) Stage 4 (CD), bearing capacity decline stage: there is a nonlinear relationship between the load on the circular HSRC column and its deflection until the end of loading.
Figure 12 illustrates the stress distribution at characteristic points of circular HSRC column 1-1. The principal stress of z direction S33 for concrete and Mises stress for the hollow steel tube and rebar were analyzed. Point A marks the boundary between the elastic stage I and elastic stage II. The longitudinal stress on the circular HSRC column is all compressive, with greater compression on the right side than on the left side of the cross-section. The stress values range between 23 MPa and 38 MPa. The maximum compressive stress is approximately 1.7 times the minimum compressive stress, showing a zonal distribution along the cross-section, as depicted in Figure 12a. Point B is the boundary between elastic stage II and the elastic–plastic stage. When the longitudinal rebar yields and enters the plastic deformation stage, the overall longitudinal stress on the circular HSRC column is still all compressive, and the stress is higher on the right side than the left side. The stress value is between 29 MPa and 55 MPa, and the maximum compressive stress is about 1.9 times the minimum compressive stress, implying a zonal distribution along the cross-section, as shown in Figure 12b. At point C, the specimen reaches the peak load, the steel tube enters the plastic deformation stage, the overall longitudinal stress on the circular HSRC column is compressive, the stress value is higher on the right side than on the left side, the compressive stress value gradually decreases from the left to the right side, and the stress value is between 20 MPa and 67 MPa. The maximum compressive stress is approximately 3.5 times the minimum compressive stress, and the distribution along the cross-section is zonal, as shown in Figure 12c. At point D, the left side of the concrete experiences tensile stress, causing concrete edge cracks, the left side of the entire circular HSRC column is under tension while the right side of the column experiences compressive stress, and the maximum value of the tensile stress occurs near the middle section, which has already reached the tensile strength of the concrete. Thus, the outer concrete begins to crack on the left side and crushes on the right side, as shown in Figure 12d. In the stress distribution diagram, the compression stress is negative, but the tensile stress is positive. The maximum stress values at points C and D are greater than fcu.test, indicating that the concrete has been crushed and peeled off, but it is not displayed on the FE model.

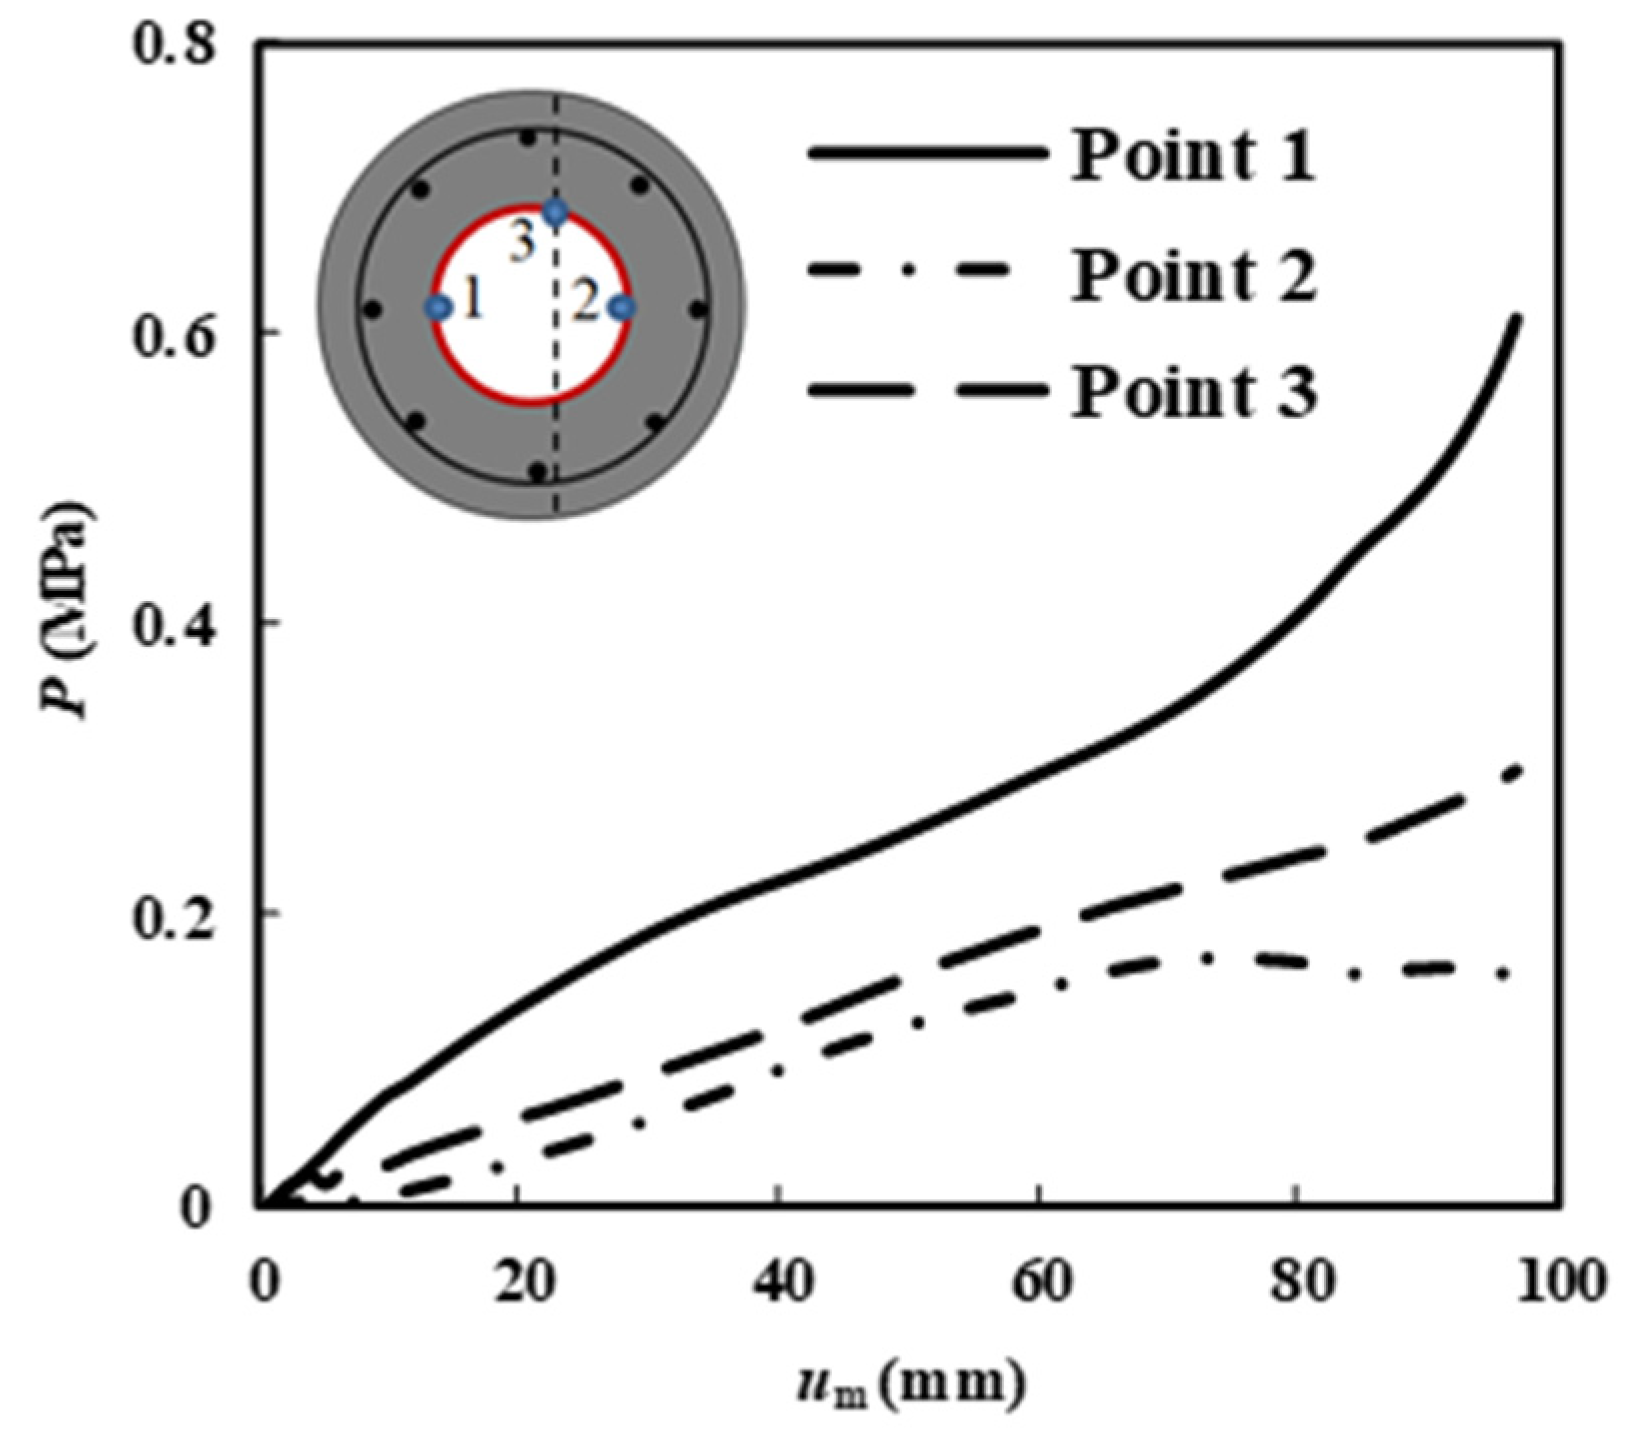
4.2. Interactions between Steel and Concrete

Figure 13 displays the Pum curves depicting the interactions between the outer RC and inner steel tube of circular HSRC column 1-1 under axial compression. During the initial loading stages, the column is in the elastic stage, and the Poisson’s ratio of the steel tube exceeds that of the concrete. Consequently, the stress on the interface between the outer RC and inner steel tube gradually increases. As continuous loading causes plastic deformation in the outer RC, the interactions gradually intensify with higher loads. Even after the column has cracked, the reinforced cage still provides constraint on the left side of the concrete, resulting in a slow increase in interactions between the outer RC and inner steel tube. This increasing trend starts mildly and then becomes more prominent. On the right side, the interactions between the outer RC and inner steel tube gradually increase with the load, following a gentle upward trend. Due to the hollow nature of the steel tube, the restraining stress is greater on the left side of the column than on the right side.

5. Parametric Analysis

In this study, the behavior of circular HSRC columns under axial compression is analyzed by considering parameters such as the diameter of the steel tube (d), the thickness of the steel tube (t), the slenderness ratio (λ), the strength of the steel tube (fys), the strength of the concrete (fcu), the strength of the longitudinal rebar (fyl), the strength of the stirrup (fyg), and the spacing of the stirrup (s).

5.1. Diameter of Steel Tube

Figure 14a plots the load–deflection curves of the circular HSRC columns for various steel tube diameters. Increasing the steel tube diameter from 80 mm to 100 mm and 120 mm results in an increase in axial load (N) from 1163.8 kN to 1286.3 kN and 1378.7 kN, respectively, corresponding to a percentage increase of 10.5% and 18.5%. The stiffness of the circular HSRC column also improves from 1624.0 kN/mm to 1628.0 kN/mm and 1645.0 kN/mm, respectively, corresponding to a percentage increase of 0.2% and 1.3%. The increase in the bearing capacity of the circular HSRC columns is attributed to the enlarged cross-sectional area of the steel tube. Therefore, the diameter of the steel tube has a significant impact on the bearing capacity of the columns. However, the diameter of the steel tube does not have a significant effect on the stiffness of the circular HSRC columns due to the reduction in external reinforced concrete.

5.2. Thickness of the Steel Tube

Figure 14b plots the load–deflection curves of the circular HSRC columns for various steel tube thicknesses. Decreasing the steel tube thickness from 4 mm to 3 mm and 2 mm reduces the axial load from 1261.1 kN to 1163.8 kN and 1115.1 kN, respectively, resulting in decreases in the stiffness of the circular HSRC columns from 1641.9 kN/mm to 1624.0 kN/mm and 1605.0 kN/mm, respectively, by 1.1% and 2.2%. Similar to the steel tube diameter, increasing its thickness expands the cross-sectional area, thereby influencing the bearing capacity of the circular HSRC columns to some extent. However, due to the reduction in external RC, the thickness of the steel tube has a negligible effect on the stiffness of the circular HSRC columns.

5.3. Slenderness Ratio

Figure 14c plots the load–deflection curves of the circular HSRC columns at various slenderness ratios. Increasing the slenderness ratio from 24 to 30 and 36 decreases the axial load from 1680.6 kN to 1530.6 kN and 1163.8 kN, respectively, resulting in a decline in the stiffness of the circular HSRC columns from 5022.5 kN/mm to 2672.5 kN/mm and 1624.0 kN/mm, respectively, by 46.7% and 67.7%. Higher slenderness ratios increase the susceptibility of circular HSRC columns to instability failure. Consequently, the bearing capacity and stiffness of the circular HSRC columns decrease, and the slenderness ratio has a significant impact on them.

5.4. Strength of Concrete

Figure 14d plots the load–deflection curves of the circular HSRC columns at various concrete strengths. Increasing the concrete strength from 40 MPa to 60 MPa and 80 MPa raises the axial load from 1163.8 kN to 1657.3 kN and 1895.1 kN, respectively, resulting in improvements in the stiffness of the circular HSRC columns from 1624.0 kN/mm to 1772.1 kN/mm and 1861.9 kN/mm, respectively, by 9.1% and 14.6%. The concrete part represents 94.4% of the total member volume. Thus, the concrete part significantly influences the bearing capacity and stiffness of the columns under axial compression, making the strength of the concrete a crucial factor.

5.5. Strength of Steel Tube

Figure 14e plots the load–deflection curves of the circular HSRC columns at various steel tube strengths. Increasing the strength of the steel tube from 345 MPa to 390 MPa and 420 MPa increases the axial force from 1163.8 kN to 1249.2 kN and 1375.5 kN, respectively, i.e., 7.3% and 18.2%. Increasing the strength of the steel tube enhances the overall bearing capacity of the circular HSRC columns. However, it does not change the overall stiffness of the rigid member when the other parameters of the steel tube remain unchanged. Thus, the strength of the steel tube moderately affects the bearing capacity of the circular HSRC columns, but does not have a profound effect on their stiffness.

5.6. Strength of Longitudinal Rebar

Figure 14f plots the load–deflection curves of the circular HSRC columns at various strengths of the longitudinal rebar. Decreasing the strength of the longitudinal rebar from 500 MPa to 400 MPa and 335 MPa results in a decrease in the axial force from 1428.8 kN to 1163.8 kN and 1052.3 kN, respectively, representing a change of 18.5% and 26.4%. Enhancing the strength of the longitudinal rebar enhances the overall bearing capacity of the members markedly on the premise that the cross-sectional area of the reinforcement remains unchanged. Since the length, diameter, and position of the longitudinal rebar remain unchanged, it does not affect the overall stiffness of the columns. Consequently, the strength of the longitudinal rebar has a significant impact on the bearing capacity of the circular HSRC columns.

5.7. Strength of Stirrup

Figure 14g plots the load–deflection curves of the circular HSRC columns at various stirrup strengths. Increasing the strength of the stirrup from 300 MPa to 335 MPa and 400 MPa increases the axial force from 1163.8 kN to 1170.6 kN and 1215.3 kN, respectively; i.e., 0.6% and 4.4%. Increasing the strength of the stirrup enhances the restraining effect of the longitudinal rebar to a certain extent but has no considerable influence on the bearing capacity and overall stiffness of the members. Thus, the strength of the stirrup has a slight influence on the bearing capacity of the circular HSRC columns, but does not have a significant effect on their stiffness.

5.8. Spacing of Stirrup

Figure 14h plots the load–deflection curves of the circular HSRC columns at various stirrup spacings. Reducing the spacing of the stirrup from 150 mm to 100 mm and 50 mm increases the axial force from 1113.3 kN to 1163.8 kN and 1233.1 kN, respectively, i.e., 4.5% and 10.8%. Changing the spacing of the stirrup only has a particular impact on restraining the longitudinal rebar. However, considering the wrapping restraint provided by the external concrete, it cannot significantly impact the bearing capacity and overall stiffness of the columns under axial compression. Thus, the spacing of the stirrups has no remarkable effect on the bearing capacity and stiffness of the circular HSRC columns.
It can be concluded that the strength of the concrete, slenderness ratio, diameter of the steel tube, yield strength of the longitudinal rebar, and yield strength of the steel tube dramatically influence the bearing capacity of the circular HSRC columns under axial compression. Additionally, the stiffness of circular HSRC columns is notably affected by the slenderness ratio and the strength of the concrete. The impact of various parameters on the axial compression performance of circular HSRC columns is primarily attributed to the buckling failure of composite columns at different heights under axial compression, as well as the alterations in the strength and cross-sectional area of the constituent materials. The primary factors influencing the initial stiffness of circular HSRC columns under axial compression include the flexural stiffness of concrete, longitudinal rebar, and steel tube, as well as the variation in flexural stiffness resulting from instability and damage caused by changes in the slenderness ratio.

6. Calculations of Ultimate Strength

6.1. Proposed Design Procedures

The axial compression bearing capacity of the circular HSRC columns can be divided into two components: the hollow steel tube and the hollow RC, based on the superposition principle. According to the limit equilibrium principle, the ultimate axial compression bearing capacity (Nuc) of circular HSRC columns can be calculated using the following expression:
N u c = N u c r c + N u c s
where: N u c r c and N u c s represent the ultimate strength of the outer RC and the inner steel tube, respectively.
Method 1 follows the Chinese codes T/CECS 188-2019 [22] and GB50010-2010 [23]. The normal-section bearing capacity of the RC part ( N u c 1 r c ) and the inner steel tube part ( N u c 1 s ) under axial compression can be determined with the axial compressive bearing capacity ( N u c 1 r c and N u c s ) of short columns corresponding to similar cross-sectional parameters using code GB50010-2010. The axial bearing capacity of the circular HSRC column can be obtained through the sum of the two components ( N u c 1 r u and N u c 1 s ), multiplying the stability coefficient provided in code T/CECS 188-2019 (see Table A1).
According to AIJ [11], method 2 defines the H/D ratio, where H is the effective length of the member and D represents the section diameter of the column. Circular HSRC columns are categorized into short, medium–long, and long columns based on the H/D ratio, and the corresponding formulas are established. The specific provisions are as follows: H/D ≤ 4 denotes a short column, 4 < H/D ≤ 12 indicates a medium–long column, and H/D > 12 represents a long column, as presented in Figure A1. The formula for the bearing capacity of the columns under axial compression is based on the linear equation of the interpolation function at the boundary of the short column and long columns.
Method 3 is according to Eurocode 4 [12]. The plastic compressive capacity (Npl.Rd) of the loading cross-section is calculated by increasing the plastic bearing capacity of the components. As for the long column under axial compression in the European code, the elastic, critical load on the column is determined according to the analysis method in Eurocode 4 [12] and the design value of the effective bending stiffness determined by the member defects in which the second-order effect is not considered.

6.2. Evaluation of Proposed Design Procedures

Methods 1–3 calculate the ultimate strength of the circular HSRC columns, and Figure 15 presents the corresponding results. Based on the three simplified design methods mentioned above, the average and standard deviation of the three methods Nuc/NuFEM, are compared, with 0.931 and 0.045 for Method 1, 0.973 and 0.069 for Method 2, and 1.042 and 0.092 for Method 3. The results clearly demonstrate that the three simplified design methods are reasonable.
Table 4 presents the ultimate axial bearing capacity (Nuc) of the circular HSRC columns calculated by three methods, along with the corresponding measured values (Nue). The result of method 1 is similar to that of method 3, and both Nuc1/Nue and Nuc3/Nue are greater than 1.0 but less than 1.1. The variance between the experimental values and the results of method 2 is minimal, with the smallest standard deviation of 0.069 shown in Figure 15.
Furthermore, the ratio of the calculated bearing capacity to the one computed by the finite element modeling (Nuc/NuFEM) in methods 1–3 obeys the normal distribution {N1 (0.931, 0.002), N2 (0.973, 0.004), and N3 (1.042, 0.009)}, and the confidence intervals are (0.907, 0.953), (0.937, 1.009), and (0.999, 1.096), respectively, at a confidence level of 95%. Method 1 has the simplest formula, but it does not consider the influence of other parameters on the bearing capacity of the columns. Method 2 can accurately simulate the effects of the slenderness ratio, material strength, and other parameters on the bearing capacity of the circular HSRC columns. In conclusion, the method based on the AIJ design method offers the most accurate predictions.

7. Conclusions

Only for short-term loading, this paper investigates the circular HSRC columns through experimental results and numerical analysis. It also analyzes the axial compression performance of the columns through parametric analysis and a simplified calculation method. The current research findings lead to the following conclusions:
  • Cracks appeared on the left side of the concrete surface when the load decreased to approximately 0.9Nue. At a load of 0.5Nue to 0.7Nue, the outer surface of the concrete on the right side was crushed, causing the inner steel tube to buckle inward. The strain on the components exceeded their yield strain. Based on the values of SI and DI, the circular HSRC columns exhibited good ductility and stiffness, with a bearing capacity higher than the sum of the compressive strengths of the components.
  • A finite element model considering material nonlinearity and the interaction between the concrete and the steel tube was established for the circular HSRC column under axial compression. The model-calculated results showed excellent agreement with the measured data. The parameters that significantly influenced the column’s bearing capacity under axial compression were the concrete strength, slenderness ratio, steel tube diameter, yield strength of the longitudinal rebar, and yield strength of the steel tube. The parameters that had a significant impact on the column’s stiffness were the slenderness ratio and concrete strength.
  • Three superimposition models were evaluated for calculating the ultimate strength of circular HSRC columns under axial compression. The evaluated methods were based on codes T/CECS663–2020, GB50010-2019, AIJ, Eurocode 4.

Author Contributions

Conceptualization, Q.W. (Qiuyu Wei), Q.R. and Q.W. (Qinghe Wang); methodology, Q.R. and Q.W. (Qinghe Wang); software, Q.W. (Qiuyu Wei); validation, Q.R., Q.W. (Qinghe Wang) and Y.Z., formal analysis, Q.W.; investigation, Q.W. (Qiuyu Wei), Q.R. and Q.W. (Qinghe Wang); resources, Q.W. (Qinghe Wang); data curation, Q.W. (Qiuyu Wei) and Q.R.; writing—original draft preparation, Q.W. (Qiuyu Wei); writing—review and editing, Q.W. (Qiuyu Wei); visualization, Q.W. (Qiuyu Wei); supervision, Q.R., Q.W. (Qinghe Wang) and Y.Z.; project administration, Q.R., Q.W. (Qinghe Wang) and Y.Z.; funding acquisition, Q.R., Q.W. (Qinghe Wang) and Y.Z. All authors have read and agreed to the published version of the manuscript.

Funding

This research was funded by the National Natural Science Foundation of China, China (51808351); by the Science and Technology Project of MHRUD, China (2019-K-054); and by the Liaoning Research Project, China (lnjc202007).

Institutional Review Board Statement

Not applicable.

Informed Consent Statement

Not applicable.

Data Availability Statement

The data provided in this study can be provided at the request of the corresponding author. The data are not publicly available due to privacy.

Conflicts of Interest

The authors declare that we do not have any commercial or associative interest that represents a conflict of interest in connection with the work submitted.

Appendix A

Appendix A.1. Method 1

N u c 1 r u and N u c 1 s in method 1 can be defined as:
N u c 1 = N u c 1 r c + N u c 1 s = 0.9 φ N u c 1 r c + N u c 1 s = 0.9 φ f c u A c + f y l A y l + f s A s
where Nuc1 is the ultimate strength predicted by method 1; N u c 1 r c and N u c 1 s indicate the ultimate strength of the CHRC and the inner CHST tube, N u c 1 r c and N u c 1 s indicate the ultimate compressive bearing capacity of short columns with the same cross-sectional parameters as the CHRC and CHST tube, respectively predicted by method 1; and φ represents the stability coefficient of the slender columns under axial compression (Chinese codes T/CECS 188-2019 [22]).
Table A1. The values of φ at different lengths.
L (mm)32001800160015001200
φ0.8750.9730.9870.9931.000

Appendix A.2. Method 2

Figure A1. The relationship between the three types of circular HSRC columns in method 2.
Applsci 14 04833 g0a1
Figure A1 depicts the relationship between the short, medium–long, and long columns. The ultimate stress design method introduces the strength reduction factor related to the standard slenderness ratio (Mat et al. [11]).
Method 2 defines N u c 2 r c and N u c 2 s for various columns as follows:

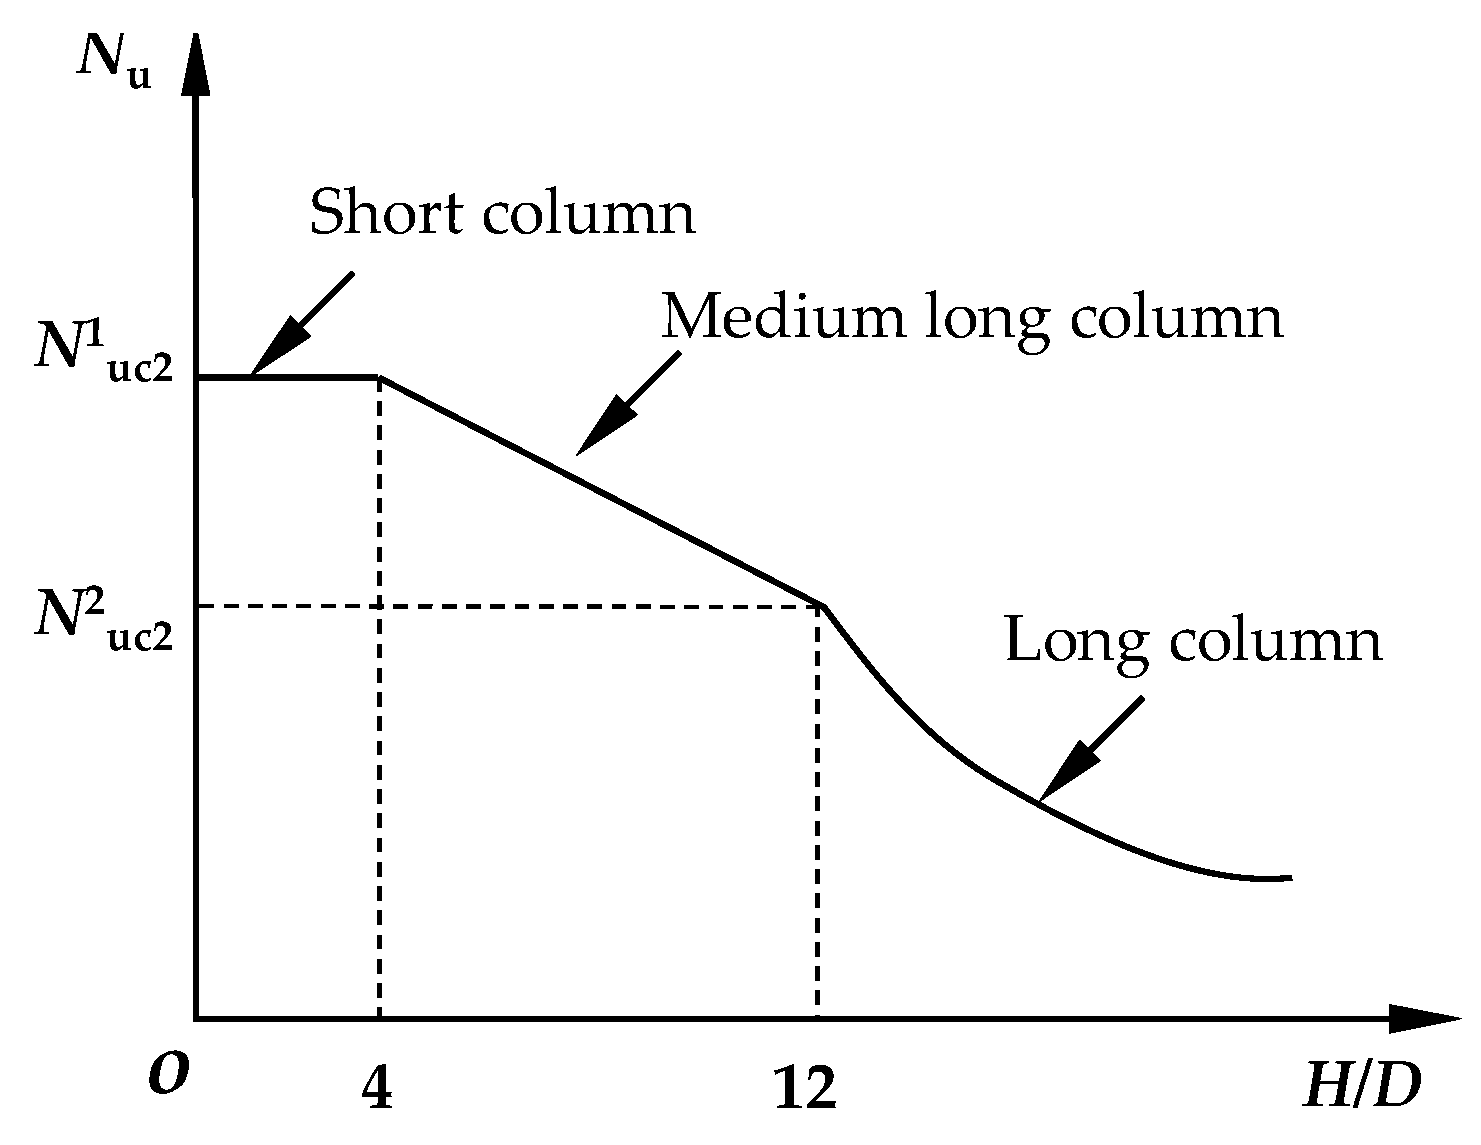
Appendix A.2.1. Short Columns (H/D ≤ 4)

N u c 2 1 = N u c 2 r c 1 + N u c 2 s 1
N u c 2 r c 1 = A c r c f c + 1 + η A l i F l
N u c 2 s 1 = 1 + η A s F s
where N u c 2 1 is the ultimate strength of short columns in method 2; N u c 2 r c 1 and N u c s 1 represent the ultimate bearing capacity of the CHRC and the inner CHST, respectively, for short columns; fc indicates the compressive strength of concrete cylinders; rc denotes the reduction factor of the compressive strength of concrete cylinders (rc = 0.85); Fl is the standard value for determining the allowable strength of longitudinal rebar and is defined as Fl = min(fyl, 0.7ftl); fyl represents the yield strength of the longitudinal rebar; ftl stands for the standard value of the tensile strength of the longitudinal rebar; Fs is the standard value for determining the allowable strength of the steel tube and is defined as Fs = min(fys, 0.7fts); fys is the yield strength of the steel tube; fts indicates the common value of the tensile strength of the steel tube; and η is the improvement coefficient of the stress on steel (η = 0.27).

Appendix A.2.2. Medium–Long Columns (4 < H/D ≤ 12)

The formula for calculating the ultimate strength of medium–long columns under axial compression is obtained according to the interpolation of N u c 2 1 , calculated by the formula for short columns under axial compression, and N u c 2 2 , calculated by the formula for long columns under axial compression, as follows:
N u c 2 = N u c 2 1 0.125 N u c 2 1 N u c 2 2 H / D 4
where Nuc2 represents the ultimate strength of medium–long columns in method 2; N u c 2 1 is the ultimate compressive capacity of composite columns when H/D = 4; and N u c 2 2 indicates the ultimate compressive capacity of composite columns when H/D = 12.

Appendix A.2.3. Long Columns (H/D > 12)

N u c 2 2 = N u c 2 r c 2 + N u c 2 s 2 = N u c 2 c 2 + N u c 2 l 2 + N u c 2 s 2
N u c 2 l 2 = Σ A l i × F 1 λ l < 0.3 1 0.545 λ l 0.3 N y l 0.3   < λ l < 1.3 N y l / 1.3 × λ l 2 = N c r l / 1.3 λ l > 1.3
N u c 2 s 2 = A s × F s λ s < 0.3 1 0.545 λ s 0.3 N y s 0.3   < λ s < 1.3 N y s / 1.3 × λ s 2 = N c r s / 1.3 λ s > 1.3
λ l = H I l A l i ,   λ s = H I s A s ,   λ c = H I c A c
λ l = λ l π N l 2 E s = N l 2 . N c r l ,   λ s = λ s π N s 2 E s = N s 2 . N c r s ,   λ c = λ c π ε c u
N c r l = π 2 E l I l / μ H 2 ,   N c r s = π 2 E s I s / μ H 2
N u c 2 c 2 = A c σ c
σ c = 2 1 + λ c 4 + 1 × σ B λ c < 1.0 0.83 esp C c 1 λ c σ B λ c > 1.0
σ B = r u f c
ε c u = 0.93 σ B 1 / 4 1 0 3
C C = 0.586 + 0.00612 × f c
where N u c 2 2 is the ultimate strength of long columns in method 2; N u c 2 c 2 , N u c 2 l 2 , and N u c 2 s 2 represent the ultimate bearing capacity of CHRC, the longitudinal rebar, and the inner CHST, respectively, for long columns; λl, λs, and λc indicate the slenderness ratio of the longitudinal rebar, the inner hollow steel tube, and the outer concrete, respectively, for long columns; λl, λs, and λc represent the standard slenderness ratio of the longitudinal rebar, the inner hollow steel tube, and the outer concrete, respectively; Ncrl and Ncrs are the Euler stability limit for the compressive strength of the longitudinal rebar and the inner hollow steel tube, respectively; Il, Is, and Ic denote the section moment of inertia of the longitudinal rebar, the inner hollow steel tube, and the outer concrete, respectively for long columns; σc is the stress on concrete at the stable ultimate strength in the AIJ design method (Mat et al., 1997 [11]); σB is the compressive stress on plain concrete; εcu stands for the strain on plain concrete; and Cc is the concrete conversion coefficient.

Appendix A.3. Method 3

According to the stress characteristics, the effective height of the circular HSRC column is the column height, and the relative slenderness ratio (λ) is not greater than 2.0 (Eurocode 4 [12]). N u c 3 r c and N u c 3 s in method 3 can be defined as:
N u c 3 = N u c 3 r c + N u c 3 s = χ N p l . k = 1.7 χ N p l . R d = 1.7 χ N u c 3 r c + N u c 3 s
N u c 3 r c = Σ A l i f y d + 0.85 A c f c u ,   N u c 3 s = A s f s d
λ = N p l . k N c r
N c r = π 2 E I e f f . I I / μ H 2
E I e f f . I I = Κ o E l I l + E s I s + Κ e . I I E c I c
χ = 1 Φ + Φ 2 λ 2
Φ = 0.5 1 + α λ 0.2 + λ 2
where Nuc3 is the ultimate strength predicted by method 3; N u c 3 r c , N u c 3 r c and N u c 3 s , N u c 3 s represent the predicted slender column and short column ultimate strength of the CHRC and the inner CHST, respectively, in method 3; Npl.Rd is the plastic resistance to compression; Npl.k indicates the characteristic value of the plastic resistance to compression calculated as Npl.k = 1.7 Npl.Rd; fyd and fsd are the characteristic value of the plastic resistance to compression of the longitudinal rebar and the steel tube, respectively, calculated as fyd = fyd/γm1 and fsd = fsd/γm1; γm1 is the partial factor; λ″ indicates the relative slenderness ratio; Ncr stands for the elastic, critical, normal force in the relevant buckling mode calculated using the effective flexural stiffness of the cross-section of a composite column, (EI)eff indicates effective flexural stiffness for use in second-order analysis; Ke.II is a correction factor which should be taken as 0.5; Ko indicates a calibration factor which should be taken as 0.9; Il, Is, and Ic represent the section moment of inertia of the longitudinal rebar, the inner, hollow steel tube, and the outer, encased concrete, respectively; and χ denotes the reduction factor in the relevant buckling mode. α indicates an imperfection factor.

Appendix B

Appendix B.1. Mechanical Parameters Adopted for the Damage Plasticity Model for Concrete

Table A2. Damage plasticity model.
Dilation Angle (°)Eccentricityfb0/fc0k Viscosity Parameter
30°0.11.160.6670.015
Table A3. Compressive behavior.
Yield Stress (N/(mm2))Inelastic Strain
13.577955460
13.9240740.00013829
17.4028480.000220006
20.317750.000319012
22.6792320.000434996
24.4977460.000567646
25.7837440.000716649
26.5476780.000881693
26.80.001062463
26.517982680.00125967
25.794161750.00147047
24.792106960.001689825
23.639484470.001913801
22.427265950.002139594
Table A4. Tensile behavior.
Yield Stress (N/(mm2))Fracture Energy (N/(mm0.5))
3.01419266221
Table A5. Convergence criterion. Newton-Raphson iteration solver.
Maximum Number of Increments10,000
Increment sizeInitialMinimumMaximum
0.0011 × 10−60.01

References

  1. Wang, R.; Han, L.H.; Lam, D.; Sheehan, T. Behavior of octagonal steel-reinforced concrete box columns under compressive load. Mag. Concr. Res. 2018, 70, 38–855. [Google Scholar] [CrossRef]
  2. An, Y.F.; Han, L.H.; Zhao, X.L. Experimental behavior of box concrete-encased CFST eccentrically loaded column. Mag. Concr. Res. 2013, 65, 1219–1235. [Google Scholar] [CrossRef]
  3. Won, D.H.; Han, T.H.; Kim, S.; Jang, I.S.; Kang, Y.J. Optimum confining effect in steel composite hollow RC column with inner tube under compressive load. Mag. Concr. Res. 2014, 66, 433–446. [Google Scholar] [CrossRef]
  4. Han, T.H.; Stallings, J.M.; Cho, S.K.; Kang, Y.J. Behavior of a hollow RC column with an internal tube. Mag. Concr. Res. 2010, 62, 25–38. [Google Scholar] [CrossRef]
  5. Han, T.H.; Yoon, K.Y.; Kang, Y.J. Compressive strength of circular hollow reinforced concrete confined by an internal steel tube. Constr. Build. Mater. 2010, 24, 1690–1699. [Google Scholar] [CrossRef]
  6. Alajarmeh, O.; Manalo, A.; Benmokrane, B.; Ferdous, W.; Mohammed, A.; Abousnina, R.; Elchalakani, M.; Edoo, A. Behavior of circular concrete columns reinforced with hollow composite sections and GFRP bars. Mar. Struct. 2020, 72, 102785. [Google Scholar] [CrossRef]
  7. Ren, Q.X.; Ding, J.N.; Wang, Q.H.; Lou, H.Q. Behavior of slender square hollow steel-reinforced concrete columns under eccentric compression. J. Build. Eng. 2021, 43, 103133. [Google Scholar] [CrossRef]
  8. AS 5100.6-2004: 2004; Bridge Design, Part 6: Steel and Composite Construction. The Council of Standards: Sydney, NSW, Australia, 2004.
  9. ANSI/AISC 360-05: 2005; Specification for Structural Steel Buildings. The AISC Committee on Specifications: Chicago, IL, USA, 2005.
  10. DBJ/T 13-51-2010: 2010; Technical Specification for Concrete-Filled Steel Tubular Structures. Provincial Department of Housing and Urban Rural Development: Fuzhou, China, 2010. (In Chinese)
  11. Mat, S.C.; Mitani, I.; Kawano, A. AIJ Design method for concrete filled steel tubular structures. In Proceedings of the International Conference on Composite Construction Conventional and Innovative, Innsbruck, Austria, 14–18 July 1997. [Google Scholar]
  12. EN1994-1-1: 2004; Design of Composite Steel and Concrete Structures—Part 1–1: General Rules and Rules for Buildings. European Committee for Standardization: Brussels, Belgium, 2004.
  13. Hadi, M.; Goaiz, H.A.; Yu, T. Experimental investigation of CFRP confined hollow core Reactive Powder Concrete columns. Constr. Build. Mater. 2018, 74, 343–355. [Google Scholar] [CrossRef]
  14. Bai, Y.; Nie, J.G.; Cai, C.S. New connection system for confined concrete columns and beams. I I: Theoretical Modeling. J. Struct. Eng. ASCE 2008, 134, 1800–1809. [Google Scholar] [CrossRef]
  15. Li, Y.J.; Han, L.H.; Xu, W.; Tao, Z. Circle concrete-encased concrete-filled steel tube (CFST) stub columns subjected to axial compression. Mag. Concr. Res. 2016, 68, 995–1010. [Google Scholar] [CrossRef]
  16. Hibbitt, K.; Sorenson, I. ABAQUS, Version 6.14: Theory Manual, Users’ Manual, Verification Manual and Example Problems Manual; Dassault Systèmes: Providence, RI, USA, 2014.
  17. Han, L.H. Concrete Filled Steel Tubular Structures—Theory and Practice, 3rd ed.; Science Press: Beijing, China, 2016. [Google Scholar]
  18. Guo, Z.H.; Shi, X.D. Principle and Analysis of Reinforced Concrete, 3rd ed.; Tsinghua University Press: Beijing, China, 2013. [Google Scholar]
  19. ACI318-11: 2011; Building Code Requirements for Structural Concrete and Commentary. American Concrete Institute: Detroit, MI, USA, 2011.
  20. Hillerborg, A.; Modéer, M.; Petersson, P.E. Analysis of crack formation and crack growth in concrete by means of fracture mechanics and finite elements. Cem. Concr. Res. 1976, 6, 773–782. [Google Scholar] [CrossRef]
  21. Xiao, L.; Sritharan, S. Effects of confinement in square hollow concrete column sections. Eng. Struct. 2019, 19, 526–535. [Google Scholar] [CrossRef]
  22. T/CECS 188-2019: 2020; Technical Specification for Steel Tube-Reinforced Concrete Column Structures. Tsinghua University and China Association for Standardization of Engineering Construction: Beijing, China, 2020. (In Chinese)
  23. GB50010-2010: 2015; Code for Design of Concrete Structures. Ministry of Housing and Urban-Rural Development of the PRC and General Adminstration of Quality Supervision Inspection and Quarantine: Beijing, China, 2015. (In Chinese)
Figure 1. Circular hollow steel-reinforced concrete columns.
Applsci 14 04833 g001
Figure 2. The construction process of circular HSRC column.
Applsci 14 04833 g002
Figure 3. The test setup and instrumentation.
Applsci 14 04833 g003
Figure 4. The measured load–deflection curves (Num) of the specimens.
Applsci 14 04833 g004
Figure 5. The failure process of the specimens.
Applsci 14 04833 g005
Figure 6. Comparing the failure mode between the tested and FEM results.
Applsci 14 04833 g006
Figure 7. The variation of the height with the lateral deflection of the columns.
Applsci 14 04833 g007
Figure 8. The variation of the axial load (N) with the strain (ε).
Applsci 14 04833 g008
Figure 9. The distribution of the strains across the mid-height section of columns. Dash lines indicates that the location where strain may develop is because at this point, the concrete has already been crushed or cracked.
Applsci 14 04833 g009
Figure 10. The finite element model of the circular HSRC column.
Applsci 14 04833 g010
Figure 11. Schematic diagram of the feature points.
Applsci 14 04833 g011
Figure 12. The longitudinal stress distribution of the middle-height concrete (unit: N/mm2).
Applsci 14 04833 g012
Figure 13. The change of the interactions between the outer RC and the inner steel tube in the middle section of column 1-1.
Applsci 14 04833 g013
Figure 14. The results of the parametric analysis on the Num curves.
Applsci 14 04833 g014
Figure 15. Comparison of the calculated bearing capacity with the finite element modeling results.
Applsci 14 04833 g015
Table 1. The test parameters and main results.
LabelSection
D × L (mm)
Steel Tube
d × t (mm)
SIDINue(kN)
1−1−1200 × 160080 × 2.781.234 1.6561642
1−1−2200 × 160080 × 2.781.278 1.3631585
2−1−1200 × 320080 × 2.781.155 1.852 1315
2−1−2200 × 320080 × 2.781.109 1.619 1263
1−2−1200 × 1600100 × 2.781.290 2.198 1639
1−2−2200 × 1600100 × 2.781.258 1.835 1578
Note: Nue is the measured value, SI denotes the strength index, DI is the ductility index.
Table 2. The material properties of the steel.
Steel TypedtsfyfuEνs
Steel tube80.02.783785192060.296
Longitudinal bar12.0-3845032040.289
Stirrup6.40-3264521960.293
Note: The units of d and ts are mm, the units of fy and fu are N/mm2, the units of E is Gpa.
Table 3. The mix proportions and properties of the concrete.
CementWaterFly AshSandCoarse
Aggregate
Water
Reducer
fcu,testEcνc
30015610073011304.545.232.00.201
Note: The unit of each component of the concrete mix proportion is (kg/m3), the unit of fcu,test is N/mm2, the unit of Ec is Gpa.
Table 4. Axial compression calculation results of circular HSRC specimens.
Label.Nue (kN)Nuc (kN)Nuc/Nue
NuFEMNuc1Nuc2Nuc3ABCD
1−1−1164216221549164416971.0230.9771.0371.071
1−1−215850.9880.9441.0011.034
2−1−1131512801356127813010.973 1.0310.982 0.989
2−1−212631.013 1.0731.022 1.030
1−2−1163916141494157916840.985 0.9110.963 1.027
1−2−215781.023 0.9471.000 1.067
Mean1.0010.9810.9971.036
Standard deviation0.0220.0610.0260.029
Note: Nuc indicates the calculated value, A is NuFEM/Nue, B denotes Nuc1/Nue, C indicates Nuc2/Nue, and D represents Nuc3/Nue.
Disclaimer/Publisher’s Note: The statements, opinions and data contained in all publications are solely those of the individual author(s) and contributor(s) and not of MDPI and/or the editor(s). MDPI and/or the editor(s) disclaim responsibility for any injury to people or property resulting from any ideas, methods, instructions or products referred to in the content.

