
Primary and Secondary Stability Assessments of Dental Implants According to Their Macro-Design, Length, Width, Location, and Bone Quality

 , , , and
Abstract
1. Introduction
2. Materials and Methods
2.1. Study Design
2.2. Preoperative Radiographic Assessment
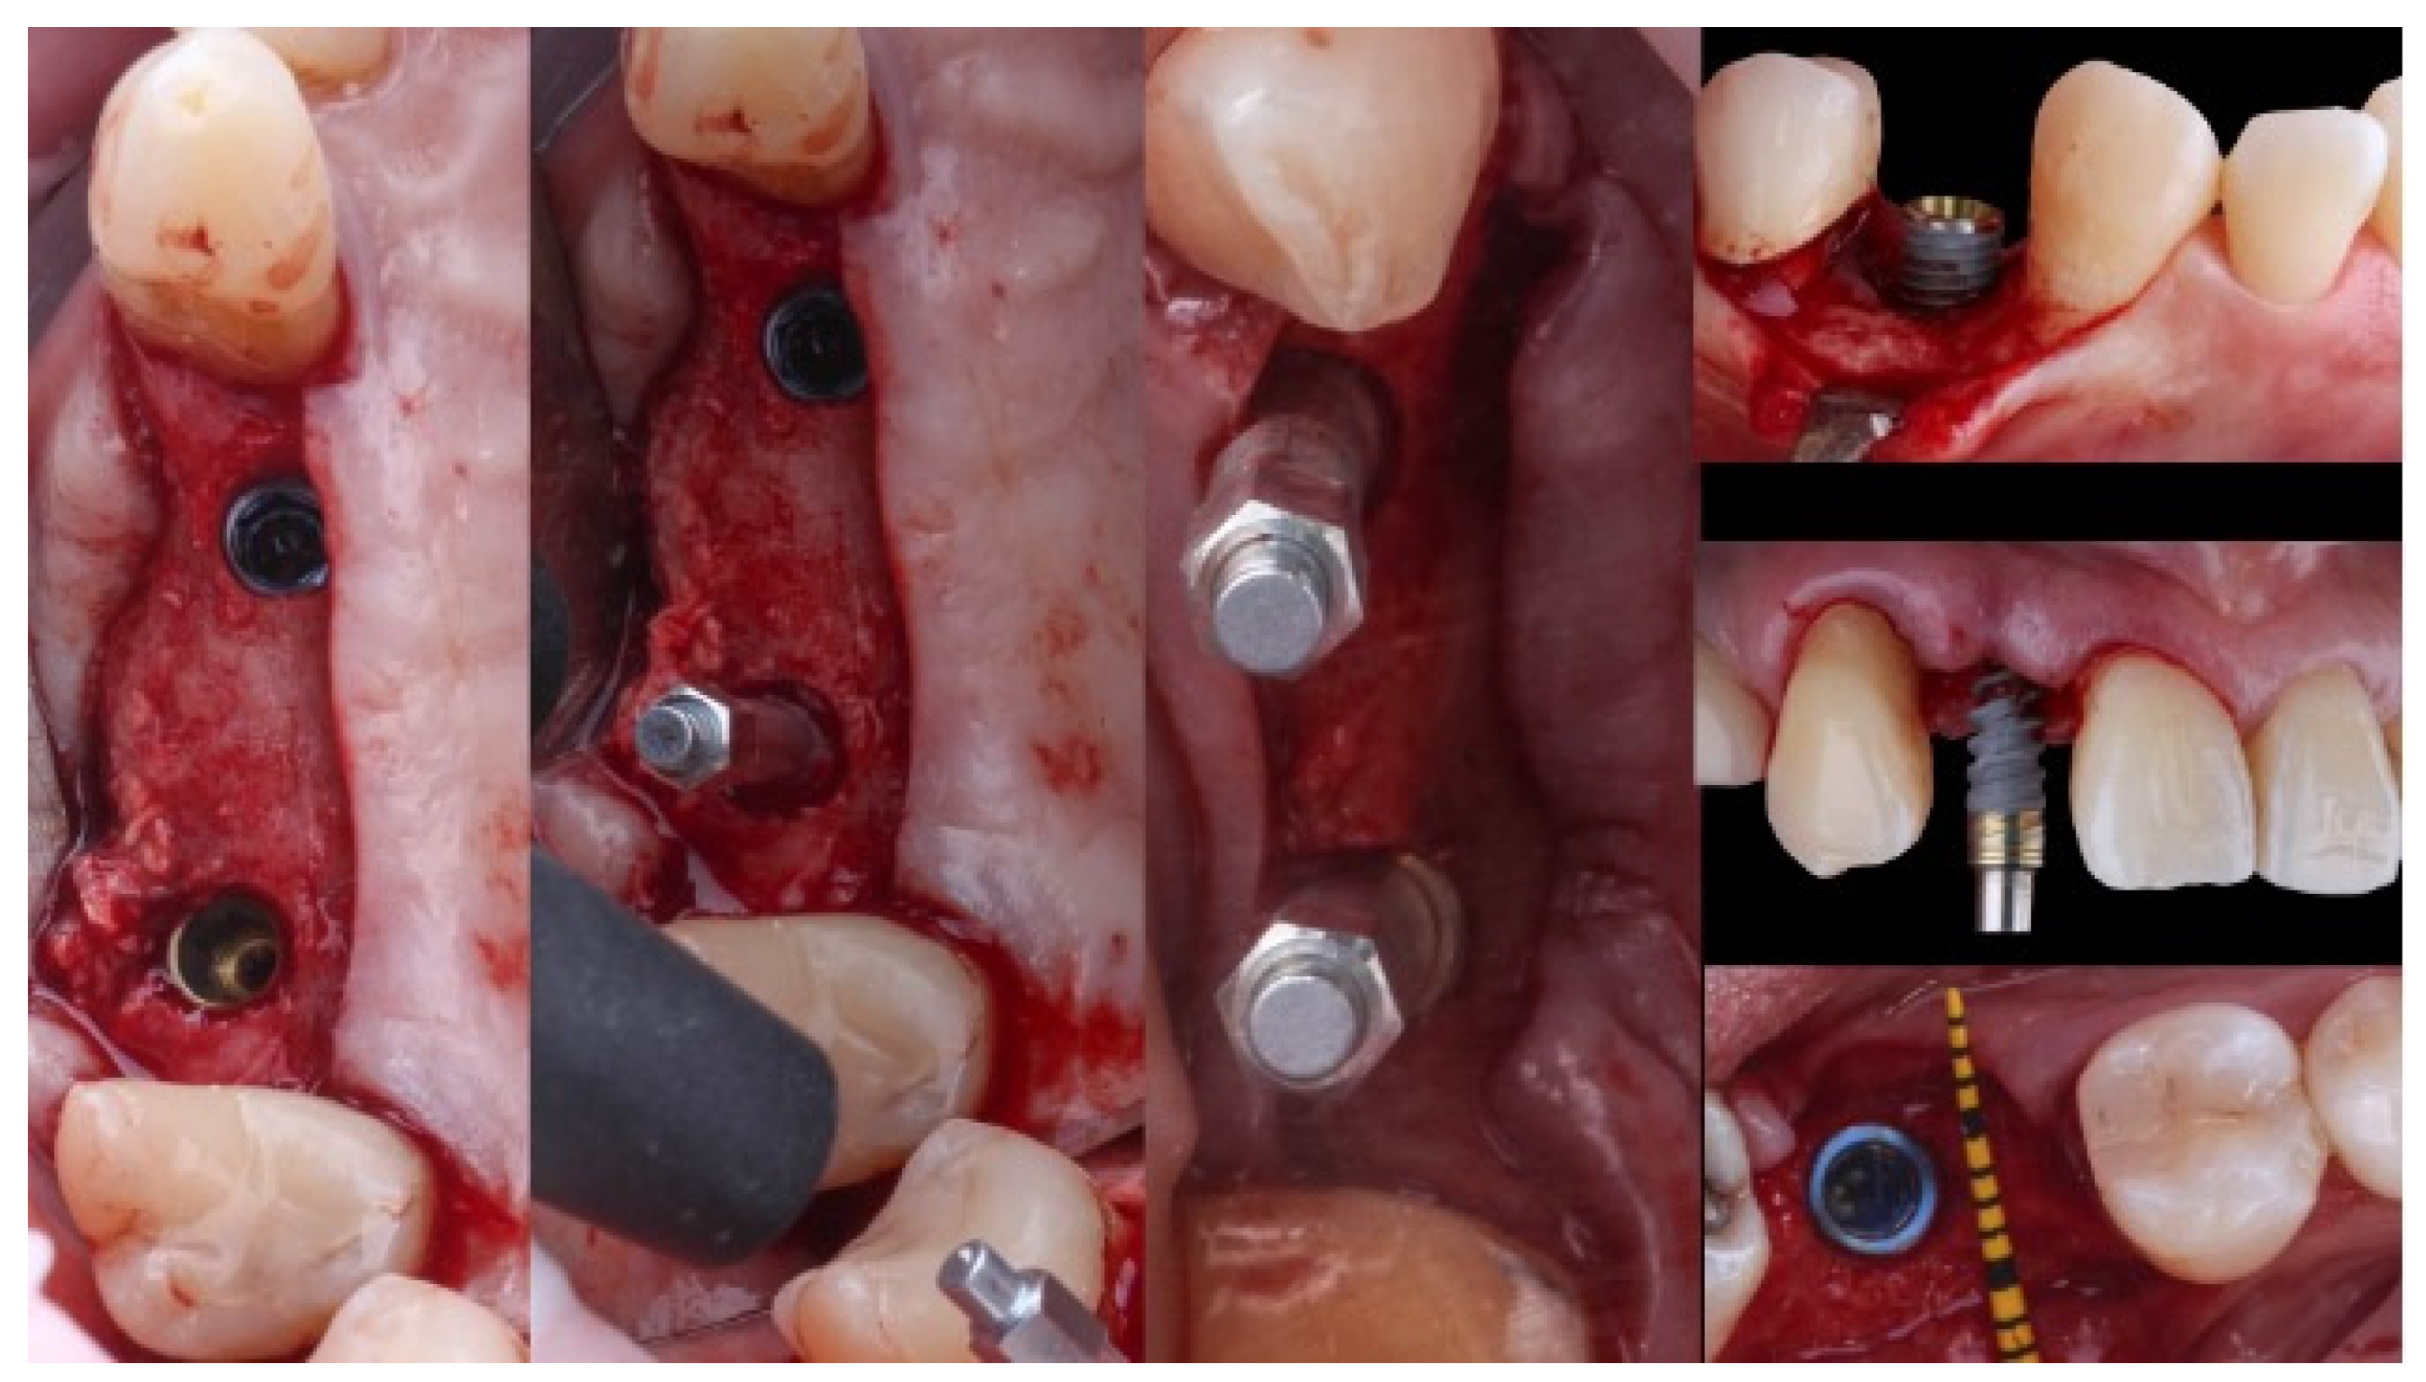
2.3. Surgical Protocol
2.4. Statistical Analysis
3. Results
4. Discussion
5. Conclusions
- On healed bone crests, higher values for primary stability (insertion torque and ISQ points) will be achieved with standard-diameter implants (Ø ≤ 4.5).
- After implant osseointegration (three months), the cylindrical implants yielded higher ISQ values than the conical implants. Further research is needed to assess factors that affect secondary stability.
- The ISQ values after three months will be lower in implants placed in the incisor–canine region than those placed in the bicuspid–molar region.
- Insertion torque is the variable that most influences ISQ on the day of the surgery, and the implant location and macro-design in the arch have the most significant effects on ISQ after three months.
Author Contributions
Funding
Institutional Review Board Statement
Informed Consent Statement
Data Availability Statement
Acknowledgments
Conflicts of Interest
Abbreviations
| CBCT | Cone beam computed tomography. |
| HU | Hounsfield units. |
| DICOM | Digital imaging and communication in medicine |
| IT | Insertion torque |
| ISQ | Implant stability quotient |
References
- Gamborena, I.; Sasaki, Y.; Blatz, M.-B. Predictable immediate implant placement and restoration in the esthetic zone. J. Esthet. Restor. Dent. 2021, 33, 158–172. [Google Scholar] [CrossRef] [PubMed]
- Papaspyridakos, P.; Chen, C.-J.; Singh, M.; Weber, H.-P.; Gallucci, G.-O. Success criteria in implant dentistry: A systematic review. J. Dent. Res. 2012, 91, 242–248. [Google Scholar] [CrossRef] [PubMed]
- Carosi, P.; Lorenzi, C.; Laureti, M.; Ferrigno, N.; Arcuri, C. Short Dental Implants (≤6 mm) to Rehabilitate Severe Mandibular Atrophy: A Systematic Review. Int. J. Oral Maxillofac. Implant. 2021, 36, 30–37. [Google Scholar] [CrossRef] [PubMed]
- Bornstein, M.-M.; Scarfe, W.-C.; Vaughn, V.-M.; Jacobs, R. Cone beam computed tomography in implant dentistry: A systematic review focusing on guidelines, indications, and radiation dose risks. Int. J. Oral Maxillofac. Implant. 2014, 29, 55–77. [Google Scholar] [CrossRef] [PubMed]
- Jacobs, R.; Salmon, B.; Codari, M.; Hassan, B.; Bornstein, M.-M. Cone beam computed tomography in implant dentistry: Recommendations for clinical use. BMC Oral Health 2018, 18, 88. [Google Scholar] [CrossRef] [PubMed]
- Marquezan, M.; Osório, A.; Sant′Anna, E.; Souza, M.M.; Maia, L. Does bone mineral density influence the primary stability of dental implants? A systematic review. Clin. Oral Implant. Res. 2012, 23, 767–774. [Google Scholar] [CrossRef] [PubMed]
- Fuster-Torres, M.-Á.; Peñarrocha-Diago, M.; Peñarrocha-Oltra, D.; Peñarrocha-Diago, M. Relationships between bone density values from cone beam computed tomography, maximum insertion torque, and resonance frequency analysis at implant placement: A pilot study. Int. J. Oral Maxillofac. Implant. 2011, 26, 1051–1056. [Google Scholar]
- Turkyilmaz, I.; Aksoy, U.; McGlumphy, E.-A. Two alternative surgical techniques for enhancing primary implant stability in the posterior maxilla: A clinical study including bone density, insertion torque, and resonance frequency analysis data. Clin. Implant. Dent. Relat. Res. 2008, 10, 231–237. [Google Scholar] [CrossRef] [PubMed]
- Ottoni, J.-M.; Oliveira, Z.-F.; Mansini, R.; Cabral, A.-M. Correlation between placement torque and survival of single-tooth implants. Int. J. Oral Maxillofac. Implant. 2005, 20, 769–776. [Google Scholar]
- Lages, F.-S.; Douglas-de Oliveira, D.-W.; Costa, F.-O. Relationship between implant stability measurements obtained by insertion torque and resonance frequency analysis: A systematic review. Clin. Implant. Dent. Relat. Res. 2018, 20, 26–33. [Google Scholar] [CrossRef]
- Trisi, P.; Perfetti, G.; Baldoni, E.; Berardi, D.; Colagiovanni, M.; Scogna, G. Implant micromotion is related to peak insertion torque and bone density. Clin. Oral Implant. Res. 2009, 20, 467–471. [Google Scholar] [CrossRef] [PubMed]
- Mikic, M.; Vlahovic, Z.; Stevanović, M.; Arsic, Z.; Mladenovic, R. The Importance of Correlation between CBCT Analysis of Bone Density and Primary Stability When Choosing the Design of Dental Implants-Ex Vivo Study. Tomography 2022, 8, 1293–1306. [Google Scholar] [CrossRef] [PubMed]
- Falco, A.; Berardini, M.; Trisi, P. Correlation between Implant Geometry, Implant Surface, Insertion Torque, and Primary Stability: In Vitro Biomechanical Analysis. Int. J. Oral Maxillofac. Implant. 2018, 33, 824–830. [Google Scholar] [CrossRef] [PubMed]
- Antonelli, A.; Barone, S.; Attanasio, F.; Salviati, M.; Cerra, M.G.; Calabria, E.; Bennardo, F.; Giudice, A. Effect of Implant Macro-Design and Magnetodynamic Surgical Preparation on Primary Implant Stability: An In Vitro Investigation. Dent. J. 2023, 11, 227. [Google Scholar] [CrossRef] [PubMed]
- Pérez-Pevida, E.; Cherro, R.; Camps-Font, O.; Piqué, N. Effects of Drilling Protocol and Bone Density on the Stability of Implants According to Different Macrogeometries of the Implant Used: Results of an In Vitro Study. Int. J. Oral Maxillofac. Implant. 2020, 35, 955–964. [Google Scholar] [CrossRef] [PubMed]
- Lekholm, U.; Zarb, G.-A. Patient selection and preparation. In Tissue Integrated Prostheses. Osseointegration in Clinical Dentistry; Brånemark, P.-I., Zarb, G.A., Albrektsson, T., Eds.; Quintessence Publishing Co.: Chicago, IL, USA, 1985; pp. 199–209. [Google Scholar]
- Misch, C.-E. Density of bone: Effect on surgical approach, and healing. In Contemporary Implant Dentistry; Misch, C.E., Ed.; Mosby-Year Book: St. Louis, MO, USA, 1999; pp. 371–384. [Google Scholar]
- Todisco, M.; Trisi, P. Bone mineral density and bone histomorphometry are statistically related. Int. J. Oral Maxillofac. Implant. 2005, 20, 898–904. [Google Scholar]
- Sennerby, L.; Andersson, P.; Pagliani, L.; Giani, C.; Moretti, G.; Molinari, M.; Motroni, A. Evaluation of a Novel Cone Beam Computed Tomography Scanner for Bone Density Examinations in Preoperative 3D Reconstructions and Correlation with Primary Implant Stability. Clin. Implant. Dent. Relat. Res. 2015, 17, 844–853. [Google Scholar] [CrossRef] [PubMed]
- Pandey, C.; Rokaya, D.; Bhattarai, B.P. Contemporary Concepts in Osseointegration of Dental Implants: A Review. Biomed. Res. Int. 2022, 2022, 6170452. [Google Scholar] [CrossRef] [PubMed]
- Vallecillo-Rivas, M.; Reyes-Botella, C.; Vallecillo, C.; Lisbona-González, M.J.; Vallecillo-Capilla, M.; Olmedo-Gaya, M.V. Comparison of Implant Stability between Regenerated and Non-Regenerated Bone. A Prospective Cohort Study. J. Clin. Med. 2021, 10, 3220. [Google Scholar] [CrossRef]
- Albrektsson, T.; Wennerberg, A. On osseointegration in relation to implant surfaces. Clin. Implant. Dent. Relat. Res. 2019, 21 (Suppl. 1), 4–7. [Google Scholar] [CrossRef]
- Kreve, S.; Ferreira, I.; da Costa Valente, M.L.; Dos Reis, A.C. Relationship between dental implant macro-design and osseointegration: A systematic review. Oral Maxillofac. Surg. 2024, 28, 1–14. [Google Scholar] [CrossRef] [PubMed]
- Lozano-Carrascal, N.; Salomó-Coll, O.; Gilabert-Cerdà, M.; Farré-Pagés, N.; Gargallo-Albiol, J.; Hernández-Alfaro, F. Effect of implant macro-design on primary stability: A prospective clinical study. Med. Oral Patol. Oral Cir. Bucal 2016, 21, e214–e221. [Google Scholar] [CrossRef]
- Walker, C.J.; Prihoda, T.J.; Mealey, B.L.; Lasho, D.J.; Noujeim, M.; Huynh-Ba, G. Evaluation of Healing at Molar Extraction Sites with and without Ridge Preservation: A Randomized Controlled Clinical Trial. J. Periodontol. 2017, 88, 241–249. [Google Scholar] [CrossRef]
- Chrcanovic, B.-R.; Kisch, J.; Albrektsson, T.; Wennerberg, A. Factors Influencing Early Dental Implant Failures. J. Dent. Res. 2016, 95, 995–1002. [Google Scholar] [CrossRef]
- Chatzopoulos, G.-S.; Wolff, L.-F. Retrospective analysis of 50,333 implants on implant failure and associated patient-related factors. J. Stomatol. Oral Maxillofac. Surg. 2023, 124, 101555. [Google Scholar] [CrossRef] [PubMed]
- Griggs, J.-A. Dental Implants. Dent. Clin. N. Am. 2017, 61, 857–871. [Google Scholar] [CrossRef] [PubMed]
- Heimes, D.; Becker, P.; Pabst, A. How does dental implant macrogeometry affect primary implant stability? A narrative review. Int. J. Implant. Dent. 2023, 9, 20. [Google Scholar] [CrossRef] [PubMed]
- Torroella-Saura, G.; Mareque-Bueno, J.; Cabratosa-Termes, J.; Hernández-Alfaro, F.; Ferrés-Padró, E.; Calvo-Guirado, J.-L. Effect of implant design in immediate loading. A randomized, controlled, split-mouth, prospective clinical trial. Clin. Oral Implant. Res. 2015, 26, 240–244. [Google Scholar] [CrossRef] [PubMed]
- Barone, A.; Alfonsi, F.; Derchi, G.; Tonelli, P.; Toti, P.; Marchionni, S.; Covani, U. The Effect of Insertion Torque on the Clinical Outcome of Single Implants: A Randomized Clinical Trial. Clin. Implant. Dent. Relat. Res. 2016, 18, 588–600. [Google Scholar] [CrossRef]
- Marconcini, S.; Giammarinaro, E.; Toti, P.; Alfonsi, F.; Covani, U.; Barone, A. Longitudinal analysis on the effect of insertion torque on delayed single implants: A 3-year randomized clinical study. Clin. Implant. Dent. Relat. Res. 2018, 20, 322–332. [Google Scholar] [CrossRef]
- Makary, C.; Rebaudi, A.; Mokbel, N.; Naaman, N. Peak insertion torque correlated to histologically and clinically evaluated bone density. Implant. Dent. 2011, 20, 182–191. [Google Scholar] [CrossRef]
- Aksoy, U.; Eratalay, K.; Tözüm, T.-F. The possible association among bone density values, resonance frequency measurements, tactile sense, and histomorphometric evaluations of dental implant osteotomy sites: A preliminary study. Implant. Dent. 2009, 18, 316–325. [Google Scholar] [CrossRef]
- Triches, D.-F.; Alonso, F.-R.; Mezzomo, L.-A. Relation between insertion torque and tactile, visual, and rescaled gray value measures of bone quality: A cross-sectional clinical study with short implants. Int. J. Implant. Dent. 2019, 5, 9. [Google Scholar] [CrossRef]
- Waechter, J.; Madruga, M.-M.; Carmo Filho, L.-C.-D.; Leite, F.-R.-M.; Schinestsck, A.-R.; Faot, F. Comparison between tapered and cylindrical implants in the posterior regions of the mandible: A prospective, randomized, split-mouth clinical trial focusing on implant stability changes during early healing. Clin. Implant. Dent. Relat. Res. 2017, 19, 733–741. [Google Scholar] [CrossRef]
- Cochran, D.; Stavropoulos, A.; Obrecht, M.; Pippenger, B.; Dard, M. A Comparison of Tapered and Nontapered Implants in the Minipig. Int. J. Oral Maxillofac. Implant. 2016, 31, 1341–1347. [Google Scholar] [CrossRef]
- Sakoh, J.; Wahlmann, U.; Stender, E.; Nat, R.; Al-Nawas, B.; Wagner, W. Primary stability of a conical implant and a hybrid, cylindric screw-type implant in vitro. Int. J. Oral Maxillofac. Implant. 2006, 21, 560–566. [Google Scholar]
- O’Sullivan, D.; Sennerby, L.; Meredith, N. Influence of implant taper on the primary and secondary stability of osseointegrated titanium implants. Clin. Oral Implant. Res. 2004, 15, 474–480. [Google Scholar] [CrossRef] [PubMed]
- Toyoshima, T.; Wagner, W.; Klein, M.-O.; Stender, E.; Wieland, M.; Al-Nawas, B. Primary stability of a hybrid self-tapping implant compared to a cylindrical non-self-tapping implant with respect to drilling protocols in an ex vivo model. Clin. Implant. Dent. Relat. Res. 2011, 13, 71–78. [Google Scholar] [CrossRef] [PubMed]
- Stacchi, C.; Troiano, G.; Montaruli, G.; Mozzati, M.; Lamazza, L.; Antonelli, A.; Giudice, A.; Lombardi, T. Changes in implant sability using different site preparation techniques: Osseodensification drills versus piezoelectric surgery. A multi-center prospective randomized controlled clinical trial. Clin. Implant. Dent. Relat. Res. 2023, 25, 133–140. [Google Scholar] [CrossRef]
- Althobaiti, A.K.; Ashour, A.W.; Halteet, F.A.; Alghamdi, S.I.; AboShetaih, M.M.; Al-Hayazi, A.M.; Saaduddin, A.M. A Comparative Assessment of Primary Implant Stability Using Osseodensification vs. Conventional Drilling Methods: A Systematic Review. Cureus 2023, 15, e46841. [Google Scholar] [CrossRef]
- Bhargava, N.; Perrotti, V.; Caponio, V.C.A.; Matsubara, V.H.; Patalwala, D.; Quaranta, A. Comparison of heat production and bone architecture changes in the implant site preparation with compressive osteotomes, osseodensification technique, piezoelectric devices, and standard drills: An ex vivo study on porcine ribs. Odontology 2023, 111, 142–153. [Google Scholar] [CrossRef]
- Turkyilmaz, I.; Tumer, C.; Ozbek, E.-N.; Tözüm, T.-F. Relations between the bone density values from computerized tomography, and implant stability parameters: A clinical study of 230 regular platform implants. J. Clin. Periodontol. 2007, 34, 716–722. [Google Scholar] [CrossRef] [PubMed]
- Farronato, D.; Manfredini, M.; Stocchero, M.; Caccia, M.; Azzi, L.; Farronato, M. Influence of Bone Quality, Drilling Protocol, Implant Diameter/Length on Primary Stability: An In Vitro Comparative Study on Insertion Torque and Resonance Frequency Analysis. J. Oral Implantol. 2020, 46, 182–189. [Google Scholar] [CrossRef]
- Da Rocha-Ferreira, J.-J.; Machado, L.-F.-M. Insertion Torque Value and Implant Stability Quotient: Separate Evaluation and Correlation for Different Clinical Parameters. Int. J. Oral Maxillofac. Implant. 2022, 37, 812–822. [Google Scholar] [CrossRef] [PubMed]
- Raghavendra, S.; Wood, M.-C.; Taylor, T.-D. Early wound healing around endosseous implants: A review of the literature. Int. J. Oral Maxillofac. Implant. 2005, 20, 425–431. [Google Scholar]
- Gursoytrak, B.; Ataoglu, H. Use of resonance frequency analysis to evaluate the effects of surface properties on the stability of different implants. Clin. Oral Implant. Res. 2020, 31, 239–245. [Google Scholar] [CrossRef]
- Neugebauer, J.; Weinländer, M.; Lekovic, V.; von Berg, K.-H.; Zoeller, J.-E. Mechanical stability of immediately loaded implants with various surfaces and designs: A pilot study in dogs. Int. J. Oral Maxillofac. Implant. 2009, 24, 1083–1092. [Google Scholar]


| Patient-Related Variables (n = 53) | Groups | n (%) | |||
|---|---|---|---|---|---|
| Gender | Women | 22 (41.1%) | |||
| Men | 31 (58.5%) | ||||
| Age (years) | ≤55 years | 27 (50.9%) | |||
| >55 years | 26 (49.1%) | ||||
| Average age in years (mean ± SD) | 56.6 ±10.1 | ||||
| Dental arch | Mandible | 43 (42.2%) | |||
| Maxilla | 59 (57.8%) | ||||
| Implant location in the arch | Incisors–canines | 36 (35.3%) | |||
| Bicuspids–molars | 66 (64.7%) | ||||
| Implant-related variables (n = 102) | |||||
| Implant macro-design | Conical | Cylindrical | |||
| Variables | n | % | n | % | |
| Macrogeometry design | 65 | 63.7% | 37 | 36.3% | |
| Location in the arch | Incisors–canines | 21 | 20.59% | 15 | 14.70% |
| Bicuspids–molars | 44 | 43.14% | 22 | 21.57% | |
| Implant diameter | Standard (<4.5 mm) | 55 | 53.92% | 36 | 35.29% |
| Wide (≥4.5 mm) | 10 | 9.80% | 1 | 0.98% | |
| Implant length | Standard (≤10 mm) | 30 | 29.41% | 18 | 17.65% |
| Long (>10 mm) | 35 | 34.31% | 19 | 18.63% | |
| Groups (n) Estimation of Initial Stability | Insertion Torque (Ncm) | ISQ Day of Surgery (ISQ Units) | ISQ 3 Months (ISQ Units) | Tactile Evaluation of Bone Quality (D1–D4 Range) | Bone Density (HU) | ||||||
|---|---|---|---|---|---|---|---|---|---|---|---|
| Rho- r- | p-Value | Rho- r- | p-Value | Rho- r- | p-Value | Rho- r- | p-Value | Rho- r- | p-Value | ||
| Insertion torque (Ncm) | Cylindrical (n = 37) | 1 | 0.214 | 0.203 | 0.033 | 0.845 | −0.366 | 0.026 | −0.036 | 0.832 | |
| Conical (n = 65) | 1 | 0.554 | <0.001 * | 0.237 | 0.057 | −0.403 | <0.001 * | 0.358 | 0.003 * | ||
| Total (n = 102) | 1 | 0.497 | <0.001 * | 0.258 | 0.009 * | −0.425 | <0.001 * | 0.294 | 0.003 * | ||
| ISQ day of surgery (ISQ units) | Cylindrical (n = 37) | 0.214 | 0.203 | 1 | 0.429 | 0.008 * | 0.132 | 0.438 | −0.245 | 0.144 | |
| Conical (n = 65) | 0.554 | <0.001 * | 1 | 0.310 | 0.012 | −0.236 | 0.059 | −0.030 | 0.812 | ||
| Total (n = 102) | 0.497 | <0.001 * | 1 | 0.417 | <0.001 * | 0.245 | 0.013 * | −0.038 | 0.705 | ||
| ISQ 3 months (ISQ units) | Cylindrical (n = 37) | 0.033 | 0.845 | 0.429 | 0.008 * | 1 | 0.076 | 0.656 | −0.332 | 0.045 * | |
| Conical (n = 65) | 0.237 | 0.057 | 0.310 | 0.012 * | 1 | −0.041 | 0.745 | −0.016 | 0.902 | ||
| Total (n = 102) | 0.258 | 0.009 * | 0.417 | <0.001 * | 1 | −0.035 | 0.728 | −0.068 | 0.496 | ||
| Tactile evaluation of bone quality (D1–D4 range) | Cylindrical (n = 37) | −0.366 | 0.026 * | −0.132 | 0.438 | 0.076 | 0.656 | 1 | 0.062 | 0.716 | |
| Conical (n = 65) | −0.403 | <0.001 * | −0.236 | 0.059 | 0.041 | 0.745 | 1 | −0.373 | 0.002 * | ||
| Total (n = 102) | −0.425 | <0.001 * | −0.245 | 0.013 * | −0.035 | 0.728 | 1 | 0.273 | 0.005 * | ||
| Bone density (HU) | Cylindrical (n = 37) | −0.036 | 0.832 | −0.245 | 0.144 | −0.332 | 0.045 * | 0.062 | 0.716 | 1 | |
| Conical (n = 65) | 0.358 | 0.003 * | −0.030 | 0.812 | −0.016 | 0.902 | −0.373 | 0.002 * | 1 | ||
| Groups (n) Estimations of Initial Stability | Mean ± SD Median (IR) n (%) | Range | U t CHI2 | p-Value | |
|---|---|---|---|---|---|
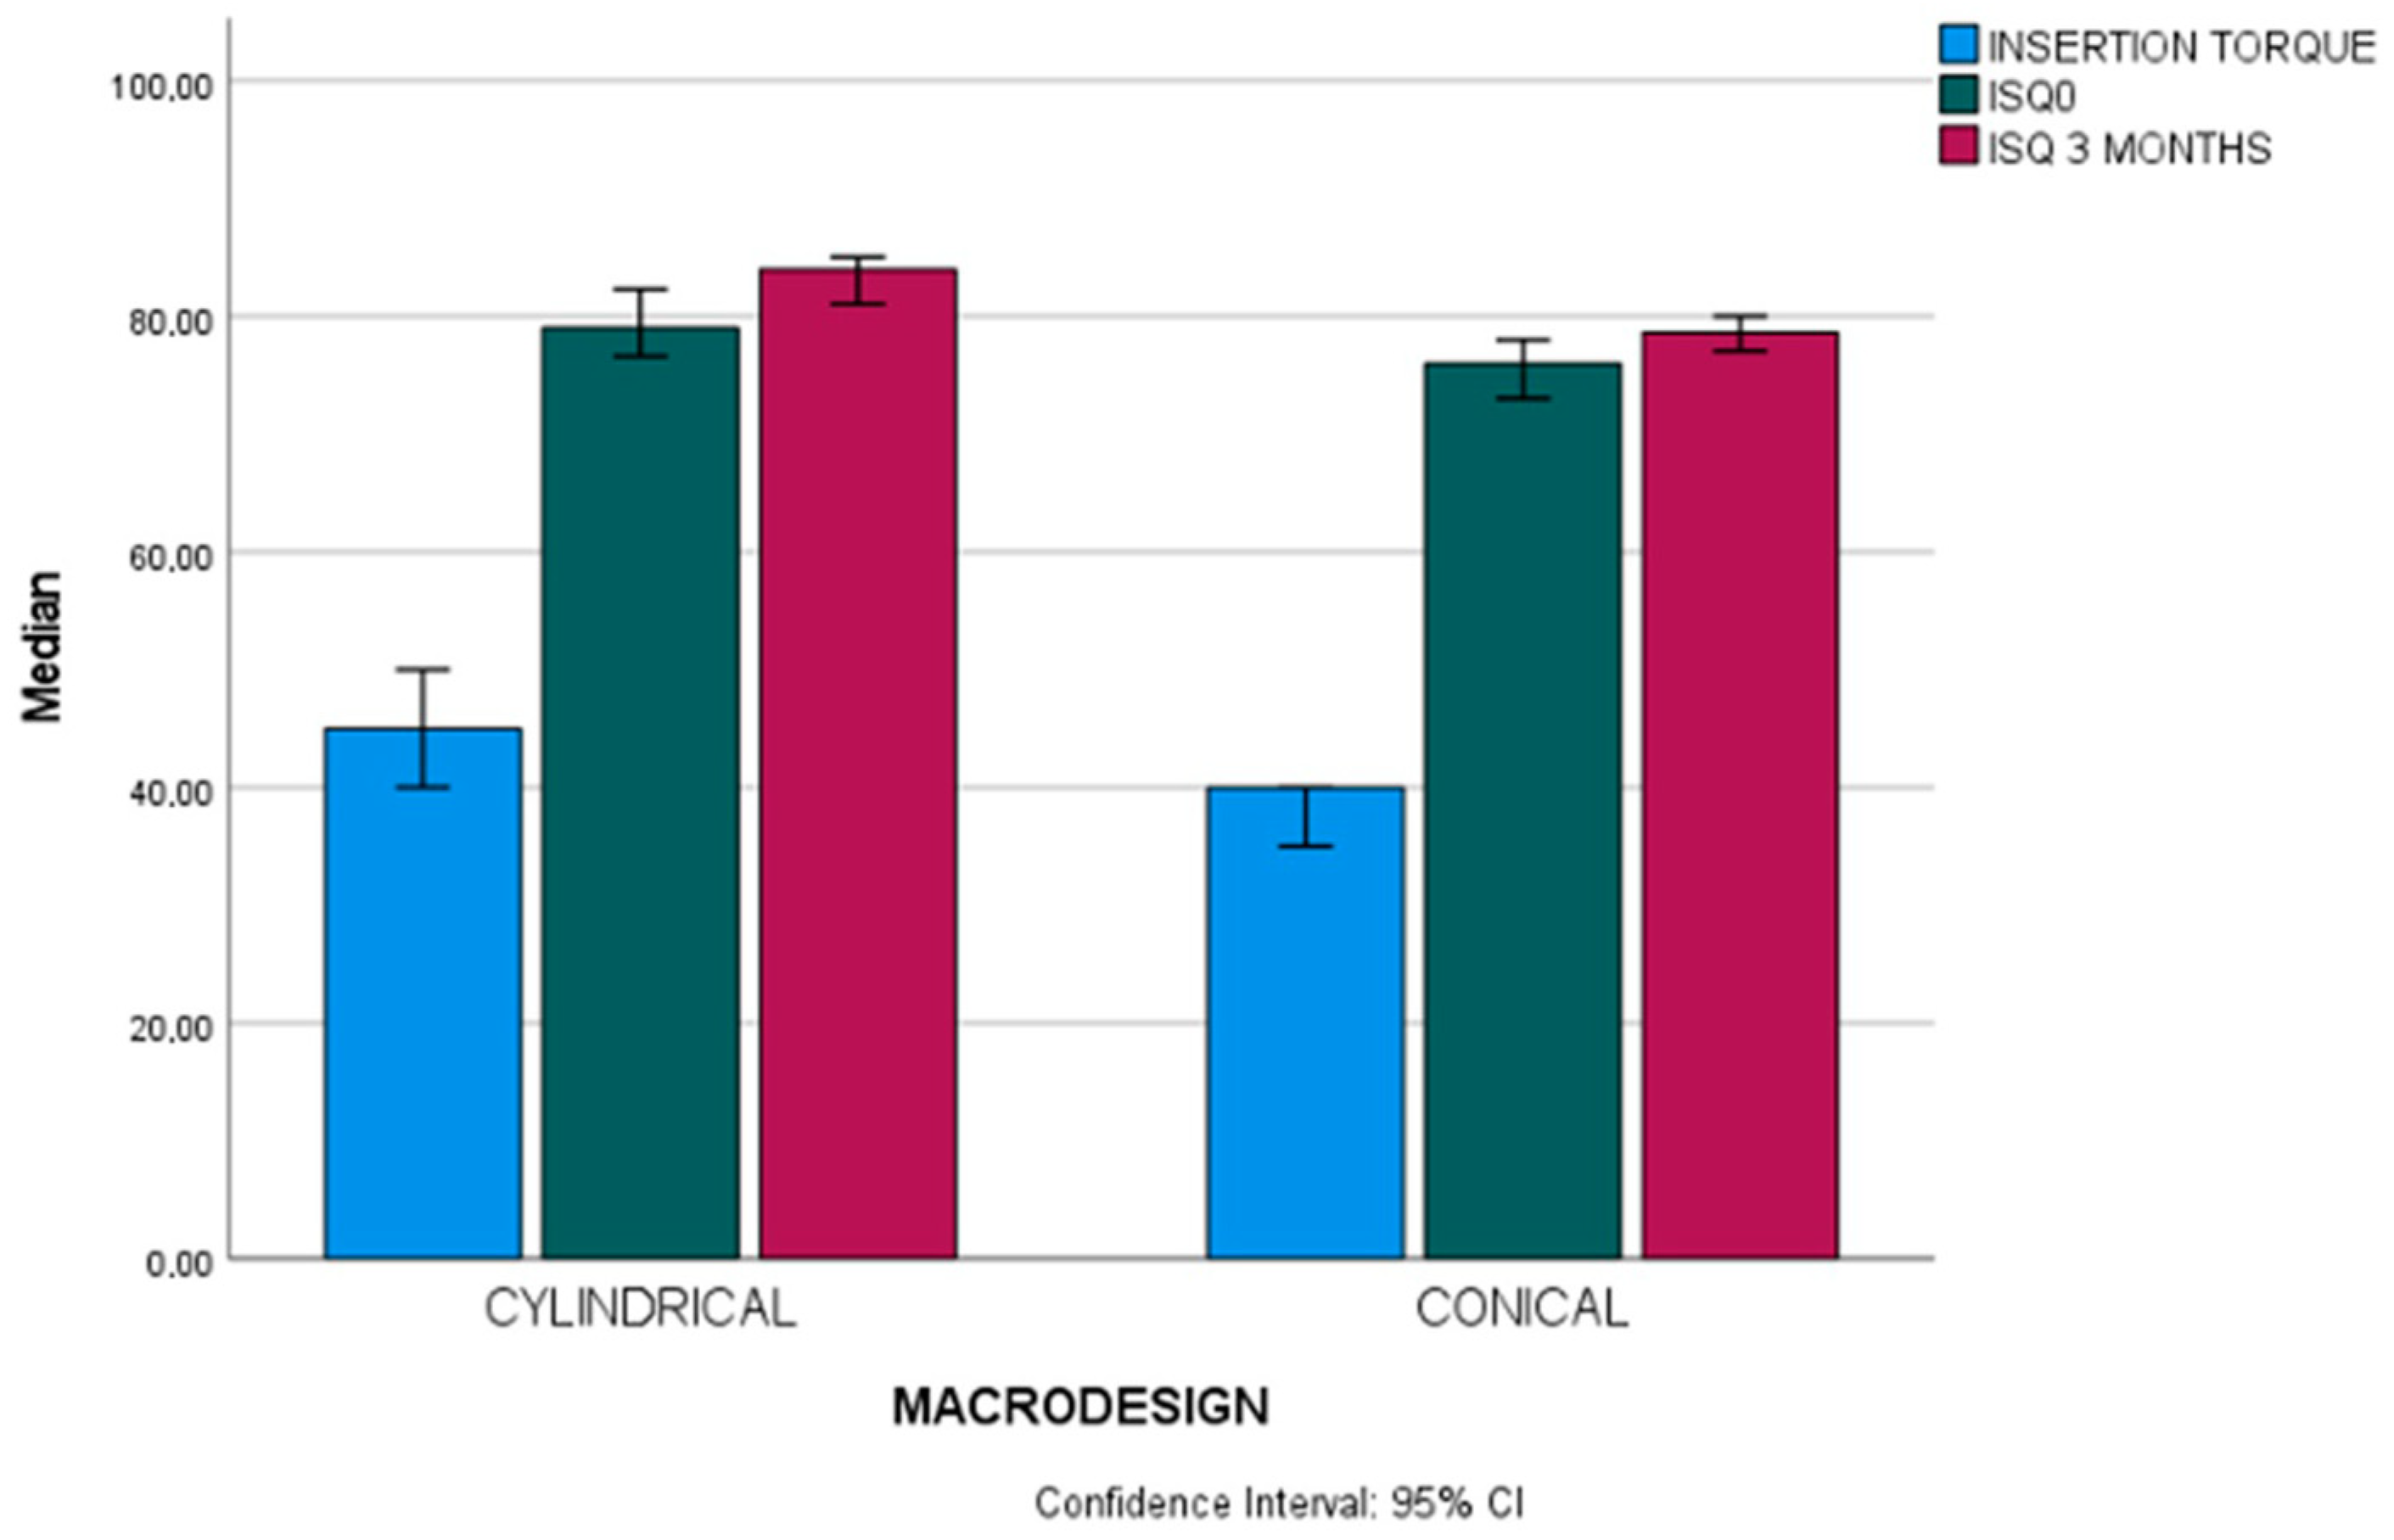
| Insertion torque (Ncm) | Cylindrical (n = 37) | 45 (10) | 20–55 | U 748 | 0.001 * |
| Conical (n = 65) | 40 (15) | 15–70 | |||
| Total (n = 102) | 40 (15) | 15–70 | |||
| ISQ day of surgery (ISQ units) | Cylindrical (n = 37) | 79 (8.95) | 61,60–88 | U 766.50 | 0.002 * |
| Conical (n = 65) | 76 (10.35) | 44.60–83 | |||
| Total (n = 102) | 77.5 (8.40) | 44.60–83 | |||
| ISQ 3 months (ISQ units) | Cylindrical (n = 37) | 84 (6.65) | 53.30–89 | U 689.50 | <0.001 * |
| Conical (n = 65) | 78.60 (6.65) | 55.30–86.60 | |||
| Total (n = 102) | 80 (7.95) | 53.30–89 | |||
| Tactile evaluation of bone quality (D1–D4 Range) | Cylindrical (n = 37) | 36 (35.29%) | CHI2 22.2 | 0.001 * | |
| Conical (n = 65) | 66 (64.71%) | ||||
| Total (n = 102) | 102 (100%) | ||||
| Bone density (HU) | Cylindrical (n = 37) | 696.62 ± 158.95 | 375–950 | T 1.481 | 0.142 |
| Conical (n = 65) | 642.50 ± 205.94 | 225–1100 | |||
| Total (n = 102) | 662.13 ± 191.21 | 225–1100 |
| Groups (n) | Cylindrical Mean ± SD Median (IR) n (%) | Conical Mean ± SD Median (IR) n (%) | U t CHI2 | p-Value | |
|---|---|---|---|---|---|
| Insertion torque (Ncm) | Incisors–canines (n = 36) | 45(5) | 40 (15) | U 99.50 | 0.058 |
| Bicuspids–molars (n = 66) | 45 (11.5) | 35 (15) | U 303 | 0.013 * | |
| U (p-value) | 130 (0.267) | 340.5 (0.085) | |||
| ISQ day of surgery (ISQ units) | Incisors–canines (n = 36) | 78 (23.40) | 76 (9.95) | U 136.50 | 0.500 |
| Bicuspids–molars (n = 66) | 81.15 (8.50) | 75.65 (11.90) | U 240.50 | <0.001 * | |
| U (p-value) | 108 (0.08) | 452.50 (0.894) | |||
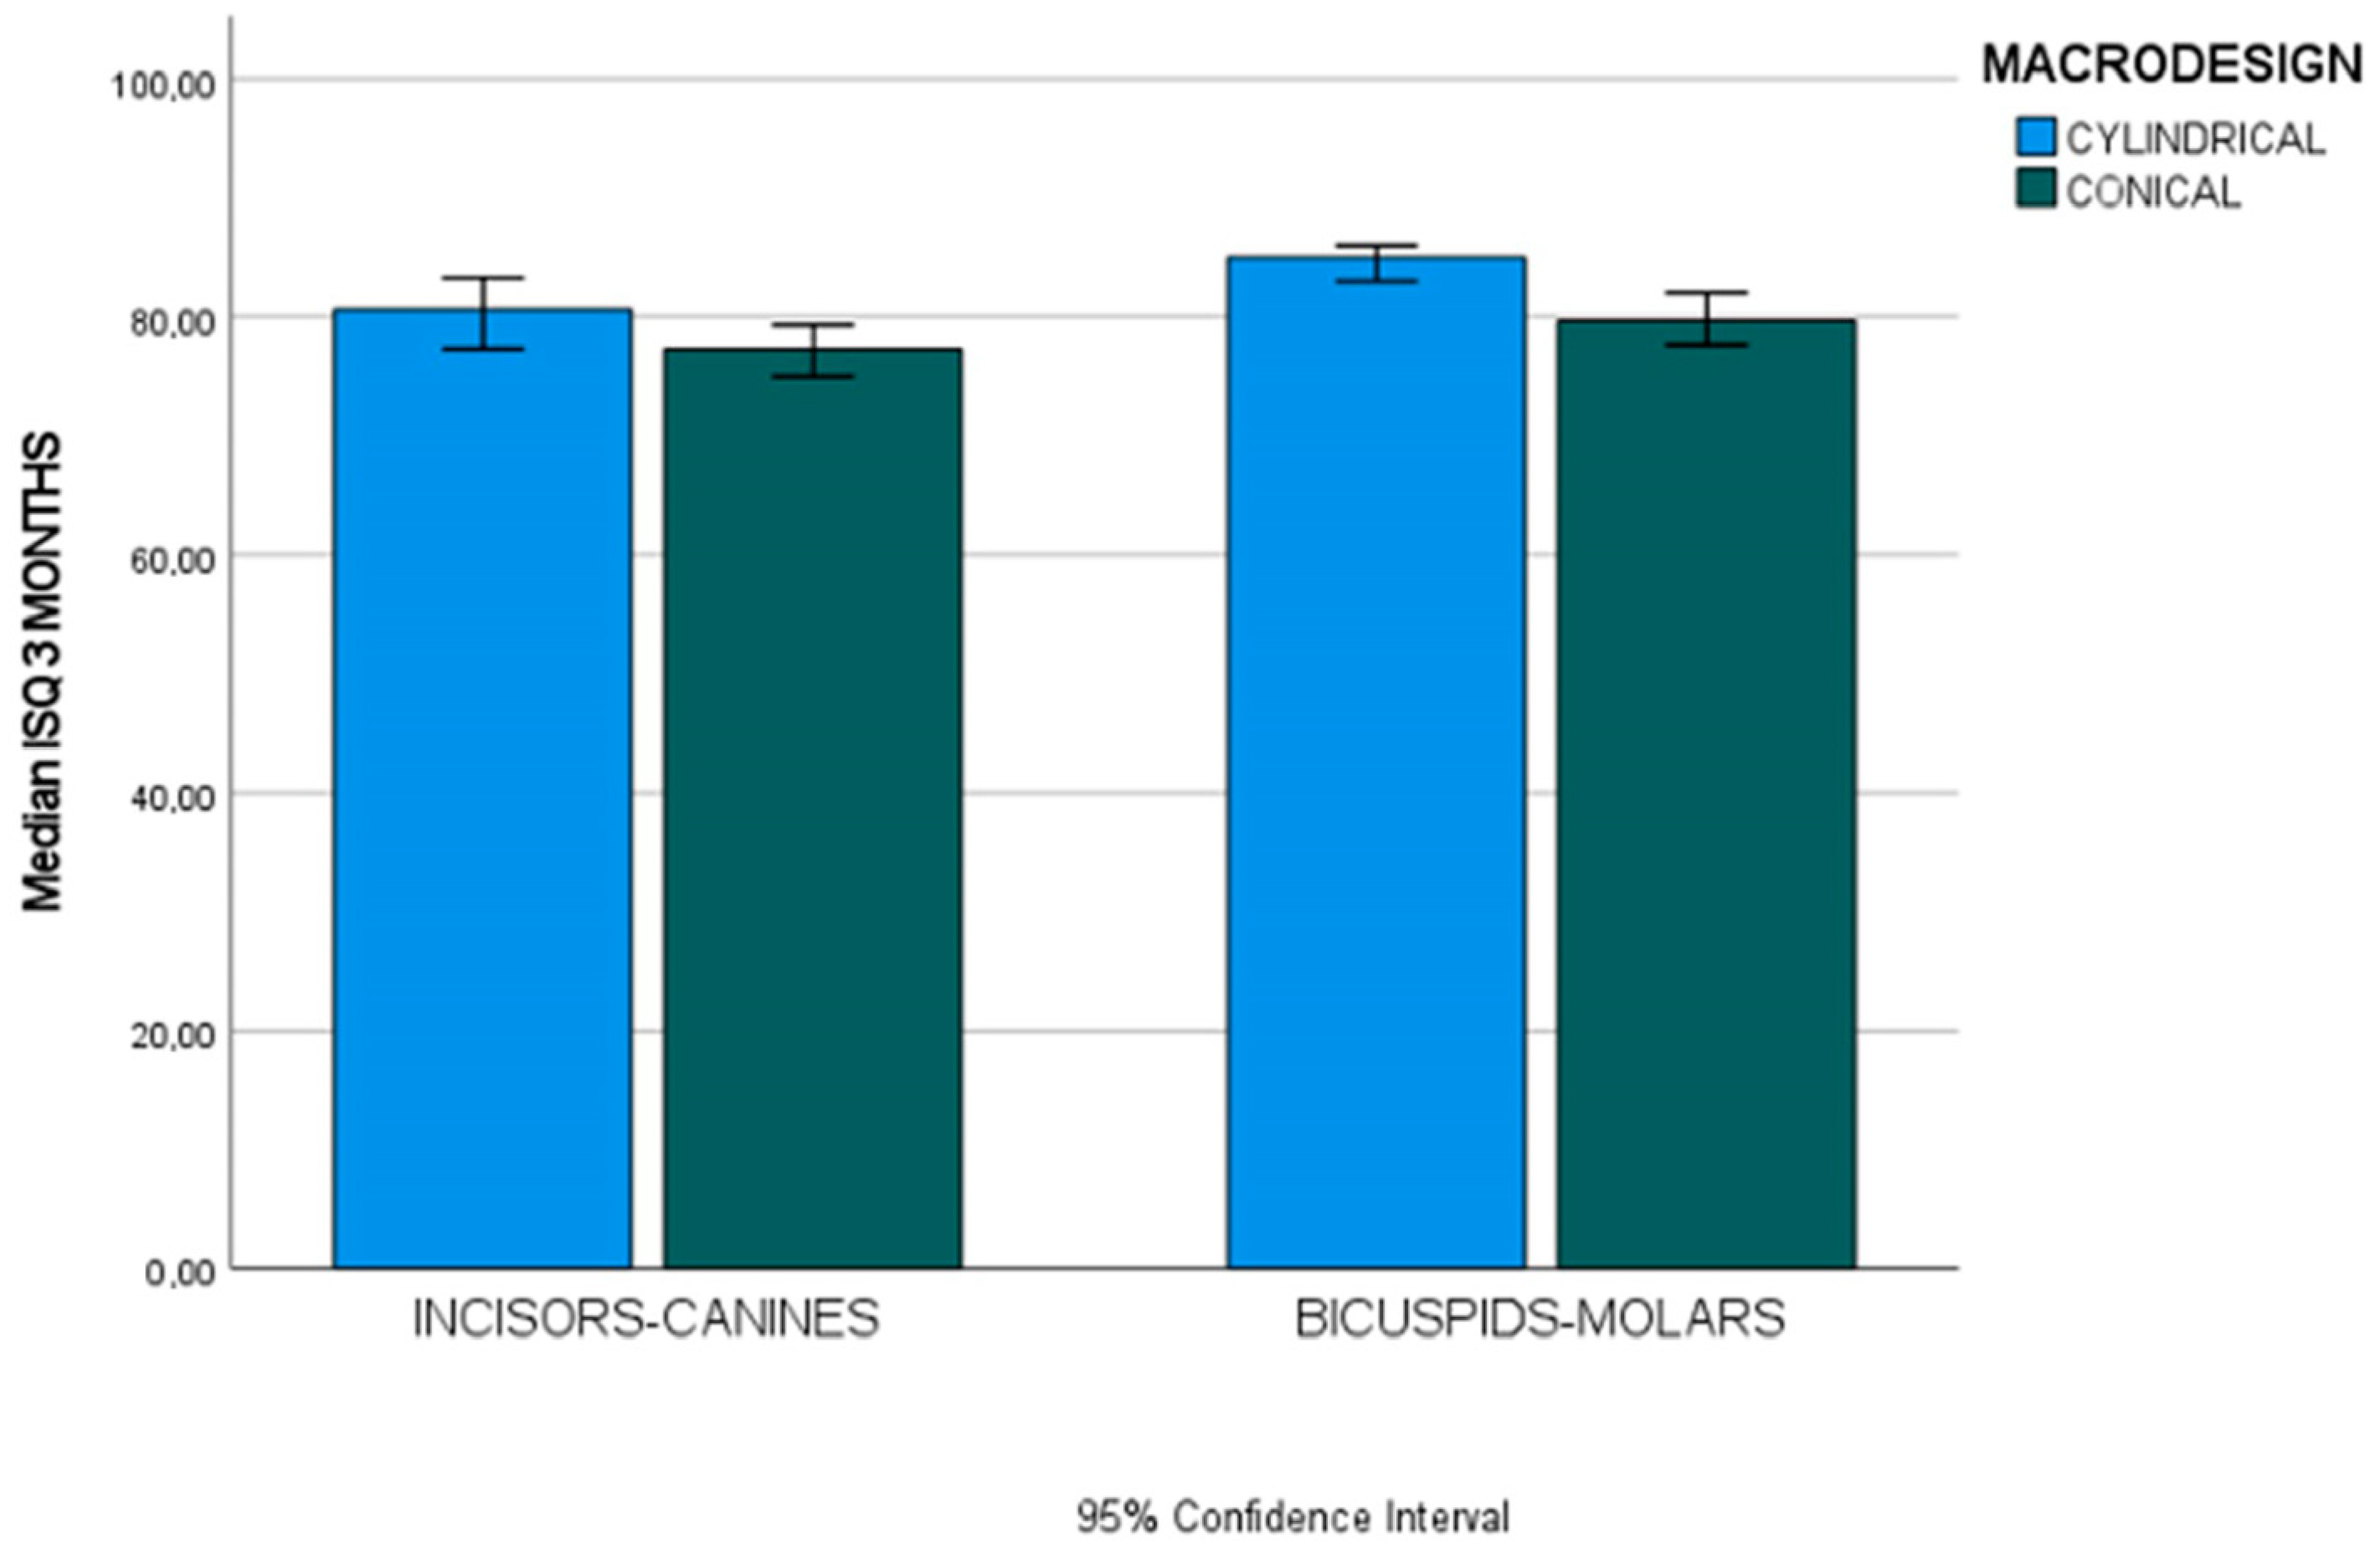
| ISQ 3 months (ISQ units) | Incisors–canines (n = 36) | 80.60 (6) | 77.30 (4.85) | U 105 | 0.092 |
| Bicuspids–molars (n = 66) | 85 (3) | 79.65 (6.92) | U 215 | <0.001 * | |
| U (p-value) | 68.50 (0.002 *) | 330.50 (0.065) | |||
| Tactile evaluation of bone quality (D1–D4 Range) | Incisors–anines (n = 36) | 15 (14.70%) | 21 (20.59%) | CHI2 2.176 | 0.537 |
| Bicuspids–molars (n = 66) | 22 (21.57%) | 44 (20.59%) | CHI2 7.986 | 0.092 | |
| CHI2 (p-value) | 2.256 (0.689) | 4.340 (0.362) | |||
| Bone density (HU) | Incisors–canine (n = 36) | 782.50 ± 124.89 | 775.59 ± 170.59 | t 0.133 | 0.895 |
| Bicuspids–molars (n = 66) | 638.06 ± 155.09 | 578.98 ± 191.85 | t 1.253 | 0.215 | |
| t (p-value) | 3.00 (0.005 *) | 3.99 (<0.001 *) |
| Groups (n) | Cylindrical Mean ± SD Median (IR) n (%) | Conical Mean ± SD Median (IR) n (%) | U t CHI2 | p-Value | |
|---|---|---|---|---|---|
| Insertion torque (Ncm) | Maxilla (n = 59) | 45 (11.25) | 35 (12.50) | U 215.5 | 0.010 * |
| Mandible (n = 43) | 50 (10) | 42.50 (20) | U 157 | 0.078 | |
| U (p-value) | 144 (0.401) | 427.5 (0.375) | |||
| ISQ day of surgery (ISQ units) | Maxilla (n = 59) | 80.80 (7.28) | 73.30 (11.15) | U 131 | <0.001 * |
| Mandible (n = 43) | 77 (7) | 78.50 (17.40) | U 215 | 0.759 | |
| U (p-value) | 101.50 (0.34) | 286 (0.005 *) | |||
| ISQ 3 months (ISQ units) | Maxilla (n = 59) | 85 (7.78) | 77.60 (5.65) | U 202.50 | 0.006 * |
| Mandible (n = 43) | 83 (6.60) | 79.50 (8.97) | U 153 | 0.066 | |
| U (p-value) | 161 (0.760) | 399 (0.206) | |||
| Tactile evaluation of bone quality (D1–D4 Range) | Maxilla (n = 59) | 18 (17.64%) | 41 (40.20%) | CHI2 4.450 | 0.349 |
| Mandible (n = 43) | 19 (18.63%) | 24 (23.53%) | CHI2 9.855 | 0.079 | |
| Chi2 (p-value) | 2.835 (0.586) | 3.057 (0.547) | |||
| Bone density (HU) | Maxilla (n = 59) | 709.03 ± 148.08 | 594.21 ± 185.95 | t 2.314 | 0.024 * |
| Mandible (n = 43) | 684.87 ± 171.82 | 725 ± 215.91 | t 2.869 | 0.512 | |
| t (p-value) | 0.457 (0.651) | −2.578 (0.012 *) |
| Groups (n) | Cylindrical Mean ± SD Median (IR) n (%) | Conical Mean ± SD Median (IR) n (%) | U t CHI2 | p-Value | |
|---|---|---|---|---|---|
| Insertion torque (Ncm) | Standard (<4.5 Ø); (n = 91) | 45 (10) | 40 (10) | U 665.50 | 0.008 * |
| Wide (≥4.5 Ø); (n = 11) | 35 | 27.5 (18.75) | |||
| U (p-value) | 126.5 (0.006 *) | ||||
| ISQ day of surgery (ISQ units) | Standard (<4.5 Ø); (n = 91) | 78.80 (8.92) | 76.3 (8.10) | U 667 | 0.009 * |
| Wide (≥4.5 Ø); (n = 11) | 82.30 | 68.95 (15.20) | |||
| U (p-value) | 264 (0.841) | ||||
| ISQ 3 months (ISQ units) | Standard (<4.5 Ø); (n = 91) | 84(5.90) | 79 (6) | U 537.50 | <0.001 * |
| Wide (≥4.5 Ø); (n = 11) | 77.00 | 76.80 (9.17) | |||
| U (p-value) | 264 (0.841) | ||||
| Tactile evaluation of bone quality (D1–D4 range) | Standard (<4.5 Ø); (n = 91) | 36 (35.29%) | 55 (53.92%) | CHI2 6.046 | 0.196 |
| Wide (≥4.5 Ø); (n = 11) | 1 (0.98%) | 10 (9.80%) | |||
| Chi2 (p-value) | 20.93 (<0.001 *) | ||||
| Bone density (HU) | Standard (<4.5 Ø); (n = 91) | 697.57 ± 161.10 | 677.27 ± 195.49 | t 0.518 | 0.606 |
| Wide (≥4.5 Ø); (n = 11) | 662.50 | 451.25 ± 155.73 | |||
| t (p-value) | 3.454 (<0.001 *) |
| Groups (n) | Cylindrical Mean ± SD Median (IR) n (%) | Conical Mean ± SD Median (IR) n (%) | U t CHI2 | p-Value | |
|---|---|---|---|---|---|
| Insertion torque (Ncm) | Standard (≤10 mm) (n = 48) | 47.50 (11.25) | 37.50 (20) | U 154.50 | 0.13 |
| Long (>10 mm) (n = 54) | 45 (10) | 40 (15) | U 218.50 | 0.036 * | |
| U (p-value) | 169 (0.950) | 441.50 (0.266) | |||
| ISQ day of surgery (ISQ units) | Standard (≤10 mm) (n = 48) | 78 (11.85) | 73.80 (38.40) | U 182 | 0.061 |
| Long (>10 mm) (n = 54) | 79 (9) | 77 (25) | U 194.50 | 0.012 * | |
| U (p-value) | 132 (0.235) | 412.50 (0.138) | |||
| ISQ 3 months (ISQ units) | Standard (≤10 mm) (n = 48) | 84.50 (5.10) | 78.80 (9) | U 151.50 | 0.012 * |
| Long (>10 mm) (n = 54) | 81.30 (7) | 78.60 (5.30) | U 201.50 | 0.018 * | |
| U (p-value) | 130.50 (0.216) | 500.50 (0.747) | |||
| Tactile evaluation of bone quality (D1–D4 Range) | Standard (≤10 mm) (n = 48) | 18 (17.65%) | 30 (29.41%) | CHI2 9.719 | 0.021 * |
| Long (>10 mm) (n = 54) | 19 (18.63%) | 35 (34.31%) | CHI2 2.746 | 0.601 | |
| CHI2 (p-value) | 2.835 (0.586) | 8.954 (0.062) | |||
| Bone density (HU) | Standard (≤10 mm) (n = 48) | 663.19 ± 166.58 | 645.83 ± 217.66 | t 0.291 | 0.773 |
| Long (>0 mm) (n = 54) | 728.29 ± 148.83 | 639.64 ± 198.51 | t 1.852 | 0.070 | |
| t (p-value) | −1.255 (0.218) | 0.120 (0.905) |
| Dependent Variables | Independent Variables | β | Error | p-Value | Lower CI 95% | Upper CI 95% |
|---|---|---|---|---|---|---|
| Primary Stability | ||||||
| ISQ day of the surgery A | Macrodesign | −0.200 | 1.410 | 0.028 | −5.948 | −0.350 |
| Length | 0.175 | 1.315 | 0.046 | 0.049 | 5.269 | |
| Insertion torque | 0.387 | 0.064 | <0.001 | 0.147 | 0.400 | |
| Secondary stability | ||||||
| ISQ 3 months B | Location | 0.274 | 1.338 | 0.003 | 1.349 | 6.660 |
| Macrodesign | −0.277 | 1.333 | 0.003 | −6.667 | −1.375 | |
| Age | 0.190 | 1.284 | 0.041 | 0.112 | 5.208 | |
Disclaimer/Publisher’s Note: The statements, opinions and data contained in all publications are solely those of the individual author(s) and contributor(s) and not of MDPI and/or the editor(s). MDPI and/or the editor(s) disclaim responsibility for any injury to people or property resulting from any ideas, methods, instructions or products referred to in the content. |
© 2024 by the authors. Licensee MDPI, Basel, Switzerland. This article is an open access article distributed under the terms and conditions of the Creative Commons Attribution (CC BY) license (https://creativecommons.org/licenses/by/4.0/).
Share and Cite
Quispe-López, N.; Martín-Martín, S.; Gómez-Polo, C.; Figueras-Alvarez, O.; Sánchez-Jorge, M.I.; Montero, J. Primary and Secondary Stability Assessments of Dental Implants According to Their Macro-Design, Length, Width, Location, and Bone Quality. Appl. Sci. 2024, 14, 4841. https://doi.org/10.3390/app14114841
Quispe-López N, Martín-Martín S, Gómez-Polo C, Figueras-Alvarez O, Sánchez-Jorge MI, Montero J. Primary and Secondary Stability Assessments of Dental Implants According to Their Macro-Design, Length, Width, Location, and Bone Quality. Applied Sciences. 2024; 14(11):4841. https://doi.org/10.3390/app14114841
Chicago/Turabian StyleQuispe-López, Norberto, Soraya Martín-Martín, Cristina Gómez-Polo, Oscar Figueras-Alvarez, María Isabel Sánchez-Jorge, and Javier Montero. 2024. "Primary and Secondary Stability Assessments of Dental Implants According to Their Macro-Design, Length, Width, Location, and Bone Quality" Applied Sciences 14, no. 11: 4841. https://doi.org/10.3390/app14114841
APA StyleQuispe-López, N., Martín-Martín, S., Gómez-Polo, C., Figueras-Alvarez, O., Sánchez-Jorge, M. I., & Montero, J. (2024). Primary and Secondary Stability Assessments of Dental Implants According to Their Macro-Design, Length, Width, Location, and Bone Quality. Applied Sciences, 14(11), 4841. https://doi.org/10.3390/app14114841