Abstract
This research article concentrates on process conditions in addition to improving color selections in polymer compounders and developing more accurate simulation models. The feed rate (FR), temperature (T) and screw speed (SS) are three processing variables that the research investigates using general trends (GTs) and Box–Behnken design (BBD) response surface methodology. The identical set of processing settings was tweaked at three separate phases independently of one another. This study uses the experimental design to investigate process parameters’ optimization while holding all other parameters constant. This design was given the name GT. To develop this design and its statistical optimization, this study used the software of the design expert method. A regression model was run in this design, which displayed collective as well as individual effects of the parameters on color images. The values of tri-stimulus color with the best optimization had the smallest proper color variance (dE*). To obtain information on pigment characteristics, an SEM image analysis was conducted, which aids in improving future designs and overcoming manufacturing issues that affect color fluctuation properties and waste reduction for various chemical grades, both of which enhance environmentally friendly processes.
1. Introduction
The production of plastics is rapidly expanding internationally due to their ease of use and their low cost of manufacturing. Consequently, there is a great demand for plastic production and industries that intensively use color. The investigation of color is economically vital.
Due to the fact that a color is created by mixing a number of different pigments, when compounding polymers and the compositions of these pigments, it might be difficult to obtain the desired shade of a color on the very first trial. Very little attention by researchers has been devoted to investigating the impact of processing factors on the color characteristics of a polymer during polymer compounding on extrusion [1,2,3]. The feed rate (FR), temperature (T), screw speed (S), duration of residence and configuration are some of these characteristics.
As a result of processing, various chemical materials and pigments may become involved in chemical reactions. Indeed, many significant challenges are faced in obtaining a homogeneous blend or dispersion of pigment. As a necessary consequence, during experiments, researchers need to extend the mixing time while making sure to reduce the viscosity of resin [4,5].
In order to determine an accurate color standard, the process of color matching calls for the utilization of spectrophotometric data. Spectrophotometers are among the most effective instruments for quality control due to their efficiency in describing and measuring changes in color [6,7]. In 1913, the CIE organization came into existence and it established color measurement standard values as both its goal and one of its responsibilities. In order to measure color, the CIE organization employed the CIE LAB technique, in which the values of L*, a* and b* are employed; L* recognizes dark (L* = 0) and bright (L* = 100) differences, a* represents red (+a*) and green (−a*) differences and b* represents yellow (+b*) and blue (−b*) differences [6,7]. dE* is the deviation of tri-stimulus color, which can be calculated using Equation (1), as follows:
Equation (1) shows the differences in the color direction without color difference dimensions. The manufactured colored materials are subjected to stringent international quality standards to guarantee that these materials are of the highest quality. Instead of absolute color values, dL*, da* and db* color differences within target values are employed; in the CIE LAB space, the total change in color is a measure of color variation, dE* [8,9]. Response surface methodology (RSM) approaches can be used in statistical design of experiments (DOE) to investigate the impact of modifying certain processing parameters on color. As a consequence of this, the initial step is to properly construct the experiments so that the parameters of the model may be examined effectively once the tests have been carried out. Creating a second-order color-responding polynomial is the task at hand for the second part of the project [10,11]. The predicted response is equal to y as shown in Equation (2):
where the following definitions hold:
- is the predicted response;
- β0 is constant;
- k is the number of factors;
- xi is an independent variable;
- βi is the ith coefficient in the linear equation;
- βii is the ith coefficient in the quadratic equation;
- βij is the ith coefficient of interaction;
- ε is the error.
Experimental data was used to forecast the model’s coefficients using regression analysis [12,13]. To collect enough data to evaluate a model’s fitness, the study uses BBD due to its rapid and straightforward approach. BBD experiments require less time and cost because of the reduced number of design points [14]. The BBD was used in this present study to improve the process conditions to ensure as little variance in the characteristics of the color as feasible (1.0 > dE). In order to optimize the process variables while simultaneously decreasing recycles, which is beneficial to the environment, it is necessary to reduce the agglomerations. The effects of extrusion parameters were evaluated and compared using Design-Expert software version 8.0. To find, within the feasible region, the most appropriate area, a “Numerical Optimizer” was employed. A number of potential points in the variables’ ranges were computed using the response optimizer of the experimental design. To achieve zero deviation from the target color in data evaluation, the experiment uses numerical optimization. Moreover, process parameters and tri-stimulus color values were optimized using the GT design to avoid any increase in the recycling materials and to ensure the color deviation dE* was at its minimum proper value.
2. Experimental and Statistical Methods
Various methodologies were employed to advance and refine new predictive models, with a particular emphasis on statistical analysis methods. Within this study, statistical techniques were utilized to analyze available data from the factory lab in order to uncover the correlation between formulations and final color discrepancies. These methods are summarized as follows:
- Number mining, involving the selection of diverse formulations and processing parameters linked to color discrepancies based on historical data.
- RSM experiments, which are employed when a few significant factors are involved in optimization. Various types of RSM designs, such as full factorial design, central composite design (CCD), Box–Behnken design (BBD) and D-optimal design, were utilized. RSM serves as a practical tool for evaluating the impact of multiple variables and their interactions on either single or multiple response variables. Moreover, the study juxtaposed RSM with alternative optimization methods, including artificial neural networks (ANNs) [15]. Moreover, advanced statistical analysis was conducted using RSM and microstructural examination via scanning electron microscopy (SEM) to optimize the process [16]. The statistical analysis in this study is focused on scrutinizing the thermal gelation tendencies of two known reactants employing RSM; partially hydrolyzed polyacrylamide (PHPA) and polyethyleneimine (PEI). The significance of the model was validated against experimental data with a confidence level of 95% through analysis of variance (ANOVA) [17].
An experimental design approach was employed to optimize the rheological properties of the HPAM polymer. This involved examining the impacts of three key parameters: the size of polystyrene microspheres, their concentration and the test temperature, on the zero-shear viscosity of HPAM polymer solutions. The findings illustrated a strong alignment between the anticipated results derived from the RSM method and the actual experimental observations [18]. Multiple techniques of design were implemented, including the following:
- Box–Behnken Design (BBD)
Design of experiments (DOE) is extensively employed in diverse scientific fields owing to its capacity to reduce the number of necessary experiments. It was utilized to pinpoint the variables crucial for the effective establishment of a process window model.
The experimental design incorporated both the utilized level and the extruder FR, S and T. It considered the same three process parameters and represented each factor with three different levels coded as −1, 0 and +1, as depicted in Table 1.

Table 1.
In the actual coding unit, three levels and parameters’ experimental design.
Table 2 presents the selected experimental design levels for the three process parameters: temperature, feed rate and screw rpm. These parameters were varied across 12 different treatments, with an additional 5 center points introduced to assess the variables’ impact on color. The extra center points were included to estimate experimental error.
Table 2.
dL*, db* and da* values.
The RSM employed also a DOE based on the BBD with the same objective: examining the influence of varied processing conditions on the output color of a compounded plastic grade during extrusion. Compared to the full factorial design, this approach offers a design space comprising 17 runs and a wider range of input parameters. It is more precise, cost-effective and time-efficient than the 3-level full factorial design.
As previously mentioned, optimization through data mining and DOE aims to determine the optimal processing parameters and color properties of a compounded polycarbonate grade. The plastic color is affected by processing parameters and the type of compounder. This study investigated the impact of three processing parameters—temperature, speed and feed rate—on the final product’s color.
- b.
- General Trends (GTs)
Three parameters—temperature (T), speed (S) and feed rate (FR)—were individually varied at three different levels while keeping all other parameters constant, in a process termed GTs. Specifically, processing temperatures of 230 °C, 255 °C and 280 °C were selected, while S and FR were held constant at intermediate values (750 rpm and 25 kg/h, respectively). A similar approach was taken for both S and FR variations. Speeds of 700, 750 and 800 rpm were selected and FRs of 20, 25 and 30 kg/h were chosen.
This study proposes optimal values for process variables to ensure consistency in the output color of the plastic grade. In the GT design, each of the 15 processing parameter combinations was evaluated to optimize the best or optimum color output. Surprisingly, the optimal color was discovered right at the center point of the experimental setup (255 °C, 25 kg/h and 750 rpm).
3. Experimental Setup (Materials and Equipment)
This section describes the materials and the equipment used for experimentation and discusses the procedures adopted.
3.1. Materials
Due to a non-disclosure agreement signed with the factory, it is not possible to publish the commercial names of the materials used, but the chemical and physical properties can be disclosed. This research investigated two grades of PC resins, referred to as R1 and R2 henceforth, each having a different melt flow index (MFI) value. R1 had an MFI of 25 and R2 had an MFI of 6.5 g/10 min. The resins were manufactured by General Electric (GE) and traded under the name of Lexan. Color pigments were in the form of powders; four different colored pigments, namely black, white, red and yellow, were used. In addition, three additives were also used, labeled as F1, F2 and F3. One was a stabilizer, another a light stabilizer and the third offered weather-resistant properties (see Table 3).
Table 3.
The grading formula applied to the grades being studied.
3.2. Compounding on Twin-Screw Extruder
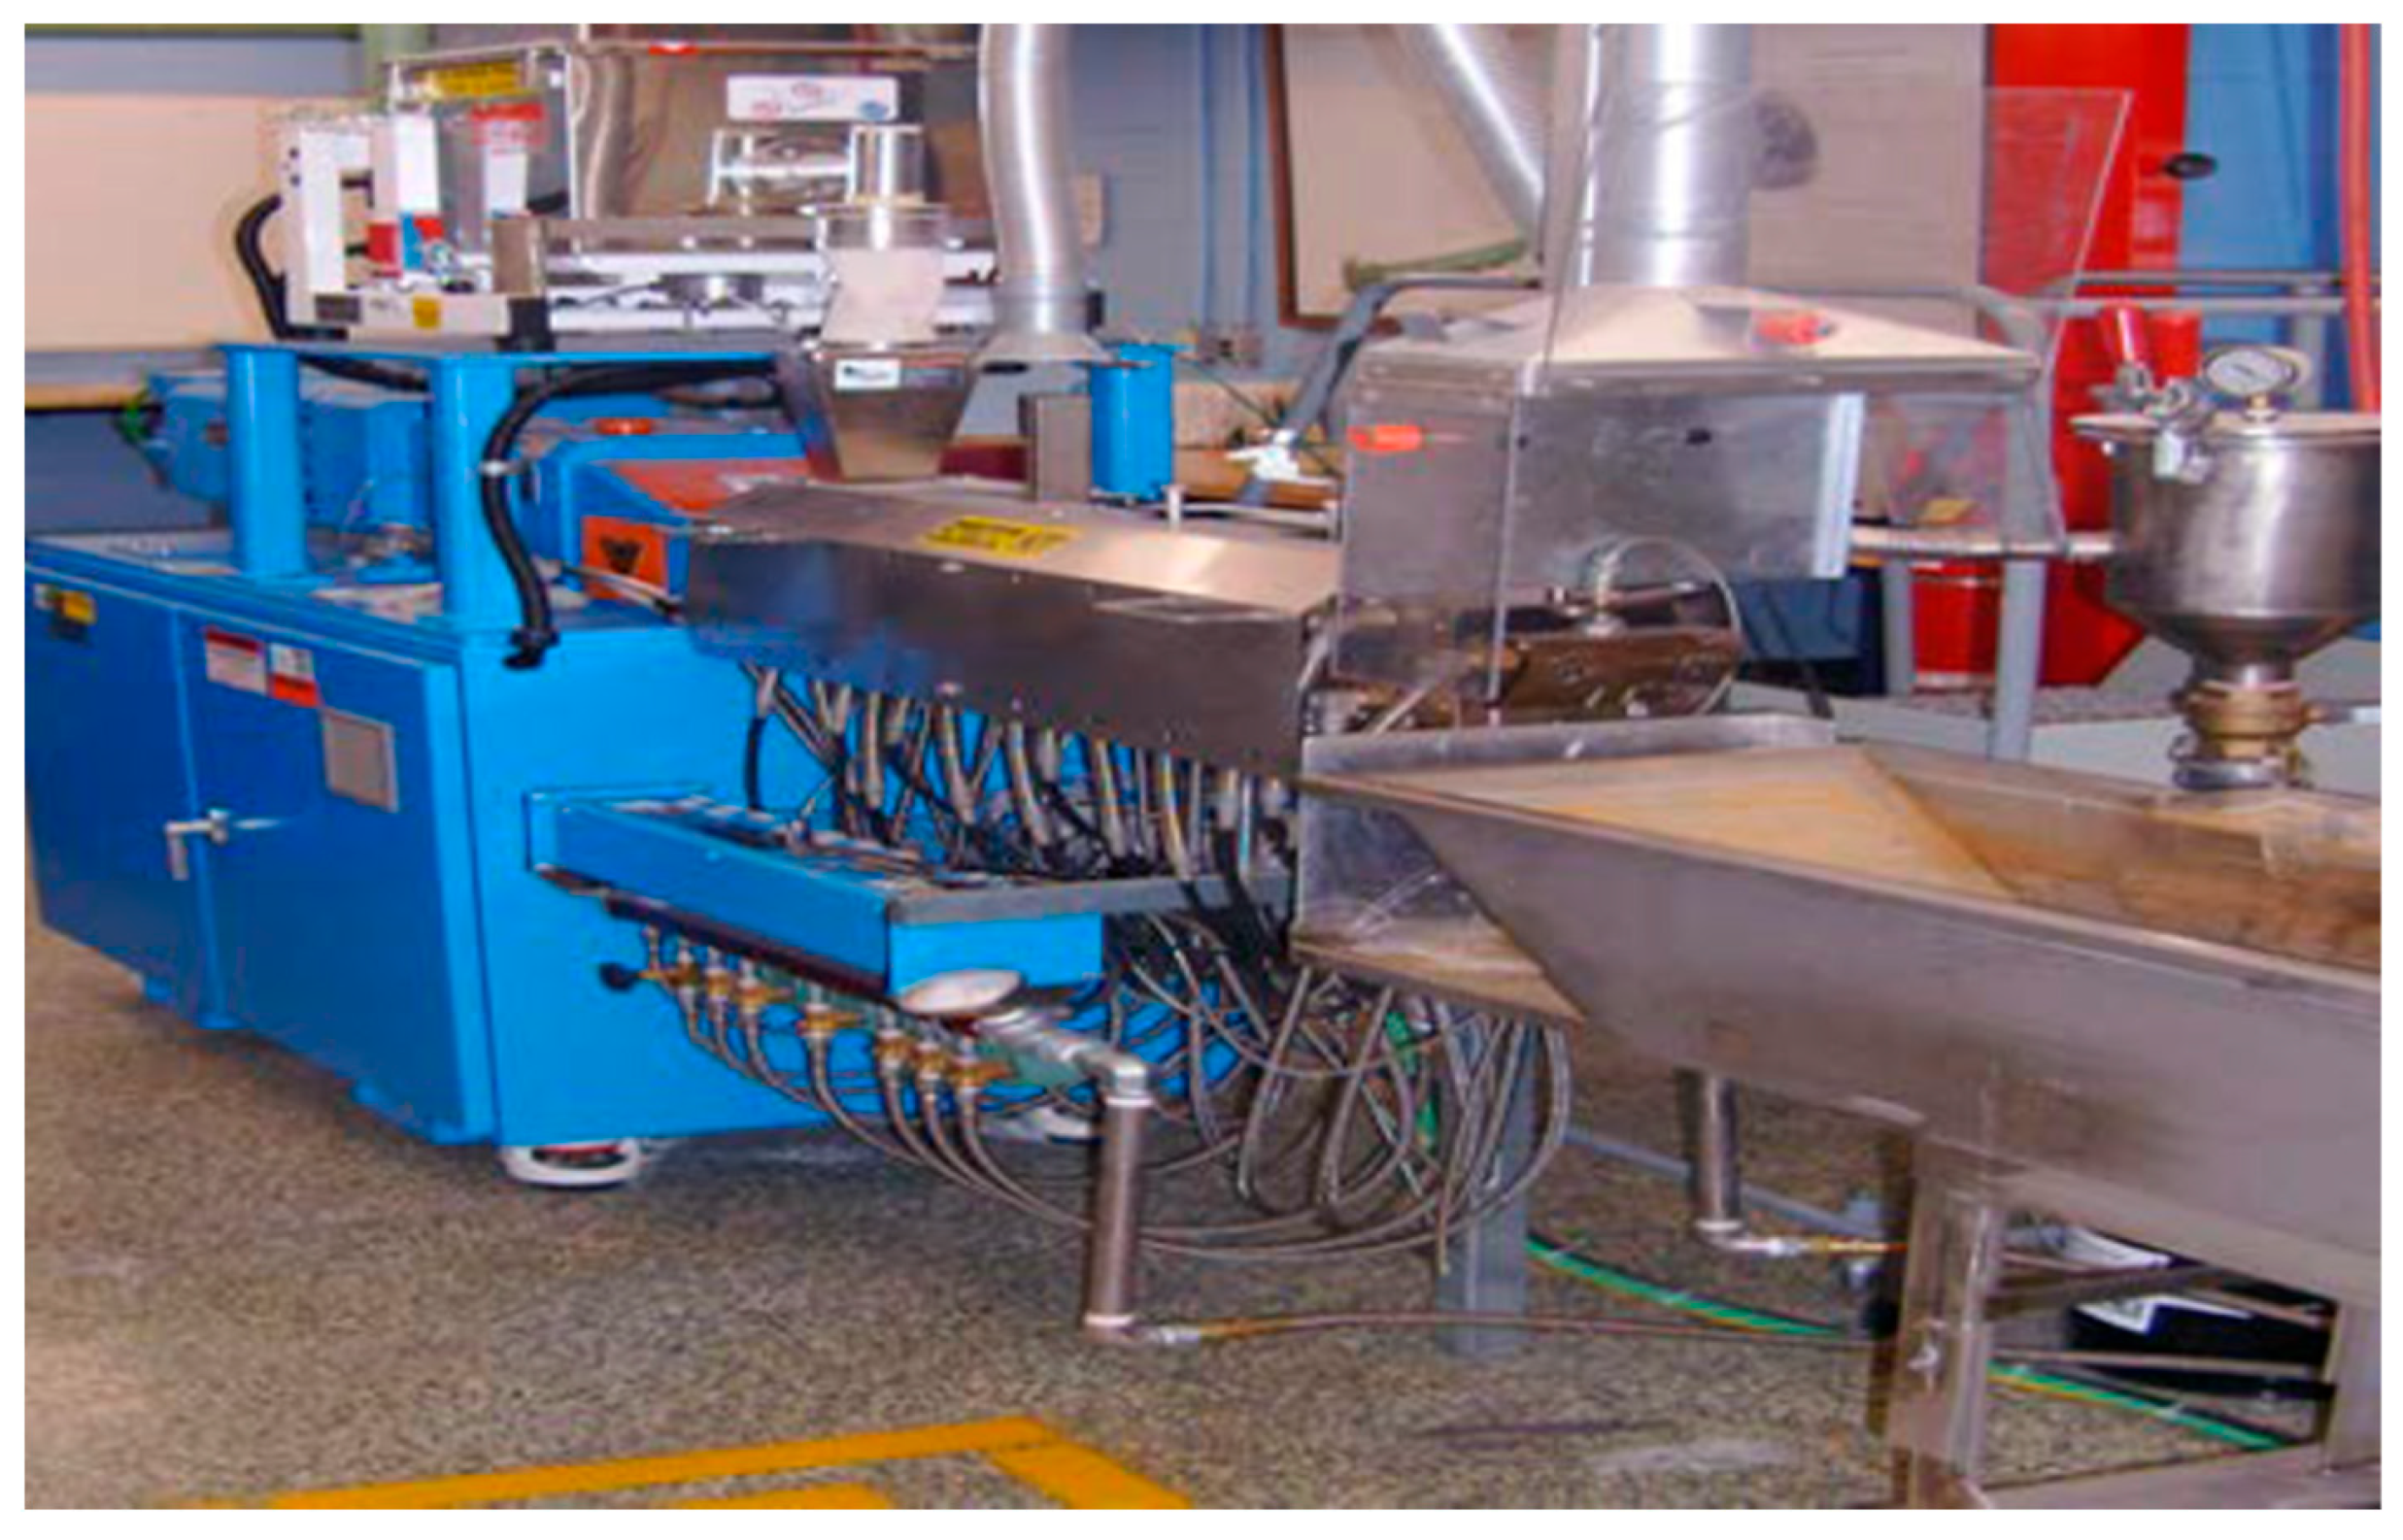
A variety of equipment was utilized for compound processing and sample preparation, characterization, color quantification and microstructural characterization. The extruder employed was an intermeshing co-rotating twin-screw extruder (TSE) manufactured by Coperion Germany. It featured a 25.5 mm screw diameter, an L-to-D ratio of 37 and a 27 kW motor. The extruder also included nine heating zones for the barrel along with one for the die. The system configuration is depicted in Figure 1 and Figure 2.
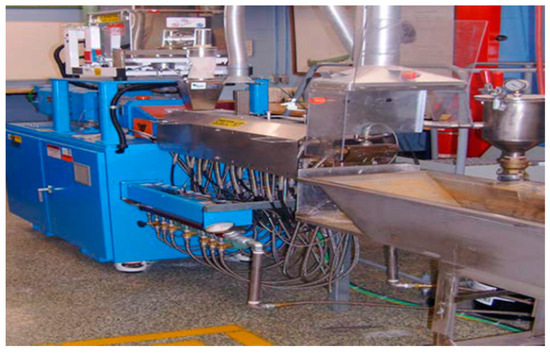
Figure 1.
Co-rotating twin-screw extruder (TSE) manufactured by Coperion Germany.
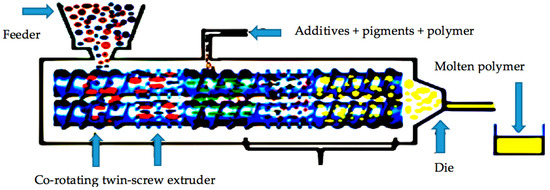
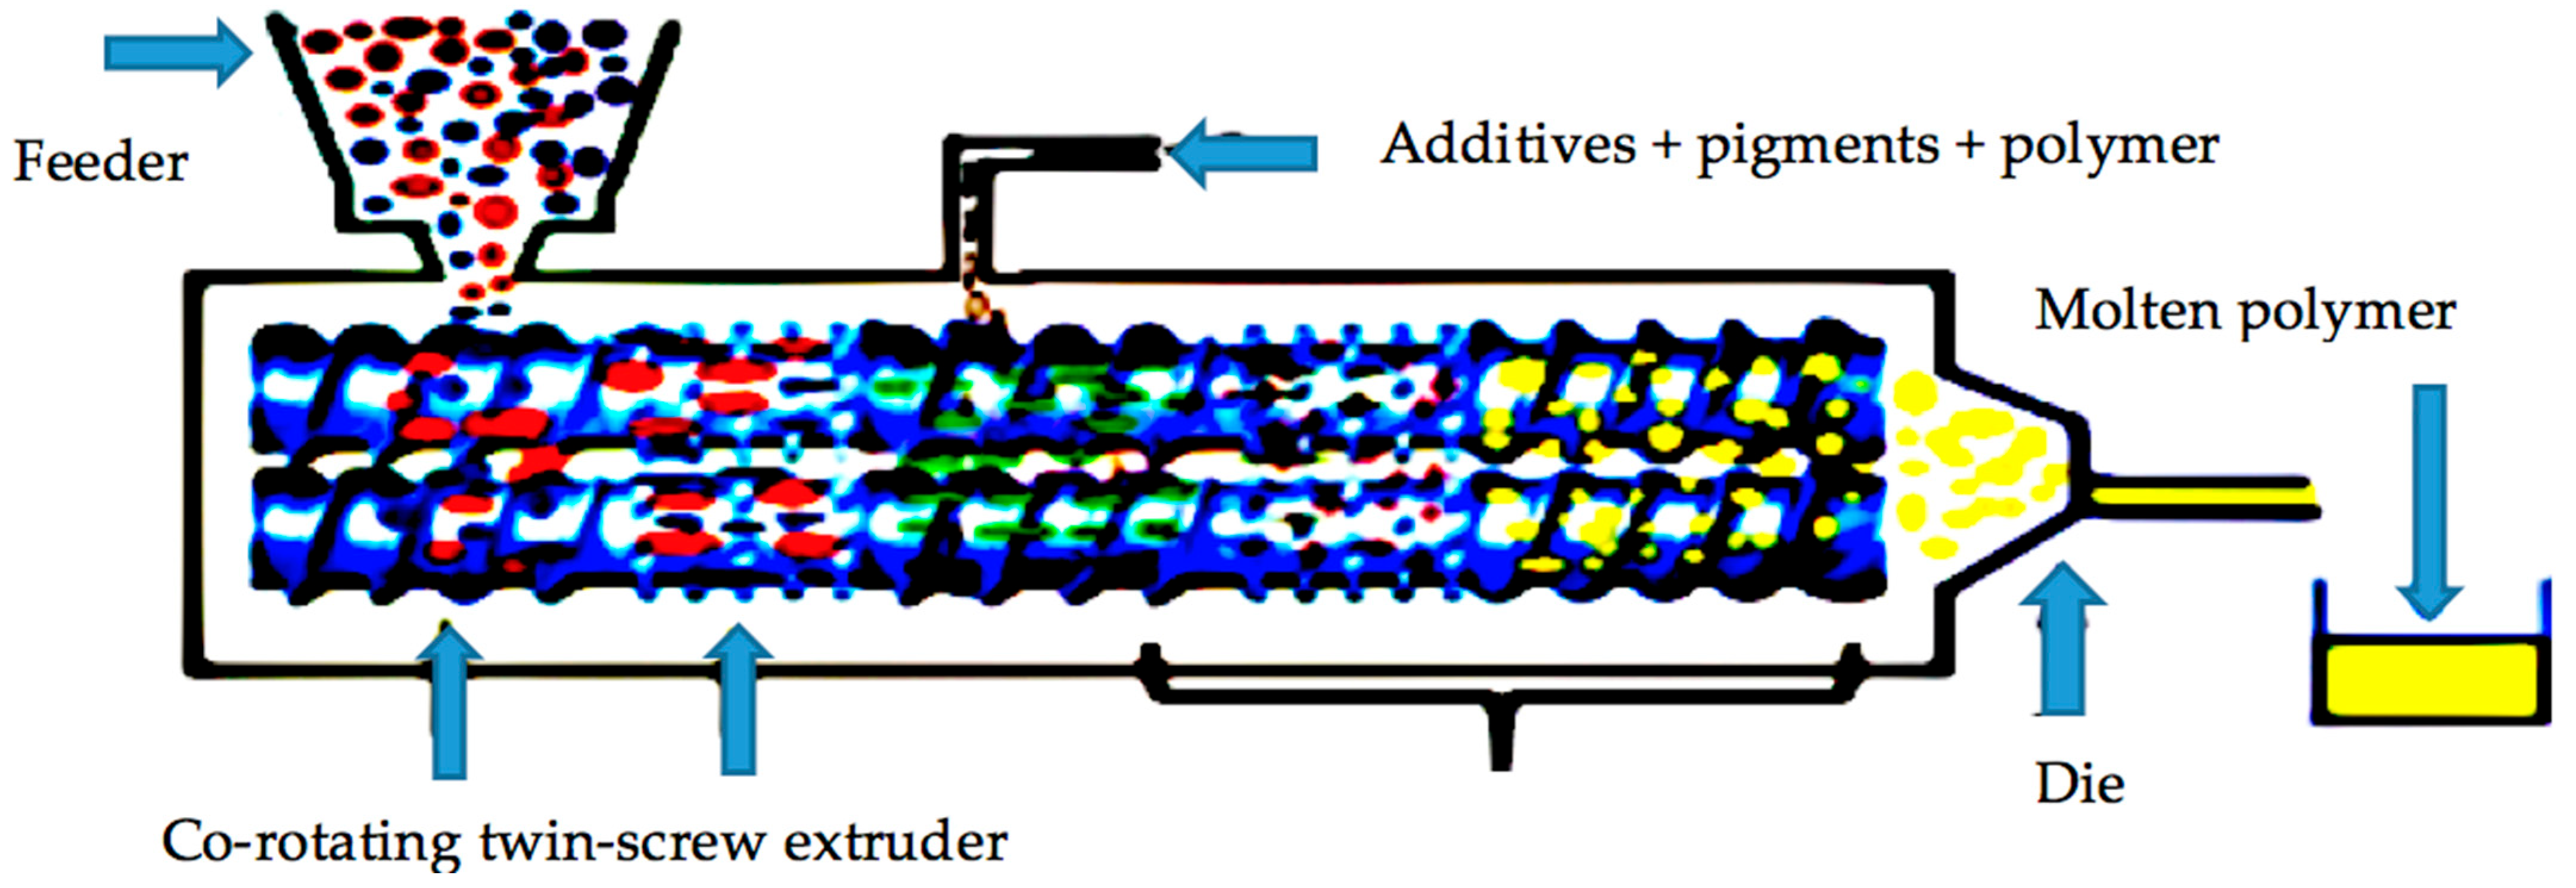
Figure 2.
Plastic extrusion processing methods.
After exiting the die, the extruded material underwent quenching in cold water, followed by drying using air and was subsequently converted into pellets via a pelletizer. These pellets were then molded via injection molding into three rectangular color chips (3 × 2 × 0.1″). Kawaguchi Co. manufactured the injection-molding machine utilized, specifically a KM100 model with a clamp tonnage of 85 tons. This machine comprised two main components: an injection component and a clamping component. The KM100 was employed to produce samples for further characterizations and color quantification, processed at approximately 1000 PSI (28 MPa) and 280 °C.
Subsequently, the specimens were dried at room temperature in the lab for further optical microscopic tests and characterization measurements.
Experimentation took place at the Industrial IP plant in SB. The materials were extruded using an intermeshing twin co-rotating screw extruder (refer to Figure 1). The total weight of the color additives (pigment and additive) was 86%. The two PC resins, R1 and R2, were utilized in a ratio of 30 and 70 wt.%, respectively. Table 3 outlines the formulation utilized. The additives and pigments were blended with the resins at a ratio of 100:86 and were batch-mixed using a super floater.
The steps involved in the compounding process are depicted in Figure 2. The samples were processed using a co-rotating twin-screw extruder throughout the extrusion process.
The pellets were subsequently molded using the injection-molding machine to create rectangular color chips measuring 3 × 2 × 0.1″ in dimensions. The injection pressure and temperature were maintained at approximately 28 MPa (1000 psi) and 280 °C, respectively. Using a spectrophotometer, color measurements were conducted at three different locations on each specimen (coupon) to obtain the tri-stimulus values (L*, a* and b*). Target values for L*, a* and b* were predefined. Color differences were then determined as dL*, da*, db* and dE*. A spectrophotometer was used to record color spectra for each coupon at three separate locations per coupon
3.3. Sample Preparation by Rotary Microtome
Sample preparation for microscopic analysis was conducted using either a hot press or a microtome, as detailed below. For certain samples, a fully automatic Slee rotary microtome (CUT 6062) was employed to produce thin slices. This microtome was capable of generating slices with thicknesses of up to 5 microns. These slices were then further cut into 50-micron thick chips for optical microscope scanning tests.
3.4. Scanning Electron Microscopy (SEM)
A Joel 5500 LV scanning electron microscope was used to examine the microstructures of the produced compounds and confirm the presence of pigment agglomerates (red, yellow, black and white) in the plastic compounds.
3.5. Characterization
The morphology was examined by SEM. The optical microscopic graphs for the processing parameters at higher temperatures showed the degree of dispersion to be increased.
Additionally, researchers investigated the wear characteristics of two high-velocity oxy-fuel (HVOF)-sprayed coatings through experimental and statistical analyses. Microstructural examinations of both coatings were performed using SEM and X-ray diffraction (XRD). RSM was utilized to formulate a mathematical model and the findings indicate that both coatings exhibit similar responses in terms of individual RSM outputs [19].
The main focus was to establish a quantitative methodology using a combination of particle size analysis (PSA), SEM, micro-computed tomography (MCT) scanning and direct observation method (DOM) observations to describe pigment dispersion in polycarbonate composites. This method enhances the evaluation of rheological properties and pigment dispersion, thereby reducing color differences during material processing and minimizing waste. For each processing parameter, three samples were produced at three levels and molded into color chips for the microscopy dispersion test. These color chips were then measured for their color output properties and particle size distributions.
The characterization of the Algerian rock reservoir involved employing a range of techniques, including SEM, XRD, XRF and BET analysis. To determine the minimum adsorbed quantity, a full factorial design consisting of 8 experiments derived from 23 factors was employed. This design allowed for the examination of individual effects and interactions of operational parameters using methods such as variance analysis (ANOVA), the desirability method and response surface methodology [20].
The scanning morphology was examined using a Joel scanning electron microscope at an accelerating voltage of 20 kV. Three parameters were varied individually from the center levels. In the SEM micrographs, relatively larger agglomerated pigments were observed at mid-level processing parameters compared to higher processing levels.
4. Discussion and Findings
Color attribute processing parameters were optimized using an analysis of variance (ANOVA). Software was used to determine the experimental design study parameters’ influence at dL*, da* and db*. Serial F-tests, either linear or quadratic depending on the circumstances, were run after developing a linear model as the starting point and subsequently adding terms [21,22]. The F-statistic was determined by selecting the model that has the greatest order and most relevant words and then calculating that model’s score. For all of the tri-stimulus values, the same approach was followed and only 0.1 probability values and significant words with 0.05 F statistics were included. Influencing parameters found by ANOVA including dL*, da* and db* were described with a sequential model. When terms are at the greatest attainable level, they are the most relevant terms the quadratic models have. Therefore, R2 values, dL*, da* and db* are described in Table 4.
Table 4.
The ANOVA analysis findings.
With an R-squared value of roughly 90% (in dL*, da* and db*), the features generally account for about 5% of the variability in db. The presence of “Adjacent R-Squared” is shown in Table 4 as the “Predicted R-Squared” column. The signal-to-noise ratio (SNR) is referred to as “sufficient precision”, and in most circumstances, it should be more than 4, which means that the model is able to work through the process. A comparison of pure and residual error was performed using the test known as “lack of fit”. Having a P-value larger than 0.05 indicates that the lack of fit test is unimportant.
Multiple linear regression models were created based on the findings of the ANOVA analysis to predict the dL*, da* and db* anticipated responses, which are displayed in Table 5. Process variables and their reactions to those responses are represented in a quantitative manner using polynomial equations. Each ANOVA analysis and multiple linear regression models were created to predict the dL*, da* and db* anticipated responses, which are displayed in Table 3 and Table 4. Process variables and their reactions to those responses are represented in a quantitative manner using polynomial equations. Each variable is assigned a coefficient value that is proportional to the degree to which it influences the responses.
Table 5.
Regression model’s simulation data.
The discrepancies in Table 3 are minute, indicating a high level of agreement when compared to predicted and actual values. By altering the color values’ output based on two process factors while leaving the third process parameter in its original state (constant), the response surface curves, also known as RSMs, may be formed. RSM curves are a useful tool for gaining a deeper understanding of the interplay that occurs between the various process components and for allocating their ideal values, both of which are important goals in the optimization process.
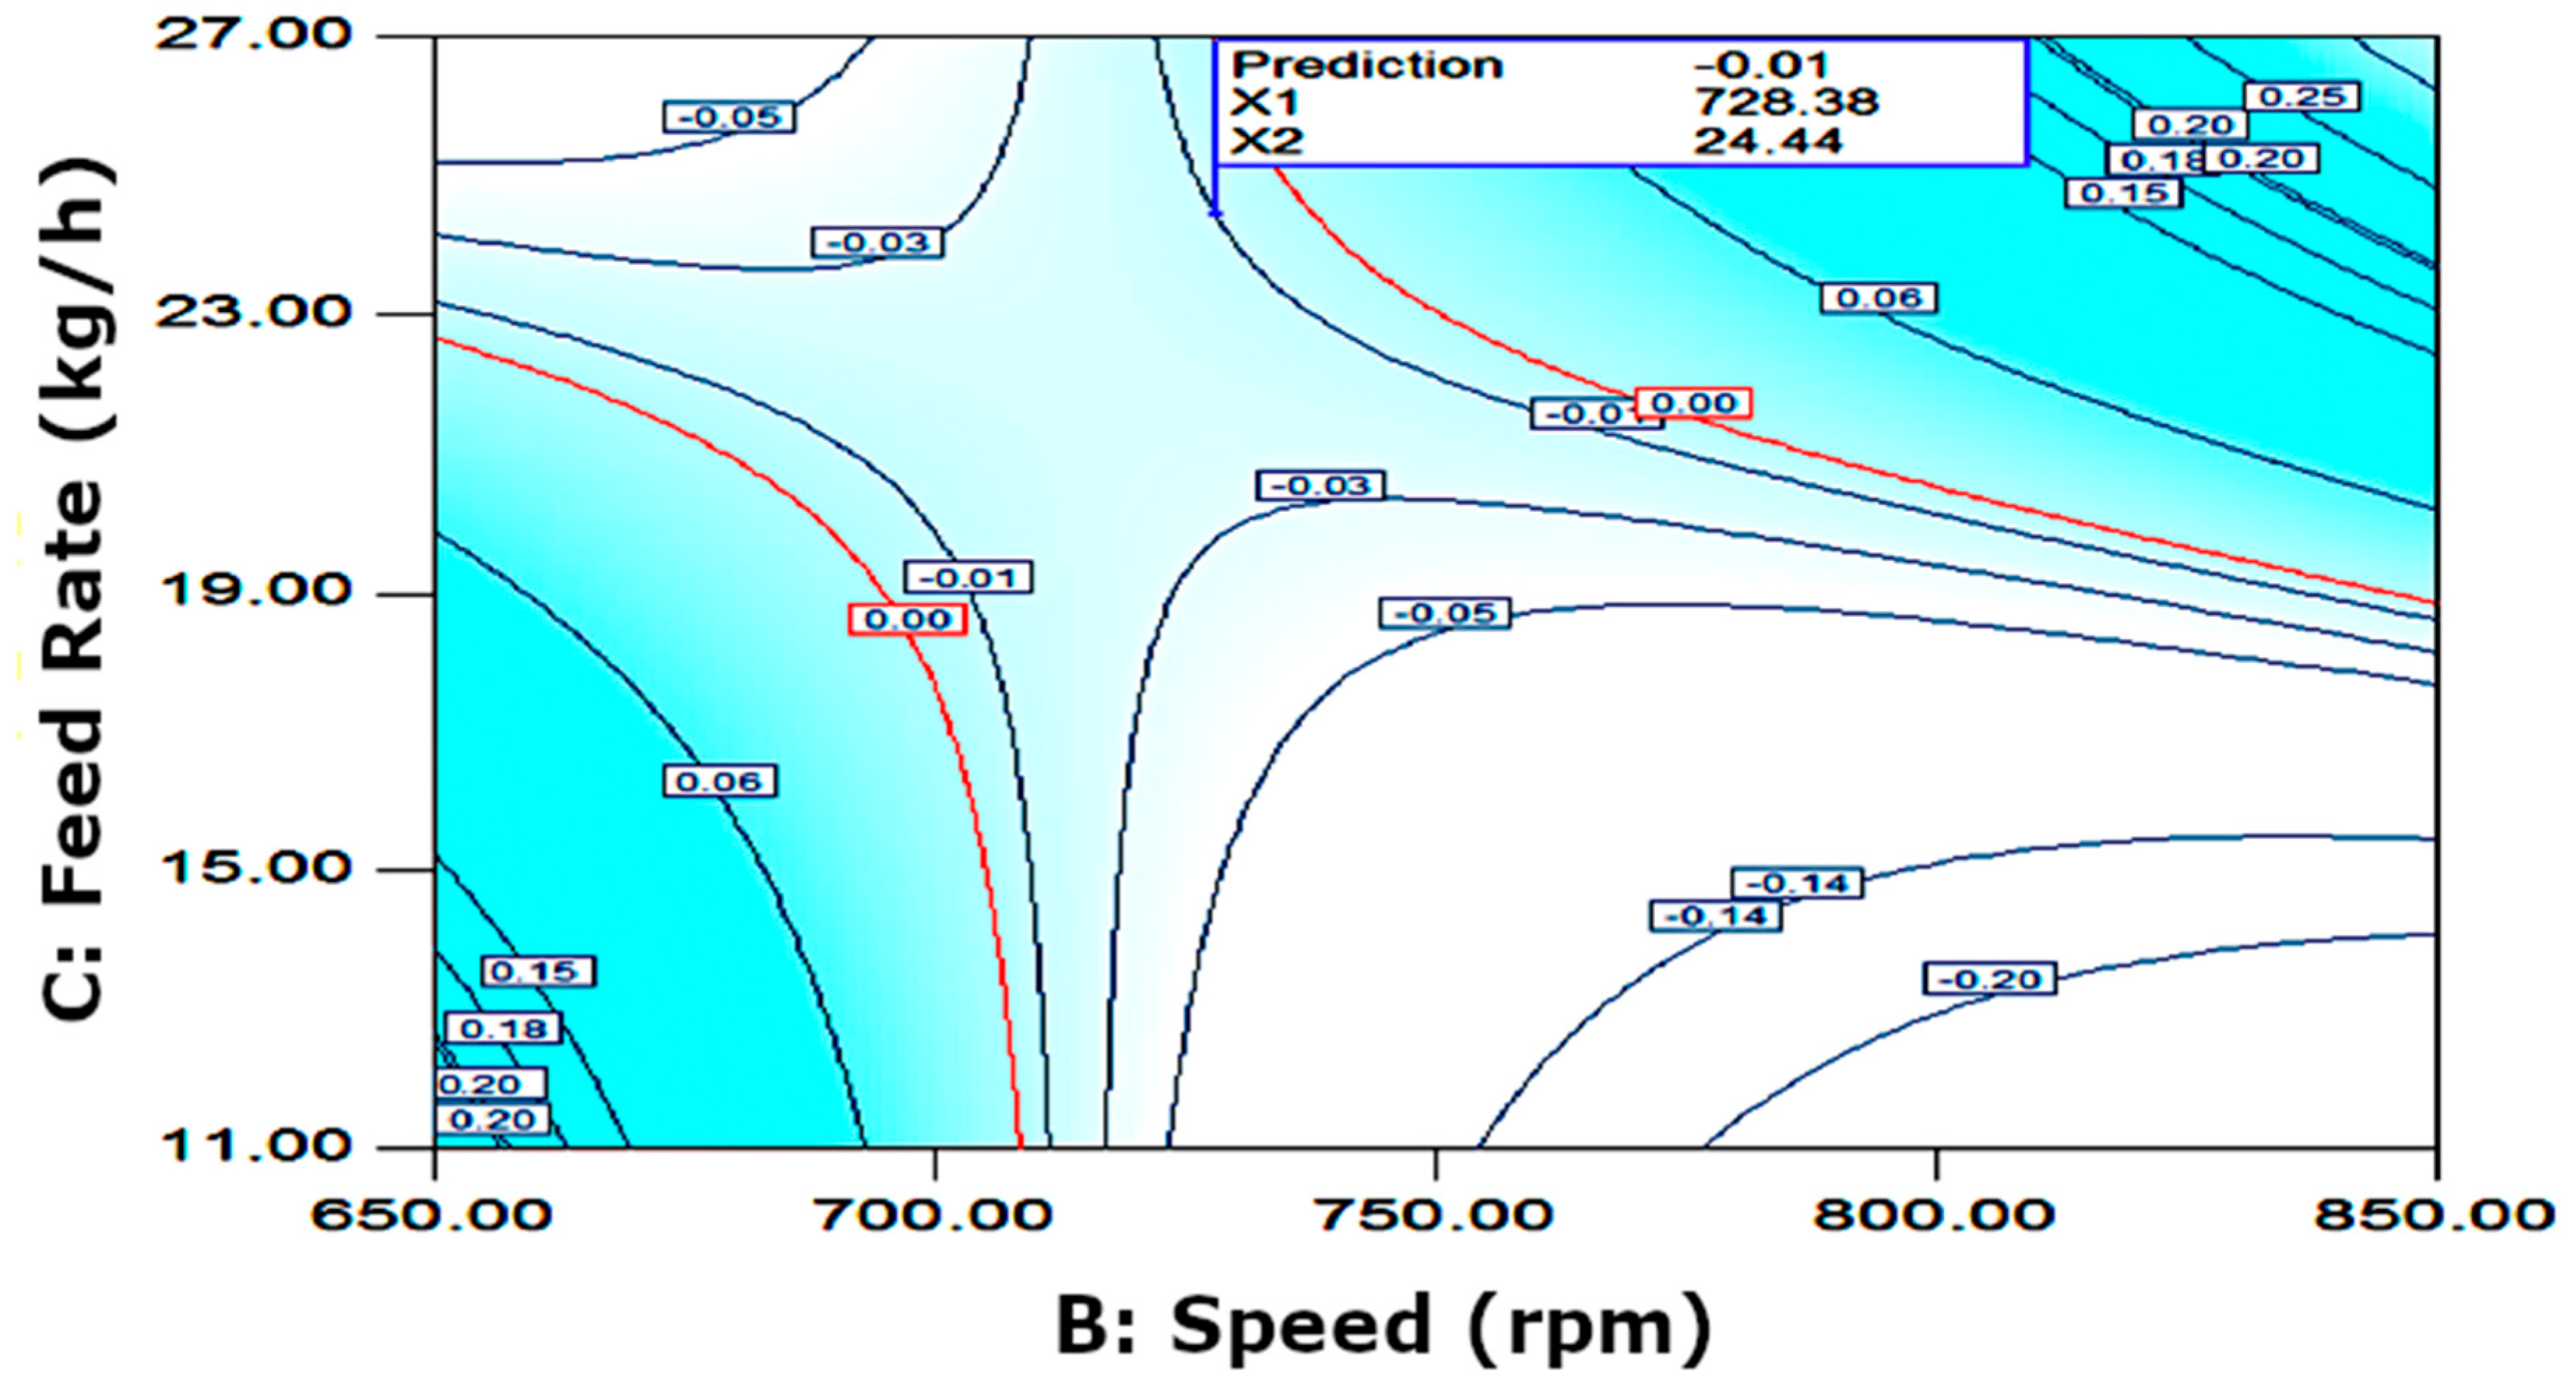
Figure 3 depicts the dL* feed rate and speed graph at 274.4 °C. It demonstrates a nonlinear relationship between speed and feed rate, resulting in significantly different response behavior in each quadrant of the graph. Many feed rates and speed combinations can achieve the goal, as illustrated. For feeding at 24.4 kg/h and 728 rpm, the global dL* value of −0.01 is displayed on the graph.
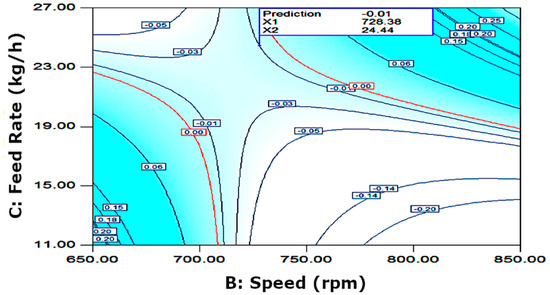
Figure 3.
At a temperature of 274.23 degrees Celsius, feed rate and speed are processed together.
Furthermore, the optimal A, B and C parameter values were determined for all responses using the desirability function “d” as well [23,24,25,26], which is also used to analyze several responses, assess their quality and pick out the best alternative with the greatest characteristics; the desired response peak levels (di) must be reflected. It is therefore possible to use the calibrated responses on a purely qualitative scale of desirability. It is possible to have an unwelcome response (d = 0) and a desired one at the same time (d = 1). When all of the criteria are optimally integrated, the value is at its highest level. There are three aspects to the narrative. At a feed rate of 24.44 kg/h, 274.23 °C and a speed of 728.38 rpm, the greatest combined desirability was determined to be 87%, as shown in Figure 4.
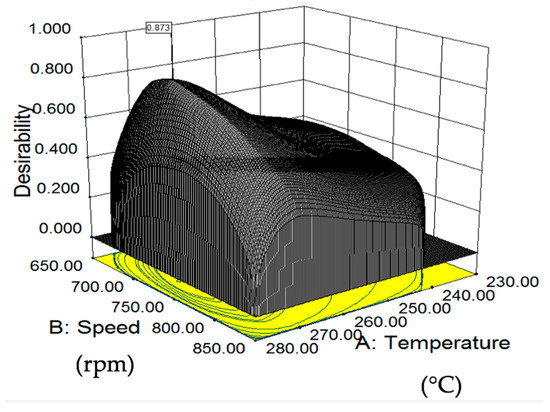
Figure 4.
Desirability diagram for a feed rate of 24.4 kg/h.
In Figure 5, an overlay plot of process outlines with speed vs. temperature is shown, which highlights the potential zone for reaching the intended values. The dL*, da* and db* measured responses have been attained with the FR maintained constant when FR = 24.44 kg/h; yellow represents the portion of the graph that lies within 0.30 da* and 0.20 db*. The settings of FR of 24.44 kg/h, T of 274.23 °C and speed of 728.38 rpm make it possible to achieve the best possible tri-stimulus values: da* equals 0.19, dL* equals −0.01 and db* equals −0.188. Equation 1 yields a tri-stimulus variance value of no more than 0.26. When viewed within the context of the allowed maximum variance, this is a respectable figure, dE* equals 1.0, according to the research findings.
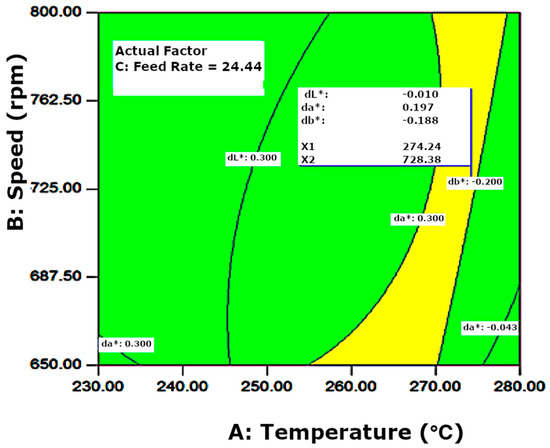
Figure 5.
FR = 24.44, between speed (B) and temperature (A) overlay-plot contours.
The experimental design utilized process variables; full factorial RSM was used, with three stages of process variables and a variety of processing conditions (GT). RSM and GT were statistically significant in producing process parameters [27,28,29,30,31].
Indeed, the present study demonstrates, from the output of the appropriate color, a little deviation is revealed by an optimized set of temperature, feed rate and screw speed values in the context of the processing parameters’ specified range. In addition, more research can be performed to determine the optimal processing conditions for various color formulations and grades, leading to a significant reduction in waste [27,28,29,30,31,32].
As a result, a total variance (dE*) of 0.26 means that the enhanced tri-stimulus values of BBD in this investigation are suitable for the desired values. Using GT allowed determining the lowest color output variation to be at 255 °C, 25 kg/h and 750 rpm (the mid-point between these three parameters).
Table 6 shows that dE* = 0.35 within such a specified range of process variables is noticed. In the GT design, a total of 15 processing parameters were tested to optimize the best or optimum color output. Interestingly, the optimal color was found at the center point of the experimental setup.
Table 6.
GT extrusion parameter effects at 255 °C, 25 kg/h and 750 rpm, at center points.
At the center point, when it comes to examining the agglomerations, the produced data from the study reveal that they are at a minimum state. There is a need for more research on different color compositions from various grades where the best processing settings are identified to achieve the best reduction in waste [27,28,29,30,31,32].
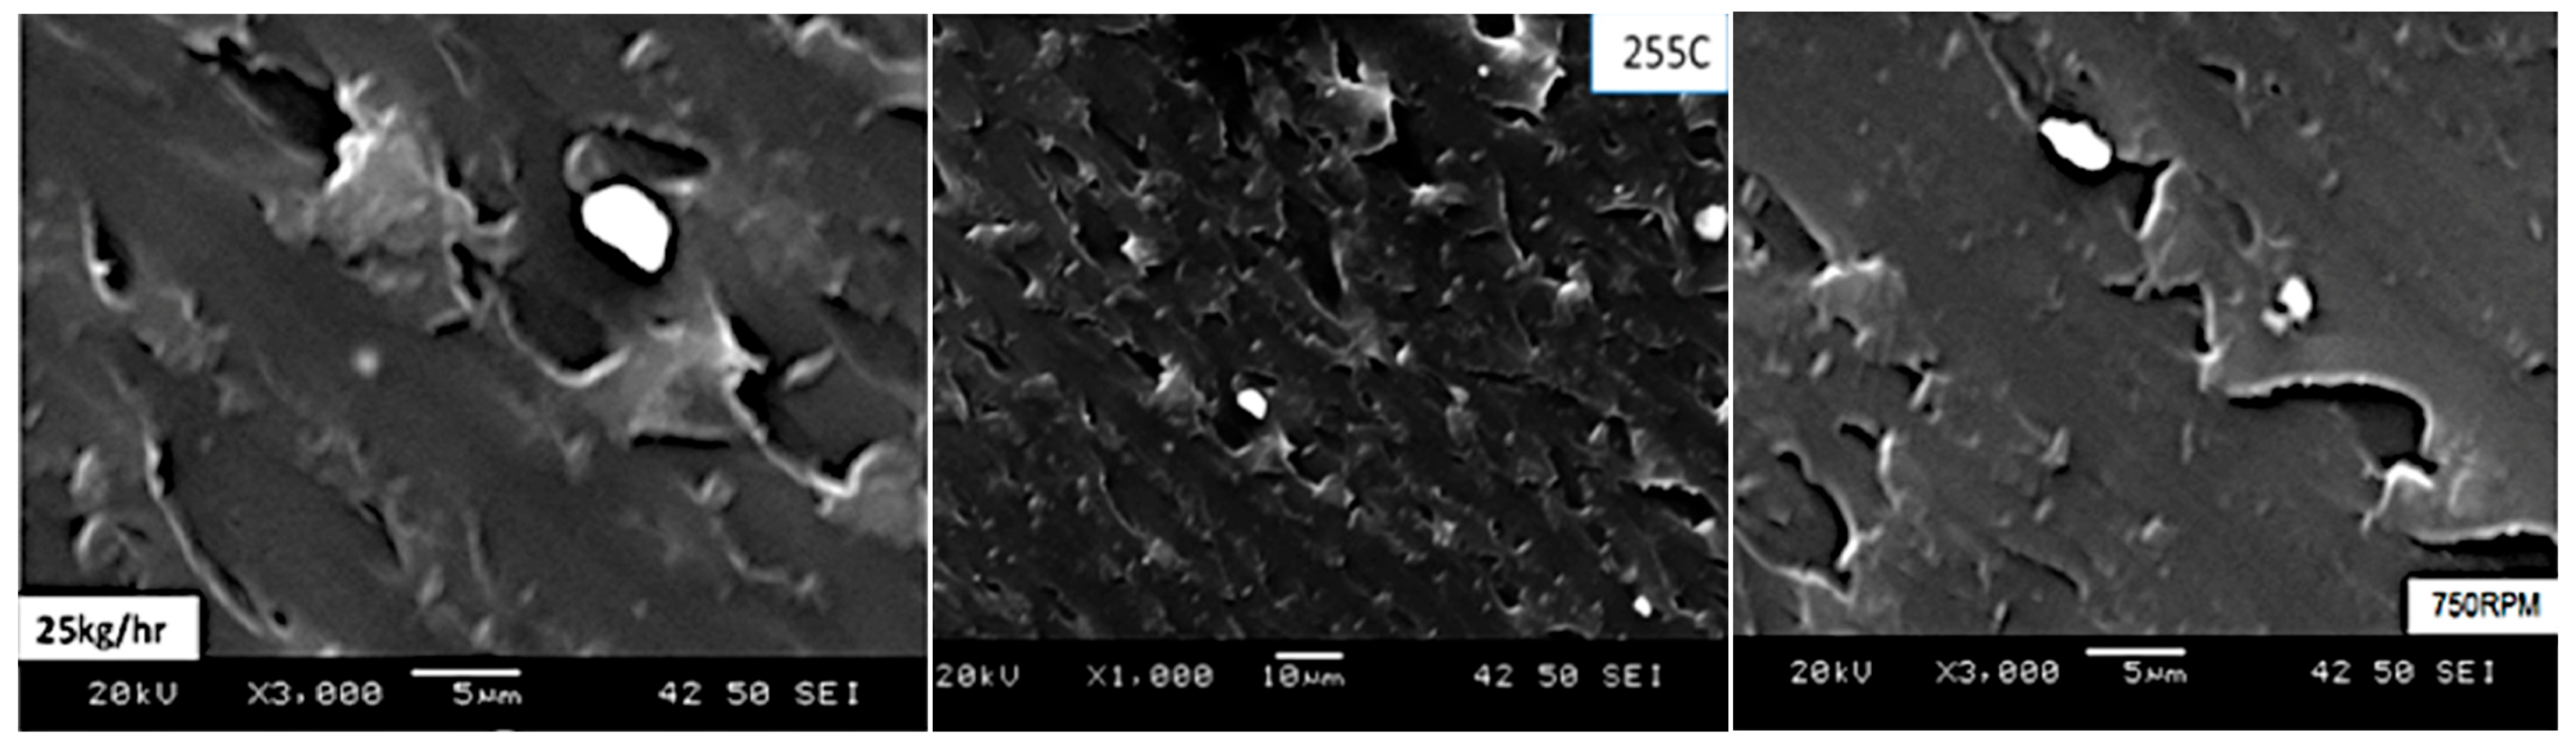
The findings identify pigment dispersion in polycarbonate composite materials in an analysis of the specimens’ characteristics for three process conditions with pigment distribution. SEM was also used to develop a quantitative methodology. As shown in Figure 6, compounded grade contains primary particles and agglomerates at three different levels; each of these samples was individually altered. To better reveal the primary agglomerated pigment, lower processing settings were used in comparison to higher processing parameters.
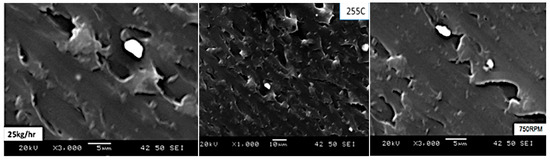
Figure 6.
Scanning electron micrographs for GT at the centers of the images.
Figure 6 shows that polycarbonate pigment samples were found to be agglomerated when examined by SEM, as evidenced by micrograph photographs showing a uniform dispersion. In the high shear zone, de-agglomeration occurs, at the center points, due to the increase in extrusion parameters at 750 rpm, 25 kg/h and 255 °C. The material had a lower shear heat or rate at a low extrusion process. As a result, agglomeration can occur when the shear zones are lowest.
5. Conclusions
This research investigates how the process conditions influence the overall trends using the method of the experimental design based on the BBD software version 8.0.
Firstly, the BBD method is used to evaluate the model’s fitness. However, less information is provided. In addition, because the BBD has a relatively small number of elements, the testing process may be finished in a shorter time and at a lower total cost. Due to minimal differences between the two values (the actual and predicted), BBD tri-stimulus values agreed well. The researchers in this study were able to predict tri-stimulus values fairly accurately, which correlates remarkably well with the results of the prior investigation findings through the model of regression.
The optimal tri-stimulus values are obtained when processing parameters (for BBD and the statistical relationship of dL*, da*, db* and dE*) are set at FR = 24.44 kg/h, T = 274.23 °C and 728.38 rpm. Furthermore, the lowest entire deviation (dE*) is 0.26 and the design maximum desirability is 87%.
In the second BBD method investigating the relation between GT behavior and process parameters, the L*, a*, b* and dE* values at center points indicated that the experiment’s minimal difference of color was noticed when 0.35 = dE*, 68.40 = L*, 1.470 = a* and 15.35 = b*. In addition, processing parameters increase consistently towards the mild ranges. In addition, GT revealed the lowest differences in color when the speed equals 750 rpm, feed rate equals 25 kg/h and temperature equals 255 °C. High shear forces in addition to a condition of heat and friction have the potential to be created by these processing parameters at higher screw feed rates, temperatures and speeds. The heat resistance of the pigments and the components of other polymer matrices might be negatively affected by this, at the center point. In principle, agglomeration can occur in zones of low and rising shear. This phenomenon makes it clear that reducing the particle size inhibits the pigment agglomeration, keeps improving the dispersion conditions and subsequently helps decrease grade color mismatching. Both findings resulted in optimal sorting conditions, increased pigment dispersion and decreased wastage.
Author Contributions
Conceptualization, J.A.; methodology, J.A.; software, J.A. and M.A.W.; validation, A.A., A.A.-C. and A.A.K.; formal analysis, J.A. and A.A.; investigation, F.A.M.A.B. and W.A.-Y.; resources, J.A.; data curation, A.A.-C.; writing—original draft preparation, J.A.; writing—review and editing, A.A.-C.; visualization, A.A.-C.; supervision, I.T., R.I., H.A.-M., S.A., F.A.M.A.B. and A.A.K.; project administration, F.A.M.A.B. and M.A. All authors have read and agreed to the published version of the manuscript.
Funding
This research received no external funding.
Institutional Review Board Statement
Not applicable.
Informed Consent Statement
Not applicable.
Data Availability Statement
The original contributions presented in the study are included in the article, further inquiries can be directed to the corresponding author.
Conflicts of Interest
The authors declare no conflict of interest.
References
- Rwei, S.P. Distributive mixing in a single-screw extruder—evaluation in the flow direction. Polym. Eng. Sci. 2001, 41, 1665–1673. [Google Scholar] [CrossRef]
- Wong, A.Y. Single-Screw Extrusion & Screw Configuration Effects on The Color Mixing Characteristics of Polymer; Sichuan Union University: Chengdu, China, 1998. [Google Scholar]
- Kimura, K.; Nakayama, Y.; Kajiwara, T. Distributive mixing characteristics of a Dulmage-type screw for a single-screw extruder: Experimental and numerical evaluation. Chem. Eng. J. Adv. 2021, 7, 100137. [Google Scholar] [CrossRef]
- Wong, Y.A. Quantification for dynamic mixing performance of single screws for different configurations: Visualization and image analysis. Adv. Polym. Technol. 2009, 28, 1–15. [Google Scholar] [CrossRef]
- Meade, D.I. Introduction to colorant selection and Application Technology. In Coloring of Plastics, Fundamentals, 2nd ed.; Charvat, R.A., Ed.; John Wiley & Sons, Inc.: Hoboken, NJ, USA, 2004; ISBN 9780471139065. [Google Scholar] [CrossRef]
- Müller, A. Coloring of the Plastics; Hanser Carl Verlag: Munich, Germany, 2003. [Google Scholar]
- ASTM D 2244-93; Standard Test Method for Calculation of Color Differences from Instrumentally Measured Color Coordinates. ASTM: West Conshohocken, PA, USA, 2000; pp. 215–222.
- Hunter Lab. The Basics of Color Perception and Measurement. 2001. Available online: https://www.hunterlab.com/media/documents/basics-of-color-theory.pdf (accessed on 30 January 2022).
- Abrams, R.; Ali, M.; Denton, P.; Igualada, J.; Groen, M.; Gschwind, E. Colouring plastics: Fundamentals and trends. Plast. Addit. Compd. 2001, 3, 18–25. [Google Scholar] [CrossRef]
- Markarian, J. US compounding industry faces challenging times. Plast. Addit. Compd. 2008, 10, 38–41. [Google Scholar] [CrossRef]
- Anderson, M.J.; Whitcomb, P.W.; Simplified, R.S. Optimizing Processes Using Response Surface Methods for Design of Experiments; Productivity Press: New York, NY, USA, 2005. [Google Scholar]
- Borror, C.N. Evaluation of Statistical Designs for Experiments Involving Noise Variables. J. Qual. Technol. 2002, 34, 54–70. [Google Scholar] [CrossRef]
- Douglas Montgomery, C. Design and Analysis of Experiments, 6th ed.; John Wiley and Sons: New York, NY, USA, 2019. [Google Scholar]
- Mishra, A. Application of Box-Benhken experimental design for optimization of laccase production by Coriolus versicolor MTCC138 in solid-state fermentation. Sci. Ind. Res. 2008, 67, 1098–1107. [Google Scholar]
- Boublia, A.; Lebouachera, S.E.I.; Haddaoui, N.; Guezzout, Z.; Ghriga, M.A.; Hasanzadeh, M.; Benguerba, Y.; Drouiche, N. State-of-the-art review on recent advances in polymer engineering: Modeling and optimization through response surface methodology approach. Polym. Bull. 2023, 80, 5999–6031. [Google Scholar] [CrossRef]
- Belkahla, Y.; Mazouzi, A.; Lebouachera, S.E.I.; Hassan, A.J.; Fides, M.; Hvizdoš, P.; Cheniti, B.; Miroud, D. Rotary friction welded C45 to 16NiCr6 steel rods: Statistical optimization coupled to mechanical and microstructure approaches. Int. J. Adv. Manuf. Technol. 2021, 116, 2285–2298. [Google Scholar] [CrossRef]
- Mazouzi, A.; Rezzoug, A.; Cheniti, B.; Lebouachera, S.E.I.; Miroud, D.; Boukantar, A.-R.; Drouiche, N.; Djerdjare, B. Impact of wear parameters on NiCr-WC10Co4Cr and WC10Co4Cr HVOF sprayed composite coatings using response surface methodology. Int. J. Adv. Manuf. Technol. 2021, 114, 525–539. [Google Scholar] [CrossRef]
- Lebouachera, S.E.I.; Ghriga Salha, B.G.; El Hadri, H.; Hasanzadeh, M.; Drouiche, N.; Reynaud, S.; Grassl, B. Optimization of zero-shear viscosity for HPAM-Polystyrene microspheres formulations through experimental design approach. J. Polym. Res. 2021, 28, 135. [Google Scholar] [CrossRef]
- Ghriga, M.A.; Hasanzadeh, M.; Gareche, M.; Lebouachera, S.E.I.; Drouiche, N.; Grassl, B. Thermal gelation of partially hydrolysed polyacrylamide/polyethylenimine mixtures using design of experiments approach. Mater. Today Commun. 2019, 21, 100686. [Google Scholar] [CrossRef]
- Lebouachera, S.E.I.; Chemini, R.; Khodja, M.; Grassl, B.; Ghriga, M.A.; Tassalit, D.; Drouiche, N. Experimental design methodology as a tool to optimize the adsorption of new surfactant on the Algerian rock reservoir: cEOR applications. Eur. Phys. J. Plus 2019, 134, 436. [Google Scholar] [CrossRef]
- Duce, C.; Bernazzani, L.; Bramanti, E.; Spepi, A.; Colombini, M.P.; Tine, M.R. Alkyd artists’ paints: Do pigments affect the stability of the resin? A TG and DSC study on fast-drying oil colours. Polym. Degrad. Stab. 2014, 105, 48–58. [Google Scholar] [CrossRef]
- Chang, K.Y. Effect Of Some Extrusion Variables On Rheological Properties And Physicochemical Changes Of Cornmeal Extruded By Twin Screw Extruder. Braz. J. Chem. Eng. 1998, 15. [Google Scholar] [CrossRef]
- Fatoni, R. Product Design of Wheat Straw Polypropylene Composite; University of Waterloo: Waterloo, ON, USA, 2012. [Google Scholar]
- Islam, M.A.; Sakkas, V.; Albanis, T.A. Application of statistical design of experiment with desirability function for the removal of organophosphorus pesticide from aqueous solution by low-cost material. J. Hazard. Mater. 2009, 170, 230–238. [Google Scholar] [CrossRef] [PubMed]
- Ahmed, S.; Al-Sadi, J.; Saeed, U.; Rizvi, G.; Ross, D.; Clarke, R.; Price, J. Process Optimization through Designed Experiments to Achieve Consistency in Output Color of a Compounded Plastic Grade; Taylor & Francis: Abingdon, UK, 2015; Volume 27. [Google Scholar]
- Sadi, J.A. Designing Experiments: Three Level Full Factorial Design and Variation of Processing Parameters Methods for Polymer Colors. Adv. Sci. Technol. Eng. Syst. J. 2018, 3, 109–115. [Google Scholar] [CrossRef]
- Alsadi, J. Investigation of the effects of Formulation, process parameters, Dispersions and Rheology on using combined Modelling and experimental Simulations. Mater. Today Proc. 2019, 13, 530–540. [Google Scholar] [CrossRef]
- Alsadi, J. A revised approach to rheological behavior and processing parameters of polycarbonate compound. In Proceedings of the Annual Conference of the SPE (ANTEC), Anaheim, CA, USA, 8–10 May 2017; pp. 249–255. [Google Scholar]
- Alsadi, J. Study on effect of dispersion and processing parameters in microscopically evaluated color of plastic grade. J. Am. Inst. Phys. 2019, 2139, 110007. [Google Scholar]
- Alsadi, J. Systematic review: Impact of Processing Parameters on Dispersion of Polycarbonate Composites and Pigment Characterized by Different techniques. Mater. Today Proc. 2020, 27, 3254–3264. [Google Scholar] [CrossRef]
- Alsadi, J.; Ismail, R.; Trrad, I. An Integrative Simulation for Mixing Different Polycarbonate Grades with the Same Color: Experimental Analysis and Evaluations. Crystals 2022, 12, 423. [Google Scholar] [CrossRef]
- Alsadi, J.; Obaidat, M.T.; Ismail, R.; Trrad, I.; Aljamal, M.; Dahim, M.; Abuaddous, M.; Khodier, M.; Hatamleh, R.; Al-Mattarneh, H. Box–Behnken Design for Polycarbonate-Pigment Blending: Applications and Characterization Techniques. Polymers 2022, 14, 4860. [Google Scholar] [CrossRef] [PubMed]


Disclaimer/Publisher’s Note: The statements, opinions and data contained in all publications are solely those of the individual author(s) and contributor(s) and not of MDPI and/or the editor(s). MDPI and/or the editor(s) disclaim responsibility for any injury to people or property resulting from any ideas, methods, instructions or products referred to in the content. |
© 2024 by the authors. Licensee MDPI, Basel, Switzerland. This article is an open access article distributed under the terms and conditions of the Creative Commons Attribution (CC BY) license (https://creativecommons.org/licenses/by/4.0/).