Article

Anisotropic Mechanical Properties and Fracture Mechanism of Transversely Isotropic Rocks under Uniaxial Cyclic Loading

School of Resources and Safety Engineering, Central South University, Changsha 410083, China
*
Author to whom correspondence should be addressed.
Appl. Sci. 2024, 14(12), 4988; https://doi.org/10.3390/app14124988
Submission received: 13 May 2024 / Revised: 4 June 2024 / Accepted: 4 June 2024 / Published: 7 June 2024
(This article belongs to the Special Issue Rock-Like Material Characterization and Engineering Properties)

Abstract

:
Transversely isotropic rocks, which are special anisotropic materials, are widely encountered in civil, mining, petroleum, geothermal, and radioactive waste-disposal engineering. Rock is frequently subject to cyclic loads resulting from natural and human-caused events. However, to date, the fracture mechanism of transversely isotropic rocks under cyclic loading remains poorly understood. To address this gap, uniaxial monotonic-loading and cyclic-loading tests were performed on slate specimens by the MTS815 system, during which acoustic emission (AE) signals inside the rock were monitored, and finally the fracture surfaces of the tested rock were scanned by scanning electron microscopy (SEM). Through these tests, the anisotropic mechanical properties, damage evolution, AE characteristics and fracture pattern of slate as a transversely isotropic rock were studied. The results show that the peak strength of specimens varies with the loading–foliation angle under monotonic and cyclic loading, following a U-shaped trend. The deformation modulus during unloading is more capable of characterizing the damage inside the specimen than that during loading. By defining the damage degree based on dissipation energy, it is found that the damage variable is influenced by the loading–foliation angle and the cyclic stress step. The AE characteristics of specimens exhibit significant anisotropy, closely correlated to the loading condition and loading–foliation angle. Regardless of cyclic stress step, the AE counts of specimens with a loading–foliation angle of 0° are mainly distributed near the peak region, whereas those of specimens with other loading–foliation angles occur primarily in the early stage of each cyclic loading. Finally, it is revealed that the fracture mechanism of slate specimens is determined by the loading–foliation angle, loading condition, and cyclic stress step.

1. Introduction

Natural rocks are more or less anisotropic. Anisotropic characteristics generally originate from the mineral foliation in metamorphic rocks, the stratification in sedimentary rocks, cleat networks in coal, and discontinuities in rock mass due to stress and geological history. Because of the layered structure in metamorphic and sedimentary rocks, they can further be regarded as transversely isotropic material, in which one privileged direction exists and the material behavior has rotational symmetry with regard to that direction [1,2,3]. Because of the abundance of sedimentary and metamorphic rocks on the Earth’s surface, transversely isotropic rocks are widely encountered in civil, mining, petroleum, geothermal, and radioactive waste-disposal engineering [4,5,6,7]. Moreover, rock engineering is frequently subject to cyclic loads resulting from natural and human-caused events, e.g., the geological tectonic movements, seismic actions, blasting excavations, and traffic transportations [8,9,10,11]. Hence, it is of significance to reveal the fracture mechanism of transversely isotropic rocks under cyclic loading for better evaluating the long-term stability of rock structures.
To date, there have been numerous studies on the mechanical behavior of rocks under cyclic loading, which have explored the deformation, strength, energy evolution, acoustic emission signal, and fatigue damage characteristics of rocks under different cyclic-loading stress paths [12,13,14,15,16,17,18]. They have discovered some inherent characteristics of rocks under cyclic loading, such as residual strain, hysteresis loop, fatigue threshold, stress memory, the Kaiser effect, and the Felicity effect. For instance, Sinaie et al. [19] investigated the relationship between size effect and cyclic response of cylindrical specimens. Peng et al. [15,20] investigated the effects of loading frequency and the lower limit of cyclic stress on the deformation characteristics of sandstone by triaxial cyclic-loading tests. They pointed out that increasing the cycle frequency inhibited the development of primary and new cracks in the rock during the compaction and plastic stages, while increasing the lower limit of cyclic stress shortened the time of volumetric compaction and produced the volumetric expansion of the specimen in advance. Liu et al. [21] studied the effect of random cyclic loading on intermittent jointed rocks, and their results showed that both the fatigue strength and deformation modulus of specimens decreased with the increase in loading time, but increased with the increase in loading amplitude. Duan and Yang [22] investigated the deformation and dissipation energy of sandstone under uniaxial cyclic loading, and found that the energy-dissipation curve could reflect the fatigue deformation of sandstone. In addition, some scholars have carried out experimental studies on the post-peak behavior of rocks under cyclic loading [23,24]. To characterize the damage degree in rocks under cyclic loading, researchers have tried to employ different physical parameters to quantitatively describe the damage degree in rocks [14,22,25,26,27], such as elastic modulus, residual strain, dissipation energy, and acoustic emission cumulative counts, and have established the relevant damage constitutive models. However, in these studies, rocks are assumed to be isotropic and the anisotropic characteristics of rocks are not taken into account.
In contrast, there is relatively little research on the mechanical behavior of rocks considering their anisotropic characteristics under cyclic loading. Wang et al. [28] conducted conventional triaxial cyclic-loading tests on layered marble and studied the effects of different bedding angles on the deformation, crack propagation and energy evolution characteristics of marble. Employing the equal plastic strain cyclic-loading and unloading tests with acoustic-force joint measurement, Bao et al. [29] analyzed the influence of foliation angles on the characteristic strength values, shear strength parameters, and longitudinal wave velocity to explore the anisotropic characteristics of biotite quartz schist. Zhang et al. [30] experimentally studied the anisotropic mechanical behavior of columnar-jointed rock masses under conventional triaxial cyclic loading by analyzing the influence of joint inclination on rock deformation, characteristic strength values, and failure modes. They found that the anisotropic mechanical properties of rock masses were caused by the combined action of structural anisotropy and stress anisotropy. However, to date, the fracture mechanism of transversely isotropic rocks under cyclic loading remains poorly understood.
In this study, we carried out monotonic-loading and cyclic-loading tests on a typical transversely isotropic rock, slate, to investigate its mechanical properties, and monitored the internal damage process of the rock with the assistance of an AE system, and finally analyzed the microscopic fracture mechanism by obtaining the microscopic morphology of the fracture surfaces of the rock through the SEM technique. The paper is structured as follows. First, the materials, equipment, and scheme of the test are introduced, followed by an analysis of the mechanical parameters. Subsequently, the evolutions of the secant modulus and energy density of specimens during cyclic loading are investigated, and the damage variable of the rock is defined and calculated based on the dissipated energy. Afterwards, the acoustic emission characteristics under monotonic loading as well as cyclic loading are analyzed, and the characteristics of acoustic emission counts and cumulative counts are compared under different loading conditions and different loading–foliation angles. Finally, the fracture modes are analyzed with respect to both macroscopic and microscopic aspects to reveal the fracture mechanism of transversely isotropic rocks.

2. Materials and Methods

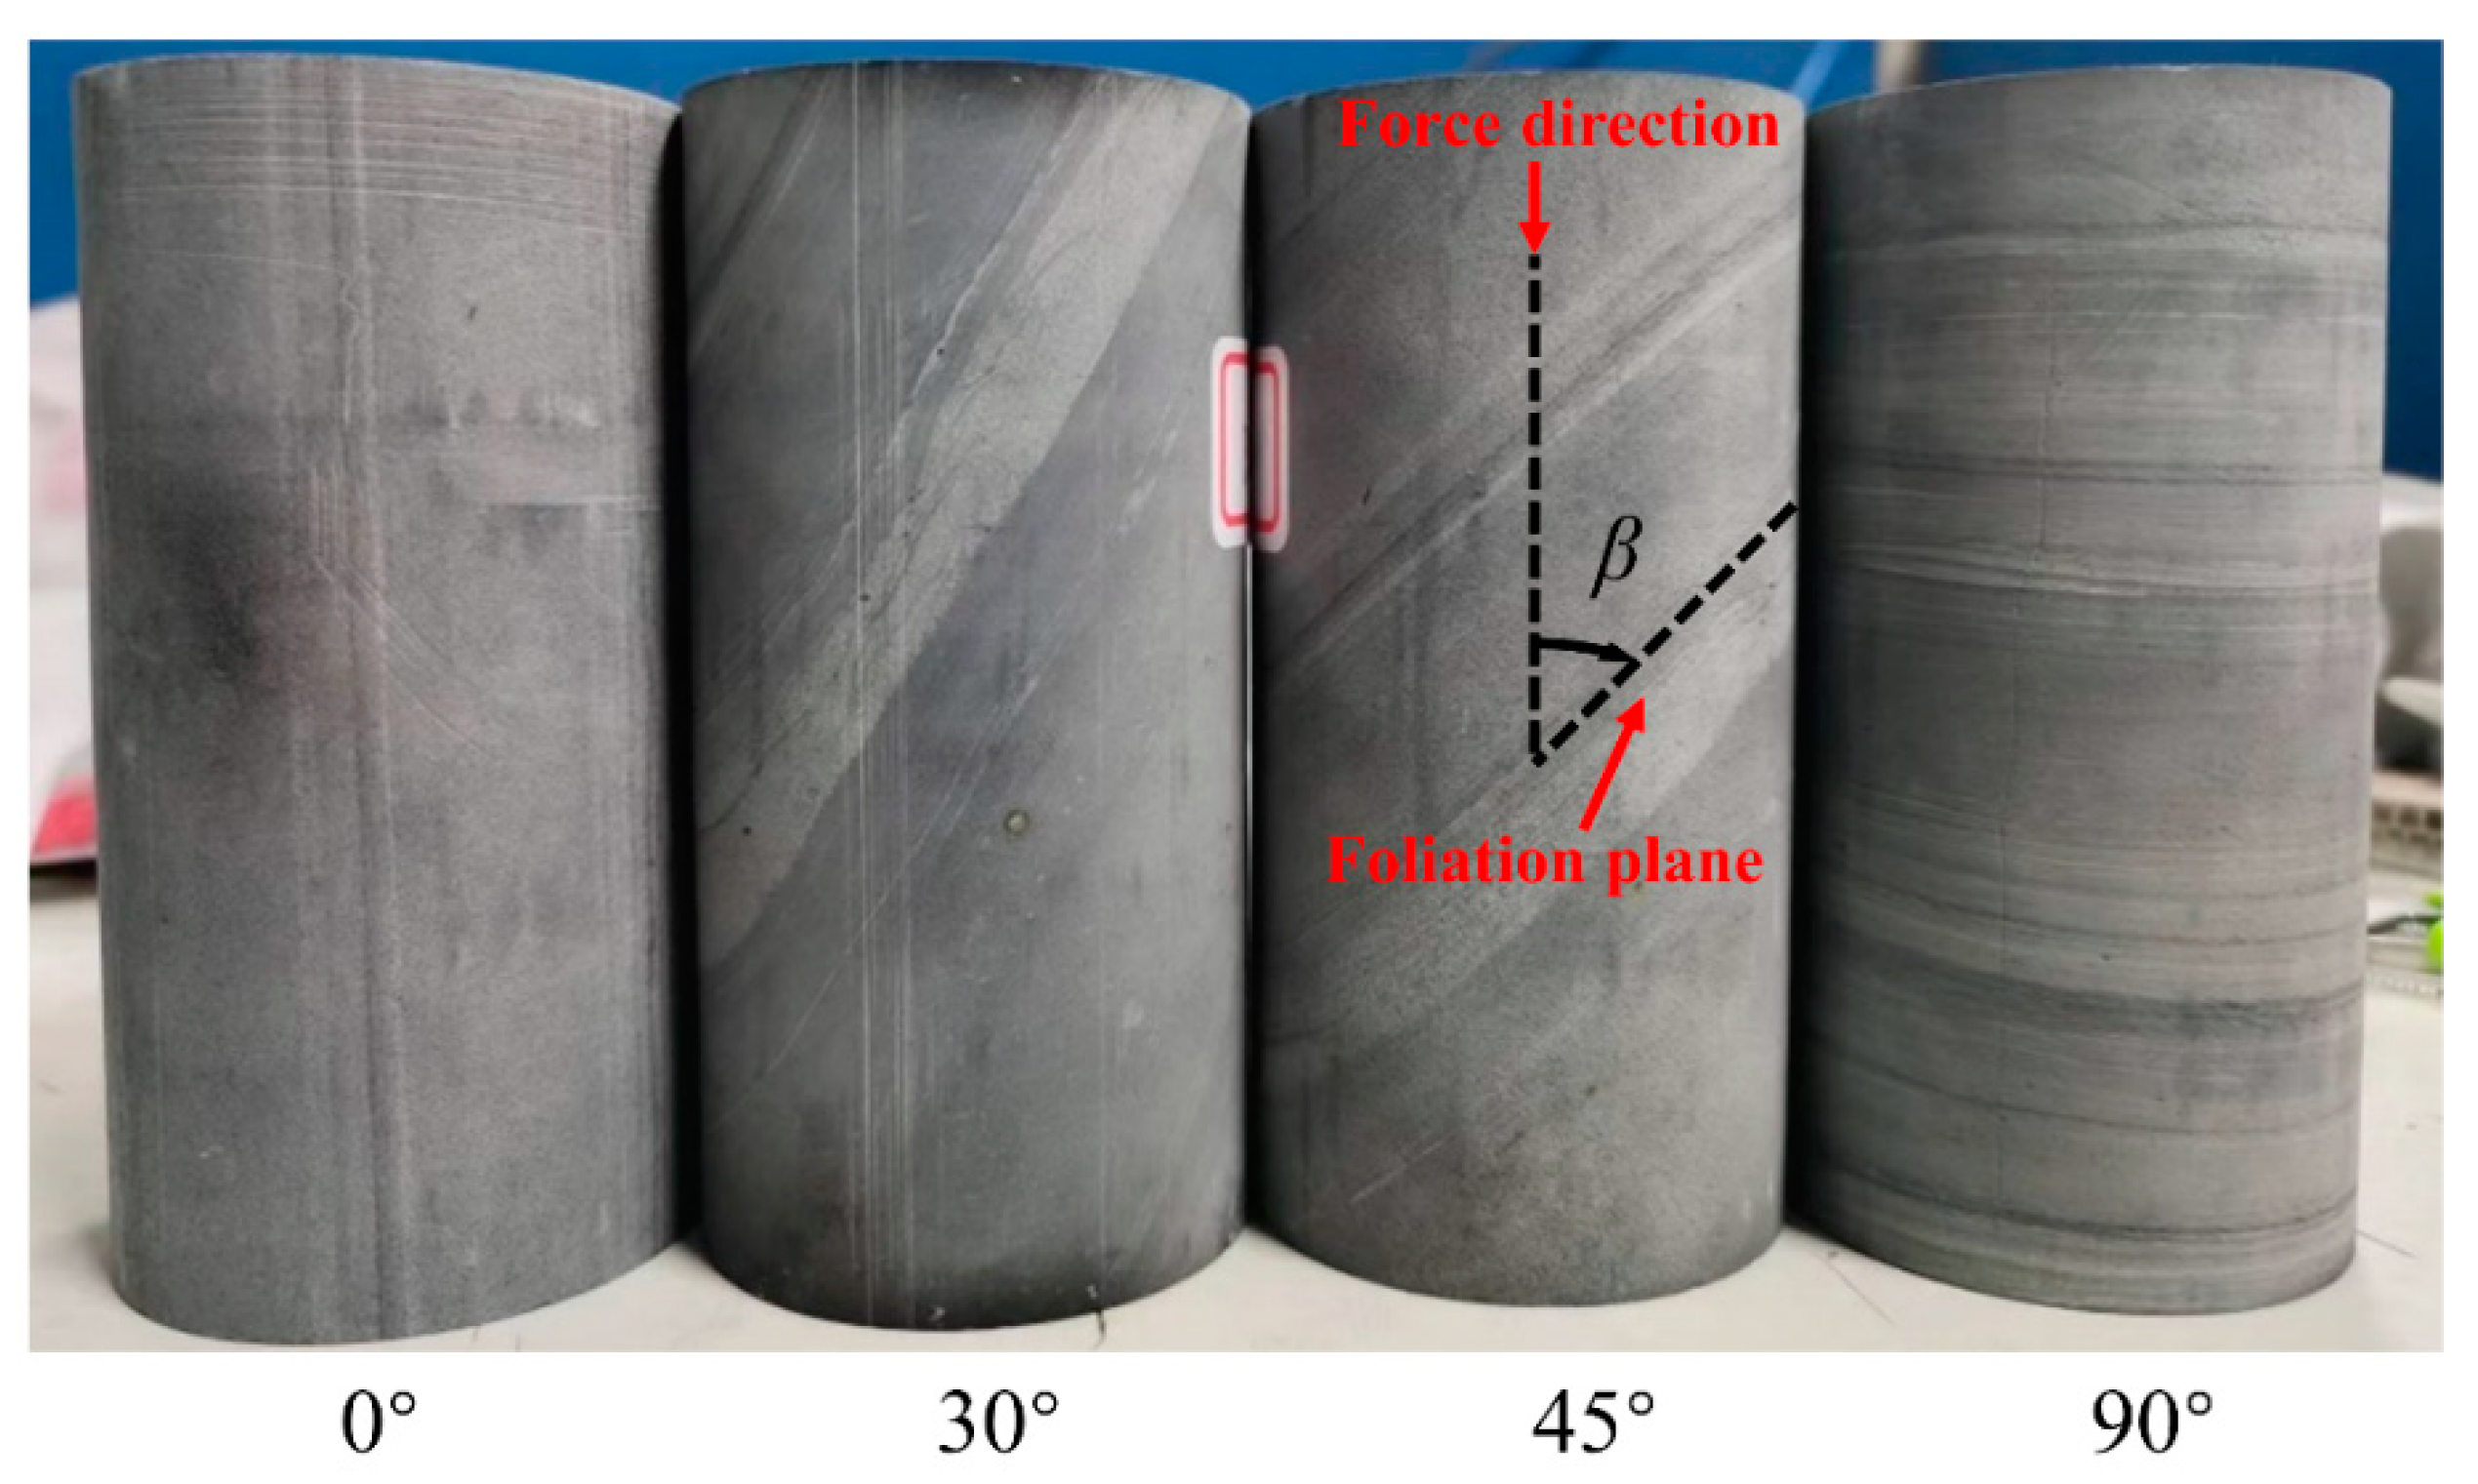
2.1. Specimen Preparation

The slate specimens from the same parent rock collected in a quarry in Jiujiang City, Jiangxi Province, China were cored at different directions with respect to foliation planes (β) of 0°, 30°, 45° and 90°, as shown in Figure 1. Following the suggestion of the International Society of Rock Mechanics [31], the specimens, with 50 mm in diameter and 100 mm in length, were prepared. The slate, exhibiting a dark gray-to-light gray color, is a shallow metamorphic rock that has been metamorphosed primarily under directional pressure and it possesses a well-developed layered texture composed of granular calcite (5%), flaky sericite (25–30%) and angular feldspar and quartz (65–70%) with a very fine grain size in the range of 0.01–0.05 mm [32].
The P-wave velocity of specimens was measured prior to the loading test. For isotropic rocks, the P-wave velocity reflects the quantity of internal defects such as microcracks and pores within the rock [33]. A higher P-wave velocity indicates a stronger integrity of the rock. For transversely isotropic rocks, the P-wave velocity is not only affected by the defects in the rock, but is also dependent on the angle between the P-wave propagation direction and the foliation plane. Figure 2 shows the mean and standard deviation of the P-wave velocity of specimens with different foliation angles. The P-wave velocity of the slate specimen shows a decreasing trend with the increase in foliation angle, which can be attributed to more foliation planes needing to be passed through during the wave propagation. A linear function is used to fit the P-wave velocity results, as shown in Figure 2; the goodness of fitting reaches 0.9691, which means that the linear function can be used to predict well the P-wave velocity of the sample at different loading–foliation angles. Moreover, the small deviation in P-wave velocity of specimens with the same foliation angle indicates a low discreteness of the prepared specimens.

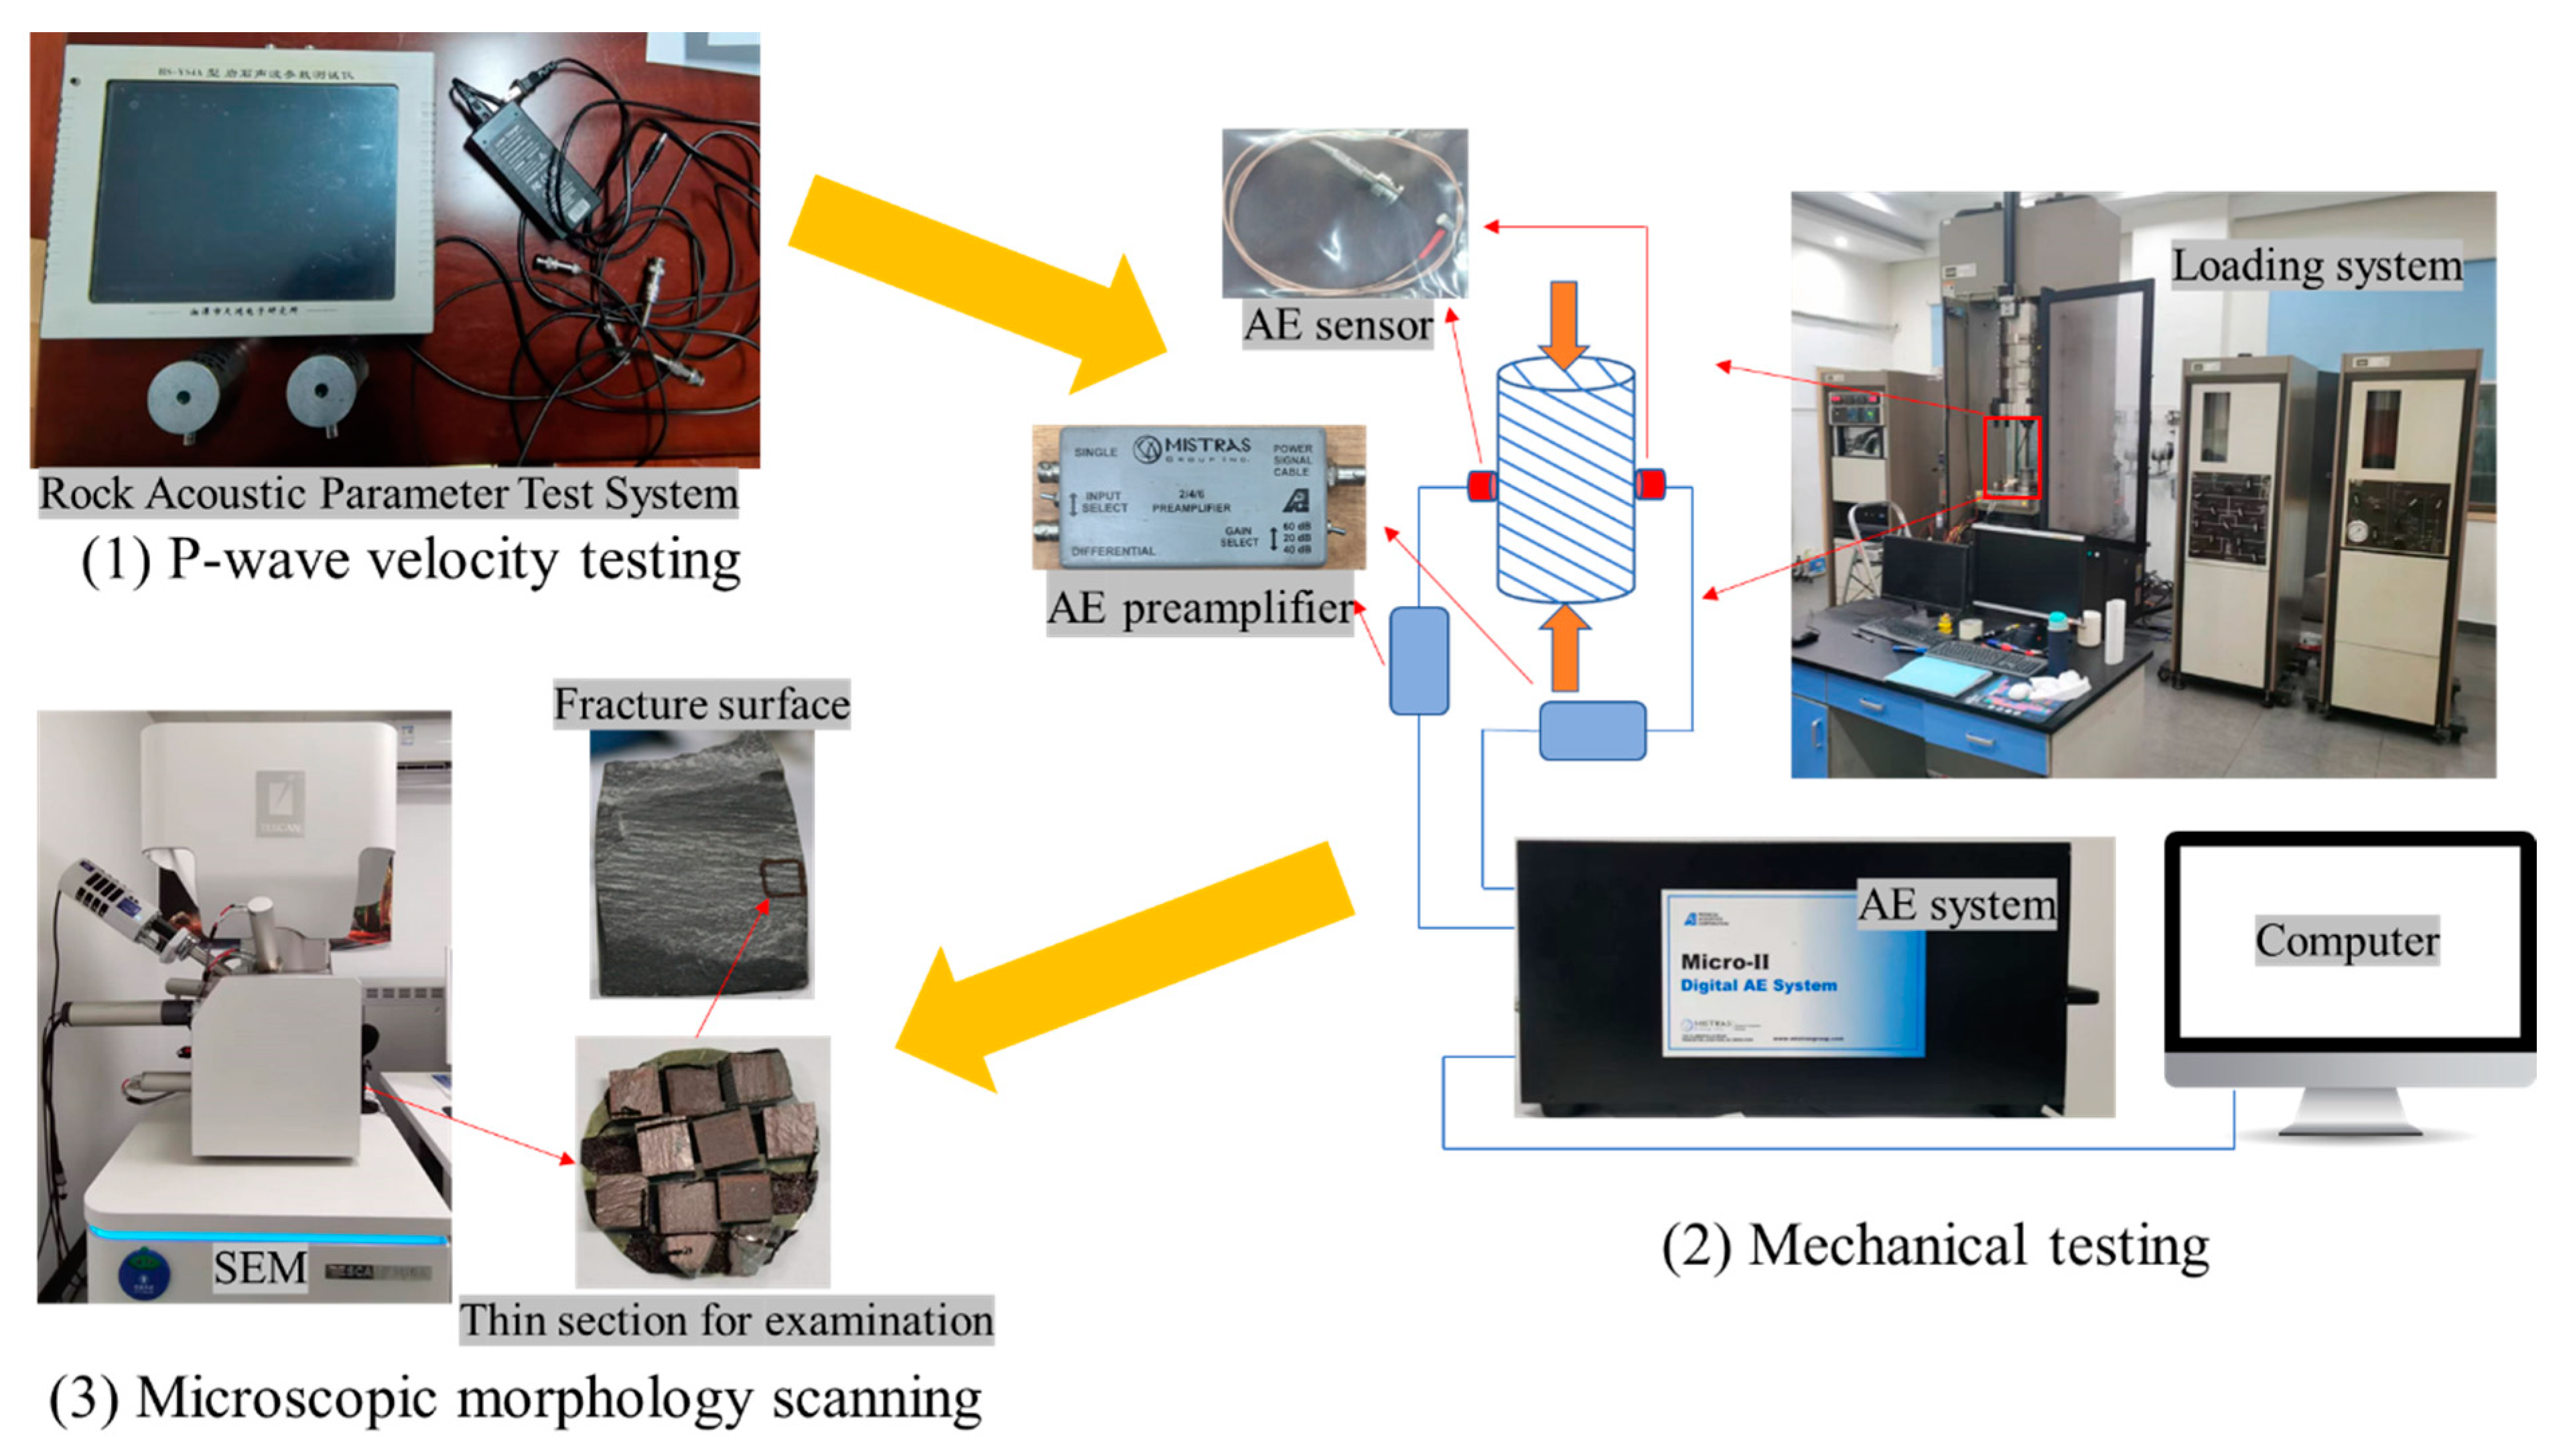
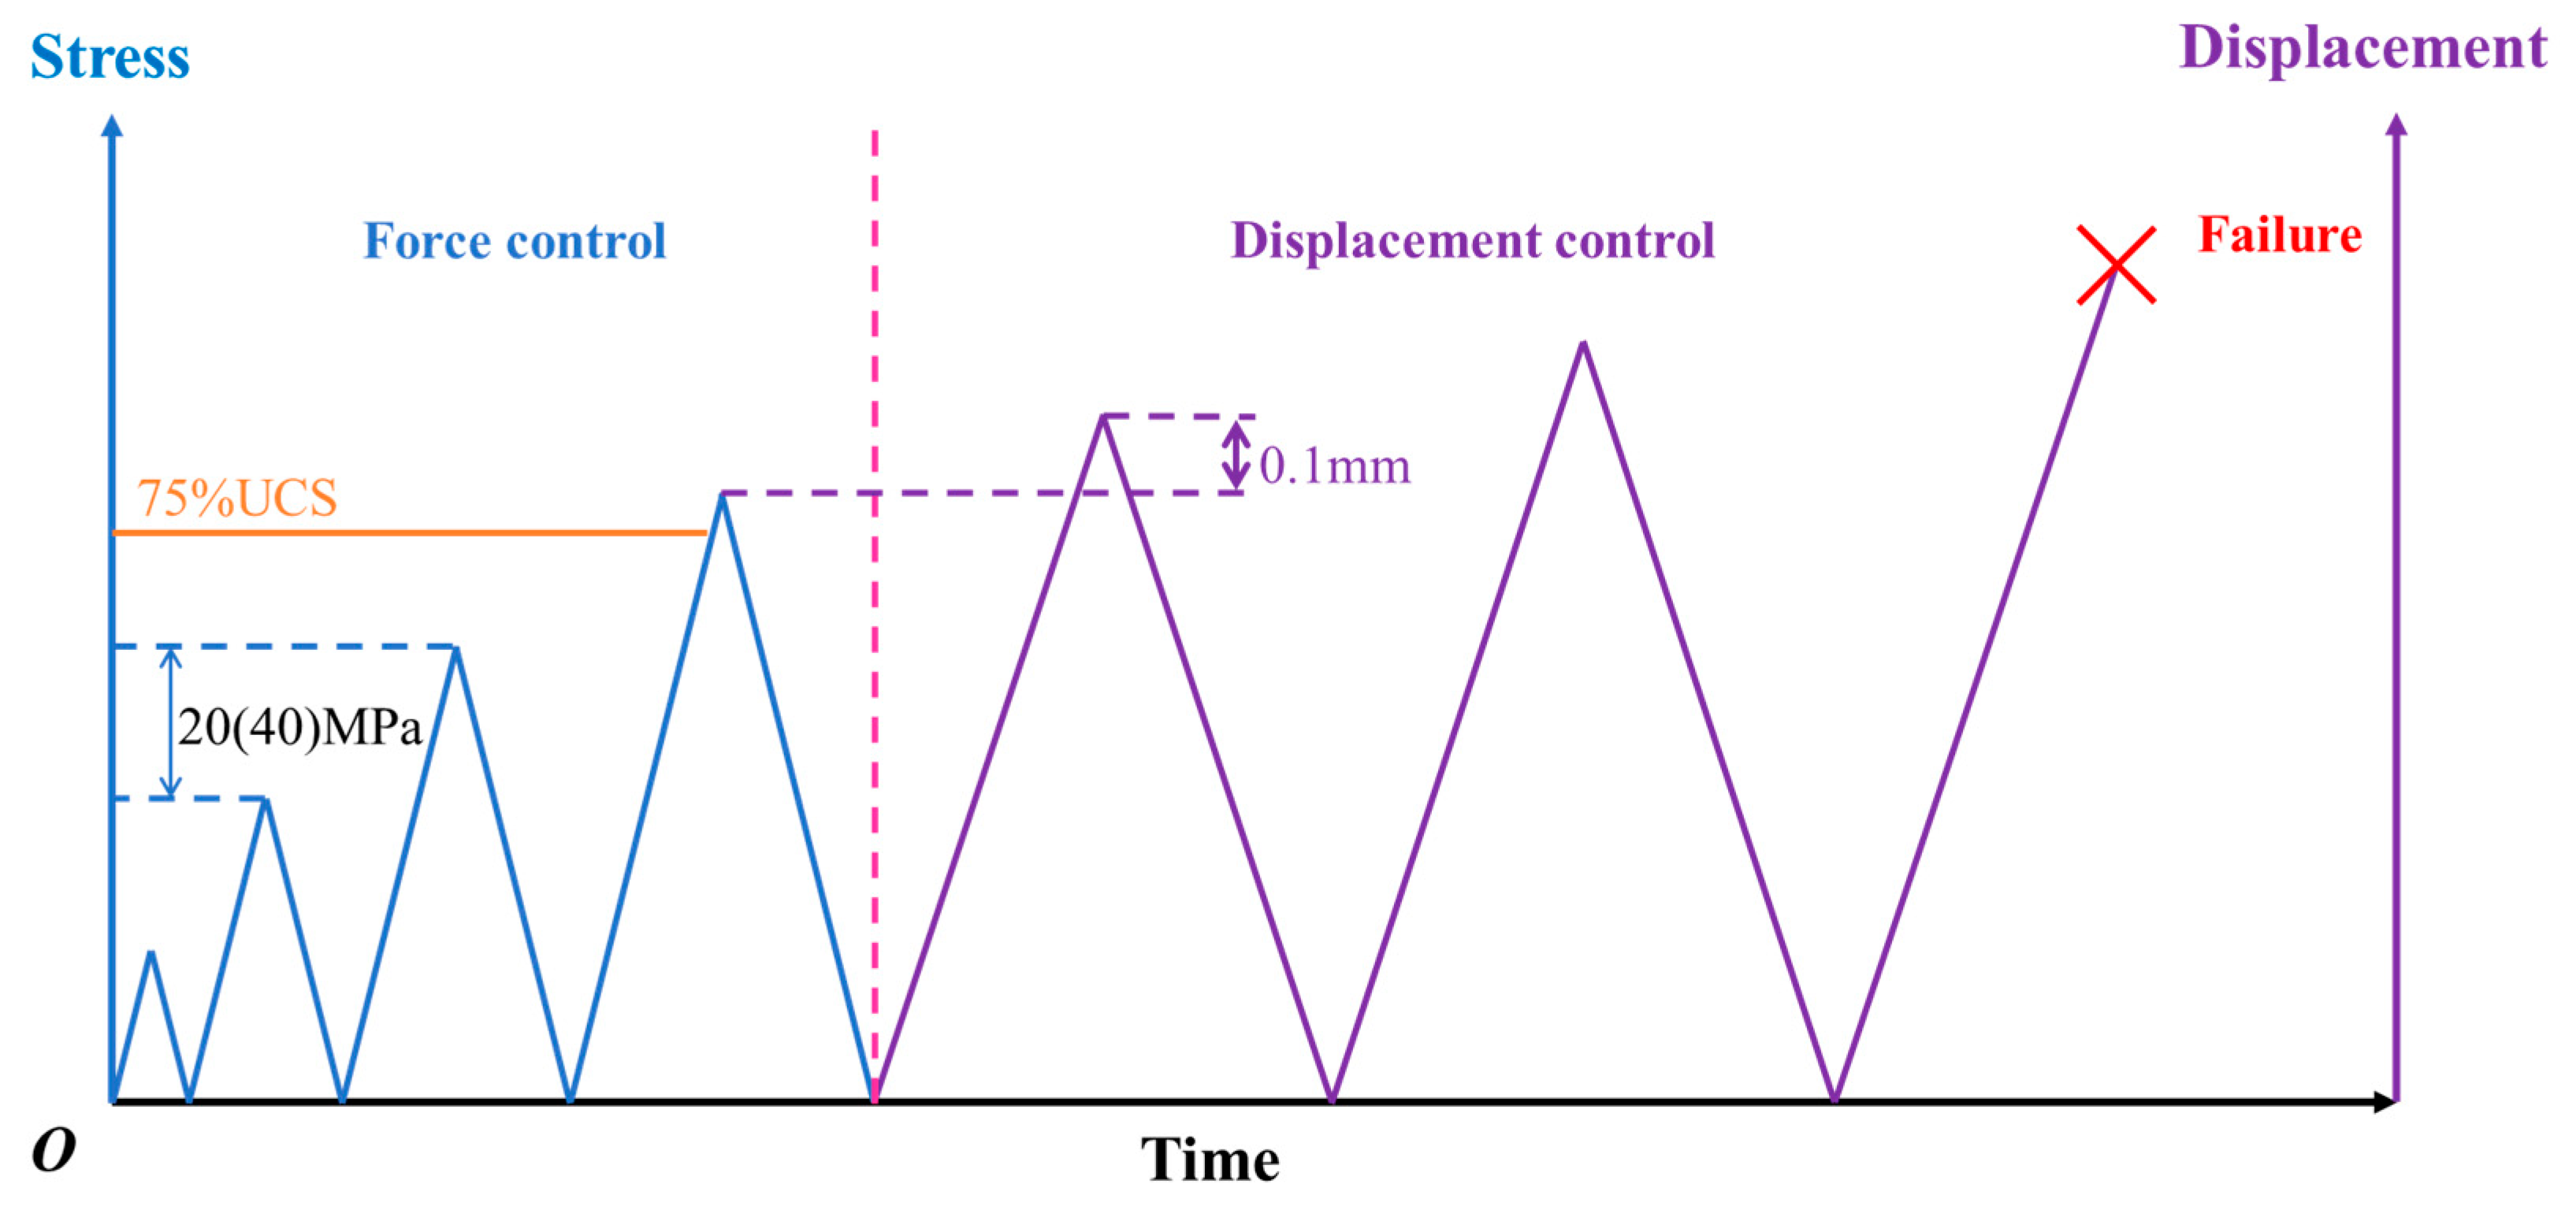
2.2. Test Equipment and Methods

The HS-YS4A Rock Acoustic Parameter Test System (Xiangtan Tianhong Electronic Research Institute, Xiangtan, China) is used to measure the P-wave velocity of the specimens. The MTS 815 rock test system (Mechanical Testing & Simulation, Eden Prairie, MN, USA) is used for the loading test, which has the maximum loading capacity of 4600 kN and the frame stiffness of 10,500 kN/mm. The Micro-II Digital AE System is employed to monitor the acoustic emission signals generated within the specimens during the testing process, and the amplitude threshold was set at 45 dB. After the rupture, the fracture was analyzed using the Scanning Electron Microscopy (SEM) technique. Figure 3 shows the test procedure and the test equipment.
All specimens are divided into two groups, on which the monotonic compression test and the cyclic-loading and unloading test are conducted. Table 1 shows the test scheme for slate specimens considering the loading path and the loading angle. The specimen is named as the loading path–foliation angle—cyclic stress step. For example, U-0 represents the specimen with a foliation angle of 0° under monotonic loading, and C-30-20 represents the specimen with a foliation angle of 30° under cyclic loading and unloading with the cyclic stress step of 20 MPa. The monotonic compression test is performed by displacement loading at a rate of 0.06 mm/min, until the specimen failure. For the cyclic-loading and unloading test, as illustrated in Figure 4, the load is first applied at a rate of 0.5 MPa/s, with increments of 20 or 40 MPa per stage. Once the upper stress of the cyclic loading reaches about 75% of the uniaxial compressive strength (UCS), the loading mode is changed to the displacement loading with a rate of 0.06 mm/min, and the increment of each stage is 0.1 mm.

3. Results and Discussion

3.1. Mechanical Properties

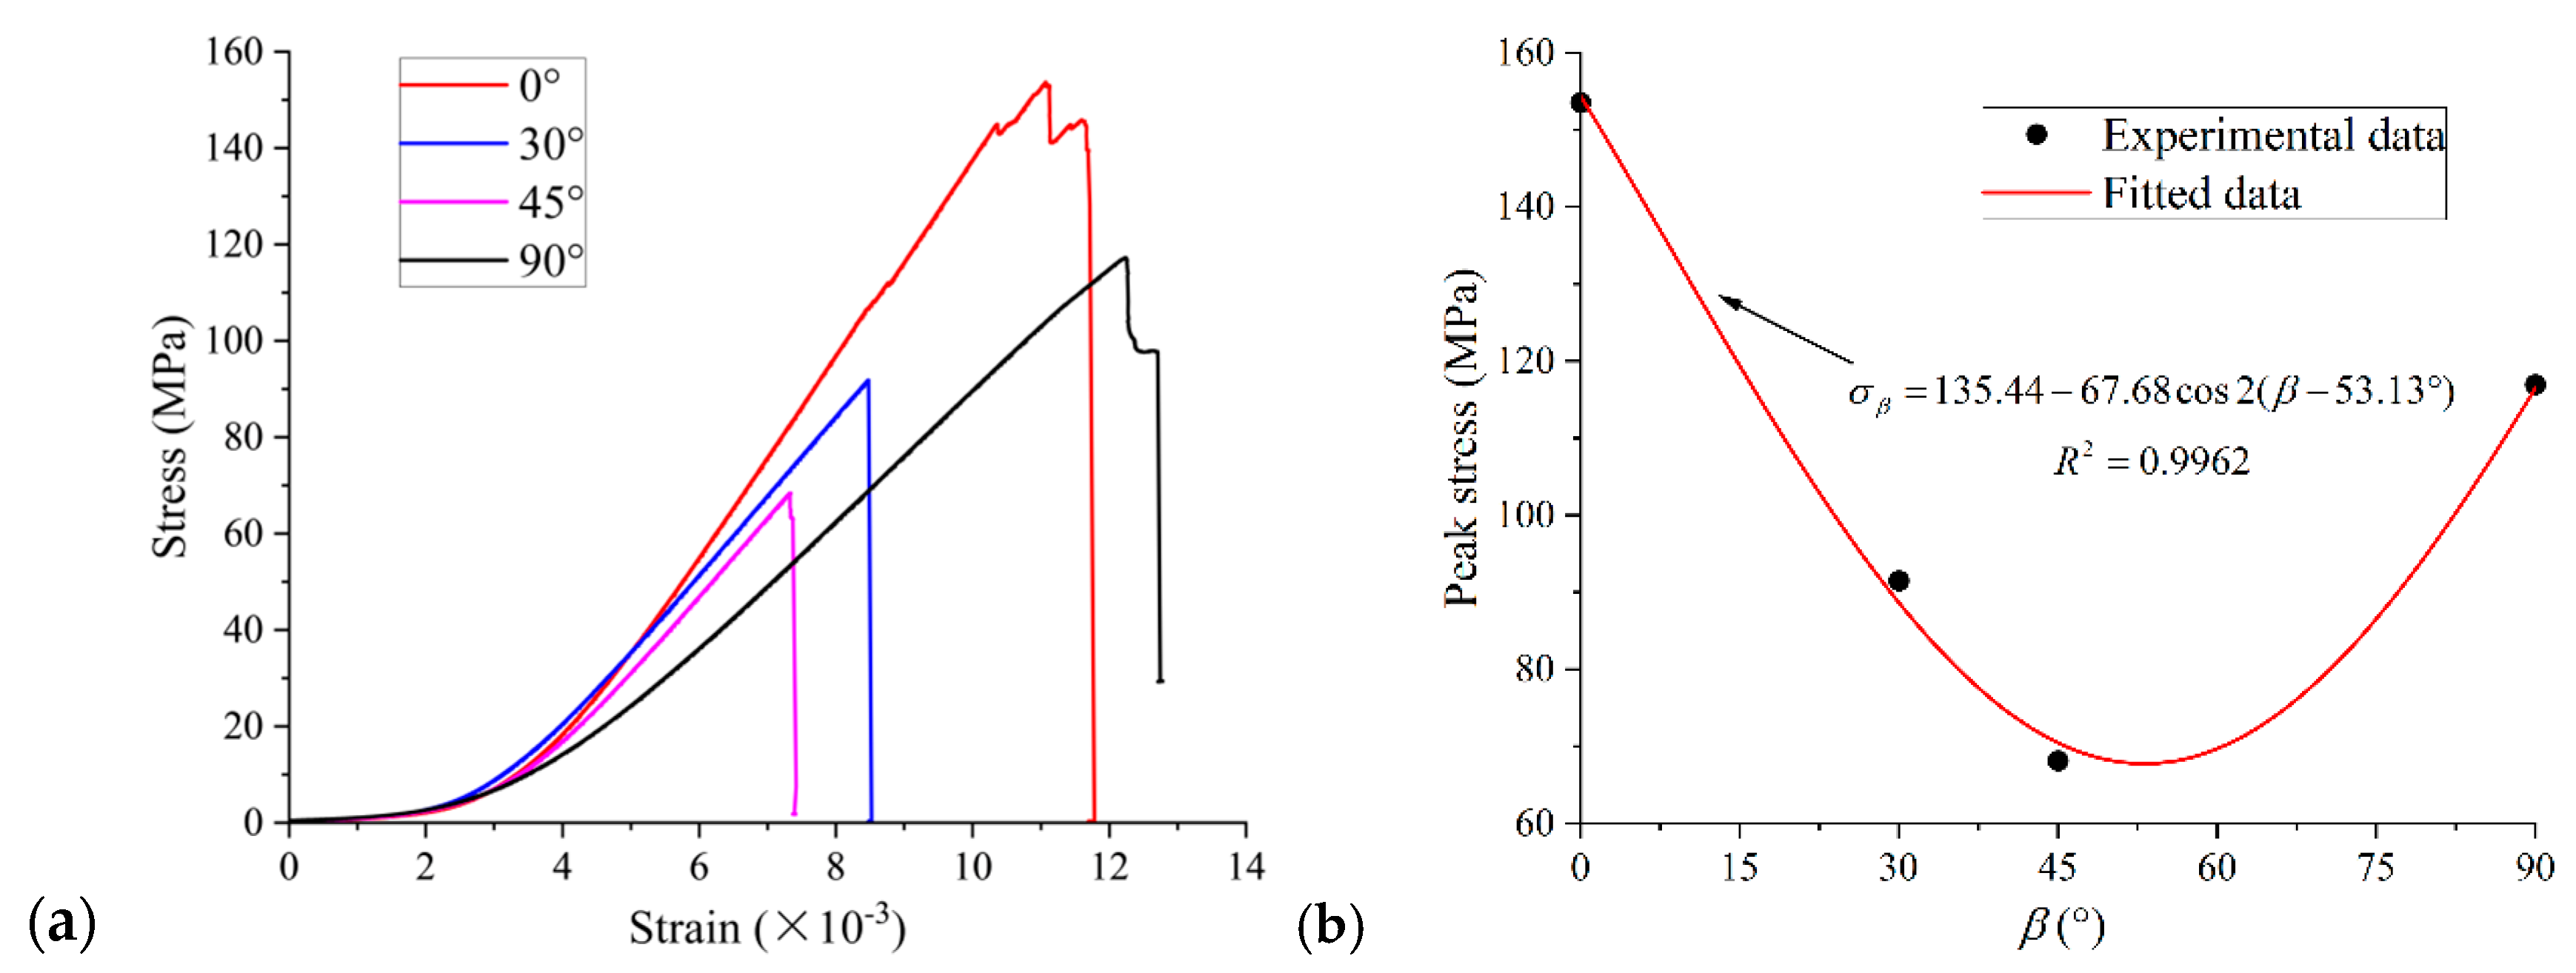
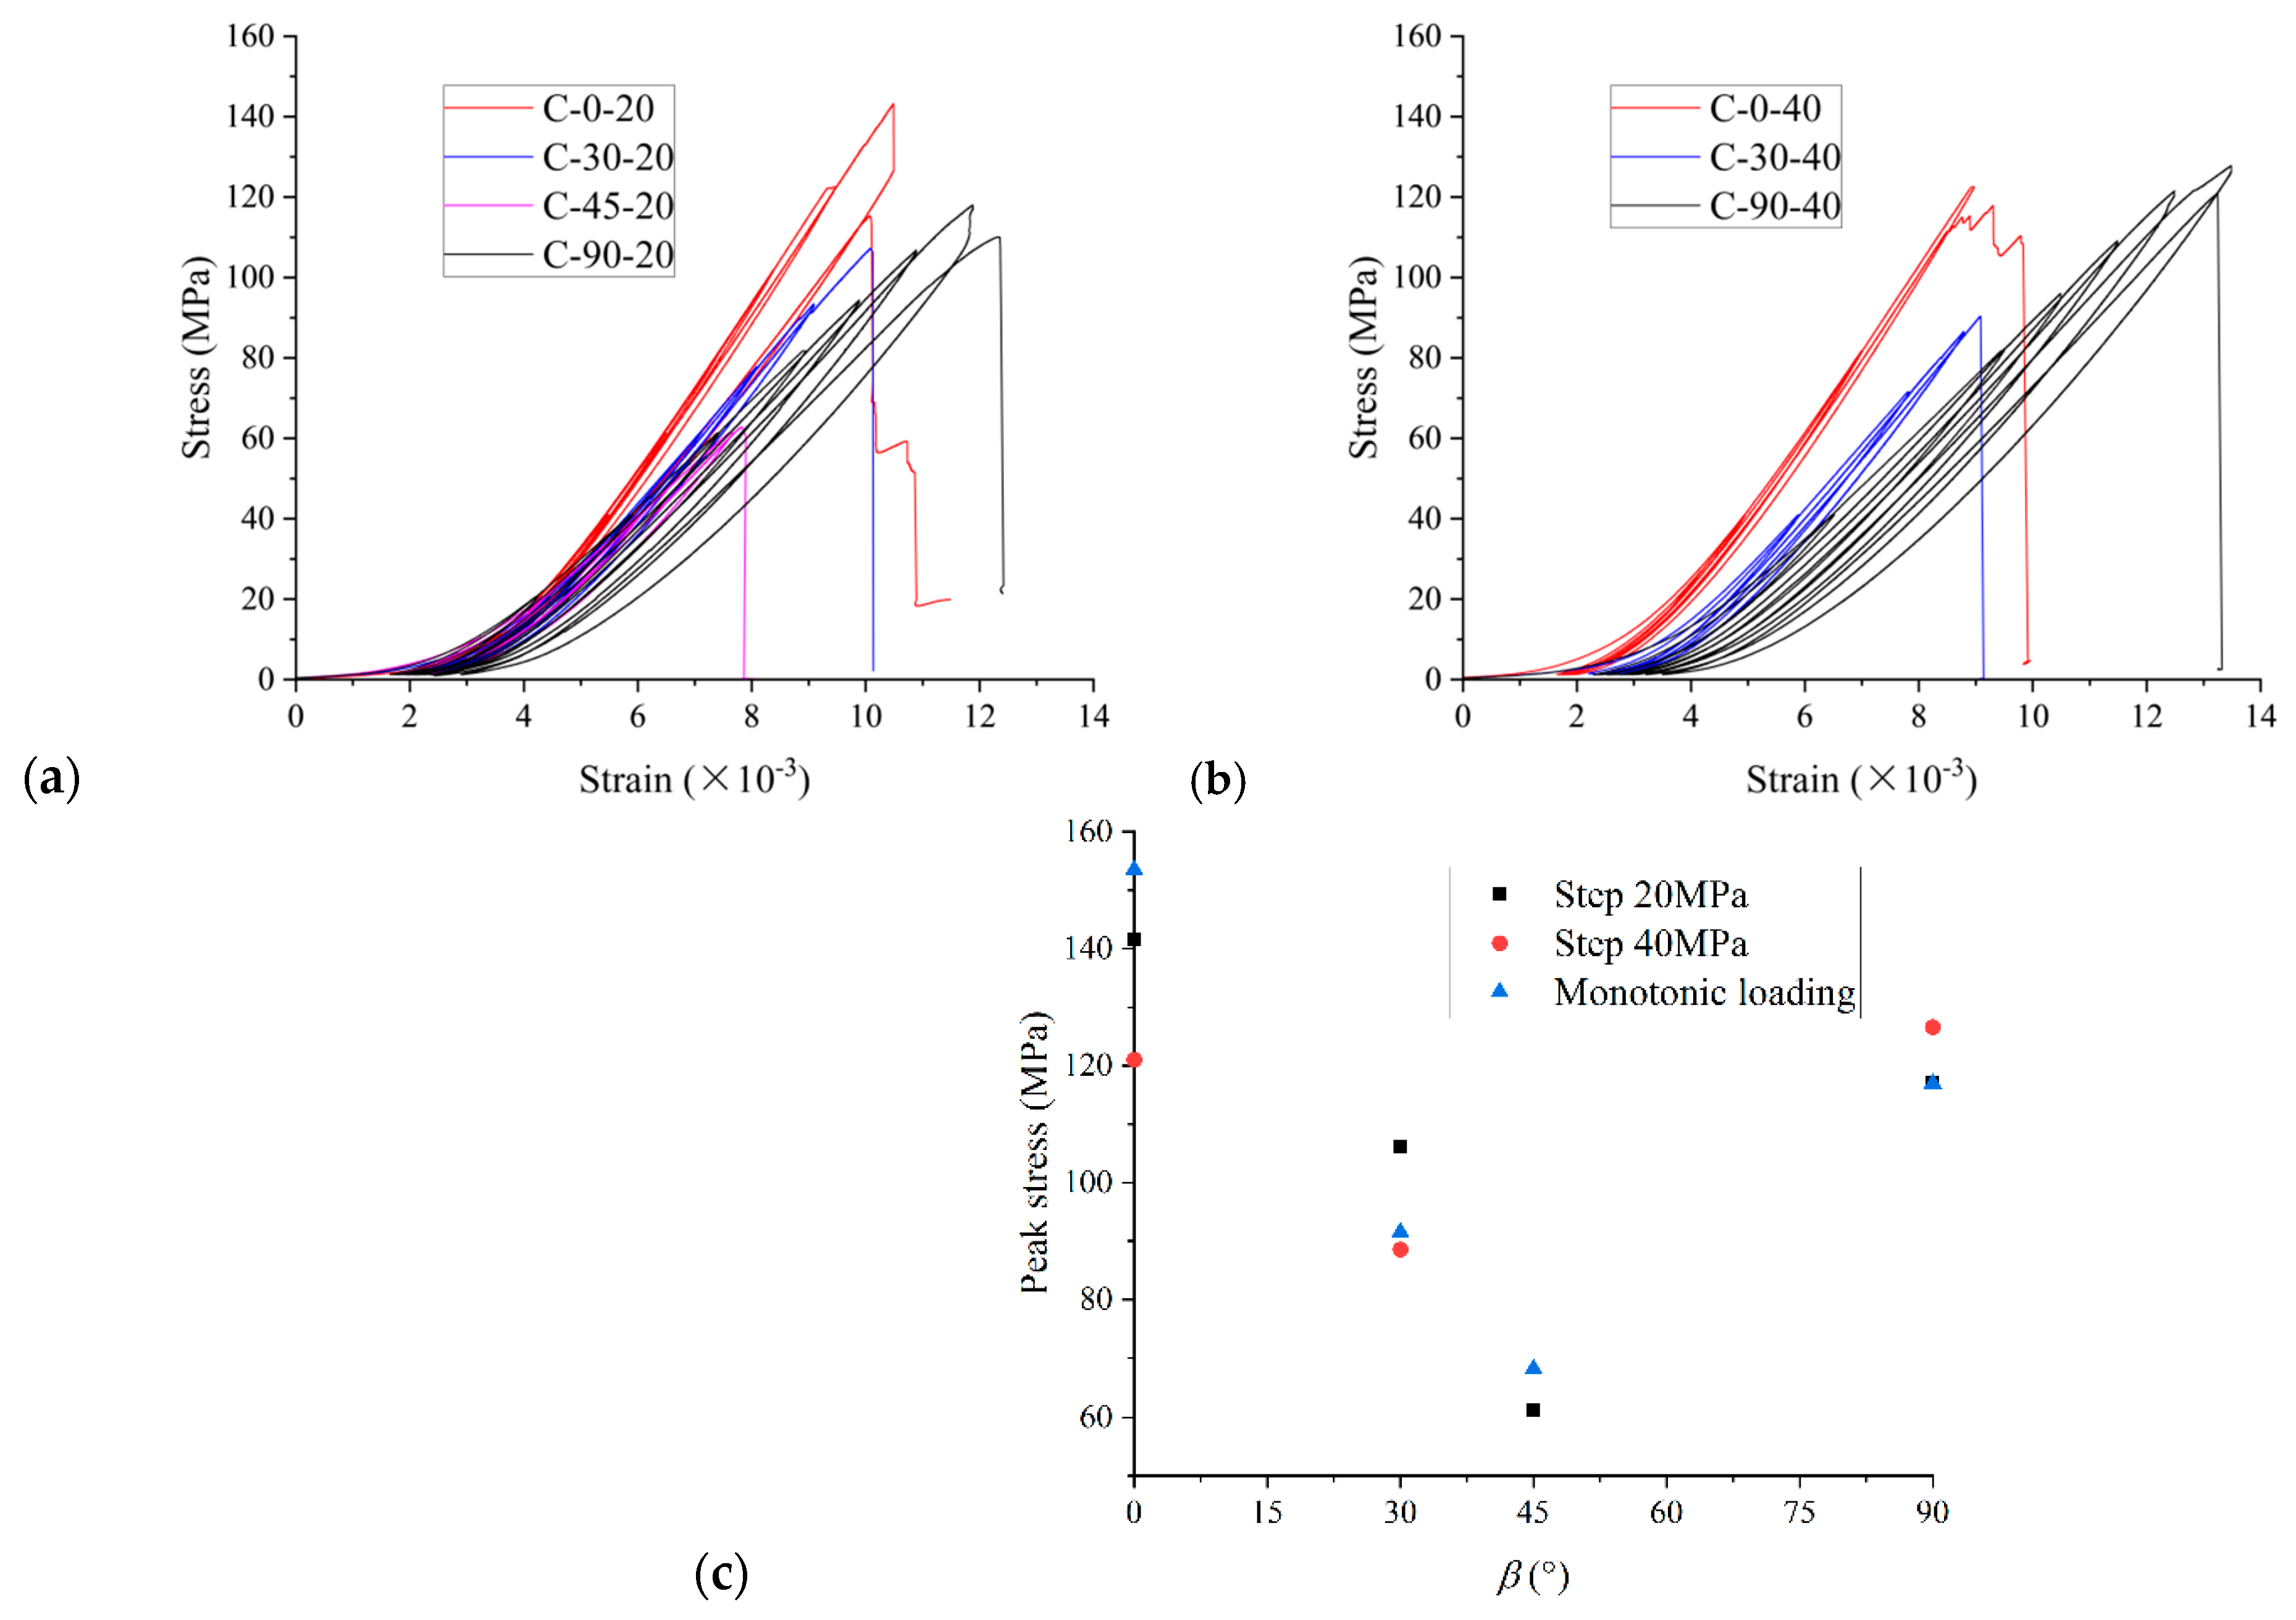
3.1.1. Peak Strength

Figure 5 demonstrates the stress–strain curves and the peak strengths of specimens at different loading–foliation angles under monotonic loading. The specimens, in a decreasing order of strength, correspond to those at loading–foliation angles of 0°, 90°, 30°, and 45°. The empirical equation first proposed by Jaeger [34] and then improved by Donath [35] can capture the strength variation in specimens with the loading–foliation angle [36], as expressed by
σ β = A D cos 2 ( β β min )
where σβ denotes the uniaxial compressive strength of the specimen at the loading–foliation angle of β; βmin denotes the angle β corresponding to the minimum strength, and A and D are two constants.
The curve fitted according to Equation (1) and the expression of the fitted equation are shown in Figure 5b. From the fitting results, it can be deduced that the strength of the specimen reaches the minimum when the loading–foliation angle is about 53°.
Figure 6 illustrates the stress–strain curves of specimens at different loading–foliation angles under cyclic loading, and the peak strengths of all specimens, including those under the monotonic loading, as a function of the loading–foliation angle. The results show that the variation trend in peak strength of specimens with the loading–foliation angle under cyclic loading is very similar to that under monotonic loading, presenting a U-type, which is consistent with the results obtained by Zhang et al. [37].

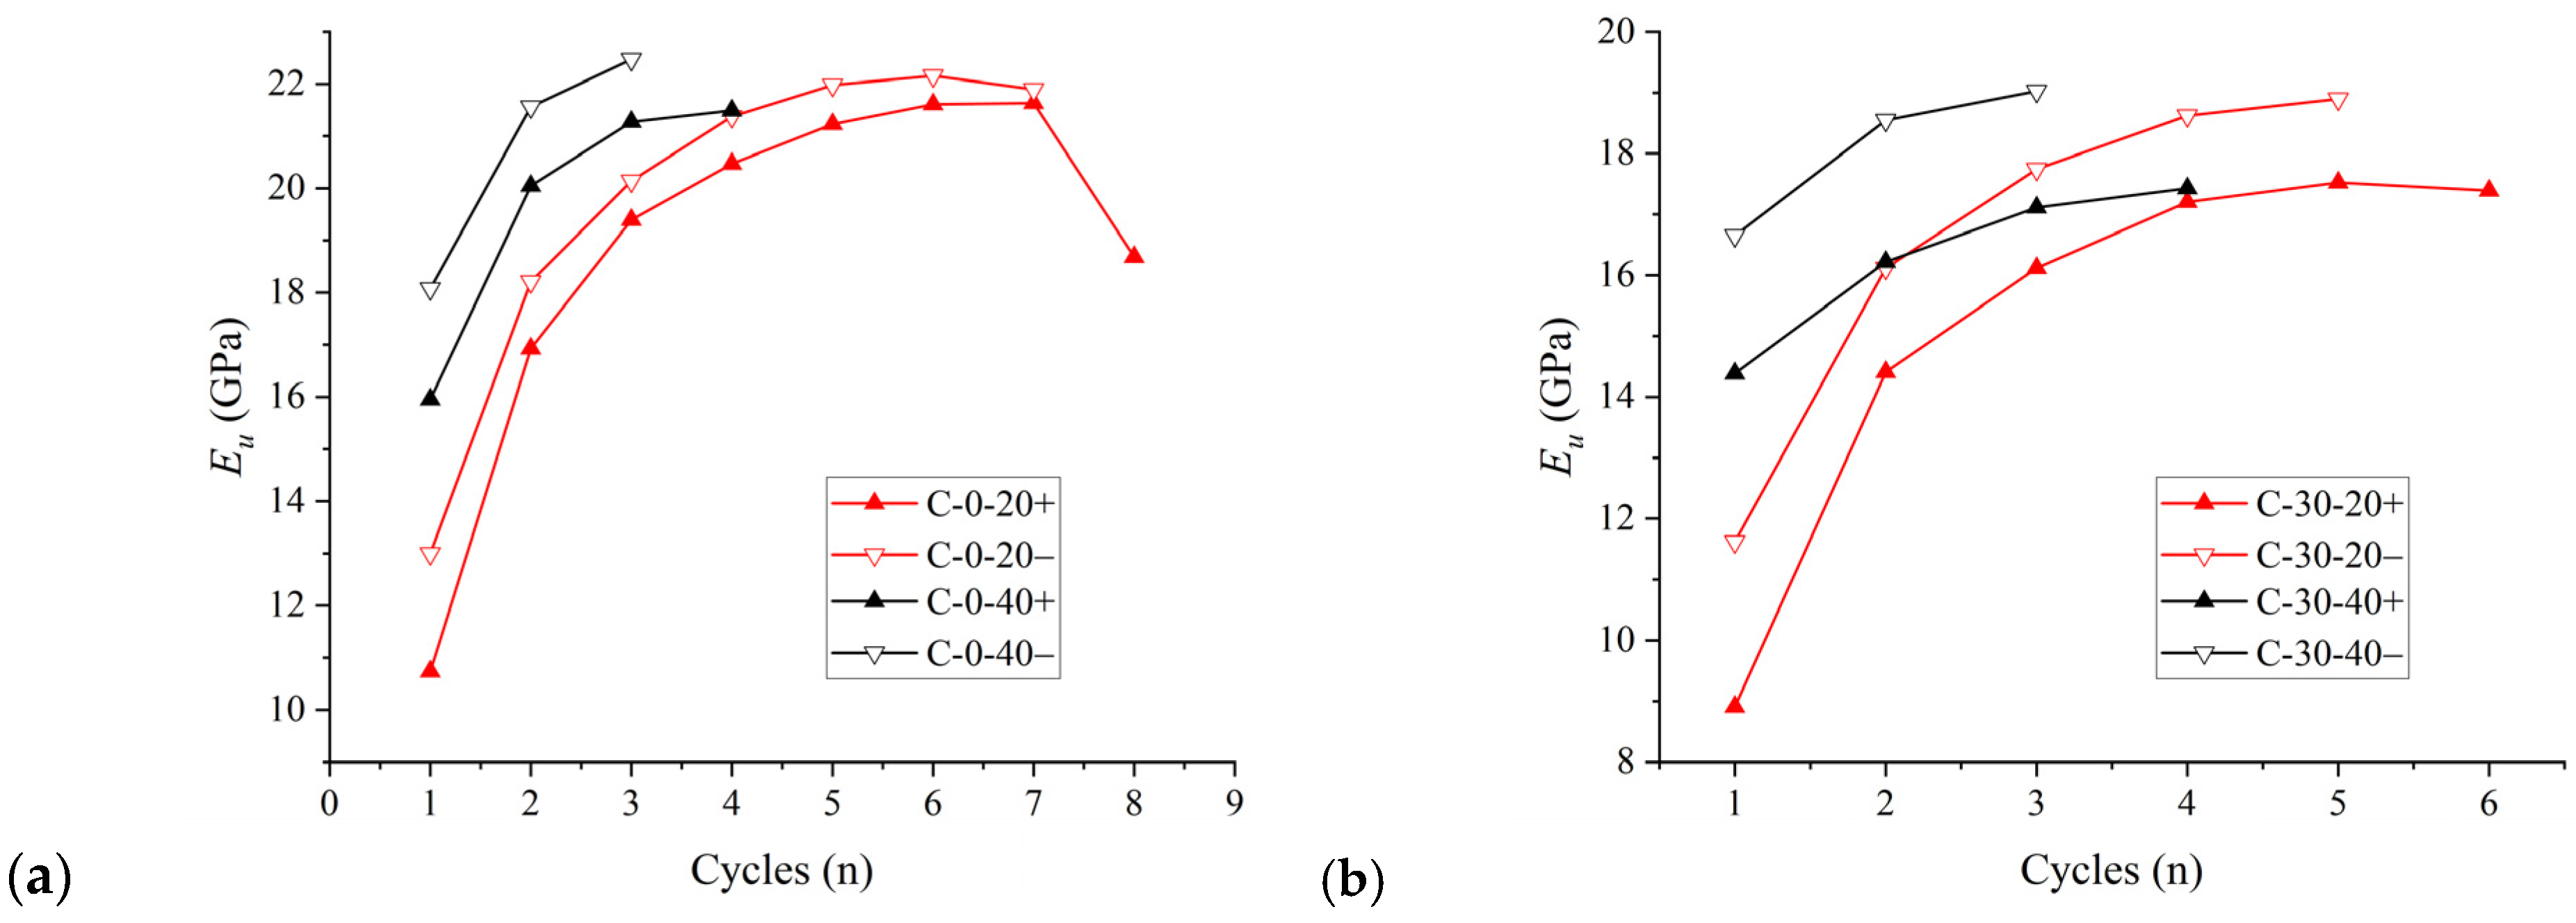
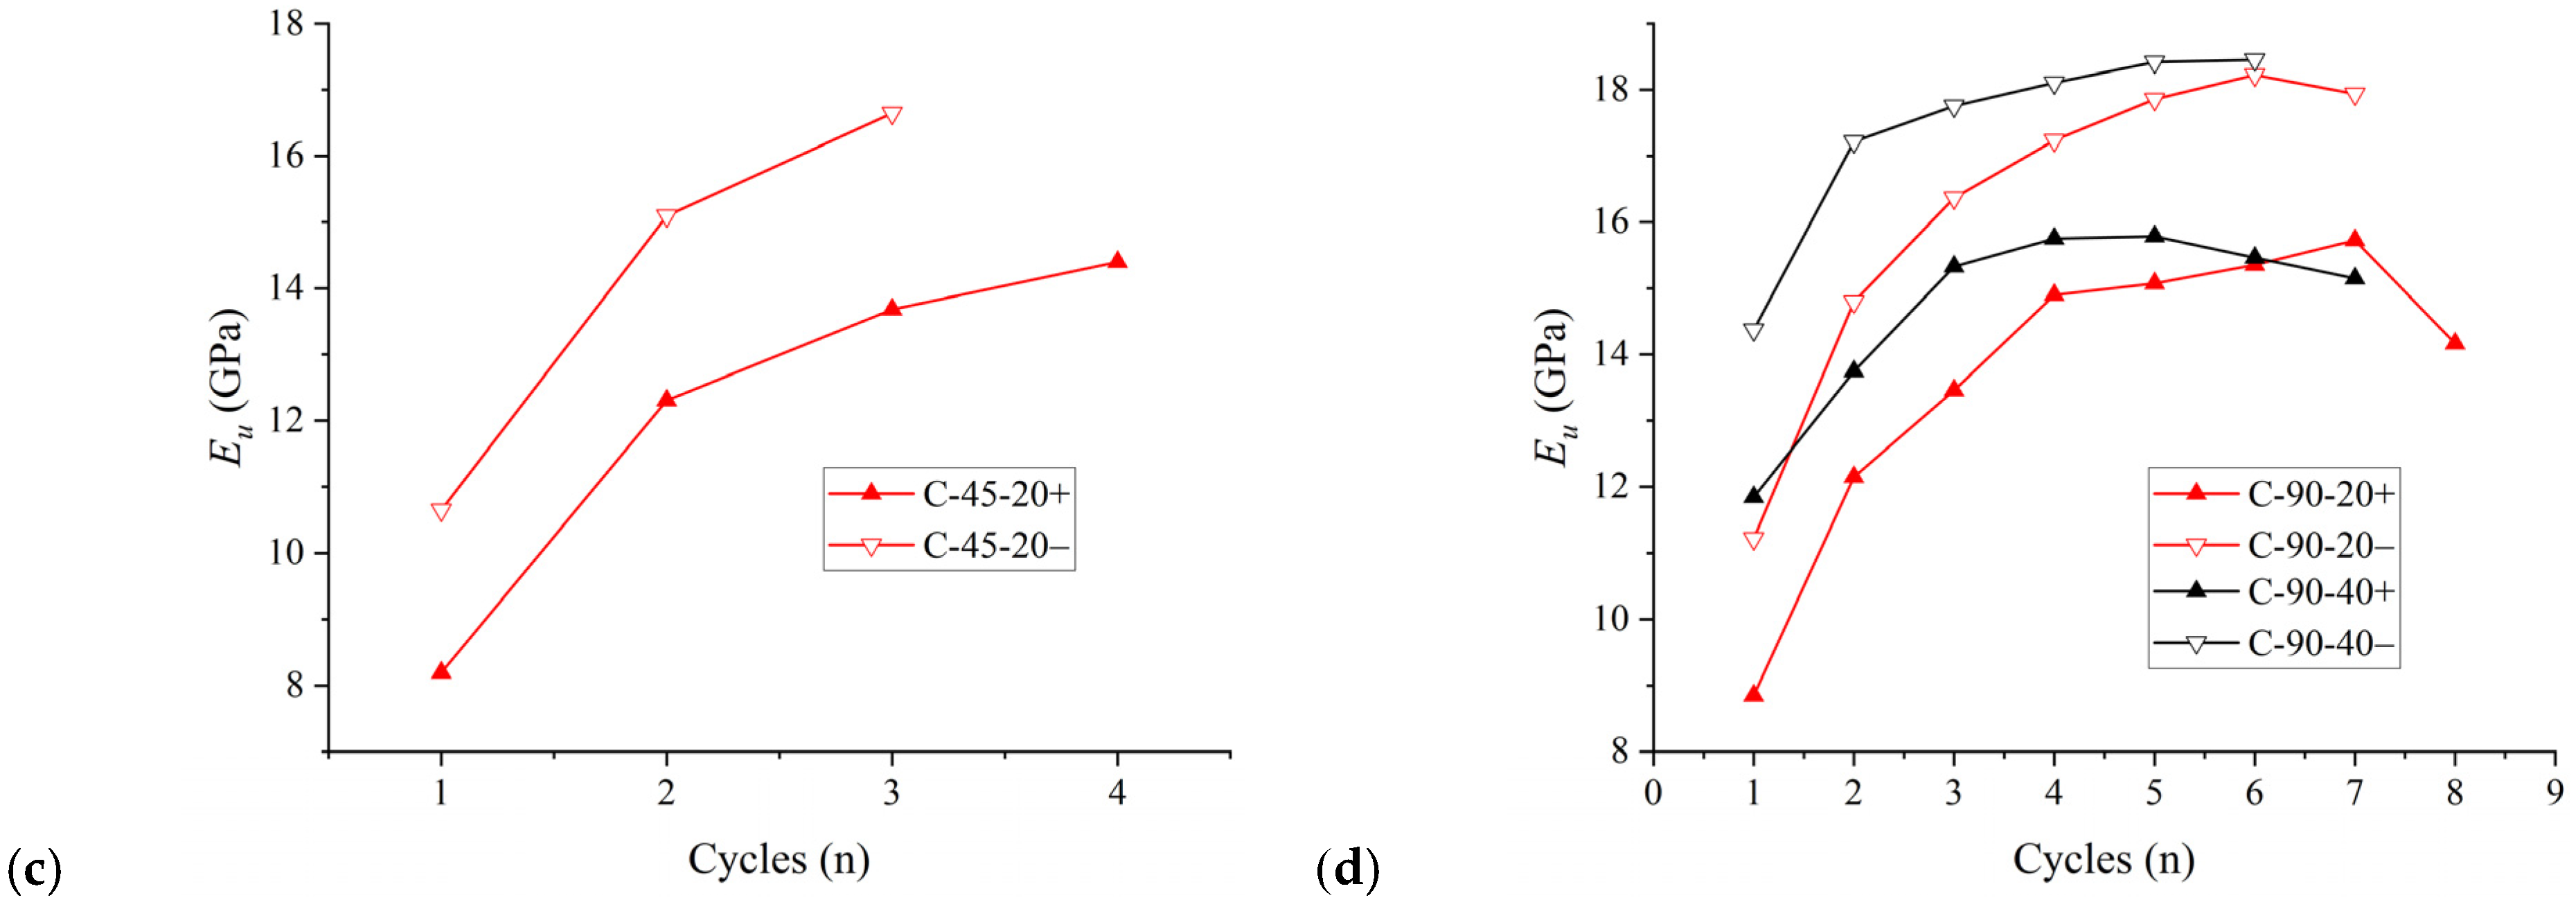
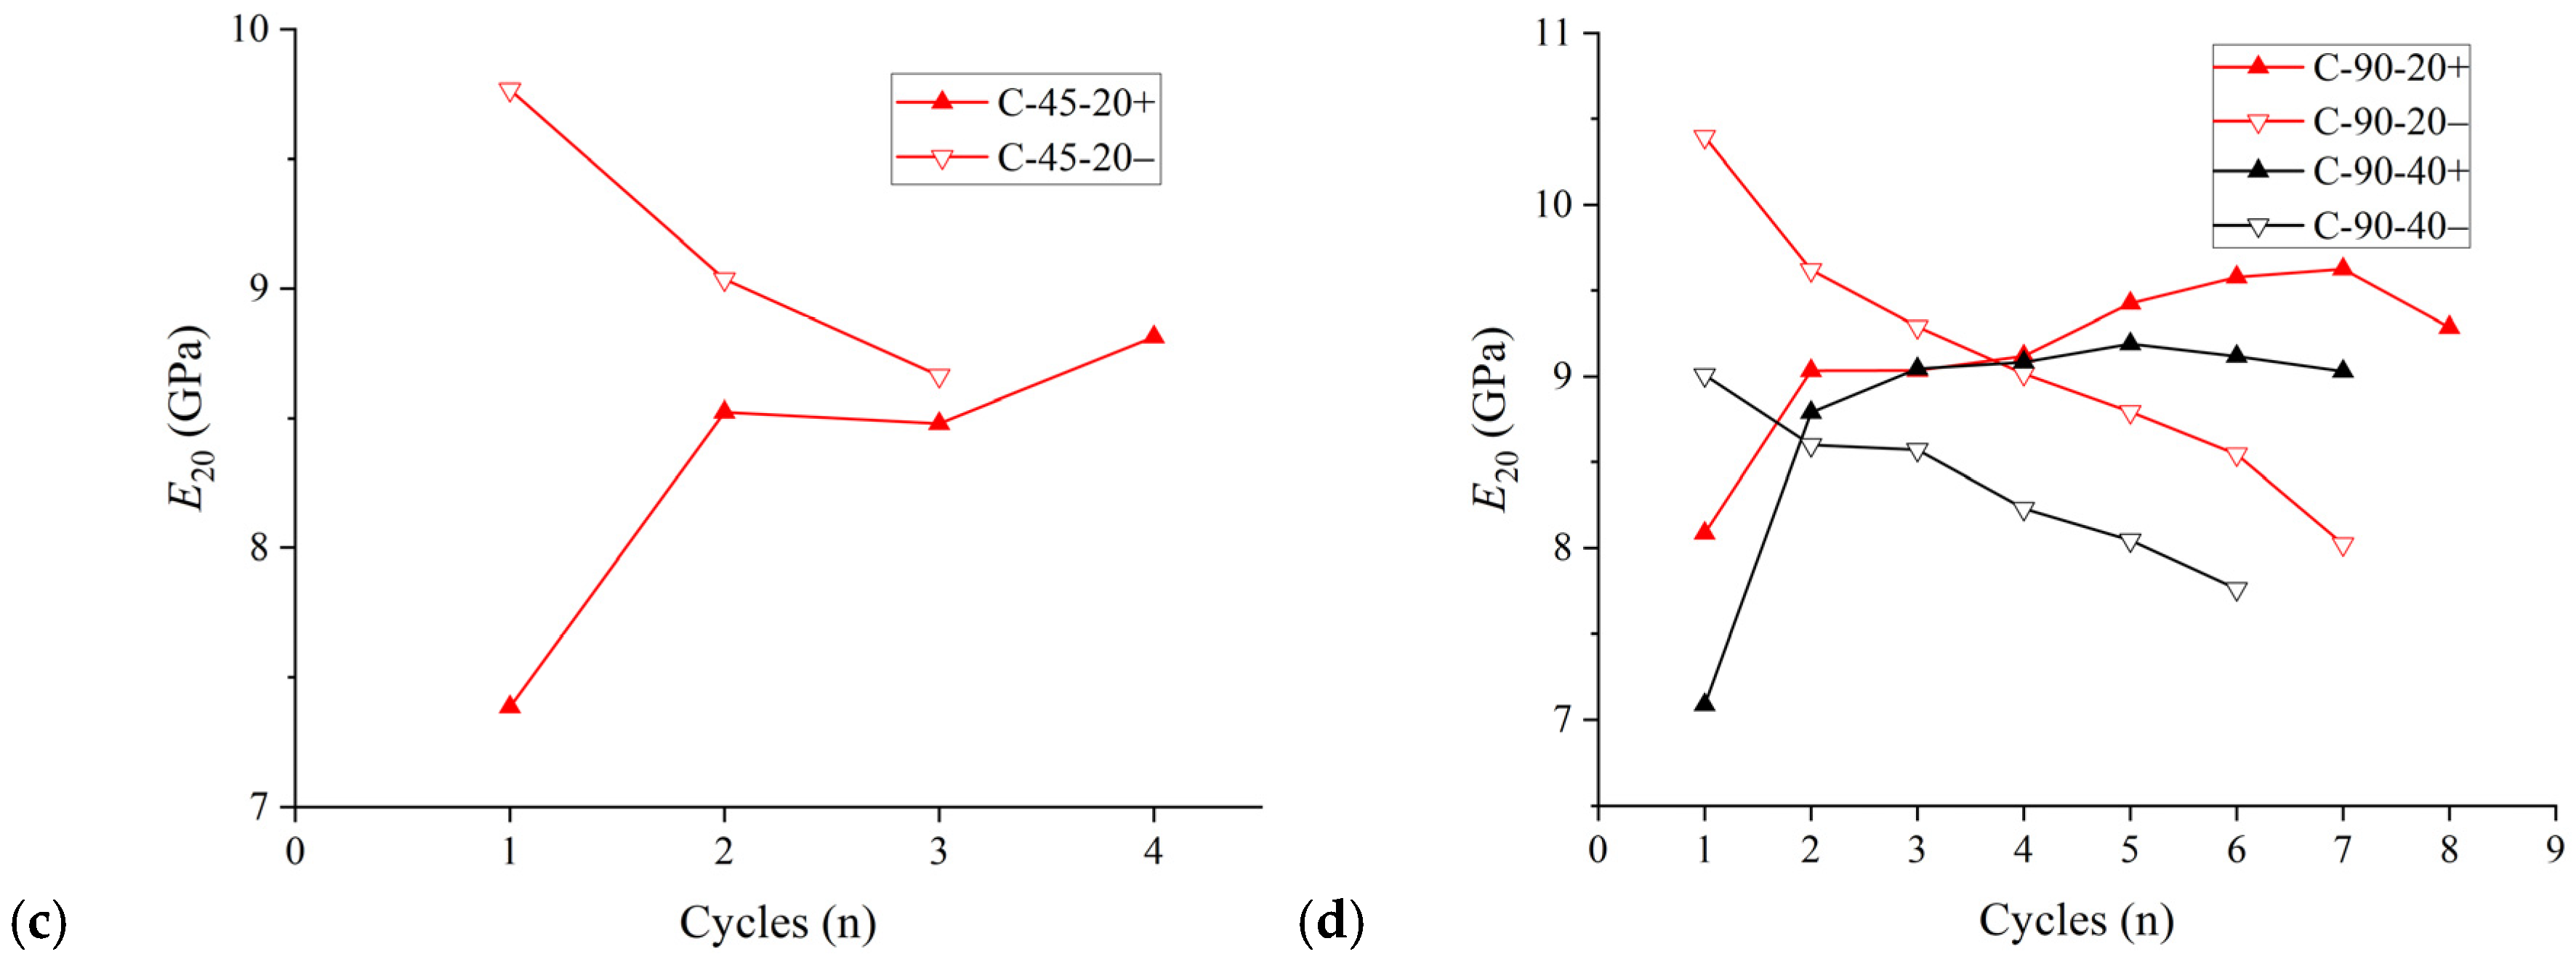
3.1.2. Elastic Modulus

In this study, the slope of the stress–strain curve in the 45~55% section of the peak strength is taken as the elastic modulus. The elastic moduli of specimens at different loading–foliation angles are listed in Table 2. The results show that the elastic modulus of the slate specimen gradually decreases with the loading–foliation angle, exhibiting a strong anisotropy. This variation in the trend of the elastic modulus, following the transversely isotropic model, has also been observed in other transversely isotropic rocks, e.g., Asan gneiss, Boryeong shale and Yeoncheon schist [38]. This phenomenon can be explained as follows: since the stiffness of the foliation is much lower than that of the rock matrix, the deformation of the rock mainly depends on the deformation of the foliation; as the loading–foliation angle is gradually increased from 0° to 90°, the stress acting on the foliation will increase, resulting in an increase in the deformation of the foliation, and the overall elastic modulus of the specimen shows a gradually decreasing trend.

3.2. Damage Evolution

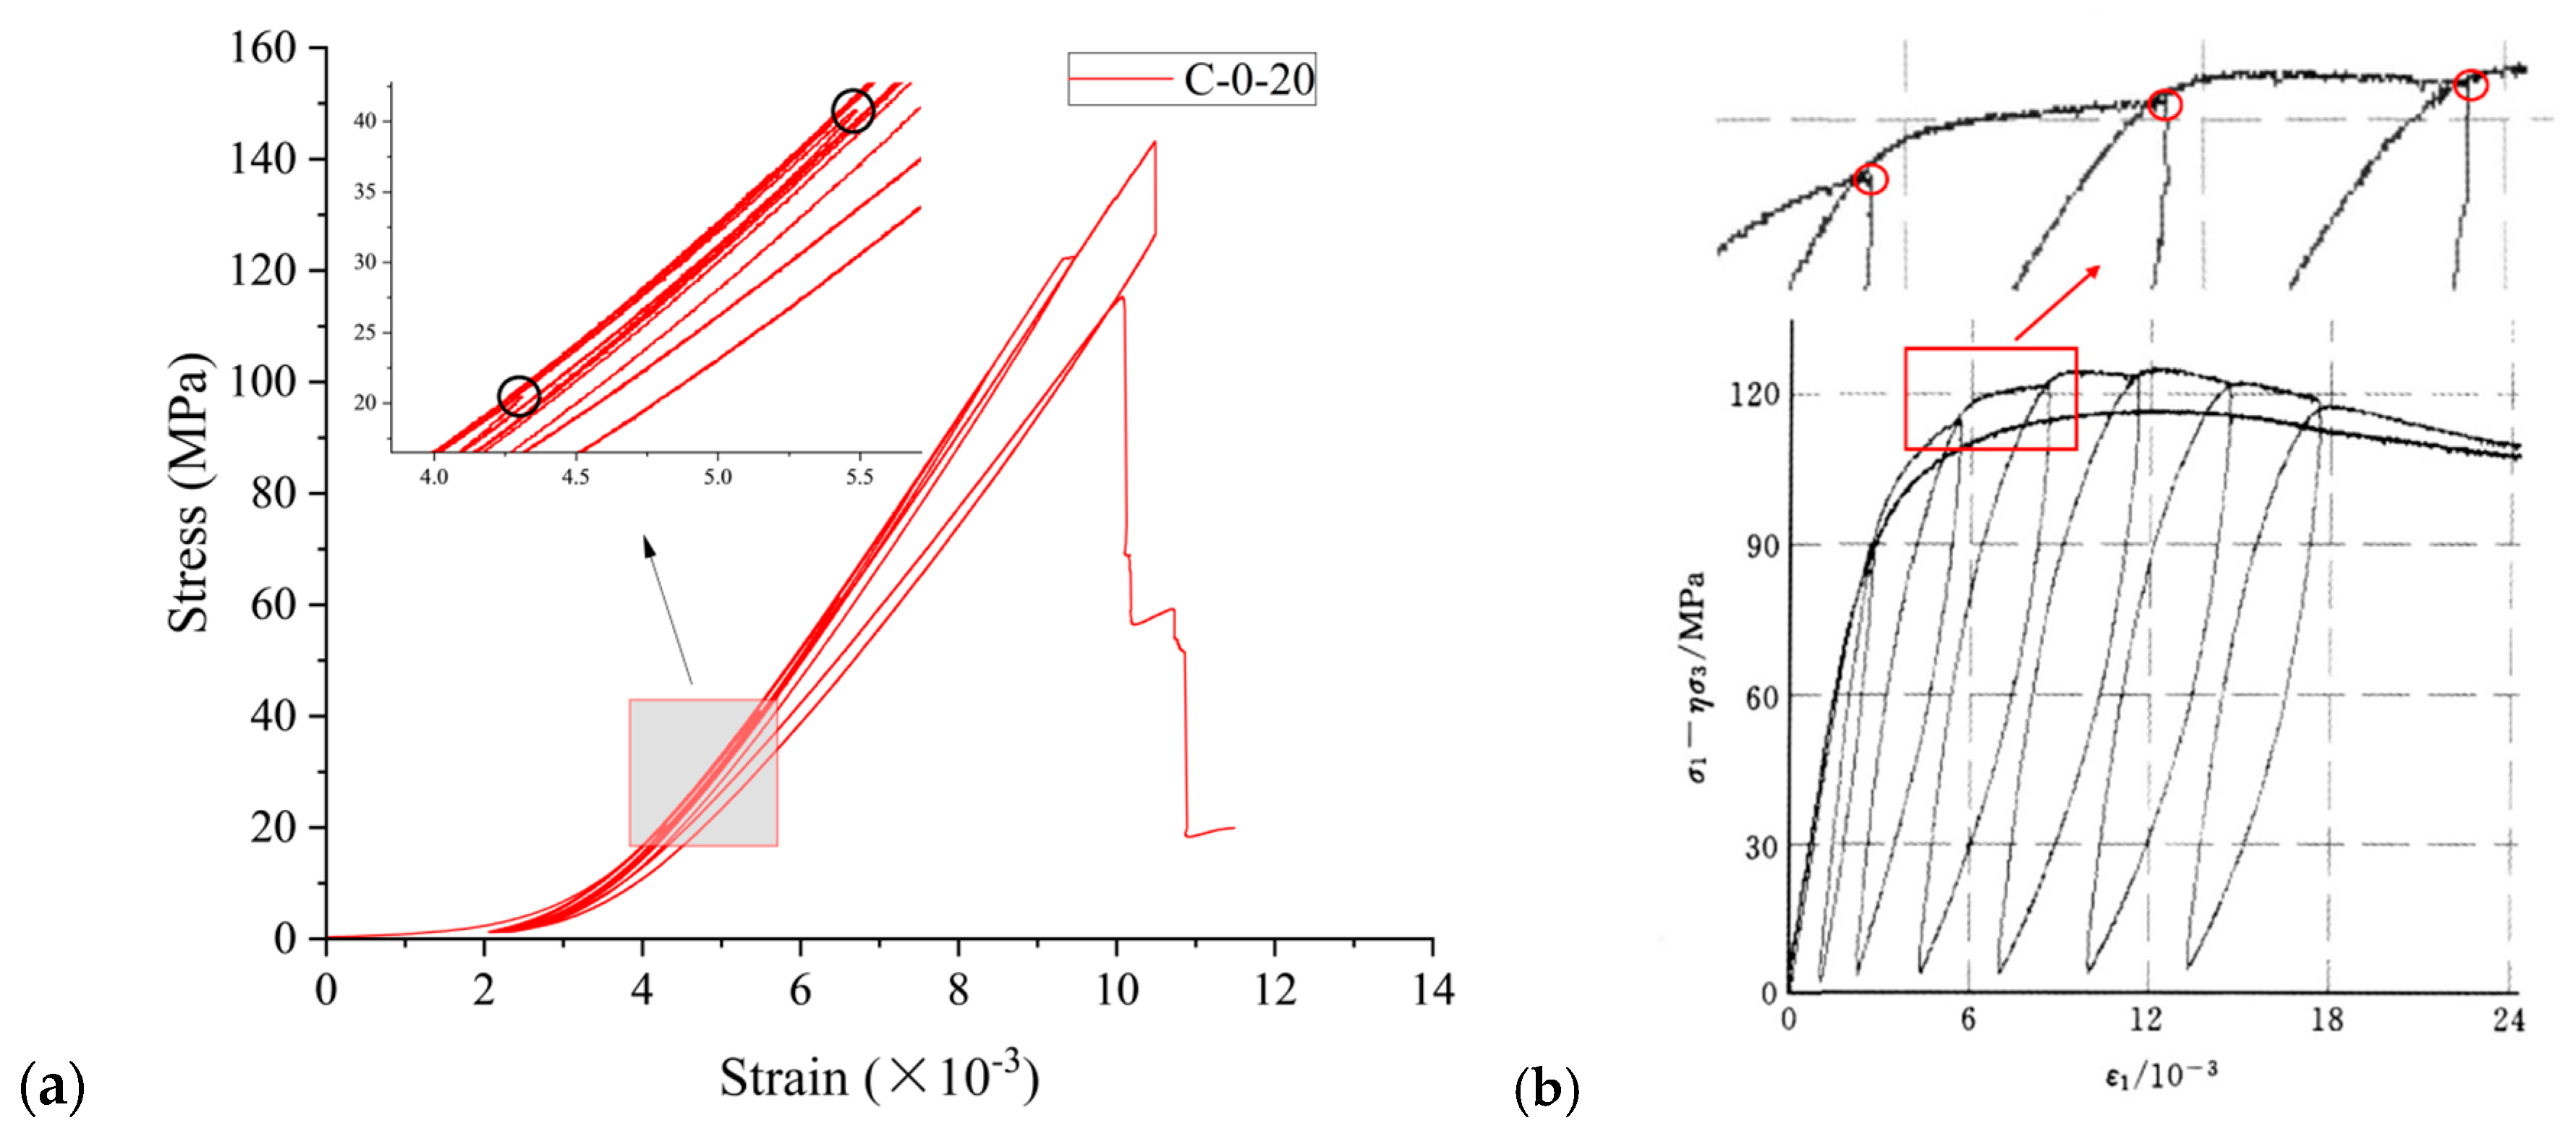
3.2.1. Deformation Evolution Process

When rocks are subject to cyclic loading, their physical and mechanical parameters will change, and the changes in these parameters can often reflect the internal conditions of rocks. The secant modulus is a deformation parameter that responds to the relationship between the stress increment and strain increment of material over a certain interval, which can reflect the damage degree within the rock, to some extent [39]. In order to study the damage process of rock specimens under cyclic loading, we analyze the secant moduli at three different locations selected in each cycle of the stress–strain curve. They are the secant modulus Eu at 80% of the upper stress of each cycle, the secant modulus E20 for the part of the stress value below 20 MPa, and the secant modulus Es at 20 MPa, respectively. The specific calculations are explained by the following equations:
E u , n = σ 0.8 u , n σ 0.8 u 5 , n ε 0.8 u , n ε 0.8 u 5 , n
E 20 , n = σ 20 , n σ l , n ε 20 , n ε l , n
E s , n = σ 20 , n ε 20 , n
where n denotes the nth cycle; σ0.8u,n and ε0.8u,n denote the stress and strain values corresponding to the location of 80% of the upper stress in the stress–strain curve of the nth cycle (in the following, the statement about the nth cycle is omitted), respectively; σ0.8u−5,n and ε0.8u−5,n denote the stress and strain at the point corresponding to 80% of the upper limit of stress minus 5MPa in the curve; σ20,n and ε20,n denote the values of stress and strain corresponding to the position of stress of 20 MPa; and σl,n and εl,n denote the corresponding stress and strain at the location of the lower stress limit. In order to differentiate between the loading phase and the unloading phase, the mechanical parameters in the loading phase are denoted by a superscript “+”, and those in the unloading phase are denoted by a superscript “−”, e.g., E+ and E.
Figure 7 illustrates the evolution of Eu+ and Eu of specimens at different loading–foliation angles under cyclic loading. Regardless of the loading–foliation angle and the cyclic stress step, Eu+ and Eu show a similar variation trend, in that as the cycle number increases, they first increase, accompanied by the increments reducing gradually, and then level off or even start to decrease. This indicates that the specimen is stiffer at higher stress levels. With increasing cycle number, the damage inside the specimen accumulates to a certain value, and then Eu+ and Eu begin to decrease. It is also suggested that the damage within the rock specimen has a weakening effect on Eu+ and Eu. Apart from that, Eu+ is always smaller than Eu in each cycle, which can be attributed to the fact that specimens are deformed both elastically and plastically during the loading process, whereas only the elastic part of the deformation recovers during the unloading process, macroscopically manifested by the accumulation of irreversible deformation at the end of each cycle.
As shown in Figure 8, the evolutions of E20+ and E20 with the cycle number are very different. As the cycle number increases, E20+ initially increases and then levels off, and finally decreases. In contrast, E20 shows a tendency to decrease with the cycle number throughout the loading process. In each cycle, E20+ is simultaneously strengthened by the compaction effect and weakened by the damage effect. In the initial stage, as the damage degree of the specimen is low, E20+ is mainly strengthened by the compaction effect. Approaching the failure, the damage degree of the specimen becomes higher, and the damage effect plays the dominant role. On the other hand, E20 is based on the end part of a cycle where the specimen has already experienced a high level of stress compaction, resulting in the specimen being mainly affected by the damage effect. Comparing E20+ and E20 within one cycle, it can be found that with the increasing cycle number the value of E20+ is first smaller than, and then exceeds, the value of E20. In fact, there is one more compaction and damage process undergone by the specimen for calculating E20 compared to E20+ in each cycle. With a growing level of damage to the specimen in the later cycles, the damage effect plays a dominant role, and thus E20 is weakened, to be less than E20+.
Figure 9 displays the evolution of Es for specimens under cyclic loading at different loading–foliation angles. The results show that Es+ is always larger than Es under the same cycle number, indicating that the deformation of the specimen during the loading process cannot be completely recovered by the unloading. Furthermore, as the cycle number increases, the deformation modulus of the specimen at the cyclic stress step of 40 MPa decreases faster than at the cyclic stress step of 20 MPa in the early stage, but this difference gradually reduces with the increasing loading–foliation angle.
Es can generally reflect the damage of a specimen caused by the previous (n − 1) loading–unloading cycles. With the exception of specimen C-0-20, the Es+ of specimens decreases with the increase in cycles. To be specific, the stress–strain curve of specimen C-0-20 in the range of 20 MPa to 40 MPa is enlarged, as shown in Figure 10a. Interestingly, the strength of the specimen after unloading is obviously increased, which is similar to the finding of You and Su [40], as shown in Figure 10b. This strengthening effect can be attributed to the increased internal friction resulting from the improved contact state of internal particles by the formed rock debris infilling the microdefects within the specimen. Moreover, Es seems to better reflect the damage caused by the previous n loading–unloading cycles, because Es is consistently decreased with the increase in cycles, including for the specimen C-0-20. Thus, it is suggested that the deformation modulus at the unloading stage is more capable of reflecting the damage inside the rock than the deformation modulus at the loading stage.

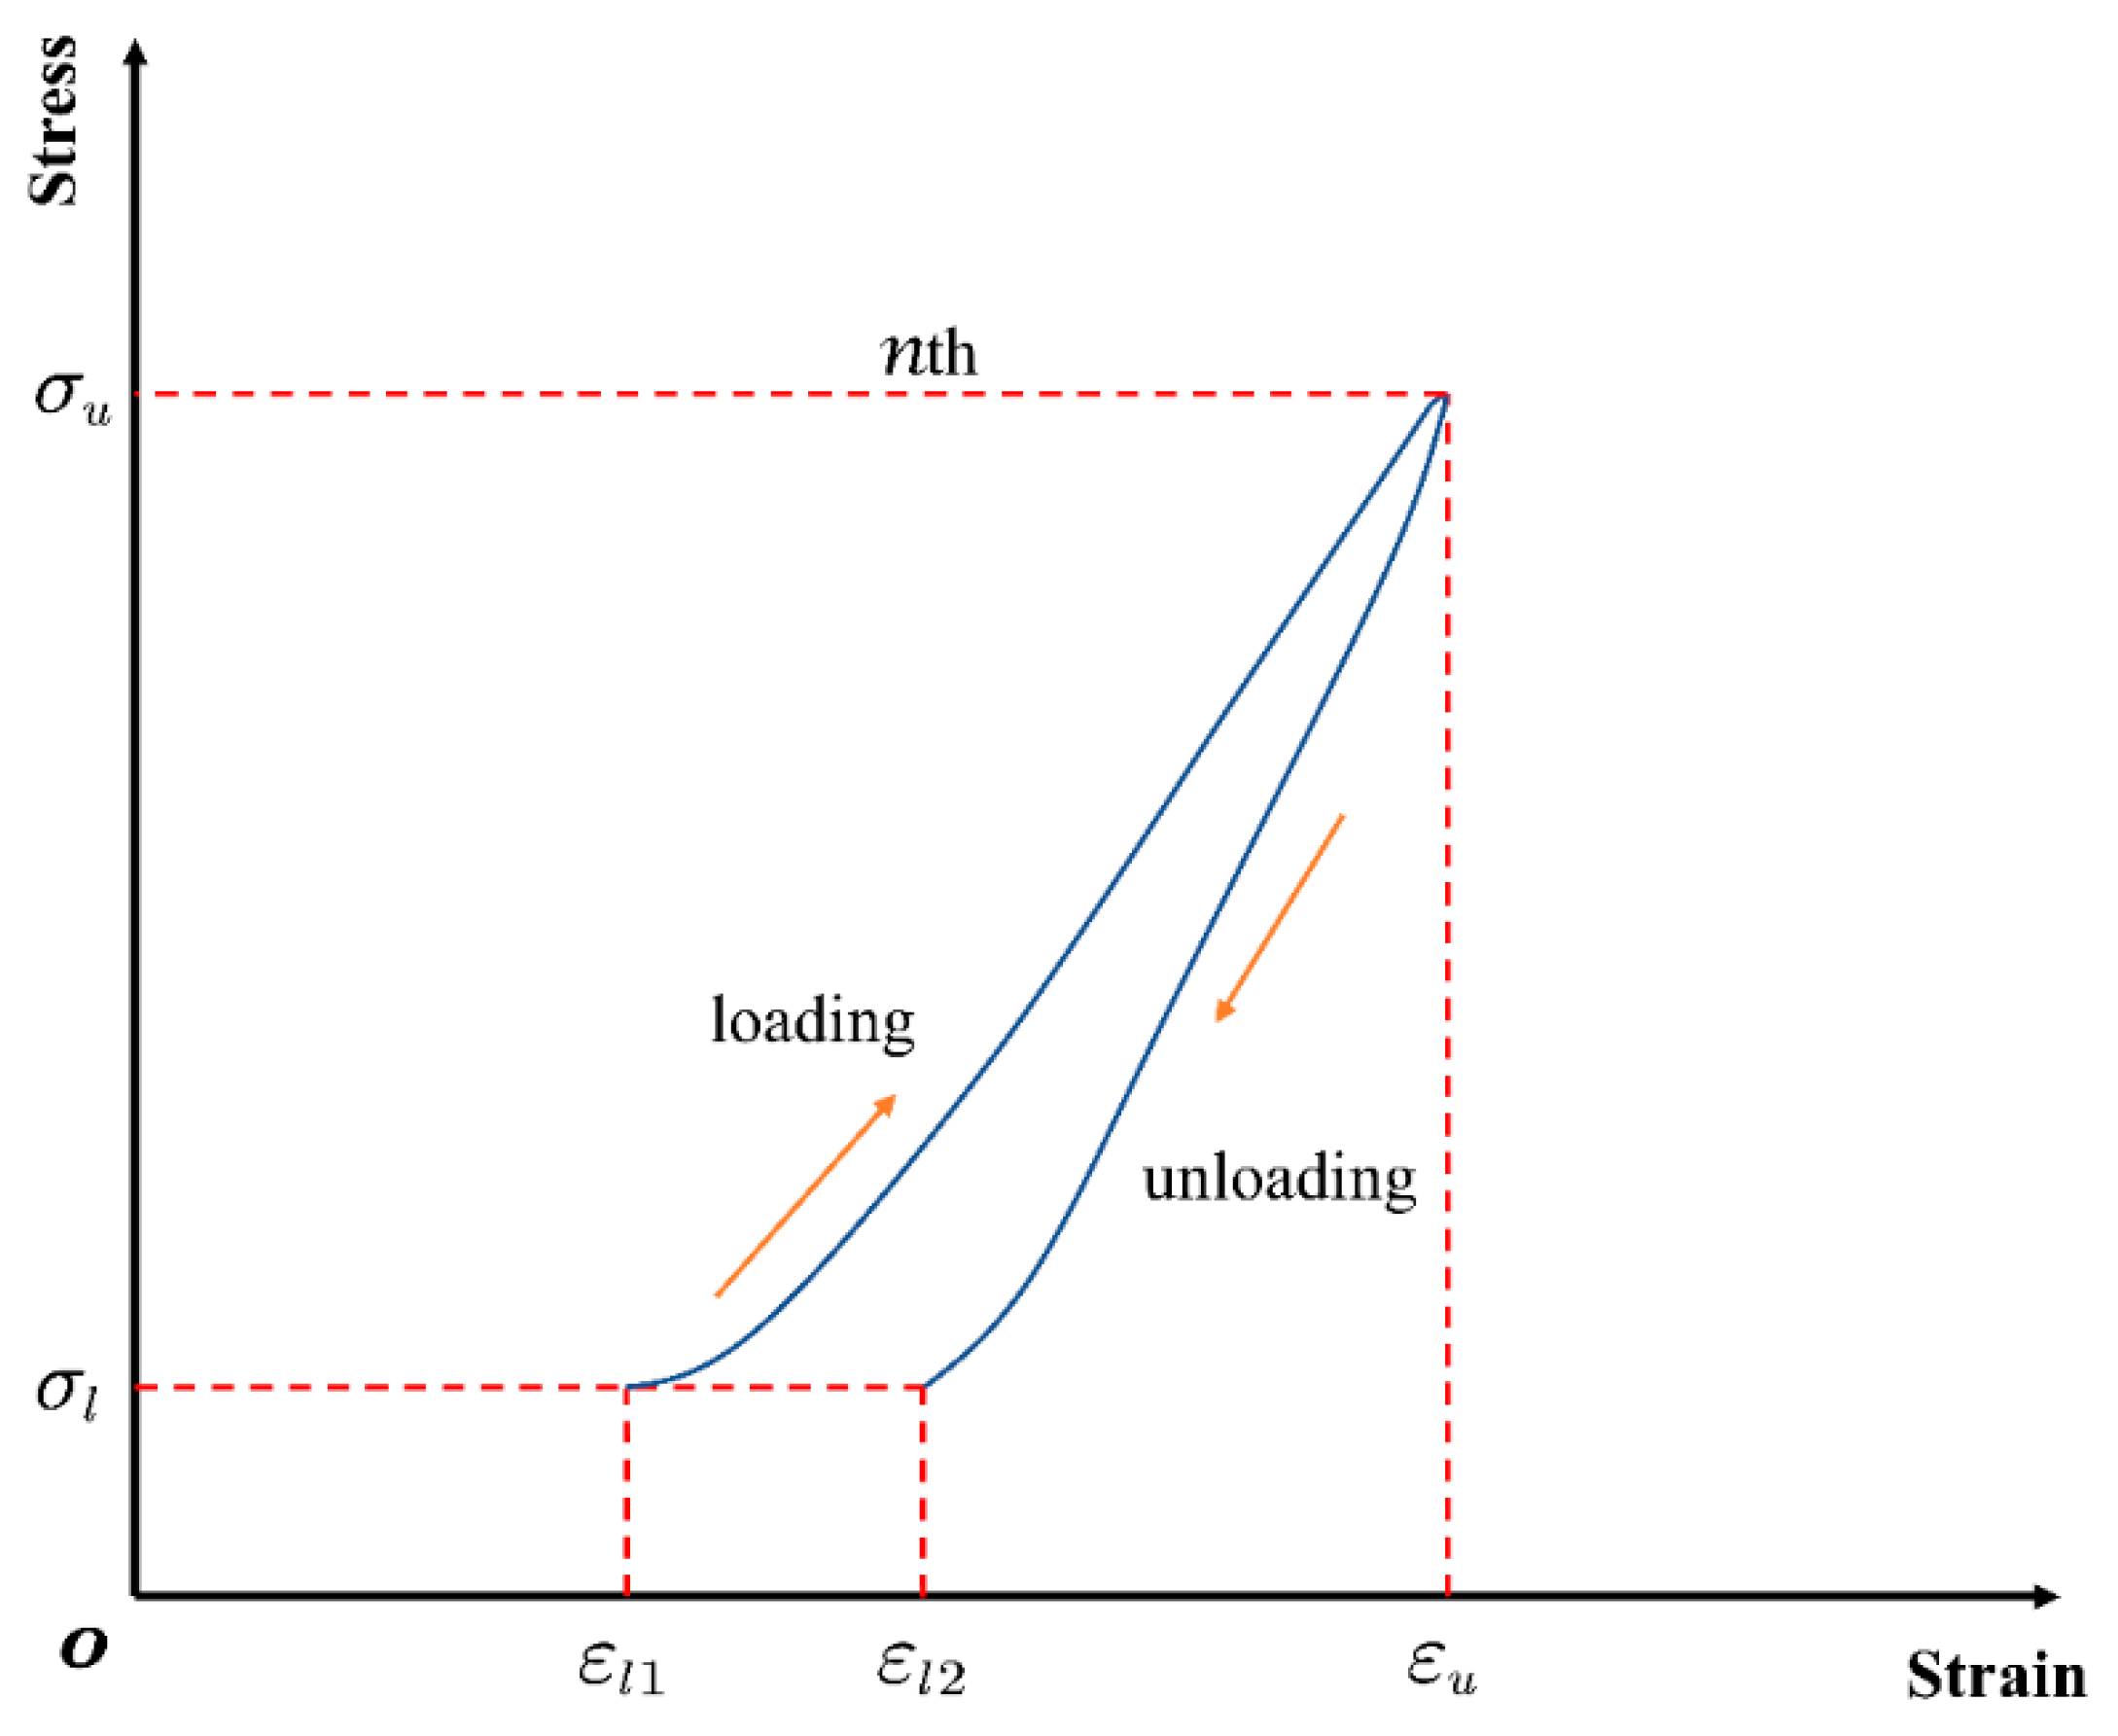
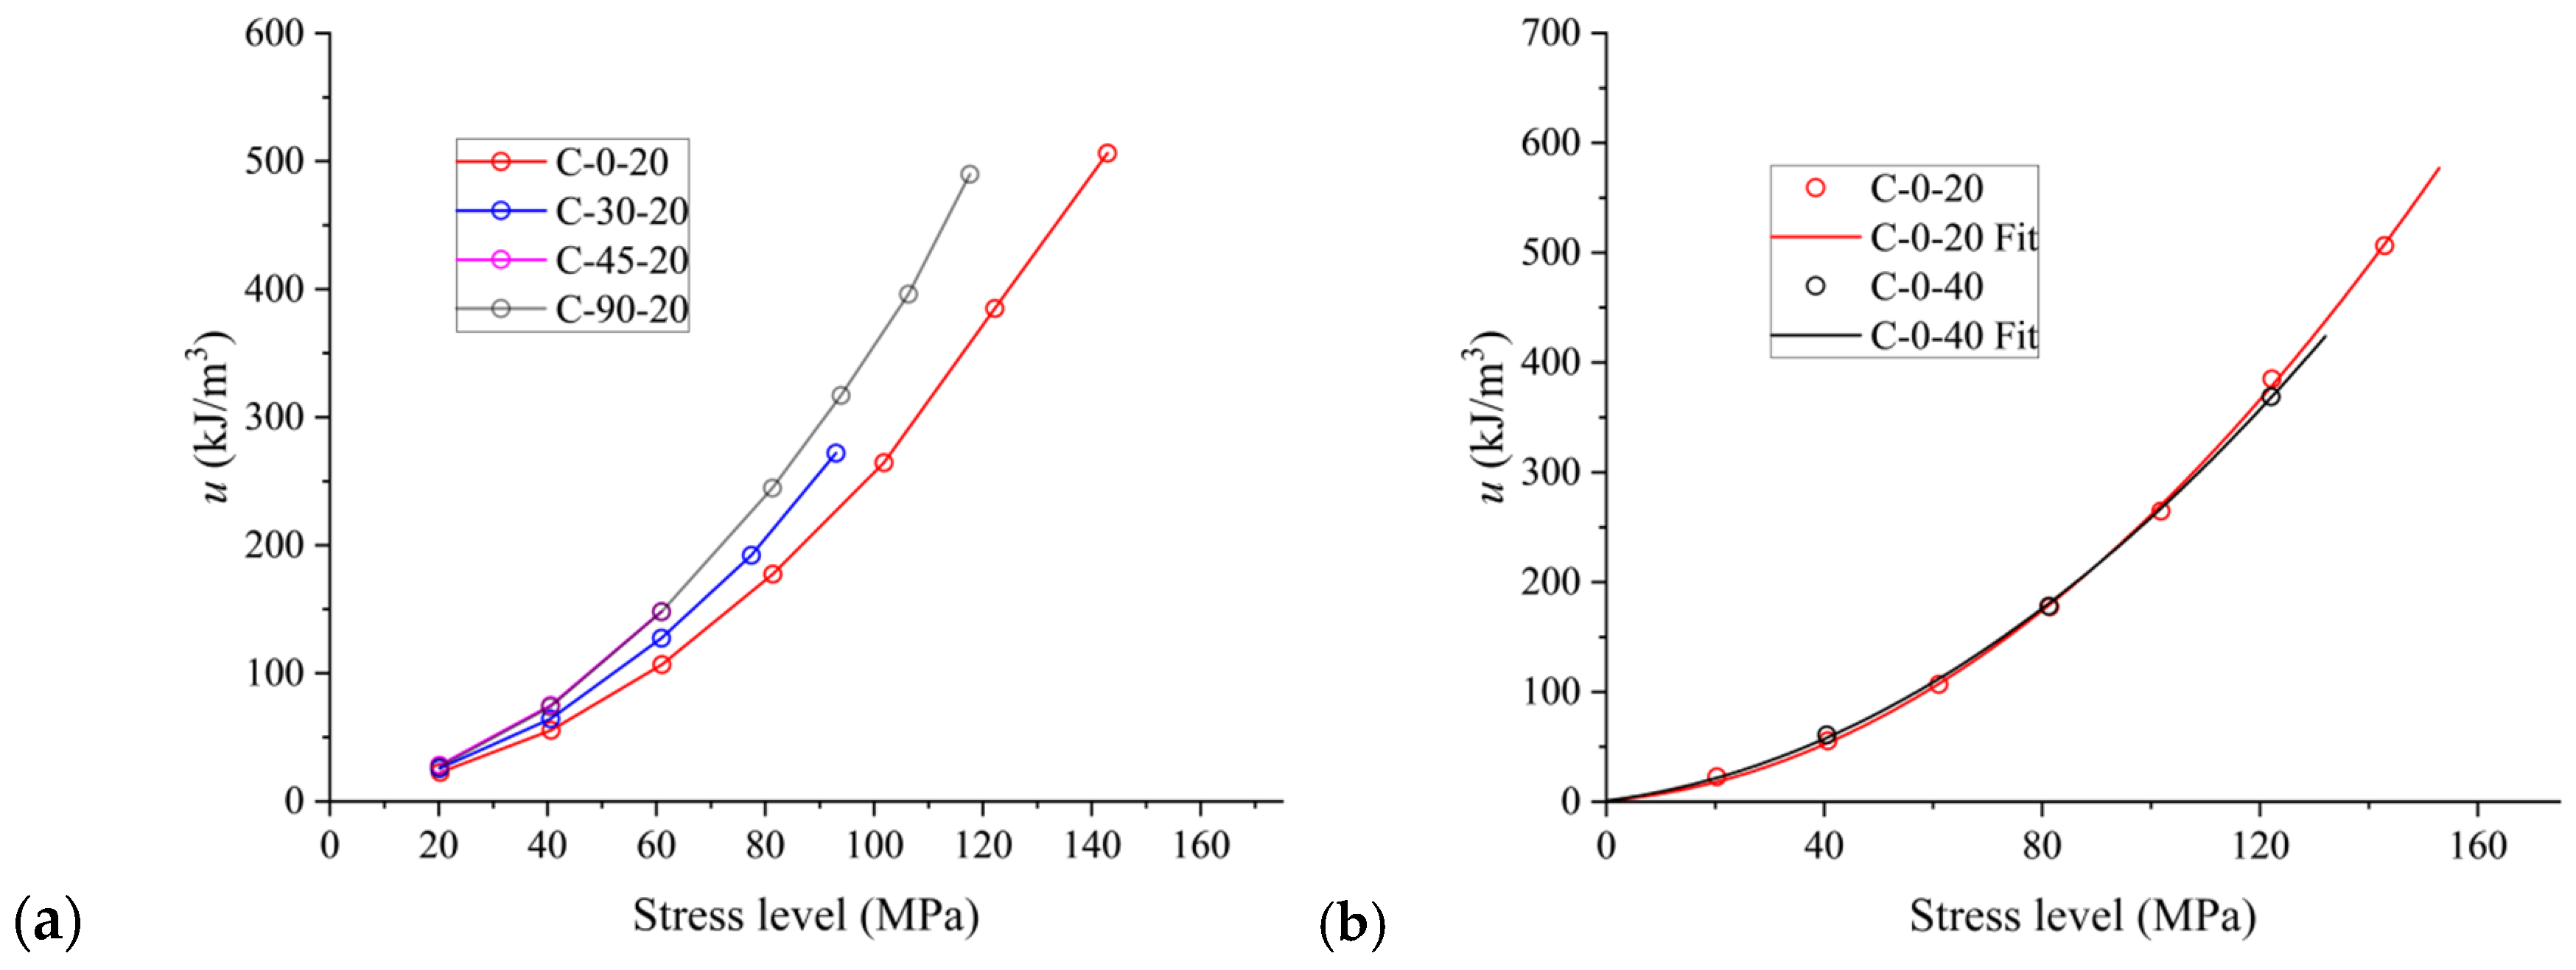
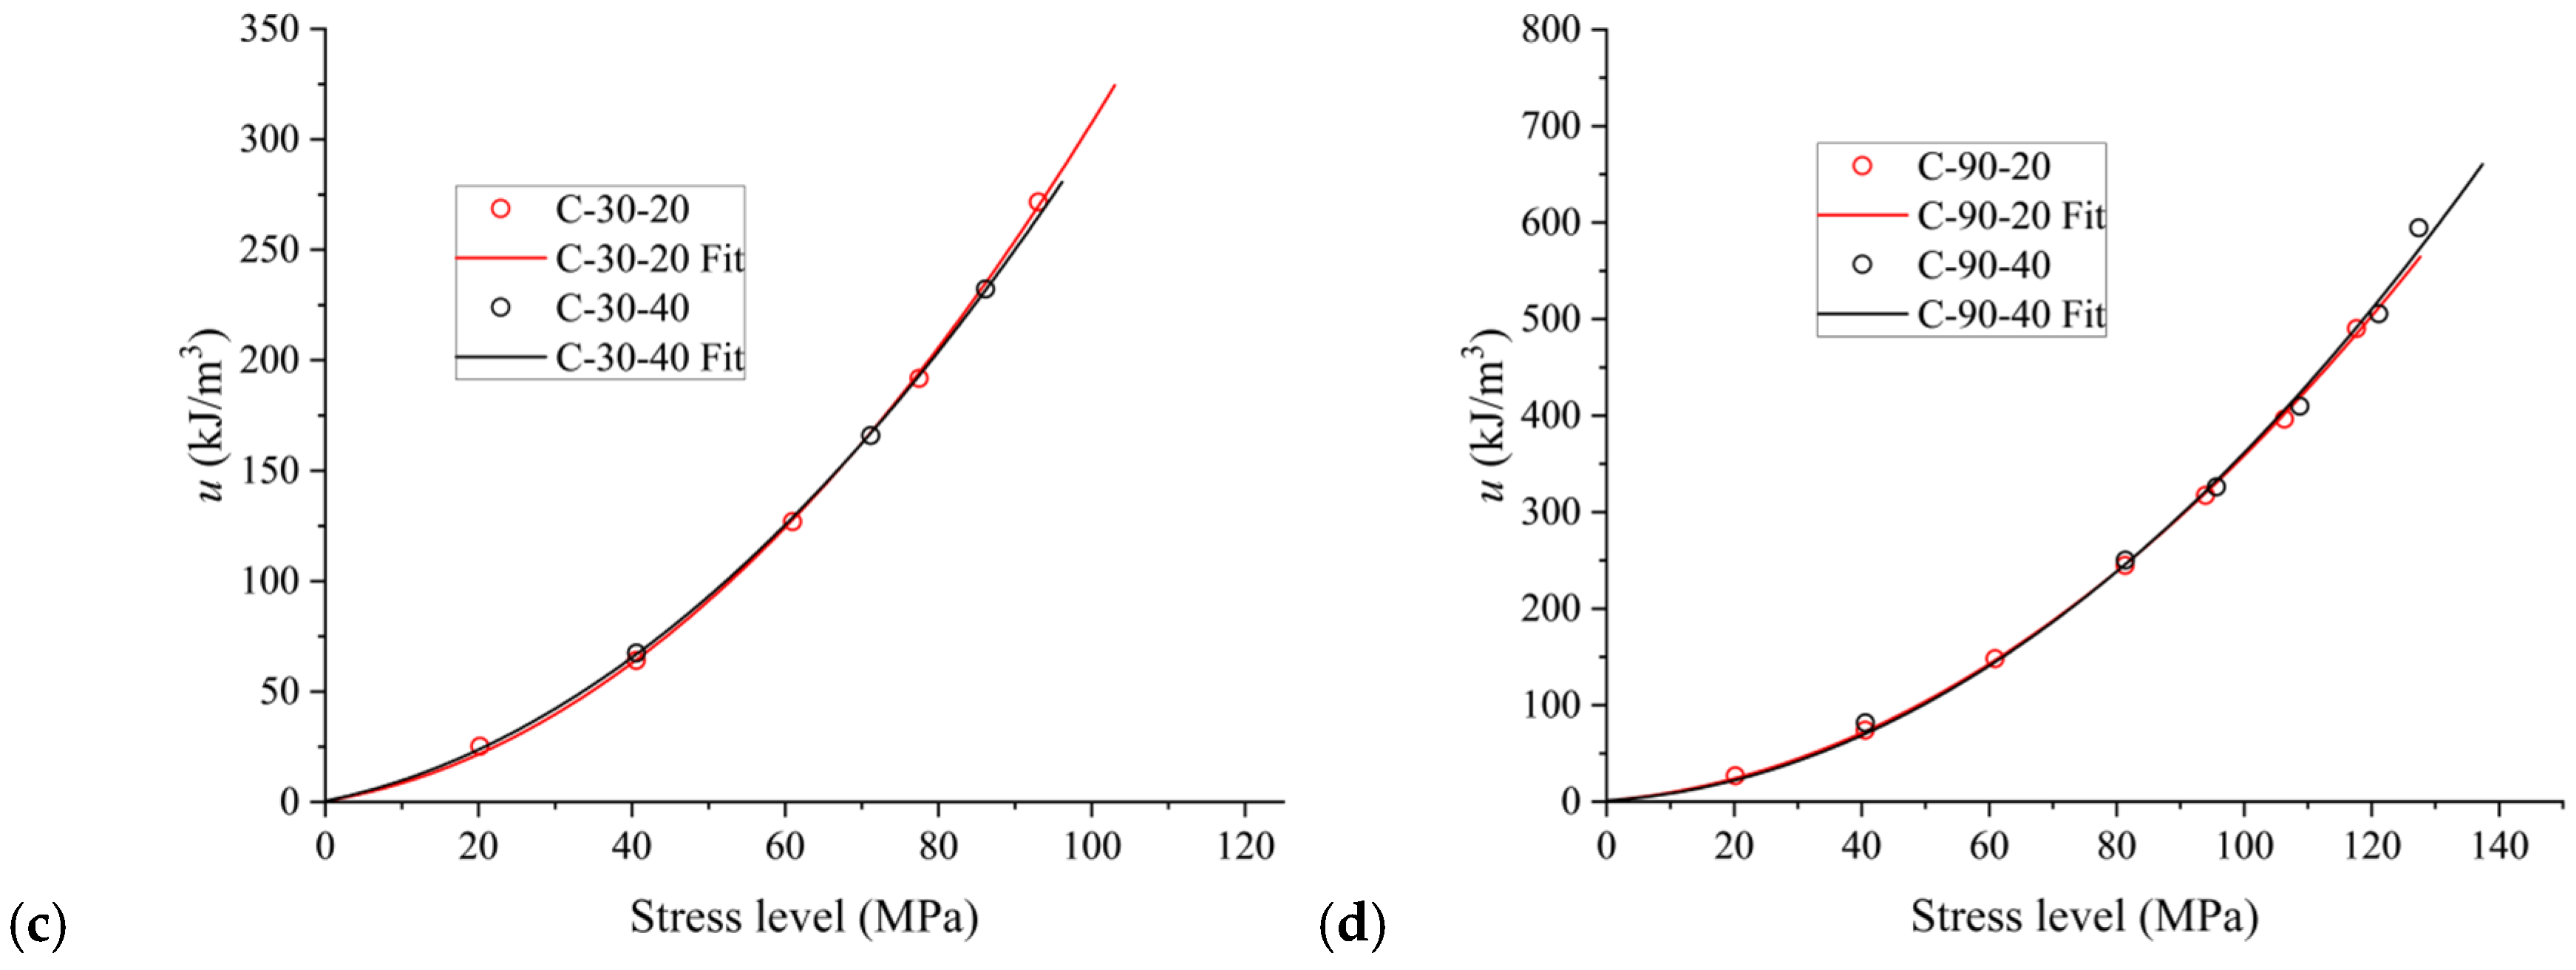
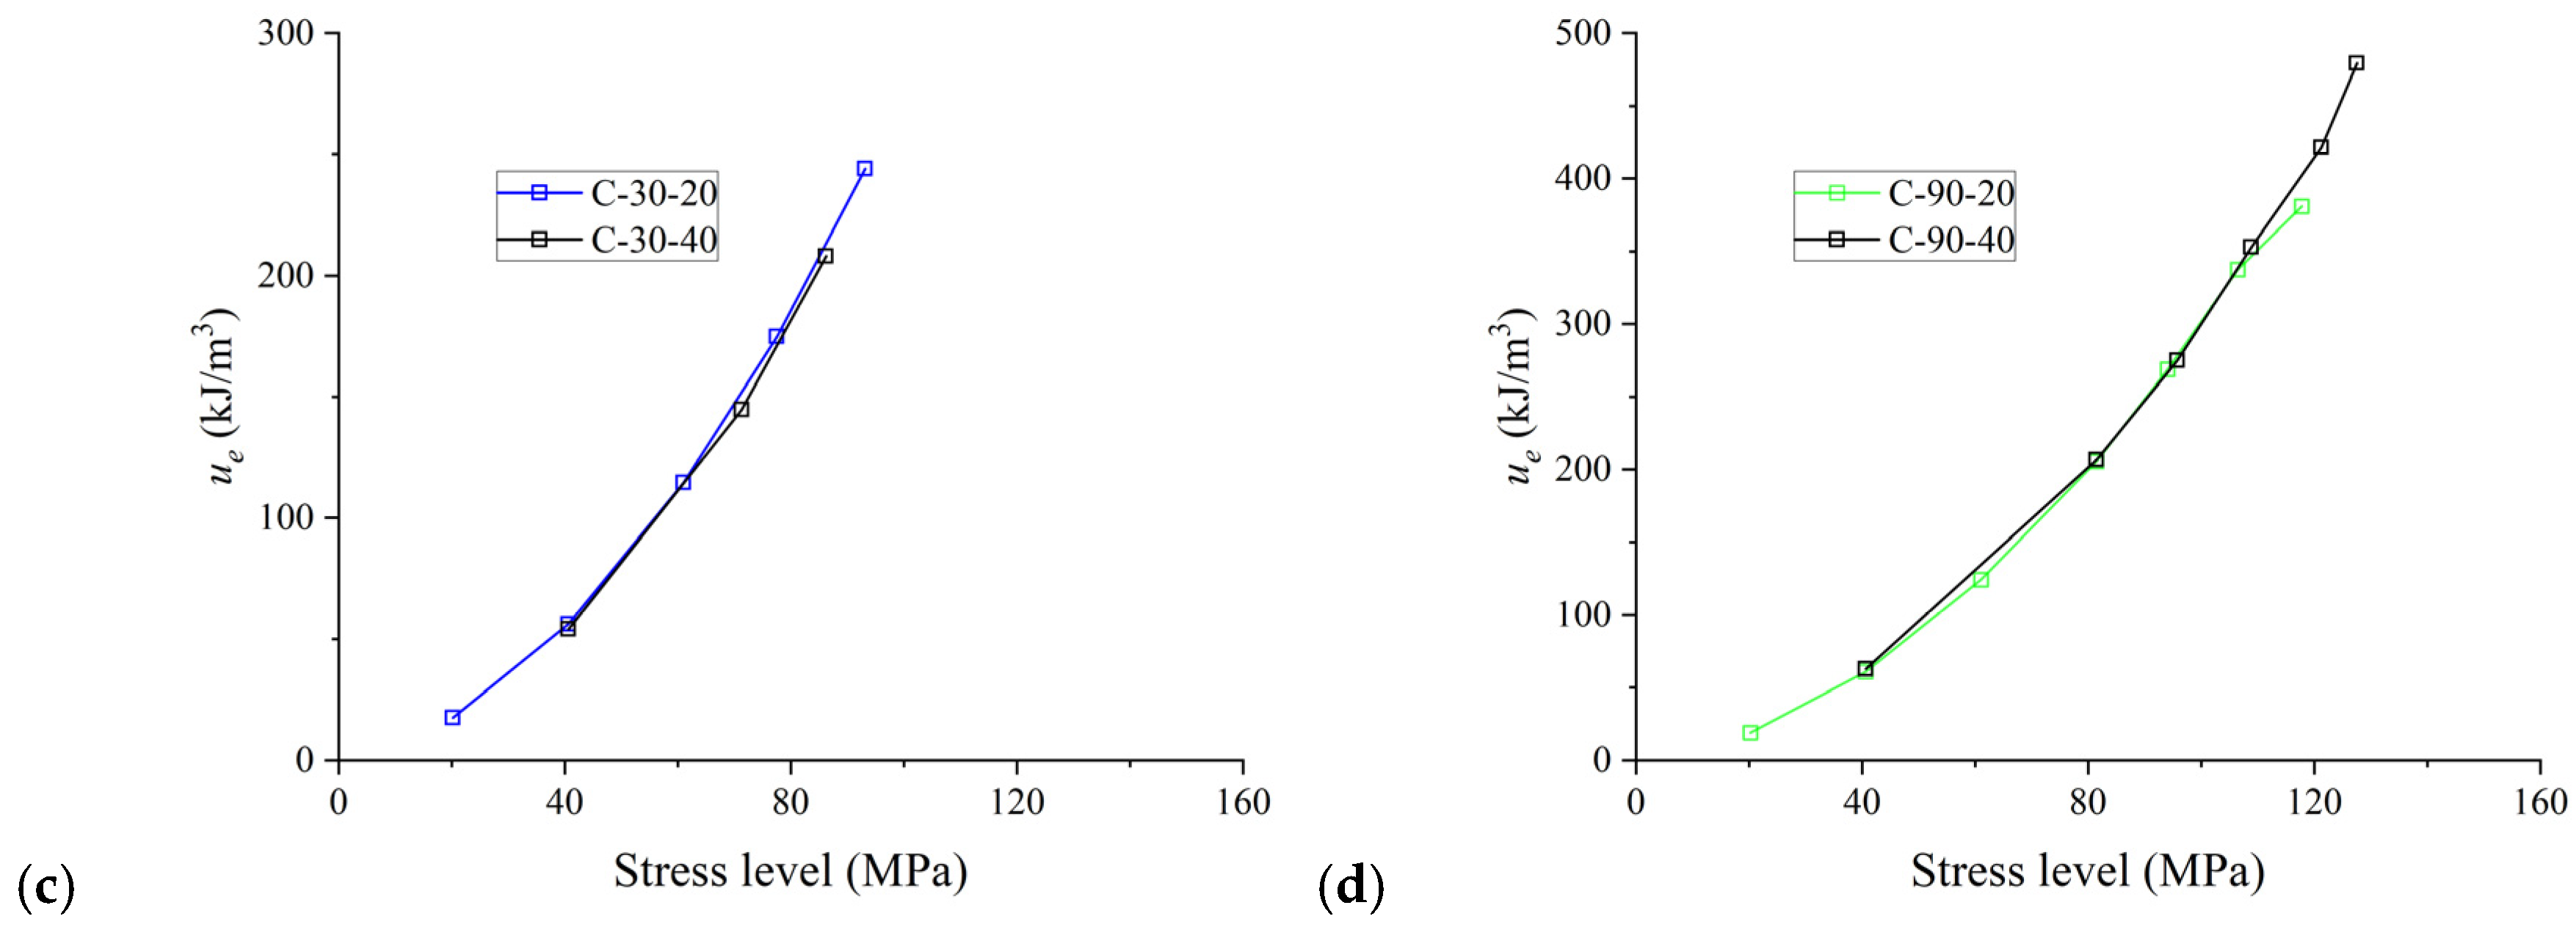
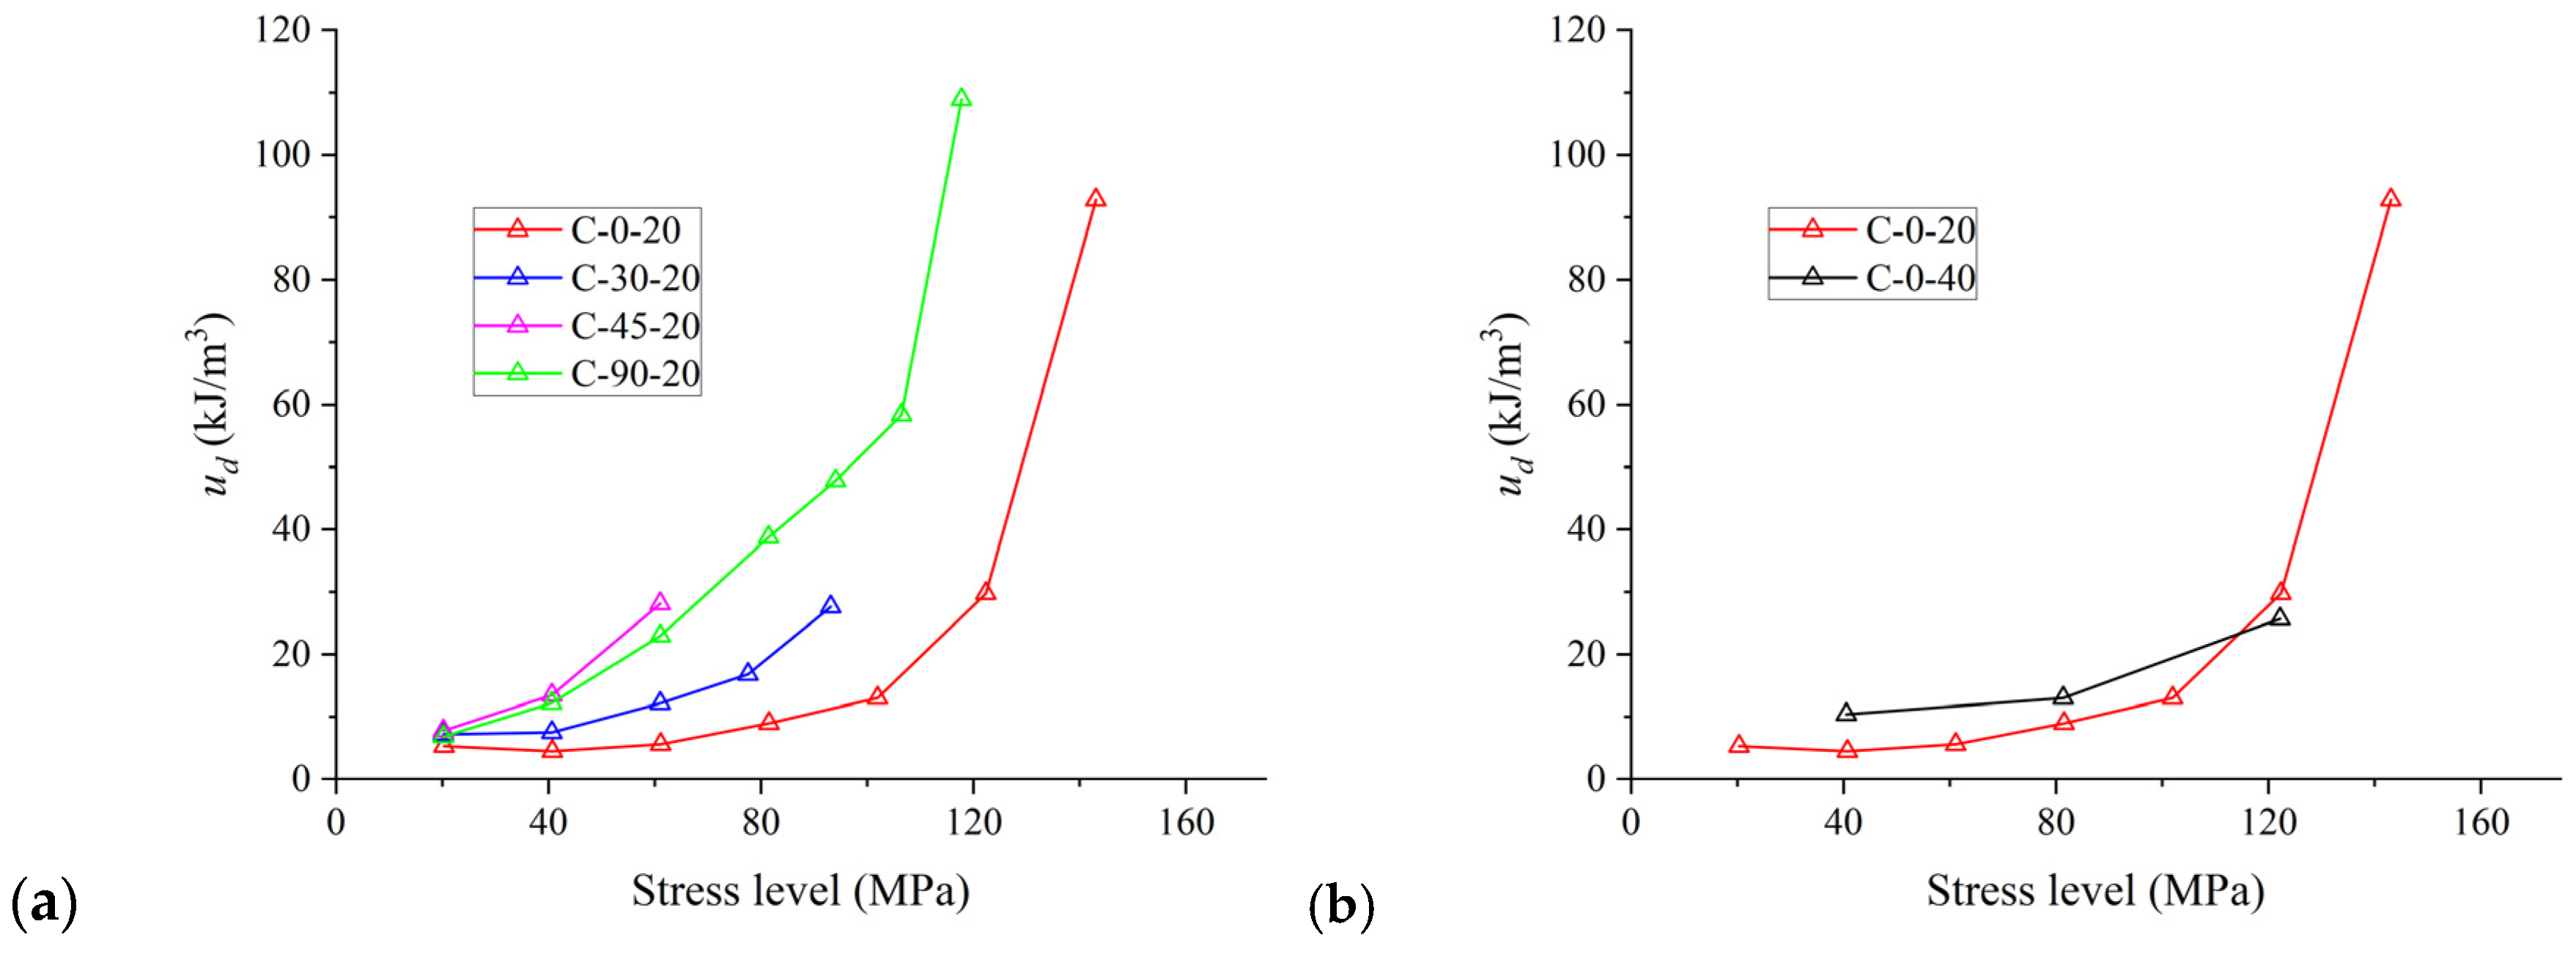
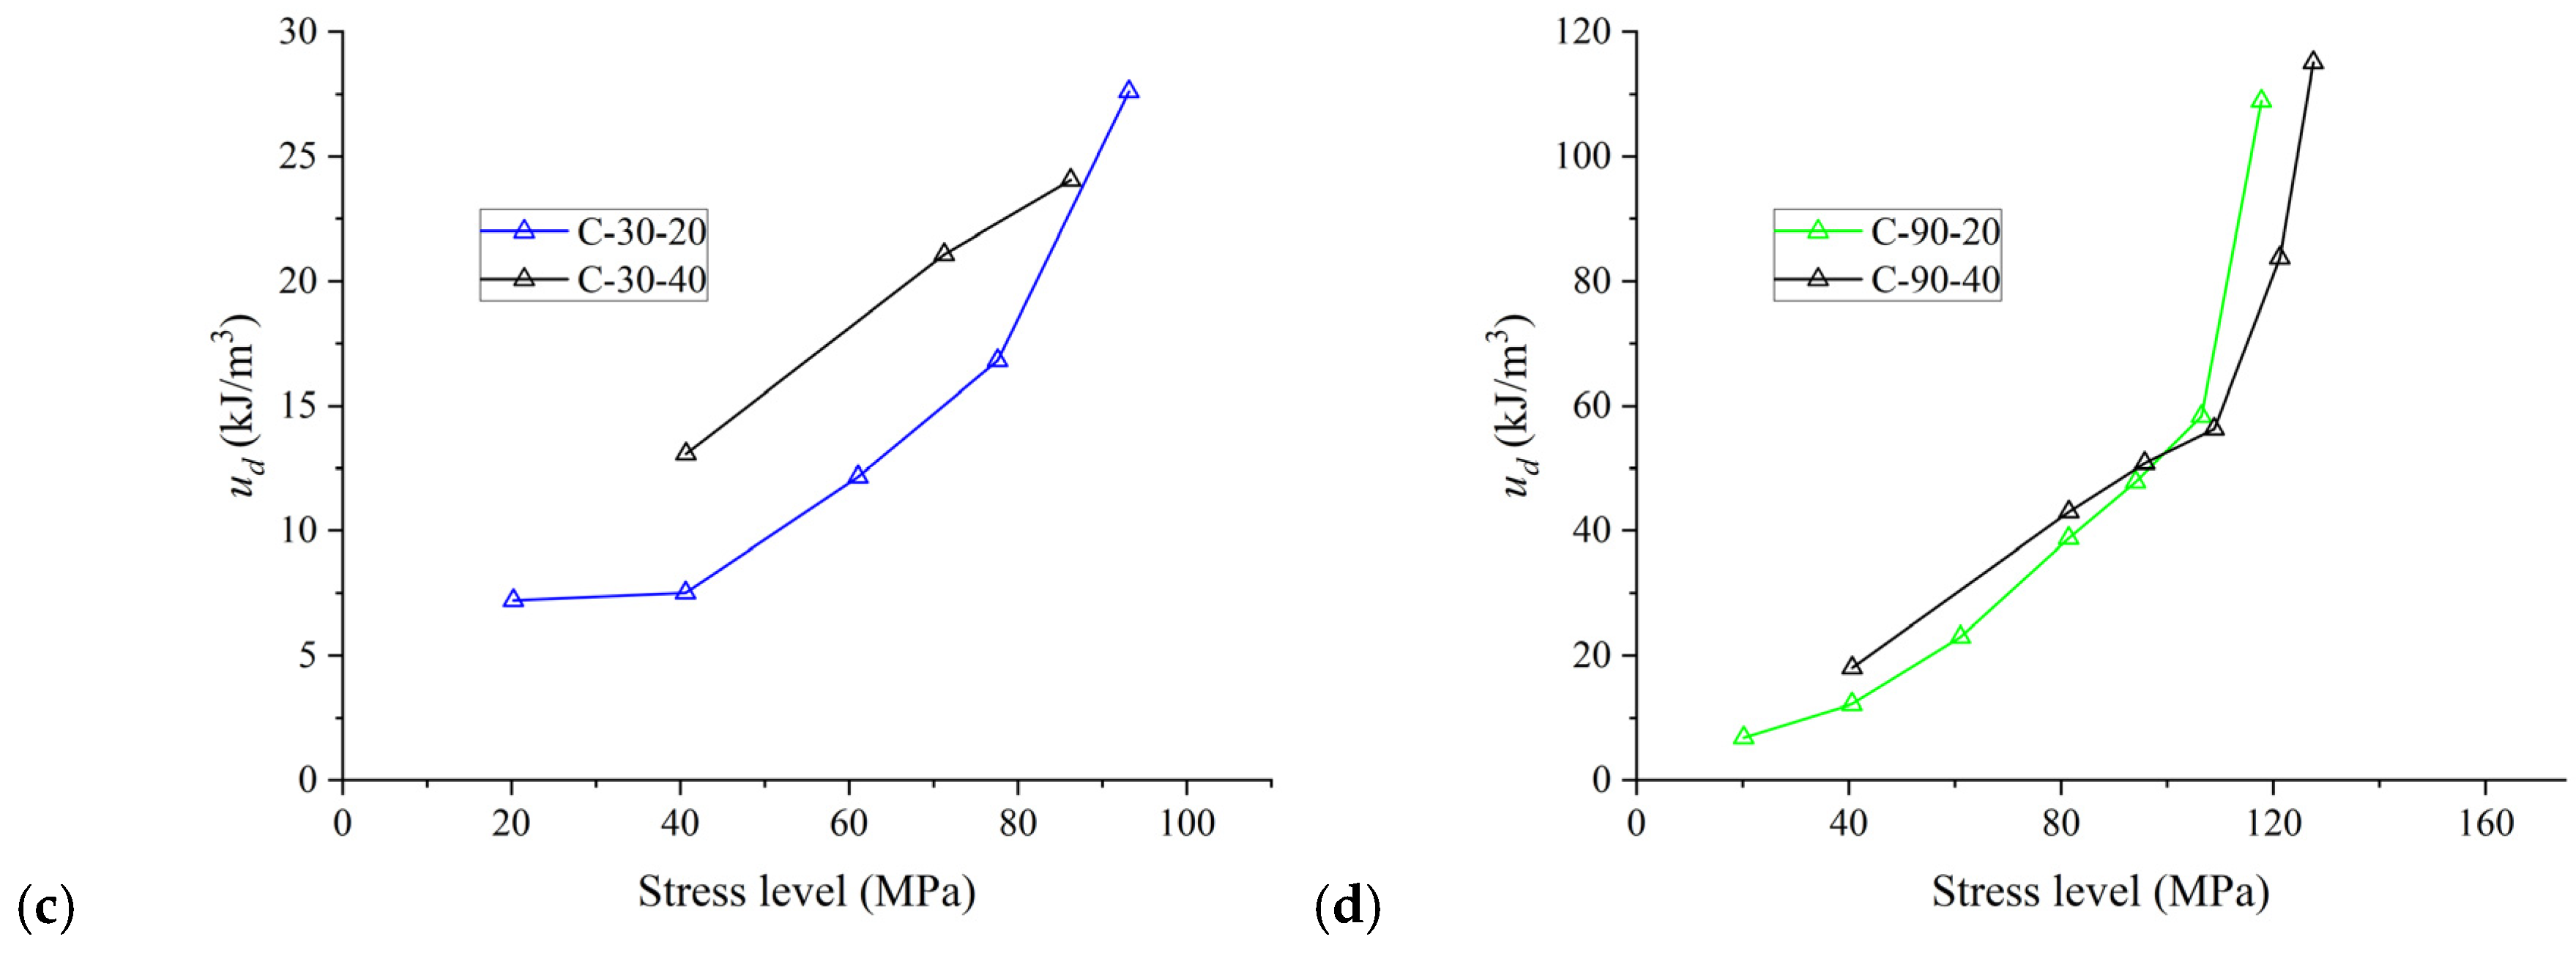
3.2.2. Energy Evolution Process

The energy in a complete cyclic loading-and-unloading process can generally be categorized as the total input energy U, the elastic energy Ue, and the dissipation energy Ud, and the relationship among them can be obtained according to the principle of energy conservation [41]:
U = U e + U d
If the volume of the specimen is taken as V, Equation (5) can be expressed as
u d V = u e d V + u d d V
where u, ue and ud represent the total energy density, elastic energy density and dissipated energy density, respectively. u and ue can be derived directly from the integral equation, and ud can be derived from the relationship equation between the three quantities.
The relevant physical quantities are shown in Figure 11, and, according to the above calculation method, the un, ue,n and ud,n of the specimen in the nth cycle can be obtained by
{ u n = ε l 1 ε u σ + d ε u e , n = ε l 2 ε u σ d ε u d , n = u n u e , n = ε l 1 ε u σ + d ε ε l 2 ε u σ d ε }
where σ+ and σ represent the stress in the loading and unloading curves, respectively.
Since the stress level reached in the last few cycles during the loading process is not consistent, the relationship between the energy density and the stress level reached in each cycle is analyzed to explore the energy evolution process of specimens under cyclic loading. The effects of the cyclic stress step and loading–foliation angle on the evolution of total energy density (u) of the specimen are illustrated in Figure 12. It is found that the relationship between u and stress level follows a quadratic function, the fitting parameters for which are listed in Table 3. The results in Figure 12a show that, regardless of stress level, with an increasing loading–foliation angle, u first increases until β exceeds 45°, and then levels off, with the u of specimen at β of 45° coinciding with that at β of 90°. Additionally, as shown in Figure 12b–d, regardless of loading–foliation angle, the curves of u versus the stress level for specimens at cyclic stress steps of 20 MPa and 40 MPa are almost overlapped. This indicates that the cyclic stress step has little influence on the total external energy absorbed by the specimen during the loading process.
Figure 13 shows the relationship between ue and stress level for specimens at different cyclic stress steps and loading–foliation angles. It can be found that ue increases significantly with increasing stress level and then slows down in the last cycle steps. The reason behind this decrease is that the damage accumulated in the specimen during cyclic loading weakens the elastic-energy storage capability of the specimen. Moreover, as illustrated in Figure 13b–d, at the same stress level, the ue corresponding to the cyclic stress step of 40 MPa is larger than that corresponding to the cyclic stress step of 20 MPa when the cycle number is small, whereas an opposite trend occurs when the cycle number is large enough.
Figure 14 displays the relationship between ud and stress level for specimens at different cyclic stress steps and loading–foliation angles. The results show that ud increases slowly in the first few cycles and surges in the later cycles. To further explore the evolution law of energy dissipation, ud/u in each cycle is analyzed as shown in Figure 15. Regardless of the loading–foliation angle, ud/u presents a U-shaped variation trend with the increase in stress level. Meanwhile, at different stress levels, as the loading–foliation angle increases, ud/u generally increases first and then levels off or reduces slightly, with ud/u reaching the minimum and maximum values at β = 0° and β = 45°, respectively. For an individual specimen, the dissipated energy in the first cycle is always the largest, primarily due to the fact that the rock specimen needs to absorb a large amount of energy to compact the original microdefects when it is loaded for the first time, and this part of the energy is mainly embodied in the form of dissipated energy. Accordingly, it can be concluded that if the damage degree of the specimen is relatively low, increasing the maximum stress level or increasing the number of cycles will reduce the percentage of dissipated energy of the specimen under cyclic loading. However, once the accumulated damage in the specimen reaches a certain degree, increasing the stress level or the number of cycles will increase the percentage of dissipated energy, with most energy used to drive the crack propagation and coalescence.

3.2.3. Damage Variable

To quantitatively analyze the damage suffered by the specimen during cyclic loading, it is necessary to introduce a damage factor that monotonically increases with the number of cycles. In this study, the damage variable is defined on the basis of the dissipation energy in the following form:
D n = i = 1 i = n u d , i i = 1 i = N u d , i
where Dn denotes the damage level of the specimen after n cycles; and i and N denote the ith cycle and the total number of cycles, respectively.
During the loading process, a proportion of the total energy absorbed by the rock from the testing machine is transformed into the elastic energy, while the remainder is dissipated within the rock in order to facilitate the development of cracks. Once the cracks within the rock have absorbed sufficient energy, they begin to link up with each other, eventually forming a fracture surface, which leads to the destruction of the specimen. Since the development of the crack is irreversible, the dissipated energy increases throughout the process, thus ensuring that the damage variable increases monotonically with the number of cycles. Since there is no complete unloading process in the last cycle, the elastic-energy density of the last unloading process is estimated here in terms of u e , n = σ p 2 2 E u , where σp is the maximum stress reached in the last cycle, and Eu is the elastic modulus of the ideal unloading curve, approximated by the elastic modulus of the unloading curve in the previous cycle [42]. The calculated values of uN, ue,N and ud,N for different specimens under cyclic loading are listed in Table 4.
In addition, to facilitate the comparison between the results, the number of cycles is normalized. The evolution of the damage variable for specimens at different cyclic stress steps and loading–foliation angles are shown in Figure 16. The results indicate that as the normalized cycle increases, D increases, with the rate of increase growing gradually. The rates of increase of the damage variables of specimens at different loading–foliation angles are different. Within the same normalized cycle, the damage variable of the specimen generally increases when β increases from 0° to 45°, and then decreases when β increases from 45° to 90°. Furthermore, the influence of the cyclic stress step on the evolution of the damage variable of the specimen is significant, in that increasing the cyclic stress step can generally accelerate the evolution of the damage variable, but its degree of influence is related to the loading–foliation angle. To be specific, the degree of influence of the cyclic stress step on the evolution of the damage variable of the specimen is minimal when β = 0°, and then increases to the maximum when β = 30°, and finally decreases when β = 90°.

3.3. Acoustic Emission Characterization

The acoustic emission phenomenon is related to the release of elastic energy, which can reflect the microscopic damage inside the rock material [43,44,45,46]. The acoustic emission signals of specimens, including the AE counts and the cumulative AE counts, are characterized in this section.

3.3.1. AE Characteristics under Monotonic Loading

Figure 17 illustrates the evolutions of stress, the AE counts and the cumulative AE counts over time for specimens at different loading–foliation angles under monotonic loading. The whole loading process can be divided into three stages. In the first stage, the micropores and microcracks inside the specimen are compacted and a large number of acoustic emission signals are generated, with a rapid increase in cumulative AE counts, which corresponds to the compaction stage. In the second stage, few acoustic emission signals are generated, the growth rate of cumulative AE counts slows down, and some microcracks sprout, corresponding to the elastic stage. In the third stage, cracks within the specimen are propagated and coalesced, and a large number of acoustic emission signals are generated, corresponding to the stage of expansion and failure. It is worth noting that the specimen at β = 0° has a clear precursor before the complete failure, with a sudden increase in AE counts at certain moments when a slight stress drop can be observed from the stress–time curve. Moreover, considerably more AE counts in the second stage are observed in the specimen at β = 45° than at β = 30°. This can be attributed to the fact that when the shear fracture occurs, the fracture through foliation planes often produces more AE counts than that along the foliation plane, which is consistent with the experimental finding of Xu et al. [47]. Although in this study the shear fracture dominates in specimens at β = 30° and β = 45°, the positions of the shear fracture plane in relation to the foliation plane are different, which will be further analyzed in Section 3.4.

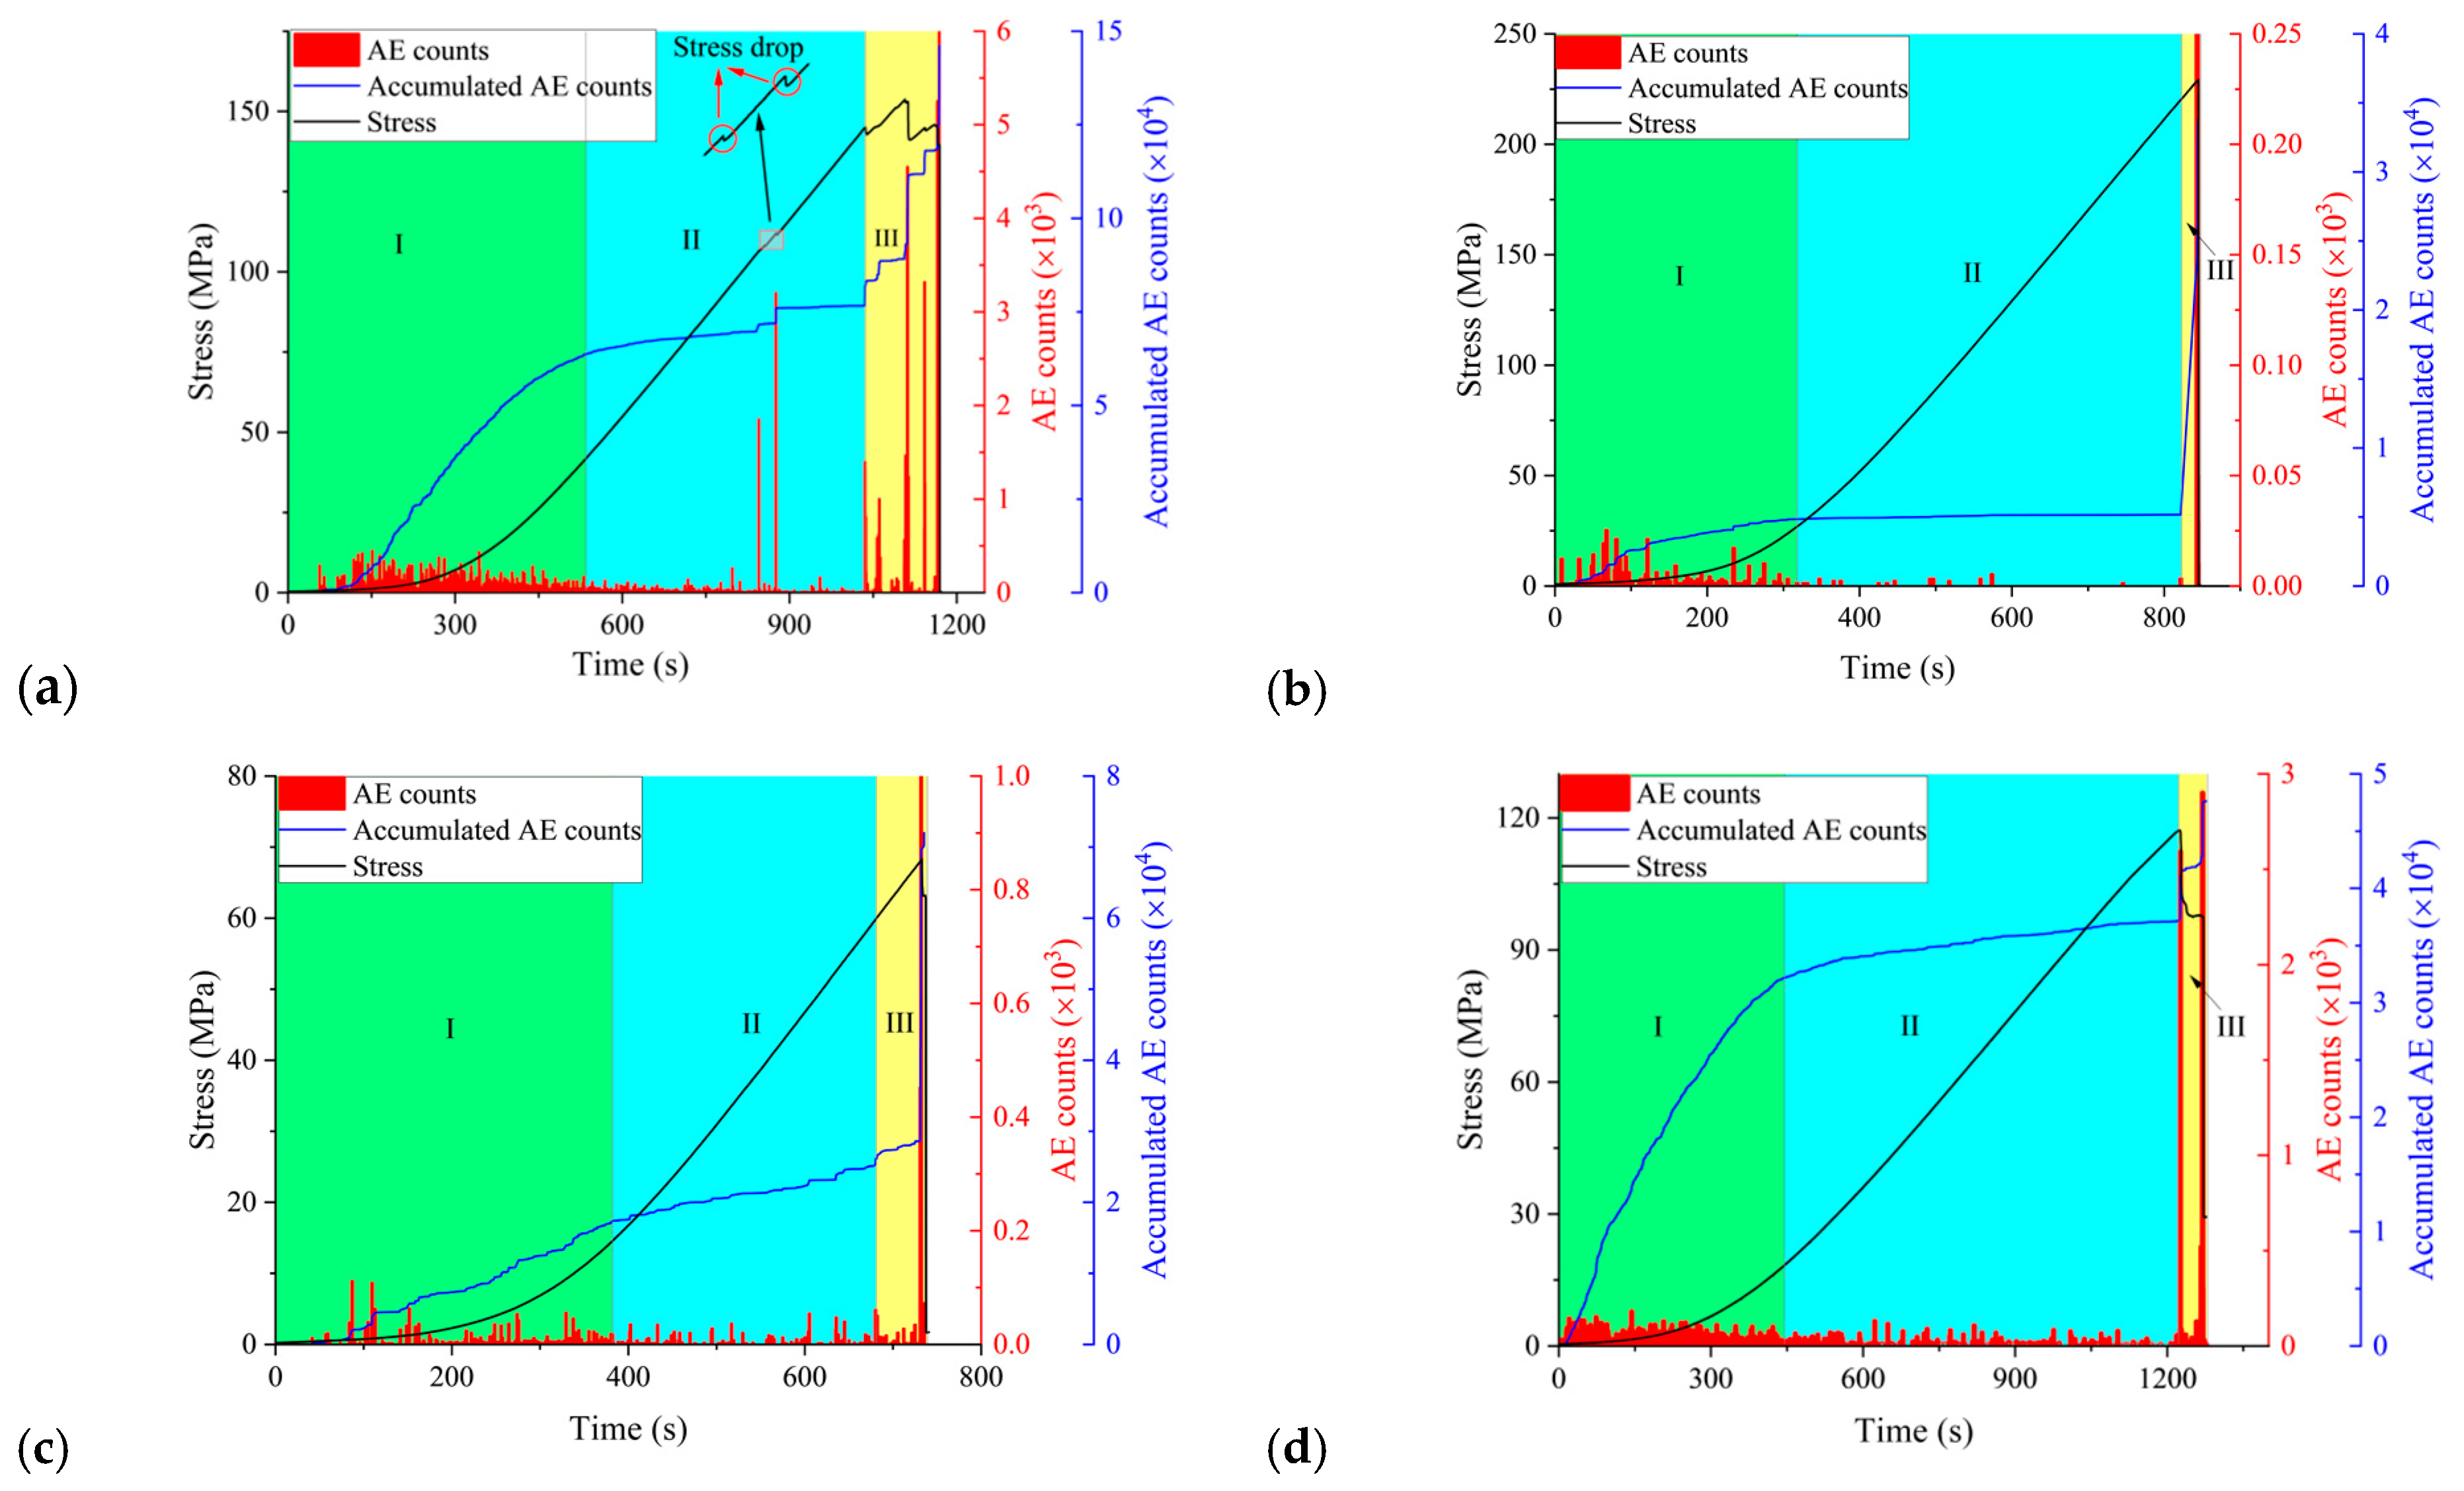
3.3.2. AE Characteristics under Cyclic Loading

Figure 18 shows the evolutions of stress, AE counts and cumulative AE counts over time for specimens under cyclic loading at different cyclic stress steps and loading–foliation angles. In general, the AE counts show a similar variation trend, in that a large number of AE counts are generated during the loading process, especially in the pre-load and near-peak loading stages, while very few AE counts are generated during the unloading process. It is found that the AE counts of the specimens at β = 0° are mainly distributed in the near-peak region, which is consistent with the Kaiser effect, whereas the AE counts of the specimens at the other loading–foliation angles are mainly distributed in the early stage of each cyclic-loading process, exhibiting an obvious Felicity effect. This implies that the foliation planes in specimens can be repeatedly compacted over a low stress range, resulting in a large number of AE counts each time in the early stage of the loading process. In addition, for the specimens loaded at β = 0° and β = 90°, regardless of cyclic stress step, the maximum stress level reached in the last loading process is smaller than that in the previous loading process, with a large number of AE counts occurring at the peak of the previous cycle, which indicates that the accumulated damage in these specimens before the last cycle has already reached a very high level.

3.4. Fracture Mechanism

3.4.1. Macroscopic-Fracture Characteristics

The fracture mode is an important factor affecting the mechanical properties of materials, and it is often more complex for transversely isotropic rocks. Figure 19 illustrates the failure modes of slate specimens under monotonic and cyclic-loading conditions. The results show that the fracture mode of the specimen is closely related to the loading–foliation angle. The fracture mode of the specimen at β = 0° is splitting failure, with multiple fracture surfaces parallel to the foliation planes. This implies that the specimen at β = 0° finally fails when more than one foliation plane is peeled off, which corresponds to the obvious precursor of acoustic emission signals prior to the final fracture, as discussed in the previous section. Regardless of loading conditions, the shear fracture along the foliation plane dominates in the specimen at β = 30°. It is noted that a splitting fracture through the foliation plane has occurred in the specimen C-30-20, but the tensile fracture does not penetrate through the entire specimen, with the shear fracture along the foliation plane dominating.
Additionally, the fracture mode of specimens at β = 45° is dominated by a shear fracture, including shear fractures along and through the foliation planes. Due to the difference in fracture pattern, the acoustic emission characteristics of specimens under different loading conditions are also very different. For the specimen U-45, two major shear-fracture planes appear, including a small portion of the fracture along the foliation plane and a large portion of the fracture through the foliation plane, and the induced AE counts are distributed evenly throughout the loading process, whereas, for specimen C-45-20, only one single shear-fracture plane along the foliation plane is formed, and the induced AE events are concentrated in the early stage of the loading process. Combined with the results in Section 3.1.1, showing that there is an obvious difference between the acoustic emission results of the β = 45° and β = 30° specimens, it is clear that the fracture mode of the rock can indeed influence the distribution of acoustic emission events. For specimens at β = 90°, the fracture mode is dominated by the combination of shear fracture and tension fracture through the foliation plane. It is also noted that the tensile fracture in the horizontal direction occurs in all the specimens at β = 90°, which can be attributed to the low cohesion between foliation planes. Before the specimen completely fails, the end of the specimen is fractured into two parts. Accordingly, the tensile stress, resulting from the bending moment at the end of the specimen, brings about the emergence of the horizontal fracture along the foliation plane.

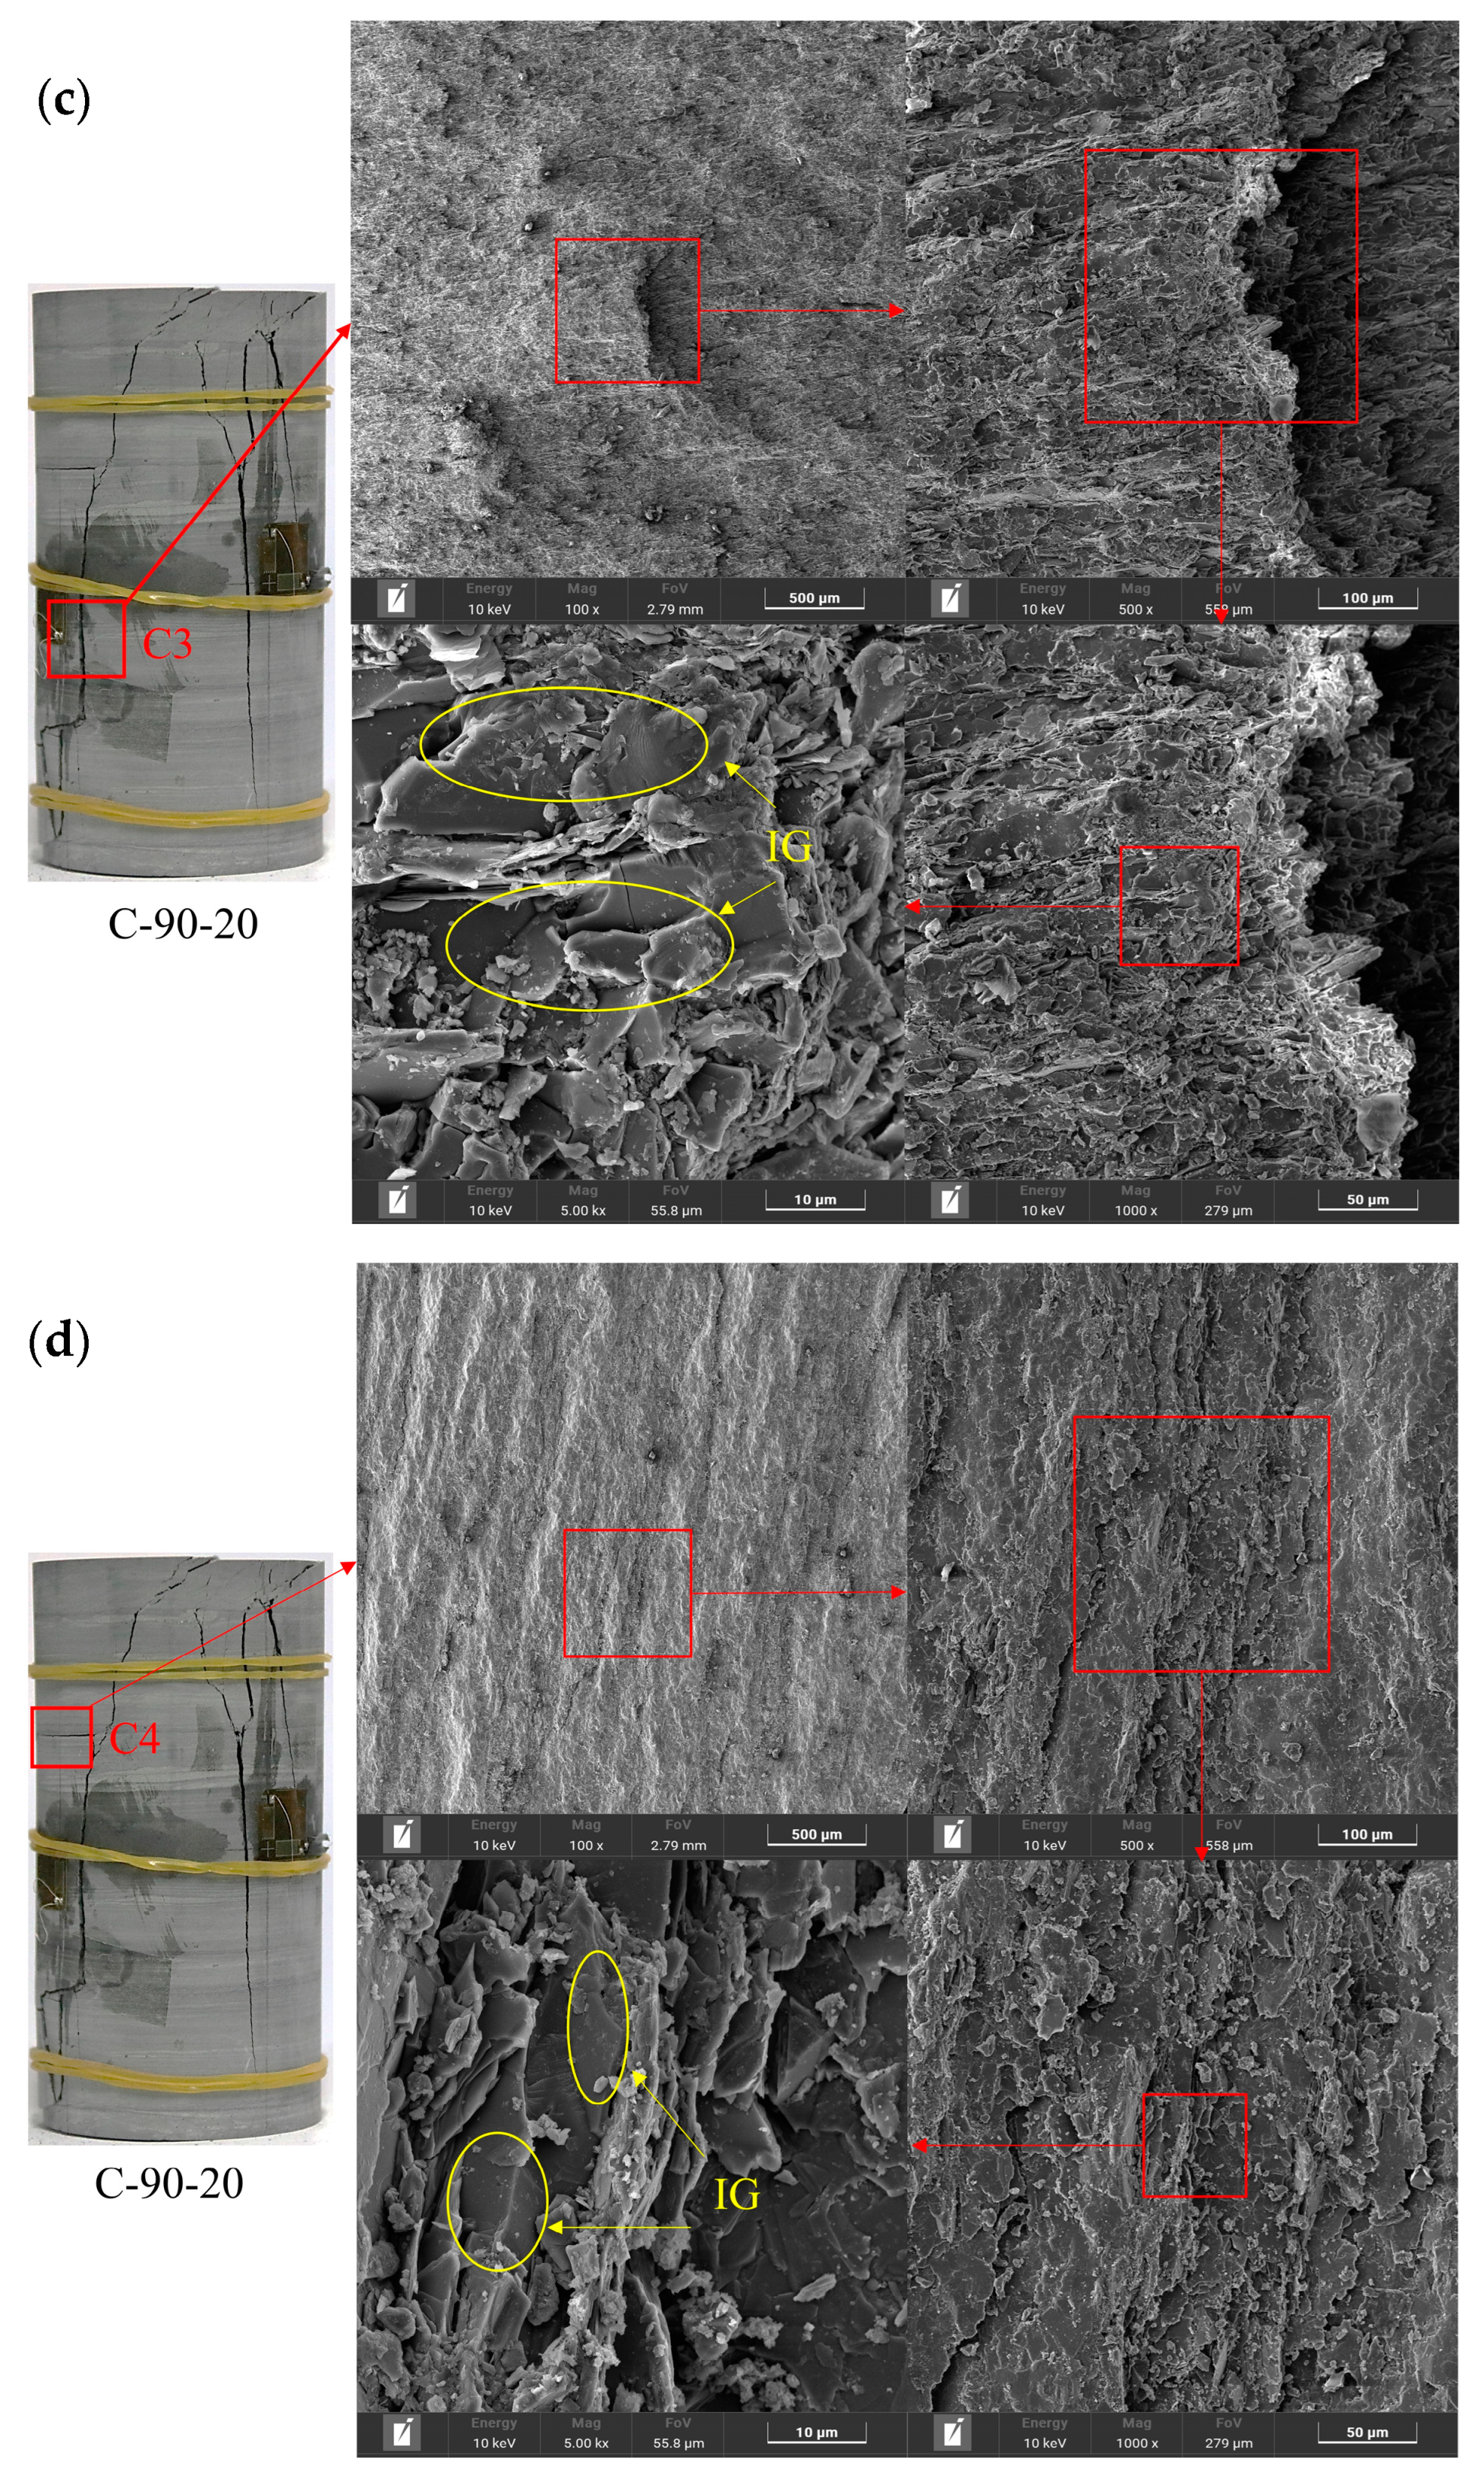
3.4.2. Microscopic-Fracture Characteristics

The microscopic morphology of the fracture surface of the specimen can be obtained by means of SEM, to help reveal the failure mechanism of rock from a microscopic point of view [48,49]. To better understand the failure mechanism of transversely isotropic rocks, the specimens with typical fracture characteristics are selected for SEM scanning and their fractures are analyzed in the following
Figure 20 presents the microscopic morphology of different fractures under monotonic loading. For the tensile fracture along the foliation plane (U1) in sample U-0, it can be seen from the magnified image of 100 times that there are many foliation planes exposed on the fracture surface, forming a wave-like pattern. This indicates that this fracture is peeled from more than one foliation plane due to the thin layered texture possessed by the slate rock. When the fracture surface is magnified up to 5000 times, a lot of thin-section tips can be observed at the fracture edge. This is because the tensile fracture means the tips of sharp lamellae are retained. Moreover, the grain grooves can also be observed, indicating the occurrence of intergranular (IG) fracture. For the shear fracture along the foliation plane (U2) in specimen U-30, at 100-times magnification, the fracture surface is banded and the banded stripes show a morphology of a peak in the middle and a valley on both sides. After further magnification, it can be found that the middle part of the band is filled with rock debris, while the two sides of the band are the foliation surface with a low degree of damage. The reason for the presence of abundant rock debris may be that the foliation planes are broken during shearing, and the foliation planes are staggered and rub against each other.
In addition, three typical fracture surfaces, e.g., U3, U4 and U5, in the specimen U-90 are analyzed microscopically. Figure 20c demonstrates the microscopic characteristics of the tensile fracture through the foliation plane (U3). It can be seen in the image, at a magnification of 100 times, that the flaking layer is curved and the fracture surface is relatively rough. These curved flaking layers are not foliations, but consist mainly of an arrangement of grains. Clear rock grains can be observed in the magnified-5000-times image, implying that the fracture mode is dominated by the IG fracture, but the transgranular (TG) fracture can also be found in some localized locations. The microscopic morphology of the tensile fracture along the foliation plane (U4) is presented in Figure 20d. The fracture surface is undulated, as shown in the magnified-100-times image, and the IG fracture is observed at 5000-times magnification, indicating that the fracture mode is dominated by the tensile fracture. Furthermore, Figure 20e demonstrates the morphological characteristics of the shear fracture through the foliation plane (U5) under SEM; a few wavy bumps can be observed at 100-times magnification, and, except for these bumps, the fracture surface is relatively smooth and flat. At 5000-times magnification, rock debris is observed on the fracture surface, and some step-like features that symbolize the TG fracture are found as well. This further validates the fact that the fracture mode of U4 is dominated by the shear failure through the foliation plane.
The microscopic characteristics of different fractures in specimens under cyclic loading are shown in Figure 21. The results manifest the fact that the fracture pattern of fracture C1 in specimen C-0-40 under cyclic loading is very similar to that of fracture U1 in specimen U-0 under monotonic loading, but with more rock debris formed. This phenomenon is more significant in the fracture C2. This may result from the repeated compression and shear on the formed fracture surface during cyclic loading. Thin-section tips and IG fractures are also found in the fracture C1, which symbolize the typical tensile fracture mode. Additionally, the fracture modes of both fracture C2 in specimen C-0-40 and fracture U2 in specimen U-30 are dominated by the shear fracture along the foliation plane, but the fracture surface of C2 is smoother, as shown in the magnified-100-times image. The difference between fractures C2 and U2 is amplified at 5000-times magnification, showing that the fracture C2 exhibits a higher integrity compared to the fracture U2, with the foliation planes in fracture C2 more visible. This can be explained by the difference in the formation mechanism of fractures U2 and C2, as illustrated in Figure 22. When the angle between foliation plane and loading direction (βJ) is smaller than the angle between shear plane and loading direction (βS), the edges of broken foliation planes are more susceptible to interlaced extrusion during shear sliding, and thus abundant rock fragments are formed in the fracture surface, as observed in fracture U2. On the contrary, when βJ is larger than βS, a fracture morphology similar to the fracture C2 can be formed. Similar to the fracture U3, obvious crystal and IG-fracture characteristics are observed in the fracture C3. Furthermore, the characteristics of IG fracture are also found in the fracture C4, but, compared with the fracture C3, more thin foliation-section tips are formed in the fracture C4, which is an important feature for distinguishing the tensile fracture along the foliation plane from one through the foliation plane.

4. Conclusions

In this study, uniaxial monotonic-loading and cyclic-loading tests were performed on slate specimens at different loading–foliation angles. The anisotropic mechanical properties, damage evolution, AE characteristics and fracture pattern of slate were investigated. This work contributes to a better understanding of the mechanical properties and damage mechanism of transversely isotropic rock, and is instructive for the stability assessment of rock structures in anisotropic formations. The main conclusions are summarized as follows:
(1)
The peak strength of specimens varies with the loading–foliation angle under cyclic loading, exhibiting a U-shaped trend similar to that observed under monotonic loading. The strength of the specimens at the same loading–foliation angle is close under both loading paths. The variation in elastic modulus of the specimens under uniaxial cyclic loading confirms the transversely isotropic model.
(2)
The secant moduli at different positions of the stress–strain curve exhibit unique variation characteristics under cyclic loading. These moduli can reflect the damage evolution process of the specimen with respect to various aspects. Eu and E20 reflect the influence of compaction and the damage effects on the specimen during cyclic loading and unloading. Es mainly reflects the damage of the specimen caused by the loading–unloading cycles, with Es being more effective in characterizing this feature than Es+.
(3)
The input of the total energy density of the specimen is mainly dependent on the loading–foliation angle at the same stress level. The elastic-energy density and the dissipated-energy density are affected by the loading–foliation angle, cyclic stress step and number of cycles. When the degree of damage in the rock is low, increasing the stress level of the cyclic load or increasing the number of cycles can reduce the proportion of dissipated energy. The damage variable is influenced by both the loading–foliation angle and the cyclic stress step.
(4)
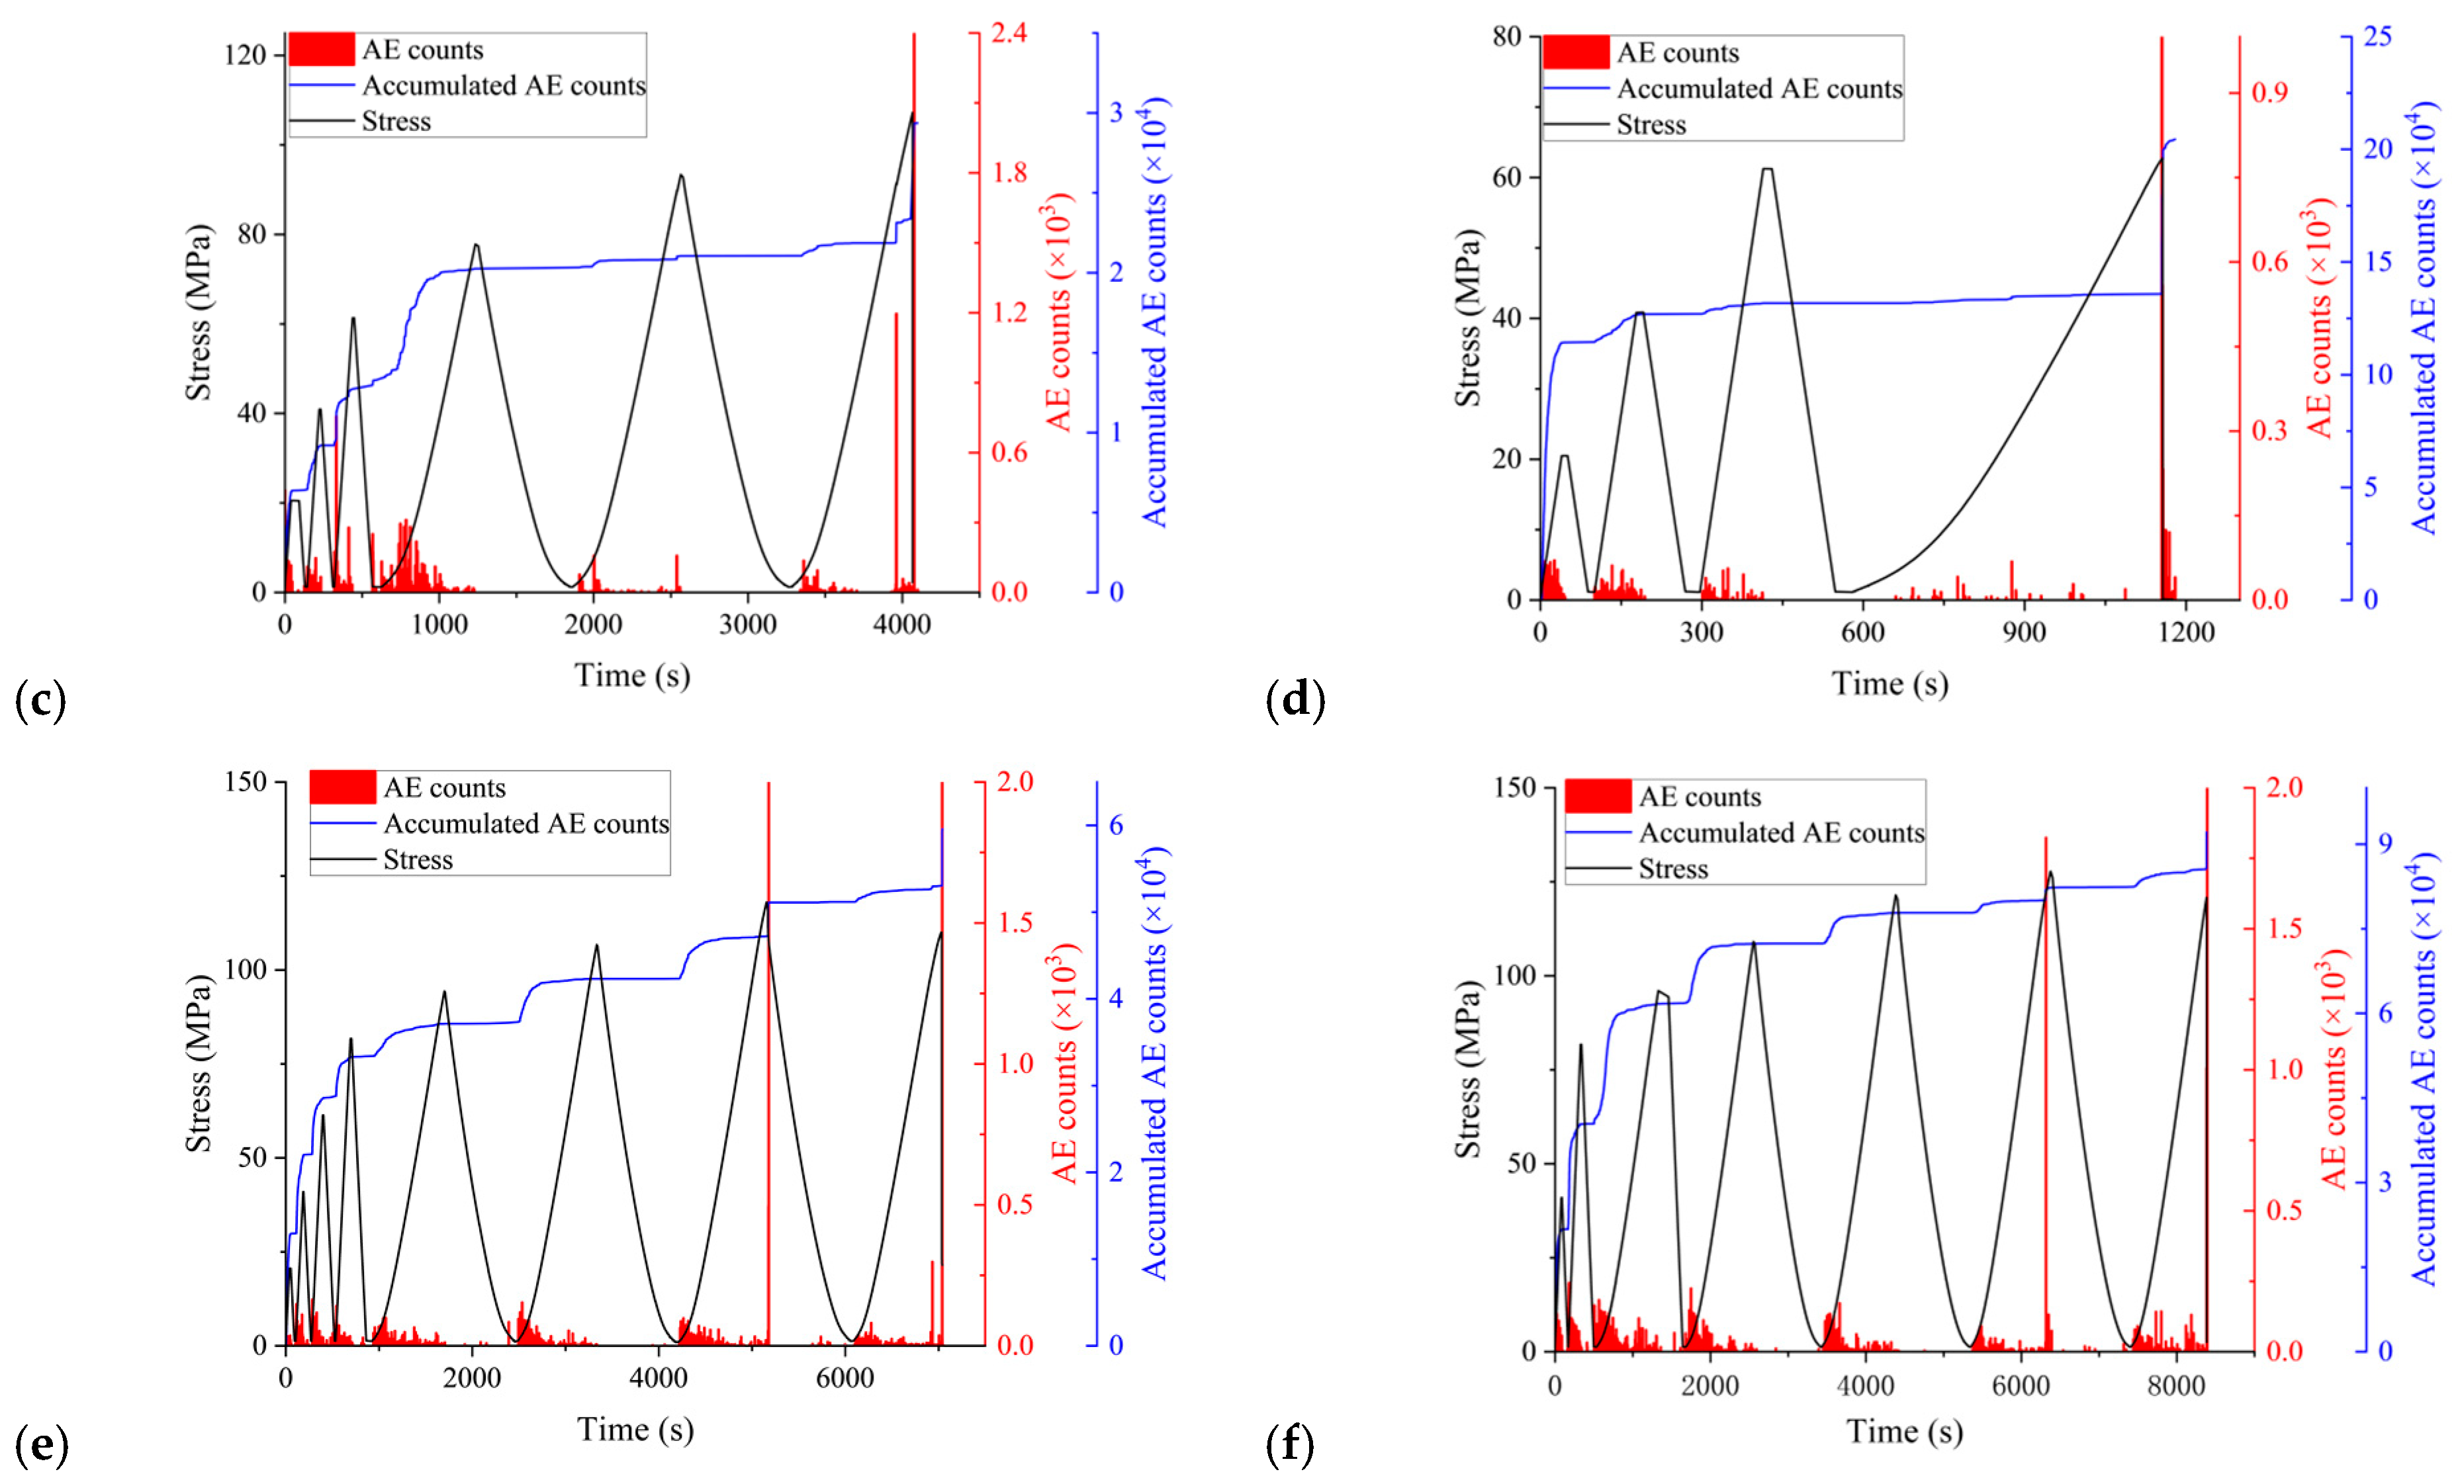
The AE characteristics of the specimen are closely related to the loading condition and the loading–foliation angle, presenting an obvious anisotropy. Under cyclic loading, regardless of cyclic stress step, the AE counts of specimens at β = 0° are concentrated near the peak region, consistent with the Kaiser effect, whereas those of specimens at the other loading–foliation angles are mainly distributed in the early stage of each cyclic-loading process, exhibiting an obvious Felicity effect.
(5)
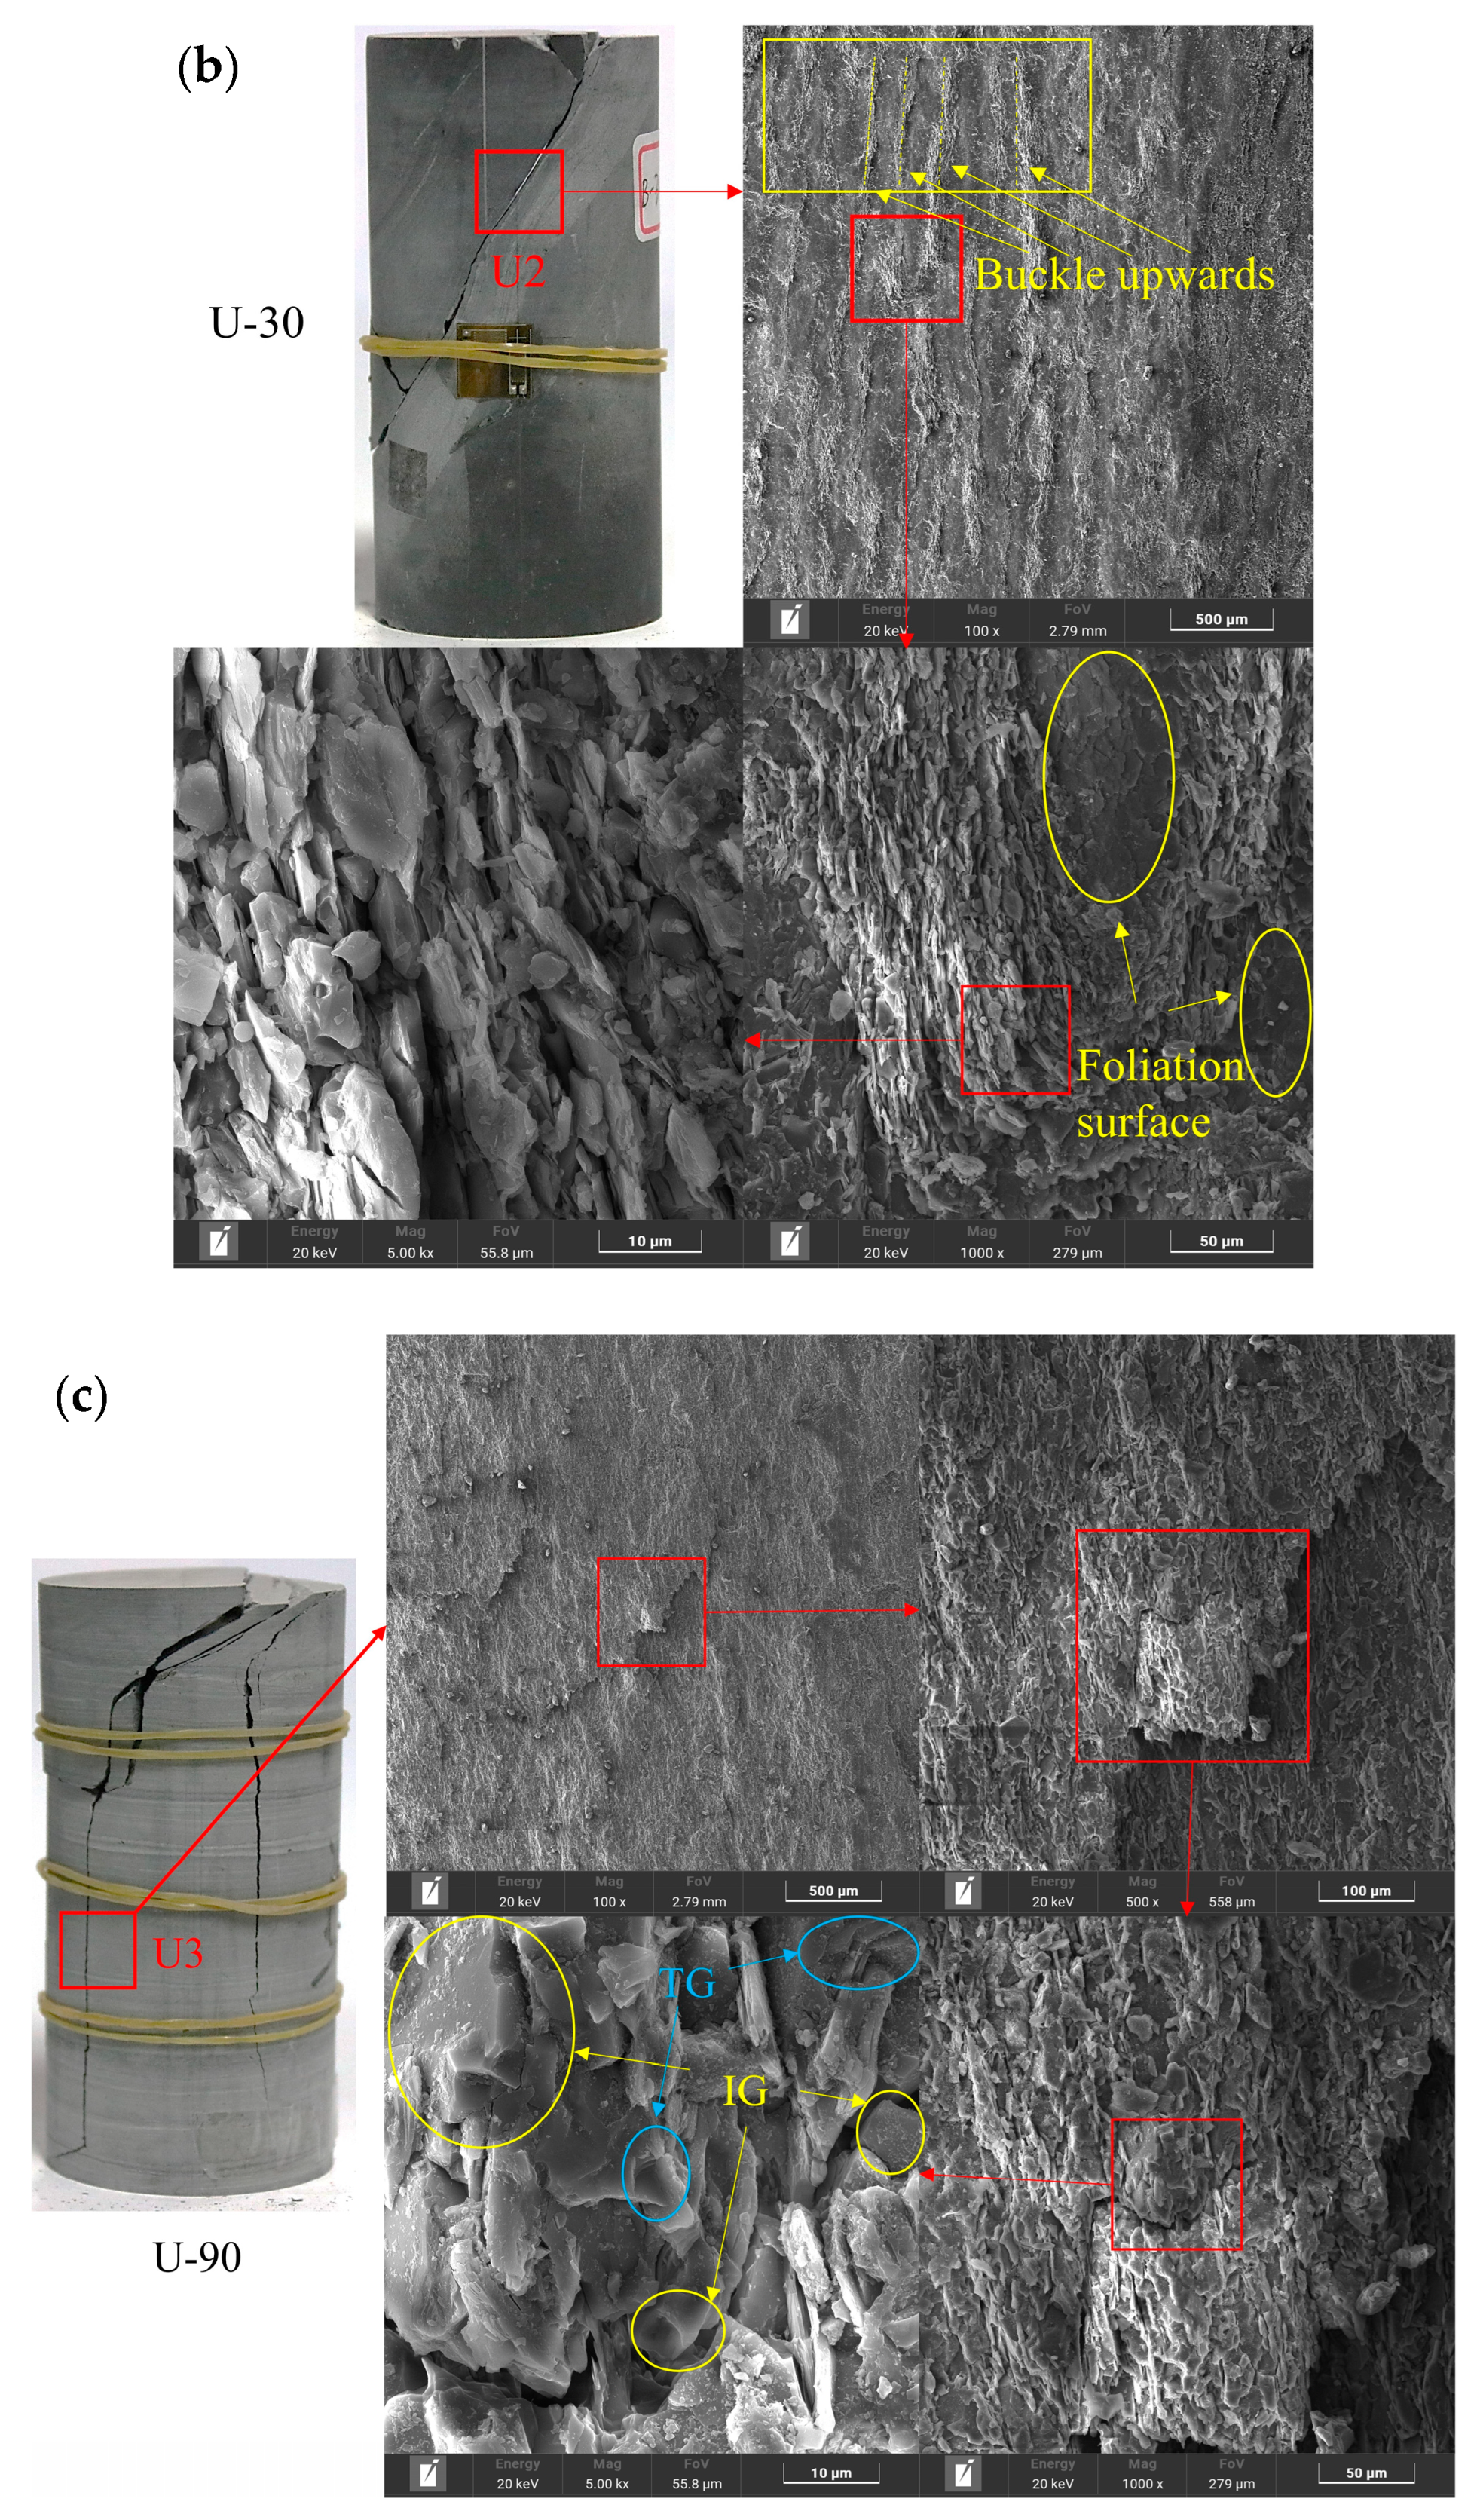
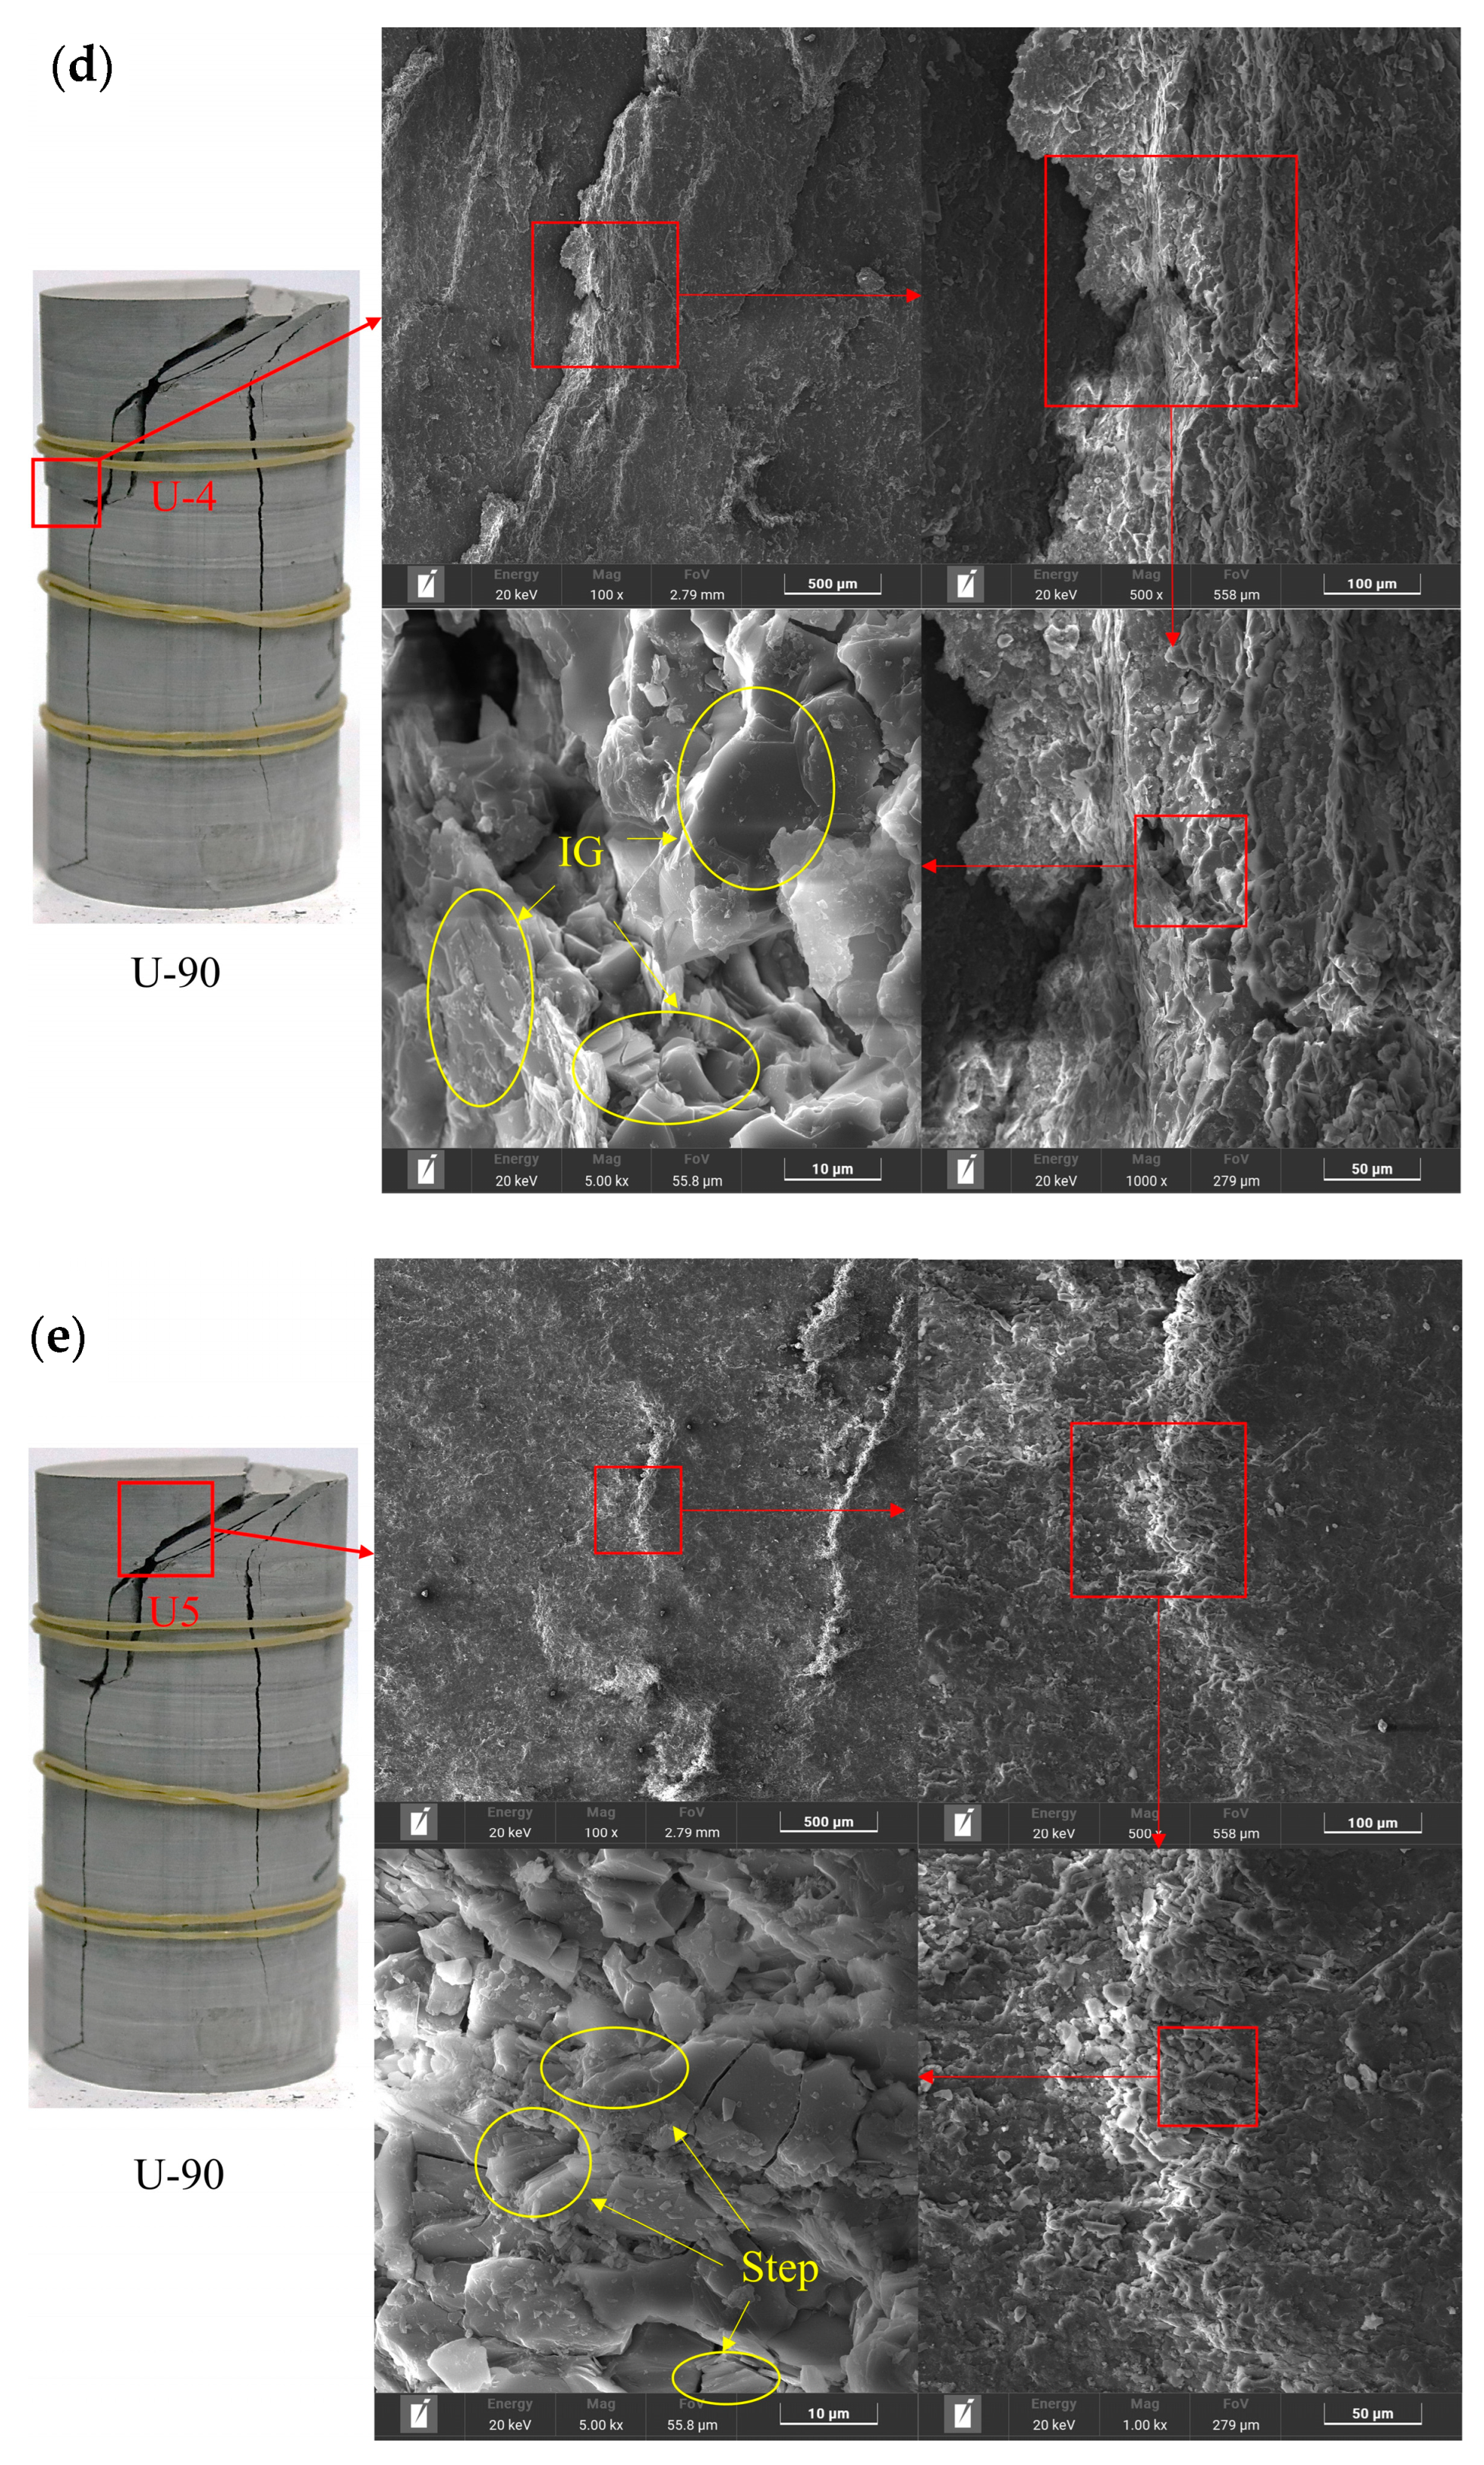
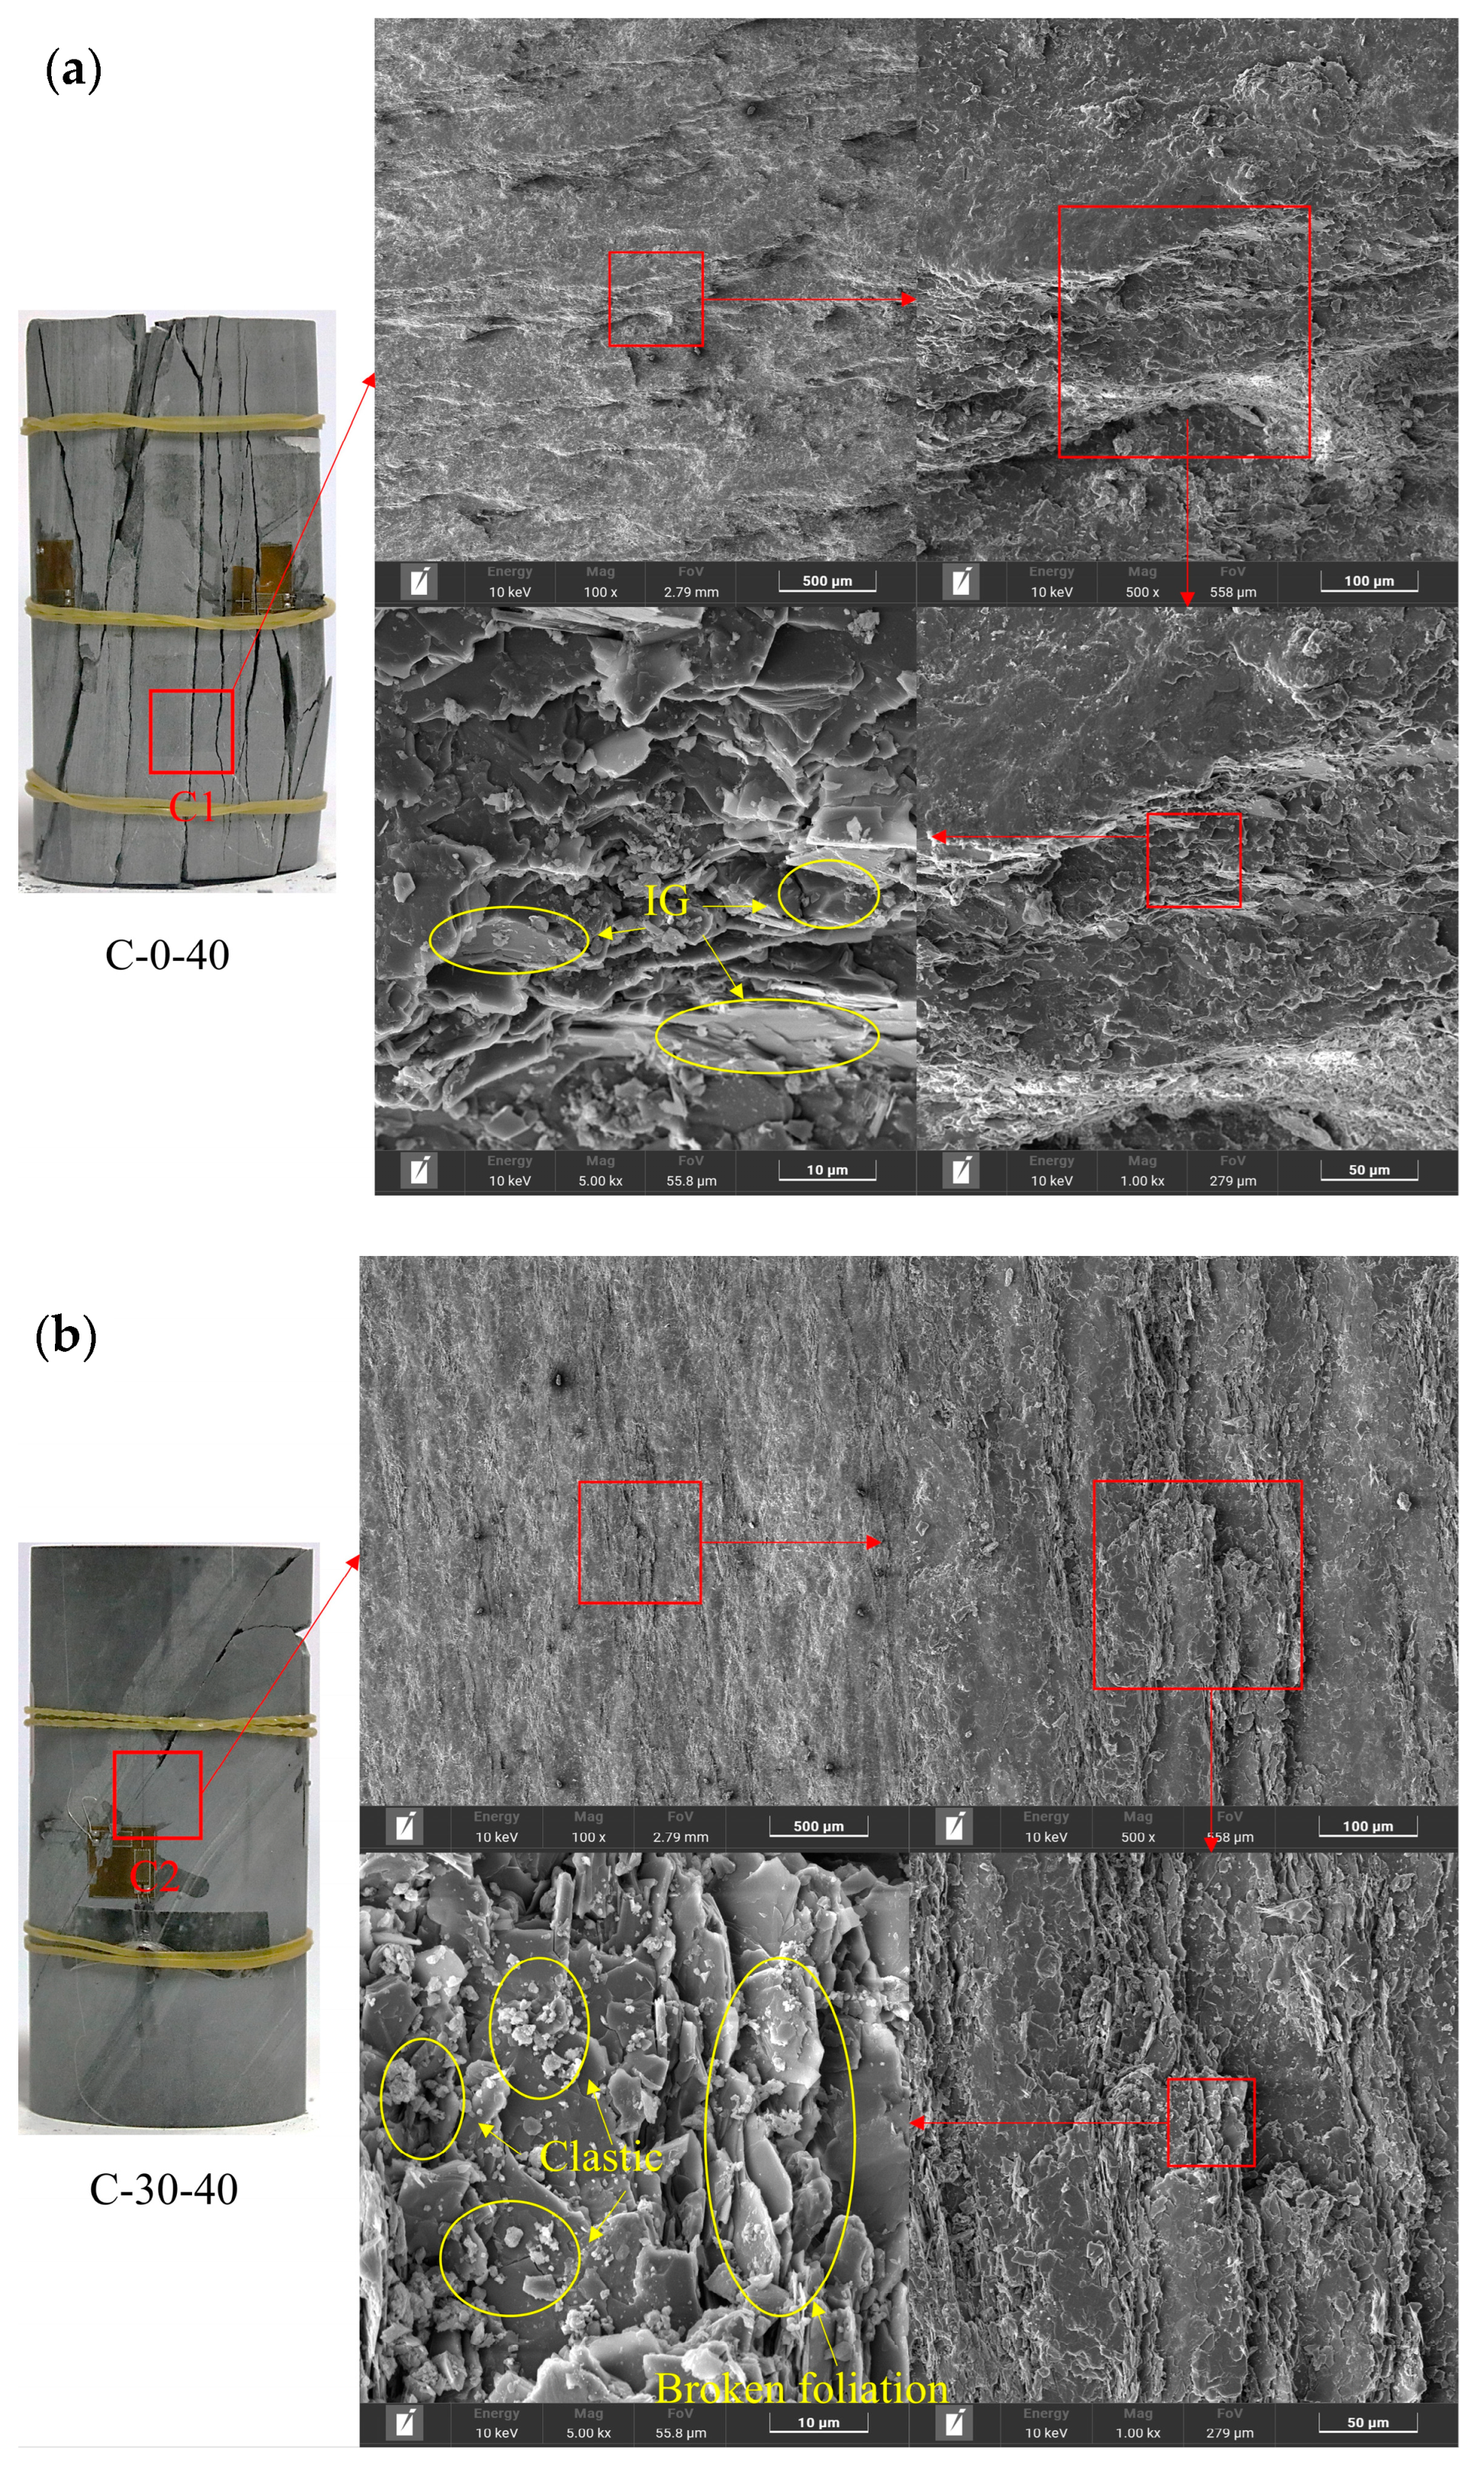
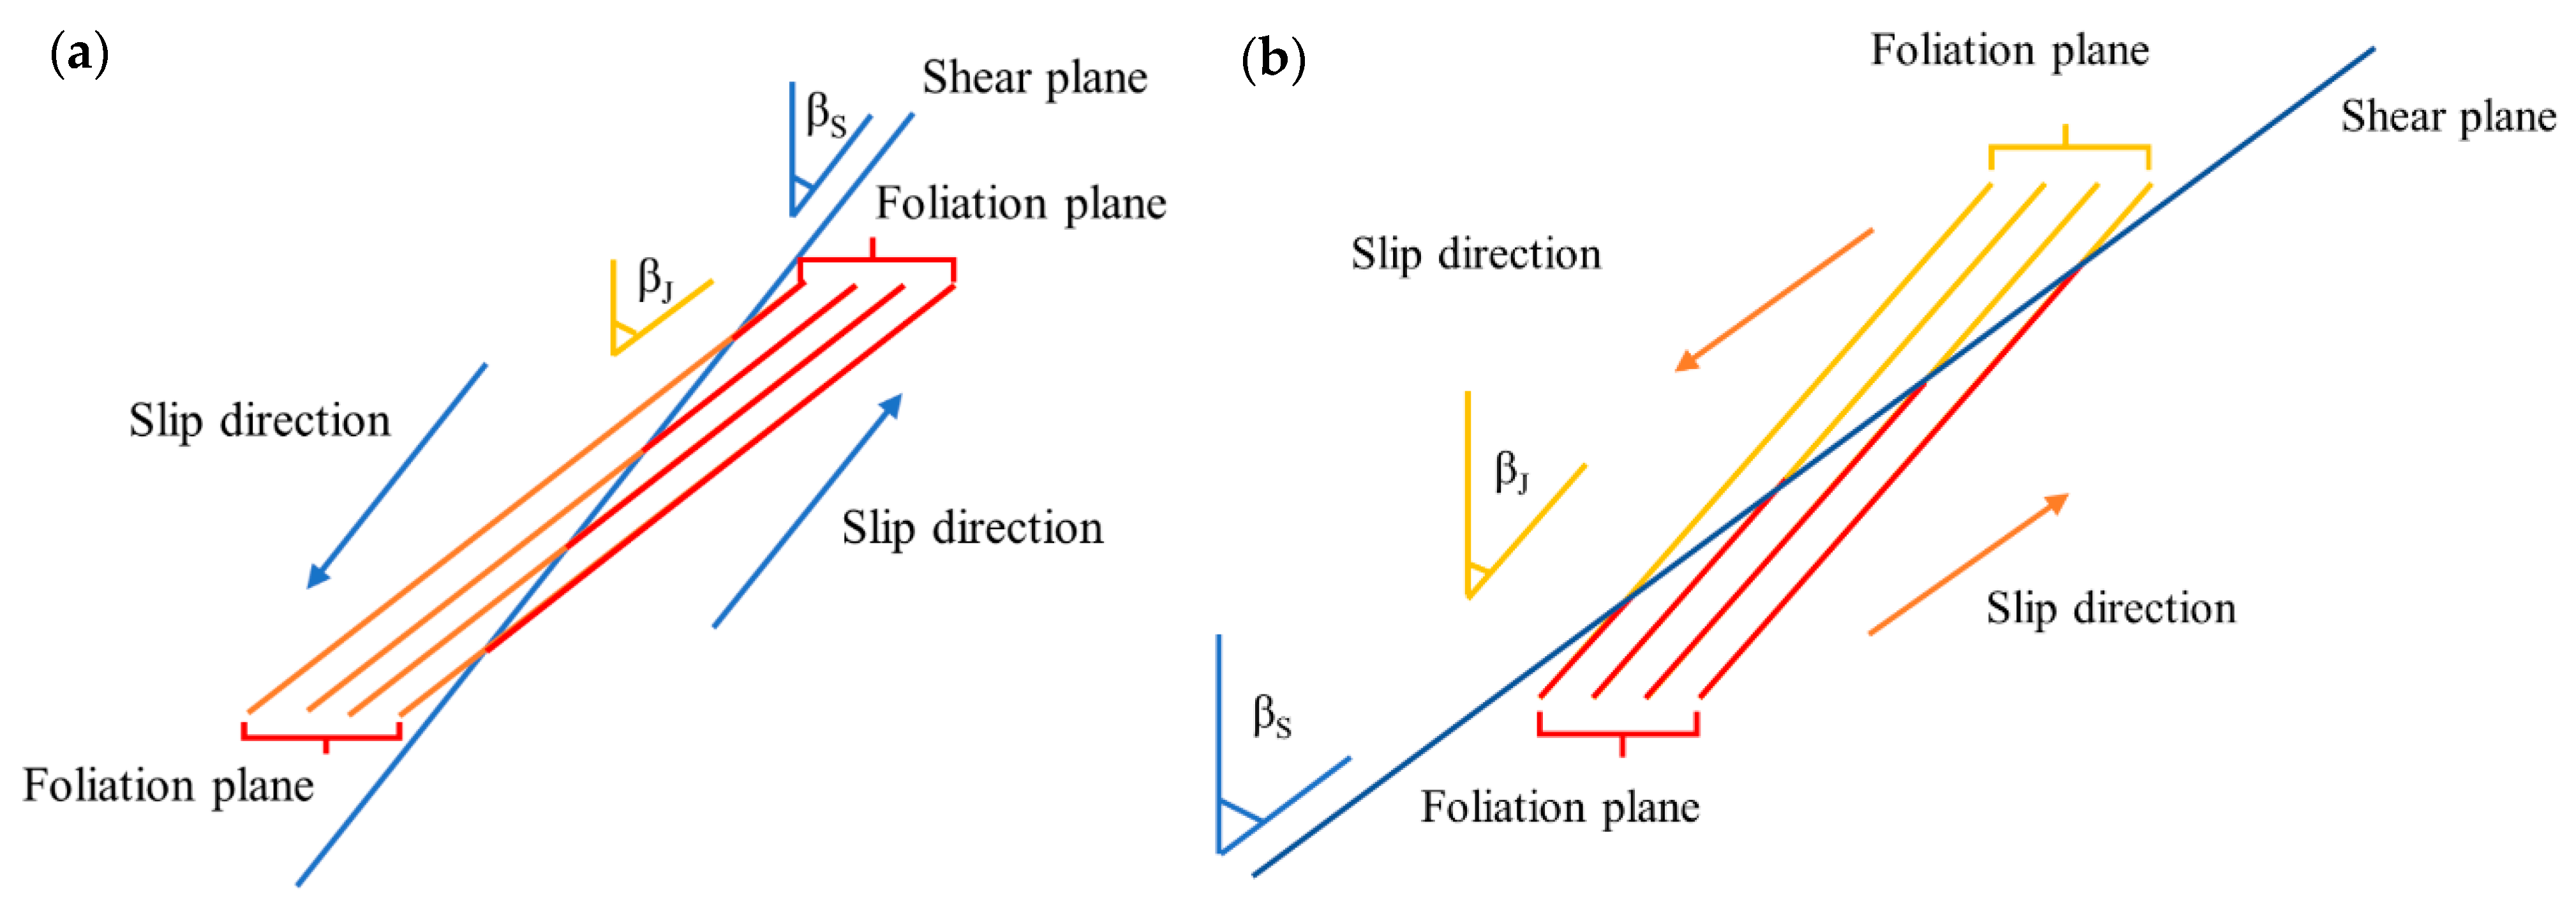
The failure mechanism of slate specimens is jointly determined by the loading–foliation angle, loading condition, and cyclic stress step. The fracture modes are classified into four categories: the tensile fracture along the foliation plane (β = 0°, 90°), the tensile fracture through the foliation plane (β = 30°, 90°), the shear fracture along the foliation plane (β = 30°, 45°) and the shear fracture through the foliation plane (β = 45°, 90°). The SEM images of corresponding fracture surfaces show different characteristics, with more rock debris formed in the fracture surface of the specimen subjected to cyclic loading than to monotonic loading.

Author Contributions

K.L.: conceptualization, methodology, writing—original draft, funding acquisition. G.D.: investigation, methodology, data curation, writing—original draft. J.L.: supervision, project administration, funding acquisition. D.H.: investigation, data curation, validation. Y.W.: writing—review and editing, resources. All authors have read and agreed to the published version of the manuscript.

Funding

This research was funded by (1) the National Natural Science Foundation of China (grant Nos. 52204119, 51979293, 52204118) and (2) the Natural Science Foundation of Hunan Province, China (grant No. 2023JJ40729).

Data Availability Statement

Data is contained within the article.

Conflicts of Interest

The authors declare no conflicts of interest.

References

  1. Amadei, B. Importance of anisotropy when estimating and measuring in situ stresses in rock. Int. J. Rock Mech. Min. Sci. Geomech. Abstr. 1996, 33, 293–325. [Google Scholar] [CrossRef]
  2. Jianyong, P. Strength of Transversely Isotropic Rocks. Ph.D. Thesis, Massachusetts Institute of Technology, Massachusetts Ave, Cambridge, UK, 2008. [Google Scholar]
  3. Li, K.; Yin, Z.-Y.; Han, D.; Fan, X.; Cao, R.; Lin, H. Size Effect and Anisotropy in a Transversely Isotropic Rock Under Compressive Conditions. Rock Mech. Rock Eng. 2021, 54, 4639–4662. [Google Scholar] [CrossRef]
  4. Wittke, W. Rock Mechanics Based on an Anisotropic Jointed Rock Model (AJRM), 1st ed.; Ernst & Sohn: Berlin, Germany, 2014; pp. 5–7. [Google Scholar]
  5. Li, K.; Yin, Z.Y.; Cheng, Y.; Cao, P.; Meng, J. Three-dimensional discrete element simulation of indirect tensile behaviour of a transversely isotropic rock. Int. J. Numer. Anal. Methods Geomech. 2020, 44, 1812–1832. [Google Scholar] [CrossRef]
  6. Sun, X.; Zhang, B.; Yang, K.; Guo, P.; Tao, Z. Large Deformation Mechanism of Foliated Rock and NPR Anchor Cable Support Technology in the Changning Tunnel: A Case Study. Rock Mech. Rock Eng. 2022, 55, 7243–7268. [Google Scholar] [CrossRef]
  7. Plúa, C.; Vu, M.N.; de La Vaissière, R.; Armand, G. In Situ Thermal Hydrofracturing Behavior of the Callovo-Oxfordian Claystone within the Context of the Deep Geological Disposal of Radioactive Waste in France. Rock Mech. Rock Eng. 2023. [Google Scholar] [CrossRef]
  8. Liu, Y.; Dai, F. A review of experimental and theoretical research on the deformation and failure behavior of rocks subjected to cyclic loading. J. Rock Mech. Geotech. 2021, 13, 1203–1230. [Google Scholar] [CrossRef]
  9. Shi, Z.; Li, J.; Wang, M.; Tan, H.; Lin, H.; Li, K. Effect of temperature on pure mode III fracture behavior and fracture morphology of granite after thermal shock. Theor. Appl. Fract. Mech. 2023, 127, 104024. [Google Scholar] [CrossRef]
  10. Wang, M.; Li, J.; Tan, H.; Wang, J.; Shi, Z.; Li, K. Study on fatigue characteristics and thermal damage mechanism of red sandstone under high temperature-cyclic load coupling. Int. J. Fatigue 2023, 168, 107405. [Google Scholar] [CrossRef]
  11. He, M.C.; Ren, F.Q.; Cheng, C. Experimental and numerical analyses on the effect of stiffness on bedded sandstone strain burst with varying dip angle. Bull. Eng. Geol. Environ. 2019, 78, 3593–3610. [Google Scholar] [CrossRef]
  12. Ge, X.R.; Jiang, Y.; Lu, Y.; Ren, J. Testing study on fatigue deformation law of rock under cyclic loading. Yanshilixue Yu Gongcheng Xuebao/Chin. J. Rock Mech. Eng. 2003, 22, 1581–1585. [Google Scholar] [CrossRef]
  13. Yang, S.Q.; Ranjith, P.G.; Huang, Y.H.; Yin, P.F.; Jing, H.W.; Gui, Y.L.; Yu, Q.L. Experimental investigation on mechanical damage characteristics of sandstone under triaxial cyclic loading. Geophys. J. Int. 2015, 201, 662–682. [Google Scholar] [CrossRef]
  14. Jiang, C.; Duan, M.; Yin, G.; Wang, J.G.; Lu, T.; Xu, J.; Zhang, D.; Huang, G. Experimental study on seepage properties, AE characteristics and energy dissipation of coal under tiered cyclic loading. Eng. Geol. 2017, 221, 114–123. [Google Scholar] [CrossRef]
  15. Peng, K.; Zhou, J.; Zou, Q.; Song, X. Effect of loading frequency on the deformation behaviours of sandstones subjected to cyclic loads and its underlying mechanism. Int. J. Fatigue 2020, 131, 105349. [Google Scholar] [CrossRef]
  16. Meng, Q.-b.; Liu, J.-f.; Huang, B.-x.; Pu, H.; Wu, J.-y.; Zhang, Z.-z. Effects of Confining Pressure and Temperature on the Energy Evolution of Rocks Under Triaxial Cyclic Loading and Unloading Conditions. Rock Mech. Rock Eng. 2022, 55, 773–798. [Google Scholar] [CrossRef]
  17. Yang, S.Q.; Huang, Y.H.; Tang, J.Z. Mechanical, acoustic, and fracture behaviors of yellow sandstone specimens under triaxial monotonic and cyclic loading. Int. J. Rock Mech. Min. Sci. 2020, 130, 104268. [Google Scholar] [CrossRef]
  18. Zhang, Y.J.; Zhao, Y.L.; Liu, Q.; Li, Y.; Lin, H.; Ma, J.J. Energy Evolution Law of Sandstone Material during Post-Peak Cyclic Loading and Unloading under Hydraulic Coupling. Sustainability 2024, 16, 24. [Google Scholar] [CrossRef]
  19. Sinaie, S.; Heidarpour, A.; Zhao, X.L.; Sanjayan, J.G. Effect of size on the response of cylindrical concrete samples under cyclic loading. Constr. Build. Mater. 2015, 84, 399–408. [Google Scholar] [CrossRef]
  20. Peng, K.; Zhou, J.; Zou, Q.; Zhang, J.; Wu, F. Effects of stress lower limit during cyclic loading and unloading on deformation characteristics of sandstones. Constr. Build. Mater. 2019, 217, 202–215. [Google Scholar] [CrossRef]
  21. Liu, Y.; Dai, F.; Feng, P.; Xu, N.-w. Mechanical behavior of intermittent jointed rocks under random cyclic compression with different loading parameters. Soil Dyn. Earthq. Eng. 2018, 113, 12–24. [Google Scholar] [CrossRef]
  22. Duan, H.; Yang, Y. Deformation and Dissipated Energy of Sandstone Under Uniaxial Cyclic Loading. Geotech. Geol. Eng. 2018, 36, 611–619. [Google Scholar] [CrossRef]
  23. Tang, J.H.; Chen, X.D.; Dai, F. Experimental study on the crack propagation and acoustic emission characteristics of notched rock beams under post-peak cyclic loading. Eng. Fract. Mech. 2020, 226, 106890. [Google Scholar] [CrossRef]
  24. Zhao, Y.L.; Liu, J.H.; Zhang, C.S.; Liao, J.; Zhu, S.T.; Zhang, L.Y. Mechanical behavior of sandstone during post-peak cyclic loading and unloading under hydromechanical coupling (vol 33, pg 927, 2023). Int. J. Min. Sci. Technol. 2023, 33, 1317. [Google Scholar] [CrossRef]
  25. Xiao, J.-Q.; Ding, D.-X.; Jiang, F.-L.; Xu, G. Fatigue damage variable and evolution of rock subjected to cyclic loading. Int. J. Rock Mech. Min. Sci. 2010, 47, 461–468. [Google Scholar] [CrossRef]
  26. Li, T.T.; Pei, X.J.; Wang, D.P.; Huang, R.Q.; Tang, H. Nonlinear behavior and damage model for fractured rock under cyclic loading based on energy dissipation principle. Eng. Fract. Mech. 2019, 206, 330–341. [Google Scholar] [CrossRef]
  27. Yang, S.; Zhang, N.; Feng, X.; Kan, J.; Pan, D.; Qian, D. Experimental Investigation of Sandstone under Cyclic Loading: Damage Assessment Using Ultrasonic Wave Velocities and Changes in Elastic Modulus. Shock. Vib. 2018, 2018, 7845143. [Google Scholar] [CrossRef]
  28. Wang, Y.; Feng, W.K.; Li, C.H. On anisotropic fracture and energy evolution of marble subjected to triaxial fatigue cyclic-confining pressure unloading conditions. Int. J. Fatigue 2020, 134, 105524. [Google Scholar] [CrossRef]
  29. Bao, H.; Pei, R.; Lan, H.; Yan, C.; Xu, J.; Zhai, Y.; Xu, X. Damage evolution of Biotite quartz schist caused by mineral directional arrangement under cyclic loading and unloading. Yanshilixue Yu Gongcheng Xuebao/Chin. J. Rock Mech. Eng. 2021, 40, 2015–2026. [Google Scholar] [CrossRef]
  30. Zhang, T.; Xu, W.Y.; Wang, H.L.; Wang, R.B.; Yan, L.; Hu, M.T. Anisotropic mechanical behaviour of columnar jointed rock masses subjected to cyclic loading: An experimental investigation. Int. J. Rock Mech. Min. Sci. 2021, 148, 14. [Google Scholar] [CrossRef]
  31. Fairhurst, C.E.; Hudson, J.A. Draft ISRM suggested method for the complete stress-strain curve for intact rock in uniaxial compression. Int. J. Rock Mech. Min. Sci. Geomech. Abstr. 1999, 36, 281–289. [Google Scholar]
  32. Li, K.; Cheng, Y.; Yin, Z.-Y.; Han, D.; Meng, J. Size Effects in a Transversely Isotropic Rock Under Brazilian Tests: Laboratory Testing. Rock Mech. Rock Eng. 2020, 53, 2623–2642. [Google Scholar] [CrossRef]
  33. Zhang, W.; Sun, Q.; Hao, S.; Geng, J.; Lv, C. Experimental study on the variation of physical and mechanical properties of rock after high temperature treatment. Appl. Therm. Eng. 2016, 98, 1297–1304. [Google Scholar] [CrossRef]
  34. Jaeger, J.C. Shear Failure of Anistropic Rocks. Geol. Mag. 1960, 97, 65–72. [Google Scholar] [CrossRef]
  35. Donath, F.A. Experimental study of shear failure in anisotropic rocks. GSA Bull. 1961, 72, 985–989. [Google Scholar] [CrossRef]
  36. Saeidi, O.; Vaneghi, R.G.; Rasouli, V.; Gholami, R. A modified empirical criterion for strength of transversely anisotropic rocks with metamorphic origin. Bull. Eng. Geol. Environ. 2013, 72, 257–269. [Google Scholar] [CrossRef]
  37. Zhang, J.; Du, R.; Chen, Y.; Huang, Z. Experimental Investigation of the Mechanical Properties and Energy Evolution of Layered Phyllite Under Uniaxial Multilevel Cyclic Loading. Rock Mech. Rock Eng. 2023, 56, 4153–4168. [Google Scholar] [CrossRef]
  38. Cho, J.W.; Kim, H.; Jeon, S.; Min, K.B. Deformation and strength anisotropy of Asan gneiss, Boryeong shale, and Yeoncheon schist. Int. J. Rock Mech. Min. Sci. 2012, 50, 158–169. [Google Scholar] [CrossRef]
  39. Li, C.; Gao, C.; Xie, H.; Li, N. Experimental investigation of anisotropic fatigue characteristics of shale under uniaxial cyclic loading. Int. J. Rock Mech. Min. Sci. 2020, 130, 104314. [Google Scholar] [CrossRef]
  40. You, M.; Su, C. Experimental study on strengthening of marble specimen in cyclic loading of uniaxial or pseudo-triaxial compression. Guti Lixue Xuebao/Acta Mech. Solida Sin. 2008, 29, 66–72. [Google Scholar] [CrossRef]
  41. Xie, H.; Li, L.; Peng, R.; Ju, Y. Energy analysis and criteria for structural failure of rocks. J. Rock Mech. Geotech. 2009, 1, 11–20. [Google Scholar] [CrossRef]
  42. Wang, J.A.; Park, H.D. Comprehensive prediction of rockburst based on analysis of strain energy in rocks. Tunn. Undergr. Space Technol. 2001, 16, 49–57. [Google Scholar] [CrossRef]
  43. Scruby, C.B. An introduction to acoustic emission. J. Phys. E Sci. Instrum. 1987, 20, 946. [Google Scholar] [CrossRef]
  44. Yang, S.-Q.; Jing, H.-W.; Wang, S.-Y. Experimental Investigation on the Strength, Deformability, Failure Behavior and Acoustic Emission Locations of Red Sandstone Under Triaxial Compression. Rock Mech. Rock Eng. 2012, 45, 583–606. [Google Scholar] [CrossRef]
  45. Yin, T.; Yin, J.; Wu, Y.; Yang, Z.; Liu, X.; Zhuang, D. Water saturation effects on the mechanical characteristics and fracture evolution of sandstone containing pre-existing flaws. Theor. Appl. Fract. Mech. 2022, 122, 103605. [Google Scholar] [CrossRef]
  46. Wang, H.; Liu, D.; Cui, Z.; Cheng, C.; Jian, Z. Investigation of the fracture modes of red sandstone using XFEM and acoustic emissions. Theor. Appl. Fract. Mech. 2016, 85, 283–293. [Google Scholar] [CrossRef]
  47. Xu, G.; He, C.; Su, A.; Chen, Z. Experimental investigation of the anisotropic mechanical behavior of phyllite under triaxial compression. Int. J. Rock Mech. Min. Sci. 2018, 104, 100–112. [Google Scholar] [CrossRef]
  48. Erarslan, N.; Williams, D.J. Mechanism of rock fatigue damage in terms of fracturing modes. Int. J. Fatigue 2012, 43, 76–89. [Google Scholar] [CrossRef]
  49. Fan, J.; Chen, J.; Jiang, D.; Ren, S.; Wu, J. Fatigue properties of rock salt subjected to interval cyclic pressure. Int. J. Fatigue 2016, 90, 109–115. [Google Scholar] [CrossRef]
Figure 1. Slate specimens with different loading–foliation angles.
Applsci 14 04988 g001
Figure 2. P-wave velocity as a function of foliation angle.
Applsci 14 04988 g002
Figure 3. The test procedure and the test equipment.
Applsci 14 04988 g003
Figure 4. The cyclic-loading and unloading path.
Applsci 14 04988 g004
Figure 5. Stress−strain curve and peak strengths of specimens at different loading−foliation angles under monotonic loading: (a) stress−strain curves and (b) peak strength and fitted curve.
Applsci 14 04988 g005
Figure 6. Stress−strain curves and peak strengths of specimens at different loading−foliation angles under cyclic loading: (a) stress−strain curves at cyclic stress step of 20 MPa; (b) stress−strain curves at cyclic stress step of 40 MPa and (c) peak strength of all specimens.
Applsci 14 04988 g006
Figure 7. The evolution of Eu with the cycle number for specimens at different loading−foliation angles: (a) β = 0°; (b) β = 30°; (c) β = 45°; and (d) β = 90°.
Applsci 14 04988 g007aApplsci 14 04988 g007b
Figure 8. The evolution of E20 with the cycle number for specimens at different loading−foliation angles: (a) β = 0°; (b) β = 30°; (c) β = 45°; and (d) β = 90°.
Applsci 14 04988 g008aApplsci 14 04988 g008b
Figure 9. The evolution of Es with the cycle number for specimens at different loading−foliation angles: (a) β = 0°; (b) β = 30°; (c) β = 45°; and (d) β = 90°.
Applsci 14 04988 g009
Figure 10. (a) Stress−strain curve and partially enlarged inset of specimen C-0-20 and (b) similar finding of You and Su [40].
Applsci 14 04988 g010
Figure 11. Schematic diagram of the nth loading-and-unloading process.
Applsci 14 04988 g011
Figure 12. The relationship between u and stress level for specimens at (a) cyclic stress step of 20 MPa; (b) β = 0°; (c) β = 30°; and (d) β = 90°.
Applsci 14 04988 g012aApplsci 14 04988 g012b
Figure 13. The relationship between ue and stress level for specimens at (a) cyclic stress step of 20 MPa; (b) β = 0°; (c) β = 30°; and (d) β = 90°.
Applsci 14 04988 g013aApplsci 14 04988 g013b
Figure 14. The relationship between ud and stress level for specimens at (a) cyclic stress step of 20 MPa; (b) β = 0°; (c) β = 30°; and (d) β = 90°.
Applsci 14 04988 g014aApplsci 14 04988 g014b
Figure 15. The relationship between ud/u and stress level for specimens at (a) cyclic stress step of 20 MPa; (b) β = 0°; (c) β = 30°; and (d) β = 90°.
Applsci 14 04988 g015
Figure 16. The relationship between damage variable and normalized cycle number for specimens at (a) cyclic stress step of 20 MPa; (b) β = 0°; (c) β = 30°; and (d) β = 90°.
Applsci 14 04988 g016
Figure 17. Evolutions of stress, AE counts and cumulative AE counts with time for specimens under monotonic loading: (a) β = 0°; (b) β = 30°; (c) β = 45°; and (d) β = 90°.
Applsci 14 04988 g017
Figure 18. Evolutions of stress, AE counts and cumulative AE counts with time for specimens under cyclic loading: (a) C-0-20; (b) C-0-40; (c) C-30-20; (d) C-45-20; (e) C-90-20; and (f) C-90-40.
Applsci 14 04988 g018aApplsci 14 04988 g018b
Figure 19. Failure modes of the slate specimens under (a) monotonic and (b) cyclic-loading conditions.
Applsci 14 04988 g019
Figure 20. Microscopic morphology of different fractures in specimens under monotonic loading by SEM scanning: (a) U1; (b) U2; (c) U3; (d) U4; and (e) U5.
Applsci 14 04988 g020aApplsci 14 04988 g020bApplsci 14 04988 g020c
Figure 21. Microscopic morphology of different fractures in specimens under cyclic loading by SEM scanning: (a) C1; (b) C2; (c) C3; and (d) C4.
Applsci 14 04988 g021aApplsci 14 04988 g021b
Figure 22. The formation mechanisms of the fractures (a) U2 and (b) C2.
Applsci 14 04988 g022
Table 1. Test scheme for slate specimens considering the loading path and the loading angle.
Loading PathSpecimen Nameβ (°)Cyclic Stress Step (MPa)Number of Cycles (Force Control + Displacement Control)
Monotonic loadingU-00\\
U-3030\\
U-4545\\
U-9090\\
Cyclic loading and unloadingC-0-200206 + 2
C-0-400403 + 1
C-30-2030203 + 3
C-30-4030402 + 2
C-45-2045203 + 1
C-90-2090204 + 4
C-90-4090403 + 4
Table 2. Elastic moduli of specimens at different loading–foliation angles.
β (°)0304590
E (GPa)20.3916.1515.4913.57
Table 3. Fitting parameters for the relationship between u and stress level of different specimens.
Specimen NameQuadratic CoefficientPrimary Term CoefficientNumber of Fit PointsCorrelation Coefficient
C-0-200.0220.39980.9998
C-0-400.0200.62440.9999
C-30-200.0250.55360.9998
C-30-400.0230.70141.0000
C-45-200.0270.74140.9999
C-90-200.0300.53680.9998
C-90-400.0320.40970.9981
Table 4. The calculated values of uN, ue,N and ud,N for different specimens under cyclic loading.
Specimen NameuN (kJ/m3)ue,N (kJ/m3)ud,N (kJ/m3)
C-0-20382.58306.0576.53
C-0-40453.46255.23198.23
C-30-20359.82292.9666.85
C-30-40247.14215.9331.21
C-45-20147.91115.8032.11
C-90-20482.01331.05150.97
C-90-40512.15396.38115.77
Disclaimer/Publisher’s Note: The statements, opinions and data contained in all publications are solely those of the individual author(s) and contributor(s) and not of MDPI and/or the editor(s). MDPI and/or the editor(s) disclaim responsibility for any injury to people or property resulting from any ideas, methods, instructions or products referred to in the content.

