Article

Ultrasonic Pulse-Echo Signals for Quantitative Assessment of Reinforced Concrete Anomalies

1
College of Engineering and Computer Sciences, Marshall University, Huntington, WV 25755, USA
2
Department of Civil Engineering, Nanjing University of Science and Technology, Nanjing 210094, China
*
Author to whom correspondence should be addressed.
Appl. Sci. 2024, 14(11), 4860; https://doi.org/10.3390/app14114860
Submission received: 18 March 2024 / Revised: 19 May 2024 / Accepted: 21 May 2024 / Published: 4 June 2024
(This article belongs to the Section Civil Engineering)

Abstract

:
This paper presents a study to accurately evaluate defects in concrete decks using ultrasonic pulse-echo signals. A reinforced concrete deck with void defects was designed and evaluated for validation, and a commercial ultrasonic pulse-echo (UPE) device was used to obtain the 2D images of the void defect inside the deck. The UPE image is based on the ultrasonic shear-wave test method and an extended synthetic aperture focusing technique (SAFT). To enhance the accuracy of the defect location in the SAFT imaging, the recorded A-scan data from UPE was analyzed using an advanced denoising approach and defect echo peak extraction, which are based on empirical modal decomposition, Hurst exponent characterization, and Hilbert envelope estimation. The results demonstrated that the location and depth of the void defect in the deck can be accurately assessed by using the developed approach. The new method provides quantitative information of the anomalies inside the deck, which can be used to calibrate the qualitative images of UPC devices with the SAFT.

1. Introduction

Poor construction processes associated with concrete quality can affect the load-carrying capacity of an engineering structure. A common problem arising from these practices is usually cavities, cracks, internal voids, which frequently occur below the concrete surface and cannot be found outside the concrete structure. These defects of high magnitude affect the concrete core and can cause a considerable decrease in the properties of the concrete elements. The internal flaw detection method uses nondestructive testing (NDT), which consists of a broad group of analysis techniques to evaluate specific properties and conditions of concrete without deteriorating or destroying the specimen [1,2].
The American Concrete Institute report ACI228.2R3 summarizes a few NDT methods used for concrete, one of which uses ultrasonic pulse-echo waves for flaw detection. Pulse-echo equipment consists of grouped piezoelectric transducers that allow for an operator to analyze an element on a single face without accessing the opposite side of the concrete element [3]. The pulse-echo technique uses the synthetic aperture focusing technique (SAFT), which is a post-processing signal designed to improve the result of an area scan to locate concrete defects [4,5,6,7]. This technique has been employed in many studies to locate voids in concrete [8,9,10].
The basic principle of UPE testing relies on a transmitter to transform the energy of an electrical voltage into an ultrasonic wave. The ultrasonic wave travels at a velocity dependent upon the concrete properties. The ultrasonic wave travels through the concrete until a void/defect (or boundary) reflects the signal. The reflected signal travels back through the material to the receiver. The receiver converts the mechanical energy back to electrical energy, amplified as an echo, and recorded as an A-scan [11,12,13].
Figure 1 shows the schematic of a typical ultrasound reflection principle in a UPE device, with a transmitting and a receiving transducer. Equation (1) allows for accurate calculation of the depth of the reflecting interface of the defect, Z. C s refers to the material’s shear-wave speed, t is the travel time measured, and X is the horizontal spacing between the transmitter and the defect location (Equation (1)) [7,11]. To understand the physical properties of material better, it is essential to consider its density (φ), Poisson’s ratio (µ), modulus of elasticity (E), and shear modulus (G). By analyzing these factors, we can gain valuable insights into the behavior and characteristics of the material (Equation (2)).
Z = C s t 2 2 X 2
C s = E φ 1 2 1 + μ = G φ
If applied effectively, UPE devices can be employed in the construction industry to inspect and evaluate the quality of reinforced concrete structures. Commercially available UPE devices, such as MIRA, EyeCon, and Pundit, utilize the tomography technique to generate images of the interior concrete, which can help identify potential imperfections [14,15,16]. In this study, the dry-point-contact transducer array unit was used to enhance the accuracy of the inspection further. The UPE device used in this study is a low-frequency ultrasonic shear-wave tomography device with a surface longitudinal spacing of 30 mm, making it an excellent tool for detecting even the smallest defects in concrete structures.
Conventional software of UPE (v7.3.5) devices has limited the application to image concrete structures because of the assumption of a single-layer homogeneous, isotropic medium for concrete. A concrete bridge deck is a complex structure with multiple layers of different materials, each with varying shear-wave velocities. Due to this variation, the software used for inspection may provide inaccurate information about the multi-layered bridge deck, including depth, thickness, and internal defects. Furthermore, the software’s signal processing may not accurately present reflected waves at the surface and defects. The real heterogeneous materials may result in the generation of non-linear features in wave propagation. The irregular surface texture may cause sensor contact variation and create a stochastic signal.
Pulse-echo testing is a nondestructive technique that uses ultrasonic waves to detect material defects. The technique works by analyzing the amplitude of the echo signal and the time it takes for the signal to reach the receiver. This information helps determine the defect’s presence, size, and location. One of the primary advantages of the pulse-echo technique is its flexibility in testing large and irregularly shaped objects. However, the technique has a significant drawback: the loss of sensitivity near the test surface due to the coupling of the transducer with the test specimen. The ultrasonic signal passes through several materials before reaching the test specimen, including a coupling element and a transducer body. The reflected signals create near-field noise in the A-scan, which shows a reflector at each material interface.
The amplitude of the received echo depends on several factors, such as the transmitter power, direction of the transmission, size of the reflector, surface irregularities of the reflector, the reflector’s position and orientation, the receiver’s size and orientation, loss of signal at the receiver due to re-reflection and lack of coupling, attenuation of the sound wave due to absorption and scattering, and shadow effects [17,18,19,20,21].
Ultrasonic testing is an effective method for detecting internal defects in concrete structures. However, interpreting ultrasonic testing data is a crucial task requiring extensive expertise. Various methods have been developed to overcome this challenge, including the widely used mature industrial ultrasonic imaging method, SAFT. These methods have shown promising results in detecting internal defects of concrete structures. However, it is essential to note that most of these methods can only qualitatively determine the presence of defects in concrete and cannot quantitatively detect the position and size of these defects.
Accurate positioning, precise evaluation, and clear visualization of void defects are essential for assessing the safety and performance of concrete structures. Unfortunately, the conventional SAFT method is often plagued by background noise and image artifacts, primarily due to the low-frequency ultrasonic pulse with a long wavelength. Consequently, the resulting image tends to droop, resulting in suboptimal quality outcomes.
Ultrasonic array devices are now widely employed to visualize the insides of concrete structures nondestructively. However, the data collected by these devices may sometimes need to be clarified, requiring the use of image reconstruction algorithms to achieve clear images. Low-frequency UPE devices can combat the issue of signal attenuation in concrete structures. These devices emit low-frequency ultrasonic pulses that reduce signal attenuation, pulse duration, and image sagging, resulting in fewer image distortions and an overall improvement in quality.
The UPE device has an impressive collection of ultrasonic transducers that can measure multiple pulse-echo signals in a single scan. This advanced process results in a comprehensive cross-sectional image of the tested object. The device runs on the cutting-edge SAFT-C algorithm, which uses a time-domain approach that relies on the delay-and-sum method to focus on delayed reflections effectively. This algorithm was selected for its user-friendliness and low-performance requirements, making it an excellent microprocessor option.
While the interpolated image provides an intuitive and immediate visualization of the inside of concrete structures, the reliability of the information in the interpolated area decreases as the spacing between 2D images increases. Using a polarized shear wave by the UPE device makes it highly unlikely for a reflector to be arranged in a specific direction. Additionally, the UPE device software cannot combine data collected from multiple orientations to generate an image.
Existing detection methods often use ultrasonic body waves. The current commercial UPE devices have enabled the rapid acquisition of shear-wave echoes of concrete. The attenuation by ultrasonic scattering depends on the ratio of the wavelength to the diameter/dimension of the scatterer. Some studies demonstrated that the scattering attenuation of shear waves is less significant at frequencies lower than 50 kHz for commonly used aggregate of size 15 mm in concrete. As such, by using current UPE devices, concrete can be treated as a homogeneous medium with a single constant shear-wave velocity, and the standard SAFT is employed in the UPE equipment to detect voids, imperfections, and defects in concrete structures [22,23,24,25,26,27,28,29,30]. Ref. [31] used a focusing method (TFM) and SAFT concepts for enhancing multimodal 2D imaging of concrete structures. Ref. [32] used M-distance and linear discriminant analysis to classify the imagines of SAFT.
The standard SAFT’s results can be further improved by introducing a few developments, such as calibrating the sagging in the resulting images due to the long wavelength of the pulse [33,34], the extended SAFT methods and applications [35,36,37,38,39,40,41,42], the AI-based algorithms applications [43,44], and ultrasonic image by using both linear and non-linear wave properties [45].
Two-time indices are called t1 and t2 in the ultrasonic transmission, reflection, and receiving process. By precisely analyzing the designated timings, we can effectively discern reflections originating from the front surface and any imperfections (Figure 1). This pulse type is instrumental in generating an A-scan that meets rigorous quality standards. The data derived from this scan are the time differential tf, which is represented as tf = t2t1 and commonly known as the ultrasonic time-of-flight (TOF). Knowing the propagation speed of bulk waves in the material, the TOF is invaluable in determining the location of the defect.
TOF-based methods have proven effective in detecting, locating, and sizing faults in ultrasonic nondestructive testing and evaluation [7,11]. However, echo signals in UPC testing often contain significant noise. The intensity of this noise can vary depending on the medium’s properties and the distance of ultrasonic wave transmission, resulting in low signal-to-noise ratios and peak variations in the time domain. These factors pose a challenge in accurately locating and extracting peak amplitudes from defect echo signals.
Various signal processing techniques enhance the detection capabilities of ultrasonic NDT applications, where signals are often mixed with noise. The ultrasonic signals should be denoised, which is feasible using short-time Fourier transform, wavelet transform, improved wavelet transforms, adaptive filtering, and empirical mode decomposition (EMD) [46,47,48,49,50,51,52]. Each technique has its strengths and weaknesses, which are considered when selecting the appropriate method for the given application.
Originating from concrete defect echoes in UPC testing, the resulting intense noise makes identifying and quantifying defect echoes difficult. Therefore, the conventional averaging and filtering techniques could be more helpful for pulse-echo noise reduction. Denoising assists with filtering the noise components and retaining the original signal’s details.
The most used denoising algorithm thus far is the wavelet threshold algorithm. However, the wavelet threshold denoising has a severe drawback. It requires appropriate wavelet base, threshold, and decomposition level values, thus allowing for different parameters to affect the denoising performance remarkably. Empirical mode decomposition (EMD) works for non-linear, stochastic, and non-stationary signal processing. The EMD denoising algorithm does not require presetting the base and decomposition level and is more adaptable than the wavelet threshold algorithm. Furthermore, the EMD denoising algorithm can result in high-frequency resolution.
The electrical noise and piezoelectric signal primarily determine the position of the initial pulses in the UPE device. The signal can travel along a straight line when the distance is short and the temperature variation is slight. The TOF of the echo wave determines the position of the scatter.
The Hilbert transform has been used in signal processing to map an actual signal into an analytical signal with a complex envelope to obtain specific signal features [53,54]. The Hilbert transform converts a given signal into an analytical signal with a complex envelope, which facilitates the evaluation of the signal envelope and the determination of the TOF of the defect echo signal. This transformation is beneficial when the magnitude of the defect echo signal is relatively small and is merged with a superimposed signal.
This paper proposes an approach to denoise ultrasonic pulse-echo signals using advanced EMD and Hilbert transform to identify and quantify the defect echo signal. This advancement complements the commercial UPE device results and accurately calibrates defect locations. This study’s experimental program shows testing results to validate the proposed denoising approach.

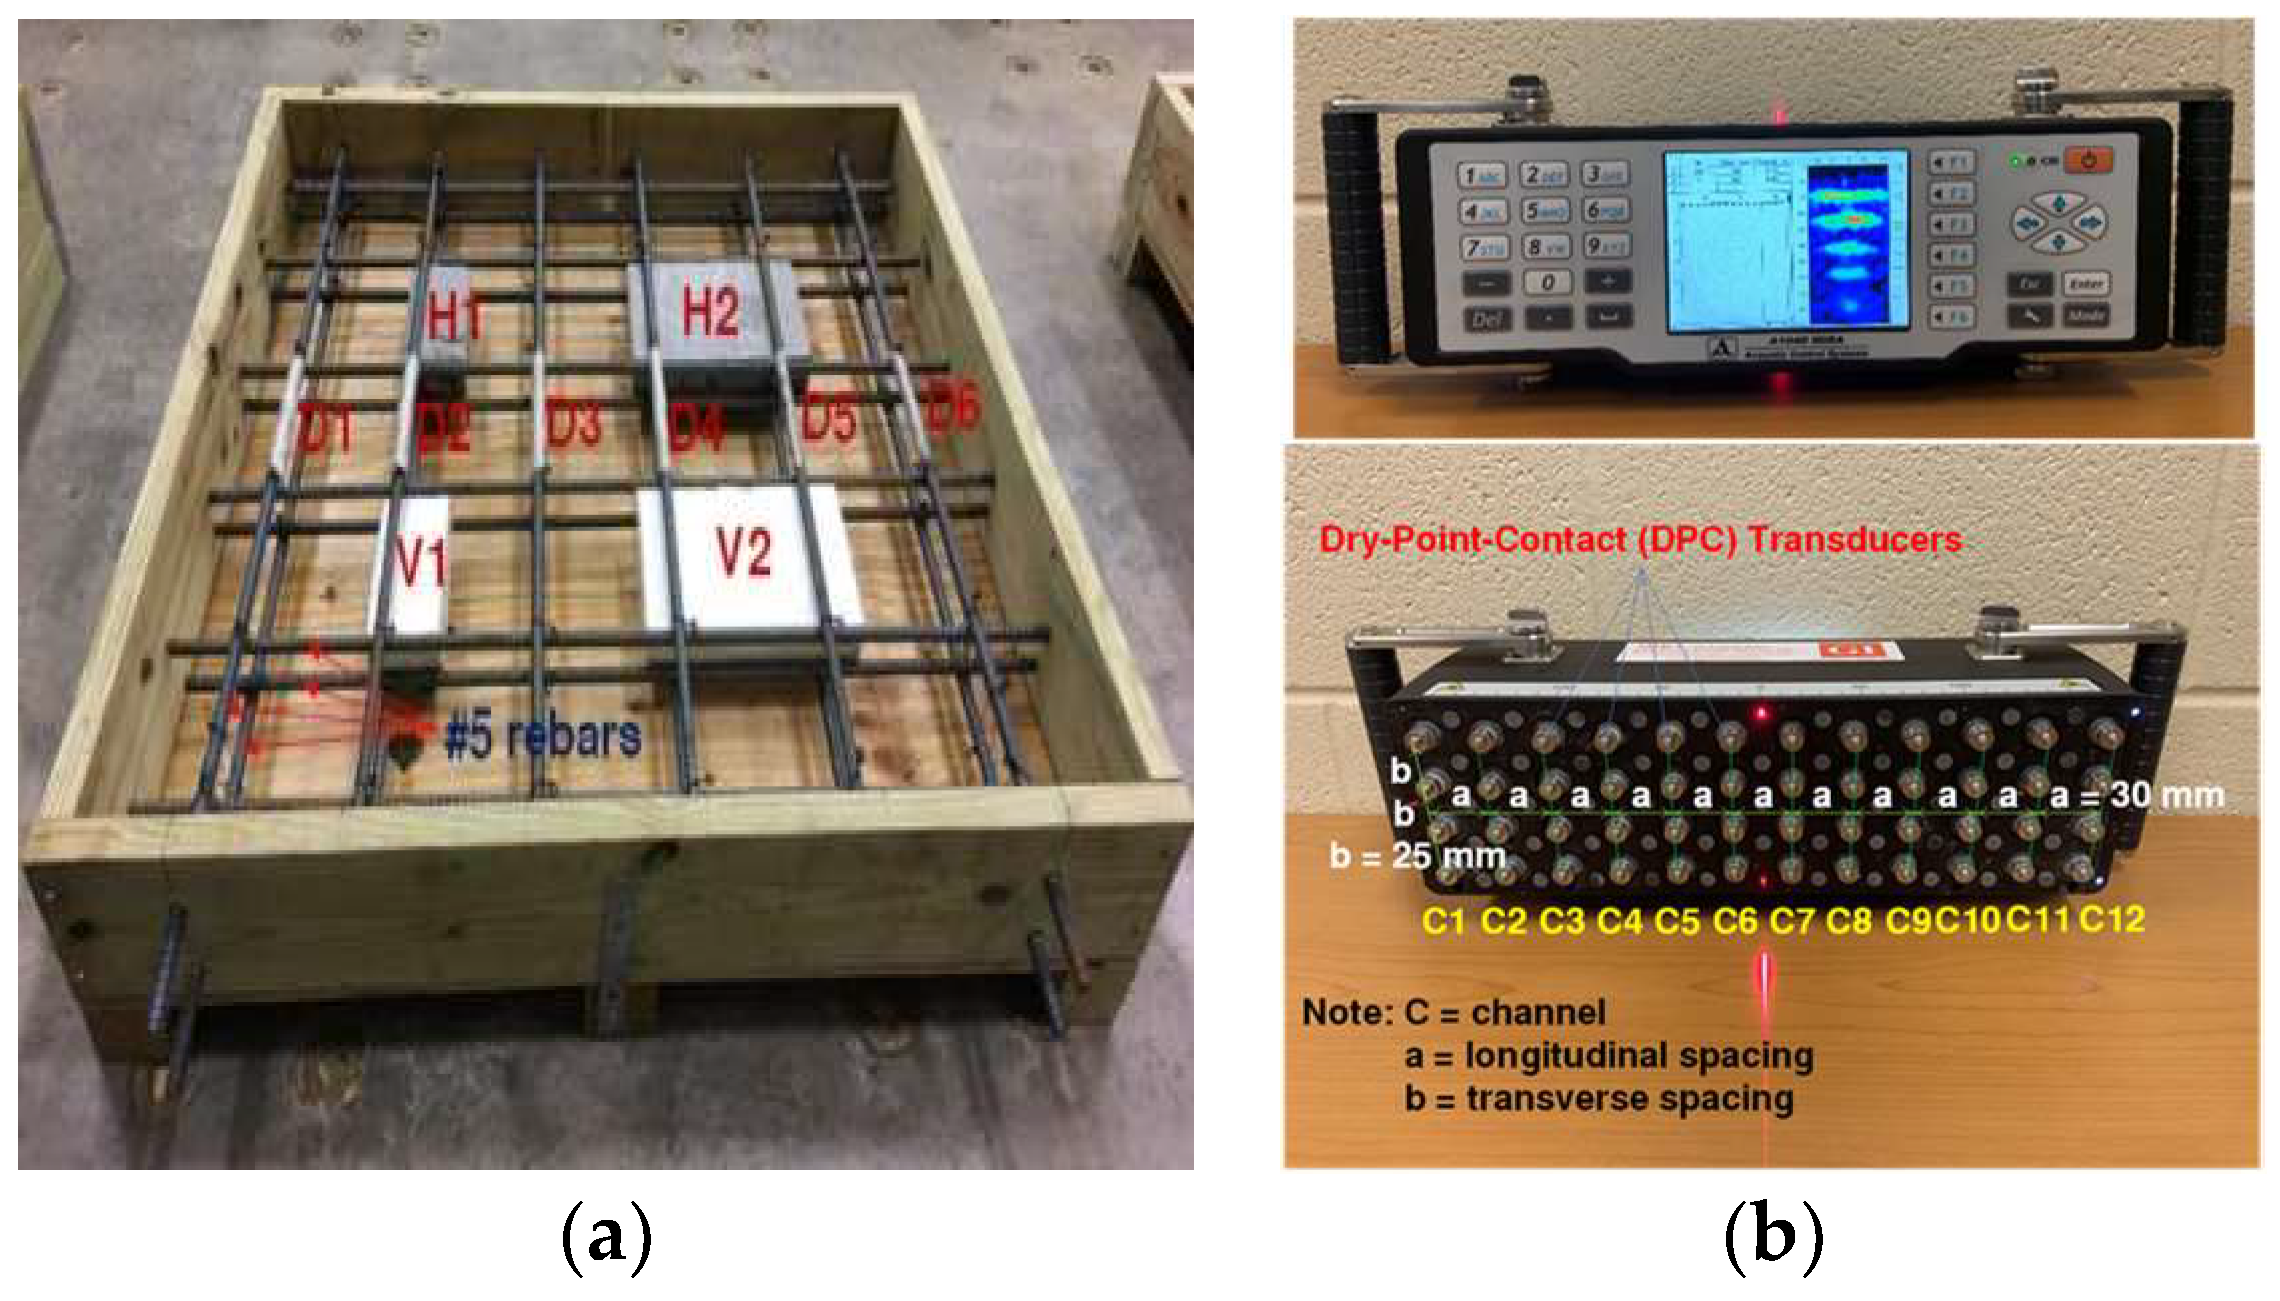
2. Experimental Setup

Voids are popular defects that occur in concrete due to many reasons, such as poor consolidation of the concrete or other construction errors. Expanded polystyrene (EPS) foam has been widely used to represent the artificial voids, as it has the same dielectric constant (1.02–1.04) as air [55,56,57,58]. The low density of foam allows for the ultrasonic waves to be reflected in a similar manner to the presence of air. In this research, the testing slabs (The Ultrasound Tomographer called MIRA, manufactured by Germann Instruments (Evanston, IL, USA) was used to conduct the tests) as shown in Figure 2a, which is same as the one in [35]. A specimen of reinforced concrete (RC) slab was designed with two layers of #5 steel rebars with a spacing of 203 mm and artificial defects. The specimen included a pair of foam voids to simulate embedded void scenarios. The dimensions of the RC deck slab specimens were precisely measured to be 114.3 cm in width, 121.9 cm in length, and 17.8 cm in thickness. The artificial voids, depicted as V1 and V2 in Figure 2a, were created using rectangular prisms of expanded polystyrene (EPS) foam, which possessed the same dielectric properties as the surrounding air. The artificial void was 102 × 30 mm (width × thickness), and the top surface of the foam was placed 83 mm down from the top surface of the deck specimen. This approach allowed for us to accurately simulate the behavior of the voids in the slab and evaluate their impact on the overall performance of the structure. Ready-mix concrete was used from in-transit mixers for casting the RC slab, which was subsequently cured and tested under laboratory conditions. A shear-wave pulse velocity of 2450 m/s was assumed. The specimen was made from normal concrete with a concrete strength of 27 MPa, and small-sized elements less than 10 mm to avoid wave scattering by the aggregates were adopted for the experiment.
Figure 2b depicts the commercial UPC device, an ultrasonic low-frequency, shear-wave tomography device that rapidly images the subsurface concrete condition. The device boasts 48 dry-point-contact (DPC) transmitting and receiving transducers with ceramic wear-resistant tips arranged in a matrix. Its antenna array comprises 12 channels, C1 through C12, at a longitudinal spacing of 30 mm, with each channel featuring four transducers at a transverse spacing of 25 mm. Each transducer can transmit and receive low-frequency (55 kHz) shear waves.
Utilizing DPC transducers, the device mentioned above can provide a consistent level of impact and wavefront penetration for diagnostics up to 3 ft deep while dealing with concrete surface textures. The device uses a shear-wave pulse velocity of 2450 m/s for concrete for the SAFT reconstruction. Figure 3 illustrates the fundamental principles of the UPE device.

3. Formulation for Accurate Assessment of Void Defects

Most ultrasonic measurements exhibit perplexity, as the results are subject to severe disturbances such as signal deviation, non-linearity, stochastic surface status, and mode conversion due to anisotropic and heterogeneous domains in the concrete. These are reflected in the UPE signal as spurious echoes and noise.
The UPE testing data analysis contains ambient noise or signals corrupted by non-stationary acoustic noises, reducing the analysis efficiency. Denoising of the signals appears in several studies reported in the literature, many of which have certain limitations. Most studies relied on prior signal knowledge to enhance denoising, resulting in the loss of important data during filtering.
Typical signal processing methods may not be effective in detecting fault features. However, combining various signal processing techniques can improve fault detection and analysis. To more accurately analyze the behavior of non-linear and non-stationary signals, many researchers have utilized empirical mode decomposition (EMD) to identify faults. EMD is capable of removing noise signals from non-linear and non-stationary signals.
Research conducted [59,60] highlighted that the EMD denoising method surpasses both median filtering and wavelet denoising in effectiveness. Nonetheless, when heavy noise is a factor, selecting the intrinsic mode function (IMF) in EMD can be difficult. The Hurst exponent is a valuable resource for detecting multifractality that may be disguised in non-linear and non-stationary signals. The Hurst analysis technique was employed to choose the appropriate IMF with the EMD method [61,62].
This study presents a novel approach to removing noise from a UPE signal using data-driven analysis. The method involves breaking down the noisy signal into IMF components using EMD analysis, and then examining each IMF’s Hurst exponent to determine which components require filtering. The filtered components are then reconstructed to eliminate the noise from the data.
By utilizing the Hurst exponent to identify the threshold for maximum signal noise suppression, the method applies thresholding techniques to the IMFs for optimal noise removal. This method has proven more effective than traditional techniques, especially for low SN signals.
A comprehensive understanding of IMF statistics in noise-only situations is essential in identifying the significance of a given mode. The estimation of the noise Hurst exponent is achieved using the aggregated variance method. This exponent is then utilized to evaluate the energies of IMFs within the noise model, a crucial step in determining the threshold of IMFs. Understanding the statistics of IMFs in noise-only scenarios can help determine the importance of a specific mode. Thus, the aggregated variance method is employed to estimate the noise Hurst exponent, which is then applied to evaluate the IMF energies and establish the IMF threshold.
Ultrasonic nondestructive testing can present challenges when it comes to detecting echoes caused by defects in backscattered signals due to backscattering and electronic noise. However, there is a solution in the form of the EMD algorithm. The EMD algorithm breaks down a non-linear and non-stationary signal into a series of zero-mean amplitude modulation and frequency modulation components. By doing so, it can accurately represent the observation’s characteristic time scale. This means that a multi-component, non-linear, and non-stationary signal can be represented with precision using EMD within the context of ultrasonic theory.
x t = j = 1 n a j t cos φ j t ,   x t = j = 1 n a j t e xp i ω j t d t
To decompose a signal using the EMD approach, we represent the instantaneous amplitude and instantaneous phase of the jth component as a j t and φ j t , respectively, and n as the number of components. This is achieved through an iterative sifting process, resulting in zero-mean AM-FM components called IMFs. These IMFs must satisfy two requirements: (a) the number of extremes and zero crossings in the IMF must be equal or differ at most by one, and (b) the mean value of the envelopes defined by the local maxima and local minima must be zero at any point. In essence, the signal must be locally symmetrical around the time axis. To find the IMFs for a given signal, we conduct the sifting process to find the IMFs for the signal x t , which involves the following steps:
(1)
To accurately process the input signal, we must initially identify all local maxima and minima, along with their respective positions and amplitudes. Following this, we can employ cubic spline interpolation to generate an upper envelope consisting of the local maxima and a lower envelope using the local minima.
(2)
After calculating these envelopes, the envelope mean signal, known as m 1 t , can be determined by taking their mean. Lastly, to finalize the processing, we need to subtract the envelope mean signal from the original input signal (Equation (4)).
(3)
Check if h t meets the IMF requirements. Treat the data as new data and repeat the process if it does not meet the IMF requirements (Equation (5)).
(4)
Repeat the sifting procedure k times until the resulting component h 1 k t is an IMF, which becomes the first IMF (Equation (6)).
h t = x t m 1 t
h 11 t = h 1 t m 11 t
c 1 t = h 1 k t
(5)
A standard method for extracting and analyzing a signal’s underlying components is residual analysis. This process involves subtracting the c 1 t component from the input signal and defining the resulting remainder as the first residual. Given that the first residual r 1 ( t ) may contain information relating to longer-period components, it is treated as a new data stream. The procedure is repeated for this new signal. This process may be iterated j times, resulting in the generation of j residuals. By following this approach, it is possible to obtain a refined understanding of the signal and identify the underlying components contributing to its overall structure.
r 1 t c 2 t = r 2 t r n 1 t c n t = r n t
(6)
The sifting process is interrupted once either of the two criteria mentioned above is fulfilled: firstly, when the component c n t or the residual r n t is reduced to such a minuscule size that it can be regarded as insignificant, or secondly, when the residual (R) becomes a monotonic function that precludes the extraction of the IMF—the objective IMF can be obtained by adding Equations (4) and (5). The original signal can be expressed as a combination of IMFs and a residual, producing significant implications in signal processing and analysis. This observation has been accepted in the academic community.
x t = i = 1 n c i m f i t + r n t
(7)
EMD-based denoising, similar to other decomposition-based denoising techniques like wavelet transforms, requires a reliable and robust threshold to distinguish between noise and authentic signal components. In cases where irregularity or noise is present in a time series, the Hurst exponent plays a crucial role in determining the irregularity in the signal. This methodology is more efficient than traditional approaches such as autocorrelation, ANOVA, and spectral analysis in many applications. The Hurst exponent value, whether greater or less than 0.5, indicates the pattern of the non-linearity of the data set. Some generalized white noise signals exhibit a flat spectrum, and their statistical properties are determined solely by a scalar parameter H, known as the Hurst exponent. For a signal x(t) exhibiting a zero-mean Gaussian stationary process, its autocorrelation function is expressed as follows:
r H k = σ 2 2 k 1 2 H 2 k 2 H + k + 1 2 H
where σ is the process variance of signal x(t), H is the Hurst exponent, and k is the correlation lag. Notably, when H equals 0.5, the process is classified as uncorrelated white noise, whereas for other H values, it is labeled as colored Gaussian noise. Moreover, when a generalized white noise signal is subjected to EMD, it acts as a dyadic filter bank.
(8)
It is important to note that the log-variance of the IMFs follows a simple linear model, which the Hurst exponent of the process ultimately governs.
log 2 V H k = log 2 V H 2 + 2 H 1 k 2 log 2 ρ H
(9)
For k ≥ 2 and ρ H 2 , the energy of each of the IMFs E k can be parameterized as a function of the first IMF energy and Hurst exponent parameters [62]:
E k = E 1 β H ρ H 2 1 H k , k 2
E 1 = 1 N n = 1 N I M F 1 2
(10)
This particular model can execute denoising BMD-based techniques. The process entails breaking down the noisy signal into IMFs and gauging their energy levels about the estimated noise-only IMF energies derived from Equation (10). From there, the signal reconstruction is accomplished by adding up the IMFs whose energy levels deviate from the expected noise model.
(11)
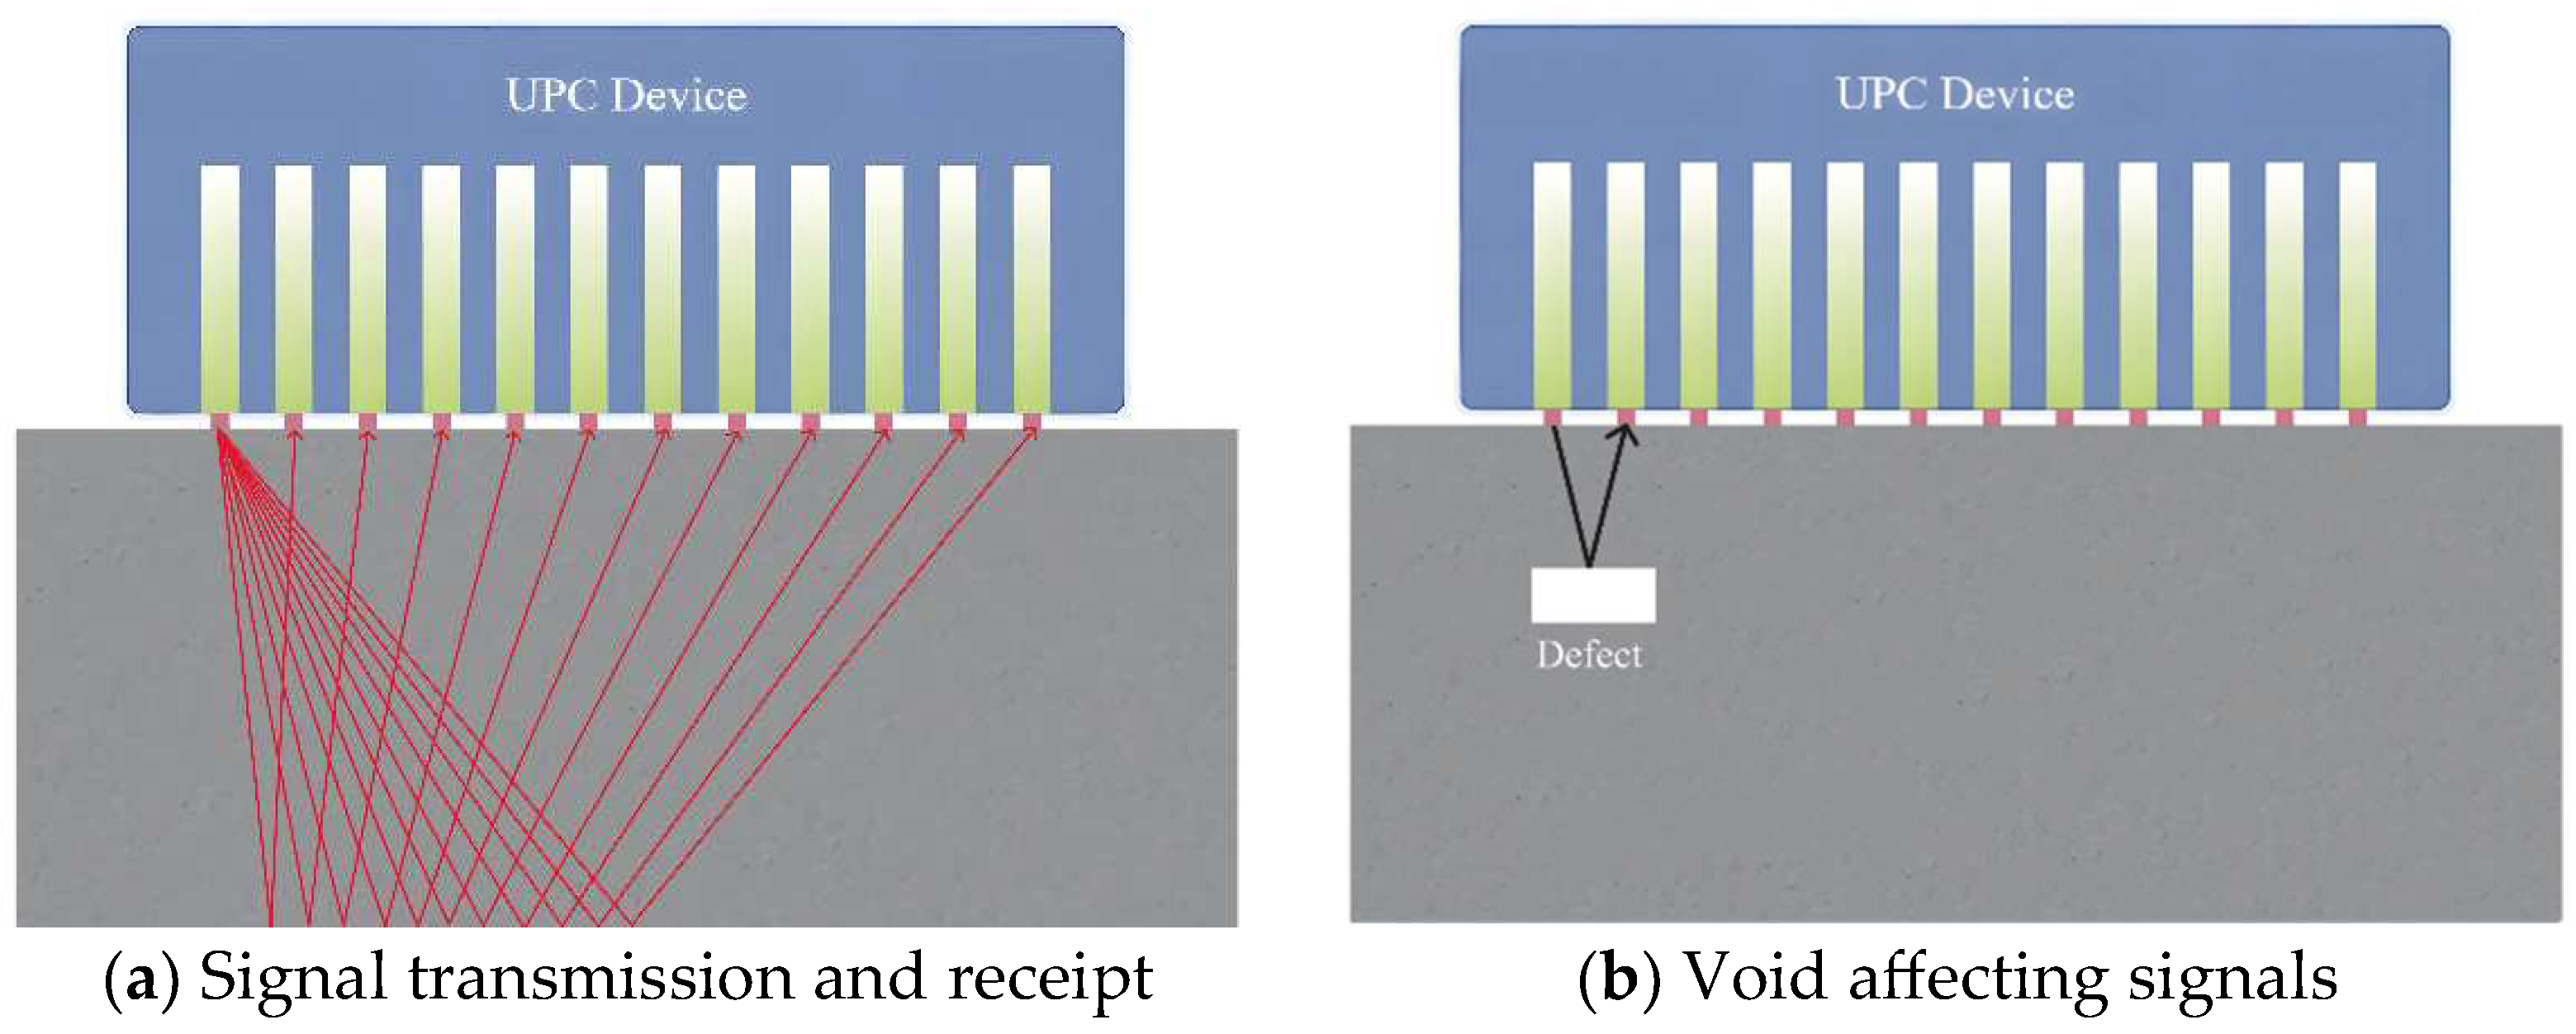
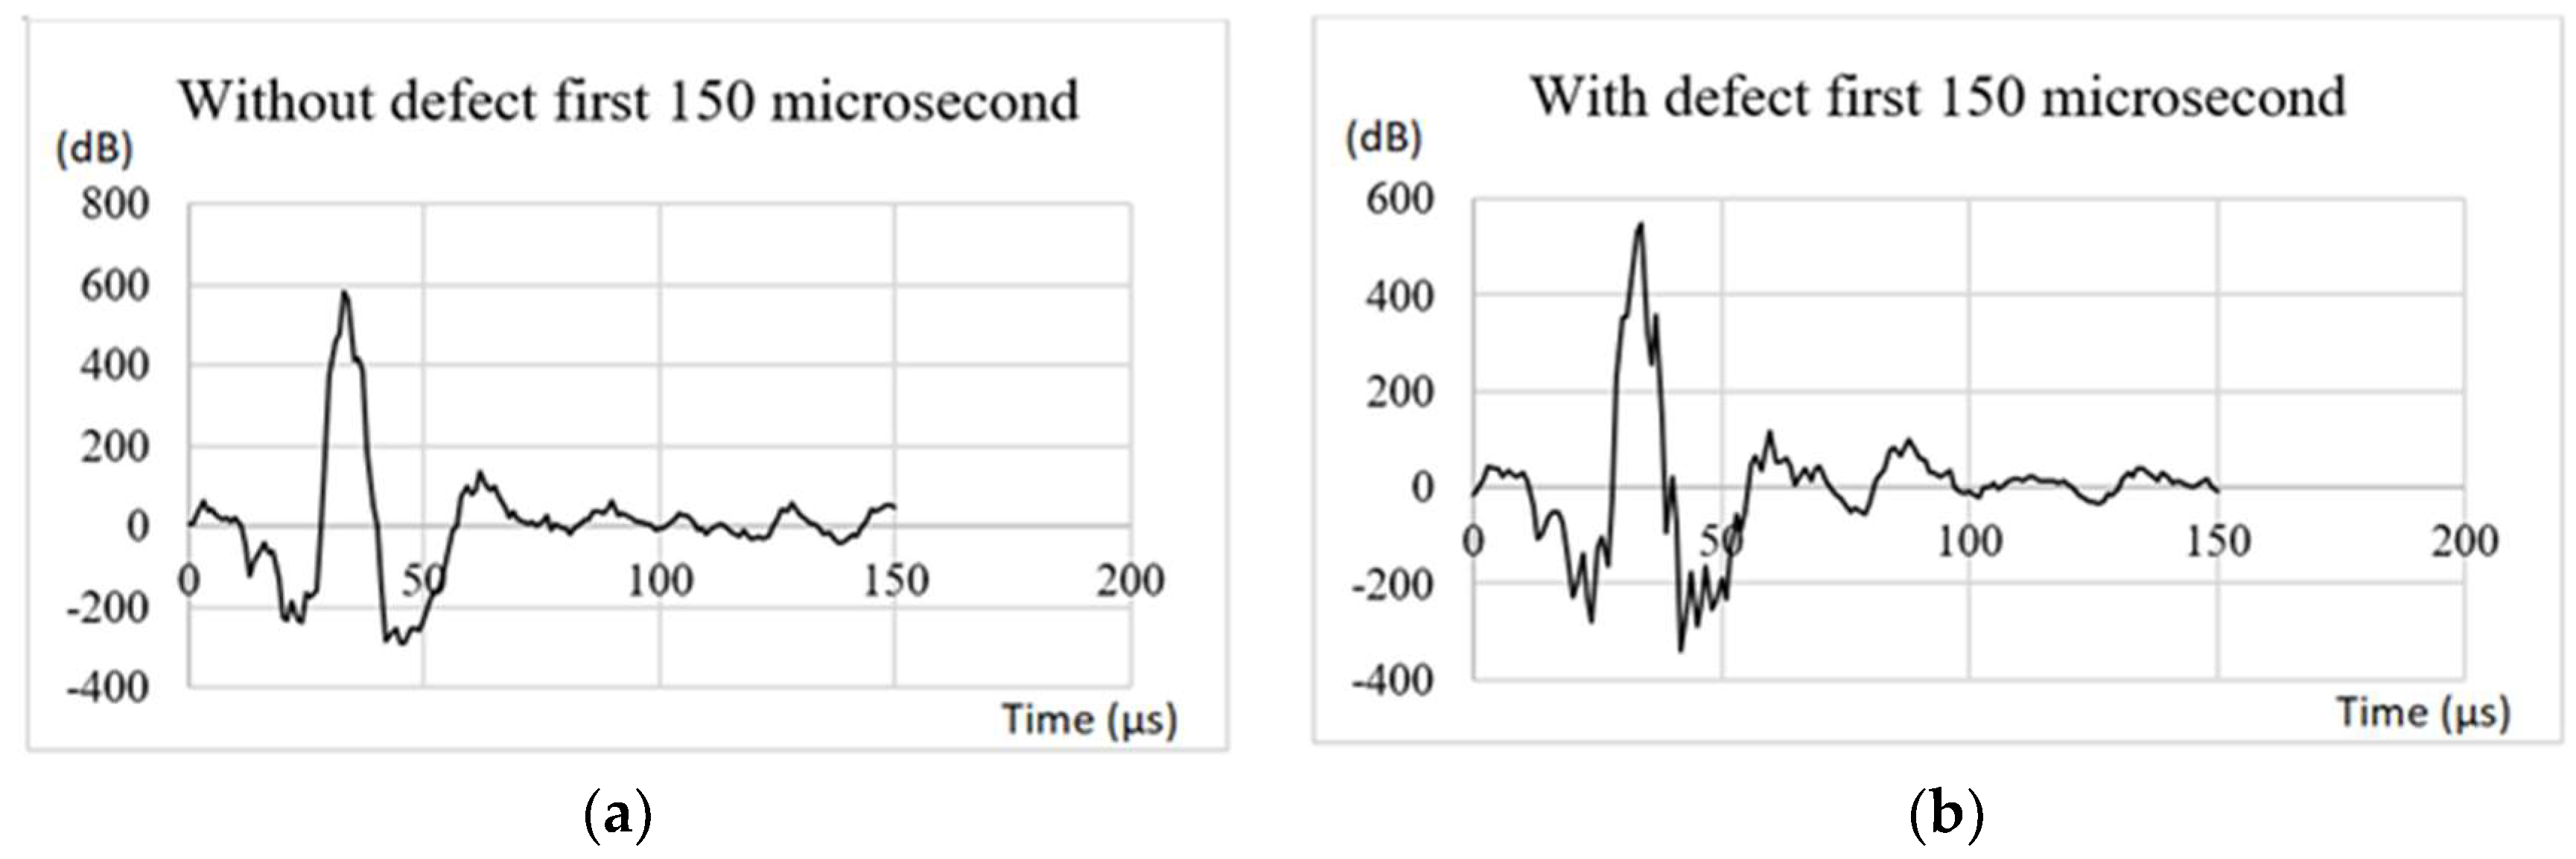
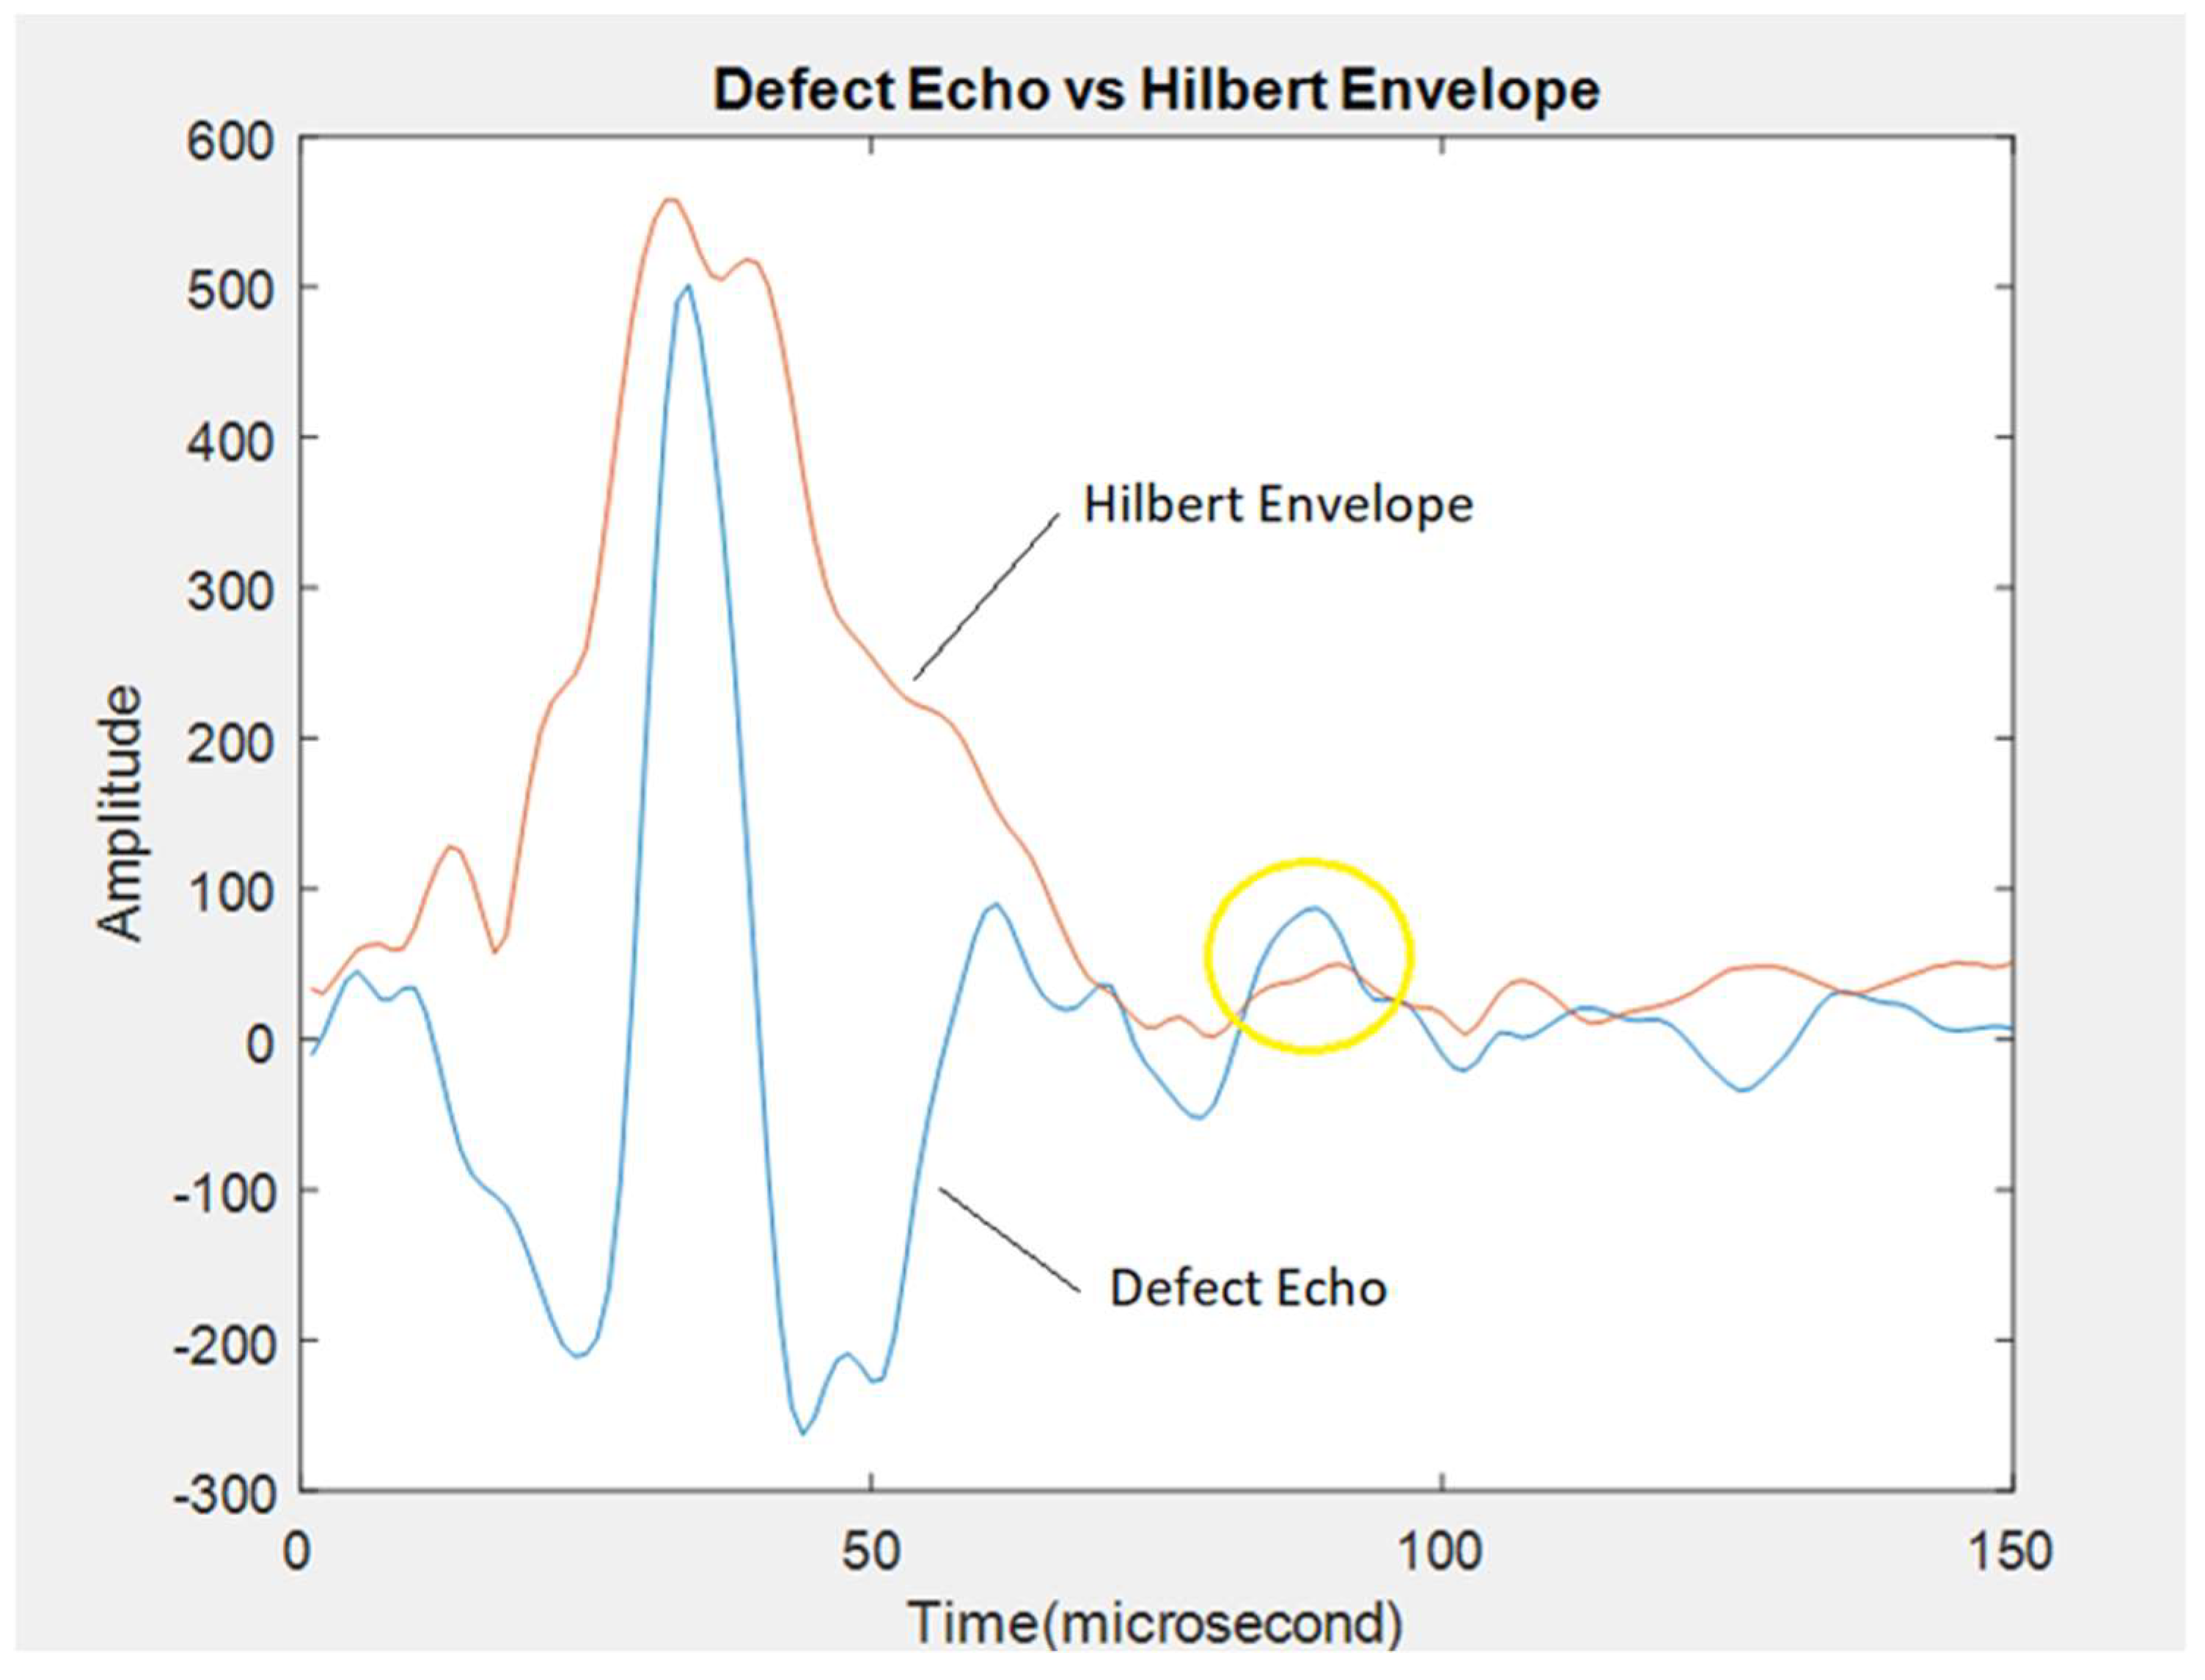
Peak detection techniques are typically employed to estimate TOF, thereby differentiating between the reflection signal from the front surface and the reflection signal from the defect. Despite the denoising process, the defect echo signals may still exhibit dispersion and weakness, requiring specialized methods for identification and estimation. Techniques such as filtering, cross-correlation, envelop moment analysis, and matching pursuit decomposition with dispersion compensation are necessary for accurate defect detection in such scenarios. The envelope of an echo signal constitutes a vital characteristic that can be employed to extract information regarding the location of the echo waveform.
The Hilbert transform facilitates the computation of instantaneous features of a time series, including the envelope amplitude and instantaneous frequency. The instantaneous envelope denotes the amplitude of the complex Hilbert transform, which can be utilized to identify the dynamic characteristics of non-linear systems by improving the accuracy of envelope detection through the use of local maxima interpolation.
The Hilbert transform involves casting the actual signal a(t) into an analytical signal (i.e., complex envelope) a ~ t . The ã(t) is a complex-valued time-domain signal, where the original actual signal a(t) is the genuine part, and the Hilbert transformed signal a ^ t is the imaginary part (Equation (13)). By leveraging this approach, one can obtain a complex-valued time-domain signal that provides a more comprehensive representation of the underlying physical phenomenon.
a ~ t = a t + j a ^ t
(12)
In Equation (14), j is the imaginary number, while H[·] denotes the Hilbert transform operation. In the time domain, the Hilbert transform is defined as the convolution of a(t) with 1/πt, where â(t) = H[a(t)]. The envelope of a signal is the magnitude of the analytical signal, which is the same as the magnitude of the real signal. The complex signal ã(t) is formed by the Hilbert transform, a(t), and â(t), as shown in Equation (15). Then, the envelope of the real signal can be given by Equation (16).
a ^ t = n H [ a ( t ) ] = 1 π a ( τ ) t τ d τ
a ~ t = a ( t ) + j H [ a ( t ) ] = A ( t ) e i ϕ ( t )
A ( t ) = [ a ( t ) ] 2 + H [ a ( t ) ] 2

4. Results and Discussion

The results from the UPE device [35] are given as follows: Figure 4a shows the 2D reconstructed image with an artificial void, reconstructed using the developed software. The voids’ locations and horizontal dimensions are precisely indicated. Figure 4b displays a reconstructed image of the artificial void #1, including its exact frame. Finally, Figure 4c shows the advanced SAFT-produced color spectrum for signal amplitudes, which can be positive or negative. These values range from black (minimum negative to zero) to dark red (maximum positive). The color spectrum is “dark”, representing black to blue, and “bright”, indicating light blue to dark red colors.
It can be seen from Figure 4b that the location of the detected void is 70–75 mm below the concrete front surface, whereas the actual location of the constructed artificial void is 83 mm below the surface (distance of concrete surface to the top surface of the artificial void form), as specified by the black frame in Figure 4b.
Figure 5 shows the A-scans for the cases measured on the concrete deck without void defect (a) and with void defect (b) below the UPE device. In Figure 5b, the peak at about 80 microseconds is slightly smaller than the last peak at about 60 microseconds; it could be interpreted as the reflection echo peak from a decayed surface wave or the reflected echo from a defect void.
Accurately identifying the defect echo wave requires eliminating noise and distinguishing between the surface reflection wave and scattered wave from the defect. The analysis of the transient ultrasonic field distribution reveals that the received signal is dominated by surface wave energy.
The presence of the surface wave signal poses a significant challenge to detecting internal defects and image quality [22,33,63]. The A-scan signal constitutes reflections from the surface and scattered waves from defects. Figure 5 shows A-scans for RC slab specimens with and without void defects. Figure 6 shows the original and denoised A-scans of the echo signal for the RC slab specimen that does not have voids. Figure 7 shows the original and denoised A-scans of the echo signal for the RC slab specimen with a void.
Figure 8 shows the denoised A-scan of the case with a defect void and the extracted envelope from denoised A-scans without void. The envelope represents standard surface wave decay, which can be used as threshold to calibrate any abnormal wave peak that is not from the surface wave and could be higher than the threshold.
As shown in Figure 8, only inside the yellow circle, the peak of the denoised A-scan at about 80 microseconds is substantially higher than the envelope of the surface wave threshold; as such, it can be identified as the echo peak of the internal defect void reflection wave.
The relevant delayed time can be obtained based on the above-identified defect echo peak and the surface echo peak in Figure 8. Based on Equation (1) and the conventional procedure [7,11], the depth of the defect void can be calculated. The result is listed in Table 1 and is compared with the void depth inside test specimen and void depth from UPE device imaging. The new method gives more accurate results than the UPE device mapping.

5. Conclusions

This study aims to quantitatively evaluate void defects in concrete deck slabs using the ultrasonic pulse-echo technique.
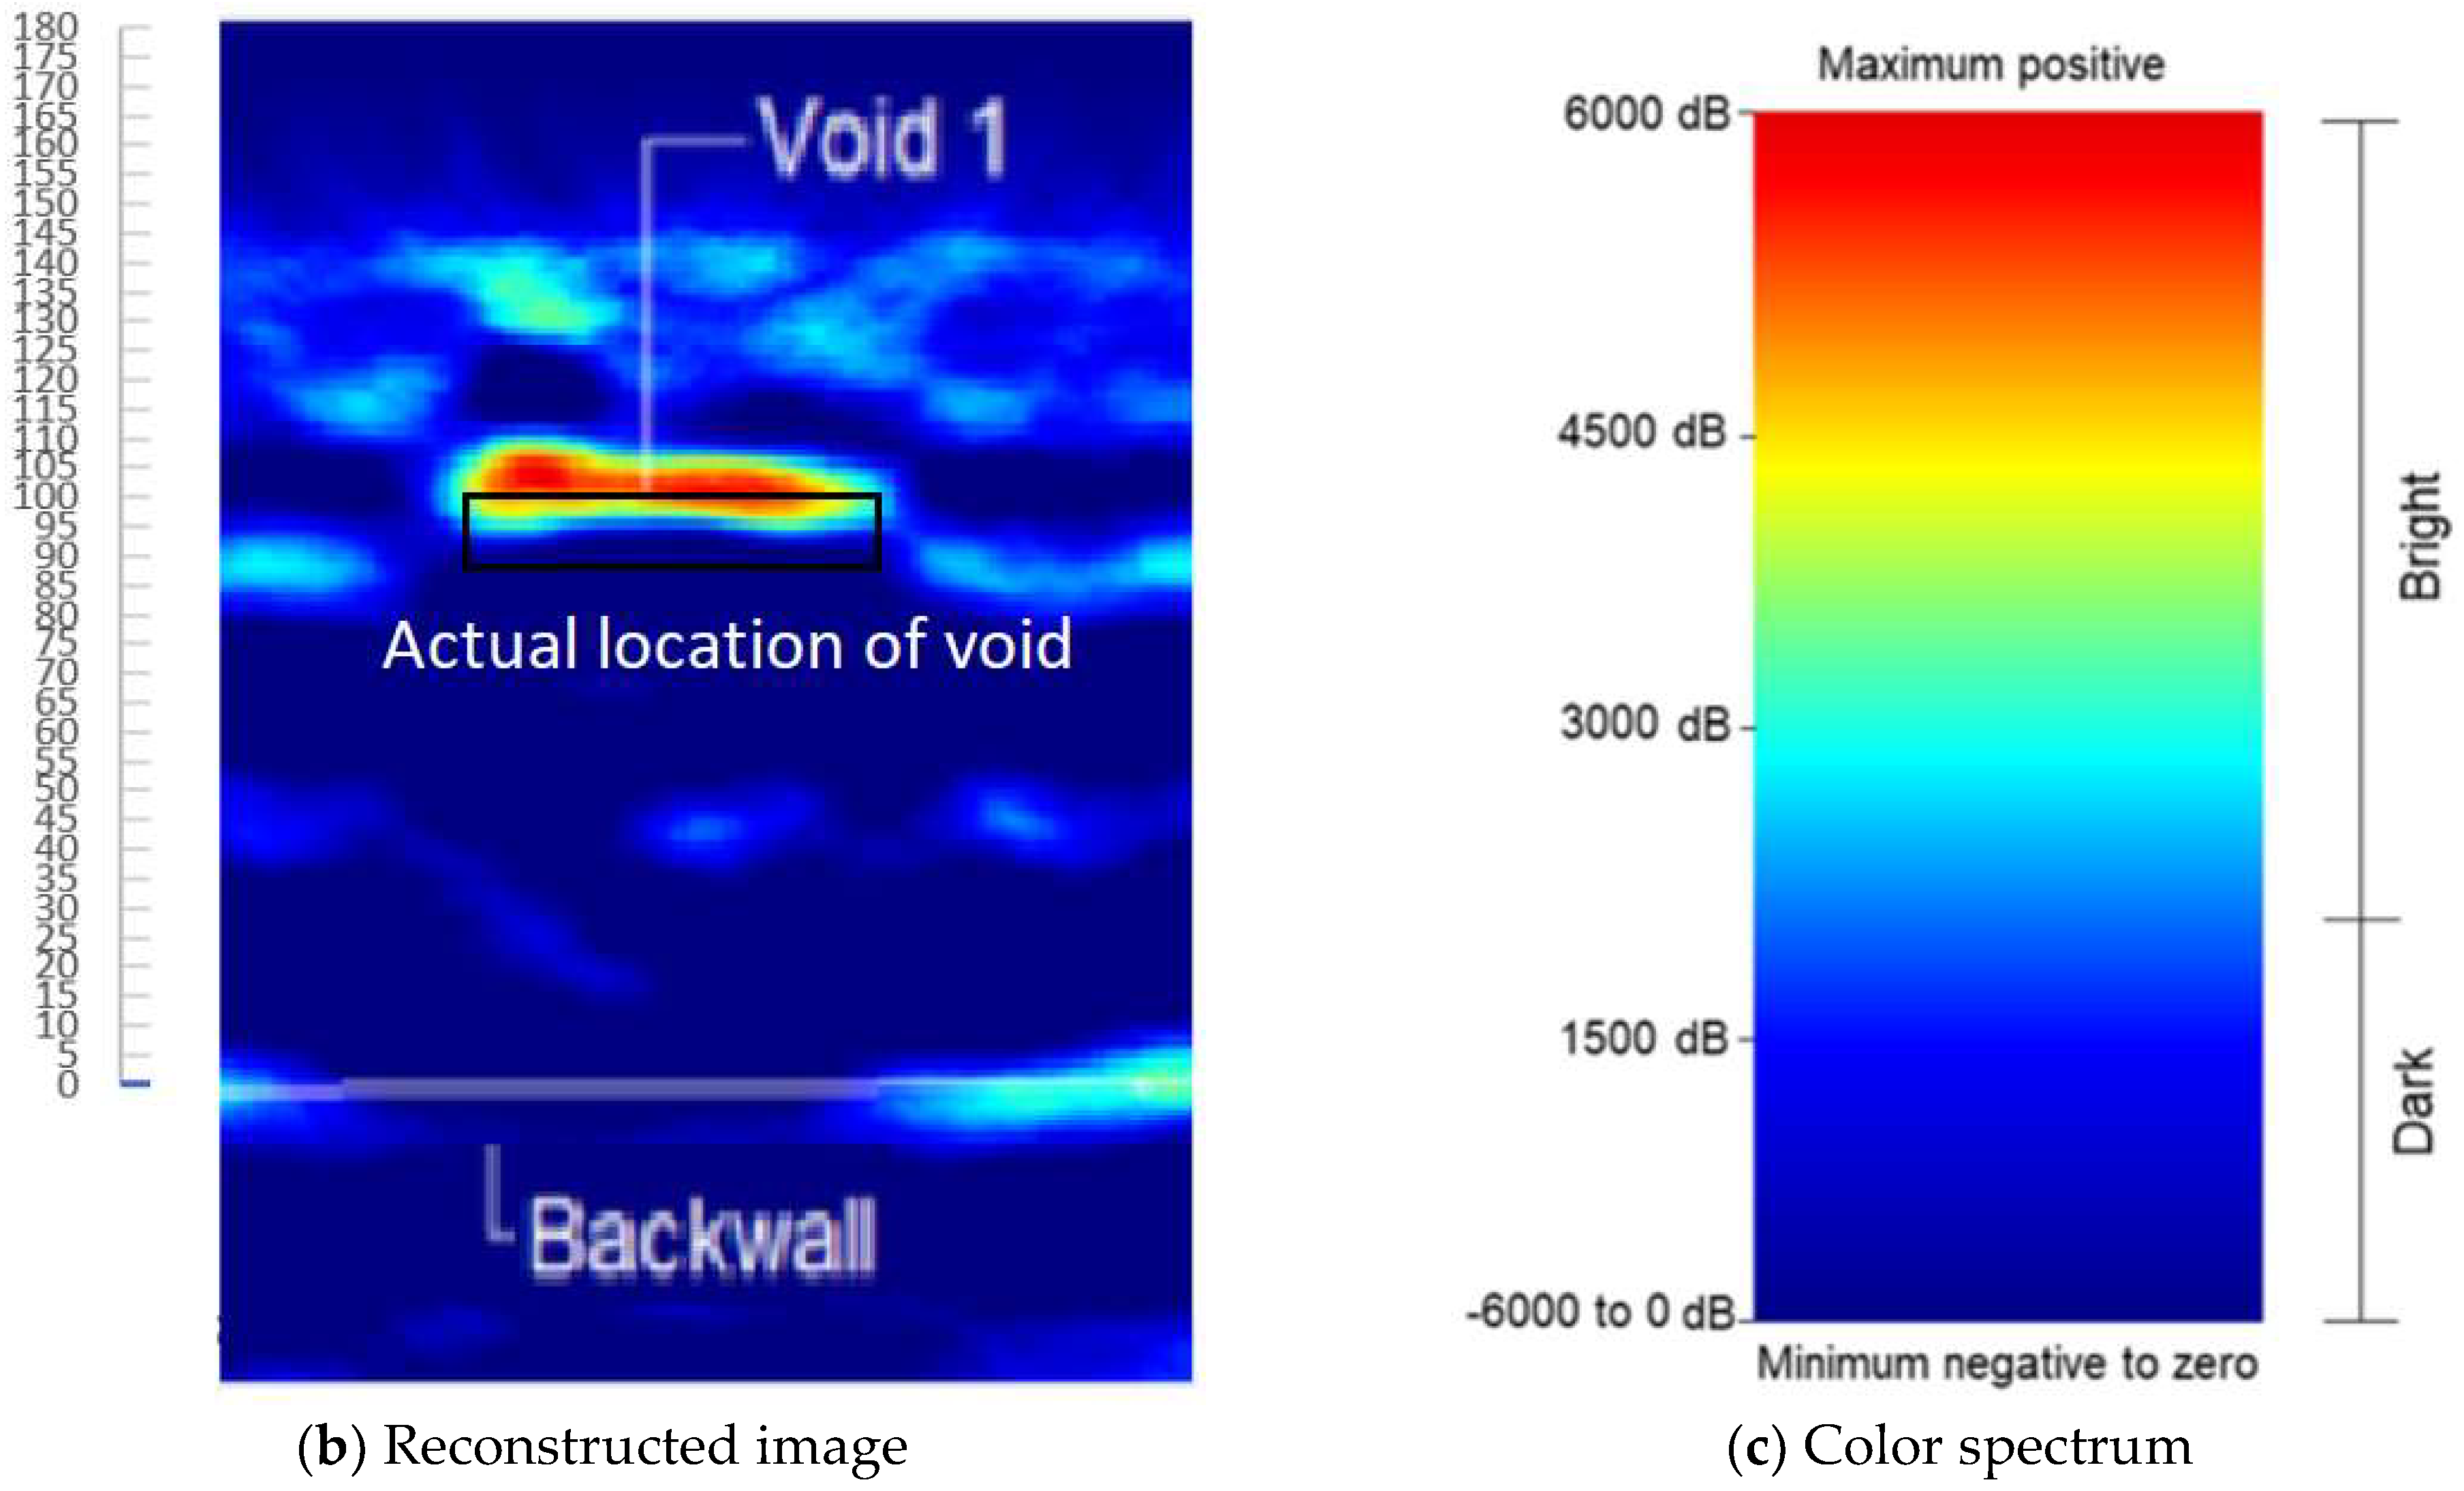
  • Advanced signal processing methods are used to accurately evaluate the location of the void defects in concrete decks, whereas the imaging of commercialized ultrasonic devices usually gives qualitative information about defects.
  • A concrete deck slab specimen with artificial void defects is used for validation. A commercial ultrasonic pulse-echo device, based on the ultrasonic shear-wave test method using dry-point-contact transmitting and receiving transducers, and extended SAFT were employed to map the internal void defect of the validation concrete deck slab specimens.
  • The recorded data from the ultrasonic pulse-echo device was analyzed by using the proposed methods to accurately evaluate the void defect locations in the concrete deck slab specimen. The new method consists of benchmark envelope estimation and the denoise of the echo signal, which identifies the weak stochastic and non-stationary echo signal from void defects.
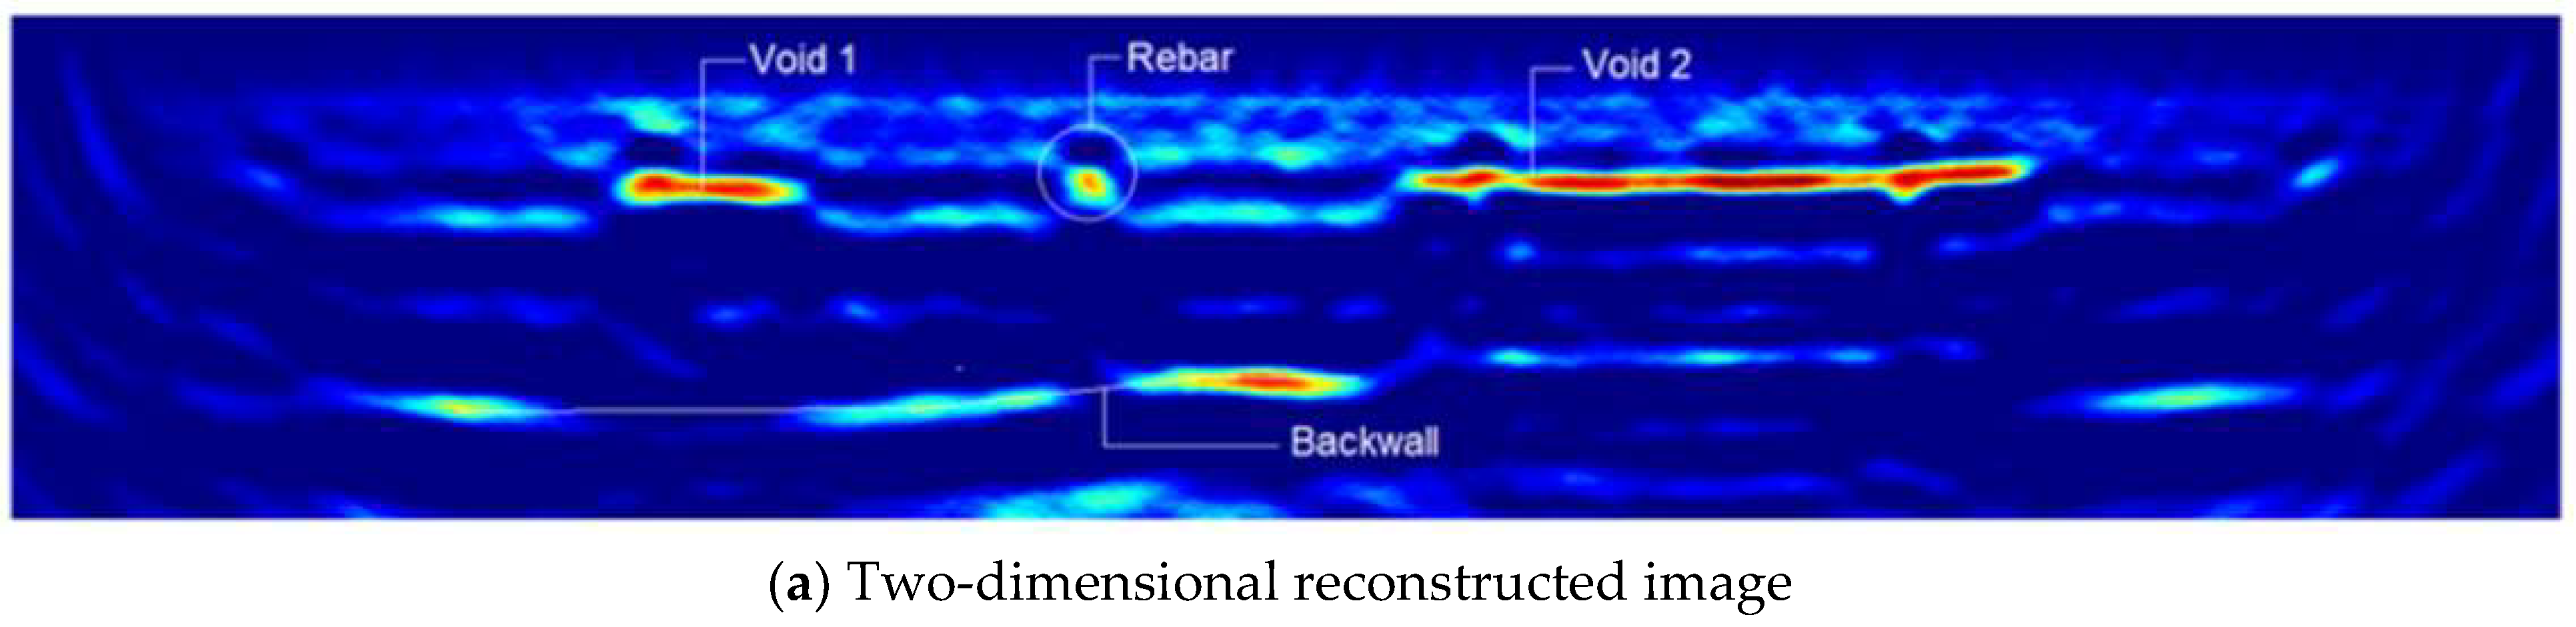
  • The results demonstrated that the proposed method accurately located the void defects in the concrete deck specimen. In contrast, the commercial ultrasonic pulse-echo device’s map for the void defects of the concrete deck can only give qualitative results.
  • The cost of application of the new method and procedure is low, as the A-scan is always available for UPE testing, and all the related algorithms have been well developed.
  • The direction to extend the current study is to apply and evaluate the proposed method to other kinds of subsurface anomalies of concrete, such as irregular crack, rebar/corrosion, etc.

Author Contributions

Conceptualization, W.Z.; Methodology, W.Z. and G.C.; Software, H.N.; Validation, W.Z., G.C. and F.X.; Formal analysis, W.Z., G.C. and F.X.; Investigation, W.Z.; Resources, W.Z.; Data curation, W.Z., G.C. and H.N.; Writing—original draft, G.C.; Writing—review & editing, W.Z. and H.N.; Supervision, W.Z.; Project administration, W.Z.; Funding acquisition, W.Z. All authors have read and agreed to the published version of the manuscript.

Funding

This research was funded by West Virginia Department of Transportation grant number [RP328].

Institutional Review Board Statement

Not applicable.

Informed Consent Statement

Not applicable.

Data Availability Statement

The data presented in this study are available on request from the corresponding author (due to restrictions from the funding agency).

Acknowledgments

Wael Zatar and Hien Nghiem would like to express their appreciation for the financial support provided by the West Virginia Department of Transportation (WVDOT) through the research project entitled “Corrosion Research to Maintain and Sustain Infrastructure in West Virginia”. The findings, conclusions, or recommendations expressed in this study are those of the authors and do not necessarily reflect the viewpoints of the WVDOT. The authors would like to thank Hai Nguyen, Tu Nguyen, Cumhur Cosgun, and Kien Dinh for their support while conducting this research project’s experiments.

Conflicts of Interest

The authors declare no conflict of interest.

References

  1. Kot, P.; Muradov, M.; Gkantou, M.; Kamaris, G.S.; Hashim, K.; Yeboah, D. Recent Advancements in Non-Destructive Testing Techniques for Structural Health Monitoring. Appl. Sci. 2021, 11, 2750. [Google Scholar] [CrossRef]
  2. Zheng, Y.; Wang, S.; Zhang, P.; Xu, T.; Zhuo, J. Application of Nondestructive Testing Technology in Quality Evaluation of Plain Concrete and RC Structures in Bridge Engineering: A Review. Buildings 2022, 12, 843. [Google Scholar] [CrossRef]
  3. Davis, A.; Ansari, F.; Gaynor, R.; Lozen, K.; Rowe, T.; Caratin, H.; Heidbrink, F.; Malhotra, V.; Simons, B.; Carino, N. Nondestructive Test Methods for Evaluation of Concrete in Structures; American Concrete Institute, ACI: Farmington Hills, MI, USA, 1998; Volume 228. [Google Scholar]
  4. Schickert, M. Towards SAFT-imaging in ultrasonic inspection of concrete. In Proceedings of the International Symposium Non-Destructive Testing in Civil Engineering, Berlin, Germany, 26–28 September 1995. [Google Scholar]
  5. Schickert, M.; Krause, M.; Müller, W. Ultrasonic Imaging of Concrete Elements Using Reconstruction by Synthetic Aperture Focusing Technique. J. Mater. Civ. Eng. 2003, 15, 235–246. [Google Scholar] [CrossRef]
  6. Hoegh, K.; Khazanovich, L. Extended synthetic aperture focusing technique for ultrasonic imaging of concrete. NDT E Int. 2015, 74, 33–42. [Google Scholar] [CrossRef]
  7. Havugarurema, J.B.; Sackey, S.H.; Nkurunziza, P.; Nsegiyumva, E. Damage detection in concrete using synthetic aperture focusing technique. Int. J. Sci. Eng. Sci. 2020, 4, 40–47. [Google Scholar]
  8. Hosseini, Z.; Momayez, M.; Hassani, F.; Lévesque, D. Detection of inclined cracks inside concrete structures by ultrasonic saft. AIP Conf. Proc. 2008, 975, 1298–1304. [Google Scholar] [CrossRef]
  9. Tong, J.; Chiu, C.; Wang, C. Improved Synthetic Aperture Focusing Technique by Hilbert-Huang Transform for Imaging Defects inside a Concrete Structure. IEEE Trans. Ultrason. Ferroelectr. Freq. Control 2010, 57, 2512–2521. [Google Scholar] [CrossRef]
  10. De La Haza, A.O.; Samokrutov, A.A.; Samokrutov, P.A. Assessment of Concrete Structures Using the Mira and Eyecon Ultrasonic Shear Wave Devices and the SAFT-C Image Reconstruction Technique. Constr. Build. Mater. 2013, 38, 1276–1291. [Google Scholar] [CrossRef]
  11. Blitz, J.; Simpson, G. Ultrasonic Methods of Non-Destructive Testing; Springer Science & Business Media: Berlin/Heidelberg, Germany, 1995; ISBN 978-0-412-60470-6. [Google Scholar]
  12. Karaiskos, G.; Deraemaeker, A.; Aggelis, D.G.; Hemelrijck, D.V. Monitoring of Concrete Structures Using the Ultrasonic Pulse Velocity Method. Smart Mater. Struct. 2015, 24, 113001. [Google Scholar] [CrossRef]
  13. Felice, M.V.; Fan, Z. Sizing of Flaws Using Ultrasonic Bulk Wave Testing: A Review. Ultrasonics 2018, 88, 26–42. [Google Scholar] [CrossRef]
  14. Clayton, D.A.; Smith, C.M.; Ferraro, D.C.C.; Nelson, J.; Khazanovich, D.L.; Hoegh, D.K.; Chintakunta, S.; Popovics, D.J. Evaluation of Ultrasonic Techniques on Concrete Structures; No. ORNL/TM-2013/430; Oak Ridge National Lab. (ORNL): Oak Ridge, TN, USA, 2013. [Google Scholar]
  15. Choi, H.; Bittner, J.; Popovics, J.S. Comparison of Ultrasonic Imaging Techniques for Full-Scale Reinforced Concrete. Transp. Res. Rec. 2016, 2592, 126–135. [Google Scholar] [CrossRef]
  16. Popovics, J.S.; Roesler, J.R.; Bittner, J.; Amirkhanian, A.N.; Brand, A.S.; Gupta, P.; Flowers, K. Ultrasonic Imaging for Concrete Infrastructure Condition Assessment and Quality Assurance; Illinois Center for Transportation Series No. 17-011, Research Report No. FHWA-ICT-17-007; Illinois Center for Transportation/Illinois Department of Transportation: Rantoul, IL, USA, 2017. [Google Scholar]
  17. Hoegh, K.; Khazanovich, L.; Ferraro, C.; Clayton, D. Ultrasonic Linear Array Validation via Concrete Test Blocks. AIP Conf. Proc. 2015, 1650, 83–93. [Google Scholar] [CrossRef]
  18. Bishko, A.; Samokrutov, A.A.; Shevaldykin, V.G. Ultrasonic echo-pulse tomography of concrete using shear waves low-frequency phased antenna arrays. In Proceedings of the 17th World Conference on Nondestructive Testing, Shanghai, China, 25–28 October 2008; p. 2008. [Google Scholar]
  19. Zhao, H.; Song, P.; Urban, M.W.; Kinnick, R.R.; Yin, M.; Greenleaf, J.F.; Chen, S. Bias Observed in Time-of-Flight Shear Wave Speed Measurements Using Radiation Force of a Focused Ultrasound Beam. Ultrasound Med. Biol. 2011, 37, 1884–1892. [Google Scholar] [CrossRef]
  20. Haslinger, S.G.; Lowe, M.J.S.; Huthwaite, P.; Craster, R.V.; Shi, F. Elastic Shear Wave Scattering by Randomly Rough Surfaces. J. Mech. Phys. Solids 2020, 137, 103852. [Google Scholar] [CrossRef]
  21. Deng, Y.; Rouze, N.C.; Palmeri, M.L.; Nightingale, K.R. On System-Dependent Sources of Uncertainty and Bias in Ultrasonic Quantitative Shear-Wave Imaging. IEEE Trans. Ultrason. Ferroelectr. Freq. Control 2016, 63, 381–393. [Google Scholar] [CrossRef]
  22. Lin, S.; Shams, S.; Choi, H.; Azari, H. Ultrasonic Imaging of Multi-Layer Concrete Structures. NDT E Int. 2018, 98, 101–109. [Google Scholar] [CrossRef]
  23. Jain, H.; Patankar, V.H. Advances in Ultrasonic Instrumentation for Inspection of Concrete/RCC Structures. In Proceedings of the NDE 2018 Conference & Exhibition of the Society for NDT (ISNT), Mumbai, India, 19–21 December 2018. [Google Scholar]
  24. Rathod, H.; Gupta, R. Two-Dimensional Non-Destructive Testing Data Maps for Reinforced Concrete Slabs with Simulated Damage. Data Brief 2019, 25, 104127. [Google Scholar] [CrossRef]
  25. Rathod, H.; Gupta, R. Sub-Surface Simulated Damage Detection Using Non-Destructive Testing Techniques in Reinforced-Concrete Slabs. Constr. Build. Mater. 2019, 215, 754–764. [Google Scholar] [CrossRef]
  26. Ezell, N.D.B.; Venkatakrishnan, S.V.; Al Mansouri, H.; Santos-Villalobos, H.; Floyd, D. High fidelity ultrasound imaging of concrete structures. In Proceedings of the Smart Structures and NDE for Energy Systems and Industry 4.0, Denver, CO, USA, 4–5 March 2019; pp. 151–159. [Google Scholar]
  27. Ohara, Y.; Kikuchi, K.; Tsuji, T.; Mihara, T. Development of Low-Frequency Phased Array for Imaging Defects in Concrete Structures. Sensors 2021, 21, 7012. [Google Scholar] [CrossRef]
  28. Rabe, U.; Pudovikov, S.; Herrmann, H.-G.; Wiggenhauser, H.; Prabhakara, P.; Niederleithinger, E. Using the Corner Reflection for Depth Evaluation of Surface Breaking Cracks in Concrete by Ultrasound. J. Nondestruct. Eval. 2023, 42, 44. [Google Scholar] [CrossRef]
  29. Kuchipudi, S.T.; Pudovikov, S.; Wiggenhauser, H.; Ghosh, D.; Rabe, U. Imaging of Vertical Surface-Breaking Cracks in Concrete Members Using Ultrasonic Shear Wave Tomography. Sci. Rep. 2023, 13, 21744. [Google Scholar] [CrossRef] [PubMed]
  30. Maack, S.; Küttenbaum, S.; Bühling, B.; Borchardt-Giers, K.; Aßmann, N.; Niederleithinger, E. Low Frequency Ultrasonic Pulse-Echo Datasets for Object Detection and Thickness Measurement in Concrete Specimens as Testing Tasks in Civil Engineering. Data Brief 2023, 48, 109233. [Google Scholar] [CrossRef] [PubMed]
  31. Mehdinia, S.; Schumacher, T.; Song, X.; Wan, E. A Pipeline for Enhanced Multimodal 2D Imaging of Concrete Structures. Mater. Struct. 2021, 54, 228. [Google Scholar] [CrossRef]
  32. Mayakuntla, P.K.; Ghosh, D.; Ganguli, A. Classification of Corrosion Severity in Concrete Structures Using Ultrasonic Imaging and Linear Discriminant Analysis. Sustainability 2022, 14, 15768. [Google Scholar] [CrossRef]
  33. Kwon, H.; Joh, C.; Chin, W.J. Pulse Peak Delay-Total Focusing Method for Ultrasonic Tomography on Concrete Structure. Appl. Sci. 2021, 11, 1741. [Google Scholar] [CrossRef]
  34. Kwon, H.; Joh, C.; Chin, W.J. 3D Internal Visualization of Concrete Structure Using Multifaceted Data for Ultrasonic Array Pulse-Echo Tomography. Sensors 2021, 21, 6681. [Google Scholar] [CrossRef] [PubMed]
  35. Zatar, W.A.; Nguyen, H.D.; Nghiem, H.M. Ultrasonic Pitch and Catch Technique for Non-Destructive Testing of Reinforced Concrete Slabs. J. Infrastruct. Preserv. Resil. 2020, 1, 12. [Google Scholar] [CrossRef]
  36. Zatar, W.; Nguyen, T.; Nguyen, H. Environmental effects on condition assessments of concrete structures with ground penetrating radar. J. Appl. Geophys. 2022, 203, 104713. [Google Scholar] [CrossRef]
  37. Zatar, W.; Nguyen, H.; Nghiem, H. FRP Retrofitting and Non-Destructive Evaluation for Corrosion-Deteriorated Bridges in West Virginia. In International Concrete Abstracts Portal; Special Publication; American Concrete Institute (ACI): Farmington Hills, MI, USA, 2021; Volume 346, pp. 11–30. [Google Scholar]
  38. Zatar, W.; Nghiem, H. Detectability of embedded defects in FRP strengthened concrete deck slabs. In Risk-Based Strategies for Bridge Maintenance; CRC Press: Boca Raton, FL, USA, 2023; pp. 221–234. [Google Scholar]
  39. Zatar, W.; Hua, X.; Chen, G.; Nguyen, H.; Nghiem, H. Evaluating the Properties of Railway Ballast Using Spectral Analysis of Ground Penetrating Radar Signal Based on Optimized Variational Mode Decomposition. Adv. Civ. Eng. 2022, 2022, 2840318. [Google Scholar] [CrossRef]
  40. Zatar, W.A.; Nguyen, H.D.; Nghiem, H.M.; Cosgun, C. Non-Destructive Testing of GFRP-Wrapped Reinforced-Concrete Slabs (No. TRBAM-21-03354). 2021. Available online: https://trid.trb.org/view/1758973 (accessed on 27 January 2021).
  41. Zatar, W.; Nguyen, H.; Nghiem, H. Nondestructive Evaluation of Reinforced Concrete Slabs Rehabilitated with Glass Fiber-Reinforced Polymers. In International Concrete Abstracts Portal; Special Publication; American Concrete Institute (ACI): Farmington Hills, MI, USA, 2022; Volume 356, pp. 224–237. [Google Scholar]
  42. Zatar, W.; Nguyen, H.D.; Nghiem, H.M. Influence of Frequencies of Ground-Penetrating Radar Antennas on Detectability of Defects and Image Reconstructability of Concrete Structures. In Proceedings of the Ninth Congress on Forensic Engineering, Denver, CO, USA, 4–7 November 2022; pp. 620–630. [Google Scholar]
  43. Tayfur, S. Assessing the Influences of Noise Suppression Filters on Ultrasonic Concrete Images Generated by an Innovative CMU-SAFT Algorithm. Arab. J. Sci. Eng. 2024, 1–14. [Google Scholar] [CrossRef]
  44. Mehdinia, S.; Murtuz, A.K.M.G.; Schumacher, T.; Dusicka, P. Damage Tracking in Laboratory Reinforced Concrete Bridge Columns under Reverse-Cyclic Loading Using Fusion-Based Imaging. Nondestruct. Test. Eval. 2024, 39, 536–556. [Google Scholar] [CrossRef]
  45. Zhang, T.; Zhang, L.; Ozevin, D.; Attard, T. Multi-Scale Ultrasonic Imaging of Sub-Surface Concrete Defects. Meas. Sci. Technol. 2023, 35, 035901. [Google Scholar] [CrossRef]
  46. San Emeterio, J.L.; Rodriguez-Hernandez, M.A. Wavelet Denoising of Ultrasonic A-Scans for Detection of Weak Signals. In Proceedings of the 2012 19th International Conference on Systems, Signals and Image Processing (IWSSIP), Vienna, Austria, 11–13 April 2012; pp. 48–51. [Google Scholar]
  47. Hoseini, M.R.; Zuo, M.J.; Wang, X. Denoising Ultrasonic Pulse-Echo Signal Using Two-Dimensional Analytic Wavelet Thresholding. Measurement 2012, 45, 255–267. [Google Scholar] [CrossRef]
  48. Sharma, G.K.; Kumar, A.; Jayakumar, T.; Purnachandra Rao, B.; Mariyappa, N. Ensemble Empirical Mode Decomposition Based Methodology for Ultrasonic Testing of Coarse Grain Austenitic Stainless Steels. Ultrasonics 2015, 57, 167–178. [Google Scholar] [CrossRef] [PubMed]
  49. Zhu, Y.; Xu, C.; Xiao, D. Denoising Ultrasonic Echo Signals with Generalized S Transform and Singular Value Decomposition. Trait. Signal 2019, 36, 139–145. [Google Scholar] [CrossRef]
  50. Li, Z.; Xu, H.; Jiang, B.; Han, F. Wavelet Threshold Ultrasound Echo Signal Denoising Algorithm Based on CEEMDAN. Electronics 2023, 12, 3026. [Google Scholar] [CrossRef]
  51. Bouchair, A.; Selouani, S.A.; Amrouche, A.; Sidi Yakoub, M. Improved Empirical Mode Decomposition Using Optimal Recursive Averaging Noise Estimation for Speech Enhancement. Circuits Syst. Signal Process. 2022, 41, 196–223. [Google Scholar] [CrossRef]
  52. Zhang, Z.; Xie, H.; Tong, X.; Zhang, H.; Liu, Y.; Li, B. Denoising for Satellite Laser Altimetry Full-Waveform Data Based on EMD-Hurst Analysis. Int. J. Digit. Earth 2020, 13, 1212–1229. [Google Scholar] [CrossRef]
  53. Luo, H.; Fang, X.; Ertas, B. Hilbert Transform and Its Engineering Applications. AIAA J. 2009, 47, 923–932. [Google Scholar] [CrossRef]
  54. Yoo, J.-H.; Cho, S.-H. Advanced Synchronization Check Method Using Hilbert Transform-Based Voltage Envelope Analysis. J. Electr. Eng. Technol. 2023, 18, 4463–4471. [Google Scholar] [CrossRef]
  55. Watanabe, T.; Morita, T.; Hashimoto, C.; Ohtsu, M. Detecting Voids in Reinforced Concrete Slab by SIBIE. Constr. Build. Mater. 2004, 18, 225–231. [Google Scholar] [CrossRef]
  56. Gu, J.-C.; Unjoh, S.; Naito, H. Detectability of Delamination Regions Using Infrared Thermography in Concrete Members Strengthened by CFRP Jacketing. Compos. Struct. 2020, 245, 112328. [Google Scholar] [CrossRef]
  57. Gu, J.; Unjoh, S. Image Processing Methodology for Detecting Delamination Using Infrared Thermography in CFRP-Jacketed Concrete Members by Infrared Thermography. Compos. Struct. 2021, 270, 114040. [Google Scholar] [CrossRef]
  58. Kabir, E. Nondestructive Evaluation of Structural Defects in Concrete Slabs. Ph.D. Thesis, Georgia Southern University, Statesboro, GA, USA, 2023. [Google Scholar]
  59. Zhang, M.; Wei, G. An Integrated EMD Adaptive Threshold Denoising Method for Reduction of Noise in ECG. PLoS ONE 2020, 15, e0235330. [Google Scholar] [CrossRef] [PubMed]
  60. Feng, W.; Zhou, X.; Zeng, X.; Yang, C. Ultrasonic Flaw Echo Enhancement Based on Empirical Mode Decomposition. Sensors 2019, 19, 236. [Google Scholar] [CrossRef] [PubMed]
  61. Duan, D.; Ma, H.; Yan, Y.; Yang, Q. A Fault Diagnosis Scheme Using Hurst Exponent for Metal Particle Faults in GIL/GIS. Sensors 2022, 22, 862. [Google Scholar] [CrossRef] [PubMed]
  62. Haider, N.S. Respiratory Sound Denoising Using Empirical Mode Decomposition, Hurst Analysis and Spectral Subtraction. Biomed. Signal Process. Control 2021, 64, 102313. [Google Scholar] [CrossRef]
  63. Zhu, W.-F.; Chen, X.-J.; Li, Z.-W.; Meng, X.-Z.; Fan, G.-P.; Shao, W.; Zhang, H.-Y. A SAFT Method for the Detection of Void Defect inside a Ballastless Track Structure Using Ultrasonic Array Sensors. Sensors 2019, 19, 4677. [Google Scholar] [CrossRef]
Figure 1. Schematic of the principles of UPC device.
Applsci 14 04860 g001
Figure 2. (a) Reinforced concrete deck slab specimen before concrete placement; (b) front panel of the UPC device and 48 low-frequency dry-point-contact transducers [35].
Applsci 14 04860 g002
Figure 3. Basic principles of the UPE device: (a) the first channel of transducers transmits signals that are subsequently received by other channels; (b) a transmitting and a receiving transducer produce an A-scan for void defection.
Applsci 14 04860 g003
Figure 4. (a) Two-dimensional reconstructed image including the voids; (b) reconstructed image of void #1; (c) color spectrum for signal amplitudes.
Applsci 14 04860 g004aApplsci 14 04860 g004b
Figure 5. A-scans for the case without and with voids. (a) without void defect; (b) with void defect.
Applsci 14 04860 g005
Figure 6. Original and denoised A-scans of echo signal for RC specimen without void. (a) Original A-scans; (b) Denoised A-scans.
Applsci 14 04860 g006
Figure 7. Original and denoised A-scans of the echo signal for RC specimen with a defect void. (a) Original A-scans; (b) Denoised A-scans.
Applsci 14 04860 g007
Figure 8. A-scan of RC specimen with void and the extracted envelope from A-scans without void.
Applsci 14 04860 g008
Table 1. Comparison of the void location.
MethodExperimental SpecimenUPE DeviceNew Method
Distance from surface (mm) 8370–7582
Disclaimer/Publisher’s Note: The statements, opinions and data contained in all publications are solely those of the individual author(s) and contributor(s) and not of MDPI and/or the editor(s). MDPI and/or the editor(s) disclaim responsibility for any injury to people or property resulting from any ideas, methods, instructions or products referred to in the content.

