Abstract
In contrast to cumbersome benchtop spectrometers, integrated on-chip spectrometers are well-suited for portable applications in health monitoring and environmental sensing. In this paper, we have developed an on-chip spectrometer with a programmable silicon photonic filter by simply using parallel cascaded micro-ring resonators (MRs). By altering the transmission spectrum of the filter, multiple and diverse sampling of the input spectrum is achieved. Then, combined with an artificial neural network (ANN) model, the incident spectrum is reconstructed from the sampled signals. Each MR is coupled to adjacent ones, and the phase shifts within each MR can be independently tuned. Through dynamic programming of the phases of these MRs, sampling functions featuring diverse characteristics are obtained based on a single programmable filter with an adjustable number of sampling channels. This eliminates the need for a filter array, significantly reducing the area of the on-chip reconstructive spectrometer. The simulation results demonstrate that the proposed design can achieve the reconstruction of continuous and sparse spectra within the wavelength range of 1450 nm to 1650 nm, with a tunable resolution ranging from 2 nm to 0.2 nm, depending on the number of sampling states employed. This benefit arises from the programmable nature of the device. The device holds tremendous potential for applications in wearable optical sensing, portable spectrometry, and other related scenarios.
1. Introduction
Spectroscopic analysis techniques are indispensable tools in a multitude of disciplines such as biomedical research, material science, and remote sensing [1,2,3]. Despite their significance, traditional benchtop spectrometers suffer from several drawbacks; they are generally bulky, complex, and expensive, rendering them ineffective for emerging applications such as wearable health monitoring and Lab-on-Chip systems [4,5]. The motivation for our research stems from the urgent need for more accessible and versatile spectroscopic tools that can cater to these innovative applications. Integrated spectrometers, which lack mechanical moving parts, offer an appealing alternative due to their higher reliability, compactness, and field-deployable capabilities. These advantages are particularly relevant for broadening the application scope of spectral analysis. Driven by this vision, the past few decades have seen a concerted effort by both academia and industry to develop miniaturized spectrometers. As a result, over the past few decades, researchers have introduced numerous designs for computationally reconstructed on-chip spectrometers. These designs leverage advanced technologies such as silicon photonics and nano-fabrication to integrate multiple spectral components onto a single chip, enabling high-performance spectral analysis in a much smaller and more portable form factor.
Innovative designs have emerged, replacing traditional diffraction-based elements with novel dispersive ones, such as disordered scattering media [6,7,8,9], metasurfaces [10,11], photonic crystals [12,13], quantum dot arrays [14,15], multimode waveguides [16,17], or filter arrays [18,19,20,21]. These approaches utilize these novel dispersive elements to create a sampling array, capturing the incident spectrum across multiple channels. The reconstruction of the spectrum is based on the speckle or intensity distribution obtained from these samplings. However, the scalability of the sampling array can limit the resolution and accuracy of the reconstruction. Another design approach employs dynamically tunable elements, such as tunable cavities [22], black phosphorus detectors [23], perovskite detectors [24], and reconfigurable silicon photonic networks [25,26]. By applying external control signals, the response function of the tunable sampling unit can be dynamically adjusted to achieve variable sampling of the incident spectrum. The challenge for these systems is to achieve accurate and high-resolution spectral reconstruction while avoiding overly complex device architectures or numerous sampling channels.
Addressing these challenges, our work presents an on-chip spectrometer based on a silicon photonic platform. The core of our design is a transmission-programmable silicon photonic filter, which serves as a dynamic sampling unit. By manipulating the transmission spectrum of the filter, we can perform diverse samplings of the input spectrum. An ANN model is then employed to reconstruct the incident spectrum from the sampled signals. The programmable silicon photonic filter is ingeniously designed with parallel cascaded MRs. By adjusting the phase variations of light waves within the MRs via thermo-optic phase shifters, the transmission spectrum of the silicon photonic filter can be altered. Our design distinguishes itself from existing filter-based on-chip spectrometers by employing a full MR configuration with mutually coupled cascaded MRs and intentionally designed unequal radii. This unique approach enhances the diversity of sampling responses, resembling random sampling with a limited number of sampling channels, which is essential for computational spectral reconstruction. Furthermore, our chip features three output ports, enabling higher sampling efficiency and improved reconstruction performance. Compared to previous on-chip programmable photonic filters used as spectrometers, our parallel cascaded MR-based design offers a significantly less complex and more compact solution, with an estimated chip area of approximately 40 × 100 μm2. The reduced complexity and miniaturization not only minimize the overall size of the spectral reconstruction system but also allow for lower fabrication costs and improved scalability. Additionally, our device provides wide-band spectral computational reconstruction within the wavelength of 1450 nm to 1650 nm, achieving a tunable resolution ranging from 2 nm to 0.2 nm under different numbers of sampling states. The programmable capability of the silicon photonic filter adds flexibility, empowering users to tailor the number of sampling channels to suit different applications, thereby adjusting the resolution, relative error, and computational complexity as needed.
2. Principle and Design
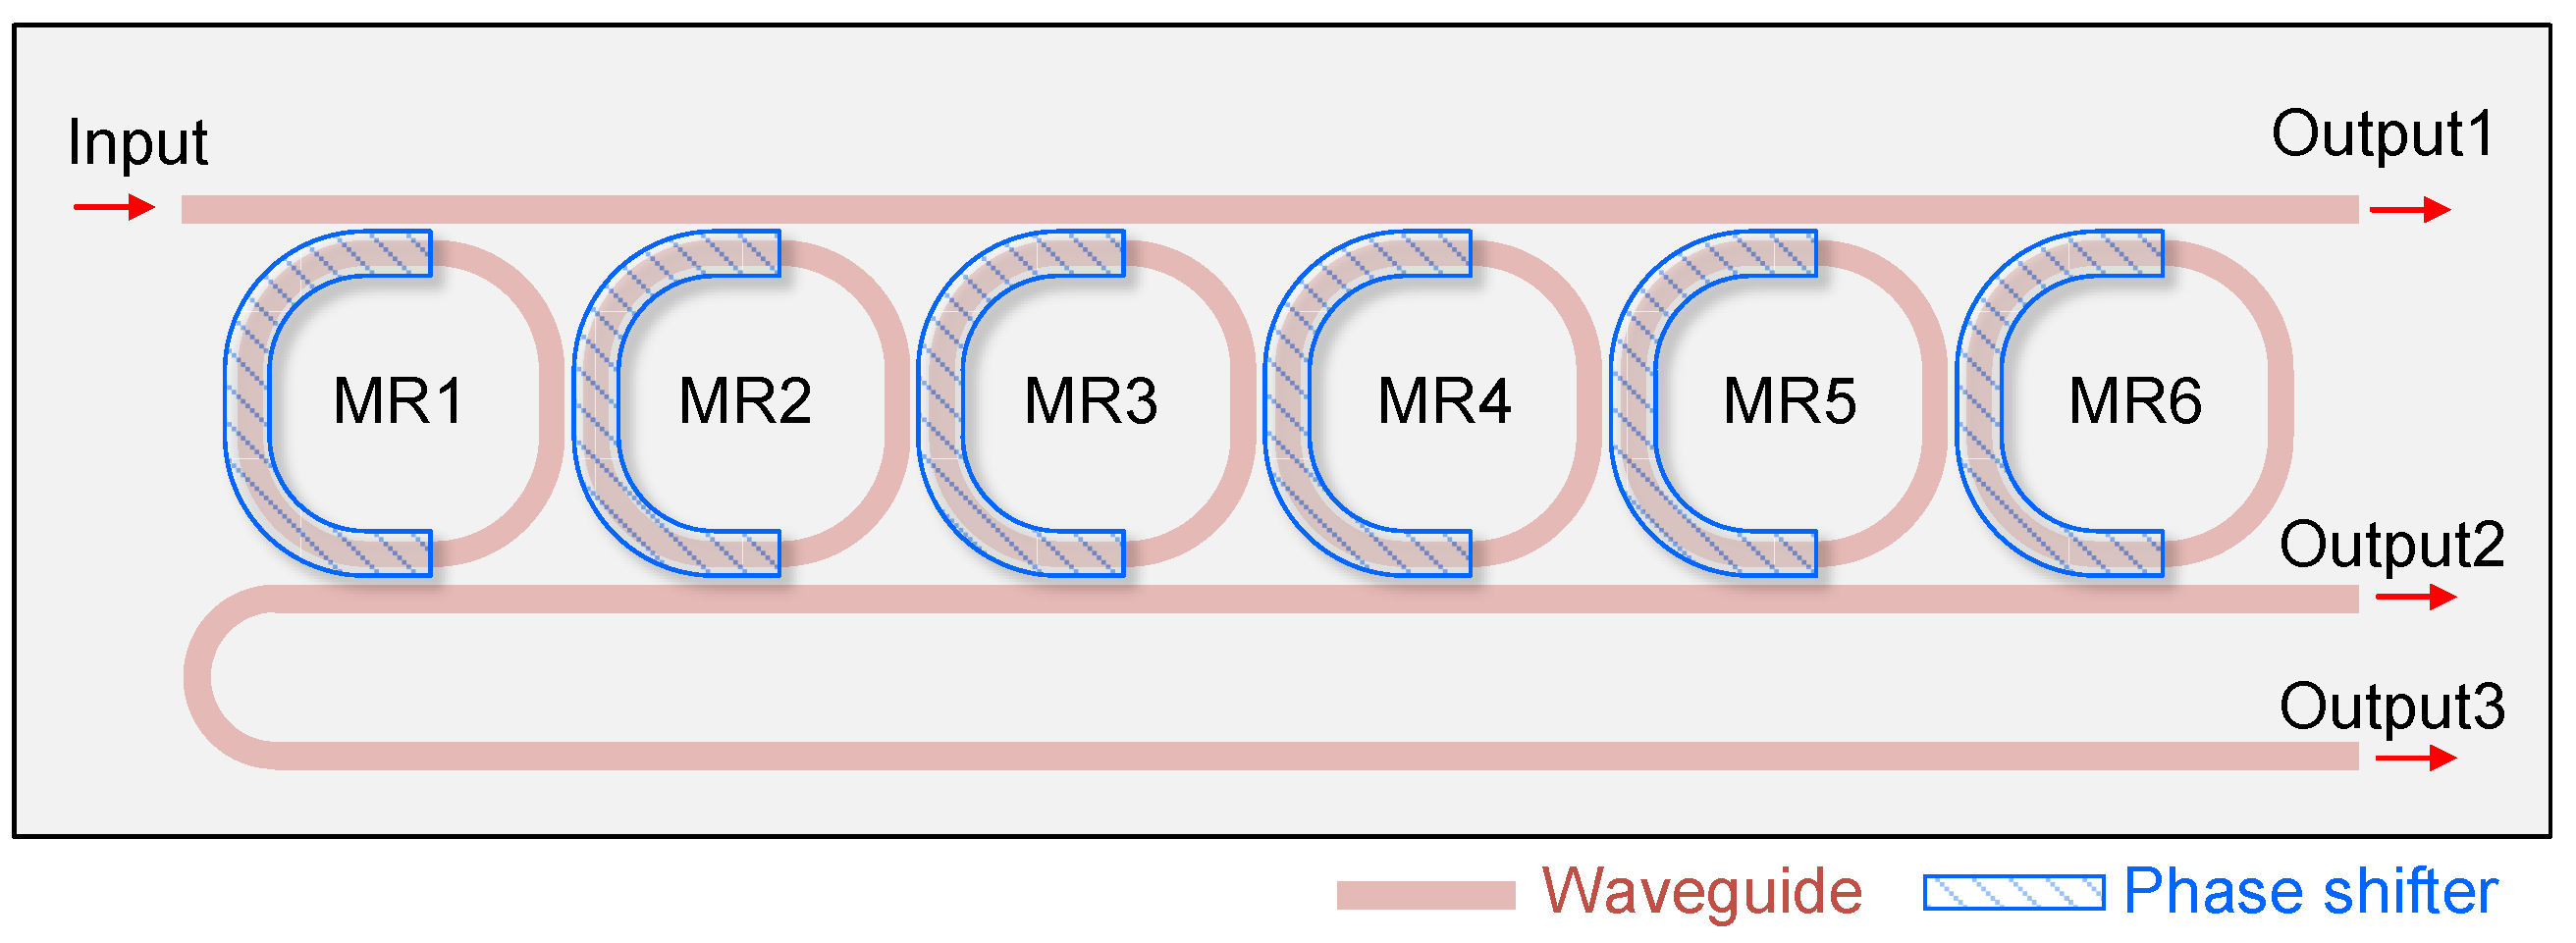
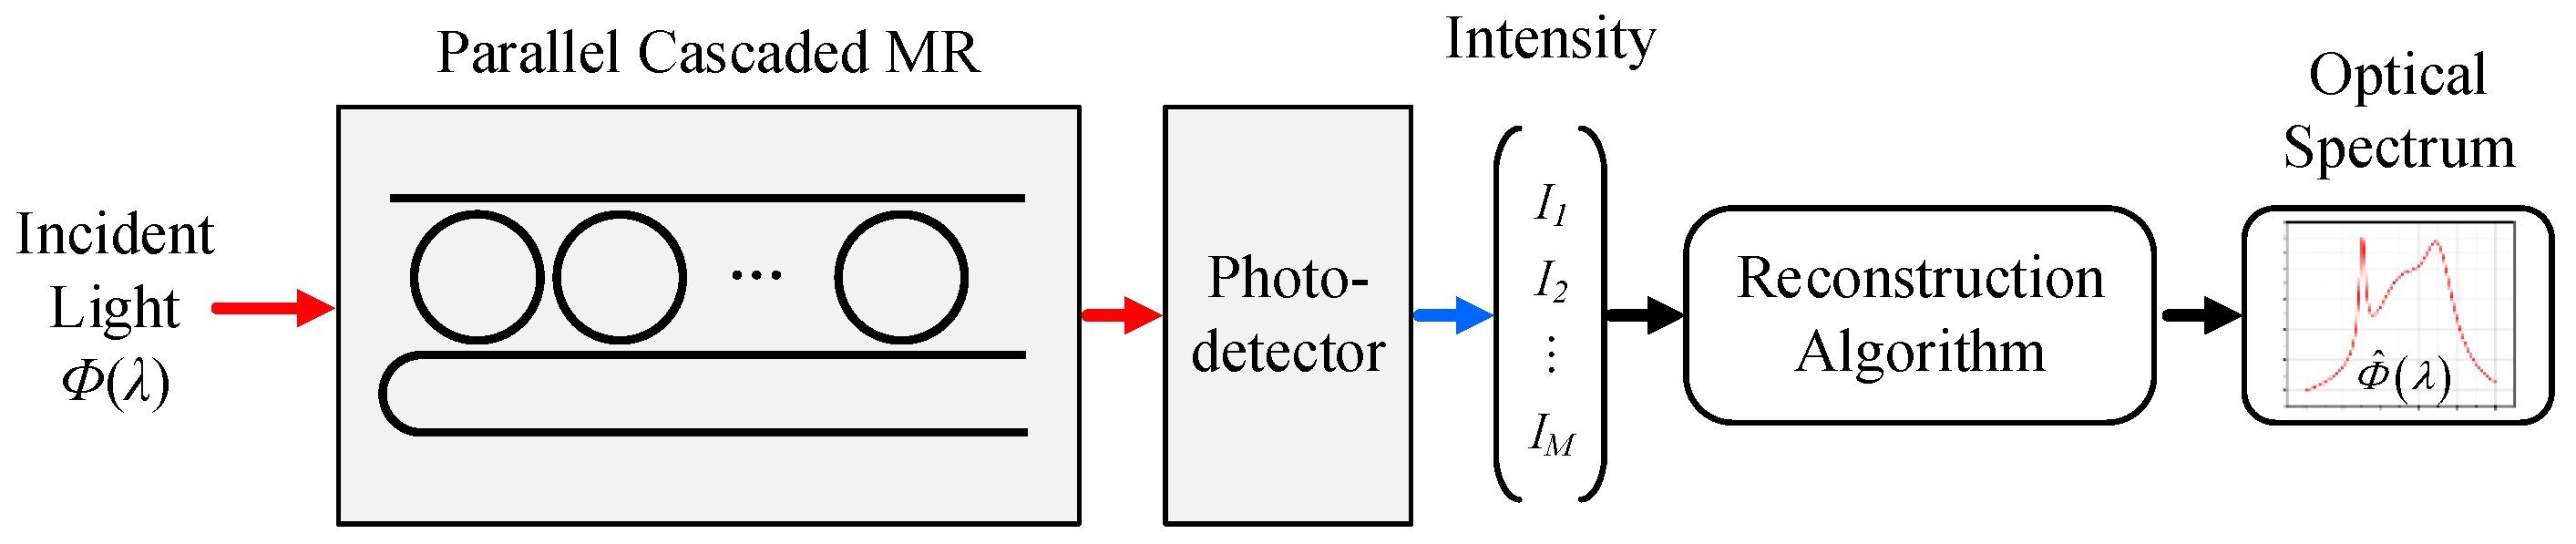
The on-chip spectrometer we have designed is primarily composed of a programmable silicon photonic filter. The structural schematic of the device is shown in Figure 1. By applying control signals to the phase shifters, we can program the phase shift of each MR, thereby altering the filter’s transmission spectrum. Each time the transmission state of the filter is changed, three samplings of the input optical signal can be completed because the filter has three output ports. Through the reasonable setting of control signals, we can ensure that the transmission spectra of sampling channels have unique spectral features with low correlation, leading to diversified sampling of the incident spectrum. The sampled spectral signals are then converted into response vectors by photodetectors at the output end of the filter. The process of spectrum reconstruction is illustrated in Figure 2.
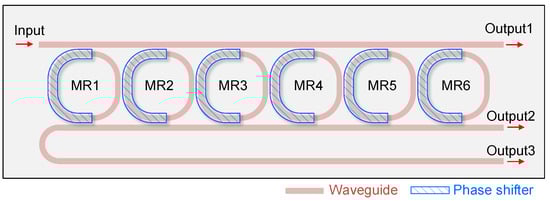
Figure 1.
Schematic diagram of the on-chip computational spectrometer based on programmable silicon photonic filters. The phase shifters are integrated within each ring resonator to individually control the phase shift, enabling the programmability of the filter’s transmission spectrum.
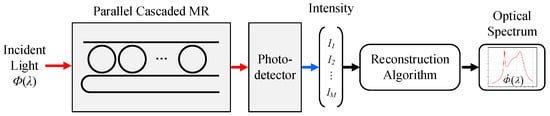
Figure 2.
Spectral reconstruction procedure.
The designed programmable silicon photonic filter consists of a 6-stage parallel cascaded MR with different radii. Each MR is coupled to adjacent ones to increase the diversity of the optical paths within the device. By employing different radii of the MRs, the Vernier effect is introduced, which further enhances the diversity of the filter’s transmission spectrum, thereby improving the sampling efficiency of the filter.
By individually controlling the voltage across the six phase shifters, we can leverage the thermo-optic effect to program the phase shift (Δϕ) in each MR, thus enabling flexible adjustment of the filter’s transmission spectrum. When the incident light, Φ(λ), enters the silicon photonic filter from the input port, the transmission spectrum Ti(λ) of the filter is modified by adjusting the input voltages of the six phase shifters, which completes the sampling of the incident light spectrum. Then the output power intensity Ii of an unknown incident spectrum Φ(λ) propagating through a broadband sampling channel can be described as:
Equation (1) can be rewritten in a discrete form as:
where N is the number of spectral pixels in the wavelength domain. By repeatedly changing the sampling state of the filter through external voltages, multiple samplings of the incident light spectrum can be achieved. An intensity vector IM×1 and the corresponding M equations are obtained through M sampling channels. These equations can be expressed in the following matrix form:
where the sampling matrix TM×N connects the intensity vector IM×1 with the incident light ΦN×1 to be measured. Clearly, there are M equations and N unknowns Φ(λk) to solve for in Equation (3). The unknown input spectrum ΦN×1 can be computed by multiplying the output intensity IM×1 by the inverse of the matrix TM×N. In general, since the inverse matrix is only applicable to square matrices, the number of recoverable wavelength channels is limited by the number of sampling channels. However, with proper design, the number of samples M required to reconstruct the spectrum of input light can be much smaller than the number of spectral pixels N [21]. When M is less than N, the problem described by Equation (3) is underdetermined. Reconstruction algorithms such as compressed sensing and convex optimization can be applied to solve this underdetermined problem and recover a high-resolution incident light spectrum [21,27]. In our work, we designed an ANN model based on residual blocks, referring to the algorithm in the literature [28], to complete the task of reconstructing the incident light spectrum. Additionally, we have modified the model architecture to reduce computational complexity and resource requirements. Specifically, we have replaced the multiple convolutional layers with a single fully connected layer while retaining residual connections. This modification streamlines the model architecture, making it more efficient and less resource-intensive, without compromising its performance in reconstructing the incident spectrum from the sampled signals. Compared to traditional methods, the spectrum reconstruction algorithm based on deep learning does not rely on prior knowledge of the incident spectrum and offers faster solving speed [20].
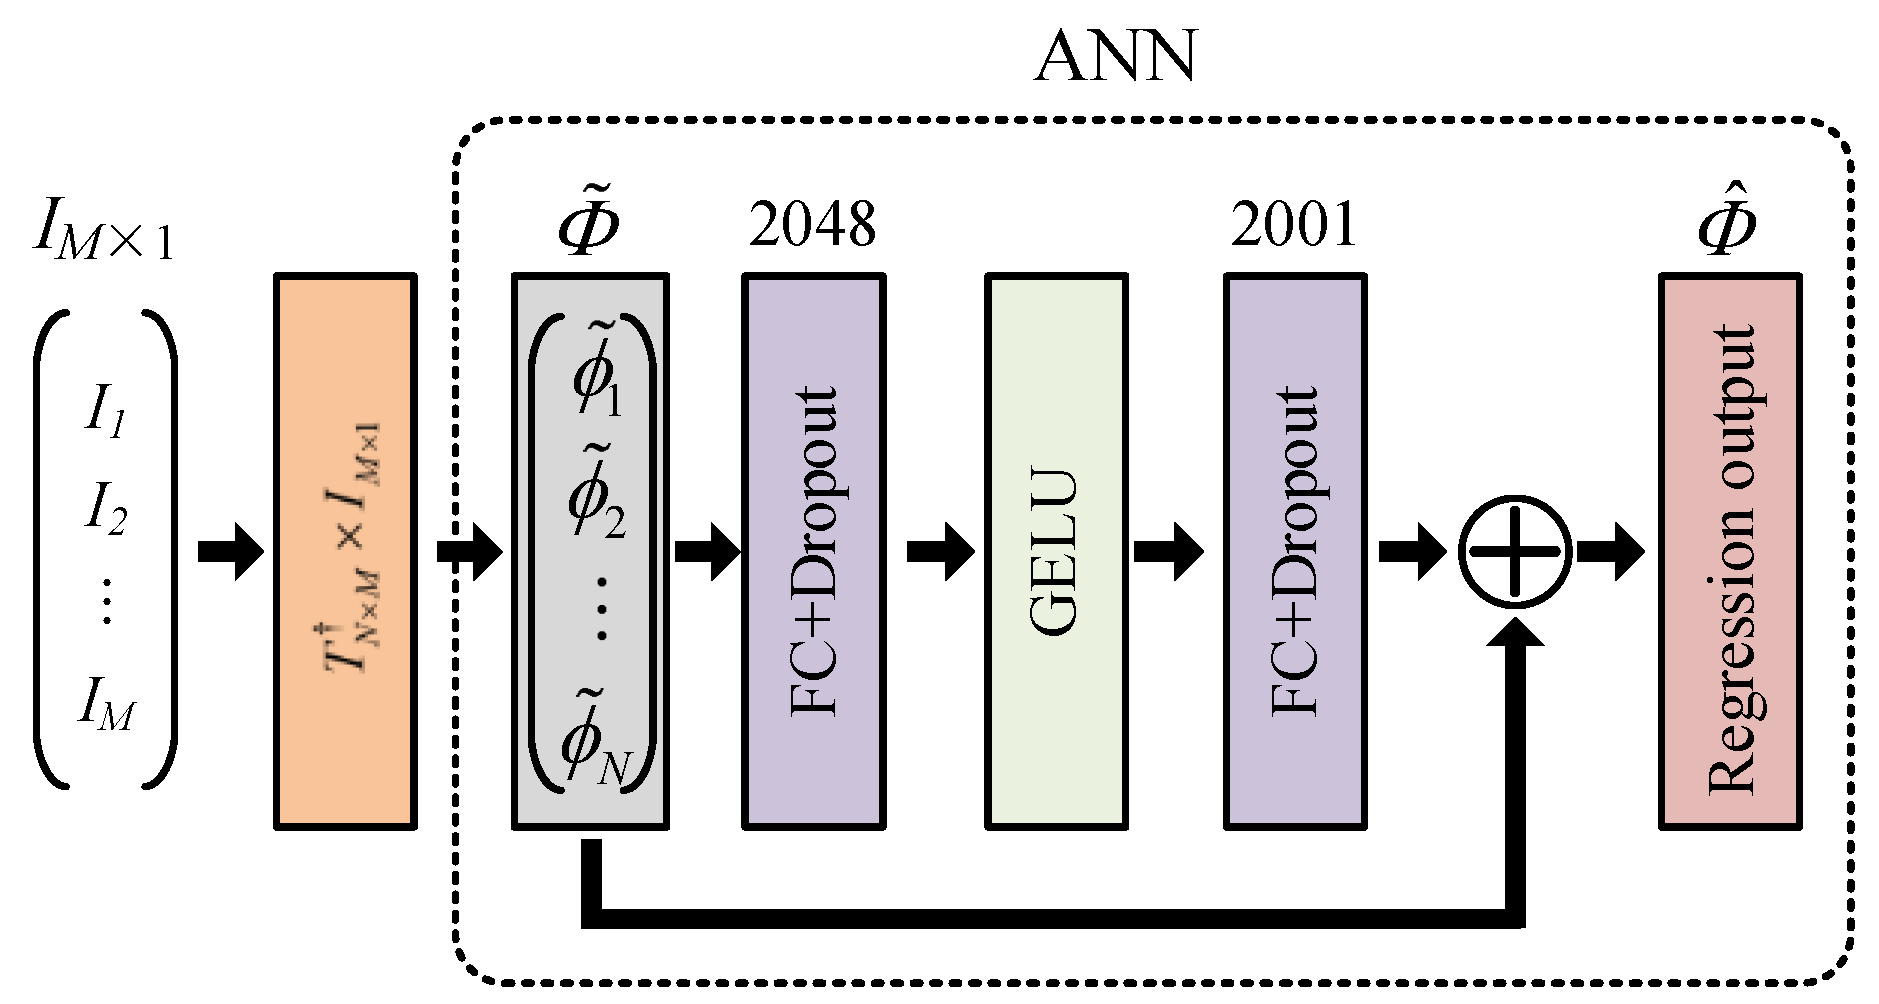
After obtaining the intensity vector IM×1 from Equation (3), we transform it by multiplying it with the pseudo-inverse matrix of the sampling matrix TM×N to obtain . This transformed vector is then used as the input for the ANN. Through training, the network learns the nonlinear mapping between and the true spectrum Φ, resulting in the reconstructed spectrum . The ANN model we employed includes two fully connected layers and a residual connection from the input to the output. After the fully connected layer, a Gaussian Error Linear Unit (GeLU) is used as the activation function. Dropout follows the layer to reduce the overfitting of the model. The output of the last fully connected layer is added to the network’s input and then fed into the regression output layer. The number of units in each fully connected layer is depicted in Figure 3. The output layer consists of 2001 nodes, representing the reconstructed spectral intensity. These nodes correspond to wavelengths ranging from 1450 nm to 1650 nm, with a uniform spacing of 0.1 nm between each wavelength point. During the training of the network, we employ the Mean Squared Error (MSE) as the loss function.
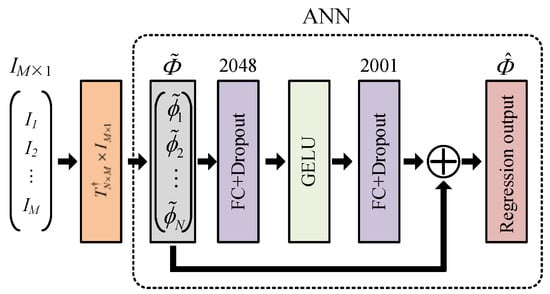
Figure 3.
The schematic of the spectrum reconstruction algorithm.
3. Simulation Results and Analysis
3.1. Device Design and Simulation
The device is designed to be fabricated on a Silicon-on-Insulator (SOI) platform with a top silicon layer thickness of 220 nm and a buried oxide layer thickness of 2 μm. The waveguide is a single-mode rib waveguide with a height of 220 nm, a width of 450 nm, and slab regions on both sides of 70 nm thickness. Referring to the technology of mainstream silicon photonics SOI platforms, the waveguide’s transmission loss is set to 2 dB/cm. The effective refractive index of the TE-polarized fundamental mode at a 1550 nm wavelength obtained using the finite difference eigenmode method is 2.4769, and the group refractive index is 4.0088. The MRs in the filter are racetrack micro-rings with straight waveguide sections 1.14 μm in length and with radii of 5 μm, 5.5 μm, 6 μm, 6.5 μm, 7 μm, and 7.5 μm, respectively. The coupling gap between the micro-ring and the straight waveguide is 100 nm, as is the coupling gap between micro-rings, ensuring that the resonators are in an over-coupled state with coupling coefficients at a 1550 nm wavelength being around 0.5.
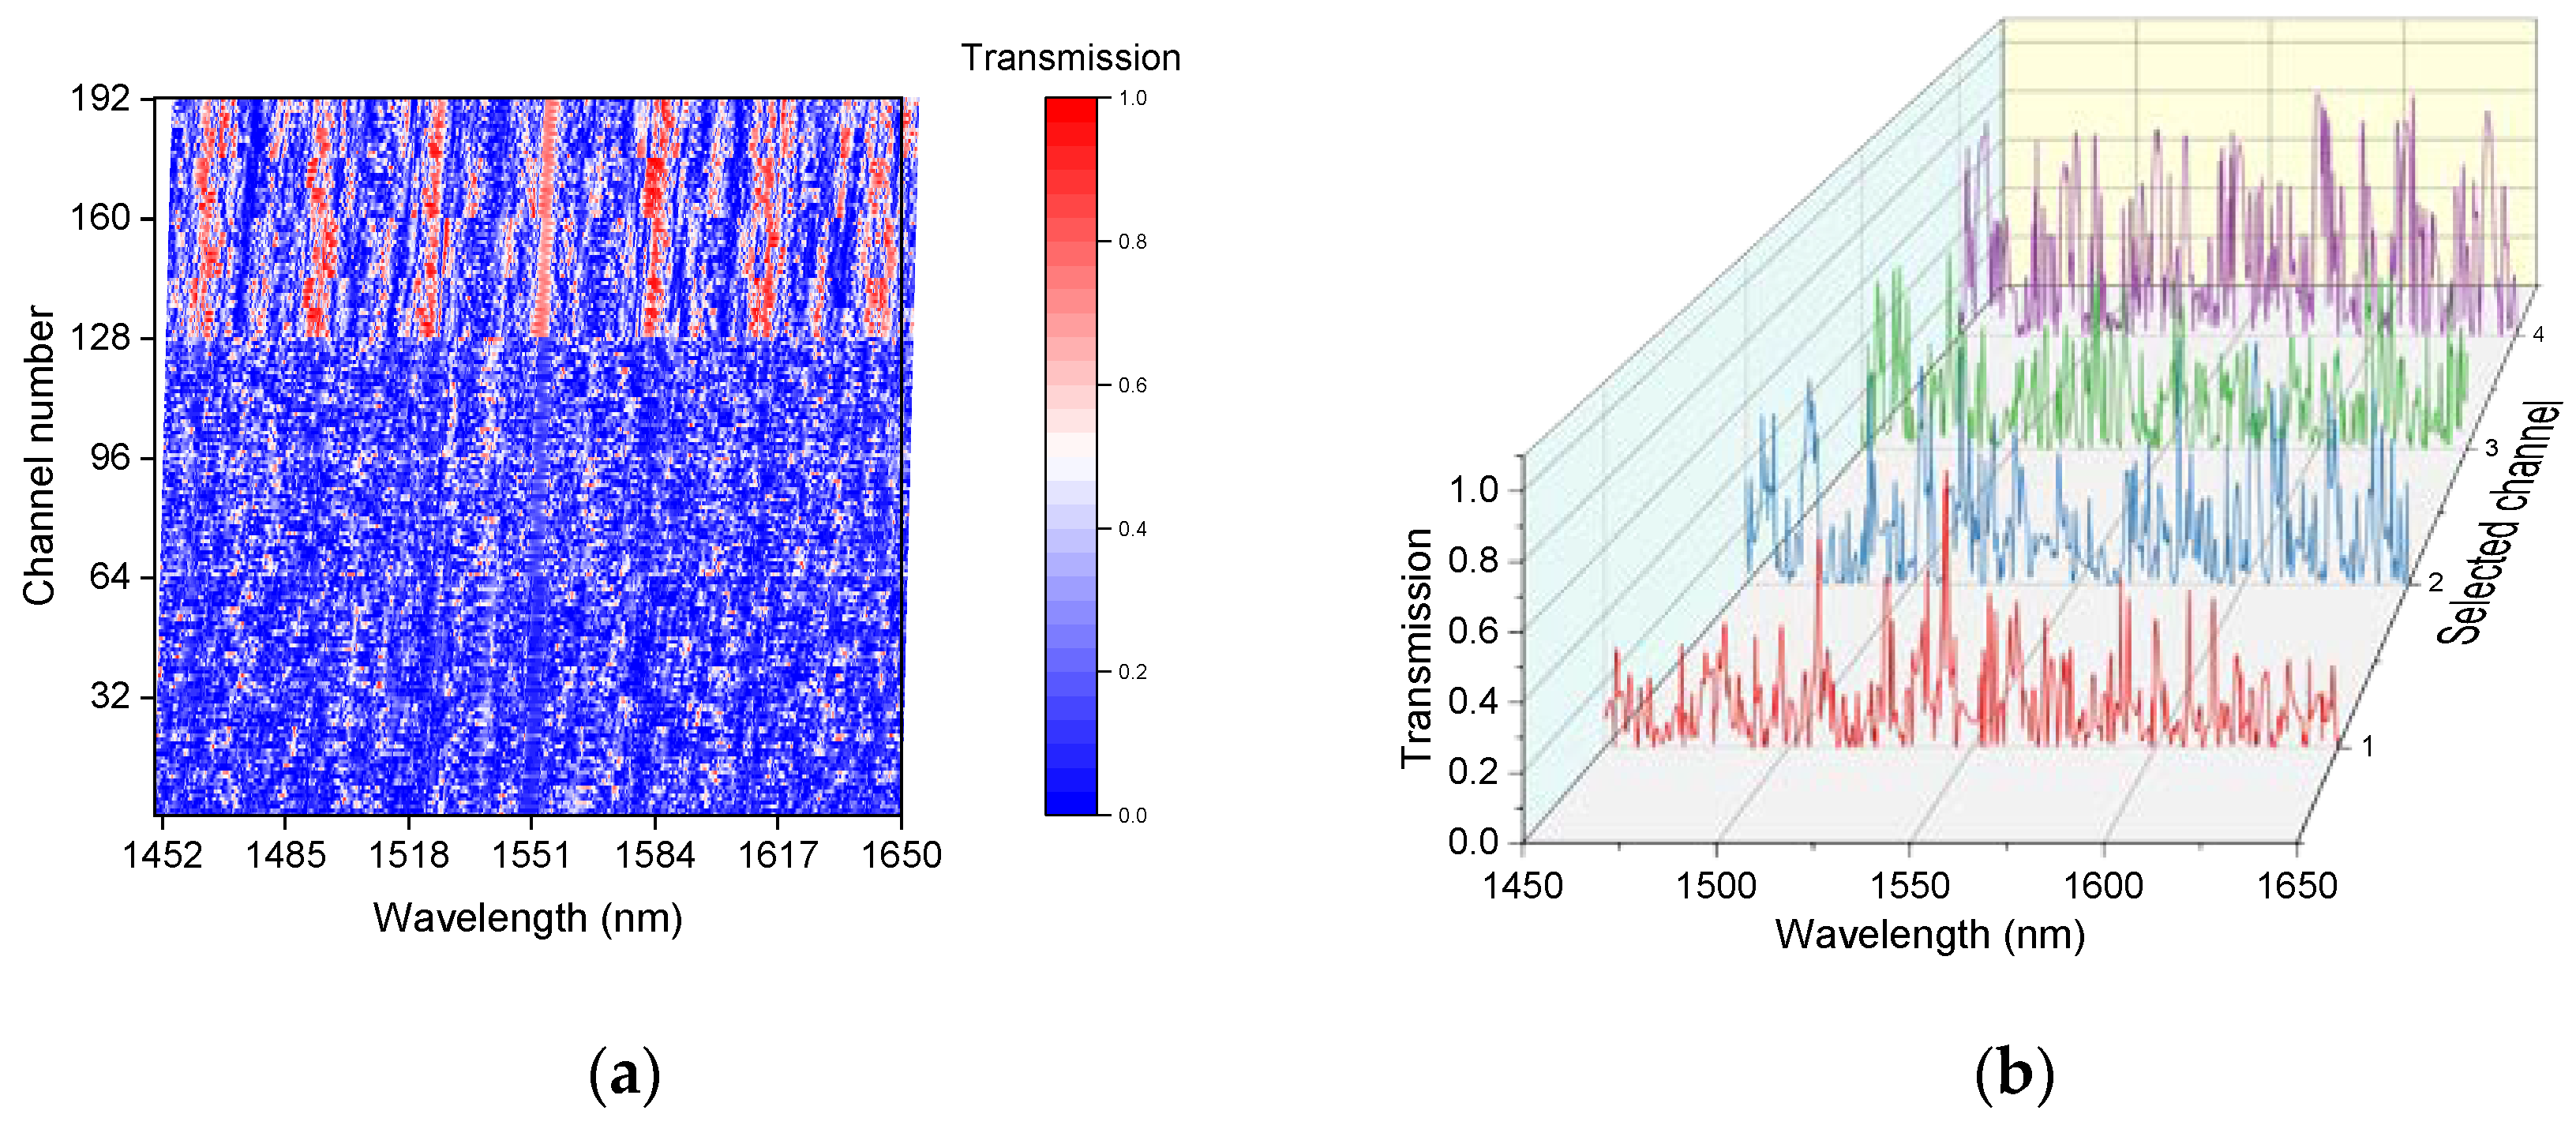
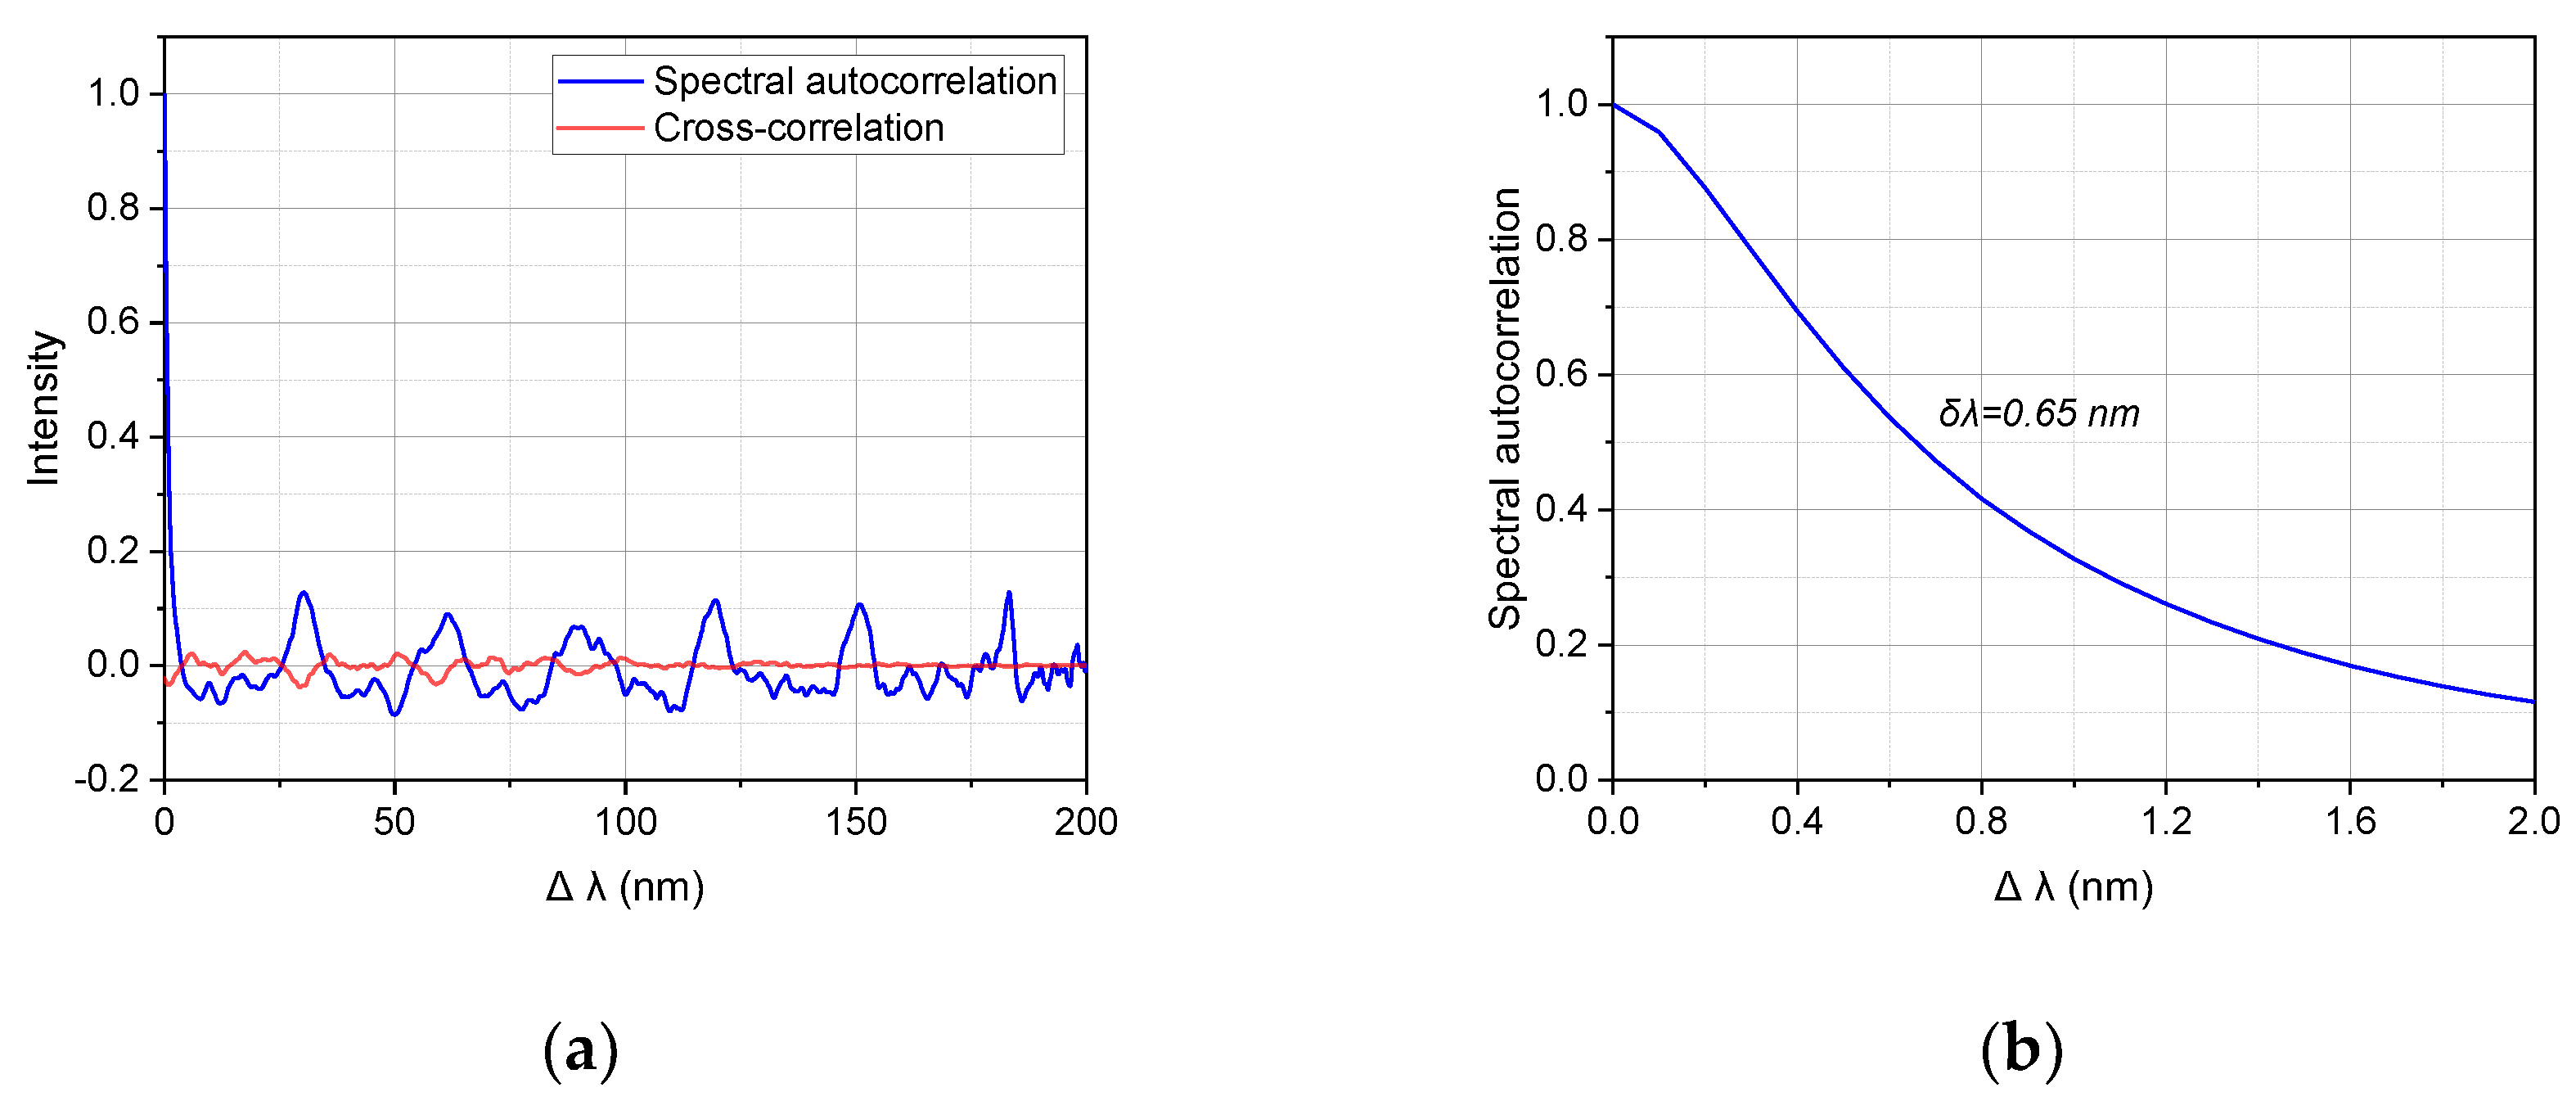
Using the Ansys Lumerical INTERCONNECT simulation platform, we set two operational states for each of the six phase shifters, introducing phase shifts Δφ of 0 and , resulting in a total of 64 sampling states. By considering the 3 output ports of the filters, we ultimately acquire 192 sampling channels from the filters, forming the sampling matrix. Figure 4a shows the heatmap of the sampling matrix of the designed spectrometer based on the programmable filter. Figure 4b displays the transmission spectra of the filter under four different phase-change conditions, which are randomly selected. Each row in the heatmap represents the transmission spectrum of a sampling channel. Autocorrelation and cross-correlation function to characterize the filter’s transmission spectra [21,26]. The half width at half maximum (HWHM) of the auto-correlation function, denoted as δλ, is a crucial parameter that quantifies the spectral resolution of the reconstructive spectrometer. It represents the minimum wavelength shift required to reduce the correlation between individual sampling channels by 50%. In other words, δλ determines the ability of the system to distinguish between neighboring wavelength pixels. The cross-correlation between two distinct sampling channels is a measure of their similarity in the spectral domain. It quantifies the extent to which the spectral responses of the two channels are correlated with each other. In an ideal scenario, the sampling channels should be orthogonal, meaning that they are completely independent. When this condition is satisfied, the cross-correlation between any two distinct sampling channels should be zero at all wavelength points. By assessing the autocorrelation and cross-correlations of the sampling matrix, we can evaluate the effectiveness of our sampling system in providing diverse and complementary spectral information. The calculated autocorrelation and cross-correlation are shown in Figure 5. The narrow autocorrelation with δλ = 0.65 nm and low cross-correlation indicates a well-designed sampling matrix contains diverse features with very little cross-correlation signal. The incident light spectrum can be converted into a unique intensity vector after sampling and detection, allowing the subsequent reconstruction algorithm to work effectively.

Figure 4.
(a) Heat map of simulated sampling matrix of the devices with 192 sampling channels; (b) Transmission spectra of 4 randomly selected sampling channels.
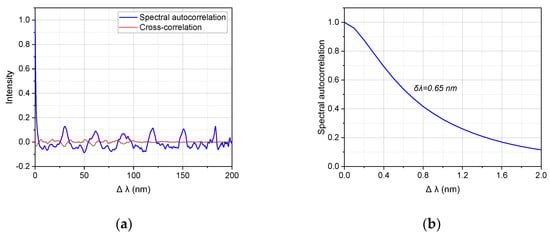
Figure 5.
(a) The calculated spectral auto-correlation function and average cross-correlation of the transmission spectra among the 192 sampling channels (64 sampling states). The cross-correlation curve represents the mean value of all the pairwise cross-correlations between the transmission spectra of the 192 channels. (b) The HWHM of the auto-correlation function is approximately 0.65 nm.
Utilizing the network architecture described in Section 2, we have constructed an ANN-based spectral reconstruction model to achieve the transformation from intensity vectors IM×1 to reconstructed spectra . We synthesized 15,000 simulated spectral datasets based on a combination of Gaussian and Lorentzian functions and used this synthesized spectral dataset to train the model. Each simulated spectrum was composed of multiple function components, with the number of components randomly ranging from 1 to 10. Each function component was randomly set as either a Gaussian or Lorentzian function with a probability of 0.5. We then randomly set the position, height, and full width at half maximum (FWHM) for each peak. The position of each peak was randomly distributed between 1500 and 1600 nm; the heights were determined using uniformly distributed random numbers in the interval (0, 1); the FWHM is set by randomly selecting a value from a specific interval to serve as the FWHM of the current spectral peak. Finally, all function components are summed to generate the synthesized spectrum. We set three different ranges for the FWHM: (2 nm, 100 nm), (2 nm, 10 nm), and (1 nm, 2 nm). The additional generation of these spectra with smaller FWHMs is intended to enhance the model’s ability to reconstruct narrow peaks (sparse spectra) in the spectrum.
Before training the model, we randomly divided the synthesized spectral data into two parts with a ratio of 4:1, where the training set contained 12,000 samples and the validation set contained 3000 samples. Then, following the same method, we generated an additional 150 simulated spectra to serve as an independent test dataset. During model training, we employed the Adam optimizer with a batch size of 256 and trained for 10,000 epochs. The training was conducted on an NVIDIA GeForce RTX 4070 graphics (NVIDIA, Santa Clara, CA, USA) processing unit. After the training was completed, we chose to save the model that exhibited the lowest loss value on the validation set during the training process as the final spectral reconstruction model.
3.2. Spectral Reconstruction Simulation Results
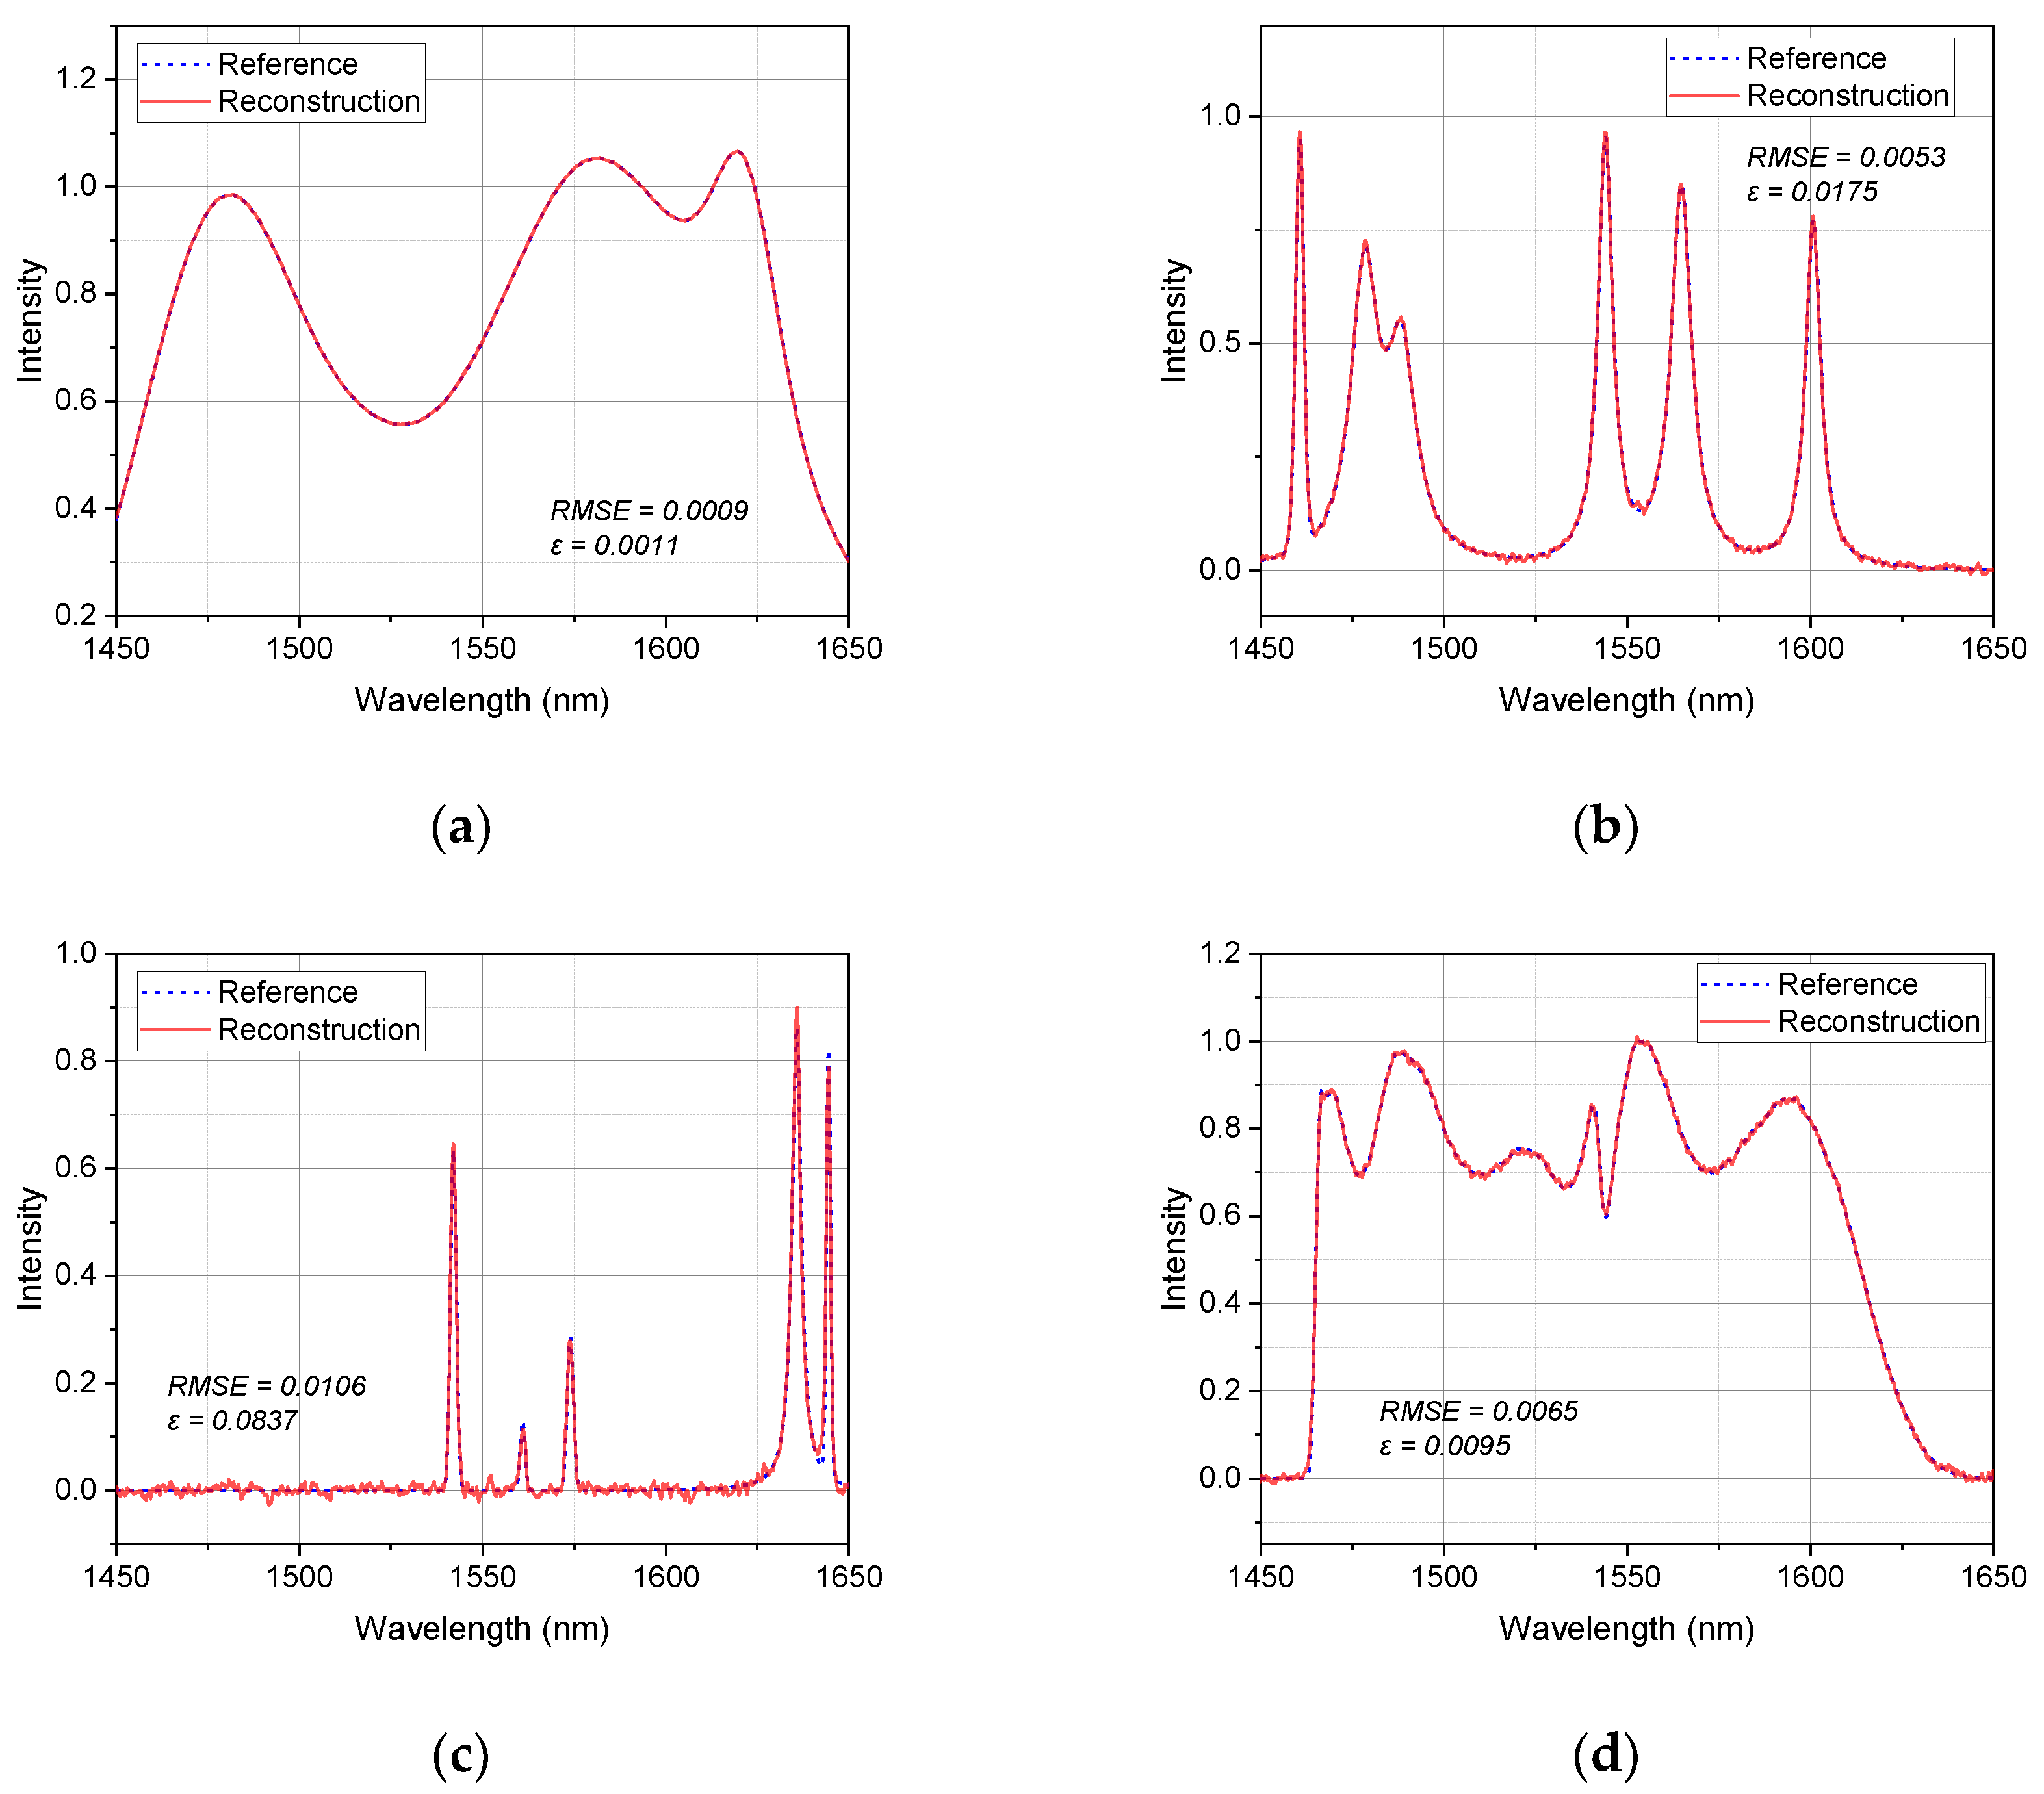
Combining the simulation results of the designed on-chip spectrometer with the trained ANN model, the reconstruction results for different types of synthetic spectra selected from the test set are shown in Figure 6a,b. We employ the root mean squared error (RMSE) and relative error ε to evaluate the spectral reconstruction results:
where m is the total number of wavelength points. Across the entire test set, the average RMSE for spectral reconstruction is 0.0051, and the average relative error ε is 0.0484.
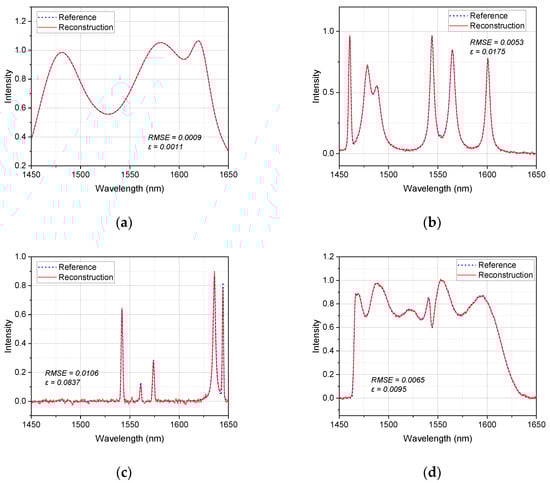
Figure 6.
Simulated reconstruction results of different types of spectra. (a–c) Randomly selected synthetic spectrum with three different FHWM; (d) ASE light source spectra.
Figure 6a,b illustrates the reconstruction of a spectrum with relatively wide peaks, where the FWHM of each peak is randomly selected from the interval (2 nm, 100 nm) and (2 nm, 10 nm). The reconstructed spectrum closely matches the true spectrum, with an RMSE of 0.0009 and 0.0053 and ε of 0.0011 and 0.0175, respectively. In Figure 6c, we demonstrate the reconstruction of a sparse spectrum with several narrow peaks, where the FWHM of each peak is randomly chosen from the interval (1 nm, 2 nm). Despite the presence of sharp and closely spaced peaks, the reconstructed spectrum still accurately captures the key features of the true spectrum, achieving an RMSE of 0.0106 and a relative error ε of 0.0837. From the figures, it is evident that the peaks in the synthesized spectra are precisely reconstructed. We also performed reconstruction on the measured spectra of an amplified spontaneous emission (ASE) light source, with the results shown in Figure 6d. The spectral range of the ASE light source is inherently 1500 nm to 1600 nm, originally containing 1001 data points. To facilitate the verification of our chip’s ability to reconstruct measured spectra, we expanded it to 2001 data points through interpolation, assuming a wavelength range of 1450 nm to 1650 nm. The RMSE and the relative errors ε are 0.0065 and 0.0095, respectively. These results demonstrate that our designed on-chip spectrometer is capable of accurately reconstructing real-world spectra. The low RMSE and relative error values for both the synthesized and measured spectra indicate the robustness and effectiveness of our on-chip spectrometer design and the associated ANN-based reconstruction model. The model’s ability to handle diverse spectral features, including narrow and closely spaced peaks, highlights its potential for practical applications in various fields where accurate spectral reconstruction is crucial.
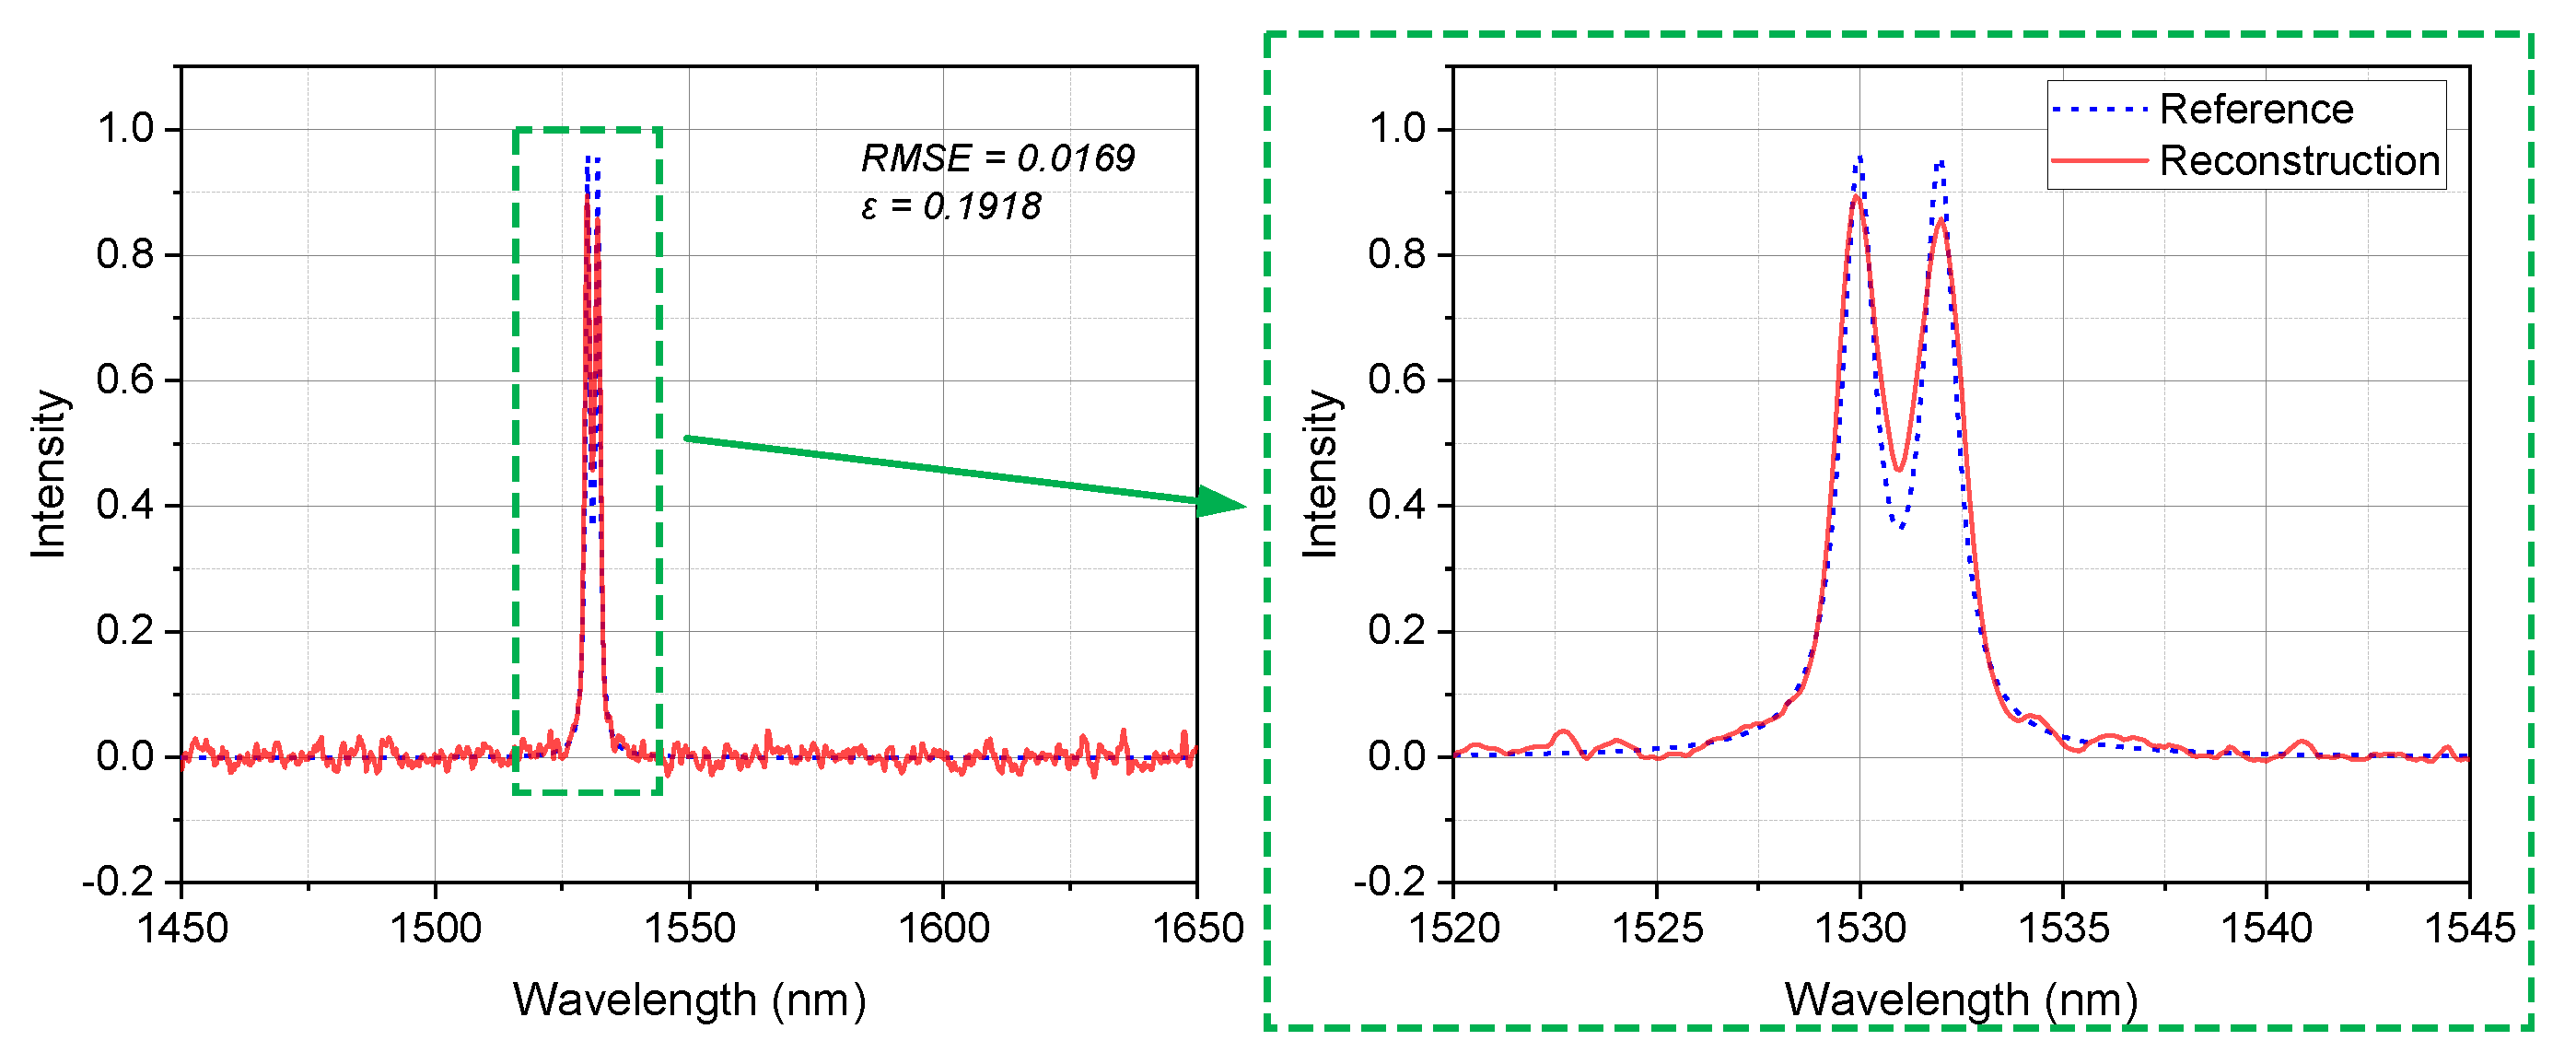
The ability to resolve closely spaced narrow peaks is crucial for many spectroscopic applications, such as gas sensing, environmental monitoring, and chemical analysis. In these fields, the spectral features of interest often lie in a narrow wavelength range, and the ability to distinguish between adjacent peaks is essential for the accurate identification and quantification of the target analytes. To further demonstrate the spectral resolution of the proposed spectral chip, we simulated the reconstruction of a dual-peak spectrum, where the peaks are separated by 2 nm, and each peak has an FWHM of approximately 1 nm. The reconstruction results are shown in Figure 7, with an RMSE of 0.0169 and a relative error ε of 0.1918, providing strong evidence for the high spectral resolution of our proposed on-chip spectrometer. The two narrow peaks spaced at 2 nm are clearly distinguishable in the reconstructed spectrum, indicating that the spectral reconstruction resolution of our designed spectrometer chip can reach 2 nm under a limited number of sampling channels. The clear resolution of the two peaks demonstrates the capability of our design to resolve fine spectral features, which is a key performance metric for advanced spectroscopic devices.
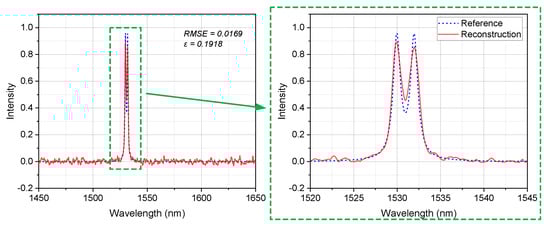
Figure 7.
Simulated reconstruction results of a narrow double-peak spectrum separated by 2 nm.
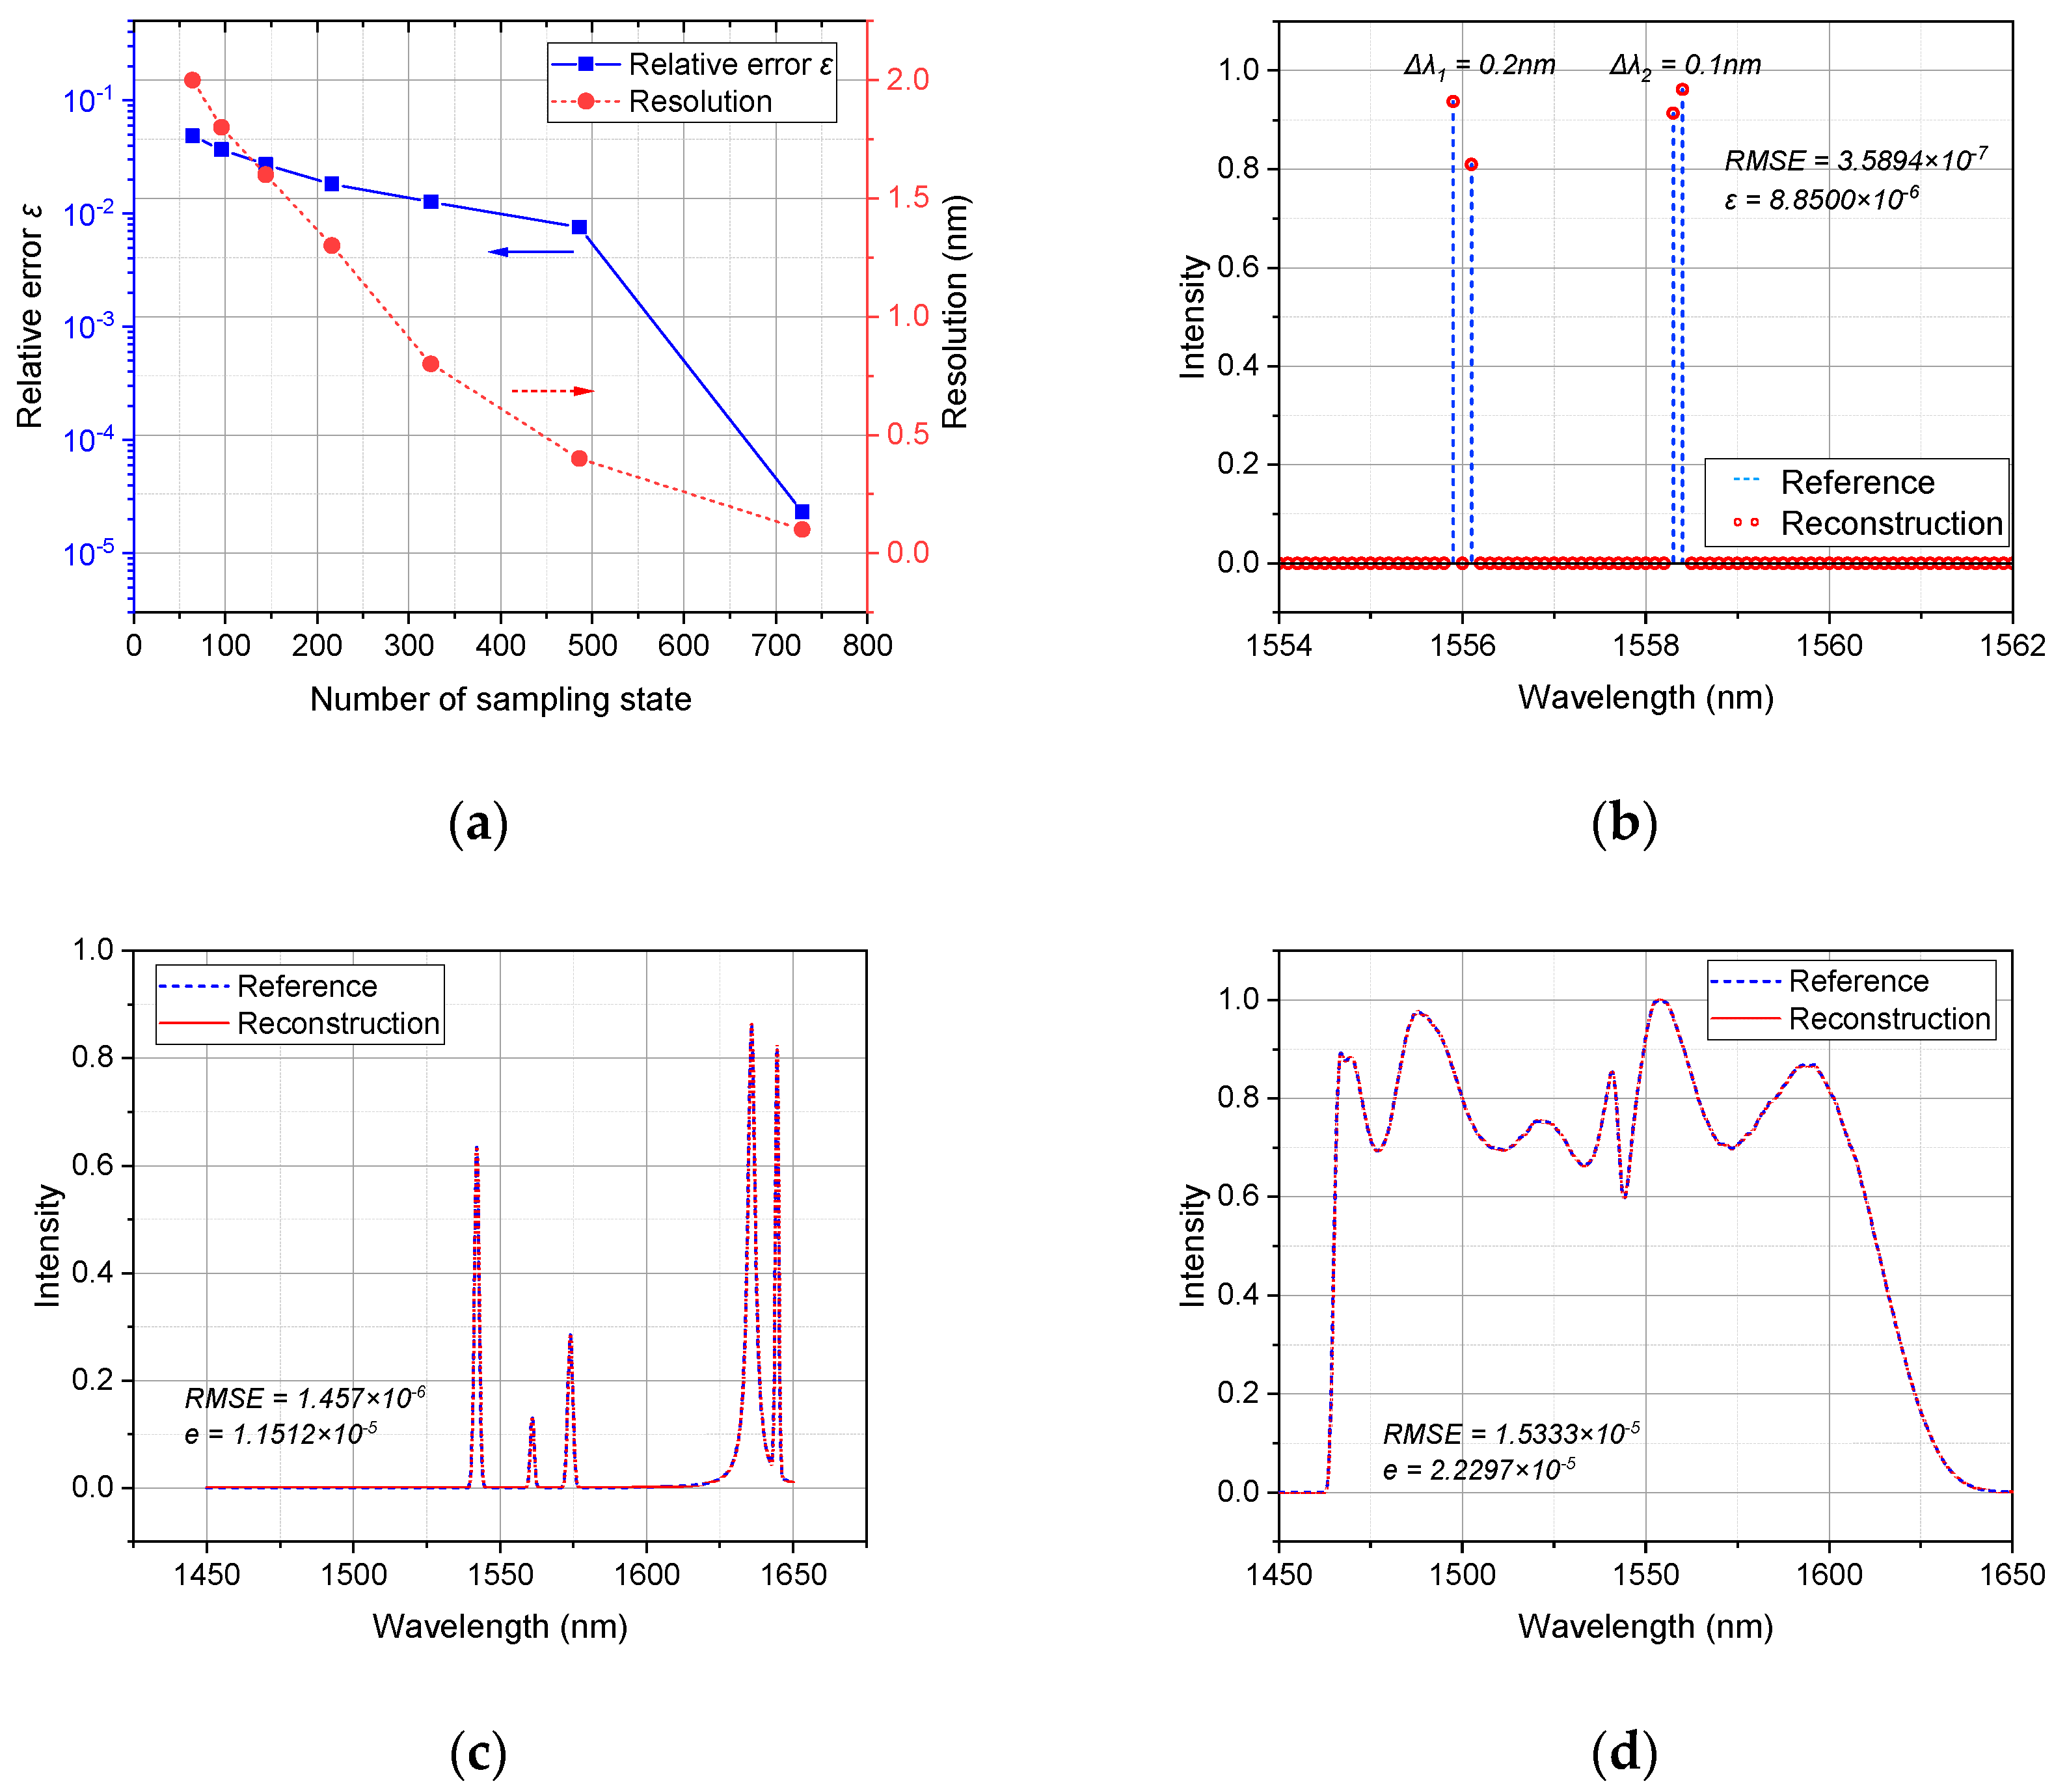
Increasing the number of sampling states of the photonic filter can further reduce the spectral reconstruction error and increase the resolution. We investigate the impact of the filter sampling states on the spectral reconstruction performance by increasing the number of phase shift states of the phase shifters in the programmable silicon photonic filter. We sequentially increase the number of phase shift states of the phase shifters from 2 (0 and π) to 3 (0, π/3, and 2π/3), obtaining sampling matrices with M = 3 × 96, 3 × 144, 3 × 216, 3 × 324, 3 × 486, and 3 × 729 sampling channels, respectively. Increasing the number of phase shift states of the phase shifters essentially increases the programmable degrees of freedom of the filter, resulting in more diverse sampling channels. When the number of states of the phase shifters increases from 2 to 3, each phase shifter can provide 3 different phase shifts, allowing the transmission spectrum of the filter to exhibit more variations. These variations enable the filter to perform richer and more diverse sampling of the incident spectrum, obtaining more spectral information. This helps to improve the accuracy and resolution of the spectral reconstruction.
As shown in Figure 8a, the average relative error ε of the reconstructed spectra in the test set steadily decreases as the number of sampling states increases from 64 to 729. Across the entire test set, with 729 sampling states, the average RMSE for spectral reconstruction is 8.912 × 10⁻⁶, and the average relative error ε is 2.2991 × 10⁻⁵. The significant reduction in RMSE and ε can be attributed to the fact that when the number of sampling states is 729, the number of sampling channels reaches 3 × 729, which exceeds the number of spectral pixels N = 2001. Consequently, the redundant information captured by the sampling channels helps to reduce the difficulty of spectral reconstruction significantly. Simultaneously, as the number of sampling states increases to 729, the resolution of the on-chip spectrometer for dual-peak spectra improves to 0.1 nm, limited by the resolution of the spectral pixels set in the simulation. This improvement is demonstrated by the dual-peak spectrum reconstruction results in Figure 8b. Figure 8c,d shows the reconstruction results of the proposed on-chip spectrometer for the previously selected narrow spectrum and the measured ASE spectrum, respectively, when the number of sampling states is set to 729. The reconstruction errors (RMSE) are 1.457 × 10⁻⁶ and 1.5333 × 10⁻⁵, and the relative errors ε are 1.1512 × 10⁻⁵ and 2.2297 × 10⁻⁵, respectively. The steady decrease in the relative error ε as the number of sampling states increases highlights the direct relationship between sampling diversity and reconstruction performance. With more distinct sampling channels, the filter captures more features in the spectrum, enabling the reconstruction algorithm to better approximate the original spectrum. Furthermore, the increase in sampling states also positively impacts the resolution of the on-chip spectrometer. As the number of sampling states increases, the spectrometer can better capture the subtle differences between the peaks, allowing for clearer separation and resolution of the individual spectral features. The programmable nature of the silicon photonic filter is a key strength of our design, providing users with the flexibility to optimize the performance of the spectral chip based on their specific needs. By adjusting the number of sampling states, users can prioritize either detection speed or reconstruction accuracy, depending on the requirements of their application. This adaptability makes our on-chip spectrometer design adaptable to a wide range of spectroscopic applications, from rapid screening to high-precision measurements.
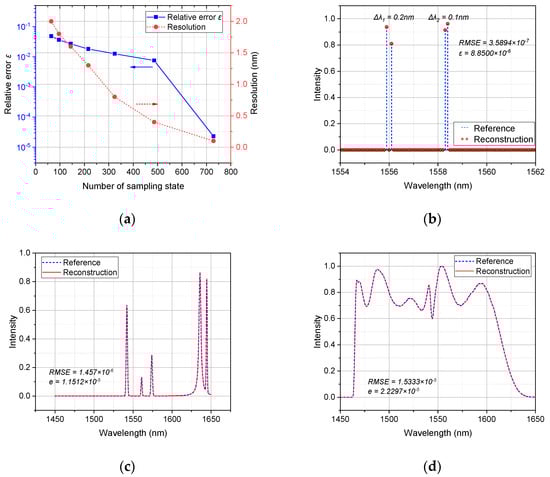
Figure 8.
(a) The calculated average relative error ε on test set and the resolution of reconstructed spectrum using the spectrometer designs with different sampling state numbers. Simulated reconstruction results with 729 sampling states for (b) narrow double-peak spectra separated by 0.1 nm and 0.2 nm, (c) previously selected narrow spectrum, and (d) the measured ASE spectrum.
3.3. Discussion
The performance of the proposed computational reconstruction spectrometers was compared with other filter-based integrated computational reconstruction spectrometers as shown in Table 1. The proposed on-chip spectrometer has a more compact footprint and faster computing time compared with the others with similar bandwidth.

Table 1.
Performance comparison of reported filter-based computational spectrometers.
As shown in Table 1, the resolution of our on-chip spectrometer is indeed lower compared to some previous works, which is primarily determined by the spectral reconstruction algorithm we employed. The choice of different types of spectral reconstruction algorithms can affect the reconstruction error, resolution, reconstruction time, and noise tolerance. In our work, we adopted the ANN algorithm to perform computational spectral reconstruction. ANN models are capable of effectively fitting nonlinear relationships, and the output nodes of the model correspond to the wavelength points of the reconstructed spectrum. Theoretically, a higher number of output nodes could lead to a higher spectral resolution achievable by the reconstruction algorithm. However, it is important to note that the number of parameters in the ANN model grows approximately quadratically with the increase in the number of wavelength points. When the number of wavelength points reaches 20,001 (corresponding to a resolution of 0.01 nm in the 1450–1650 nm range), the model would contain 800 million parameters, posing significant computational challenges. Due to hardware limitations (NVIDIA GeForce RTX 4070), we were unable to train a model with such a vast number of parameters.
Although the resolution of our on-chip spectrometer is limited by the employed spectral reconstruction algorithm, our design still possesses unique advantages. Firstly, using an ANN model as the spectral reconstruction algorithm enables faster computation of the incident spectrum from the obtained intensity vector. The CVX algorithm used in Refs. [25,26] to solve the regularized regression model achieves a resolution in the order of 10 pm, but it requires a relatively longer computational reconstruction time. In contrast, using an ANN model to perform spectral reconstruction with 2187 sampling channels (729 sampling states) takes approximately 1.93 s (including the time for computing the pseudo-inverse of the sampling matrix, based on i5-1135G7 CPU, Intel, Santa Clara, CA, USA). It is evident that the proposed ANN-based on-chip spectrometer can reconstruct the spectrum more rapidly, demonstrating a clear advantage in real-time performance compared to the CVX algorithm. Moreover, based on the discussion in Ref. [29], ANN-based spectral reconstruction algorithms exhibit stronger noise tolerance, which is another important factor to consider in spectral computational reconstruction.
4. Conclusions
In this paper, we propose an on-chip spectrometer based on a programmable silicon photonic filter. By changing the transmission spectrum of the filter through control signals, multiple and different samplings of the input spectrum can be achieved. Combined with the ANN algorithm, the incident spectrum can be reconstructed from the sampled signals. This design realizes diverse sampling of the incident spectrum based on a single programmable filter with an adjustable number of sampling channels. This approach can significantly reduce the footprint of the device and offer clear advantages in terms of integration and hardware costs. The simulation results show that the proposed device can accurately reconstruct spectra with different characteristics in the wavelength range of 1450 nm to 1650 nm. Regarding the test set consisting of synthesized spectra, the proposed on-chip spectrometer achieves an average reconstruction error RMSE of 0.0051 and an average relative error ε of 0.0484 using only a limited number of sampling states (64). When the number of sampling states is increased to 729, the RMSE and relative errors ε are reduced to 8.912 × 10⁻⁶ and 2.2991 × 10⁻⁵, respectively. The resolution for dual narrow-peak spectra can reach 0.2 nm, which is limited by the resolution of the spectral pixels we set. Benefiting from the programmable nature of the silicon photonic filter, the chip can flexibly change the number of sampling channels, allowing users to configure the chip according to the application scenario. Our proposed integrated reconstructive spectrometer based on the programmable silicon photonic filter provides a new solution for chip-level spectrometers and has broad application prospects in fields such as miniature spectrometers and Lab-on-Chip.
Author Contributions
Conceptualization, Z.Z. (Zan Zhang); simulation, Z.Z. (Zan Zhang); results analysis and discussion, Z.Z. (Zan Zhang) and Z.Z. (Zanyun Zhang); writing, Z.Z. (Zan Zhang); supervision, B.H.; funding acquisition, B.H. and H.C. All authors have read and agreed to the published version of the manuscript.
Funding
This work was supported by the Natural Science Foundation of China (Grant No. 62341508), the Youth Innovation Promotion Association of Chinese Academy of Sciences under Grant No.Y2022045, Shaanxi Qin Chuangyuan “Scientist + Engineer” Team Construction (Grant No.2024QCY-KXJ-161).
Data Availability Statement
Data underlying the results presented in this paper are available from the authors upon reasonable request.
Acknowledgments
I (Z.Z.) want to thank my wife and daughter for their great support.
Conflicts of Interest
The authors declare no conflicts of interest.
References
- Bacon, C.P.; Mattley, Y.; DeFrece, R. Miniature Spectroscopic Instrumentation: Applications to Biology and Chemistry. Rev. Sci. Instrum. 2003, 75, 1–16. [Google Scholar] [CrossRef]
- Clark, R.N.; Roush, T.L. Reflectance Spectroscopy: Quantitative Analysis Techniques for Remote Sensing Applications. J. Geophys. Res. Solid Earth 1984, 89, 6329–6340. [Google Scholar] [CrossRef]
- Manley, M. Near-Infrared Spectroscopy and Hyperspectral Imaging: Non-Destructive Analysis of Biological Materials. Chem. Soc. Rev. 2014, 43, 8200–8214. [Google Scholar] [CrossRef]
- Gao, L.; Qu, Y.; Wang, L.; Yu, Z. Computational Spectrometers Enabled by Nanophotonics and Deep Learning. Nanophotonics 2022, 11, 2507–2529. [Google Scholar] [CrossRef]
- Wang, J.; Zheng, B.; Wang, X. Strategies for High Performance and Scalable On-Chip Spectrometers. J. Phys. Photonics 2020, 3, 012006. [Google Scholar] [CrossRef]
- Redding, B.; Liew, S.F.; Sarma, R.; Cao, H. Compact Spectrometer Based on a Disordered Photonic Chip. Nat. Photonics 2013, 7, 746–751. [Google Scholar] [CrossRef]
- Hartmann, W.; Varytis, P.; Gehring, H.; Walter, N.; Beutel, F.; Busch, K.; Pernice, W. Waveguide-Integrated Broadband Spectrometer Based on Tailored Disorder. Adv. Opt. Mater. 2020, 8, 1901602. [Google Scholar] [CrossRef]
- Kwak, Y.; Park, S.M.; Ku, Z.; Urbas, A.; Kim, Y.L. A Pearl Spectrometer. Nano Lett. 2021, 21, 921–930. [Google Scholar] [CrossRef]
- Hadibrata, W.; Noh, H.; Wei, H.; Krishnaswamy, S.; Aydin, K. Compact, High-Resolution Inverse-Designed On-Chip Spectrometer Based on Tailored Disorder Modes. Laser Photonics Rev. 2021, 15, 2000556. [Google Scholar] [CrossRef]
- Xiong, J.; Cai, X.; Cui, K.; Huang, Y.; Yang, J.; Zhu, H.; Li, W.; Hong, B.; Rao, S.; Zheng, Z.; et al. Dynamic Brain Spectrum Acquired by a Real-Time Ultraspectral Imaging Chip with Reconfigurable Metasurfaces. Optica 2022, 9, 461–468. [Google Scholar] [CrossRef]
- Craig, B.; Shrestha, V.R.; Meng, J.; Cadusch, J.J.; Crozier, K.B. Experimental Demonstration of Infrared Spectral Reconstruction Using Plasmonic Metasurfaces. Opt. Lett. 2018, 43, 4481–4484. [Google Scholar] [CrossRef] [PubMed]
- Wang, Z.; Yi, S.; Chen, A.; Zhou, M.; Luk, T.S.; James, A.; Nogan, J.; Ross, W.; Joe, G.; Shahsafi, A.; et al. Single-Shot on-Chip Spectral Sensors Based on Photonic Crystal Slabs. Nat. Commun. 2019, 10, 1020. [Google Scholar] [CrossRef] [PubMed]
- Zhu, Y.; Lei, X.; Wang, K.X.; Yu, Z. Compact CMOS Spectral Sensor for the Visible Spectrum. Photonics Res. 2019, 7, 961–966. [Google Scholar] [CrossRef]
- Bao, J.; Bawendi, M.G. A Colloidal Quantum Dot Spectrometer. Nature 2015, 523, 67–70. [Google Scholar] [CrossRef]
- Zhu, X.; Bian, L.; Fu, H.; Wang, L.; Zou, B.; Dai, Q.; Zhang, J.; Zhong, H. Broadband Perovskite Quantum Dot Spectrometer beyond Human Visual Resolution. Light Sci. Appl. 2020, 9, 73. [Google Scholar] [CrossRef] [PubMed]
- Piels, M.; Zibar, D. Compact Silicon Multimode Waveguide Spectrometer with Enhanced Bandwidth. Sci. Rep. 2017, 7, 43454. [Google Scholar] [CrossRef]
- Redding, B.; Liew, S.F.; Bromberg, Y.; Sarma, R.; Cao, H. Evanescently Coupled Multimode Spiral Spectrometer. Optica 2016, 3, 956–962. [Google Scholar] [CrossRef]
- Kim, C.; Ni, P.; Lee, K.R.; Lee, H.-N. Mass Production-Enabled Computational Spectrometers Based on Multilayer Thin Films. Sci. Rep. 2022, 12, 4053. [Google Scholar] [CrossRef]
- Zhang, Z.; Li, Y.; Wang, Y.; Yu, Z.; Sun, X.; Tsang, H.K. Compact High Resolution Speckle Spectrometer by Using Linear Coherent Integrated Network on Silicon Nitride Platform at 776 Nm. Laser Photonics Rev. 2021, 15, 2100039. [Google Scholar] [CrossRef]
- Wen, J.; Hao, L.; Gao, C.; Wang, H.; Mo, K.; Yuan, W.; Chen, X.; Wang, Y.; Zhang, Y.; Shao, Y.; et al. Deep Learning-Based Miniaturized All-Dielectric Ultracompact Film Spectrometer. ACS Photonics 2023, 10, 225–233. [Google Scholar] [CrossRef]
- Li, A.; Fainman, Y. On-Chip Spectrometers Using Stratified Waveguide Filters. Nat. Commun. 2021, 12, 2704. [Google Scholar] [CrossRef]
- Xu, H.; Qin, Y.; Hu, G.; Tsang, H.K. Breaking the Resolution-Bandwidth Limit of Chip-Scale Spectrometry by Harnessing a Dispersion-Engineered Photonic Molecule. Light Sci. Appl. 2023, 12, 64. [Google Scholar] [CrossRef]
- Yuan, S.; Naveh, D.; Watanabe, K.; Taniguchi, T.; Xia, F. A Wavelength-Scale Black Phosphorus Spectrometer. Nat. Photonics 2021, 15, 601–607. [Google Scholar] [CrossRef]
- Guo, L.; Sun, H.; Wang, M.; Wang, M.; Min, L.; Cao, F.; Tian, W.; Li, L. A Single-Dot Perovskite Spectrometer. Adv. Mater. 2022, 34, 2200221. [Google Scholar] [CrossRef] [PubMed]
- Yao, C.; Chen, M.; Yan, T.; Ming, L.; Cheng, Q.; Penty, R. Broadband Picometer-Scale Resolution on-Chip Spectrometer with Reconfigurable Photonics. Light Sci. Appl. 2023, 12, 156. [Google Scholar] [CrossRef]
- Yao, C.; Xu, K.; Zhang, W.; Chen, M.; Cheng, Q.; Penty, R. Integrated Reconstructive Spectrometer with Programmable Photonic Circuits. Nat. Commun. 2023, 14, 6376. [Google Scholar] [CrossRef]
- Zhang, S.; Dong, Y.; Fu, H.; Huang, S.-L.; Zhang, L. A Spectral Reconstruction Algorithm of Miniature Spectrometer Based on Sparse Optimization and Dictionary Learning. Sensors 2018, 18, 644. [Google Scholar] [CrossRef] [PubMed]
- Kim, C.; Park, D.; Lee, H.-N. Compressive Sensing Spectroscopy Using a Residual Convolutional Neural Network. Sensors 2020, 20, 594. [Google Scholar] [CrossRef] [PubMed]
- Zhang, W.; Song, H.; He, X.; Huang, L.; Zhang, X.; Zheng, J.; Shen, W.; Hao, X.; Liu, X. Deeply Learned Broadband Encoding Stochastic Hyperspectral Imaging. Light Sci. Appl. 2021, 10, 108. [Google Scholar] [CrossRef]
Disclaimer/Publisher’s Note: The statements, opinions and data contained in all publications are solely those of the individual author(s) and contributor(s) and not of MDPI and/or the editor(s). MDPI and/or the editor(s) disclaim responsibility for any injury to people or property resulting from any ideas, methods, instructions or products referred to in the content. |
© 2024 by the authors. Licensee MDPI, Basel, Switzerland. This article is an open access article distributed under the terms and conditions of the Creative Commons Attribution (CC BY) license (https://creativecommons.org/licenses/by/4.0/).