
Seismic Response and Damage Analysis of Large Underground Frame Structures without Overburden

Abstract
1. Introduction
2. Methodology for Seismic SSI Analysis
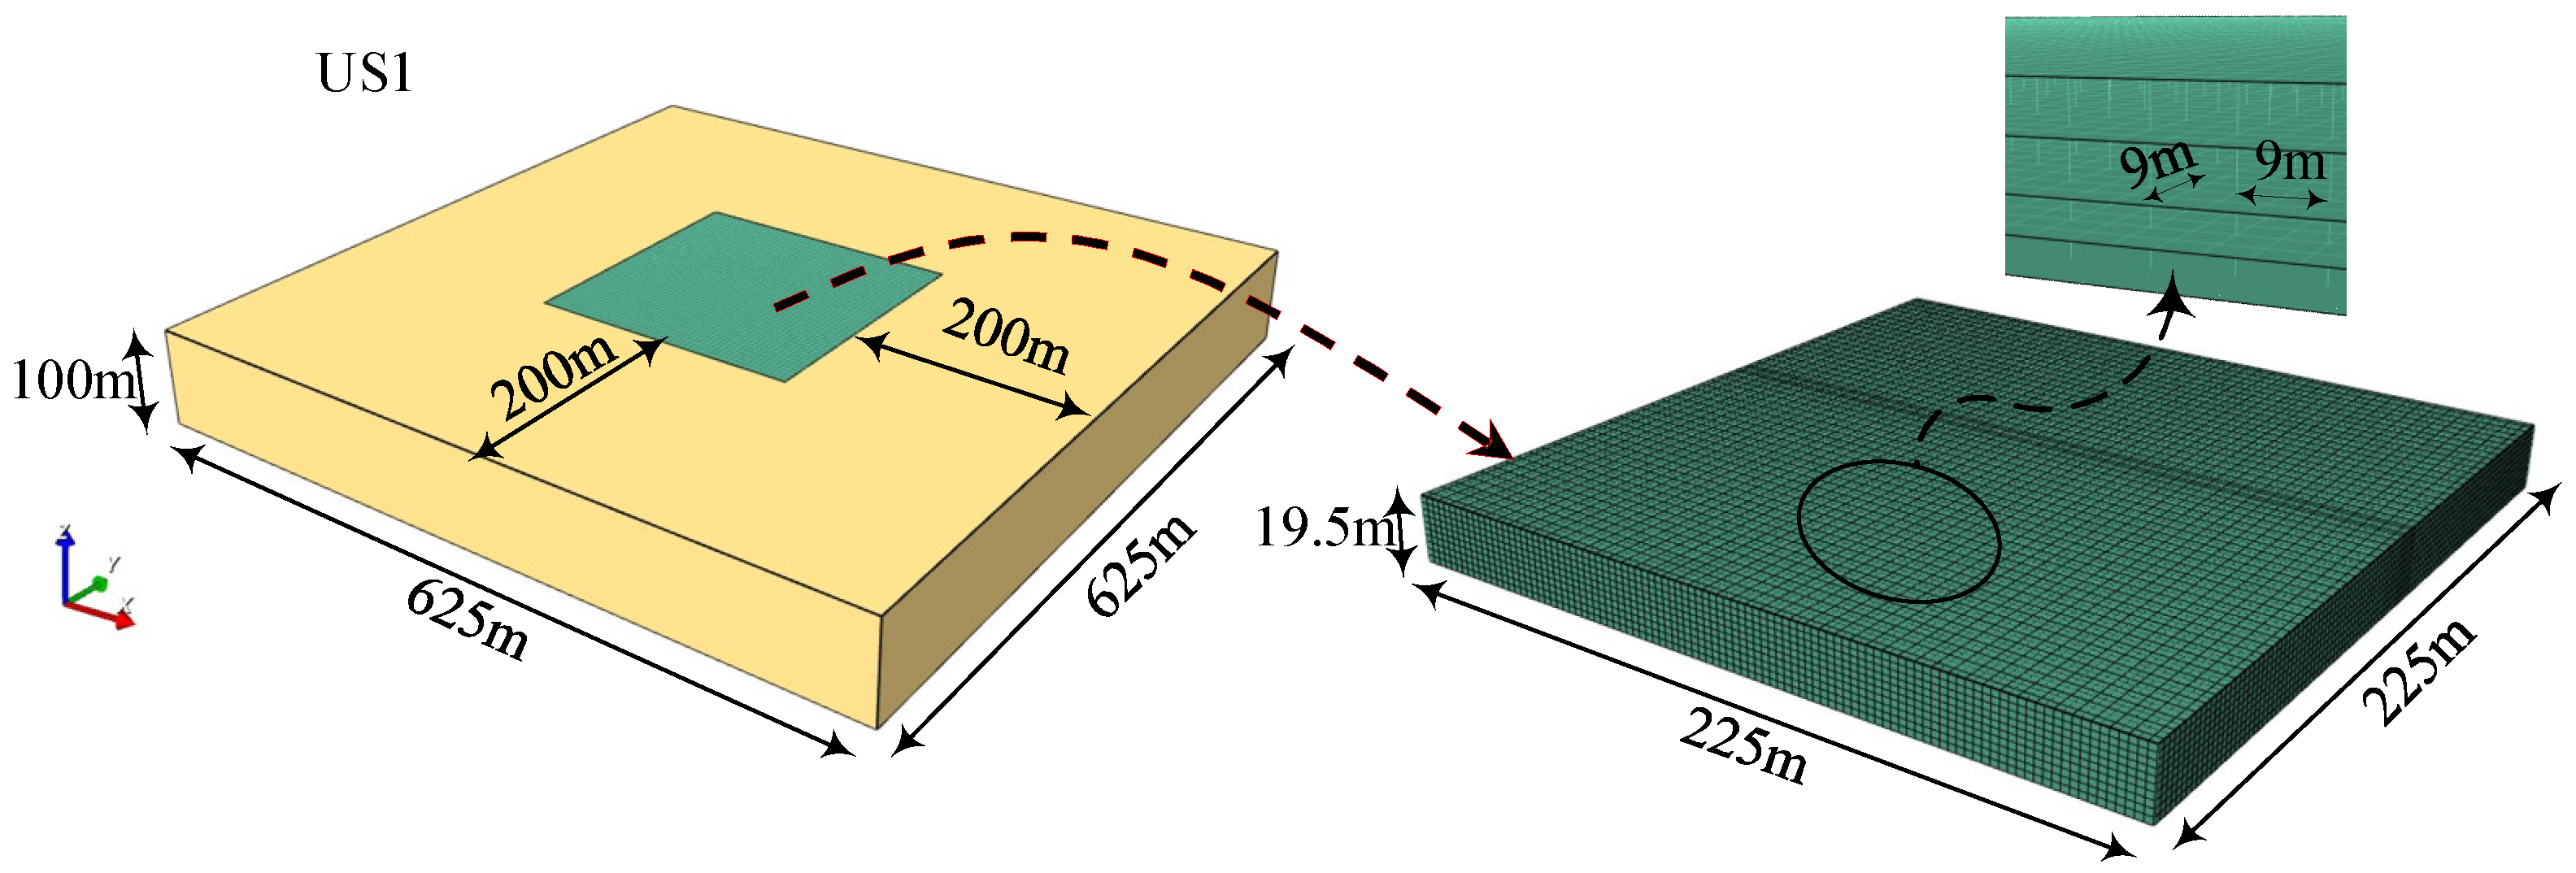
3. Finite Element Model
4. Seismic Response Laws of Large Underground Structures
5. Damage Mechanisms of Large Underground Structures
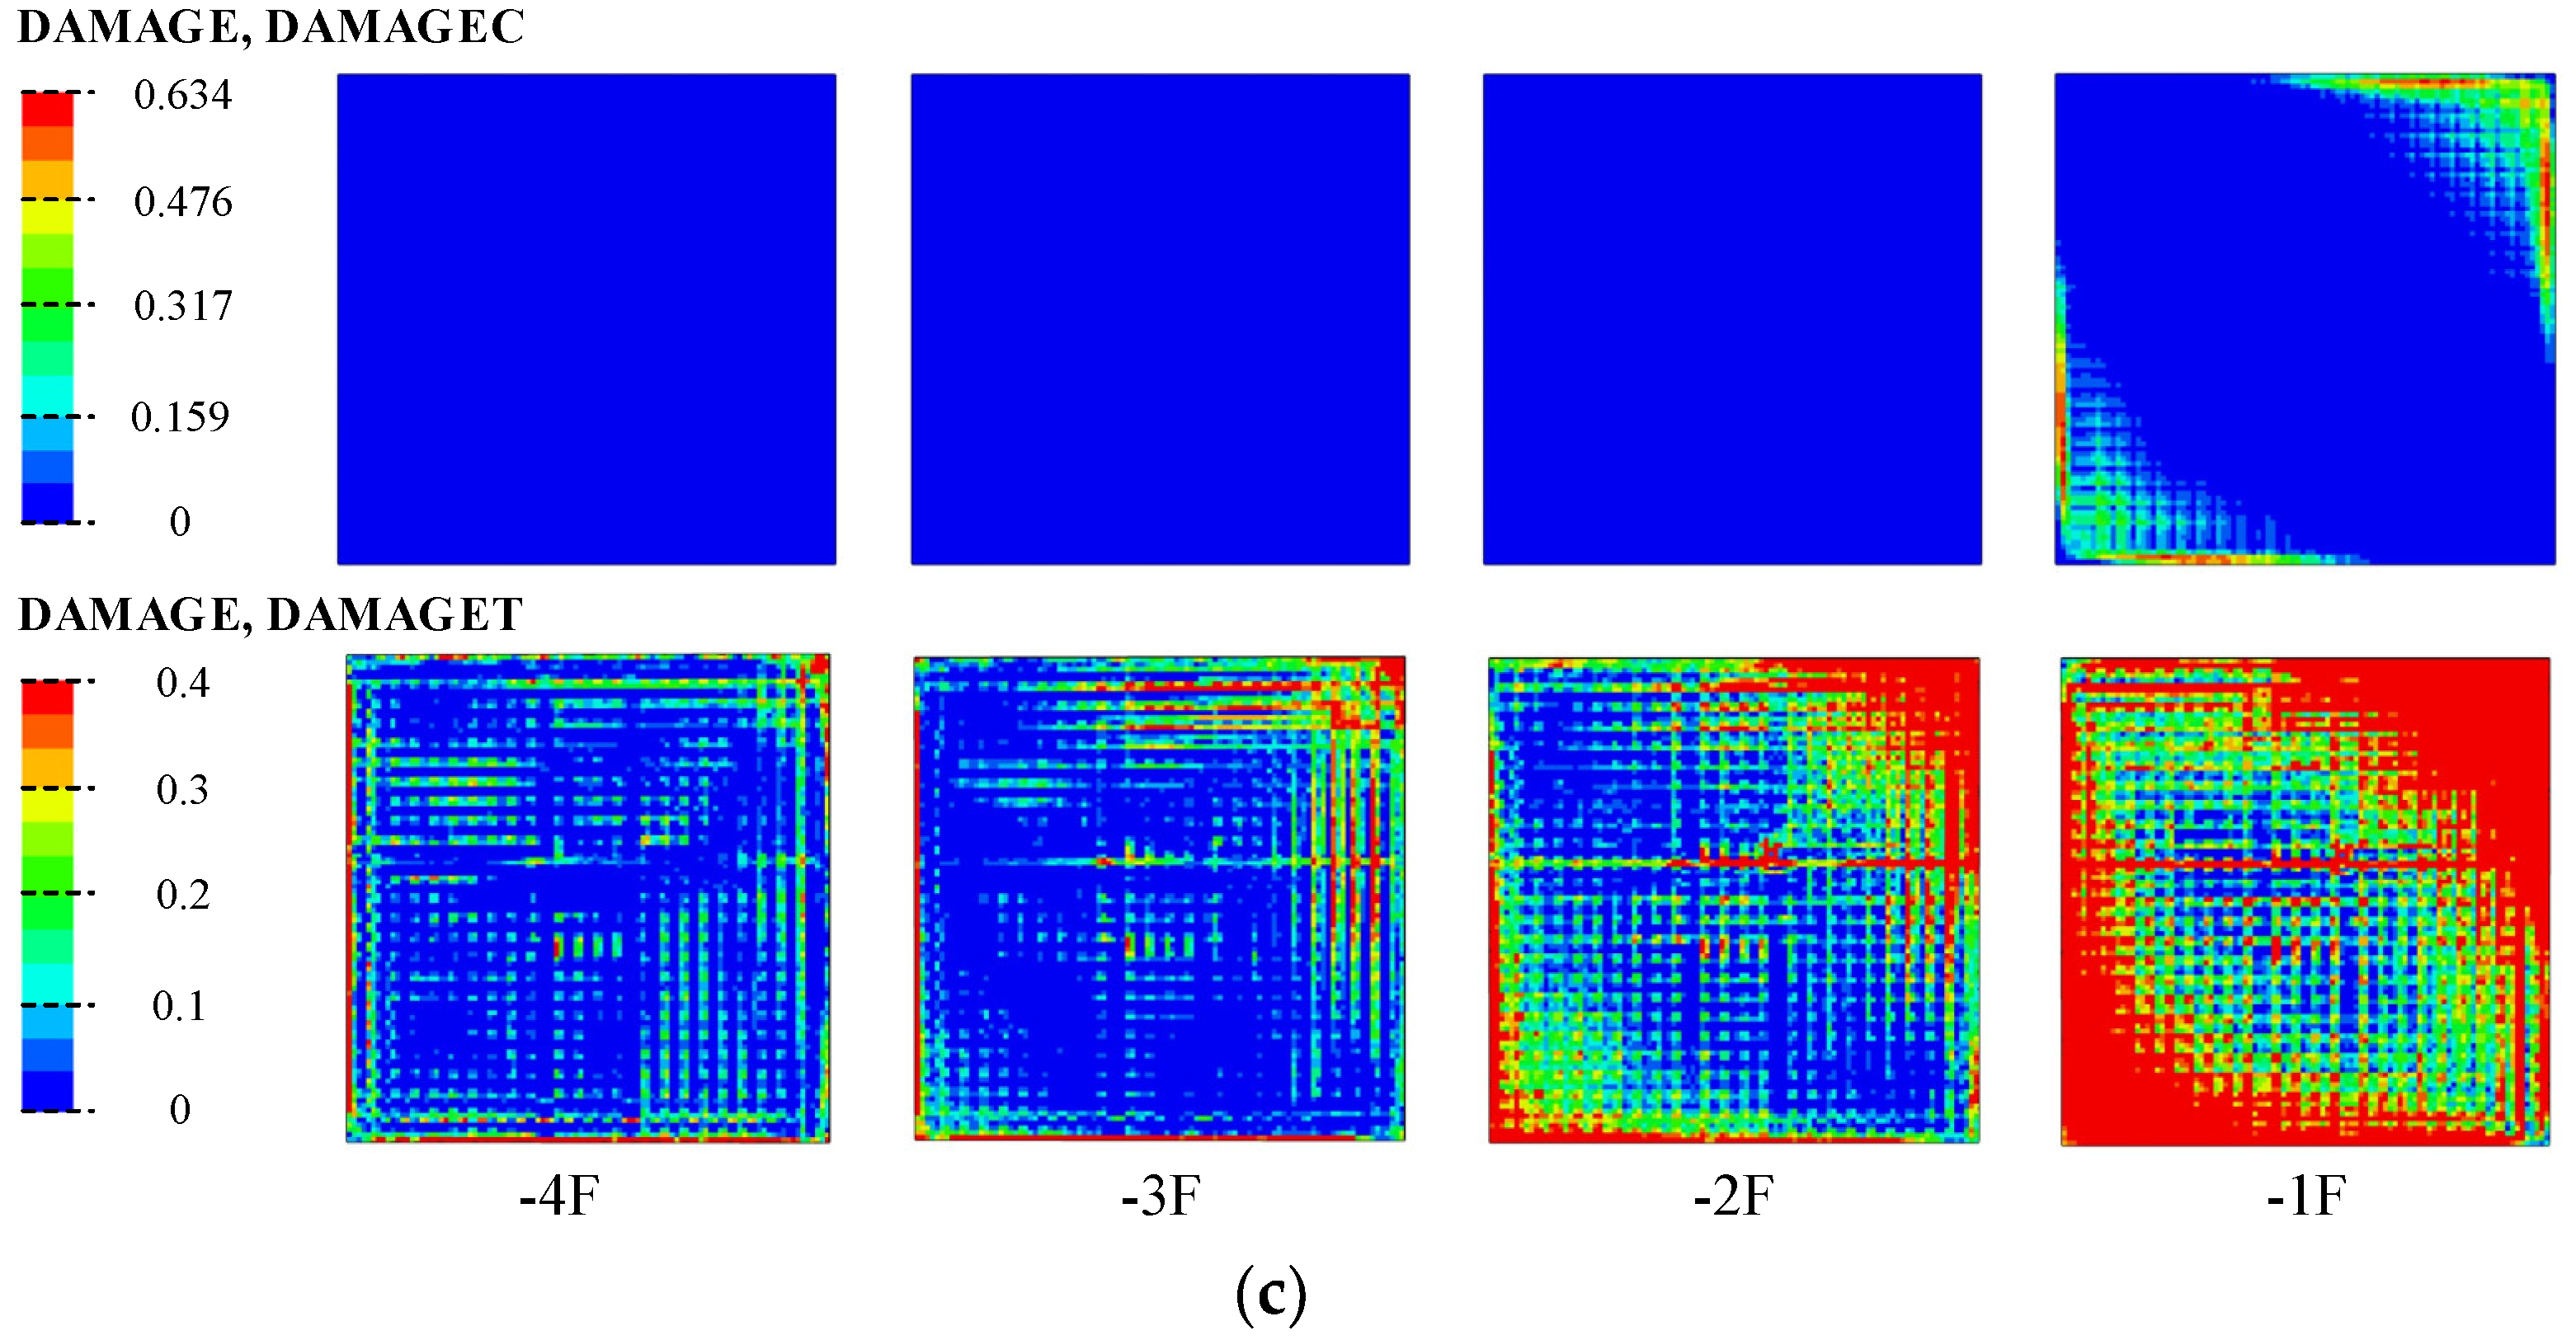
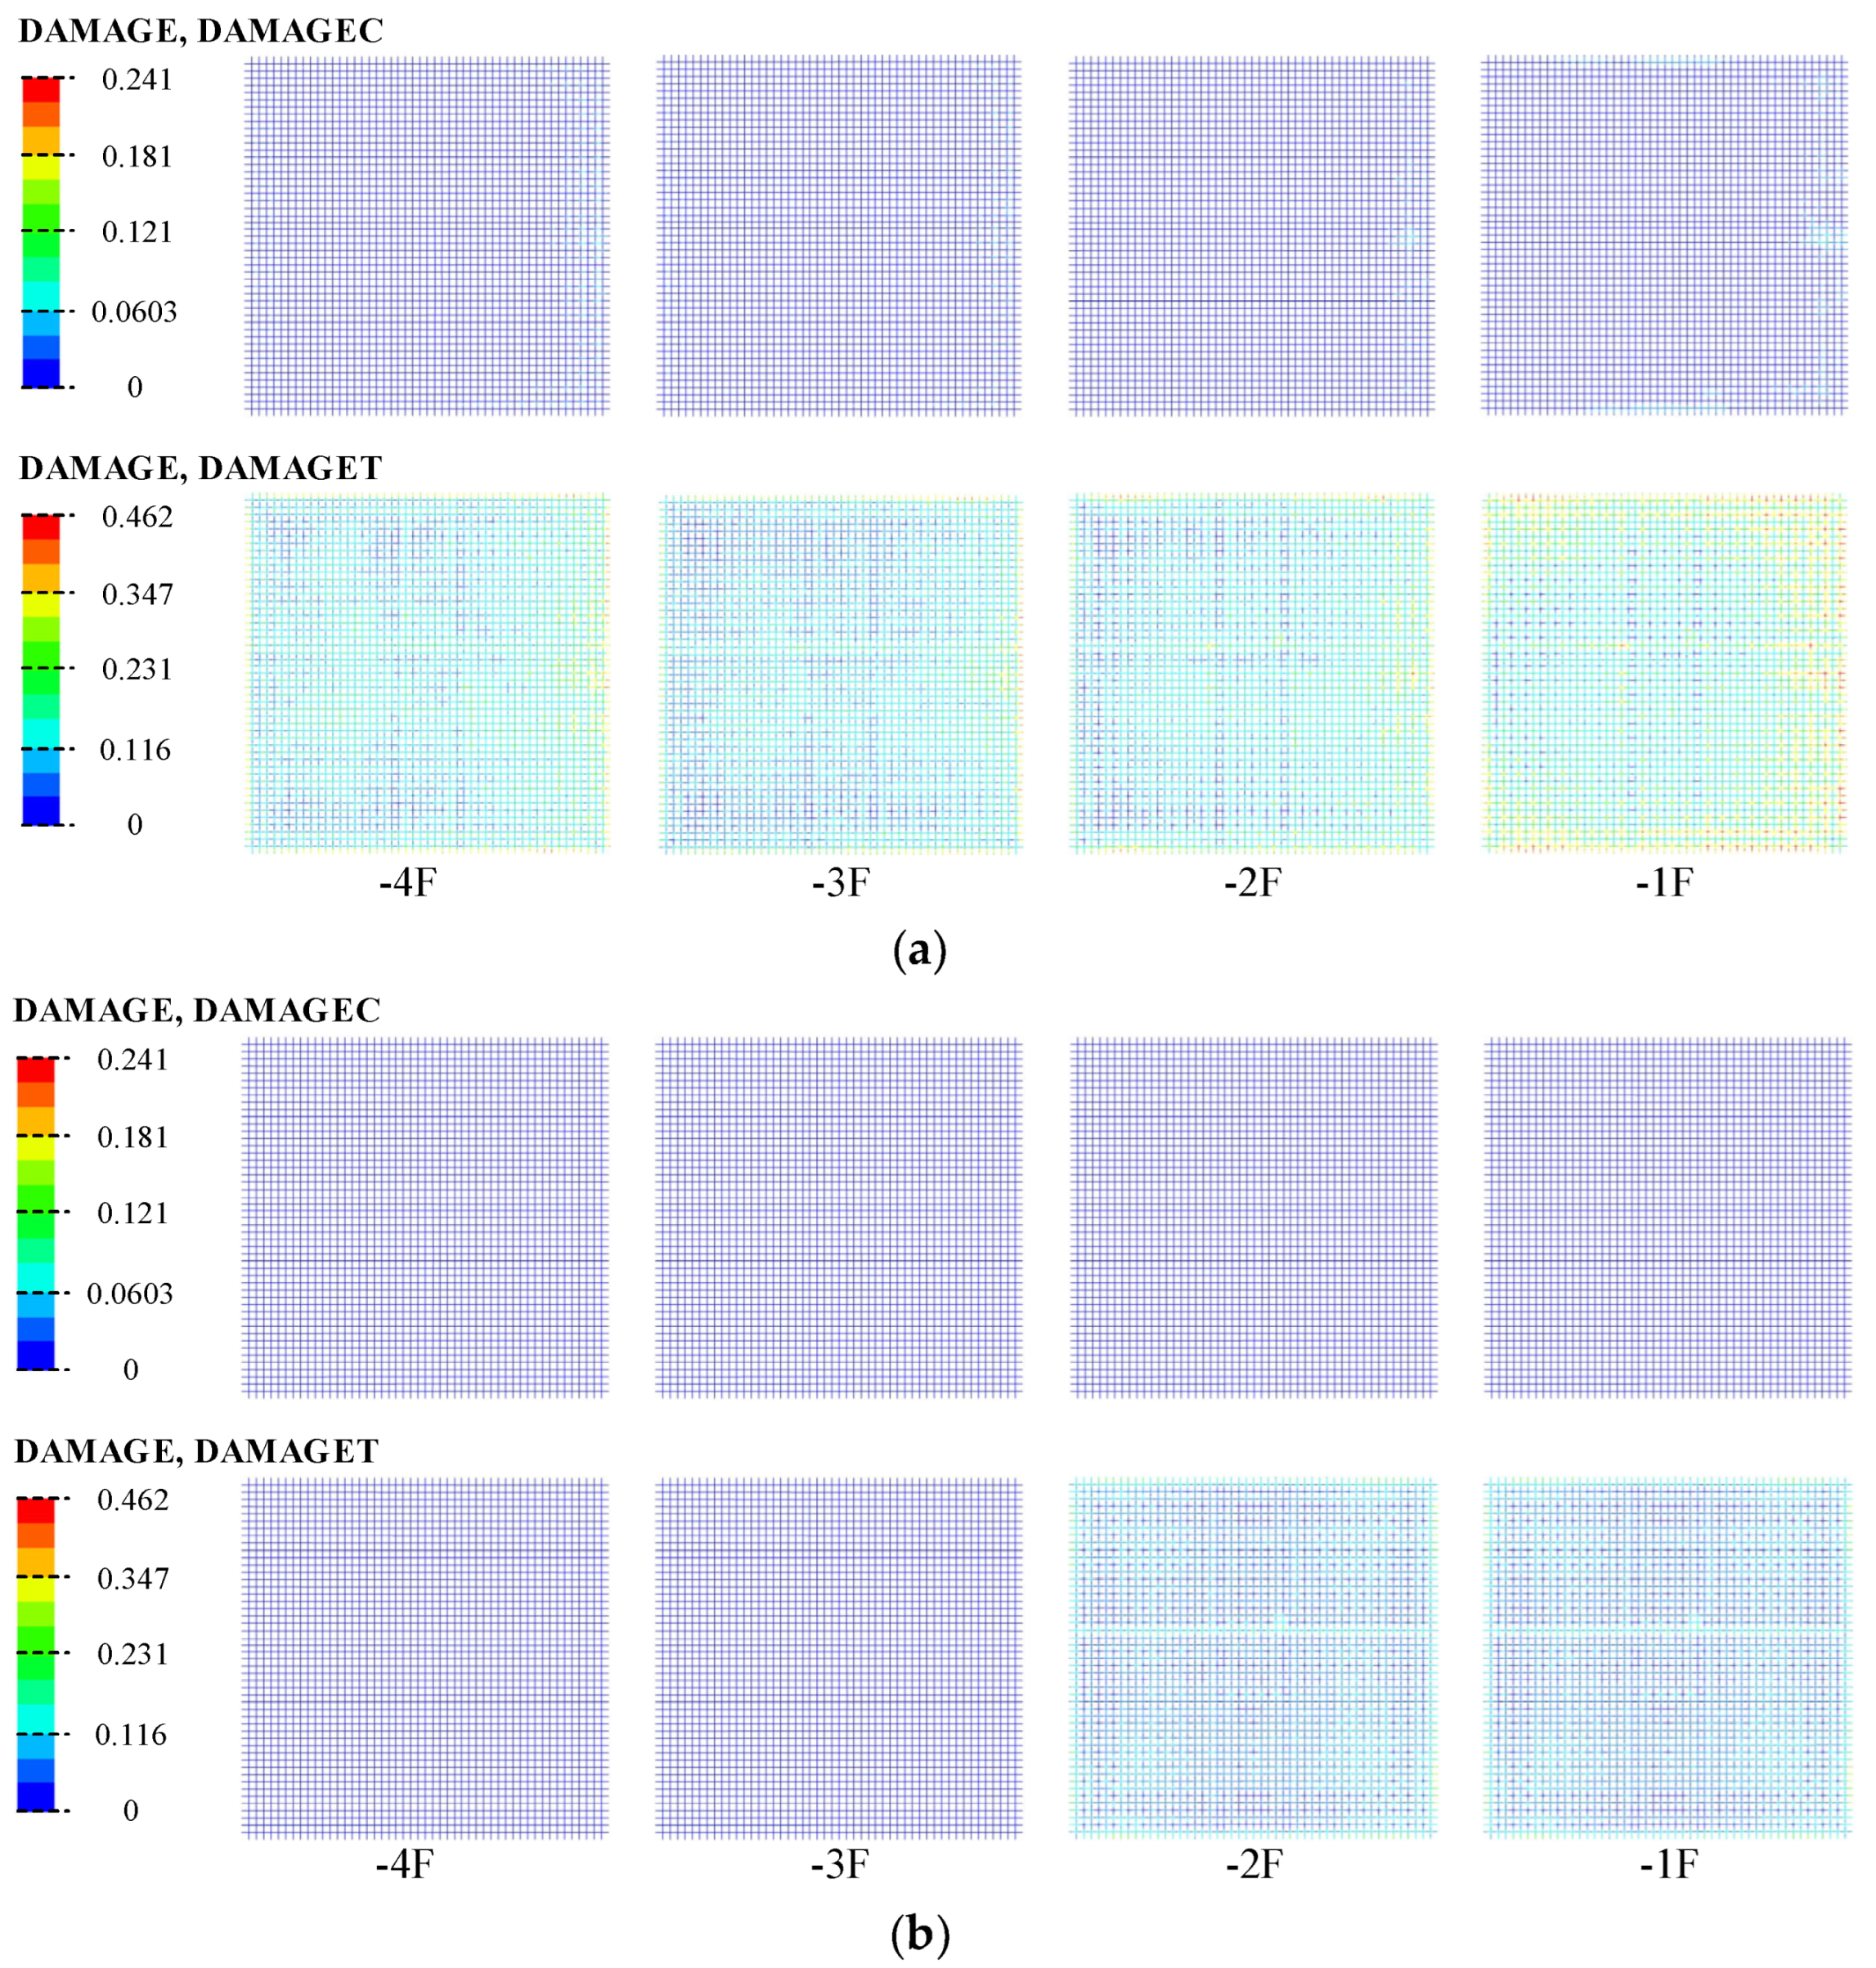
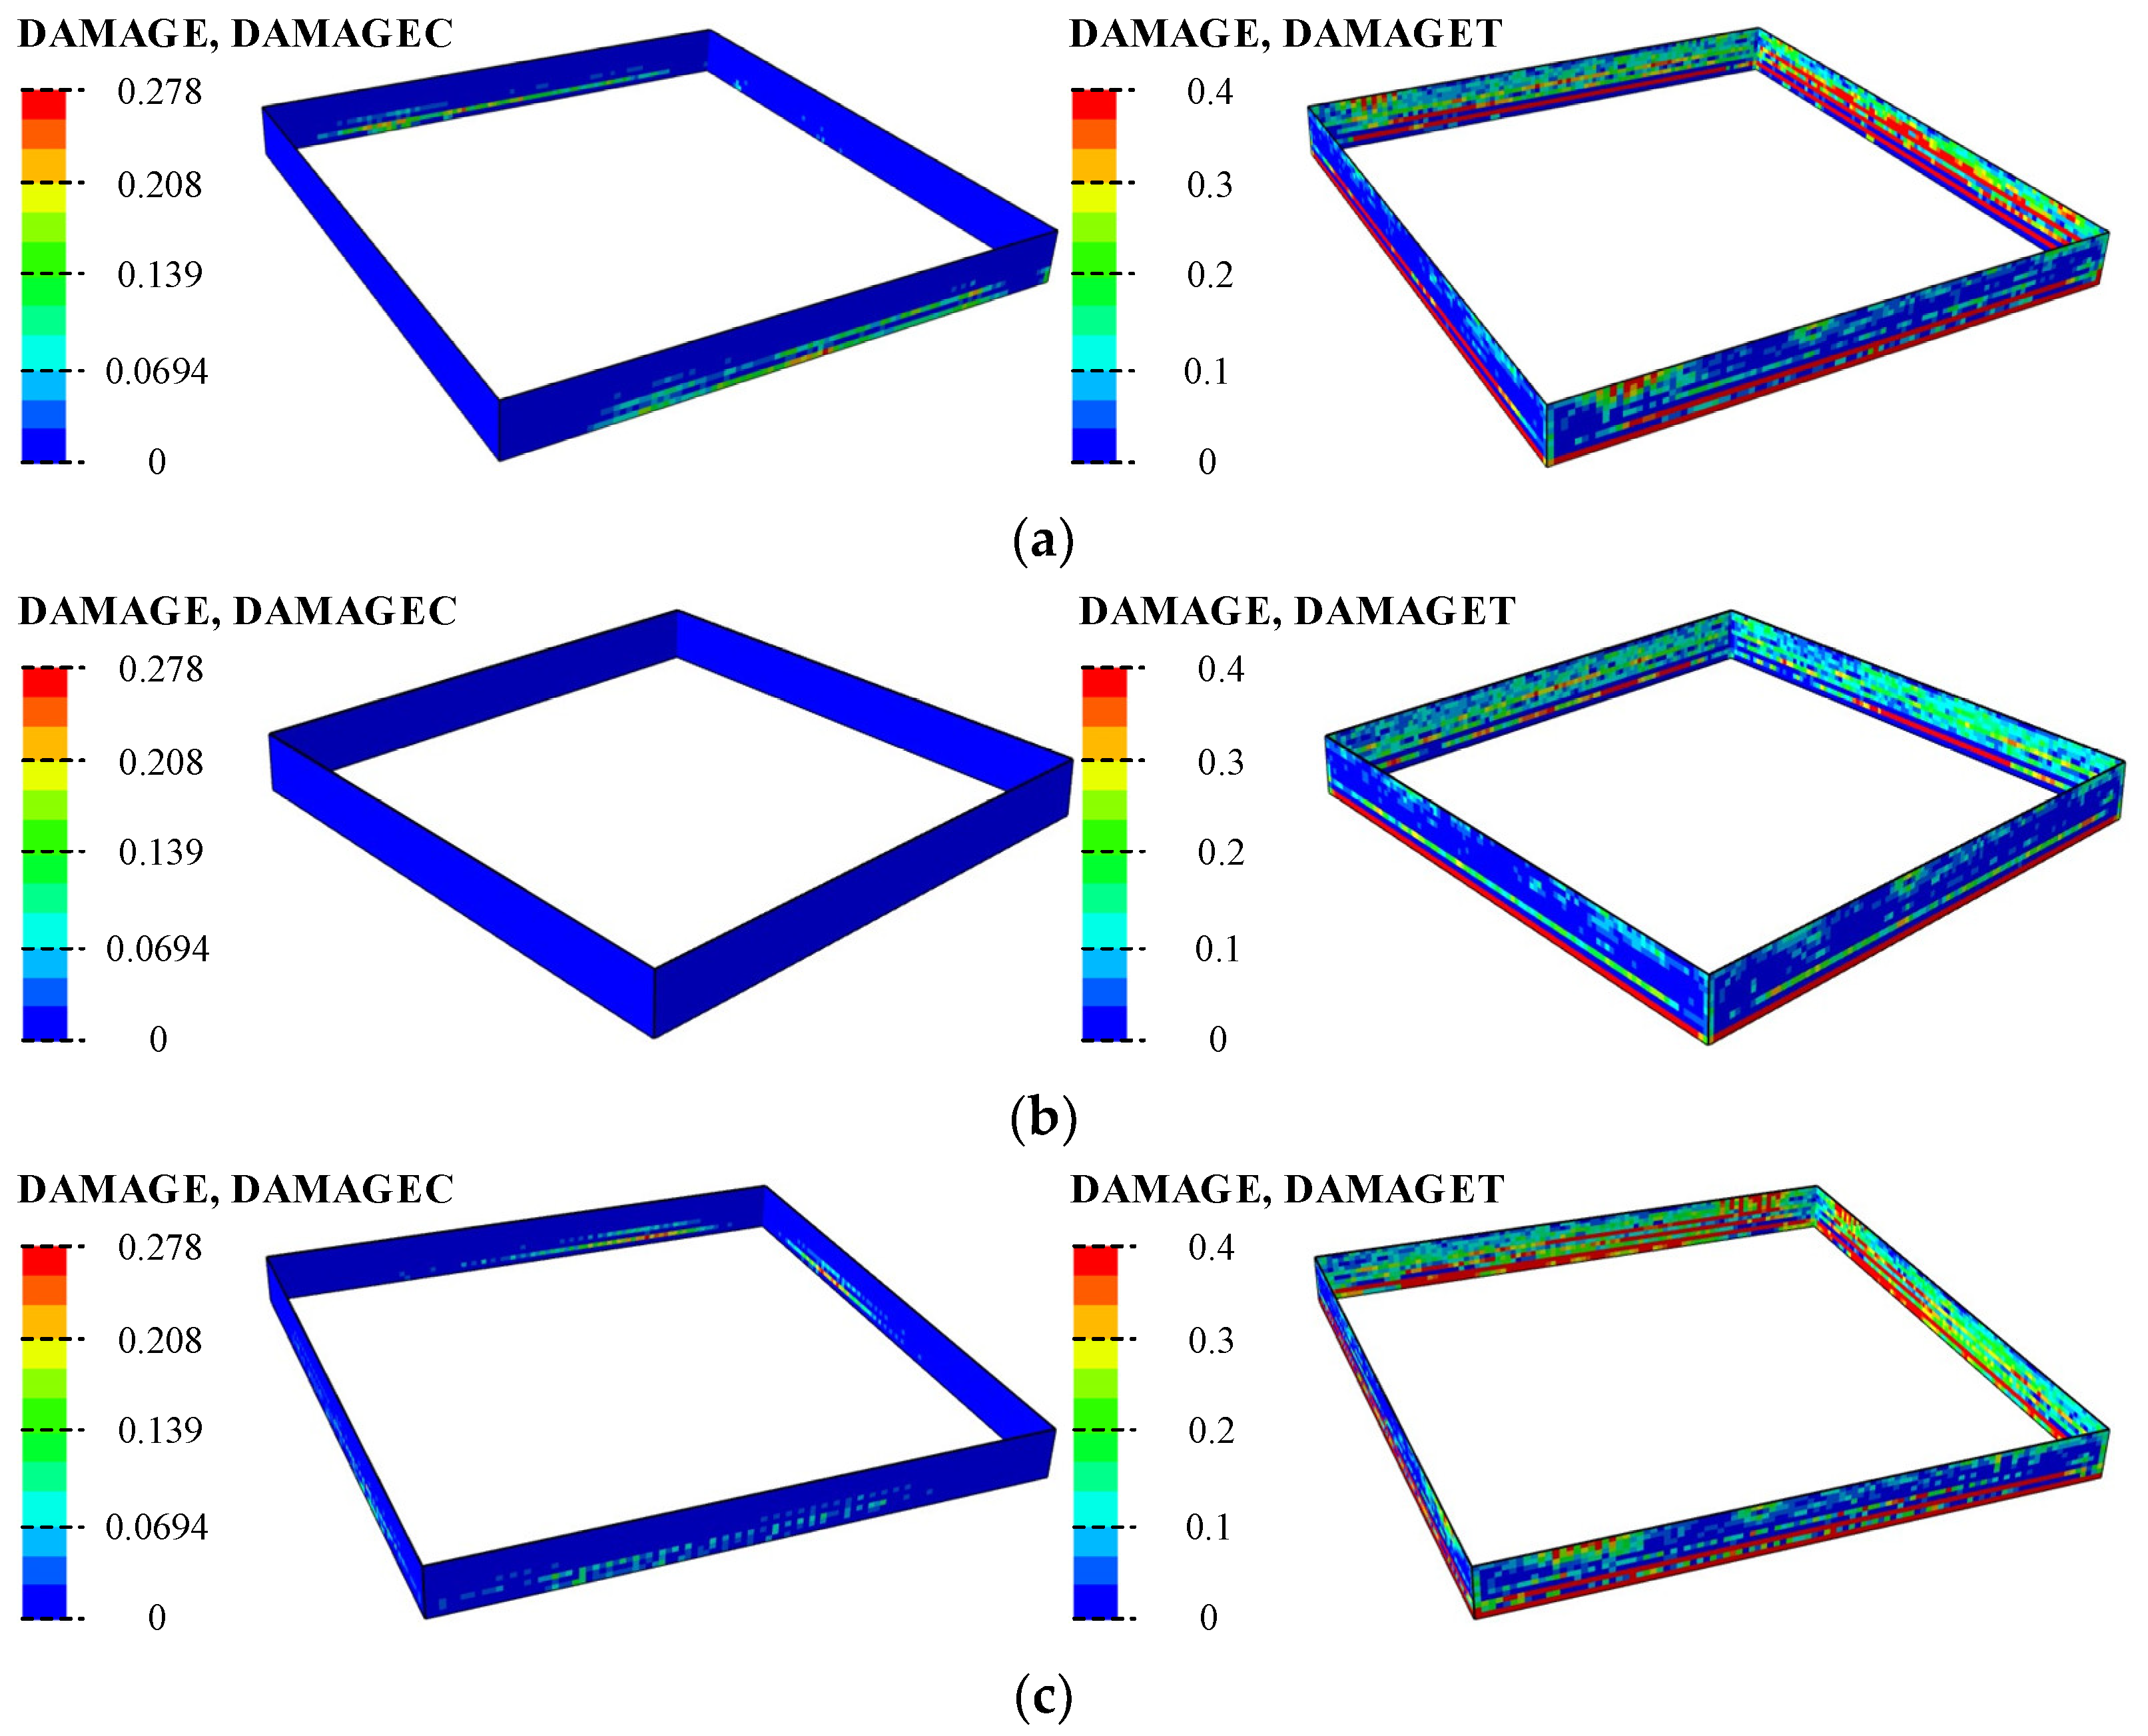
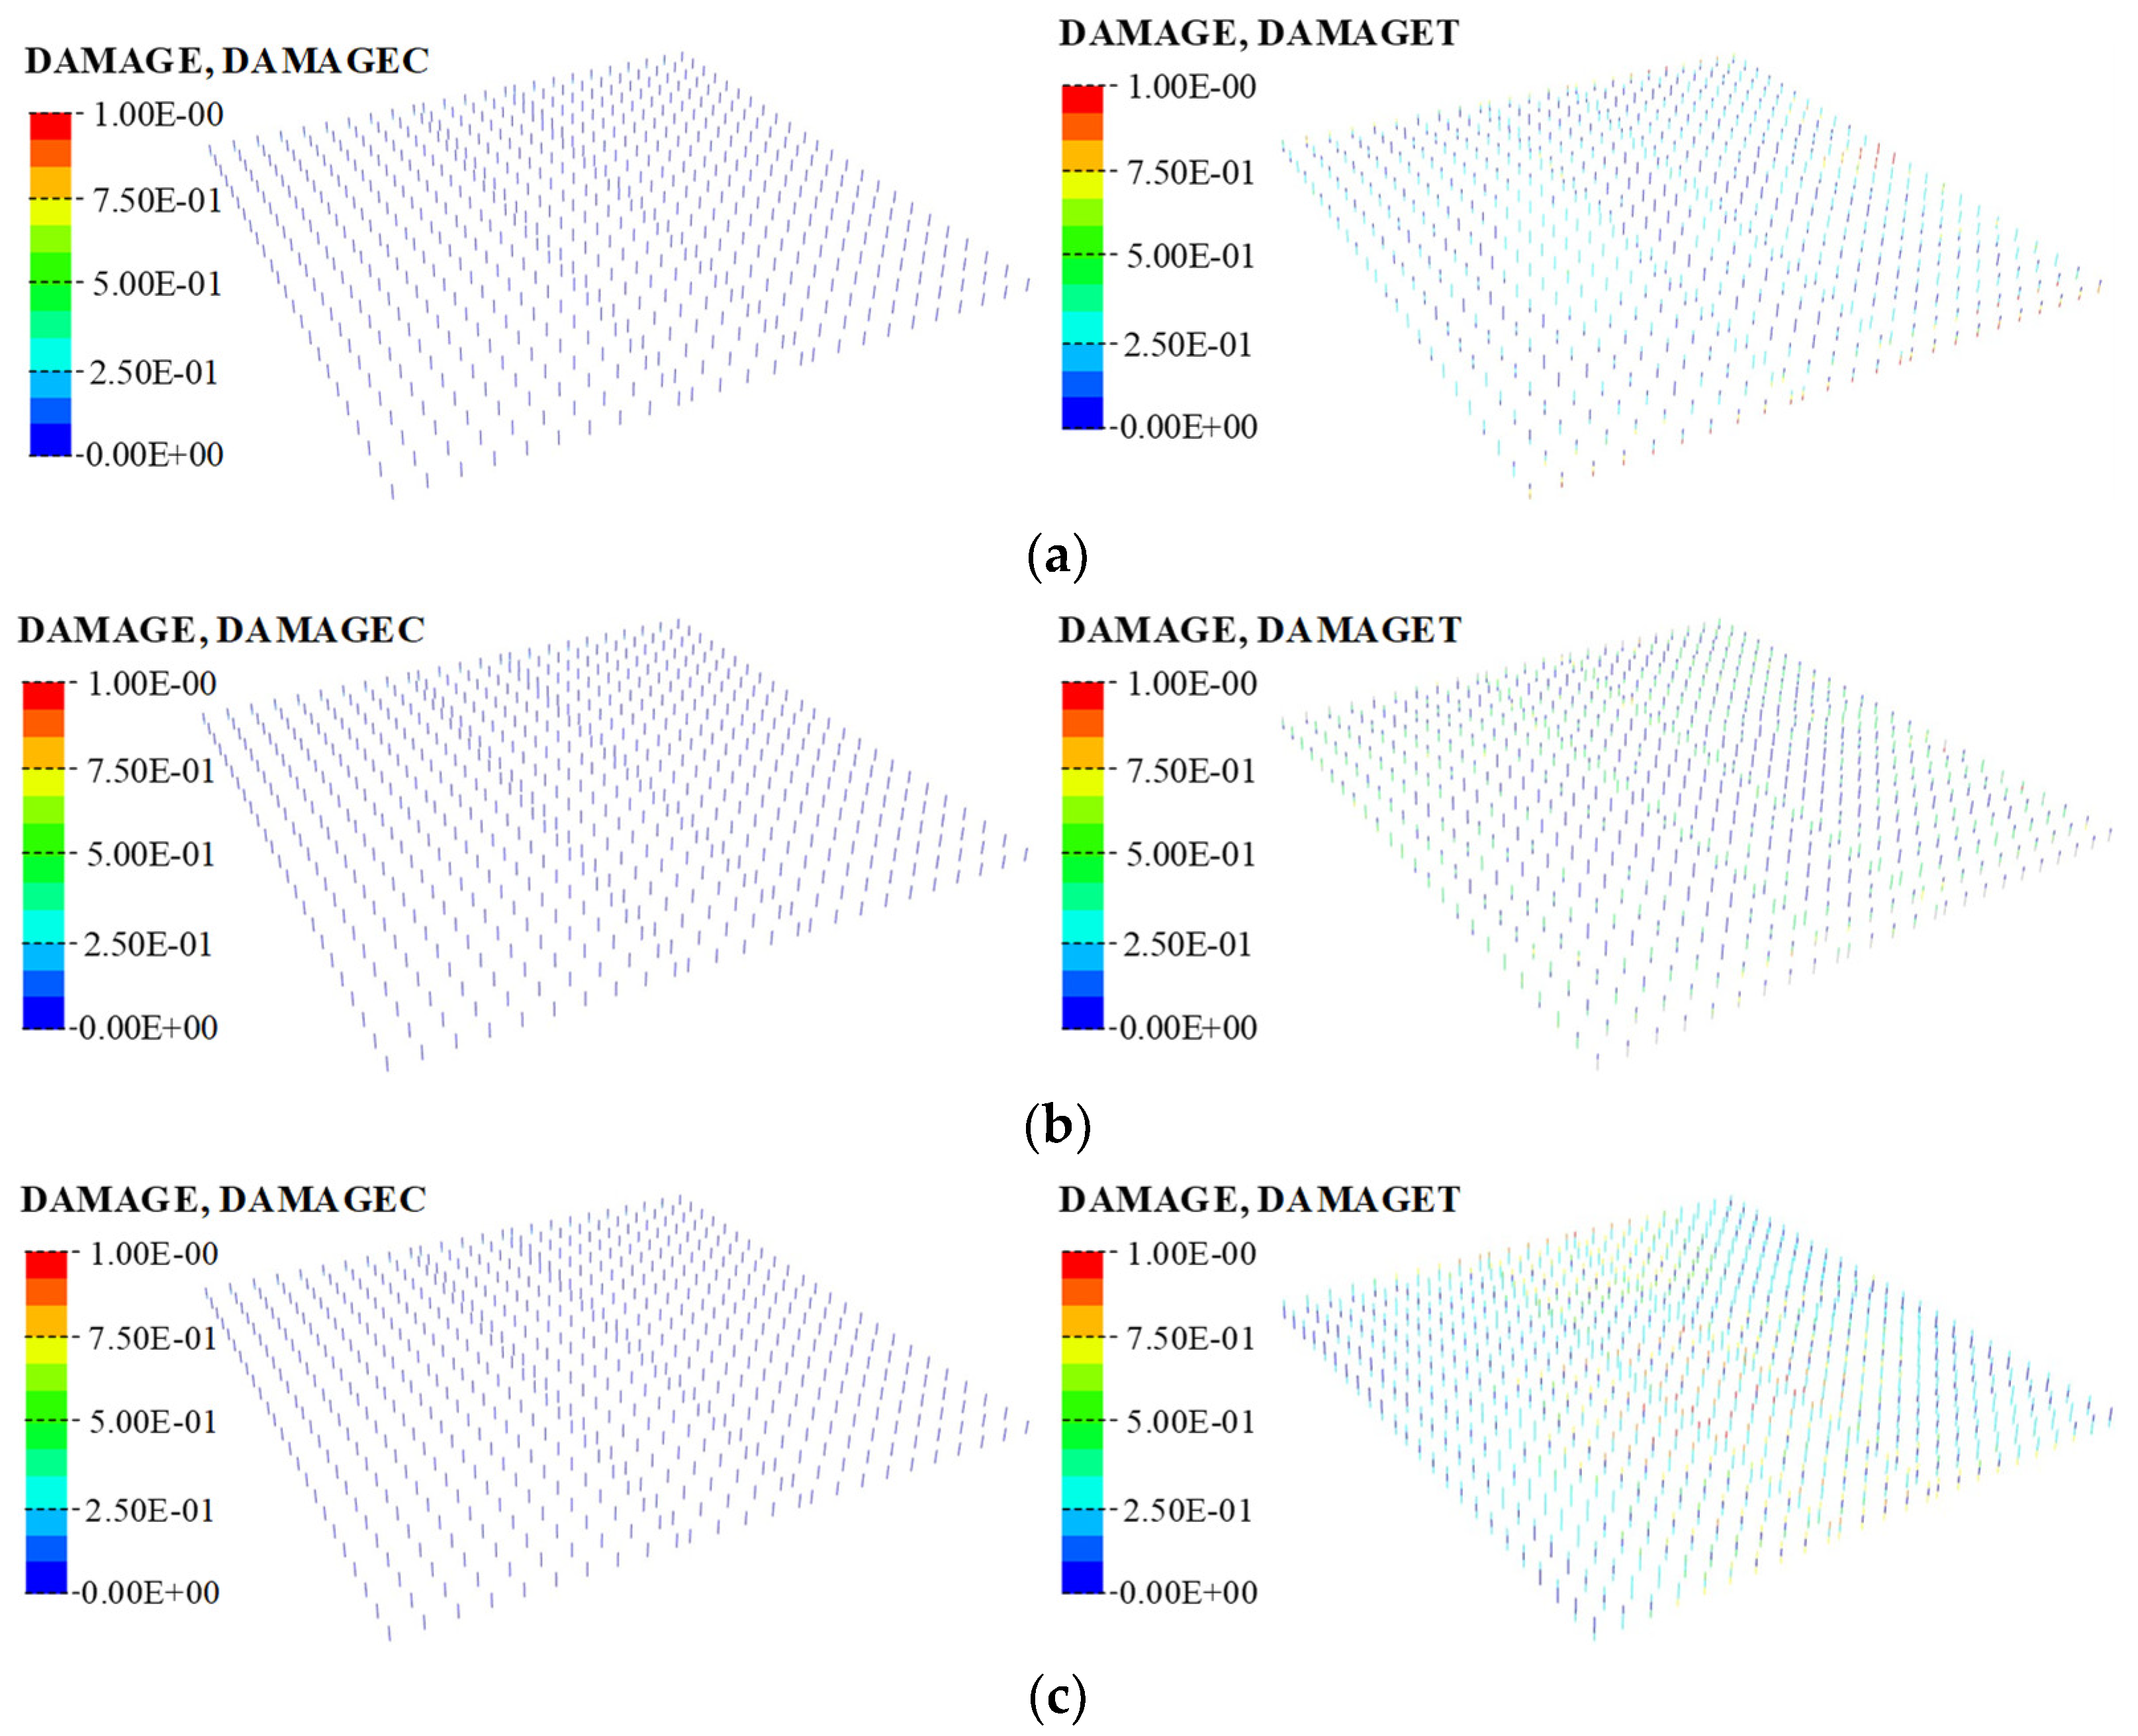
5.1. Location of Damage
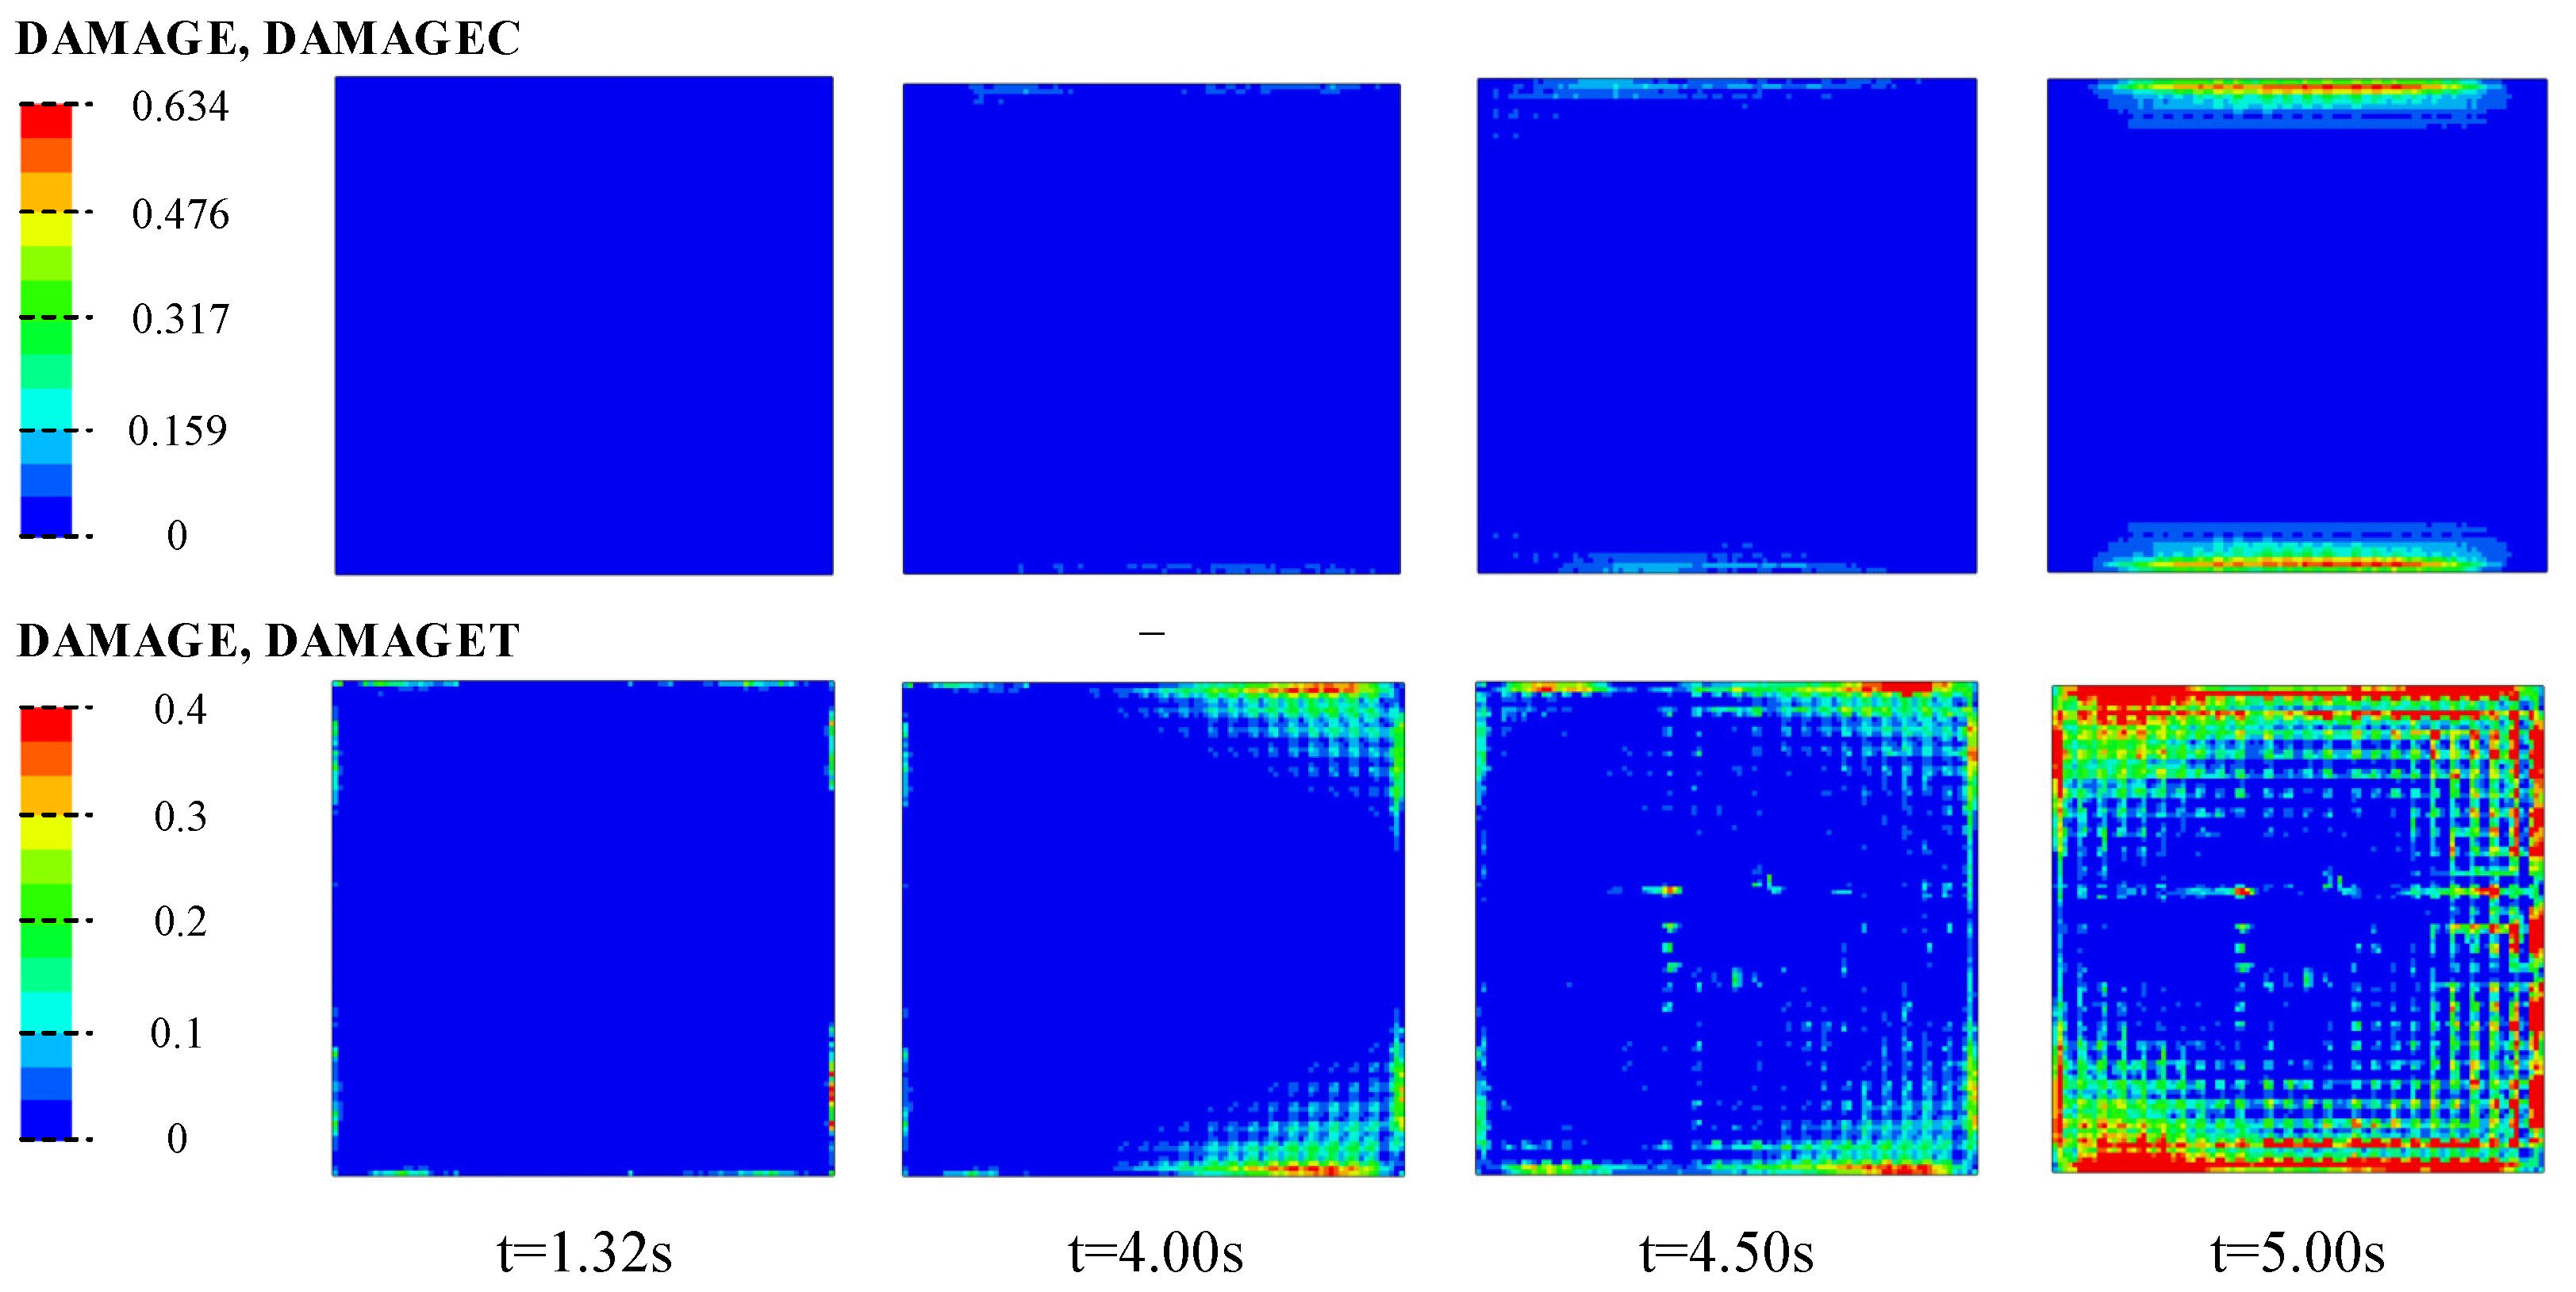
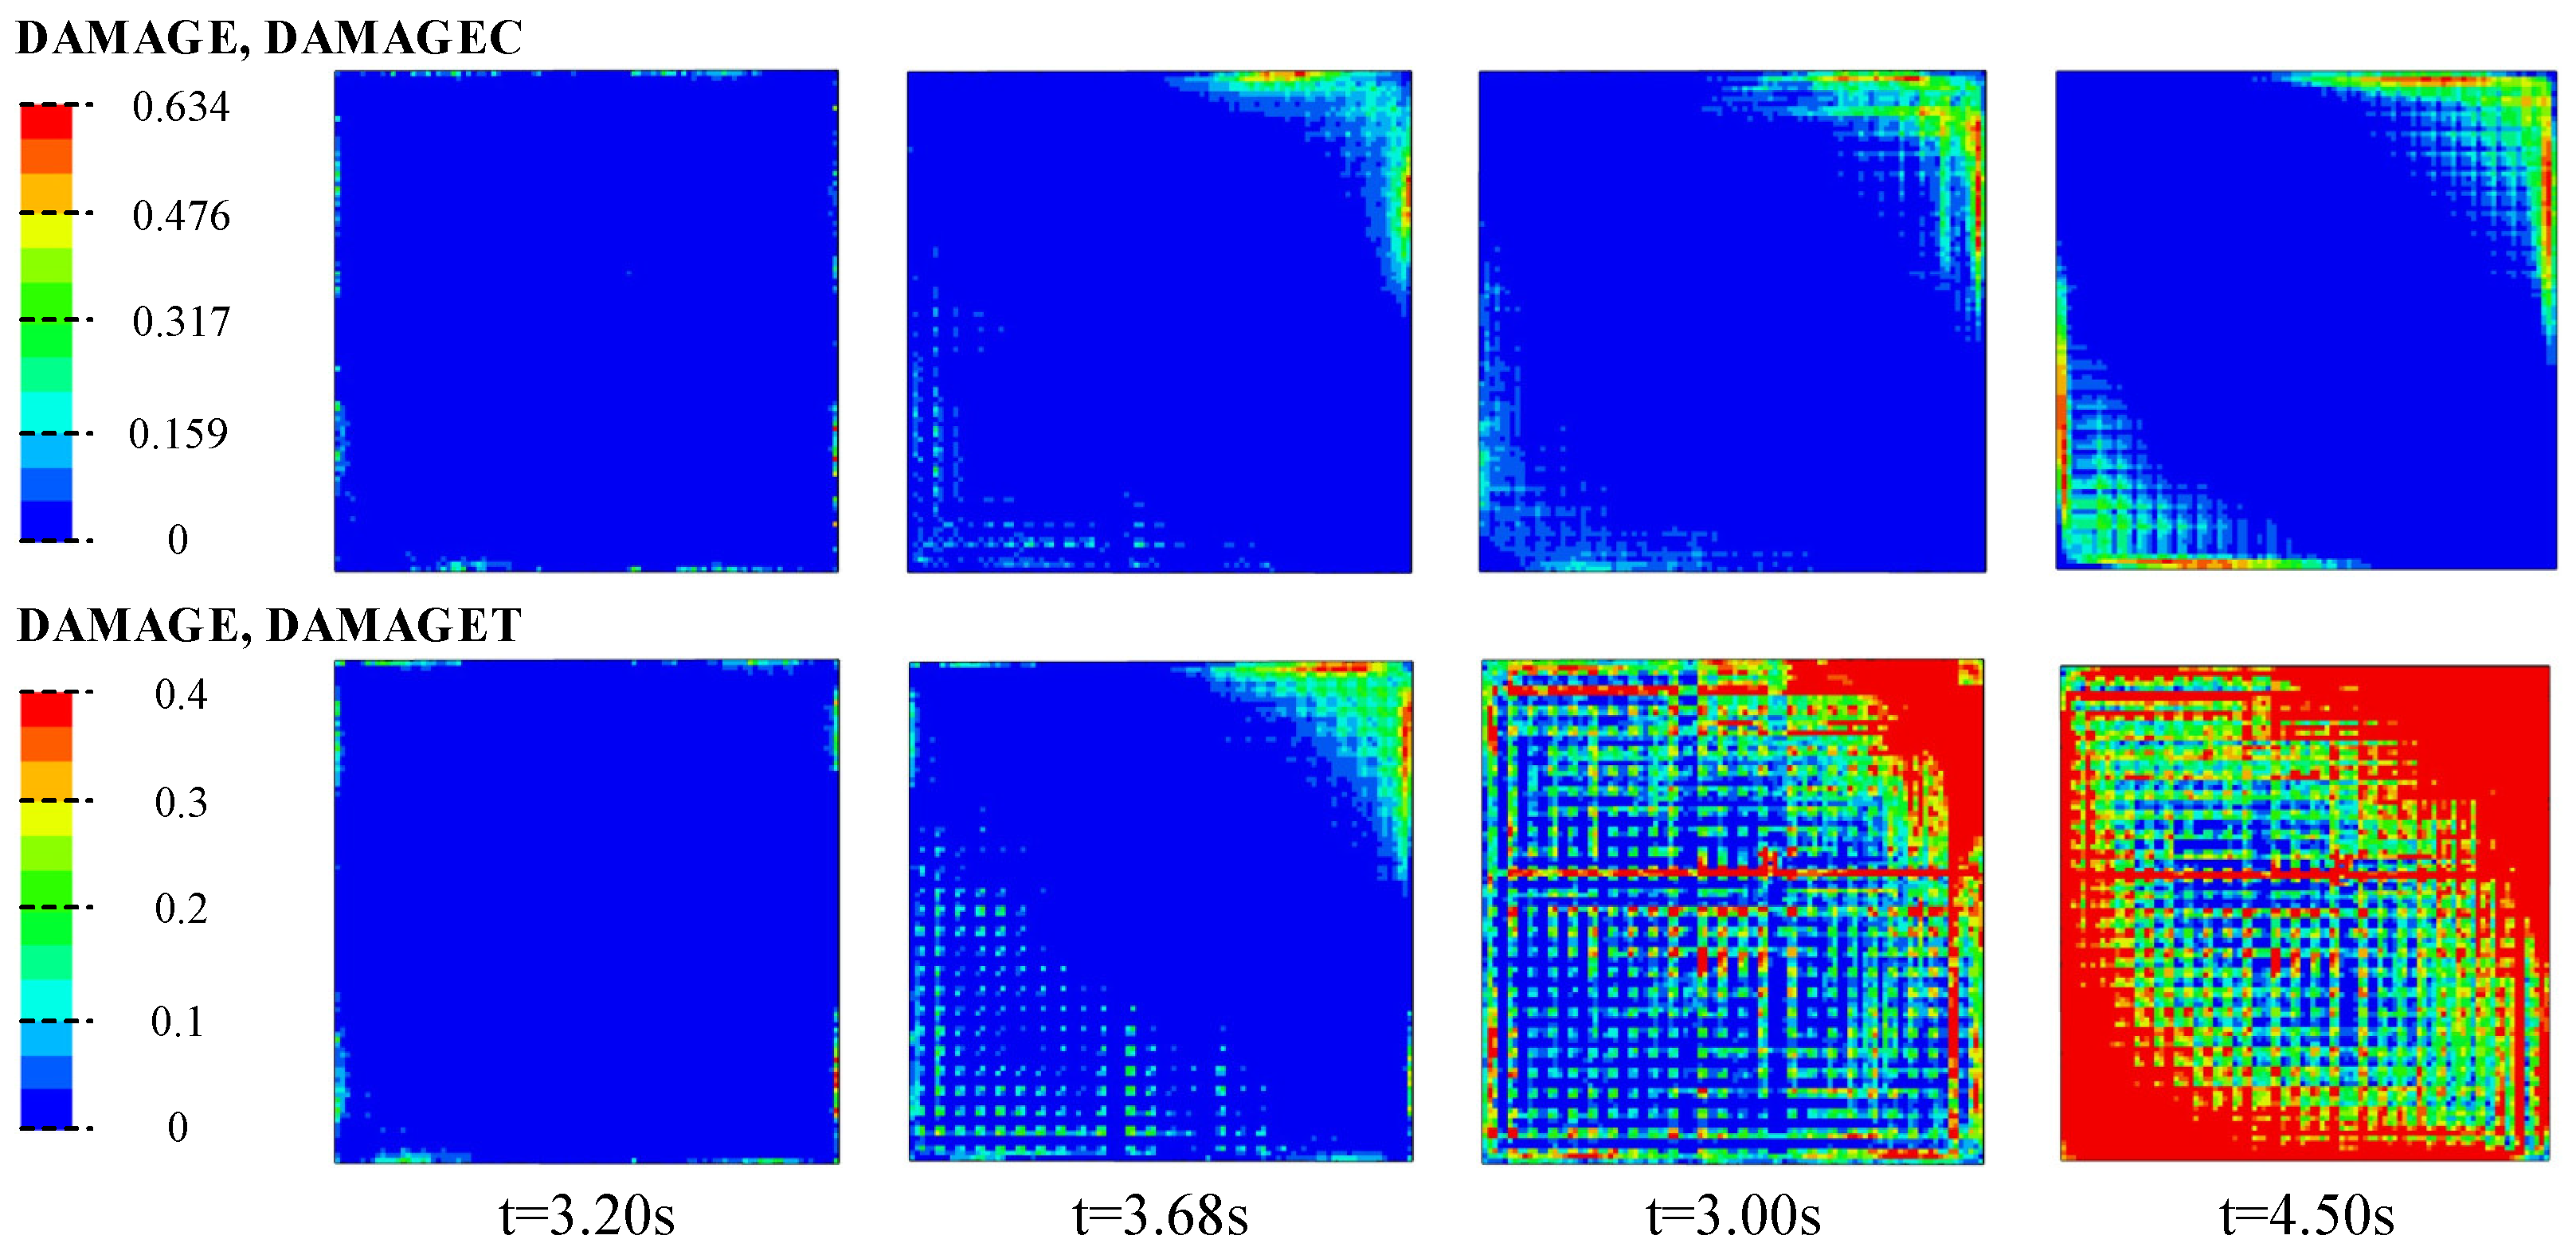
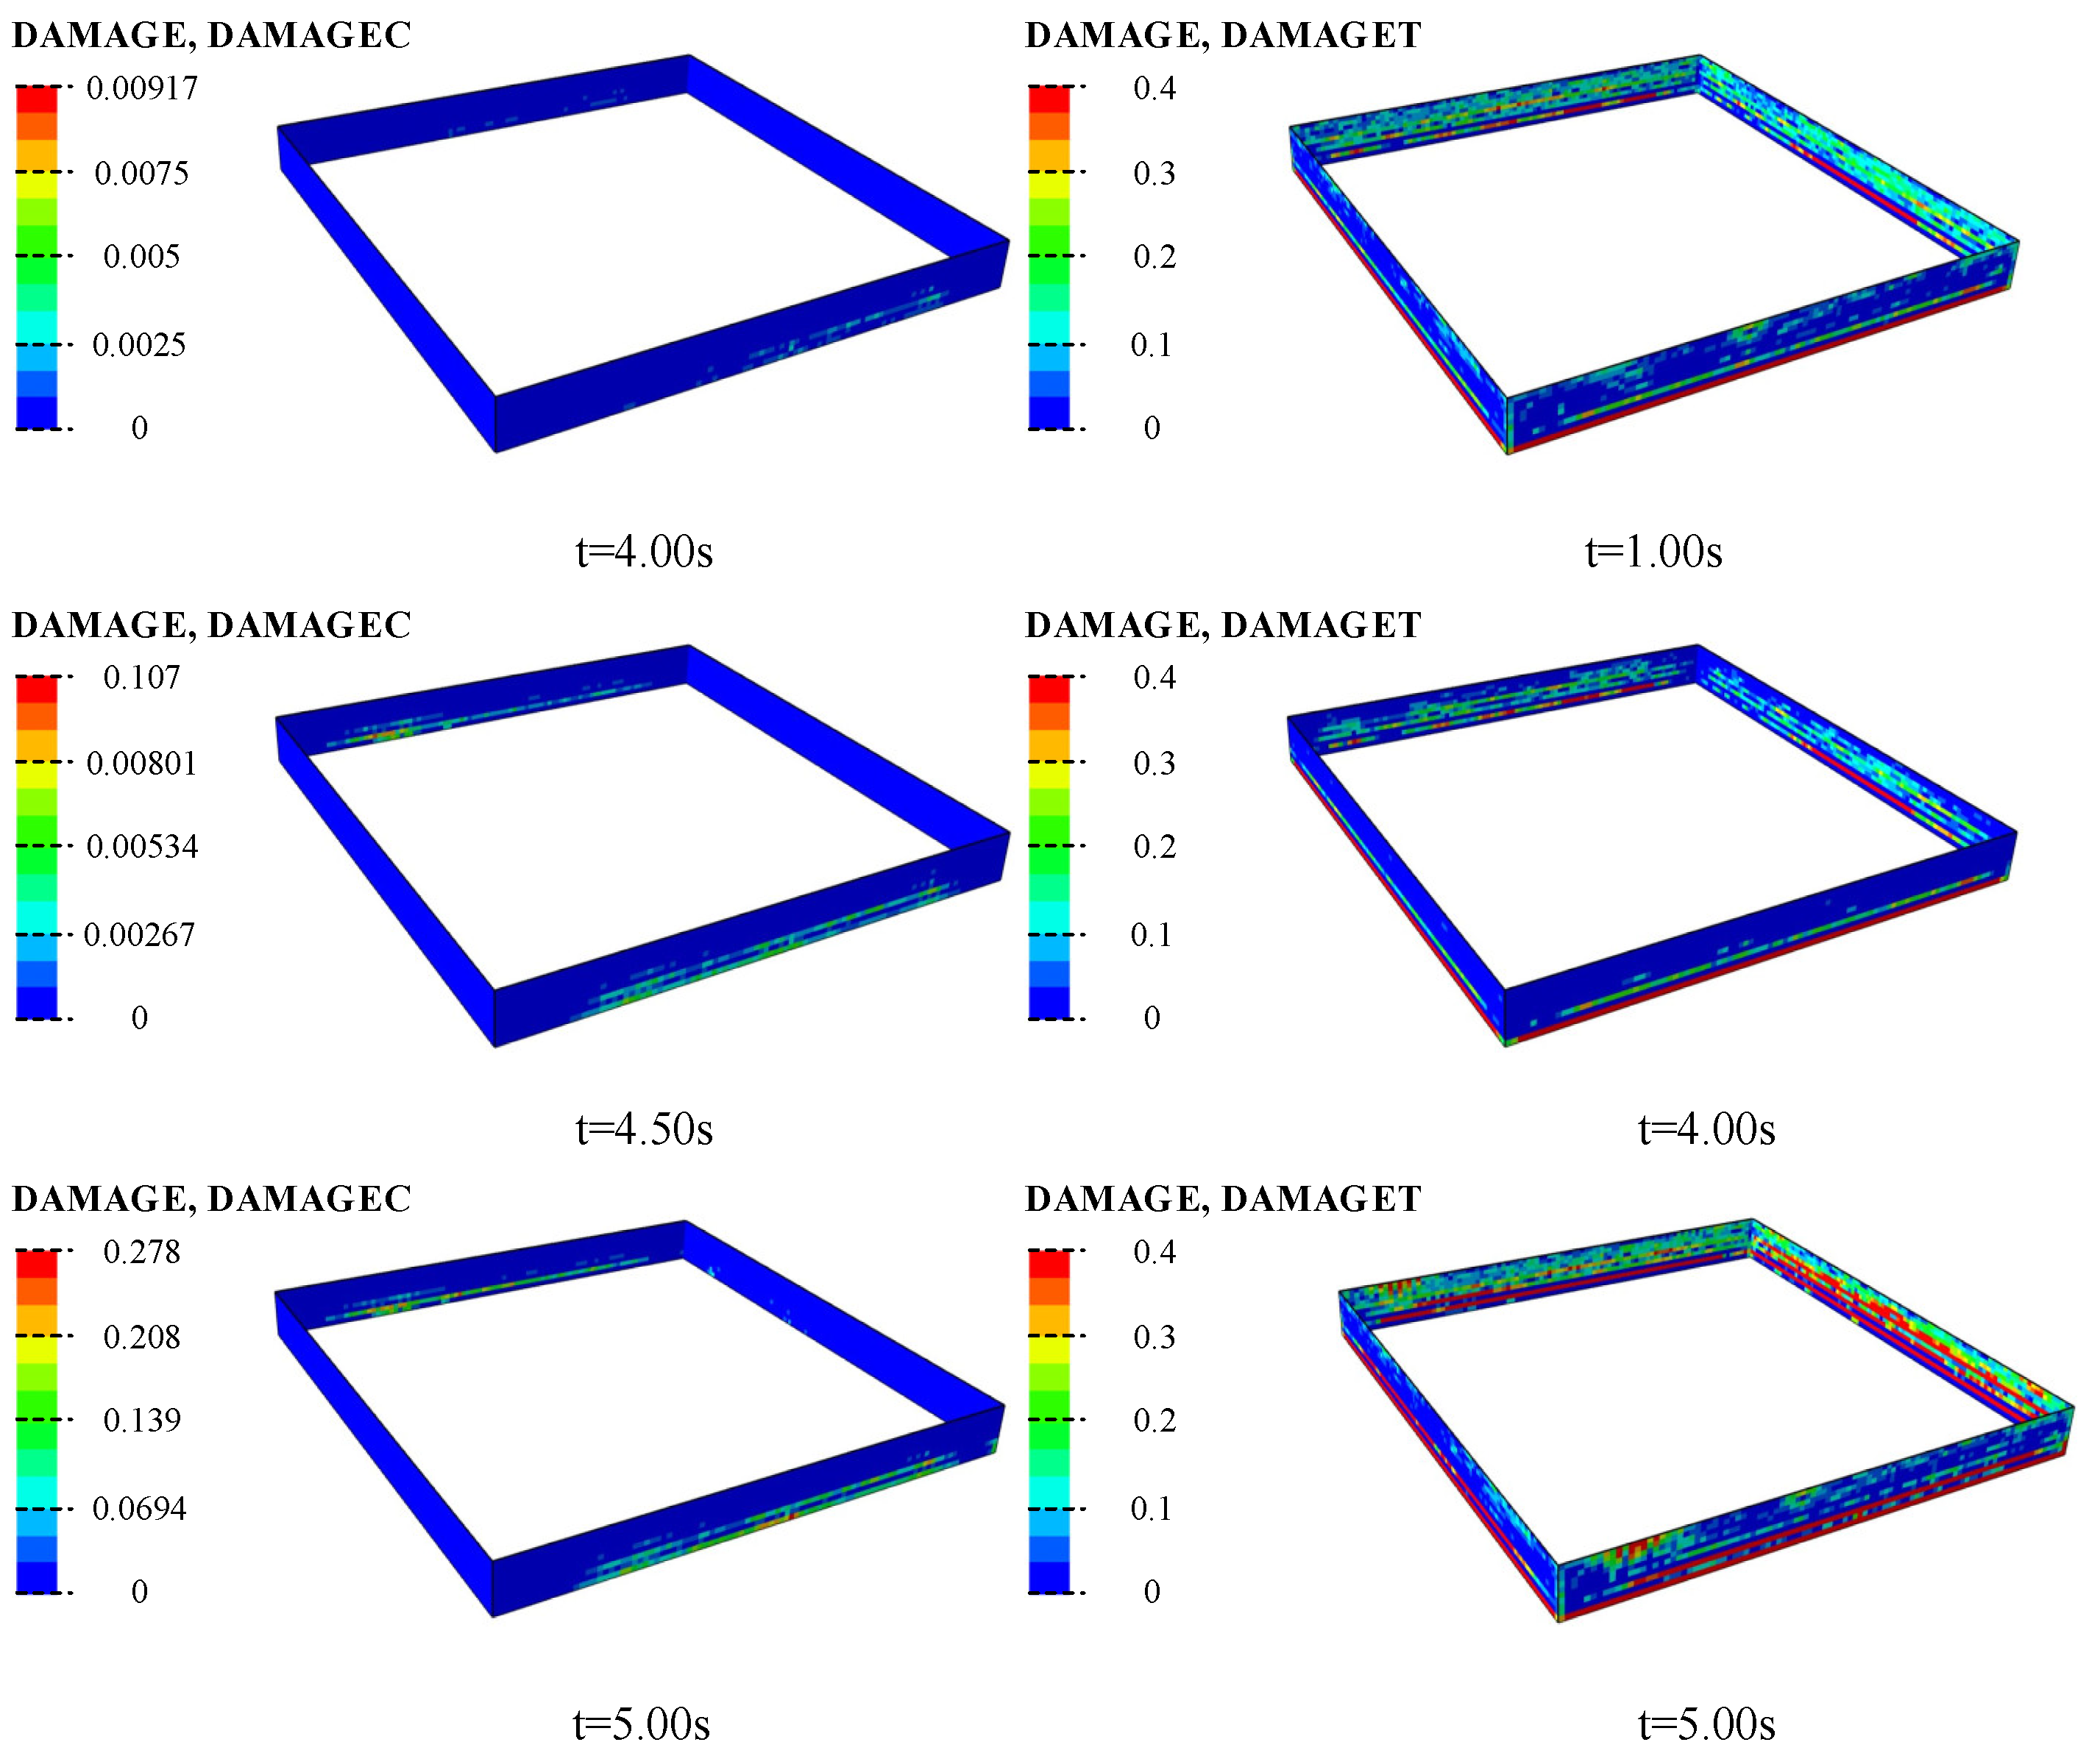
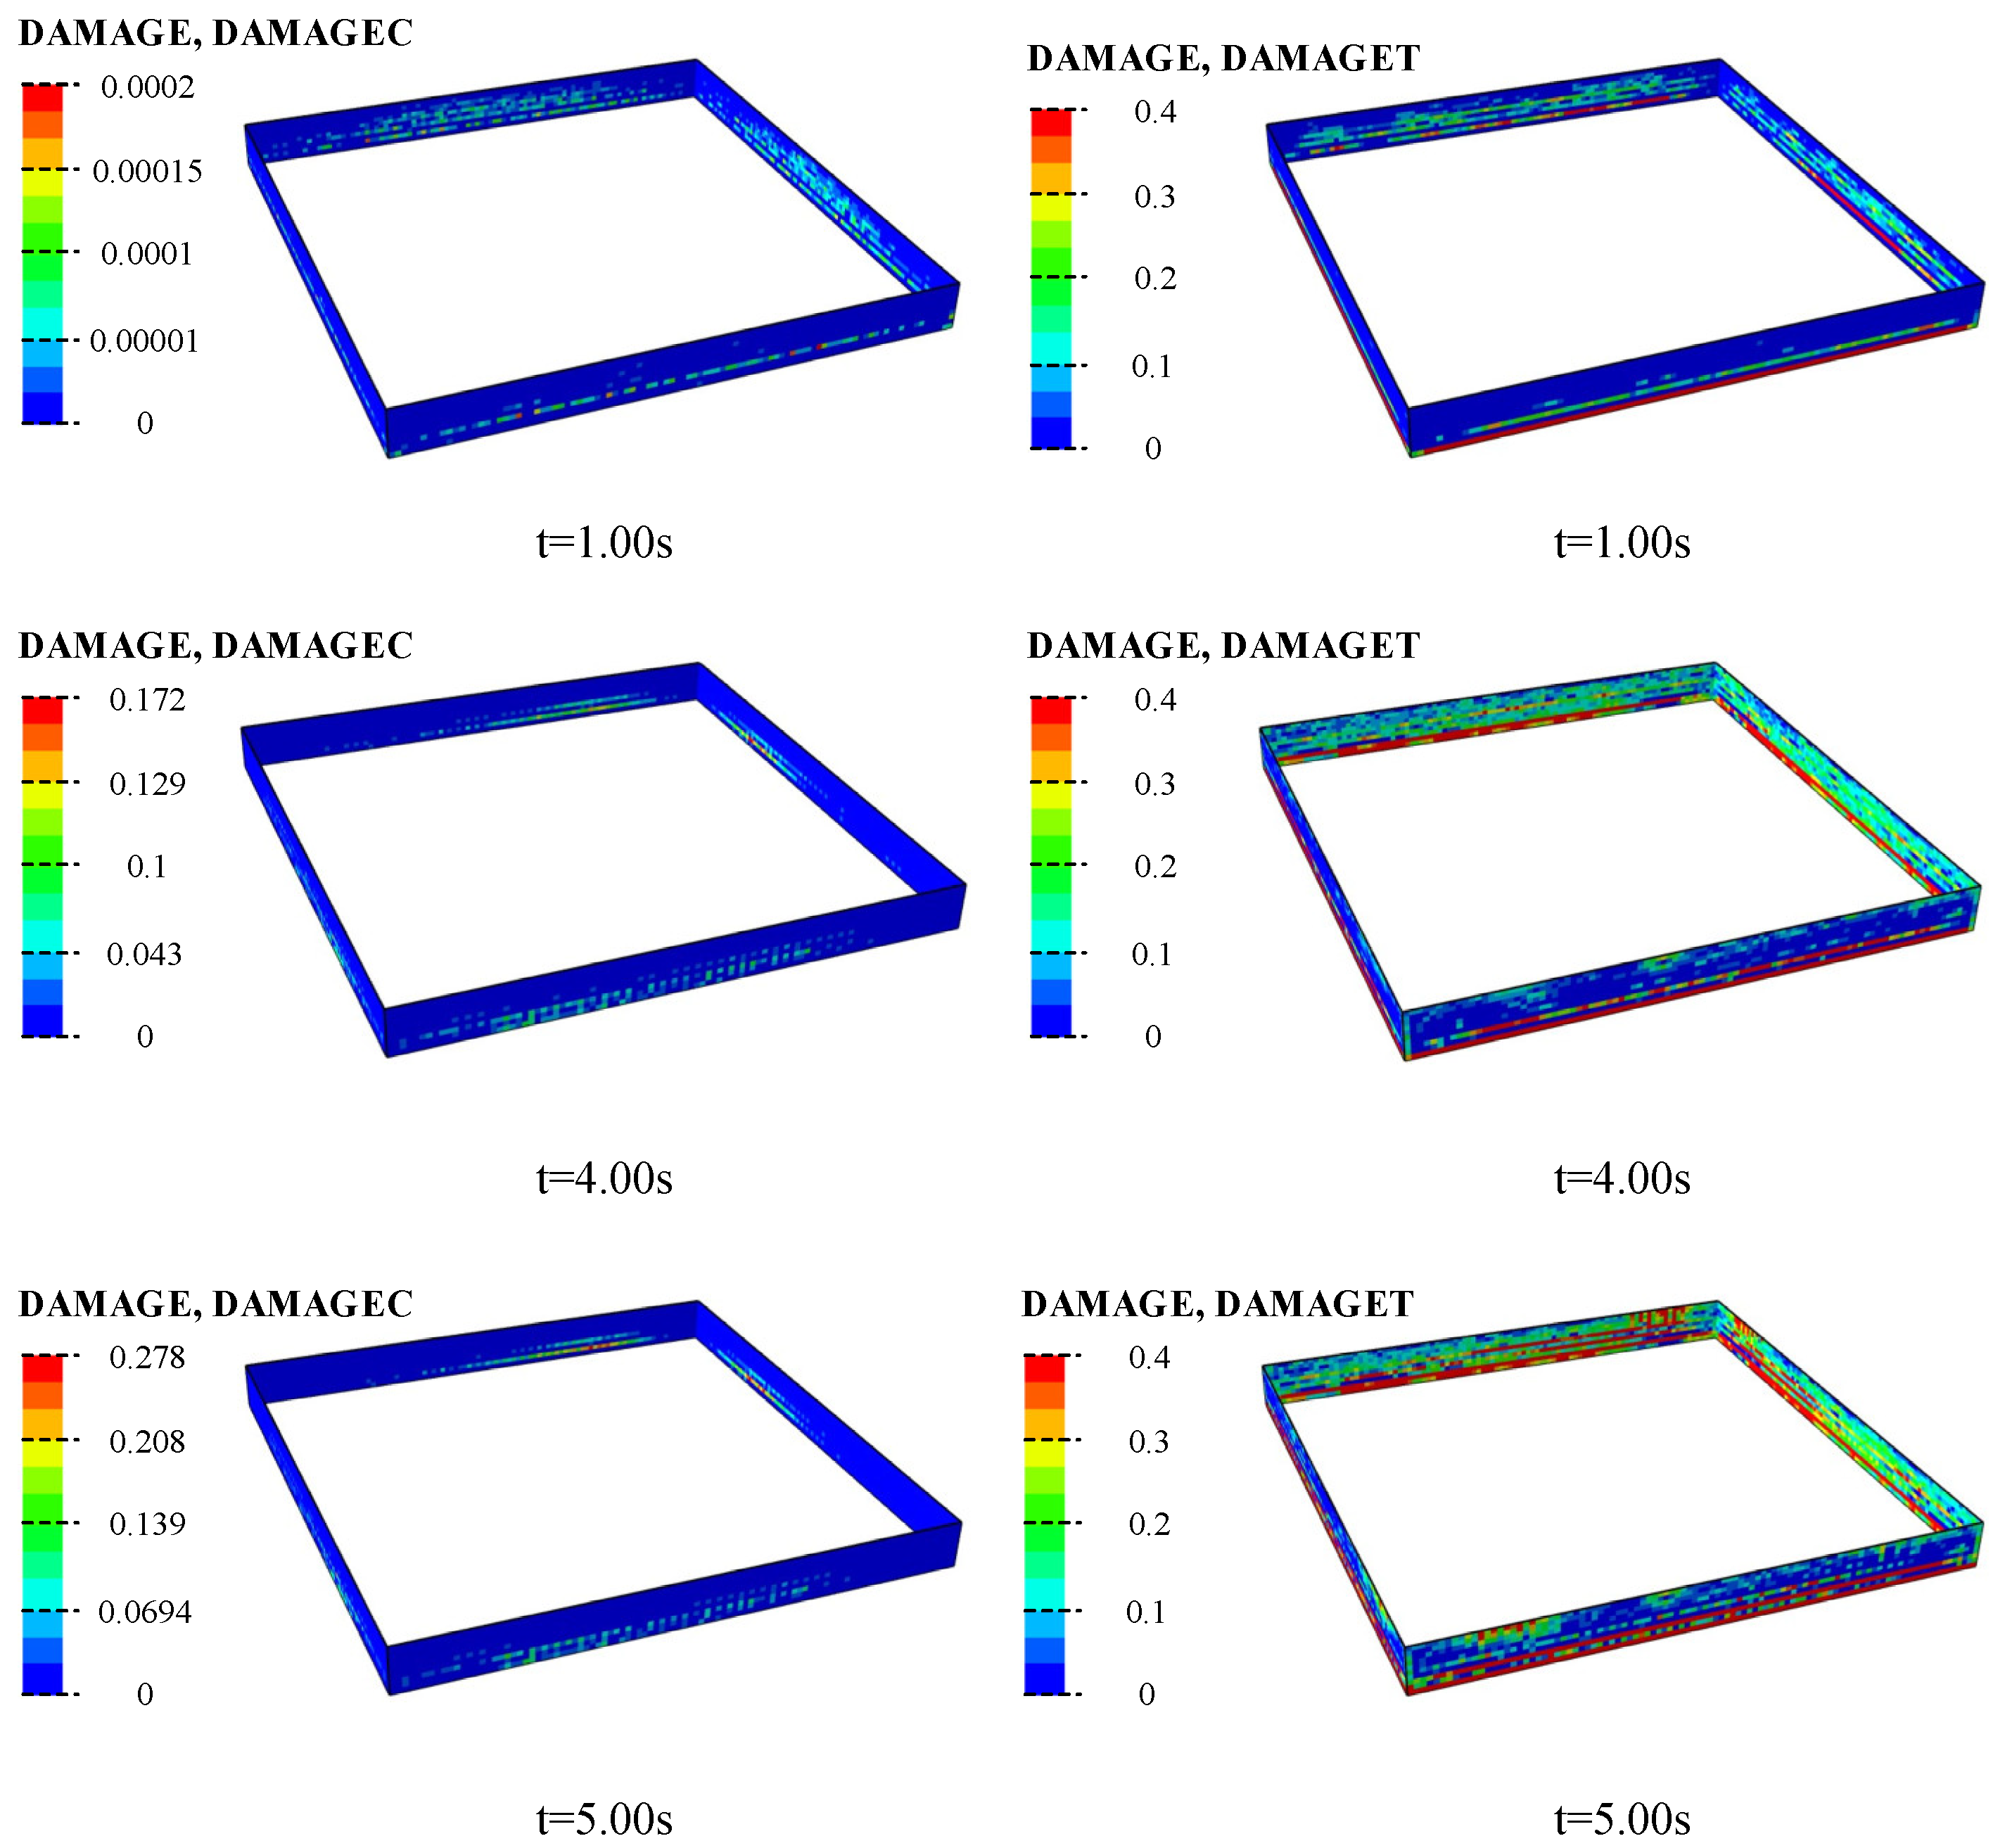
5.2. Evolution of Damage
6. Conclusions
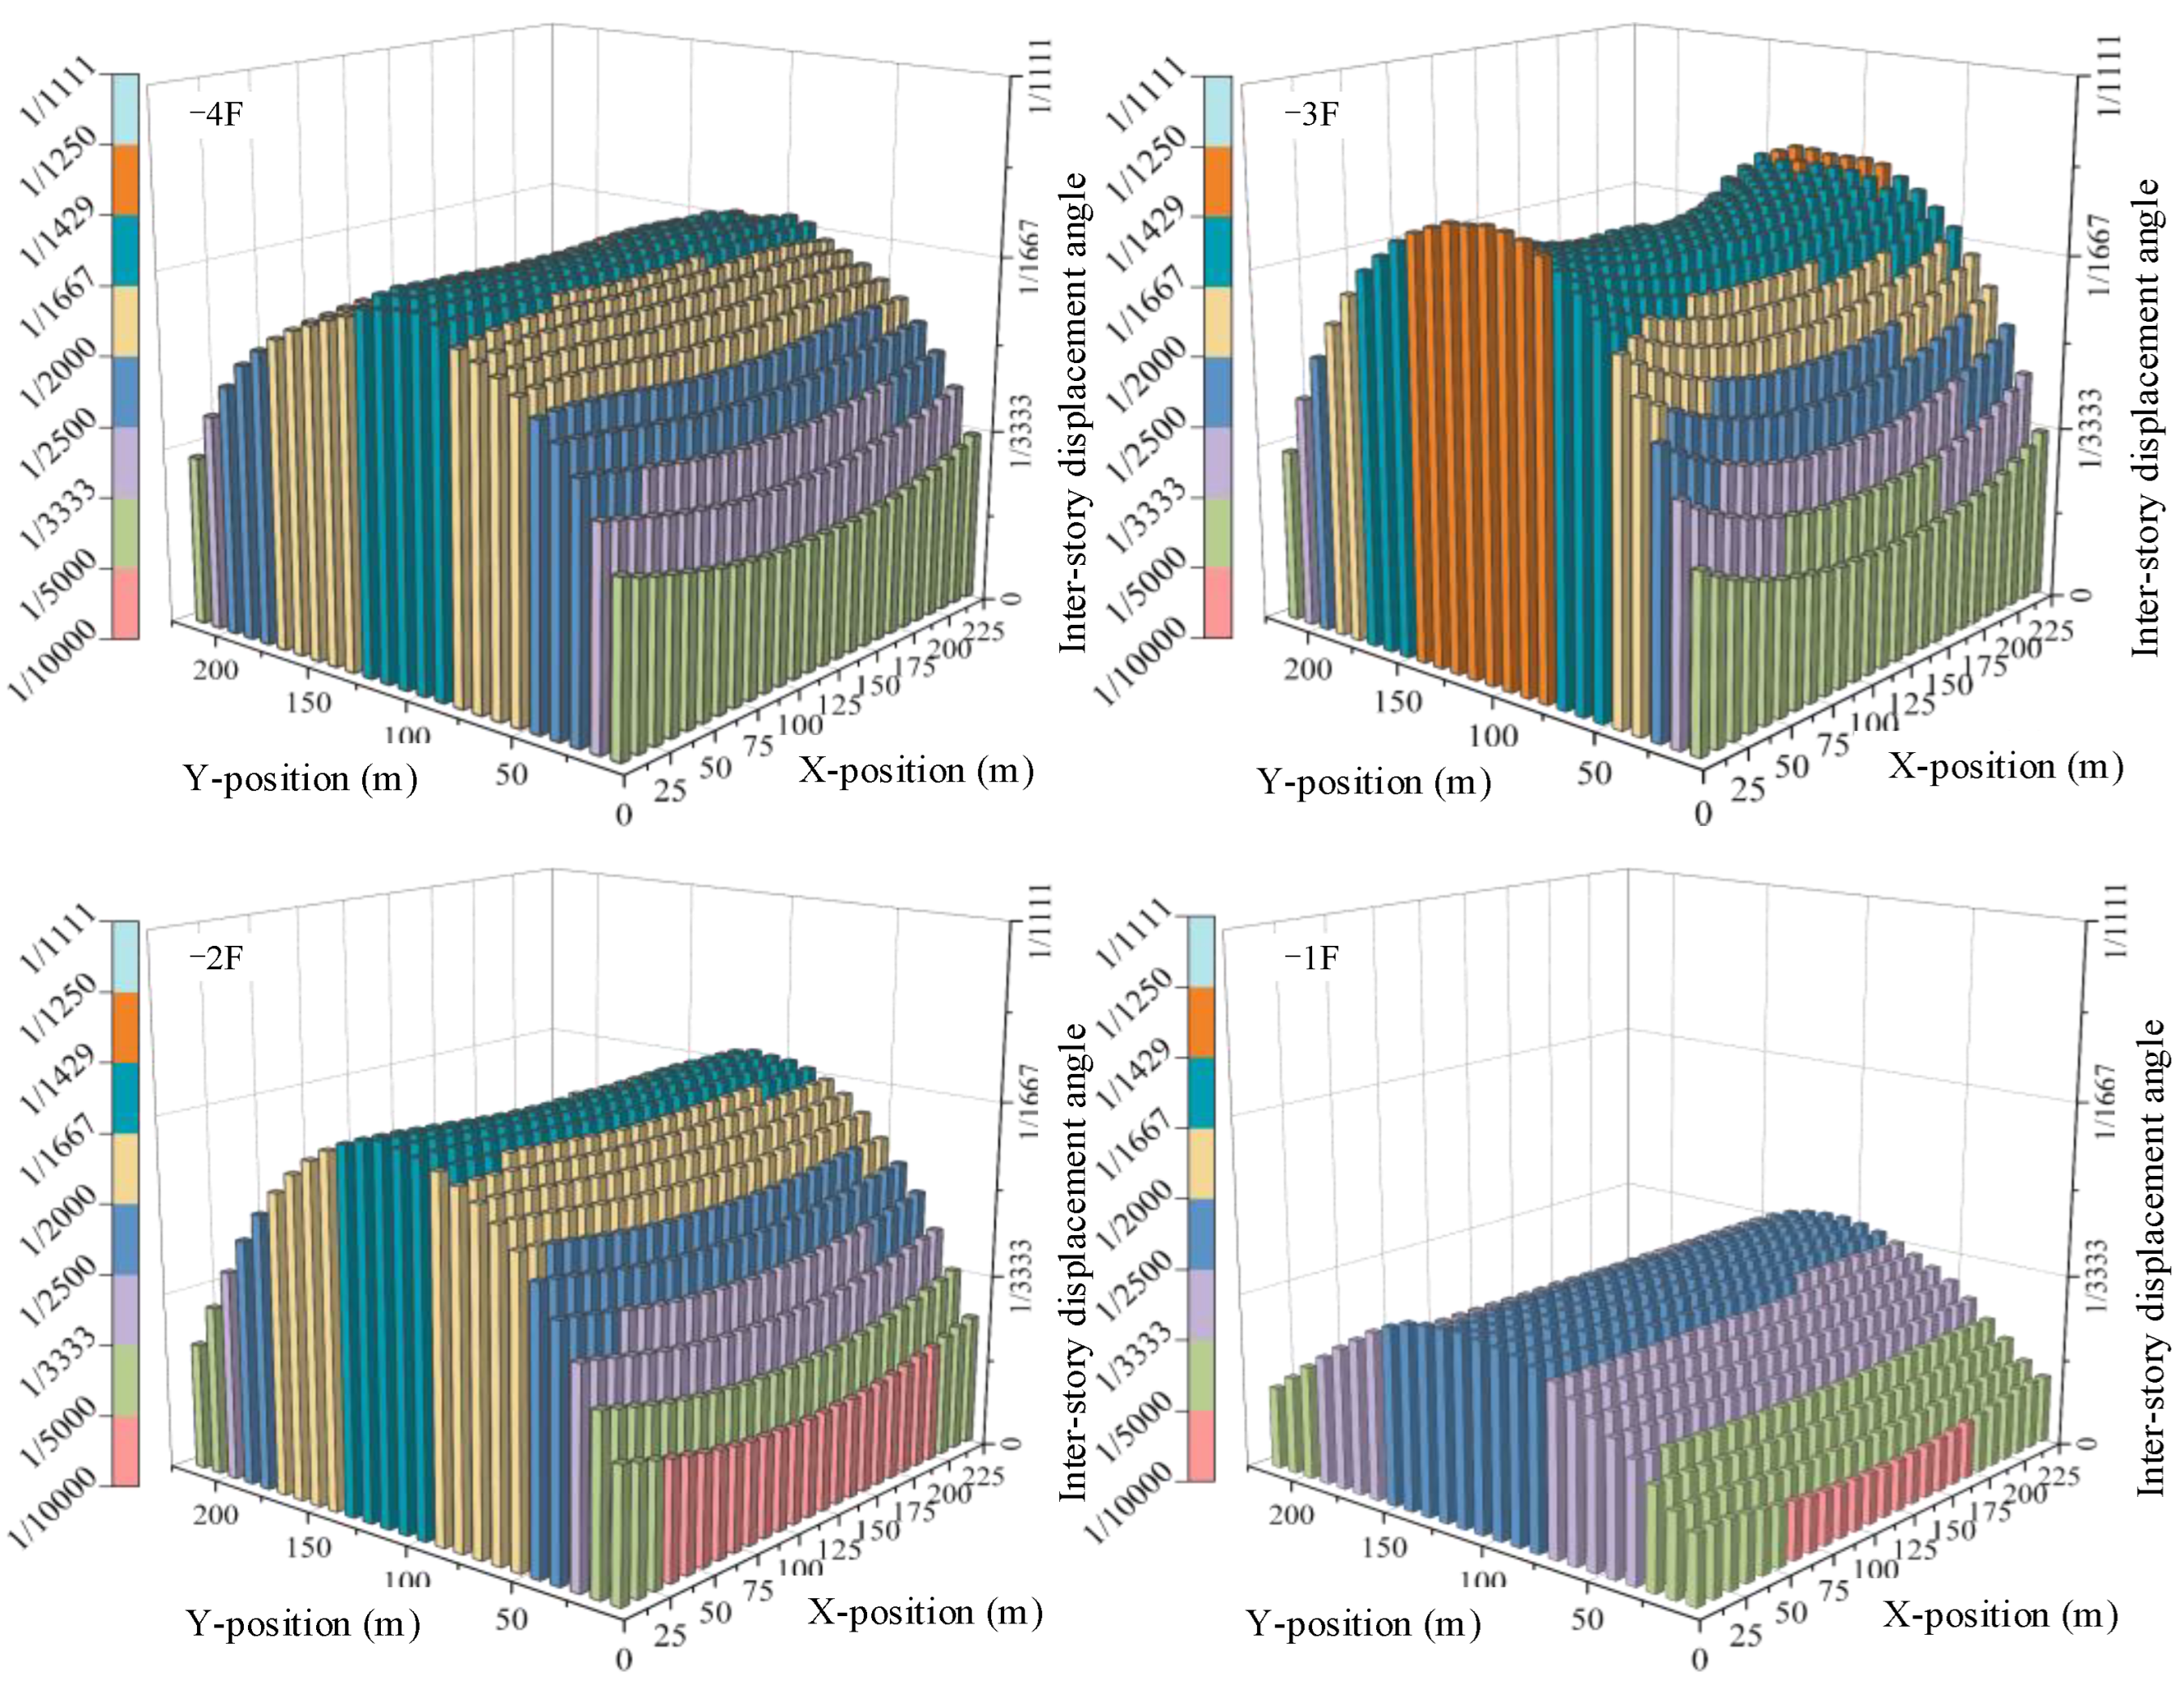
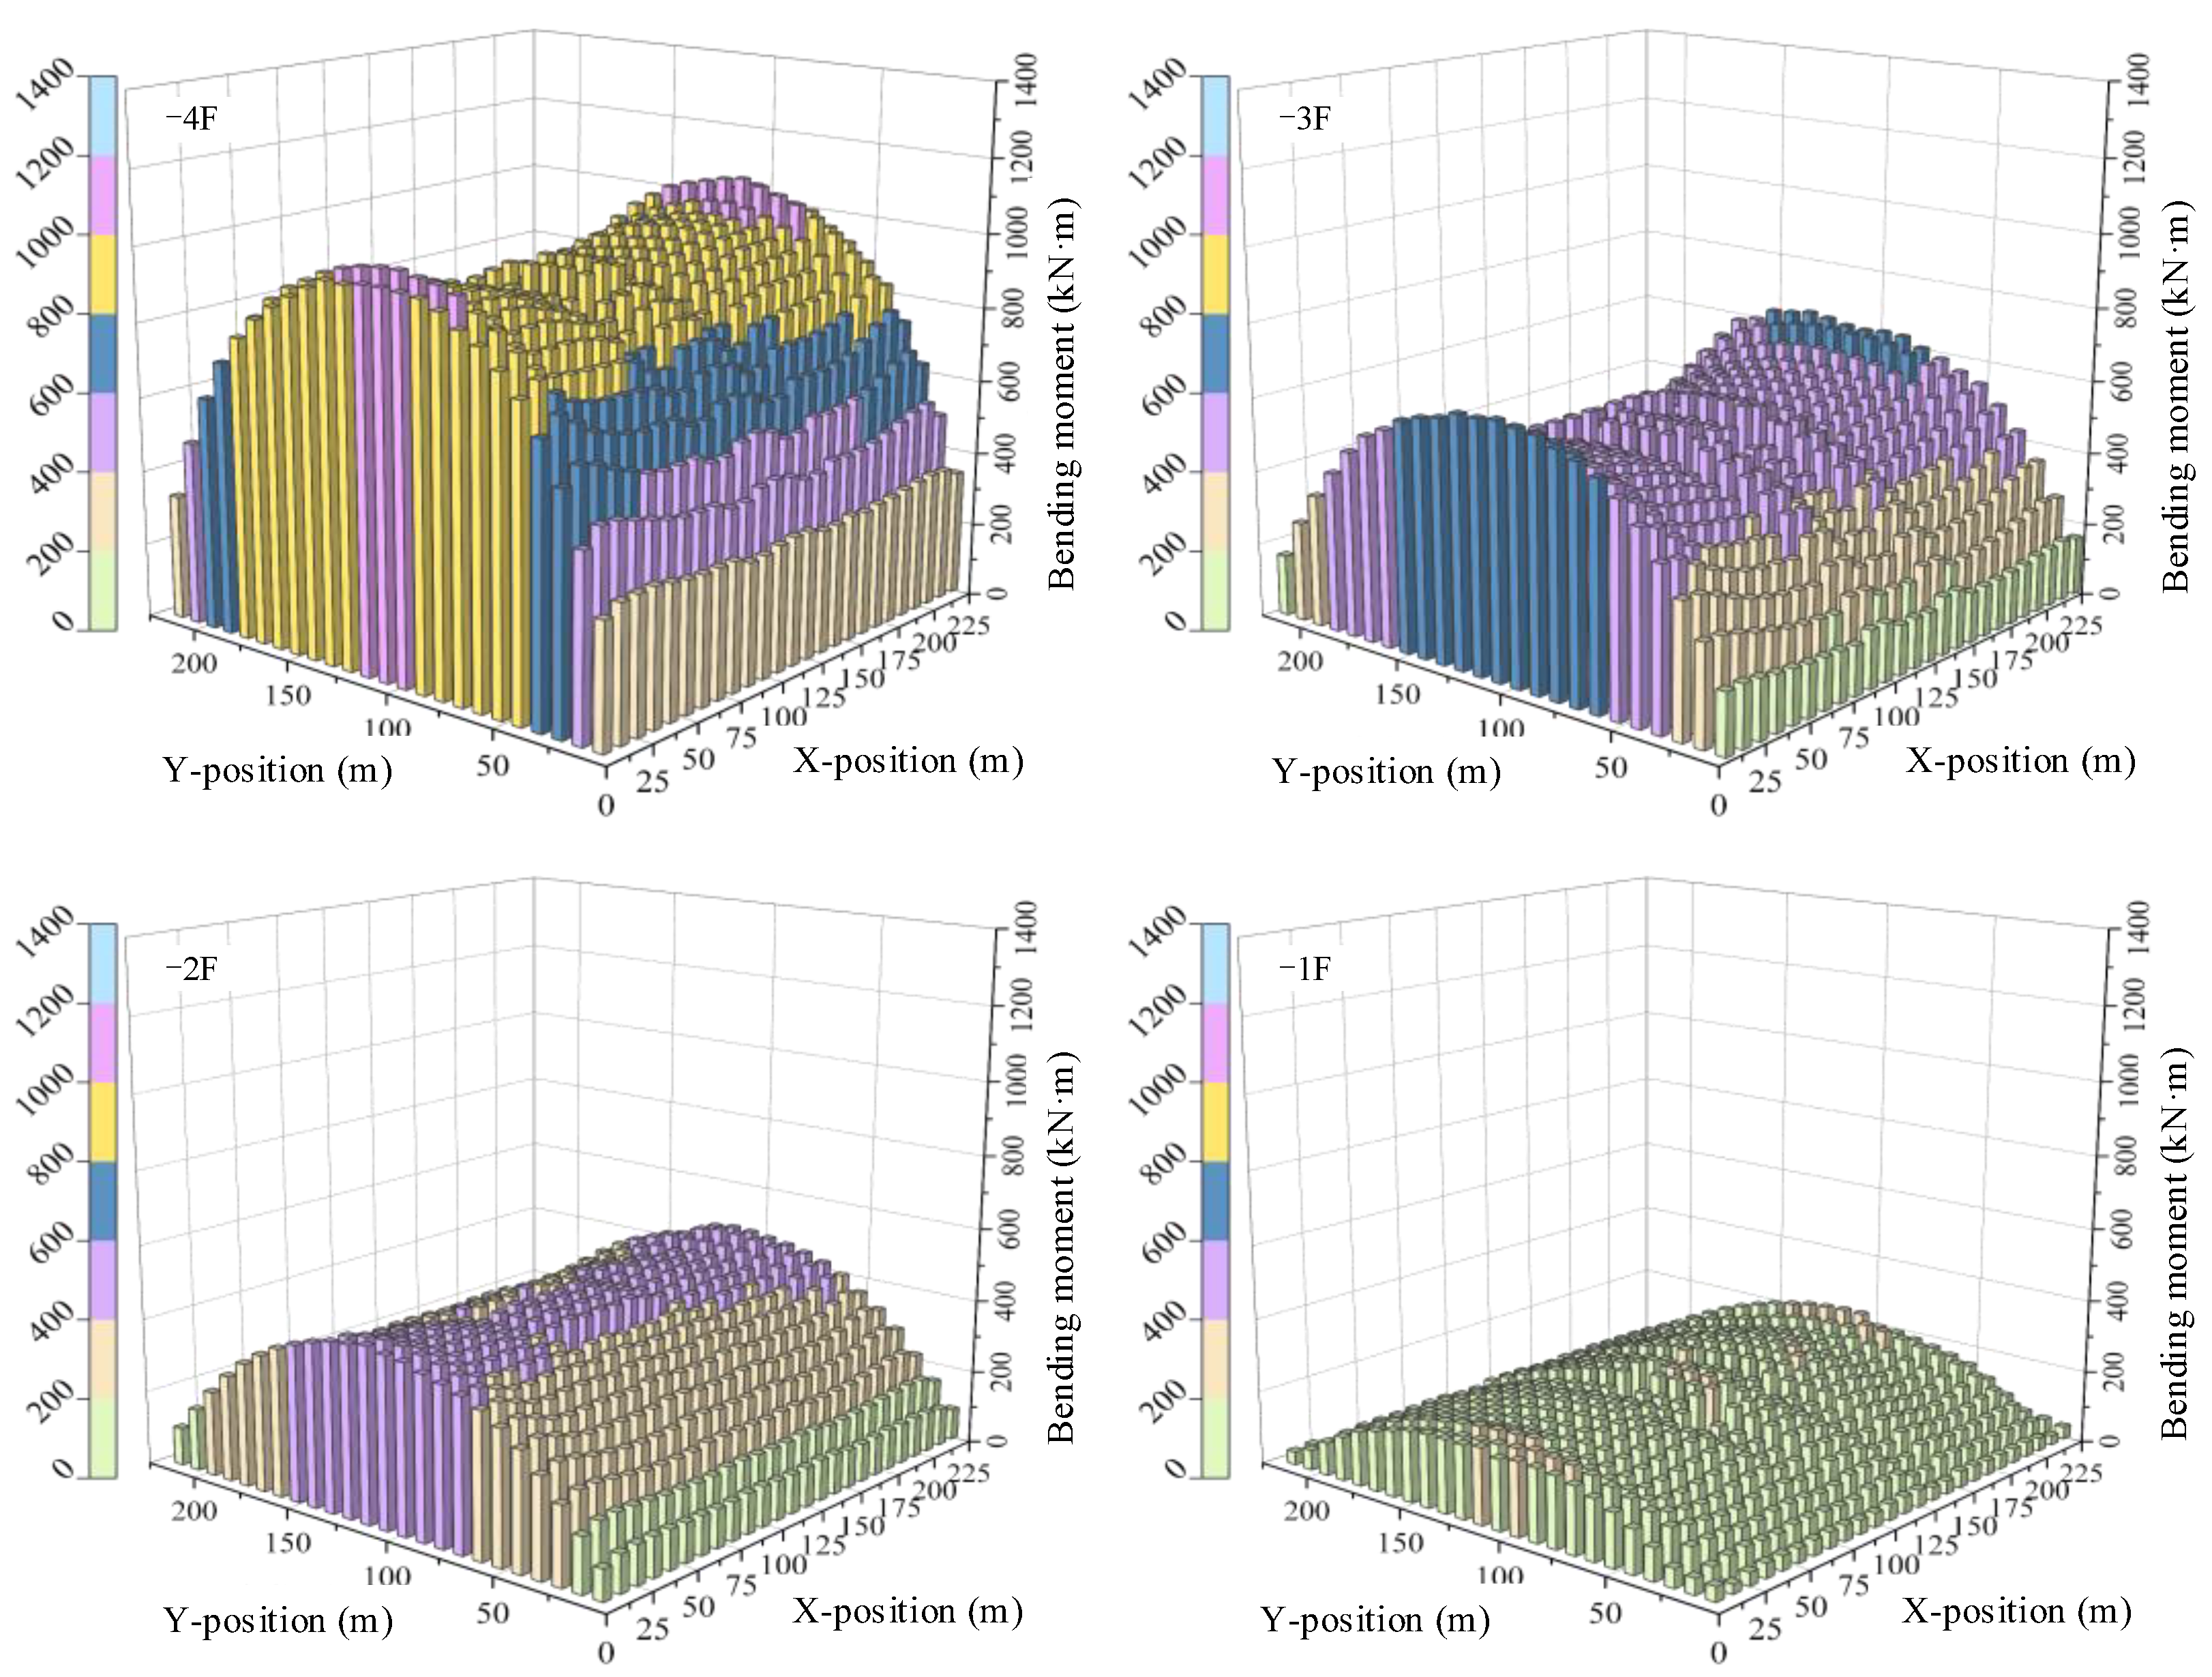
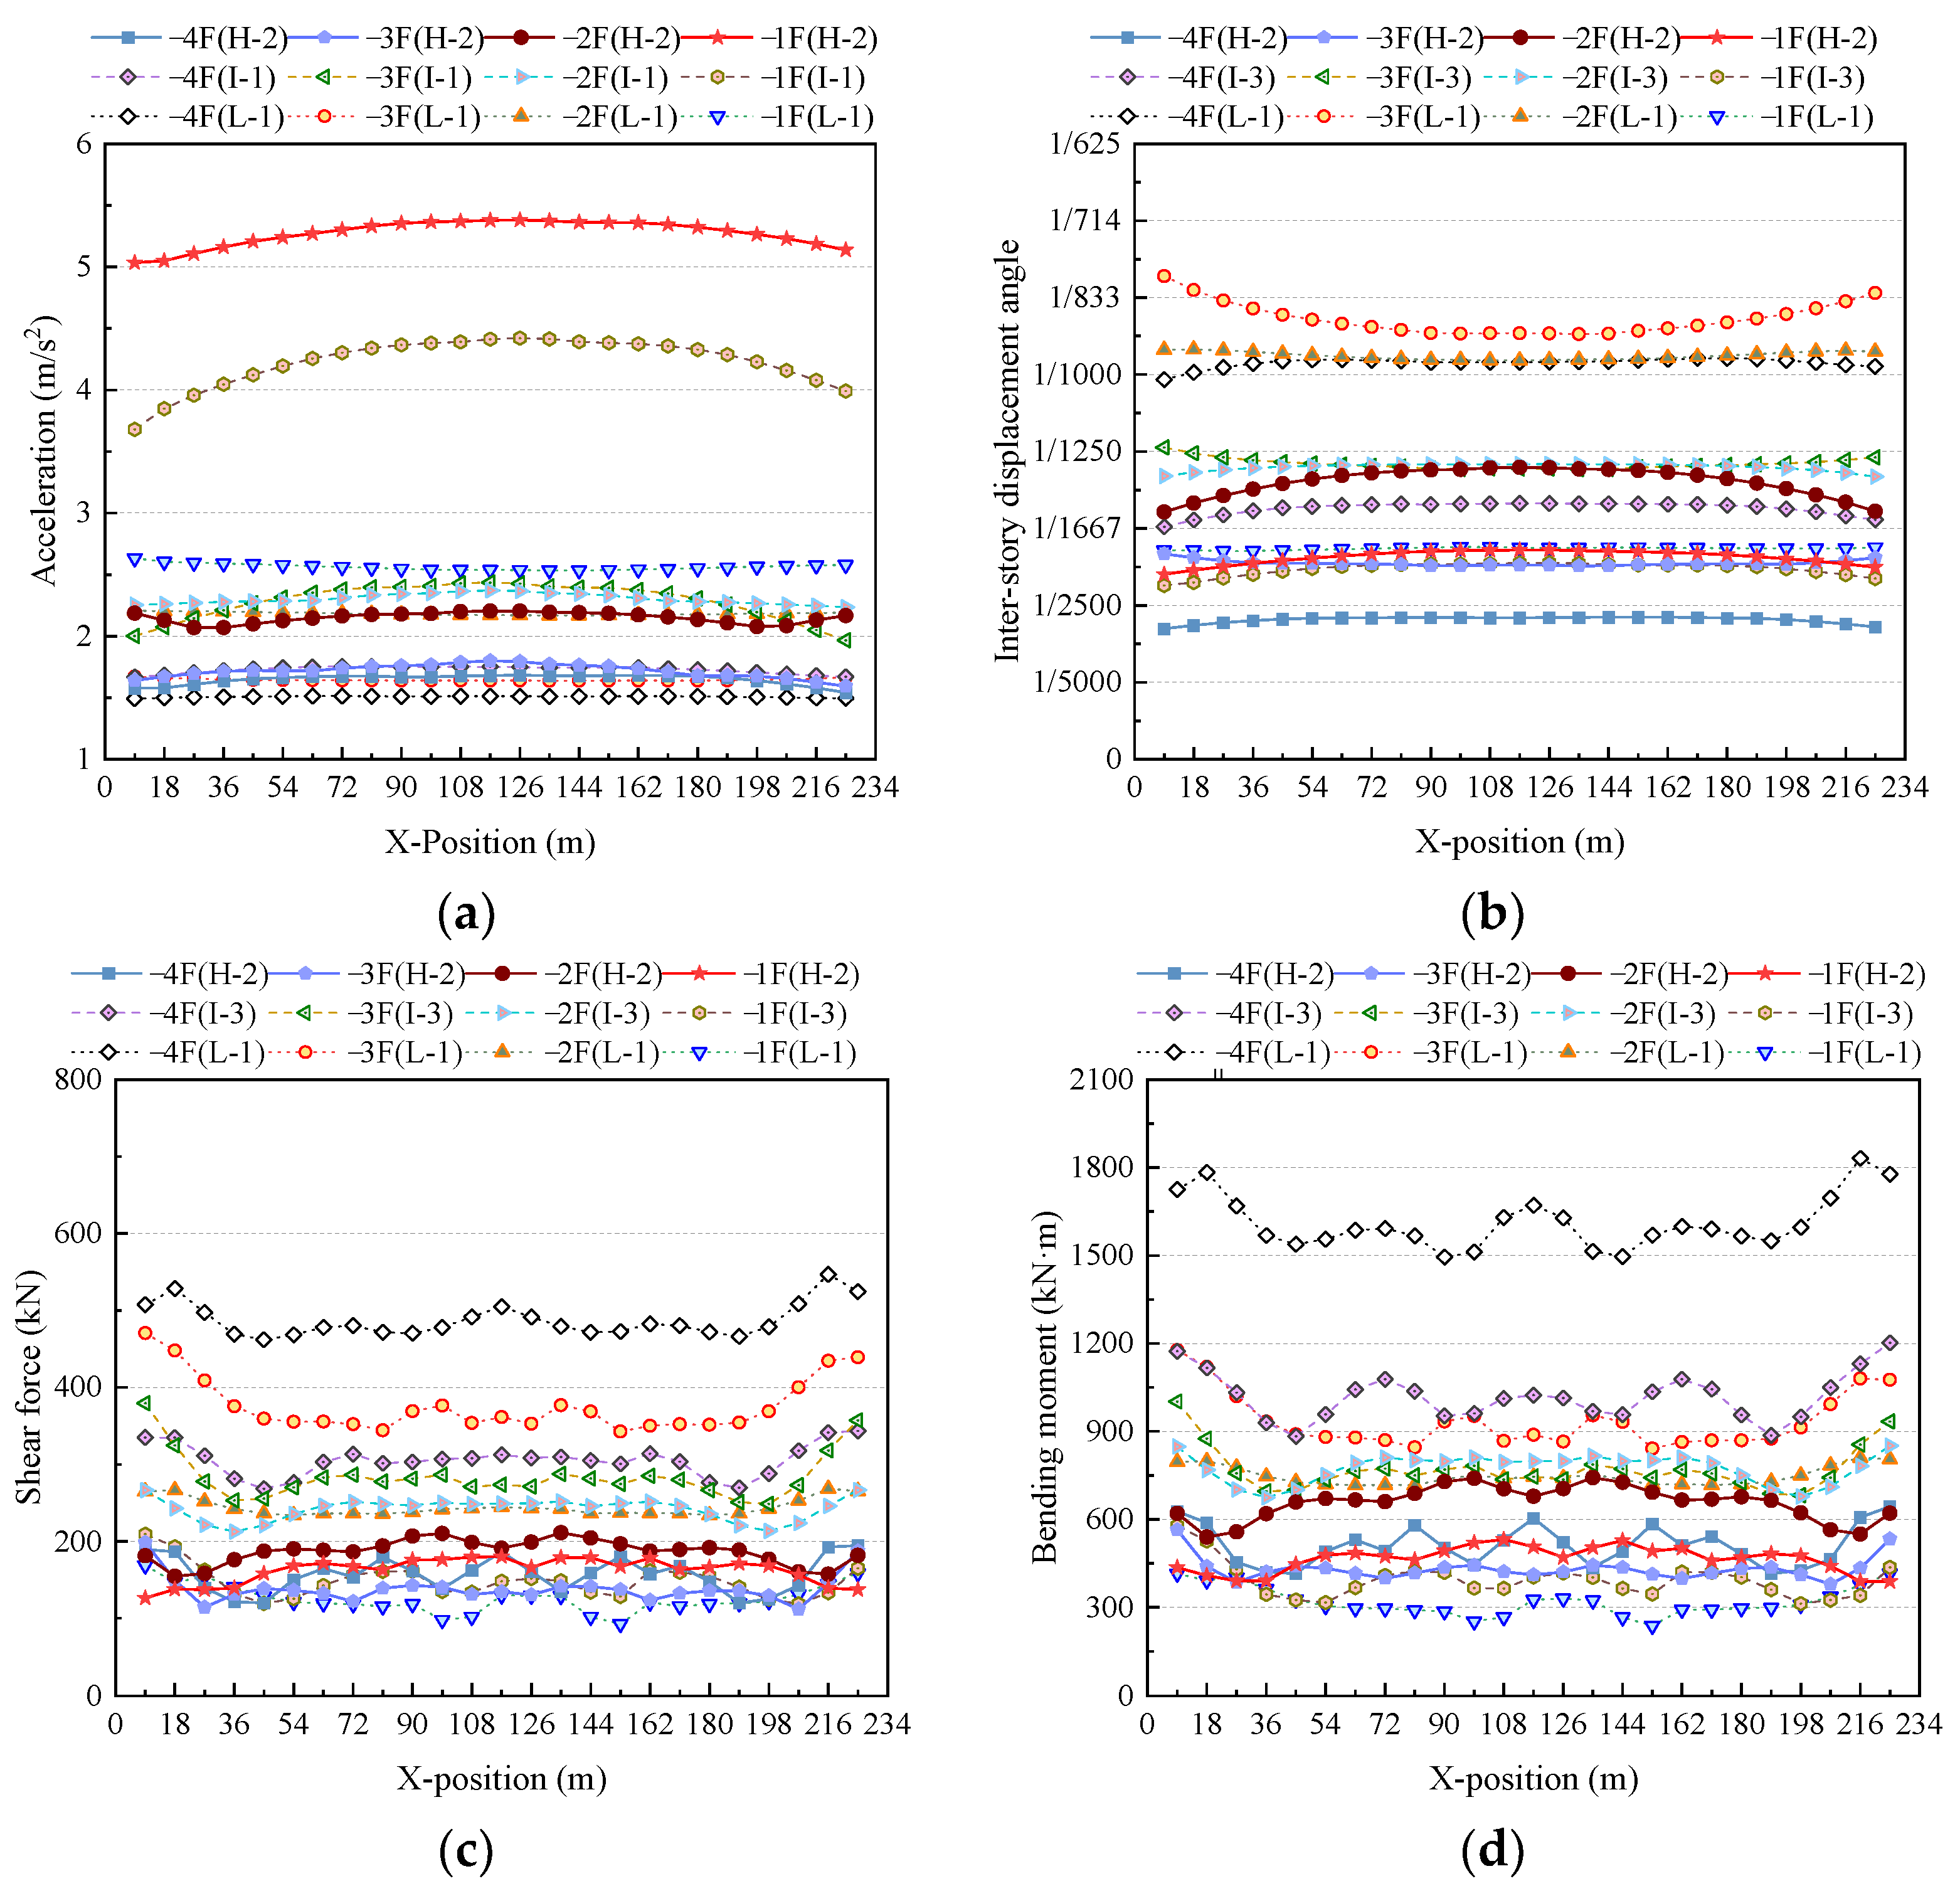
- Under the influence of X-directional seismic motion, the structural deformation and internal force in the Y-direction exhibit a distribution pattern of gradual increase from the outside to the inside. The large underground structure experiences non-uniform deformation at inner and outer locations, a manifestation of the inertia effect. The maximum values of structural internal forces are concentrated in the outermost two spans of the structural center section in the Y-direction and the middle of the bottom of the frame columns, revealing the intricate nature of the seismic response.
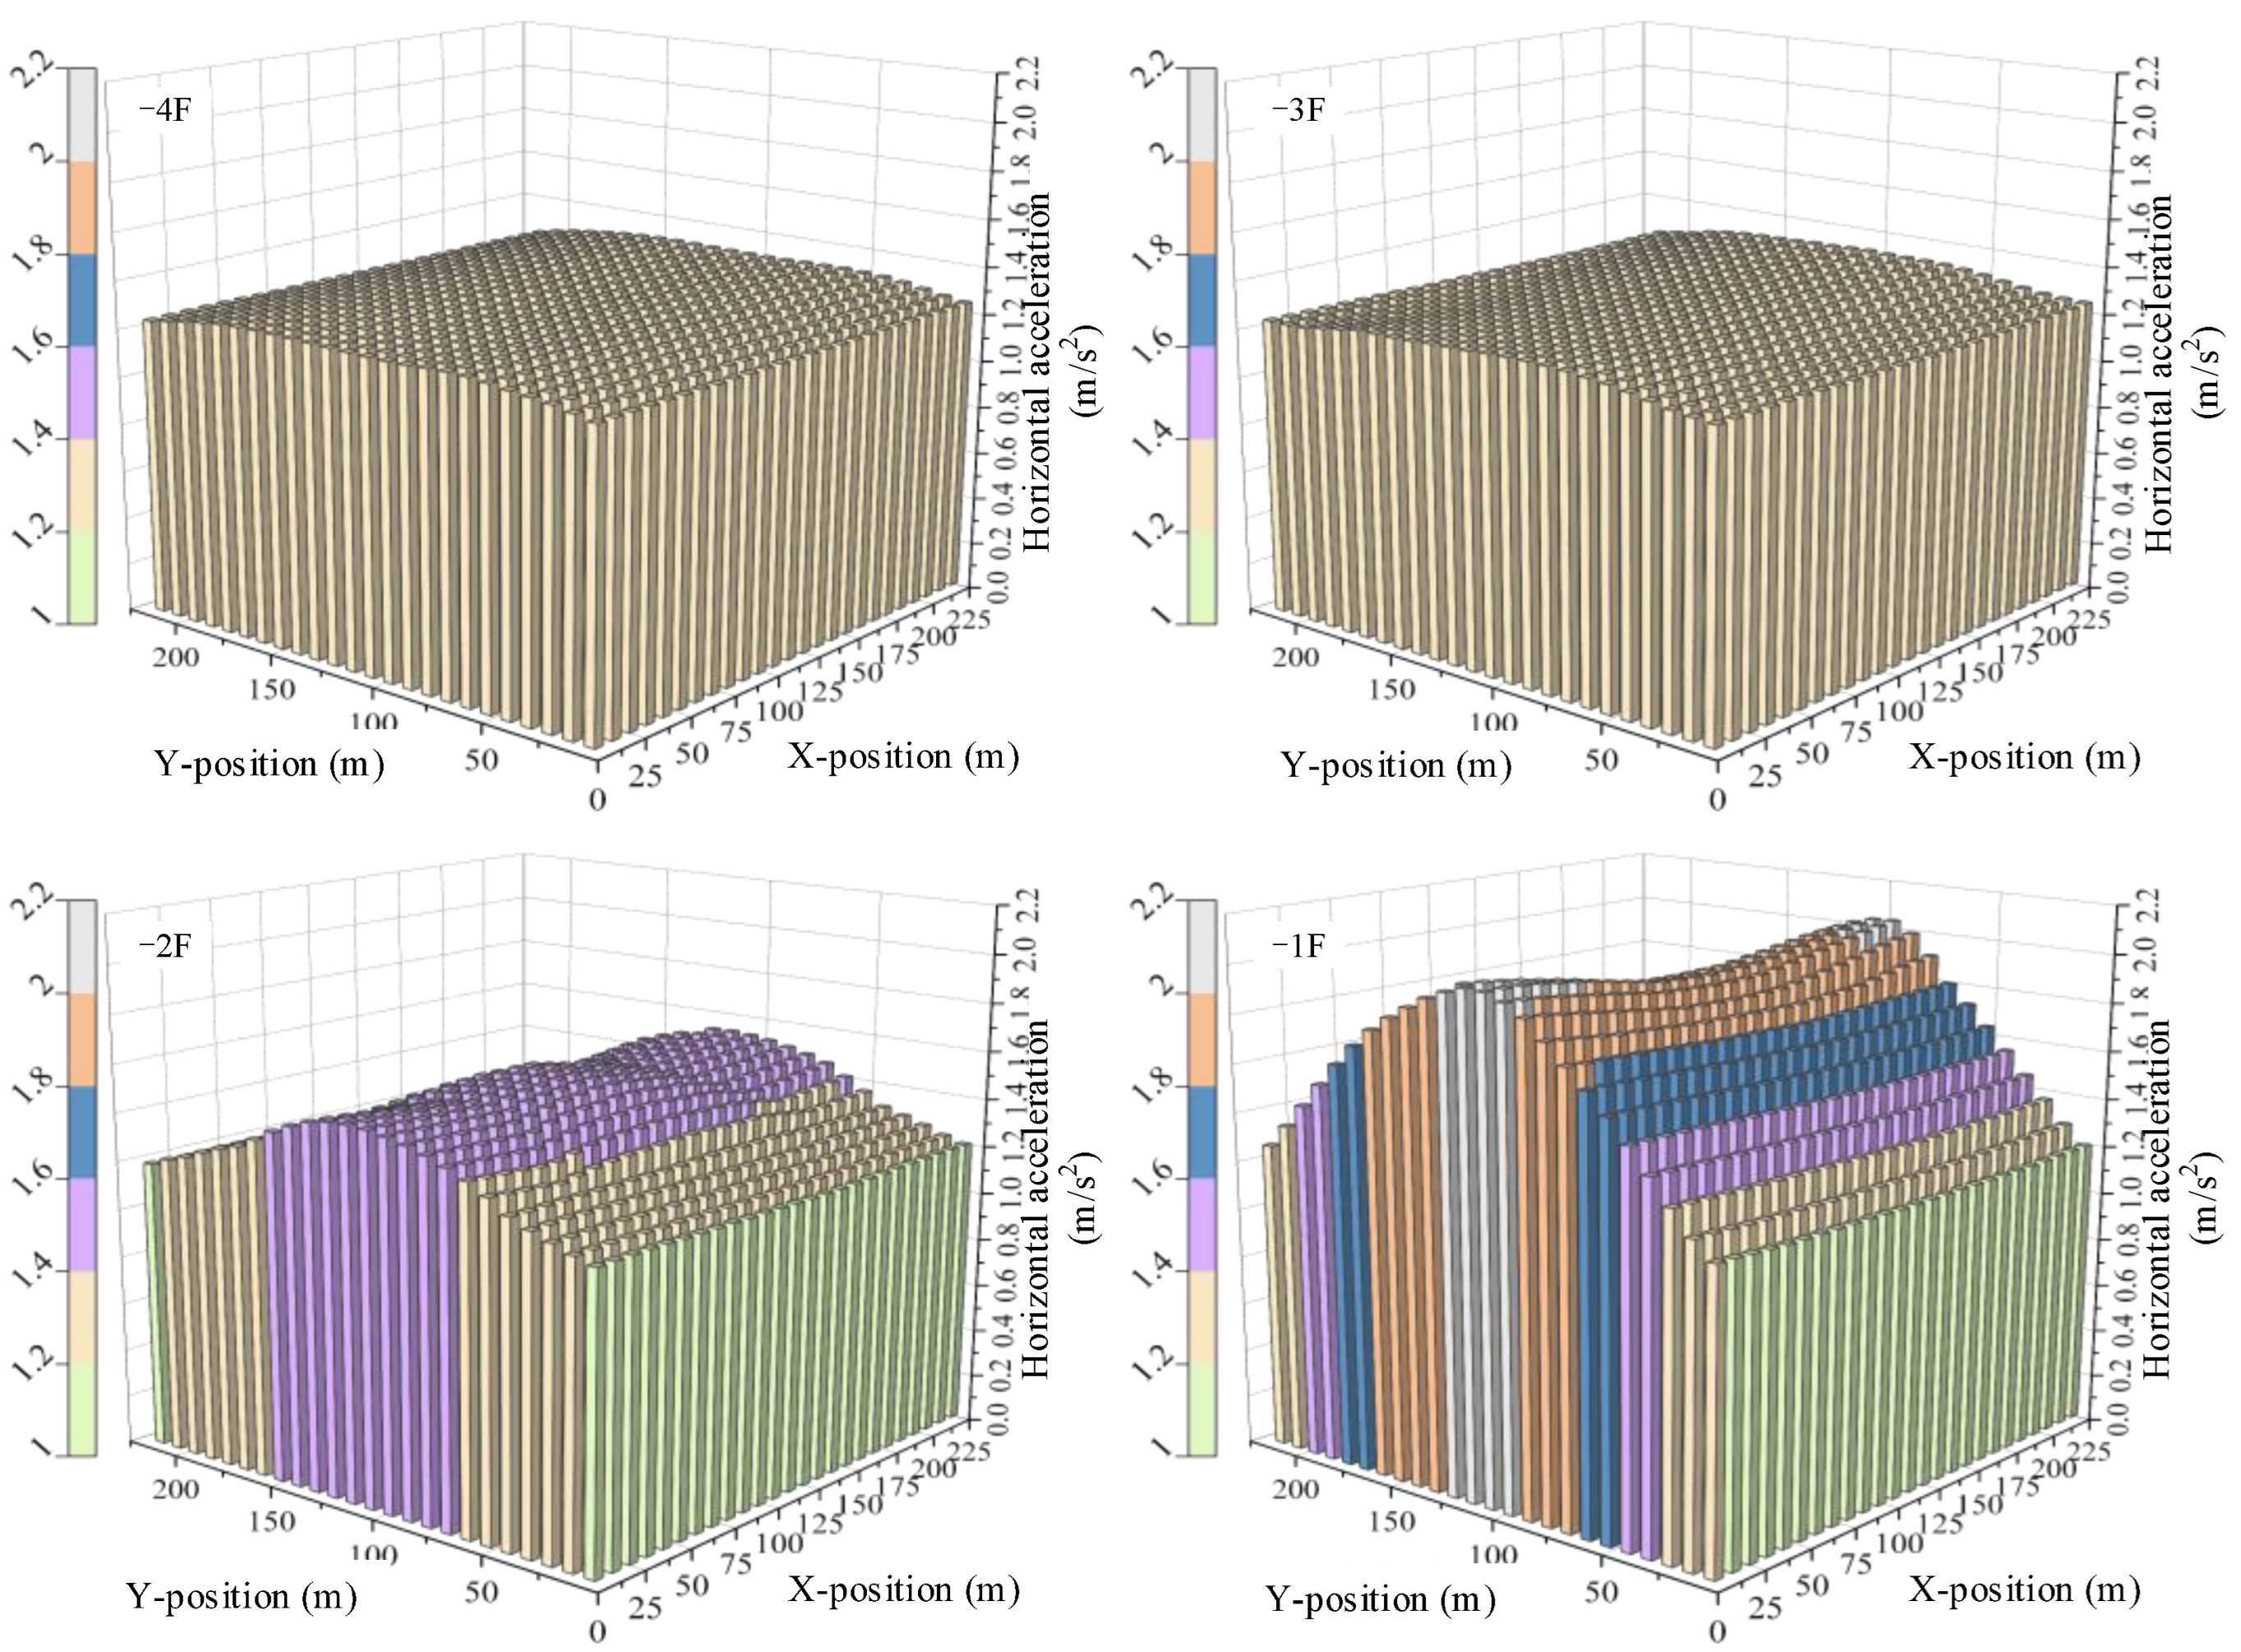
- The increased frequency of seismic motion causes an increase in the acceleration of large underground structures while decreasing their inter-story displacements. This is more pronounced in the interior of large underground structures. Low-frequency ground shaking induces the greatest structural deformations and internal forces. Under low-frequency seismic motions, the internal forces in the structure’s bottom layer are the largest, and those in the top layer are the smallest. However, high-frequency seismic motions increase the internal forces in the top layer of the structure.
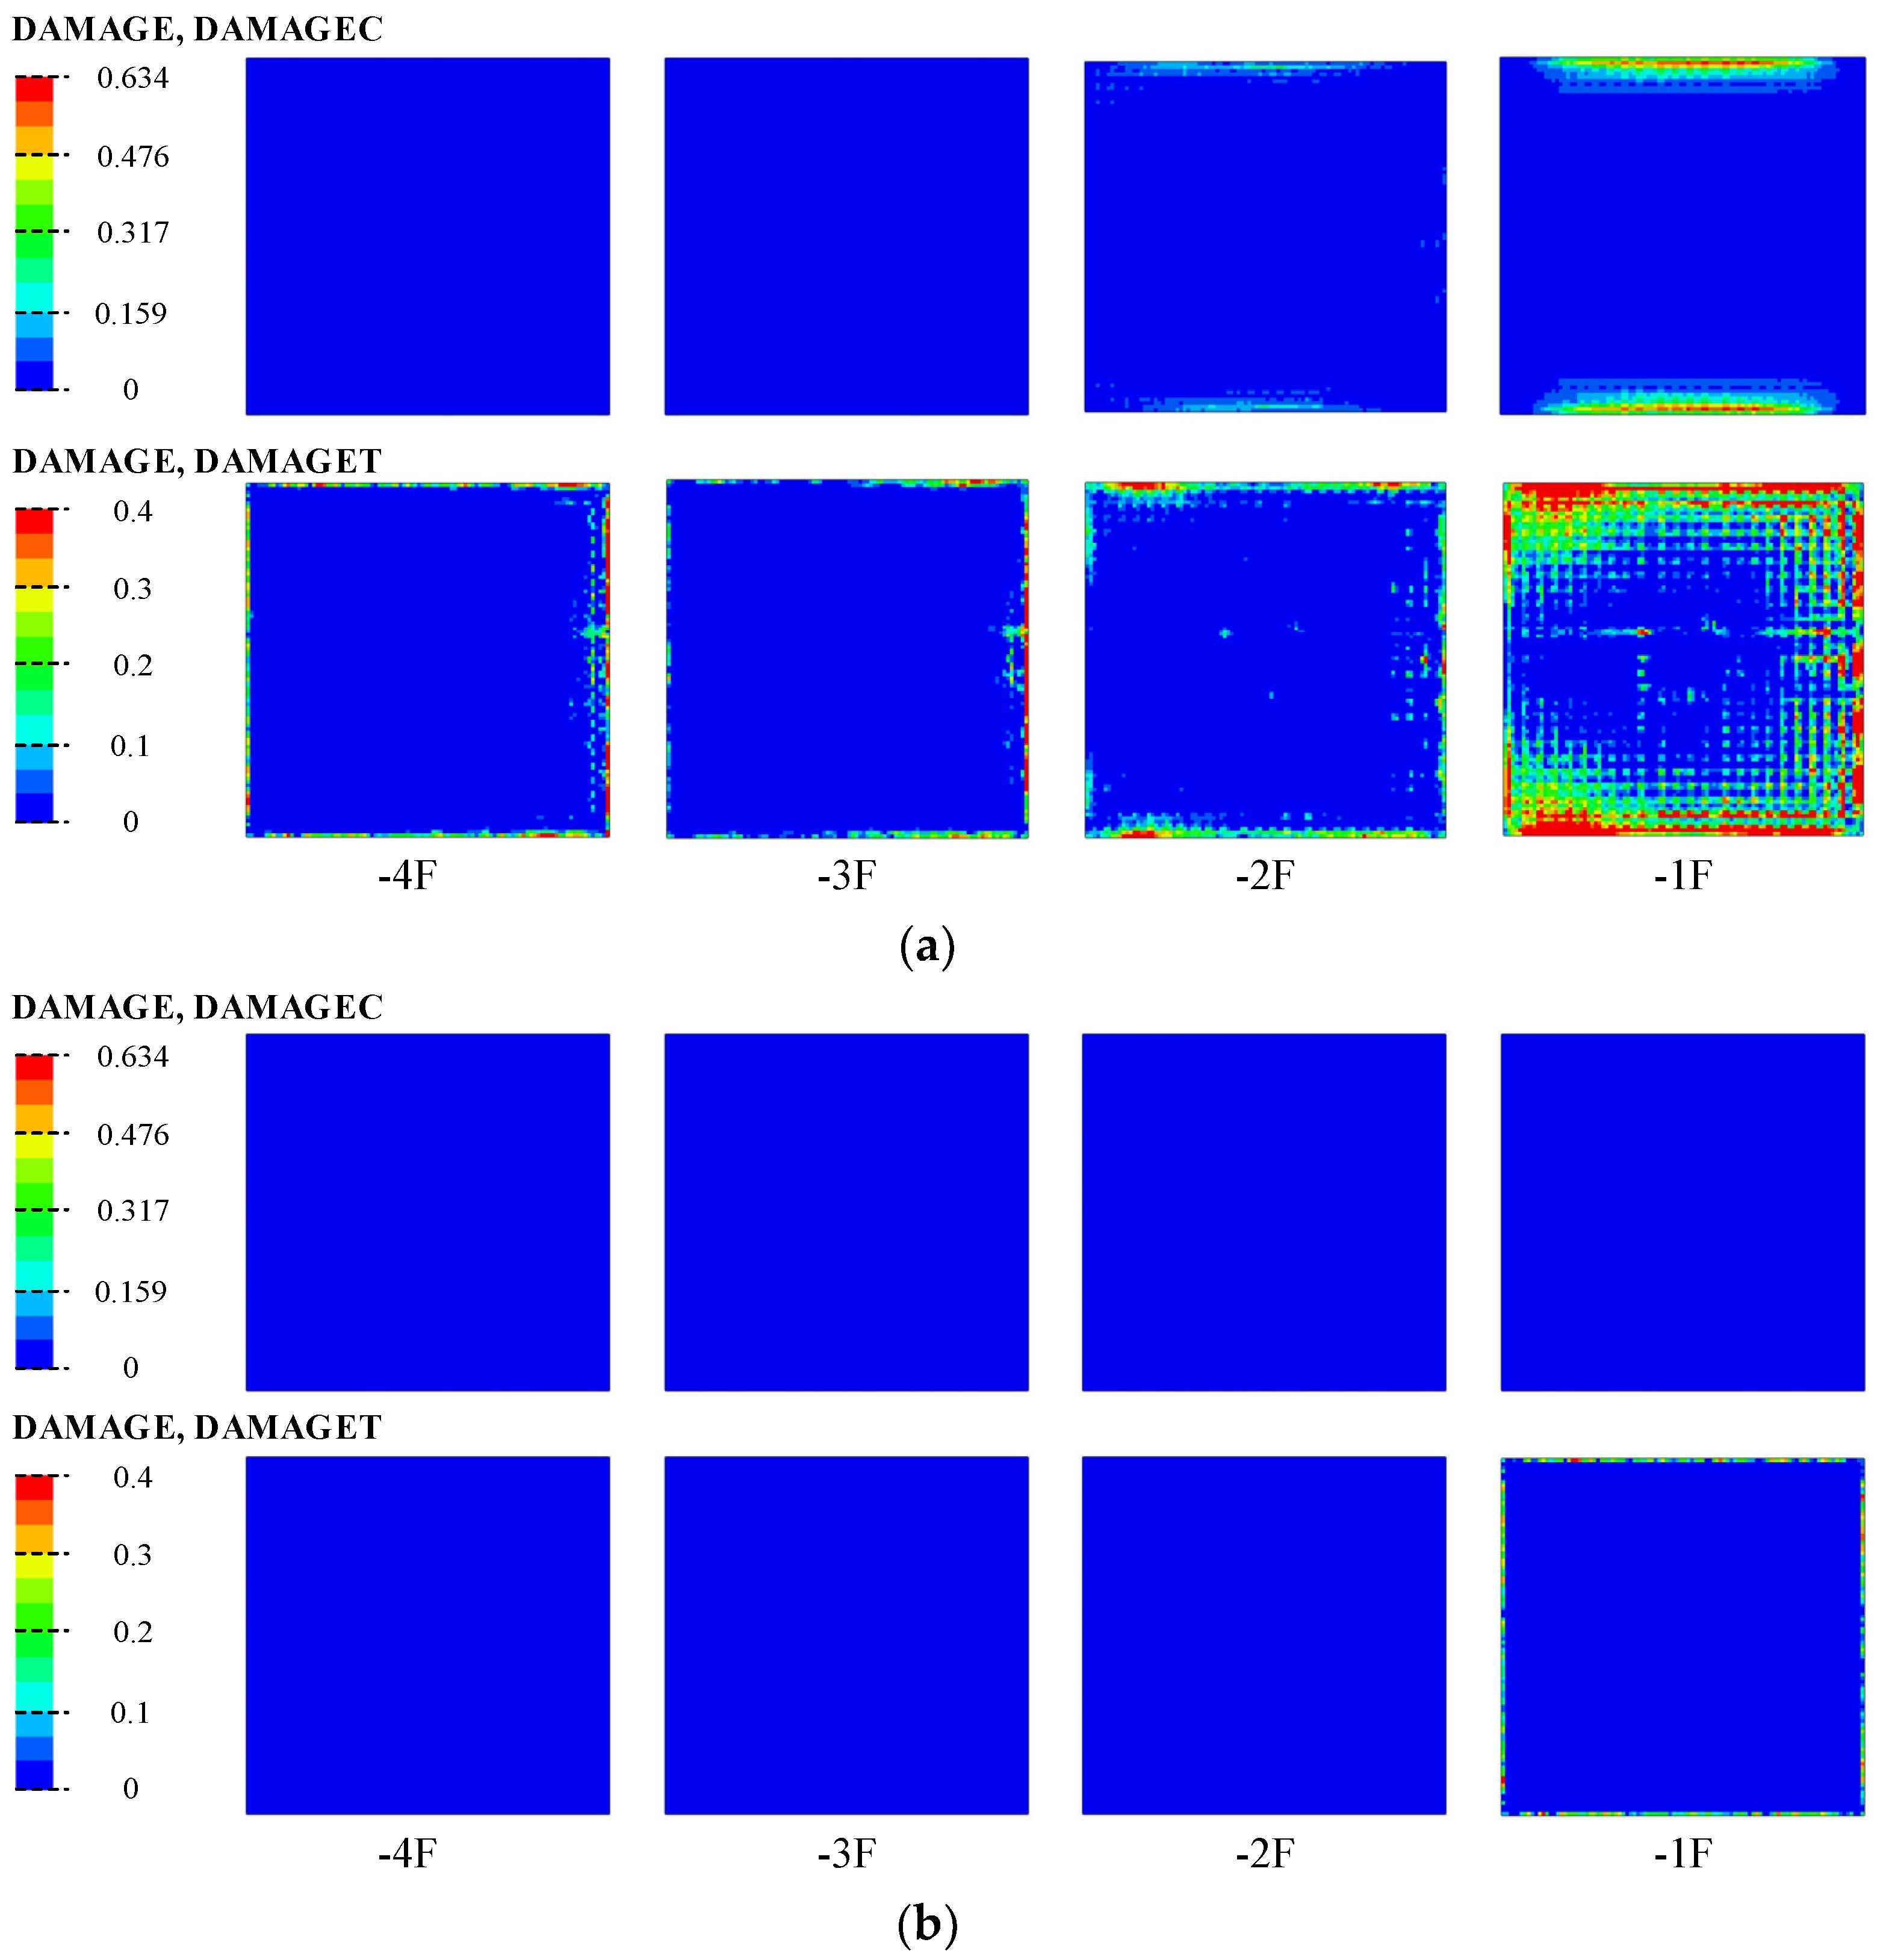
- The greatest damage to the structure occurs under XYZ seismic motions. The corners of the floor slabs near the soil layer show damage extending inward. Damage to the structural wall appears at the bottom of the wall on both sides of the corners.
Author Contributions
Funding
Institutional Review Board Statement
Informed Consent Statement
Data Availability Statement
Acknowledgments
Conflicts of Interest
References
- Iida, H.; Hiroto, T.; Yoshida, N.; Lwafuji, M. Damage to Daikai subway station. Soils Found 1996, 36, 283–300. [Google Scholar] [CrossRef]
- Wang, W.L.; Wang, T.T.; Su, J.J.; Lin, C.H.; Seng, C.R.; Huang, T.H. Assessment of damage in mountain tunnels due to the Taiwan Chi-Chi Earthquake. Tunn. Undergr. Space Technol. 2001, 16, 133–150. [Google Scholar] [CrossRef]
- Wang, X.W.; Chen, J.T.; Xiao, M. Seismic damage assessment and mechanism analysis of underground powerhouse of the Yingxiuwan Hydropower Station under the Wenchuan earthquake. Soil Dyn. Earthq. Eng. 2018, 113, 112–123. [Google Scholar] [CrossRef]
- Ma, C.; Lu, D.C.; Du, X.L.; Qi, C.Z. Effect of buried depth on seismic response of rectangular underground structures considering the influence of ground loss. Soil Dyn. Earthq. Eng. 2018, 106, 278–297. [Google Scholar] [CrossRef]
- Du, X.L.; Wang, G.; Lu, D.C. Earthquake Damage Mechanism Analysis of Dakai Metro Station by Kobe Earthquake. J. Disaster Prev. Mitig. Eng. 2016, 36, 165–171. [Google Scholar]
- Du, X.L.; Ma, C.; Lu, D.C.; Xu, C.X.; Xu, Z.G. Collapse simulation and failure mechanism analysis of the Daikai subway station under seismic loads. China Civ. Eng. J. 2017, 50, 53–62. [Google Scholar]
- Du, X.L.; Kang, K.L.; Xu, Z.G.; Li, Y.; Xu, C.X. Main characteristics and rules of seismic response for underground structures. China Civ. Eng. J. 2018, 51, 11–21. [Google Scholar]
- Xu, Z.G.; Du, X.L.; Xu, C.S.; Hao, H.; Bi, K.M.; Jiang, J.W. Numerical research on seismic response characteristics of shallow buried rectangular underground structure. Soil Dyn. Earthq. Eng. 2019, 116, 242–252. [Google Scholar] [CrossRef]
- He, W.; Chen, J.Y. Adaptive active vibration control for frictional structures based on LuGre model. J. Vib. Shock. 2011, 30, 103–107. [Google Scholar]
- Zhuang, H.Y.; Hu, Z.H.; Chen, G.X. Numerical modeling on the seismic responses of a large underground structure in soft ground. J. Vibroeng. 2015, 17, 802–815. [Google Scholar]
- Gu, Y.; Zhong, H.; Zhuo, W.D. Analysis of dynamic interaction between soil and large subway station structure under seismic excitation based on 3D model. Chin. J. Rock Mech. Eng. 2013, 32, 2290–2299. [Google Scholar]
- Wang, G.B.; Yuan, M.Z.; Ma, X.F.; Wu, J. Numerical study on the seismic response of the underground subway station-surrounding soil mass-ground adjacent building system. Front. Struct. Civ. Engine 2017, 11, 424–435. [Google Scholar] [CrossRef]
- Tao, L.J.; Liu, C.X.; Bian, J.; Wu, B.L.; Li, J.D.; Xu, Y.J. Seismic response of subway station with large span and y shaped column. Chin. J. Theor. Appl. Mech. 2017, 49, 55–64. [Google Scholar]
- Zhang, J.K.; Yu, Z.Y.; Zhang, H.R.; Qiu, Y.J. Damage and failure of underground subway stations under different soil constraint conditions. PLoS ONE 2023, 18, e0284074. [Google Scholar] [CrossRef] [PubMed]
- Li, W.T.; Chen, Q.J. Effect of vertical ground motions and overburden depth on the seismic responses of large underground structures. Eng. Struct. 2020, 205, 110073. [Google Scholar] [CrossRef]
- Zhang, Z.H.; Li, Y.; Xu, C.S.; Du, X.L.; Dou, P.F.; Yan, G.Y. Study on seismic failure mechanism of shallow buried underground frame structures based on dynamic centrifuge tests. Soil Dyn. Earthq. Eng. 2021, 150, 106938. [Google Scholar] [CrossRef]
- Zhuang, H.Y.; Zhao, C.; Chen, S.; Fu, J.S.; Zhao, K.; Chen, G.X. Seismic performance of underground subway station with sliding between column and longitudinal beam. Tunn. Undergr. Space Technol. 2020, 102, 103439. [Google Scholar] [CrossRef]
- Chen, Z.Y.; Huang, P.F.; Chen, W. Seismic response characteristics of multi-story subway station through shaking table test. Adv. Struct. Eng. 2021, 24, 2185–2200. [Google Scholar] [CrossRef]
- Qiu, D.P.; Chen, J.Y.; Cao, X.Y. Study on the seismic control measure of the underground large-scale frame structure. Struct. 2022, 40, 328–343. [Google Scholar] [CrossRef]
- Qiu, D.P.; Ren, W.J.; Chen, J.Y. The multi-dimensional fragility analysis of the underground large-scale frame structure based on the internal relationships of different seismic performance evaluating indexes. Tunn. Undergr. Space Technol. 2023, 136, 105093. [Google Scholar] [CrossRef]
- Chen, X.; Xiong, Z.M.; Zhuge, Y.; Liu, Y. Numerical analysis on the seismic performance of subway station in ground crack area. Tunn. Undergr. Space Technol. 2023, 134, 105012. [Google Scholar] [CrossRef]
- Du, X.L.; Zhao, M.; Wang, J.T. A stress artificial boundary in FEA for near-field wave problem. Chin. J. Theor. Appl. Mech. 2006, 38, 49–56. [Google Scholar]
- Zhao, M.; Yin, H.Q.; Du, X.L.; Liu, J.B.; Liang, L.Y. 1D finite element artificial boundary method for layered half space site response from obliquely incident earthquake. Earthq Struct. 2015, 9, 173–194. [Google Scholar] [CrossRef]
- Dell’Accio, F.; Di Tommaso, F.; Guessab, A.; Nudo, F. On the improvement of the triangular Shepard method by non-conformal polynomial elements. Appl. Numer. Math. 2023, 184, 446–460. [Google Scholar] [CrossRef]
- Khoei, A.R.; Nikbakht, M. An enriched finite element algorithm for numerical computation of contact friction problems. Int. J. Mech. Sci. 2007, 49, 183–199. [Google Scholar] [CrossRef]
- Chessa, J.; Wang, H.; Belytschko, T. On the construction of blending elements for local partition of unity enriched finite elements. Int. J. Numer. Meth. Engng. 2003, 57, 1015–1038. [Google Scholar] [CrossRef]
- Cao, S.T.; Lu, D.C.; Du, X.L.; Zhao, M.; Cheng, X.L. Development on software platform for nonlinear dynamic analysis of underground structure based on gpu parallel computing. Eng. Mech. 2019, 36, 53–86. [Google Scholar]
- Guirguis, J.E.B.; Mehanny, S. Evaluating code criteria for regular seismic behavior of continuous concrete box girder bridges with unequal height piers. J. Bridge Eng. 2012, 18, 486–498. [Google Scholar] [CrossRef]
- Hu, S.; Zhu, S. Life-cycle benefits estimation for hybrid seismic-resistant self-centering braced frames. Earthq. Eng. Struct. Dyn. 2023, 52, 3097–3119. [Google Scholar] [CrossRef]
- Hu, S.; Koetaka, Y.; Chen, Z.P.; Zhu, S.; Alam, M.S. Hybrid self-centering braces with NiTi-SMA U-shaped and frequency-dependent viscoelastic dampers for structural and nonstructural damage control. Eng. Struct. 2024, 308, 117920. [Google Scholar] [CrossRef]
- Hu, S.; Zhou, X.; Ke, K.; Alam, M.S.; Shi, T. Post-earthquake repairability-based methodology for enhancing steel MRFs. Eng. Struct. 2024, 308, 117898. [Google Scholar] [CrossRef]
- Wang, M.; Sun, F.F.; Jin, H.J. Performance evaluation of existing isolated buildings with supplemental passive pseudo-negative stiffness devices. Eng. Struct. 2018, 177, 30–46. [Google Scholar] [CrossRef]
- Wang, M.; Du, X.L.; Sun, F.F.; Nagarajaiah, S.; Li, Y.W. Fragility analysis and inelastic seismic performance of steel braced-core-tube frame outrigger tall buildings with passive adaptive negative stiffness damped outrigger. J. Build. Eng. 2022, 52, 104428. [Google Scholar] [CrossRef]
- Ozturk, K.F.; Cakir, T.; Araz, O. A comparative study to determine seismic response of the box culvert wing wall under influence of soil-structure interaction considering different ground motions. Soil Dyn. Earthq. Eng. 2022, 162, 107452. [Google Scholar] [CrossRef]
- Ozturk, K.F.; Cakir, T.; Araz, O. Influences of wall configurations on earthquake behavior of cantilever retaining walls considering soil-structure interaction effects. J. Earthq. Tsunami 2023, 17, 2250021. [Google Scholar] [CrossRef]
- Kianoush, M.R.; Ghaemmaghami, A.R. The effect of earthquake frequency content on the seismic behavior of concrete rectangular liquid tanks using the finite element method incorporating soil-structure interaction. Eng. Struct. 2011, 33, 2186–2200. [Google Scholar] [CrossRef]
- Hu, S.; Wang, W.; Qu, B. Seismic evaluation of low-rise steel building frames with self-centering energy-absorbing rigid cores designed using a force-based approach. Eng. Struct. 2020, 204, 110038. [Google Scholar] [CrossRef]
- Hu, S.; Wang, W.; Qu, B. Seismic economic losses in mid-rise steel buildings with conventional and emerging lateral force resisting systems. Eng. Struct. 2020, 204, 110021. [Google Scholar] [CrossRef]
- Eppelbaum, L.V.; Ezersky, M.G.; Al-Zoubi, A.S.; Goldshmidt, V.I.; Legchenko, A. Study of the factors affecting the karst volume assessment in the Dead Sea sinkhole problem using microgravity field analysis and 3D modeling. Adv. Geosci. 2008, 19, 97–115. [Google Scholar] [CrossRef]
- Eppelbaum, L.V. Review of environmental and geological microgravity applications and feasibility of their implementation at archaeological sites in Israel. Int. J. Geophys. 2011, 2011, 927080. [Google Scholar] [CrossRef]


| Material | Density ρ1 (kg/m3) | Elastic Modulus E (GPa) | Poisson’s Ratio μ | Dilation Angle Ψ (°) | Tensile Yield Stress ft (MPa) | Uniaxial Compressive Strength fc (MPa) |
|---|---|---|---|---|---|---|
| C30 | 2600 | 30 | 0.2 | 15 | 2.01 | 20.1 |
| C35 | 2600 | 31.5 | 0.2 | 15 | 2.2 | 23.4 |
| C40 | 2600 | 32.5 | 0.2 | 15 | 2.39 | 26.8 |
| C60 | 2600 | 36 | 0.2 | 15 | 2.85 | 38.5 |
| HRB400 | 7800 | 200 | 0.25 | - | 400 | 400 |
| Q345 | 7800 | 206 | 0.25 | - | 345 | 345 |
| Component | Floor | Section (mm) | Material | |
|---|---|---|---|---|
| Profile | d × t/a × b | |||
| Column | −4F~−1F | CFSTC | 1000 × 30 | C60, HRB400, Q345 |
| Beam | −4F~−1F | RRCB | 700 × 1300, 500 × 1000 | C35, HRB400 |
| Slab | Thickness (t) | |||
| Raft | - | 2000 | C30, HRB400 | |
| −4F~−1F | - | 200 | C35, HRB400- | |
| Wall | −2.5F~−1F | Exterior wall | 1000 | C40, HRB400 |
| Name | Thickness (m) | Density ρ1 (kg/m3) | Shear Wave Velocity (m/s) | Poisson’s Ratio μ | Cohesion c (Pa) | Internal Frictional Angle φ(°) |
|---|---|---|---|---|---|---|
| Clayey silt | 80 | 2000 | 200 | 0.47 | 34,000 | 13 |
| Medium sand | 20 | 2100 | 500 | 0.3 | - | - |
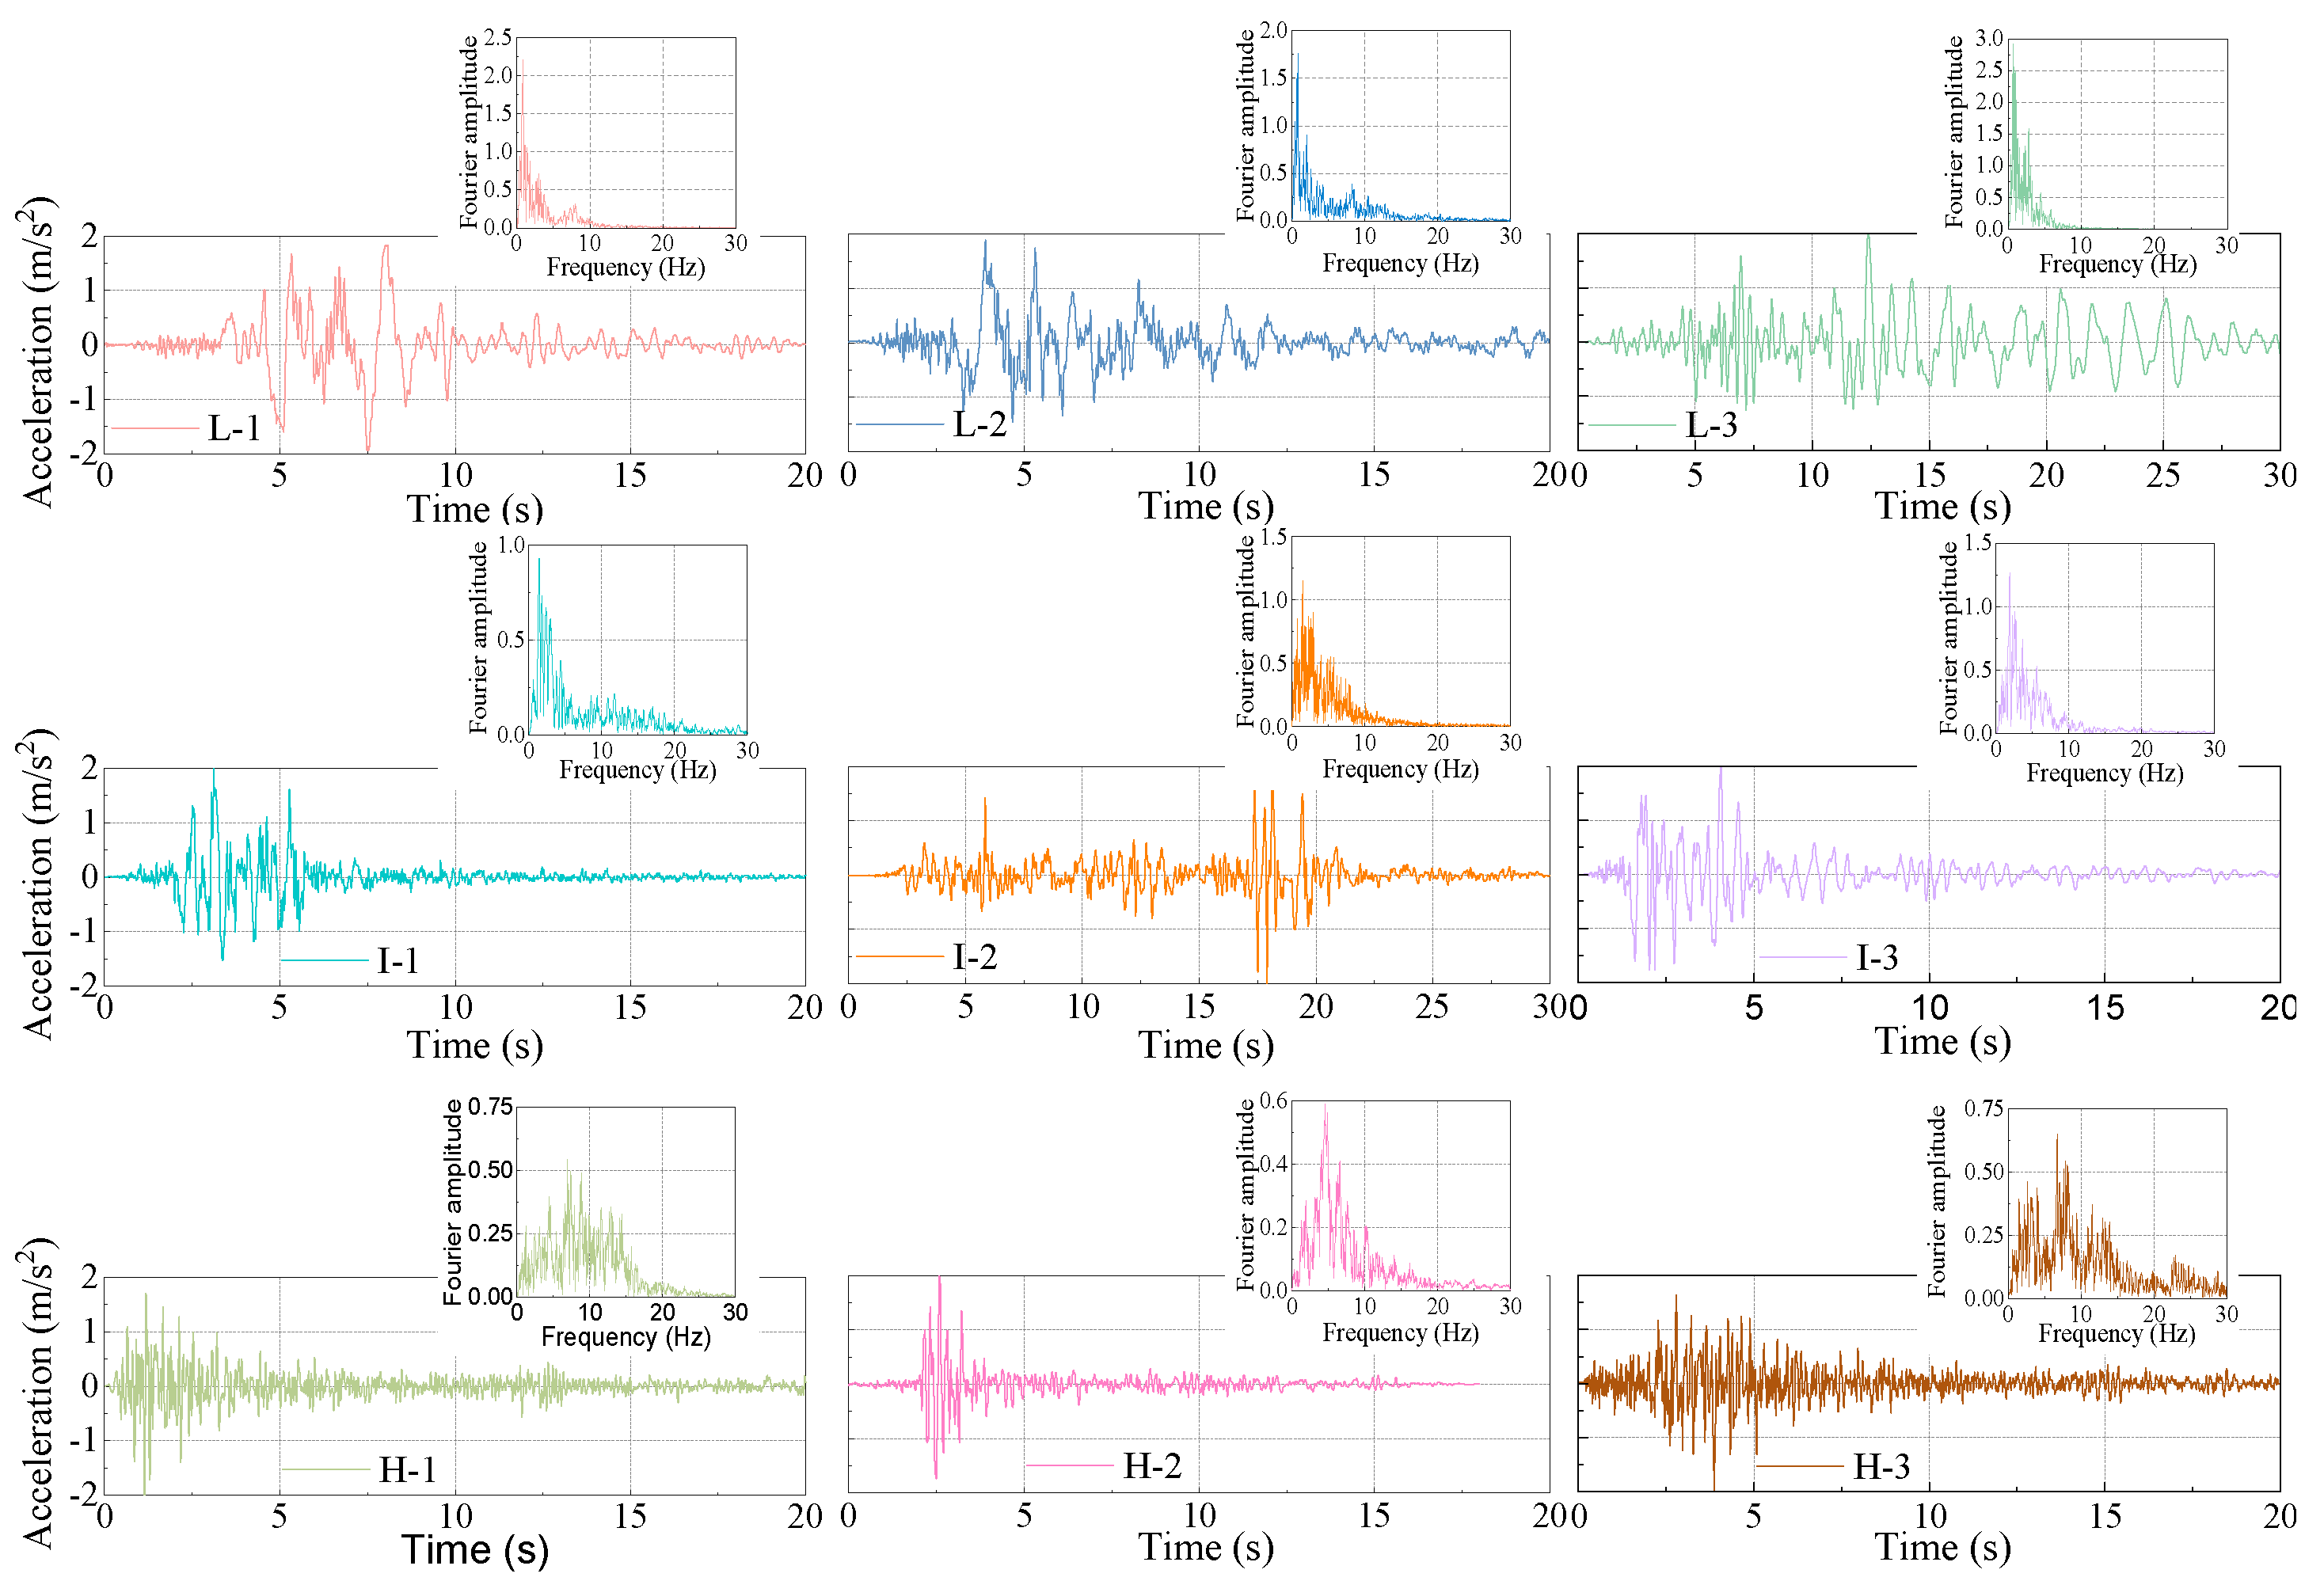
| Name | Particular Year | Record Name | Station | PGA/PGV |
|---|---|---|---|---|
| L-1 | 1995 | Kobe_Japan | Kobe University | 0.499 |
| L-2 | 1980 | Irpinia_Italy-01 | Bagnoli Irpinio | 0.545 |
| L-3 | 1989 | Livermore-01 | Tracy—Sewage Treatm Plant | 0.613 |
| I-1 | 1987 | Whittier Narrows-01 | Pasadena-CIT Kresge Lab | 1.083 |
| I-2 | 1985 | Nahanni-Canada | Site_1 | 1.065 |
| I-3 | 1979 | Coyote Lake | Gilroy Array #6 | 1.19 |
| H-1 | 1970 | Lytle_Creek | Cedar Springs_Allen Ranch | 3.237 |
| H-2 | 1992 | San Fernando | Lake Hughes #4 | 3.27 |
| H-3 | 1992 | Cape_Mendocino | Cape_Mendocino | 5.043 |
Disclaimer/Publisher’s Note: The statements, opinions and data contained in all publications are solely those of the individual author(s) and contributor(s) and not of MDPI and/or the editor(s). MDPI and/or the editor(s) disclaim responsibility for any injury to people or property resulting from any ideas, methods, instructions or products referred to in the content. |
© 2024 by the authors. Licensee MDPI, Basel, Switzerland. This article is an open access article distributed under the terms and conditions of the Creative Commons Attribution (CC BY) license (https://creativecommons.org/licenses/by/4.0/).
Share and Cite
Ding, Q.; Zhao, M.; Shen, J. Seismic Response and Damage Analysis of Large Underground Frame Structures without Overburden. Appl. Sci. 2024, 14, 4888. https://doi.org/10.3390/app14114888
Ding Q, Zhao M, Shen J. Seismic Response and Damage Analysis of Large Underground Frame Structures without Overburden. Applied Sciences. 2024; 14(11):4888. https://doi.org/10.3390/app14114888
Chicago/Turabian StyleDing, Qingpeng, Mi Zhao, and Jiaxu Shen. 2024. "Seismic Response and Damage Analysis of Large Underground Frame Structures without Overburden" Applied Sciences 14, no. 11: 4888. https://doi.org/10.3390/app14114888
APA StyleDing, Q., Zhao, M., & Shen, J. (2024). Seismic Response and Damage Analysis of Large Underground Frame Structures without Overburden. Applied Sciences, 14(11), 4888. https://doi.org/10.3390/app14114888