Article

Fire Resistance of Ultra-High-Strength Steel Columns Using Different Heating Rates

by
Paulo A. G. Piloto
1,*,
Arthur Silva Pereira
2 and
Artur Caron Mottin
2
1
GICoS, Instituto Politécnico de Bragança, Campus Santa Apolónia, 5300-253 Bragança, Portugal
2
Centro Federal de Educação Tecnológica de Minas Gerais—CEFET-MG, Av. Amazonas, 5.253, Nova Suiça, Belo Horizonte 30110, MG, Brazil
*
Author to whom correspondence should be addressed.
Appl. Sci. 2024, 14(11), 4887; https://doi.org/10.3390/app14114887
Submission received: 24 April 2024 / Revised: 26 May 2024 / Accepted: 27 May 2024 / Published: 5 June 2024
(This article belongs to the Special Issue Computational Mechanics for Solids and Structures)

Abstract

:

Featured Application

Numerical results to determine the fire resistance of ultra-high-strength steel using different heating rates.

Abstract

Ultra-High-Strength Steel (UHSS) offers several advantages over normal carbon steel, promoting exceptional strength, reducing self-weight, improving fire resistance, enhancing durability, and reducing material consumption. These advantages result in cost savings and sustainable engineering construction. The 3D numerical model is based on Geometrical and Materially Nonlinear Imperfection Analysis (GMNIA) and determines the fire resistance of different cross-section columns. The model is validated with experimental tests, with a maximum relative error of 11%. A parametric analysis is presented, based on 252 simulations, assuming three heating rates, two different cross-sections, two different thicknesses, three lengths, and seven load levels. The fire resistance depends on the heating rate, but the critical temperature is almost equal and independent of the heating rate, if one assumes implicit creep in the constitutive material model. The fire resistance decreases with the load level, as expected. The thickness effect of the hollow section is almost negligible in the fire resistance of UHSS columns. The fire resistance decreases more in higher load levels for slender columns. Columns with Circular Hollow Sections (CHSs) generally show higher fire resistance than hybrid columns in longer columns, but the hybrid columns are subject to much higher loads. New design formulas are presented for the critical temperature of UHSS columns, depending on the load level and slenderness of two different cross-sections.

1. Introduction

Ultra-High-Strength Steel (UHSS) is gaining recognition in the construction industry for its potential applications in building structures and sustainable construction. UHSS can be used in the construction of high-rise buildings for critical structural elements such as columns and beams. Its exceptional strength contributes to the use of lighter and slender elements, reducing the self-weight of the building structure. Designers may explore the use of UHSS in optimised structural design, creating aesthetically pleasant and efficient structures. As research and development in materials science progresses, the use of UHSS in building construction becomes prevalent, offering new possibilities for efficient and resilient building design. The use of UHSS can lead to a great deal of reduction in the consumed mass and CO2 production, still increasing the overall load-bearing capacity of the structures. The use of UHSS also leads to longer-span elements and can handle more complex shapes. UHSS allows for thinner structural members and reduces the overall weight of the structure, leading to cost savings in material and labour. Usually, UHSS presents higher durability (more corrosion resistance), due to the existence of special chemical elements, extending the service life of the structure. On the other hand, UHSS is typically more expensive than mild steel and can present some weldability issues.
Under compressive load, the UHSS columns may experience failure modes due to the brittle behaviour of the material as well as global buckling, depending on the geometry and slenderness. The lower ductility, when compared to mild steel sections, has an undermining effect on the global performance of the whole structure, especially under certain extreme events, but, in general, UHSS cold-formed CHS columns have improved buckling resistance, with the possibility to use the curve “b” from EN1993-1-1. The future generation of prEN1993-1-1 [1] considers the possibility of using the design curve “c” for HSS cold-formed CHS columns, when using grade S700.
While the fundamental principles of structural analysis remain consistent, the design of columns made from UHSS may require modifications to traditional design formulas developed for normal-strength steel. This is because the mechanical properties of UHSS, including its higher strength and reduced ductility, can influence the behaviour of columns under different loading conditions.
Over the past decade, different columns comprising ultra-high-strength steel sections have been proposed and successfully tested at room temperature [2,3,4]; however, only a reduced number of studies have been developed to test these materials under elevated temperatures [5,6,7,8]. At elevated temperatures, UHSS presents a different microstructure, and the reduction factors at elevated temperatures are not similar to mild steel. A higher reduction in strength at elevated temperatures is observed, and the fire response significantly differs from that of mild steel [9].
However, currently, the European standard prEN 1993-1-2:2023 [10] considers only steels with a strength of up to 700 MPa for compression and tension at elevated temperatures. Therefore, simulating this material in fire scenarios becomes crucial for understanding the risks associated with fire exposure conditions.

2. Methodology and Validation

In this section, the numerical model used to simulate the UHSS columns at both room and fire temperatures will be presented. The modelling was performed using Ansys Mechanical APDL 2023 R2, and the results are compared with the numerical and experimental results obtained by Farmani et al. [11,12].
The UHSS nominal yield strength is 1200 MPa, and it was manufactured by SSAB steel company. The UHSS material owes its ultra-high strength to its martensitic microstructure, which is obtained by direct quenching. The manufacturing process also considers a longitudinal high-frequency induction welding technique. The chemical composition was supplied by the manufacturer, see Table 1.
The austenitic stainless steel grade 1.4301 was also used in combination with UHSS to produce the hybrid columns.
For the simulations in Ansys, different types of analyses were carried out to comprehensively understand the behaviour of the columns under different conditions. Initially, an elastic linear buckling analysis was conducted at room temperature to establish a baseline for deformation, crucial for incorporating geometric imperfections in subsequent nonlinear analyses. This step was followed by a nonlinear buckling analysis at room temperature to determine the load-bearing capacity and validation at ambient temperature [13,14].
As the focus shifted to elevated temperatures, another nonlinear buckling analysis was developed to validate the column’s performance when subjected to high temperatures, specifically targeting the surface temperature of the column. For scenarios involving standard furnace temperatures, an additional nonlinear thermal analysis was performed to map out the temperature distribution across the columns due to the furnace gas temperature (different heating rate). Finally, a thermo-mechanical analysis was carried out to validate the columns’ behaviour under high-temperature conditions, with superposition of the nodal temperatures over time, keeping the mechanical load constant.
Given that these simulations deal with long columns featuring reduced thicknesses due to the utilisation of UHSS, shell finite elements were used. The Shell 181 element was used, featuring a four-node 3D element with six degrees of freedom at each node (translation in the x, y, z directions and rotation around the x, y, z axes). This element uses linear interpolating functions, with full integration on the plane of the element (2 × 2) and 5 Gauss integration points over thickness. In thermal simulations, the Shell 131 element, also a four-node 3D element, was employed, offering up to 32 degrees of freedom at each node, related to temperature that depends on the number of layers defined by the user [14].

2.1. Loading Elements under Different Heating Rates

Two different cross-sections of columns were utilised: CHS (Circular Hollow Section) and hybrid (a section with four UHSS CHS welded to four plates of SS, stainless steel). These cross-sections are depicted in Figure 1. Additionally, five thermocouples were used for both cases, as specified by these experimental investigations [11,12], see Figure 2.
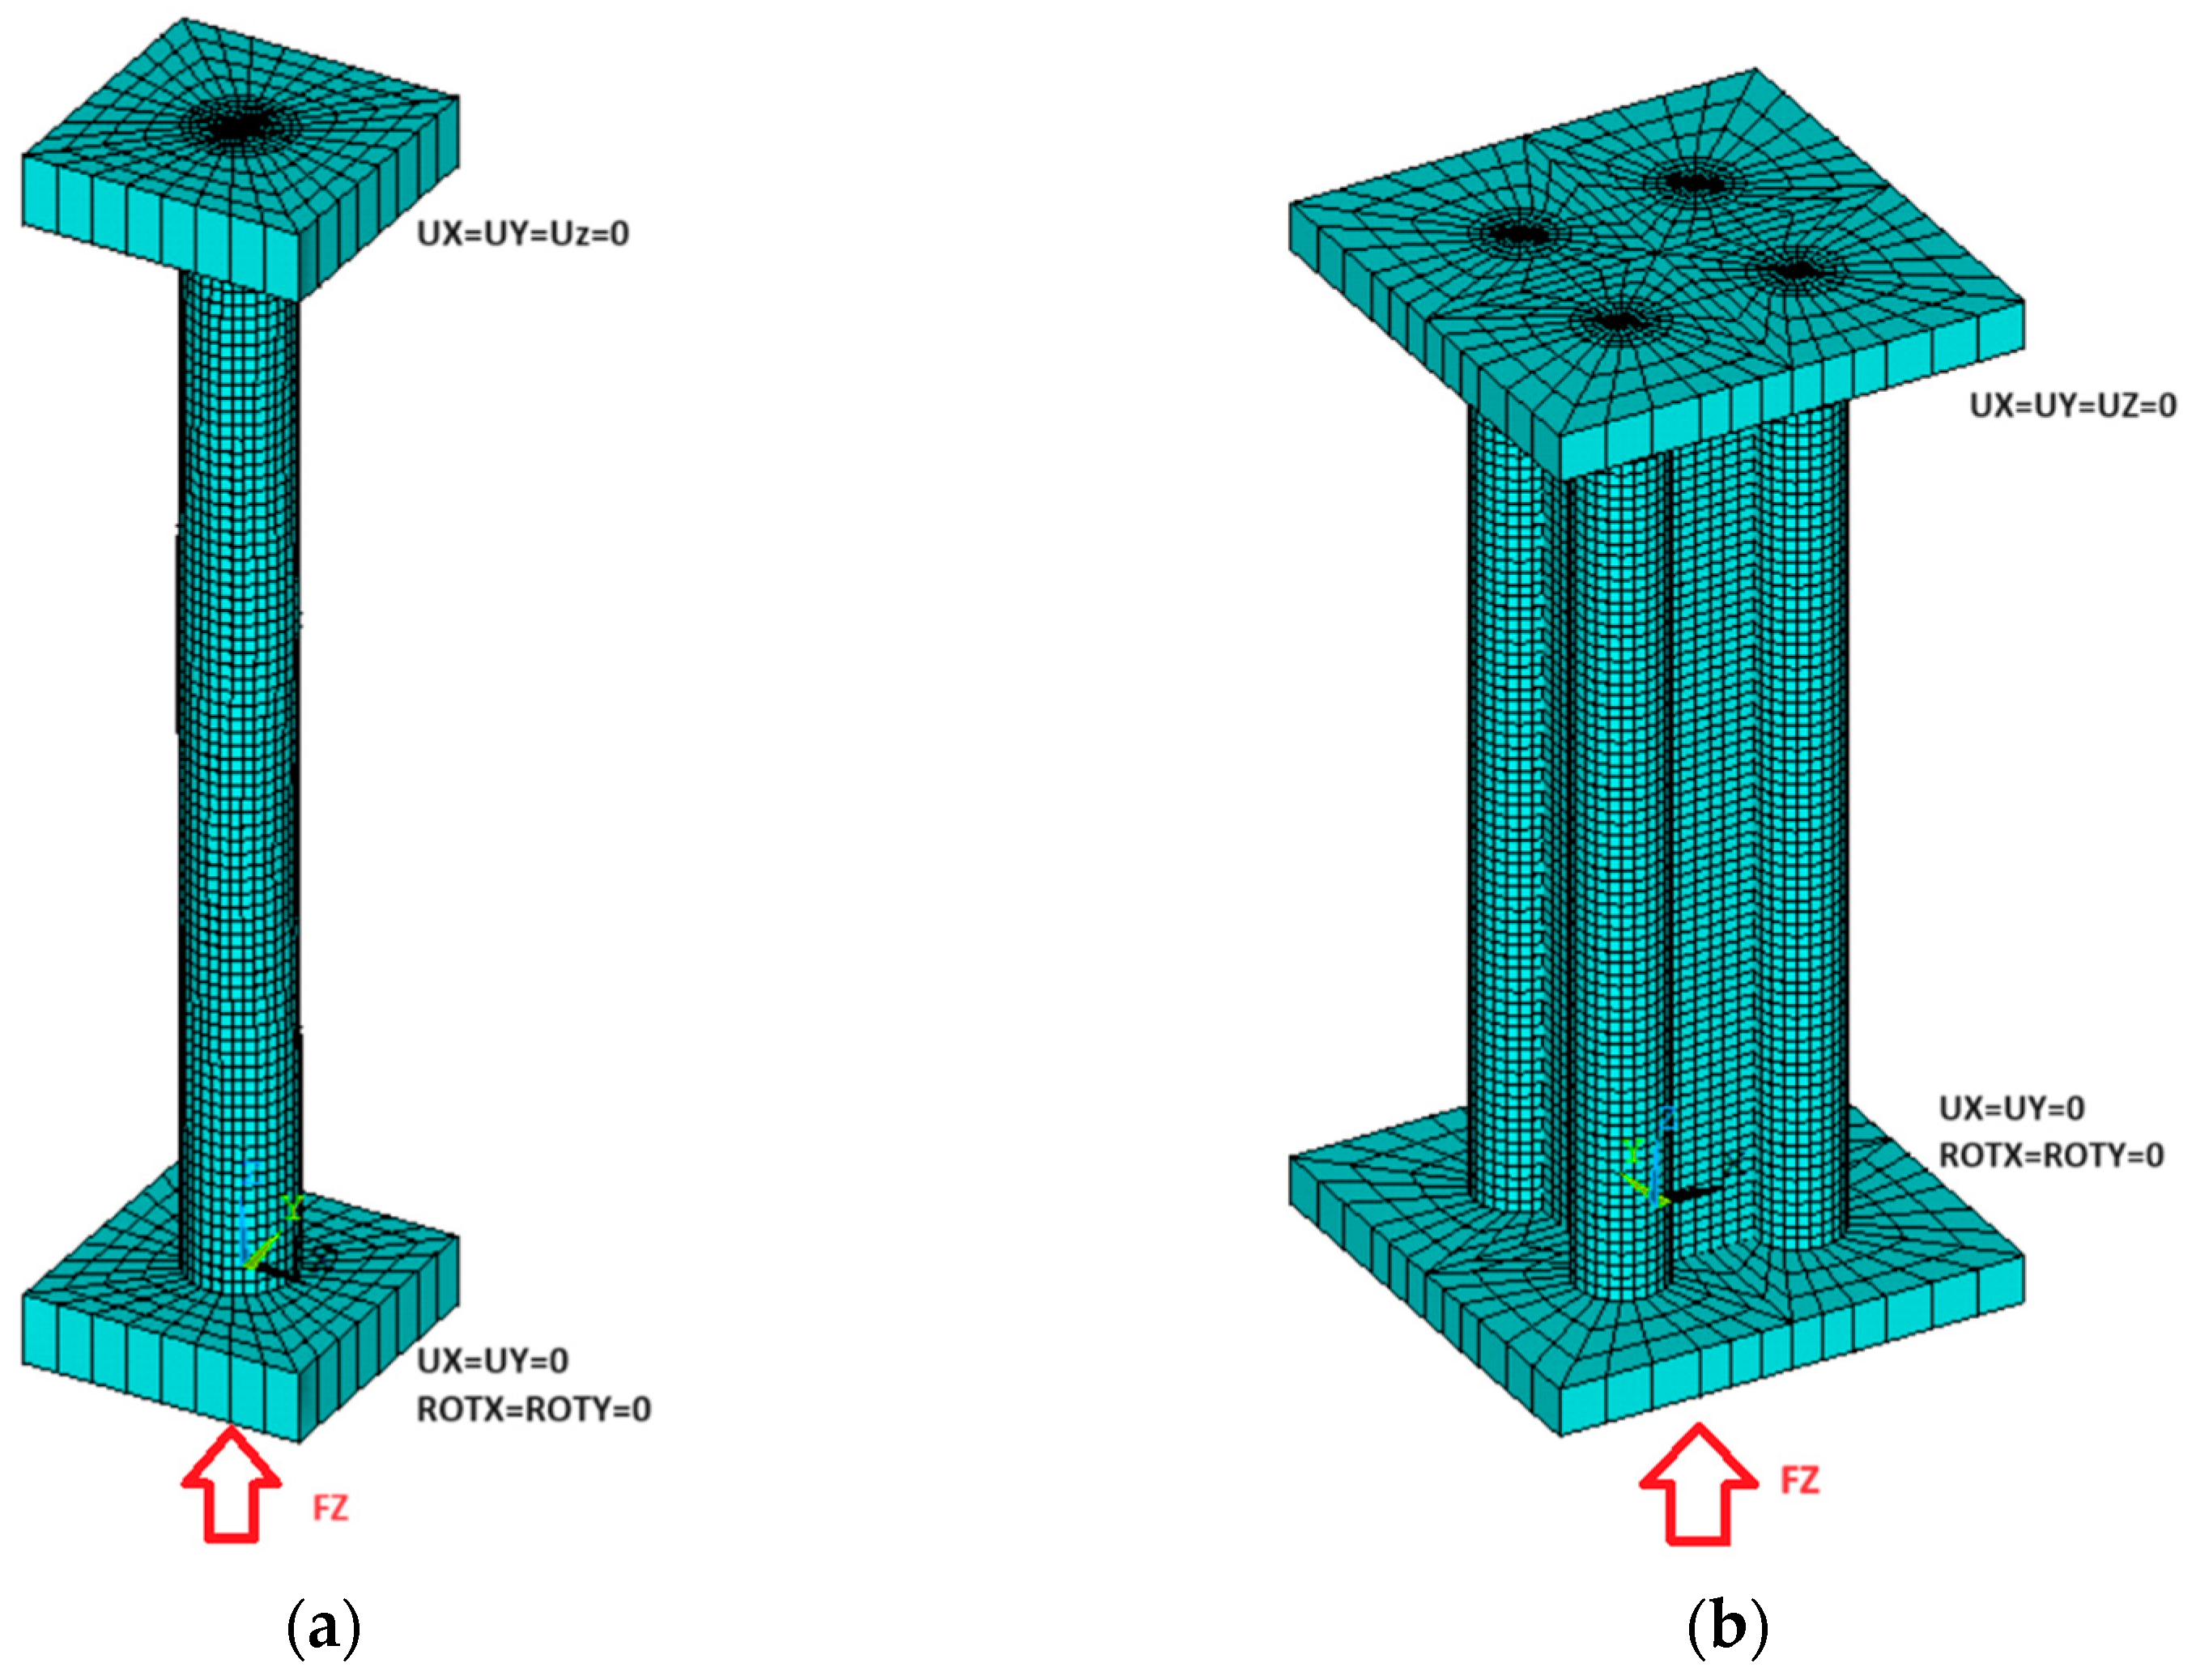
To achieve a more realistic simulation of the boundary conditions of the columns, upper and bottom end plates with a thickness of 50 mm were included in the model. In both cases, the upper plate was fixed, and the force Fz was applied to the moving bottom plate. The boundary conditions are depicted in Figure 3, following the main experimental setup used by Farmani et al. [11,12].
The verification of the fire resistance by testing establishes a failure criterion for the elements under compression. According to EN 1363-1 [15], columns will fail if the axial displacement (C) exceeds Equation (1) or when the rate of axial displacement (dC/dt) surpasses Equation (2). Here, H represents the length of the column.
  C = H / 100
  d C / d t = 3 H / 1000
The fire rating used in Europe for columns is well established [16]. These types of elements may be rated according to R 15, R 20, R 30, …, and R 360. The use of higher heating rates (hydrocarbon fires) may not be sufficient to reach the lowest rating, unless the column is protected by any insulation material.
According to both experimental campaigns, two different heating rates R5 (5 °C/min) and R20 (20 °C/min) were considered, with the temperature obtained from the five thermocouples placed on the column surface, see Figure 2. Furthermore, for this work, the ISO 834 [17] standard was included for the parametric analysis. Therefore, for validating the model with these experimental tests, simulations were conducted using GMNIA solution models, without the need for thermal analysis for the case of R5 and R20 heating rates, but with the required nonlinear thermal analysis for the case of the ISO 834 heating rate (no experimental results).

2.2. Material Properties at Elevated Temperatures

To describe the material’s behaviour at high temperatures, stress–strain curves were generated using the Ramberg–Osgood model, as referenced in [11,12]. This behaviour can be described by Equation (3) when σ ≤ σ 0.2 , T and by Equation (4) when σ 0.2 , T < σ ≤ σ u , T , where ε T represents the strain at temperature T, σ is the stress at temperature T, E T denotes the Young’s modulus at that temperature T, σ 0.2 , T signifies the yield strength (0.2% proof stress), ε t 0.2 , T corresponds to the strain for σ 0.2 , T , E 0.2 , T is equivalent to the tangent modulus of σ 0.2 , T , n T and n T are the coefficients accounting for nonlinearity effects, and finally, σ u , T stands for the ultimate stress. For UHSS, σ u , T represents the stress at 1.5% strain, while for SS, it represents the stress at 2% strain [17].
ε T = σ E T + 0.002 × ( σ σ 0.2 , T ) n T
ε T = σ σ 0.2 , T E 0.2 , T + 0.015 ε t 0.2 , T σ u , T σ 0.2 , T E 0.2 , T × σ σ 0.2 , T σ u , T σ 0.2 , T n T + ε t 0.2 , T
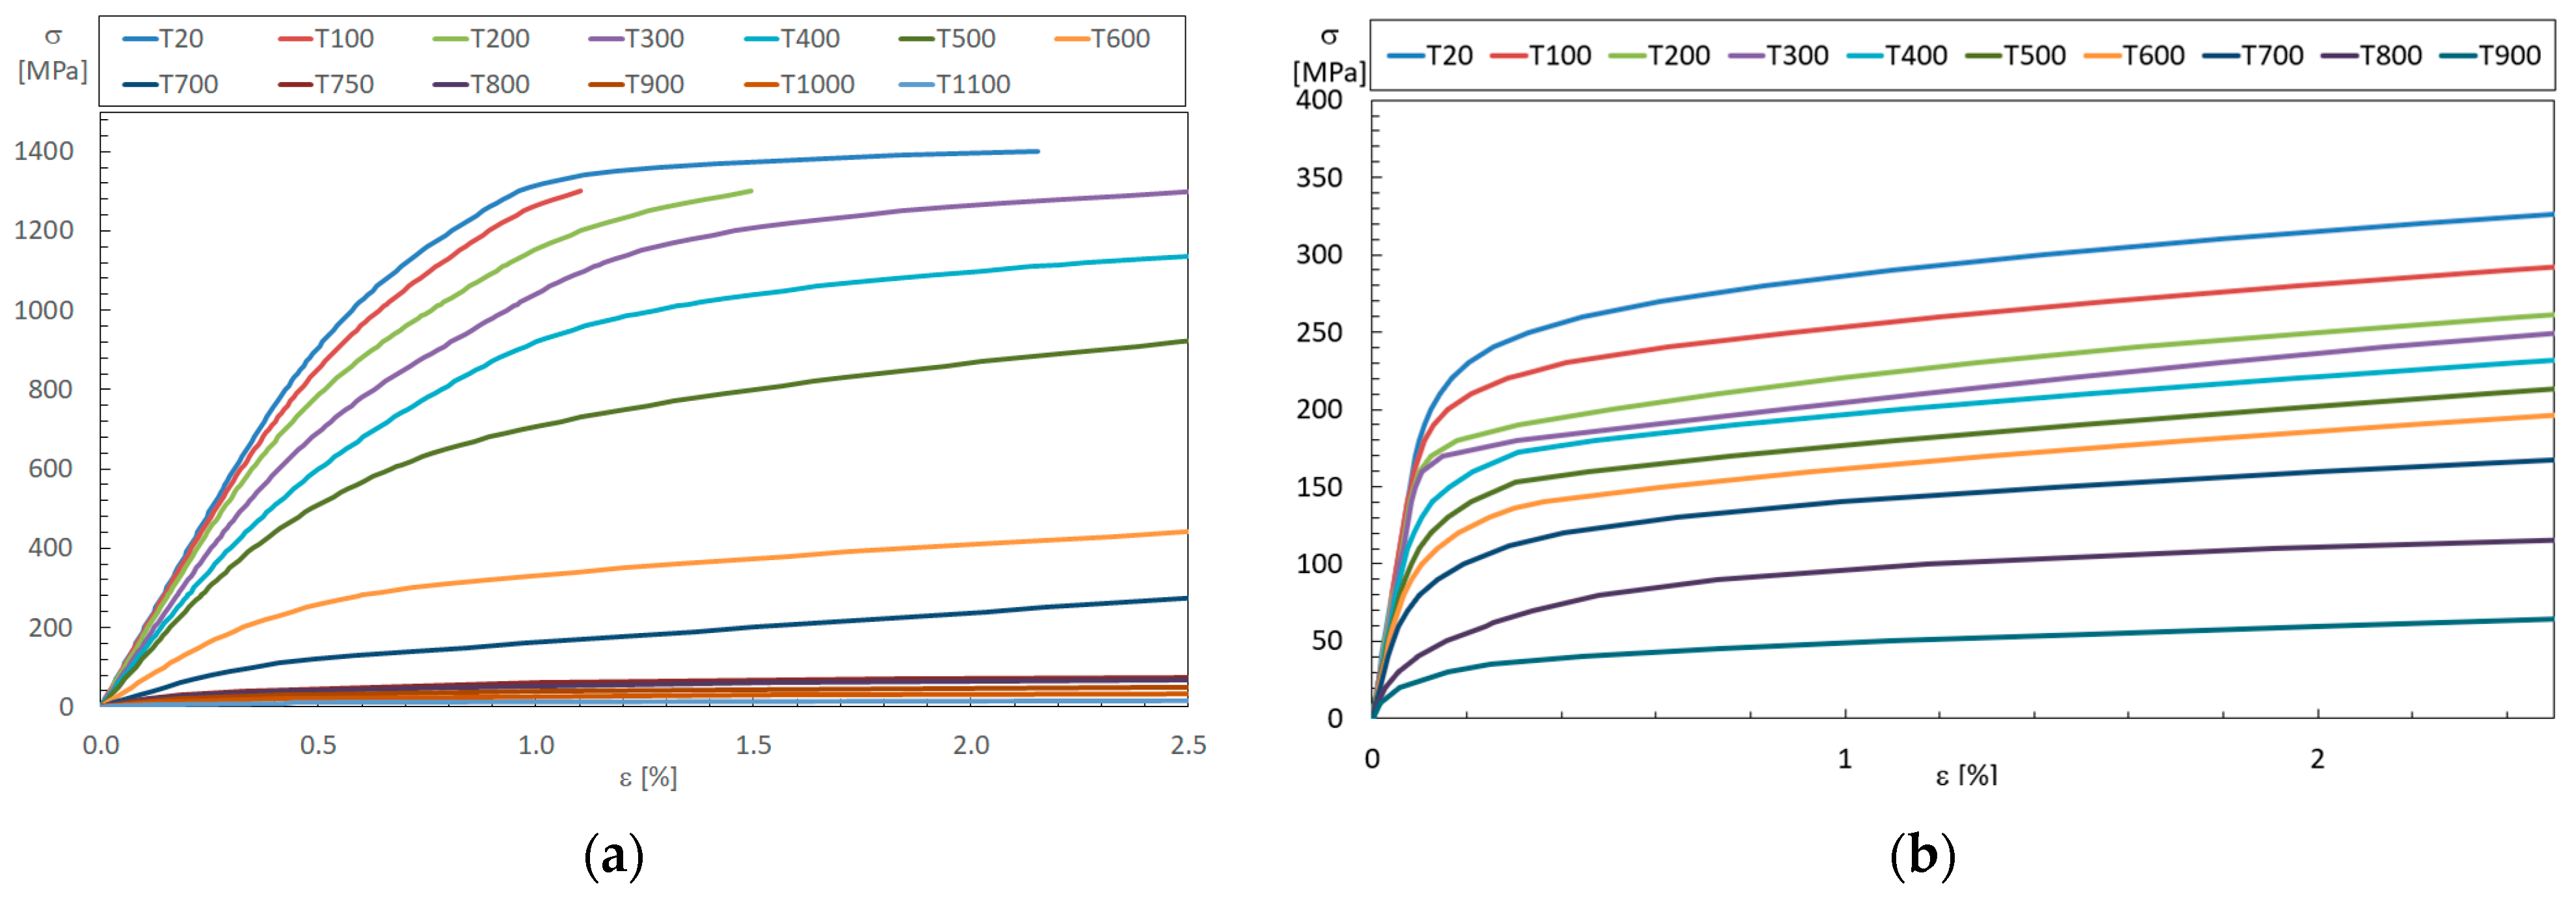
The properties of the UHSS tubes at ambient temperature are defined according to Table 2, while the properties of the SS plates are determined from Table 3. Using the reduction factors and nonlinear coefficients provided in [11] and [12], the stress–strain curves used for the constitutive model were generated for various temperatures, as depicted in Figure 4. Regarding the upper and bottom plates, only an elastic behaviour was considered, with an elastic modulus of 2000 GPa to simulate a rigid material.
Another relevant mechanical property to consider is thermal expansion, which is defined by thermal strain. For UHSS tubes, the thermal strain was calculated as presented in [11] using Equation (5). Similarly, for SS plates, Equation (6) was retrieved from [12].
The UHSS material derives from a tempered martensitic microstructure, which is a microstructure responsible for being very strong but also brittle. In UHSS with martensitic microstructures, the strength depends on the concentration of carbon remaining in the solid solution (not presented in the cementite phase). From the analysis of phase diagrams of UHSS, it can be concluded that after exposure to temperatures below 600 °C, the UHSS will remain tempered martensite with ferrite, and the phases present in the microstructure of the material (ferrite, martensite, and cementite) do not change in the type of phases but changes only their sizes. During the heating process, at elevated temperatures, coincident with the ‘tempering temperature of martensite’, the tempering processes of this phase, with the subsequent carbon diffusion and removal from solid solution, will continue resulting in a significant strength reduction in the material. The heating effect on the material results in a different behaviour (reduction coefficients). The reduction in the yield strength on UHSS at elevated temperatures (heating for the first time) begins at a lower temperature level when compared to a preheated and cooled UHSS. At 600 °C, there could be a difference of 40% [6].
ε T h = ( 5.7 + 1.55 × 10 1 T 7.19 × 10 6 T   2 ) × ( T 20 ) × 10 6
ε T h = ( 12.67 + 4.7 × 10 3 T 1.43 × 10 6 T   2 ) × ( T 20 ) × 10 6
For thermal analyses, it is crucial to define thermal properties such as thermal conductivity, specific heat capacity, emissivity, and density. These properties for the UHSS tubes were established based on prEN 1993-1-2:2023 [10] for conventional steels. Thermal conductivity can be defined according to Table 4 and specific heat capacity according to Table 5; emissivity is set at 0.7 for conventional steels, and density is fixed at 7850 kg/m3.
For the hybrid sections, the thermal proprieties for the stainless steel (SS) plates will be defined as established for the prEN 1993-1-2:2023 [10] for austenitic stainless steel. This includes determining thermal conductivity using Equation (7), specific heat using Equation (8), and setting emissivity to 0.4.
λ a = 14.6   + 1.27 × 10 2   T
c a = 450 + 2.8 × 10 1 T 2.91 × 10 4 T 2 + 1.34 × 10 7 T 3

2.3. Model Validation for CHS Columns under Fire

Farmani et al. [11] conducted compression tests and numerical simulations on CHS steel columns of grade 1200 under non-standard transient fire conditions. The study included two different heating rates (5 °C/min and 20 °C/min) and three distinct load levels (25%, 50%, and 75%). The experimental results from the study are detailed in Table 6.

2.3.1. Elastic Buckling Analysis

The column was modelled based on Figure 1a, using the finite element Shell 181 for structural analysis purposes. Material properties were defined using only the elastic properties at room temperature, and boundary conditions were applied as depicted in Figure 3a. The mesh generation involved dividing the column along its length into 80 divisions and 16 divisions around its diameter, resulting in a total of 2560 elements in the columns. When considering the elements of the plates, the total number of elements was 3200. The finite element mesh, comprising a total of 3202 nodes, can be observed in Figure 3.
During the eigenvalue buckling analysis, a reference load has been established to solve the static analysis. Both the normal stiffness matrix and the geometric stiffness matrix have to be determined, following the extraction of the instability modes (Block Lankzos extraction method).
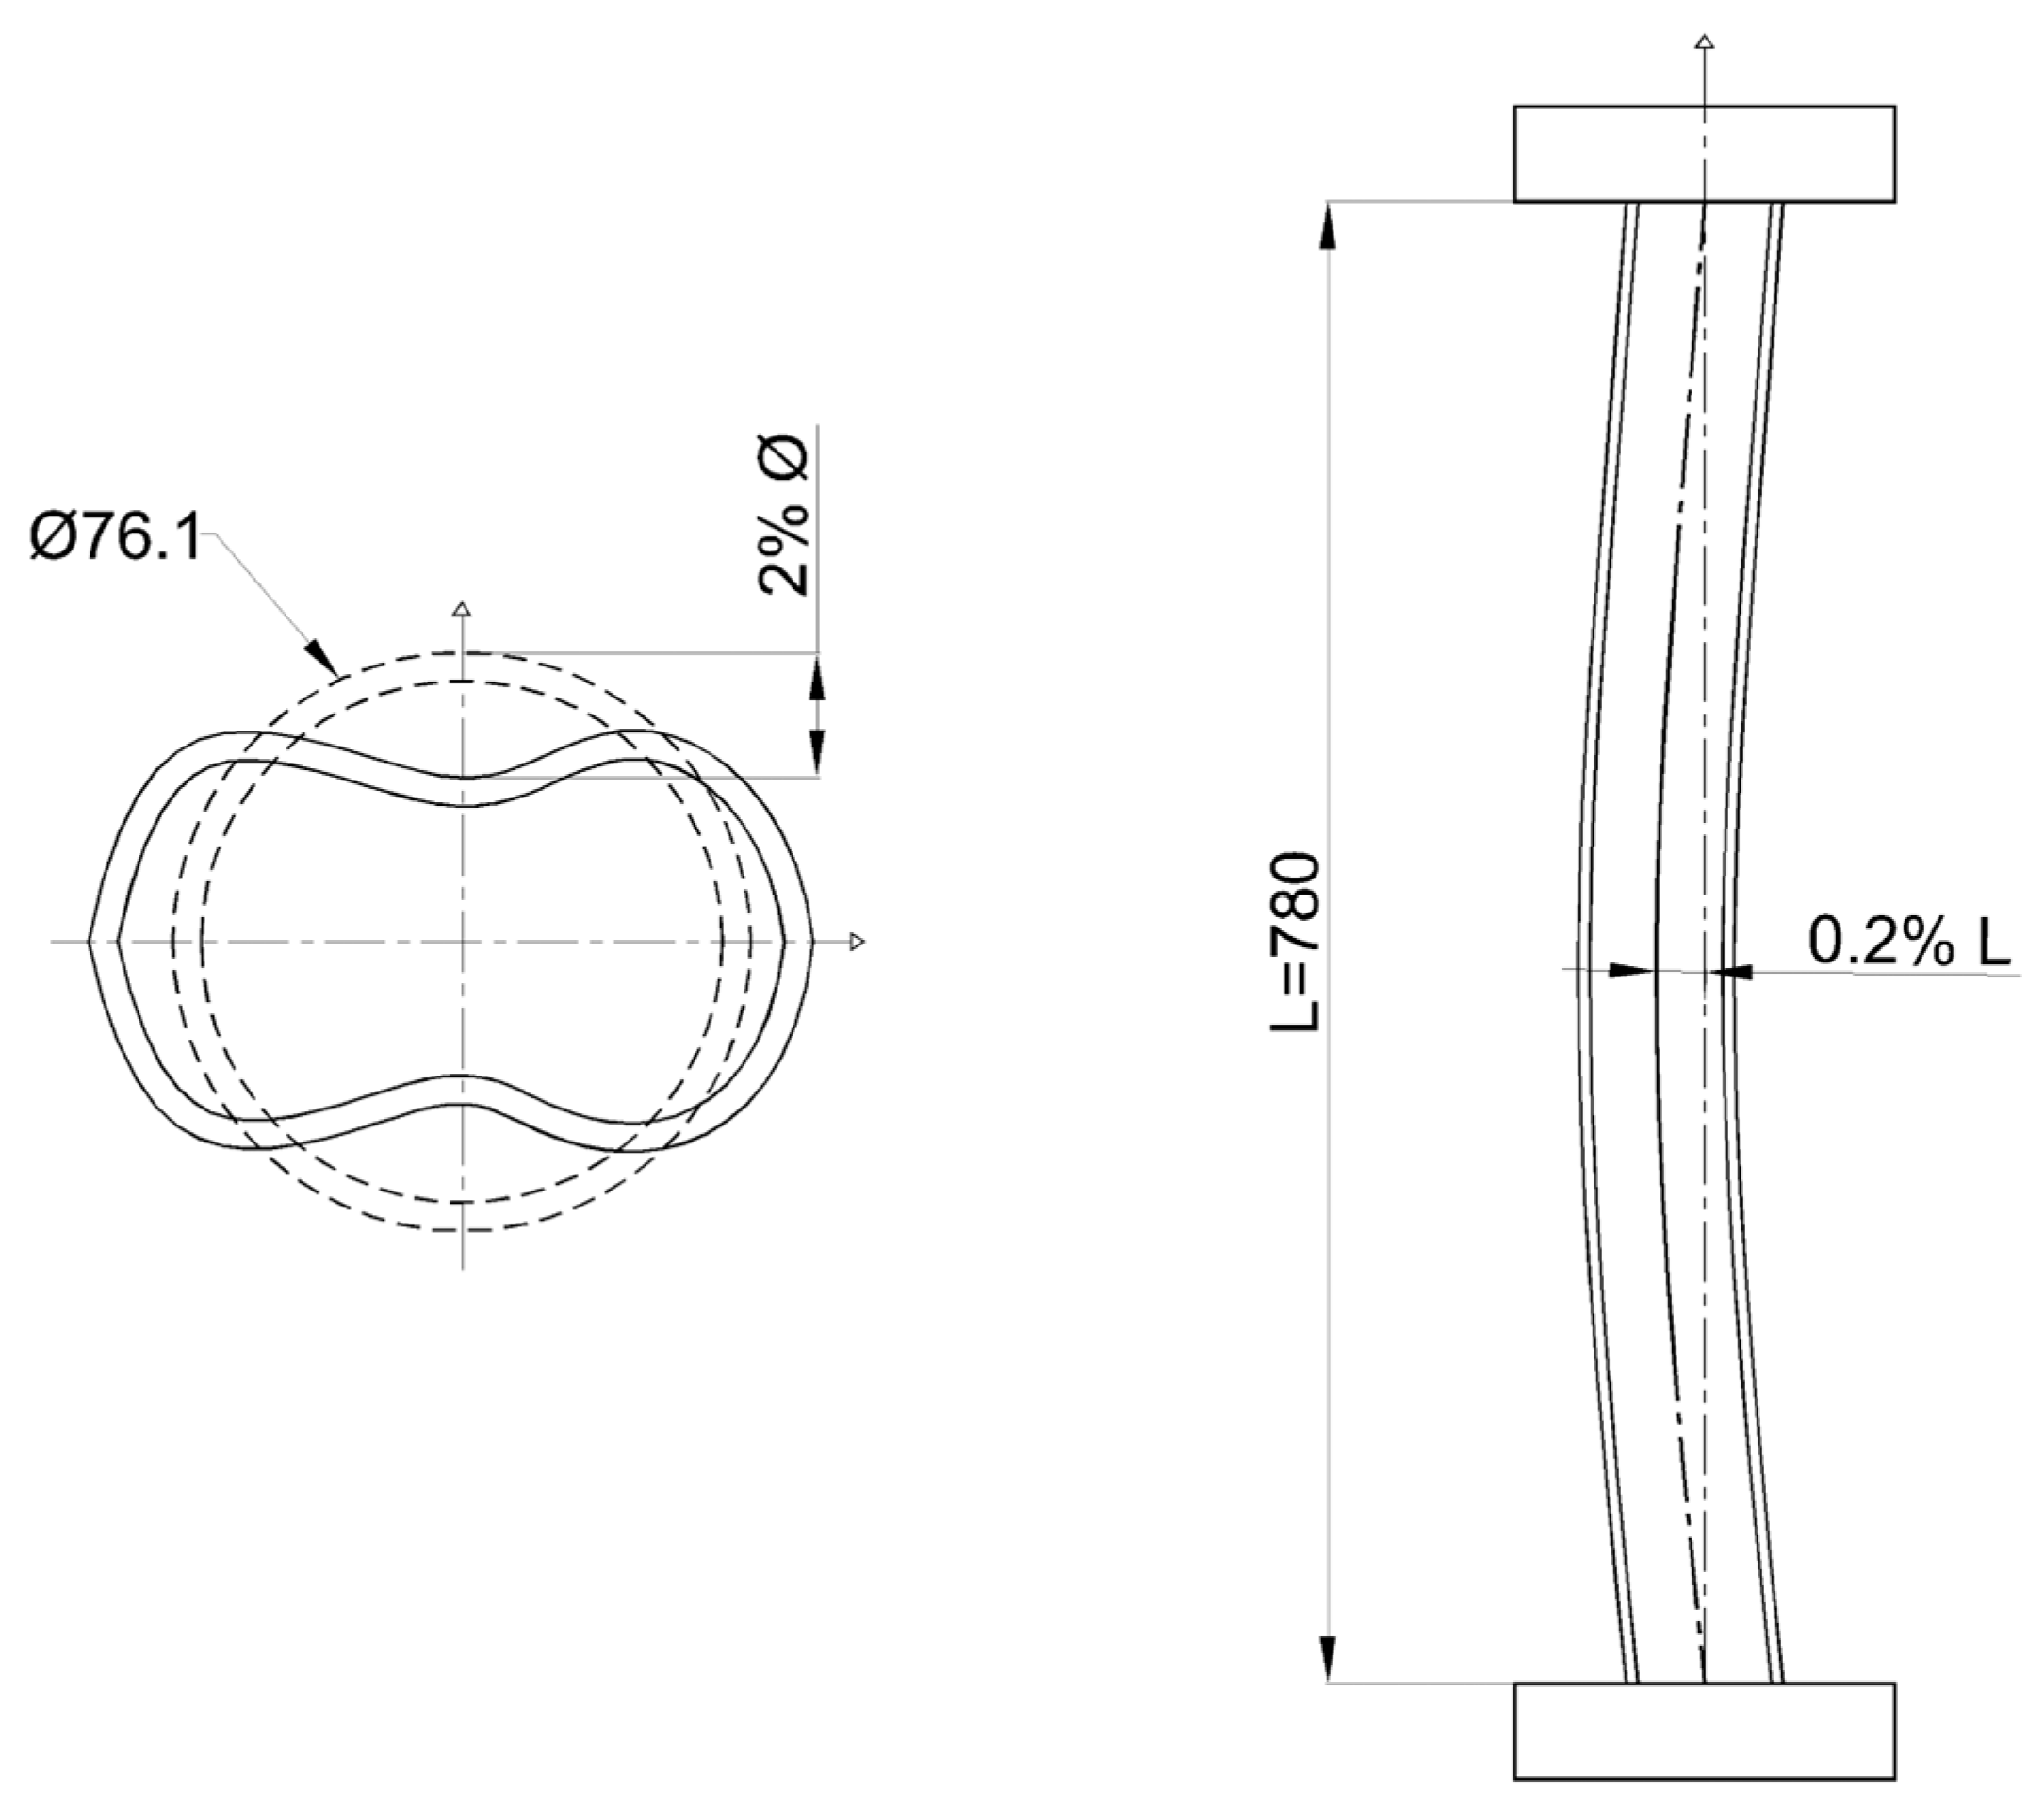
After completing the simulation, the next step was to select the deformations necessary for implementing the geometric imperfections, which are required for the subsequent nonlinear analyses. For the case of the CHS columns, the imperfections considered were local imperfections (out-of-roundness) and global imperfections (lack of straightness). These imperfections were based on EN-10219-2 [18], as illustrated in Figure 5.

2.3.2. Load Bearing Capacity at Room Temperature (GMNIA)

For the nonlinear buckling analysis, the incremental and iterative method known as Geometrically and Materially Nonlinear Analysis with Imperfections (GMNIA) was employed. This method involves a structural analysis which explicitly includes imperfections, based on the principles of shell bending theory applied to imperfect structures that incorporate the theory of large displacement nonlinearities.
The geometric imperfections were based on the combination of two different nodes of instabilities (local and global).
Additionally, in terms of material, it was essential to incorporate an isotropic multilinear nonlinear inelastic behaviour into the material constitutive model, using the von Mises criterion to detect plastification. However, it is important to note that the thermal creep effect on the material was not considered explicitly in these analyses. This effect relates to the permanent deformation caused by the duration of exposure to high temperatures and may be omitted [10].
The incremental solution was based on the arc length method, which is normally used to solve nonlinear systems of equations when the structural problem has one or more critical points. In the context of structural behaviour, a critical point can be interpreted as the point at which the loaded element cannot withstand an increase in external forces, resulting in instability [19]. In this case, the force applied to the column may be reduced during the simulation. This increment continues to vary between the initial incremental force multiplied by the minimum radius R m i n and the maximum radius R m a x as defined in the solution options. The convergence criterion is based on the displacement value of 3 mm.
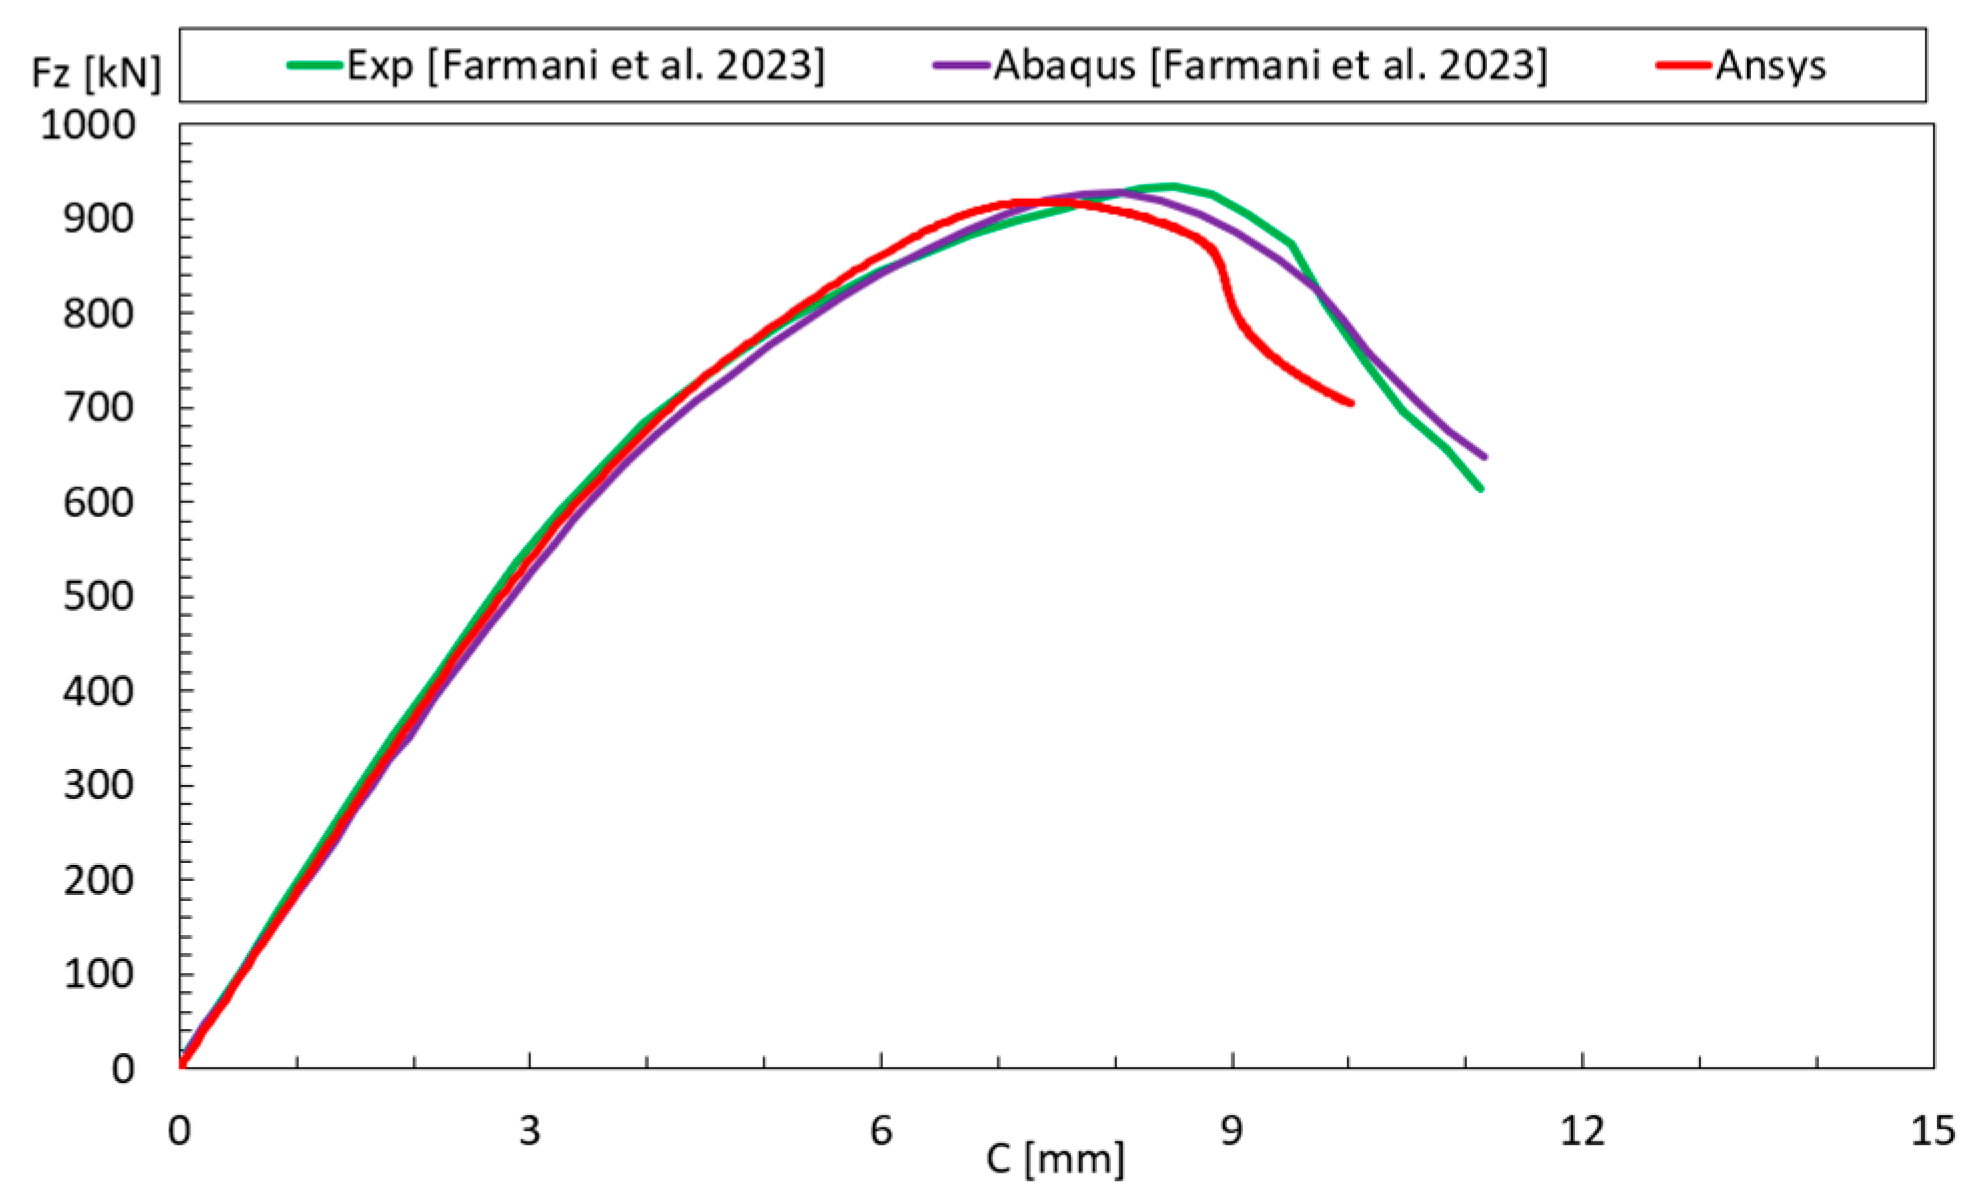
After conducting the GMNIA analysis at room temperature, it became possible to compare the results obtained in Ansys with the experimental and numerical results presented by Farmani et al. [11], as illustrated in Figure 6. In this graph, C corresponds to the axial displacement at the central node of the bottom plate (contraction). The comparison shows that the simulation performed in Ansys exhibited good agreement with the compared results, displaying only a minor difference in its final curve region. The maximum force obtained was 917.91 kN, representing a relative error of −1.93% compared to the experimental result.

2.3.3. Nonlinear Structural Analysis at Elevated Temperatures

To validate the results in fire situations, where the temperature profile in the columns was provided through thermocouples attached to their surfaces, a nonlinear buckling analysis at elevated temperatures was conducted.
The temperature profile from the thermocouples, which varied with time, was uniformly applied to the column, with the average temperature of the three central thermocouples (T2, T3, and T4), see Figure 2. A reference temperature of 20 °C was defined for zero thermal deformation.
The force was applied with the desired load level, represented as a table in Ansys, as shown in Table 7, where t s i m corresponds to the simulation time.
The Newton–Raphson method was employed with time increments. The criterion adopted was based on force and moment, with both having a tolerance of 0.001 and a minimum reference value of 1 N and 1 Nm, respectively.
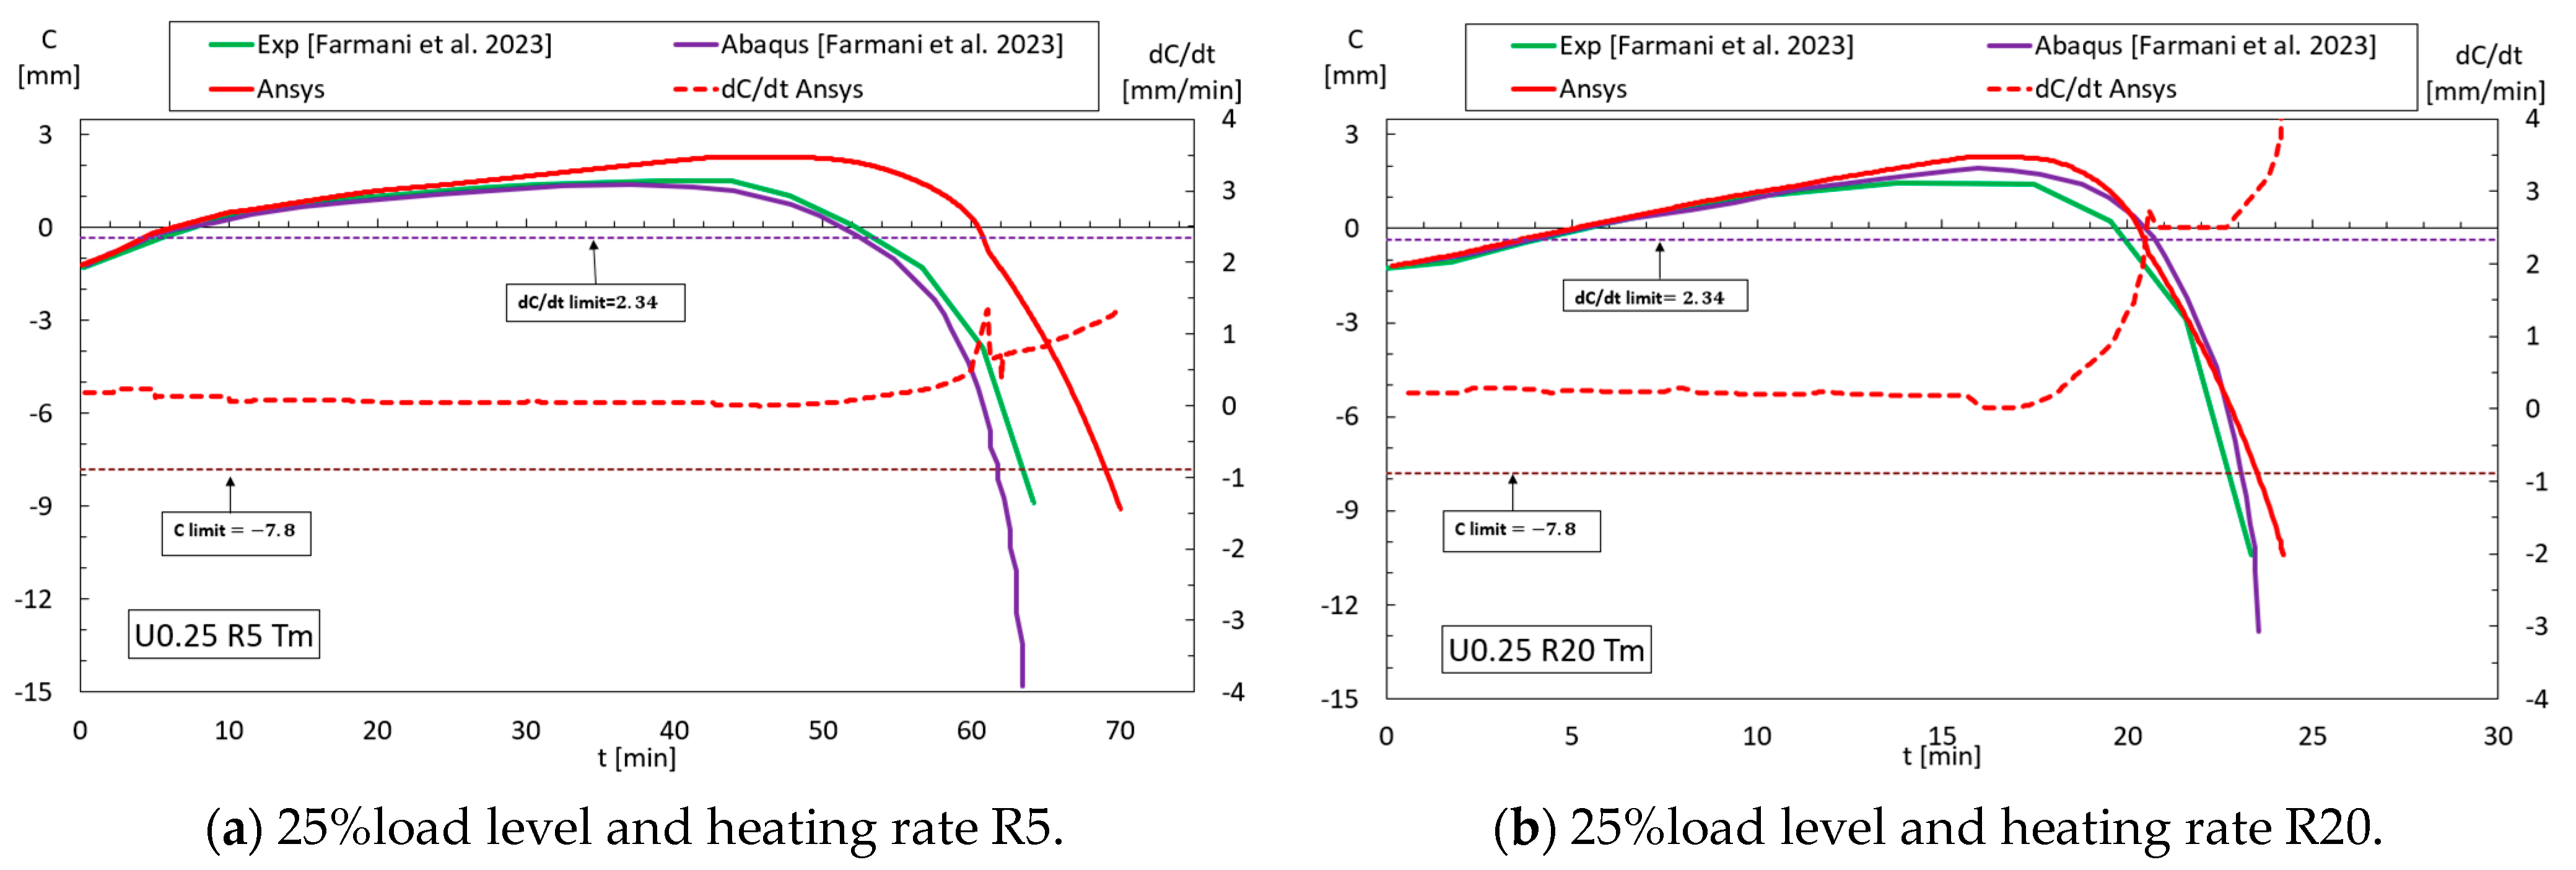
The validation of the thermo-mechanical model established using GMNIA models, using six three load levels and two different heating regimes. Each of these simulations was compared with its respective experimental and numerical results from Farmani et al. [11] and is presented in Figure 7. The rate of displacement (dC/dt) was also included as an addition criterion to find the fire resistance.
Figure 7a illustrates the test results with a heating rate of 5 °C/min, with a constant mechanical load corresponding to 25% of the load-bearing capacity. Figure 7a represents the displacement over time. The Ansys results for axial displacement (C) agree with the experimental tests up to the first 30 min, diverging slightly thereafter. The evolution of the displacement rate (dC/dt) is also represented. It is important to note that Farmani et al. [11] did not mention the displacement rate criterion. Figure 7b presents the results obtained with a heating rate of 20 °C/min using the same mechanical load (25%). Notably, the differences in axial displacement are much smaller in this case, indicating a higher level of agreement between the Ansys results and the experimental data. The accuracy of the approximation will be presented by the Root Mean Square Error (RMSE) and the relative error.
In Figure 7c, the results obtained with a heating rate of 5 °C/min using a mechanical load corresponding to 50% of the load-bearing capacity are represented. Once again, the results with this heating rate exhibit good agreement during the initial 30 min, with a more noticeable difference observed in the later stages of the analysis. Figure 7d presents the results for a higher heating rate (20 °C/min), with the same load level of 50%. These results demonstrate better agreement when compared to those obtained with a smaller heating rate, showcasing a closer match between the Ansys simulations and the experimental results at higher heating rates.
For the load level cases up to 50%, the displacement contraction reverts the direction with the effect of the thermal expansion but is able to revert the direction once again when the material starts to decrease the stiffness and strength with temperature.
Figure 7e presents the results for a heating rate of 5 °C/min with a load level corresponding to 75%. In this case, the results coincide until the 40 min mark. However, ANSYS anticipates the column failure or collapse when compared to the experimental tests, suggesting some differences in the structural response under these conditions. Finally, Figure 7f presents the results for a load level of 75% and a heating rate of 20 °C/min. The results coincide until the 17 min mark, after which ANSYS anticipates the collapse, when compared to the experimental test, under both fire resistance criteria. The results of these simulations are summarised in Table 8 for R20 and Table 9 for R5.
Anyway, the critical temperature under load changes from 402 °C (for CHC with U75R20, with 14 min of fire resistance) to 650 °C (for CHC with U25R5, with 69 min of fire resistance). If one increases the heating rate submitting the CHC columns to a hydrocarbon fire, these columns will reach almost the same critical temperature but cannot achieve the minimum fire rating of 15 min. This means that these columns under very high heating rates require external insulation to reach the minimum fire rating specified in Europe [16].
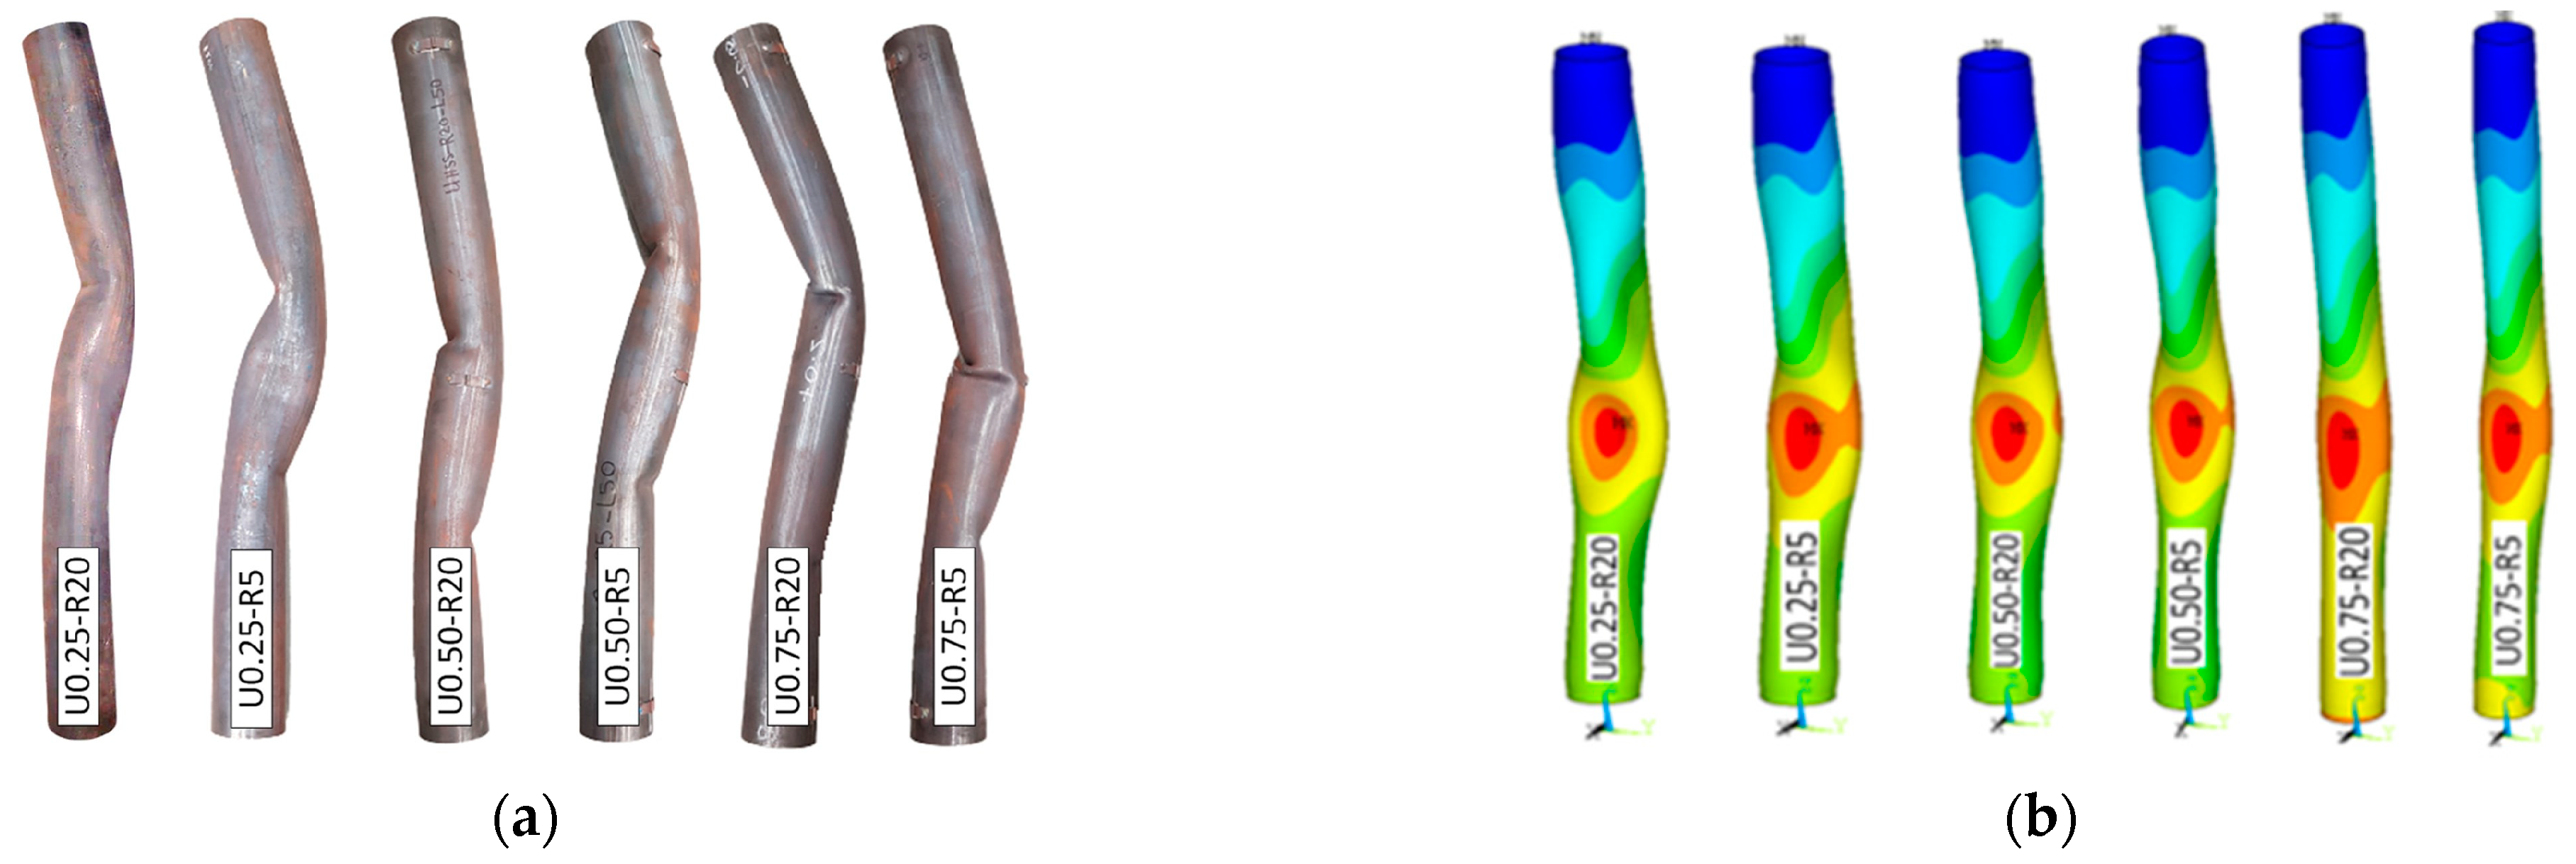
It was also possible to compare the experimental failure modes with those obtained by Ansys, as demonstrated in Figure 8. The difference in local buckling may be explained by the singular local imperfection existing in each specimen.

2.4. Model Validation for Hybrid Columns under Fire

Farmani et al. conducted compression tests and numerical simulations on Hybrid columns under non-standard transient fire conditions. The study included two different heating rates (5 °C/min and 20 °C/min) and three distinct load levels (30%, 45%, and 60%). The experimental results from this study are detailed in Table 10.

2.4.1. Elastic Buckling Analysis

The hybrid column was modelled based on the geometry presented in Figure 1b, using the finite element Shell 181 for structural analysis. Material properties were defined using only the elastic properties at room temperature, and boundary conditions were applied as depicted in Figure 3b, while the mesh generation involving the hybrid column was discretised along its length into 78 divisions, with 24 divisions for each tube around its diameter and 6 divisions for each plate in the direction of its width. This resulted in a total of 9360 elements in the hybrid column. When considering the elements of the end plates, the total number of elements was 10,800. The simulation mesh, comprising a total of 10,422 nodes, can be observed in Figure 3.
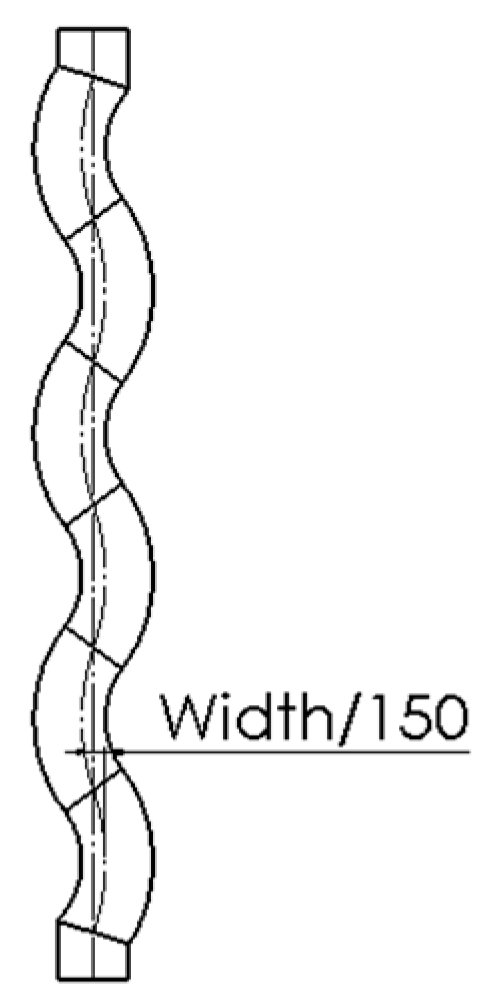
After completing the elastic buckling simulation, the next step was to select the deformations required for implementing the geometric imperfections, which would be used in the subsequent nonlinear analyses. For the validation of the hybrid columns, only local imperfections of the plates were considered, based on the out-of-straightness [12], as shown in Figure 9.

2.4.2. Load Bearing Capacity at Room Temperature (GMNIA)

The same procedure and solution options used for the CHS columns were followed for the hybrid columns as well. After conducting the GMNIA analysis at room temperature, it was possible to compare the results obtained in Ansys with the experimental and numerical results presented by Farmani et al. [12], as presented in Figure 10. The results of the simulation performed in Ansys closely matched the experimental and numerical curves. The load bearing capacity obtained was 4328.4 kN, equivalent to a relative error of 5.06% compared to the experimental result.

2.4.3. Nonlinear Structural Analysis at Elevated Temperatures

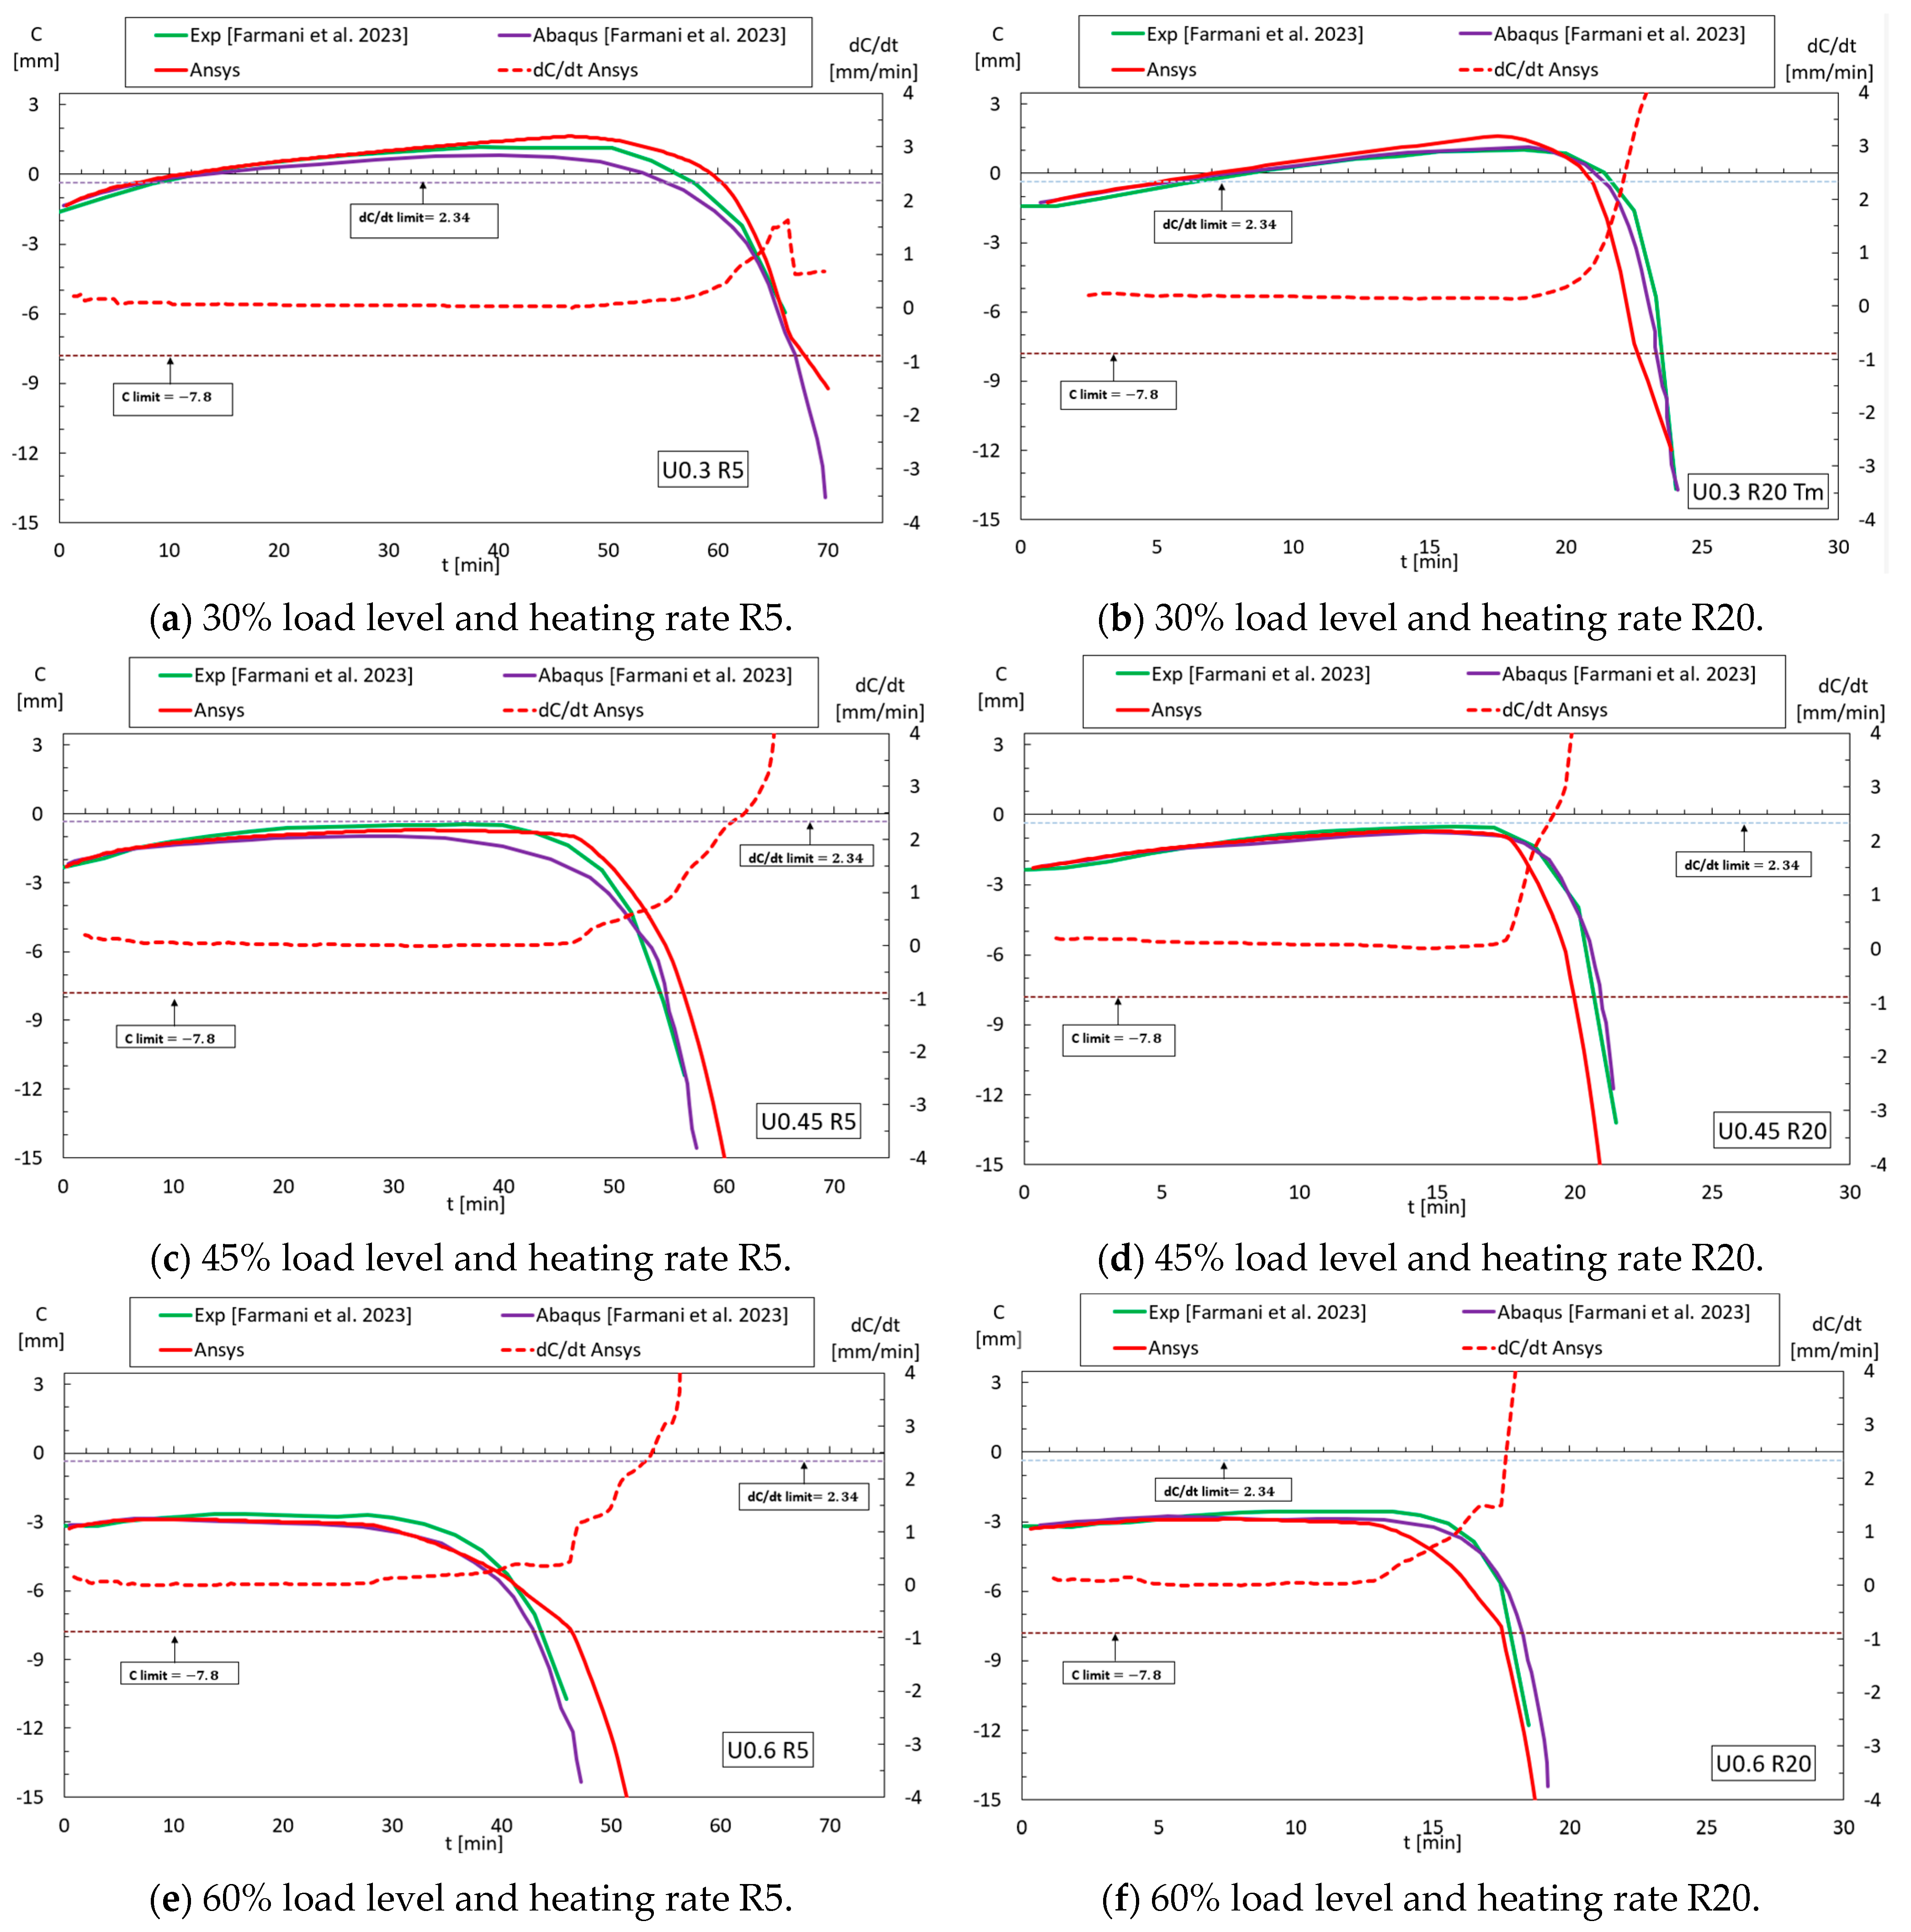
Following the same procedure as with the CHS columns, GMNIA simulations at high temperatures were conducted, enabling validation. Six simulations were carried out, incorporating three load levels and two different heating rates. Each of these simulations was then compared with its respective experimental and numerical results, obtained from Farmani et al. [12], as illustrated in Figure 11.
In Figure 11a, the test conducted with a heating rate of 5 °C/min, with a constant mechanical load corresponding to 30% of the load-bearing capacity, is presented. The numerical results obtained from Ansys match well with the experimental tests, diverging only after 65 min. On the other hand, Figure 11b presents the results obtained with a heating rate of 20 °C/min using the same mechanical load (30%). The results demonstrate good agreement during the initial 20 min but anticipate the failure or collapse of the column, when compared to the experimental tests.
Figure 11c presents the results obtained with a heating rate of 5 °C/min using a mechanical load corresponding to 45% of the load-bearing capacity. Similar to previous cases, the results with this heating rate demonstrate good agreement during the initial 45 min but exhibit a more significant difference in the later stages of the analysis. Figure 11d presents the results for a higher heating rate (20 °C/min) and same load level. The results align until 17 min, after which ANSYS anticipates the collapse, when compared to the experimental test.
Figure 11e presents the results for a heating rate of 5 °C/min with a load level corresponding to 60%. The results agree well until the 40 min mark but diverge afterwards. Lastly, in Figure 11f, the results are presented for a load level of 60% and a heating rate of 20 °C/min. The results agree well until the 12 min mark, after which they anticipate the collapse compared to the experimental test.
The overall results of these simulations are summarised in Table 11 for R20 and Table 12 for R5. The accuracy of the model is well demonstrated by the very small RMSE during the simulation time, with RMSE varying between 0.4 mm and 2.61 mm.
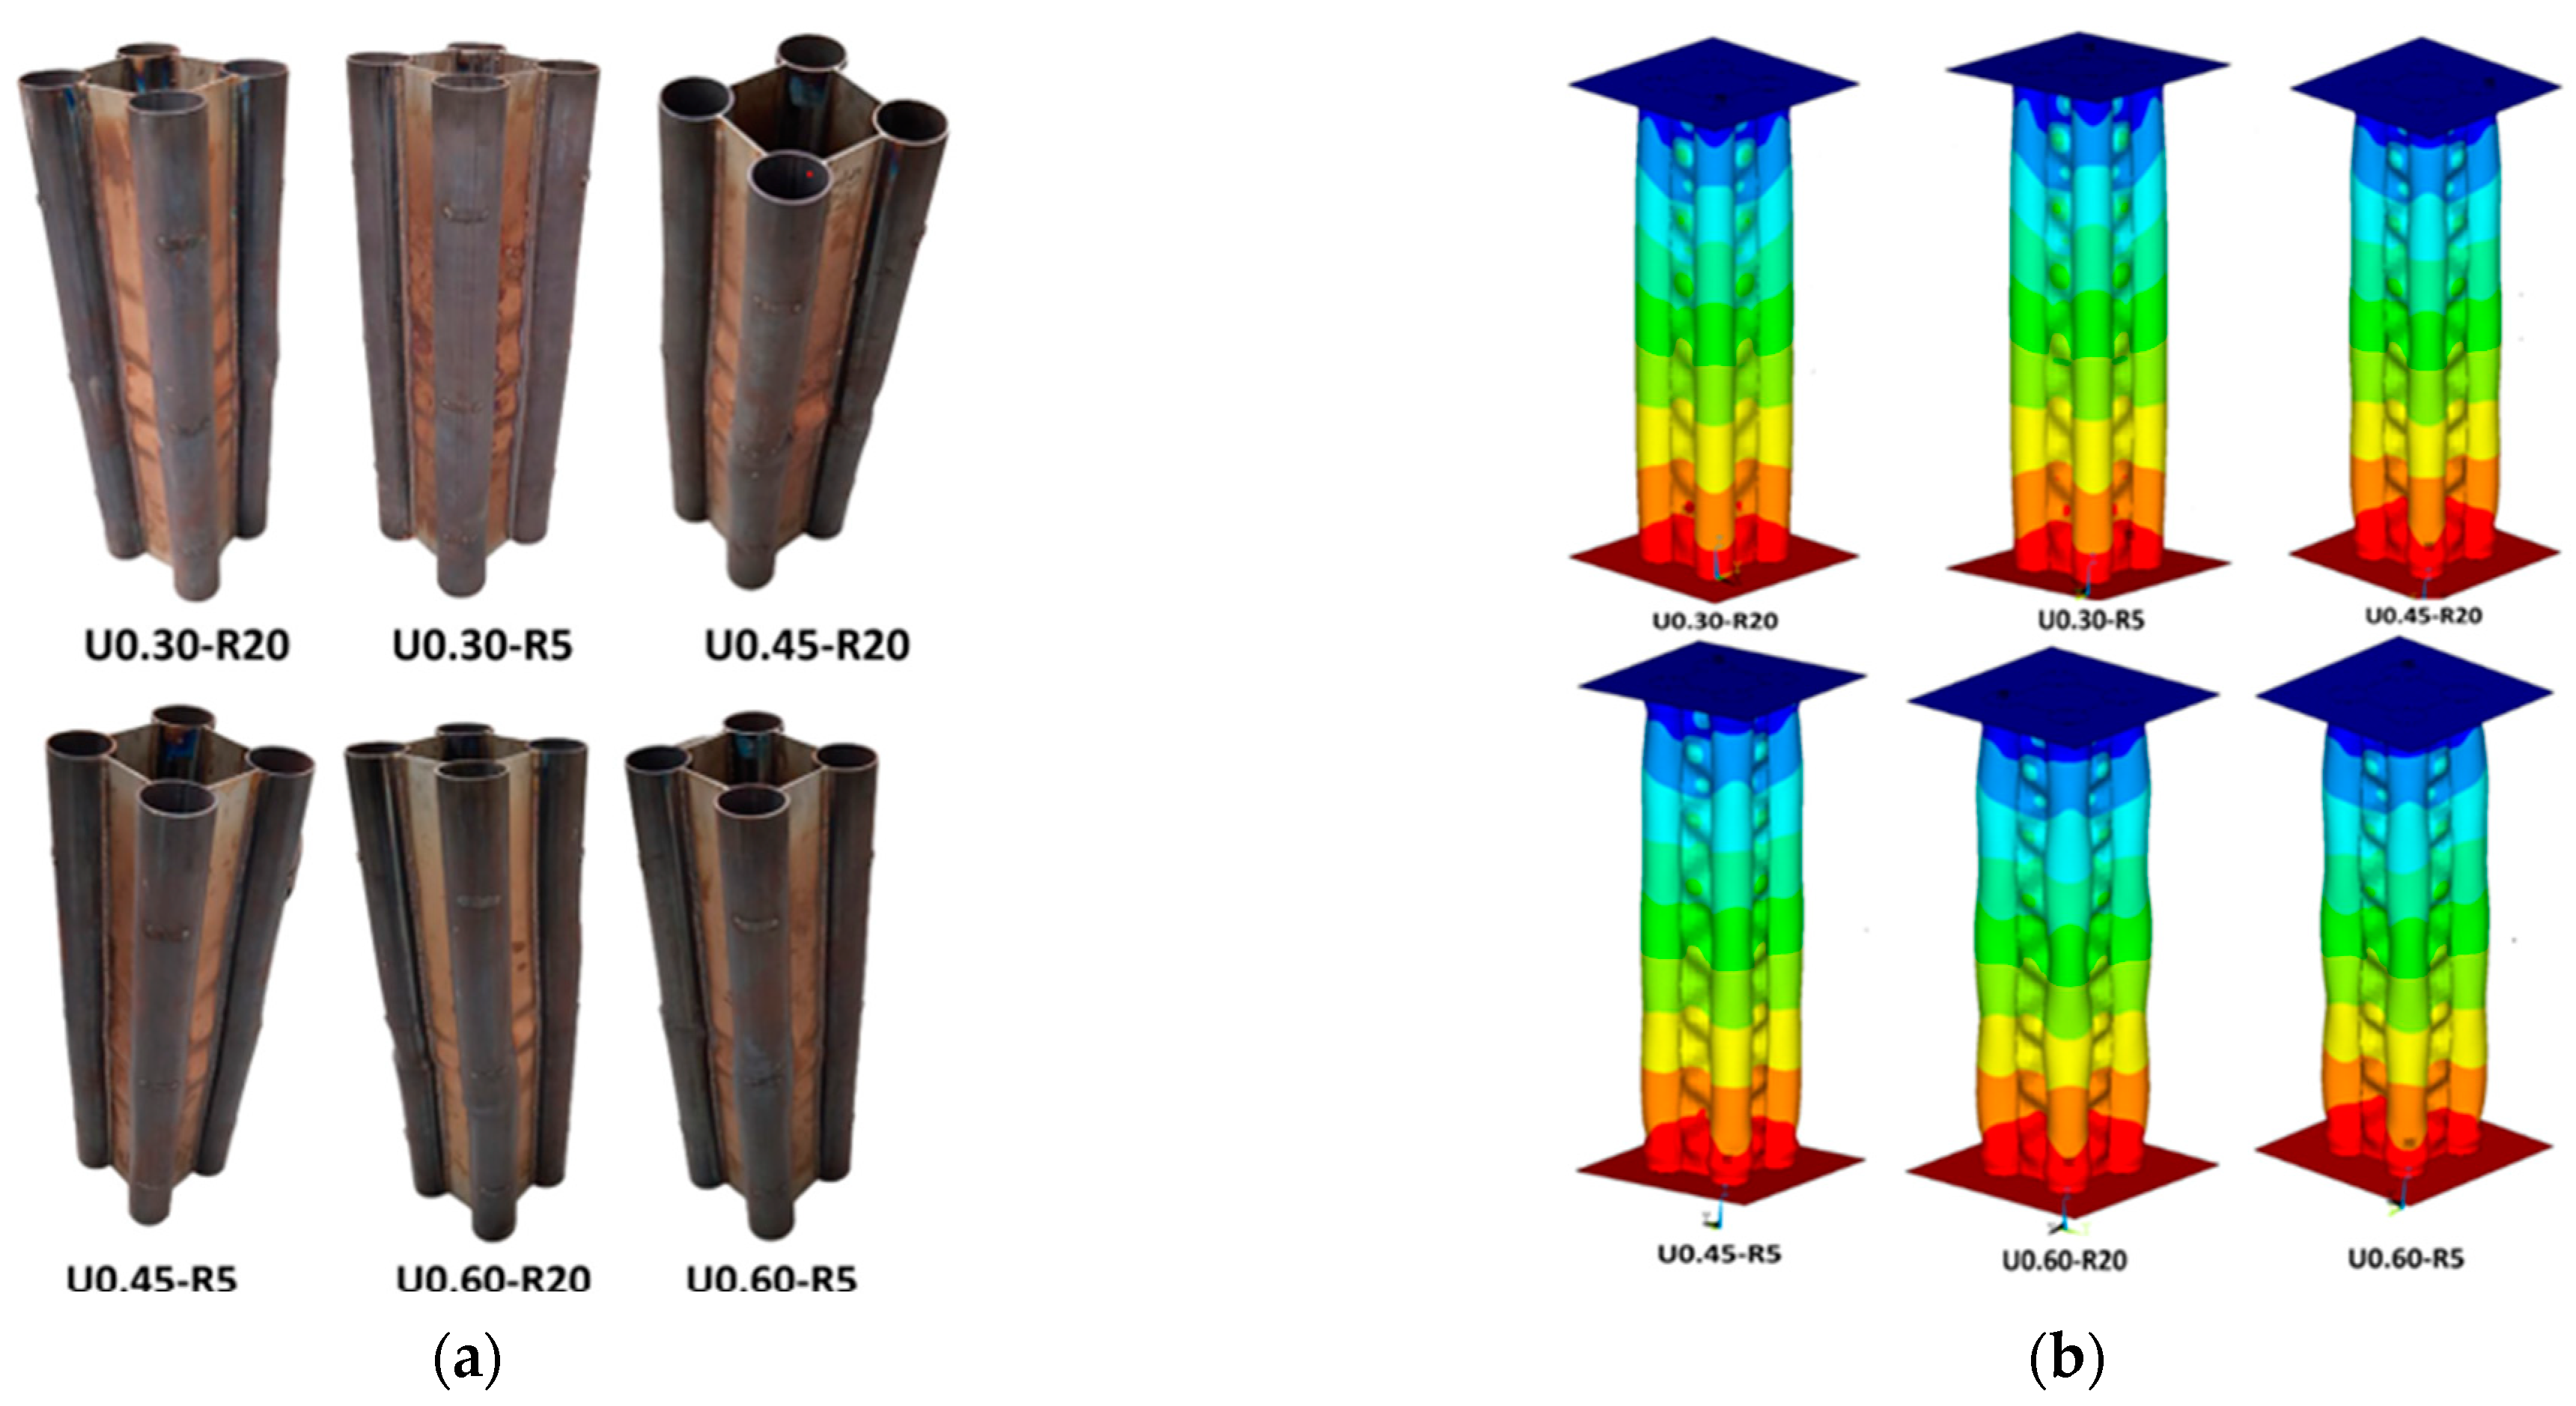
Figure 12 compares the experimental failure modes with those obtained by Ansys. As demonstrated, there is a good agreement in the deformed shape modes.

2.5. Thermal Analysis

The variable heating rate was selected to evaluate the standard fire ISO 834 heating curve. This heating curve corresponds to the typical furnace temperature and is used for both CHS and hybrid columns. Because there was no experimental temperature evolution on steel members, a nonlinear thermal analysis was developed. The temperature history was applied in both columns over time, using the additional mechanical load.
The first step was to change the structural elements (shell 181) to thermal elements (shell 131). This operation is carried out automatically in ANSYS, with the necessary adaptations regarding element options.
For the thermal simulation, it was necessary to add thermal properties such as thermal conductivity, specific heat, emissivity, and density, both at ambient temperature and at high temperatures. Additionally, exclusively for this analysis, the integration points of the sections were reduced from 5 (mechanical analysis) to 3 (thermal analysis). Next, a node located outside the column was designated to represent the furnace temperature, identified as “enclosure 1”. After that, convection and radiation were applied only to the exterior surfaces of the column, and the view factor for both sections was equal to 1 because both exterior surfaces were convex. Lastly, the initial temperature was set to 20 °C.
The equation governing heat transfer through a solid for an isotropic material can be expressed by Equation (9), where λ is the thermal conductivity, ρ is the density, and c p is the specific heat. This equation is solved using the weighted residual method, which transforms the differential equation into its integral form [20]. The solution of the simulation is obtained incrementally and iteratively using the Newton–Raphson method. The analysis type was set as transient, with an incremental time of 60 s, which could be reduced to 1 s if needed. The convergence criterion adopted was the heat flux, with a tolerance of 0.005 and a minimum reference value of 10−6 W.
x λ T x + y λ T y + z λ T z = ρ   c p   T t   ,

2.6. Thermo-Mechanical Analysis

From the temperature profile over time obtained from the thermal simulation, a nonlinear thermo-mechanical analysis was conducted. To do this, it was necessary to extract the temperature values from the previous analysis. Several load steps were defined within a time increment of 10 s. It was also necessary to change again the type of elements from thermal back to structural. Additionally, it was required to redefine the boundary conditions, forces, and section integration points, reverting to the conditions of the nonlinear high temperature buckling analysis. The convergence criterion adopted was based on displacement, with a tolerance of 0.001 and a minimum reference value of 3 m. This means that the equilibrium position of the element was defined by a 3 mm tolerance.

3. Parametric Analysis of CHS Columns

This section investigates the behaviour of UHSS CHS columns in high-temperature environments, considering four main varying parameters: column thickness, length, heating rate, and load level, as represented in Table 13. A total of 126 simulations were conducted.
Therefore, considering variations in thickness and length, six different geometries were used, as shown in Table 14.

3.1. Effect of the Load Level on the Critical Temperature

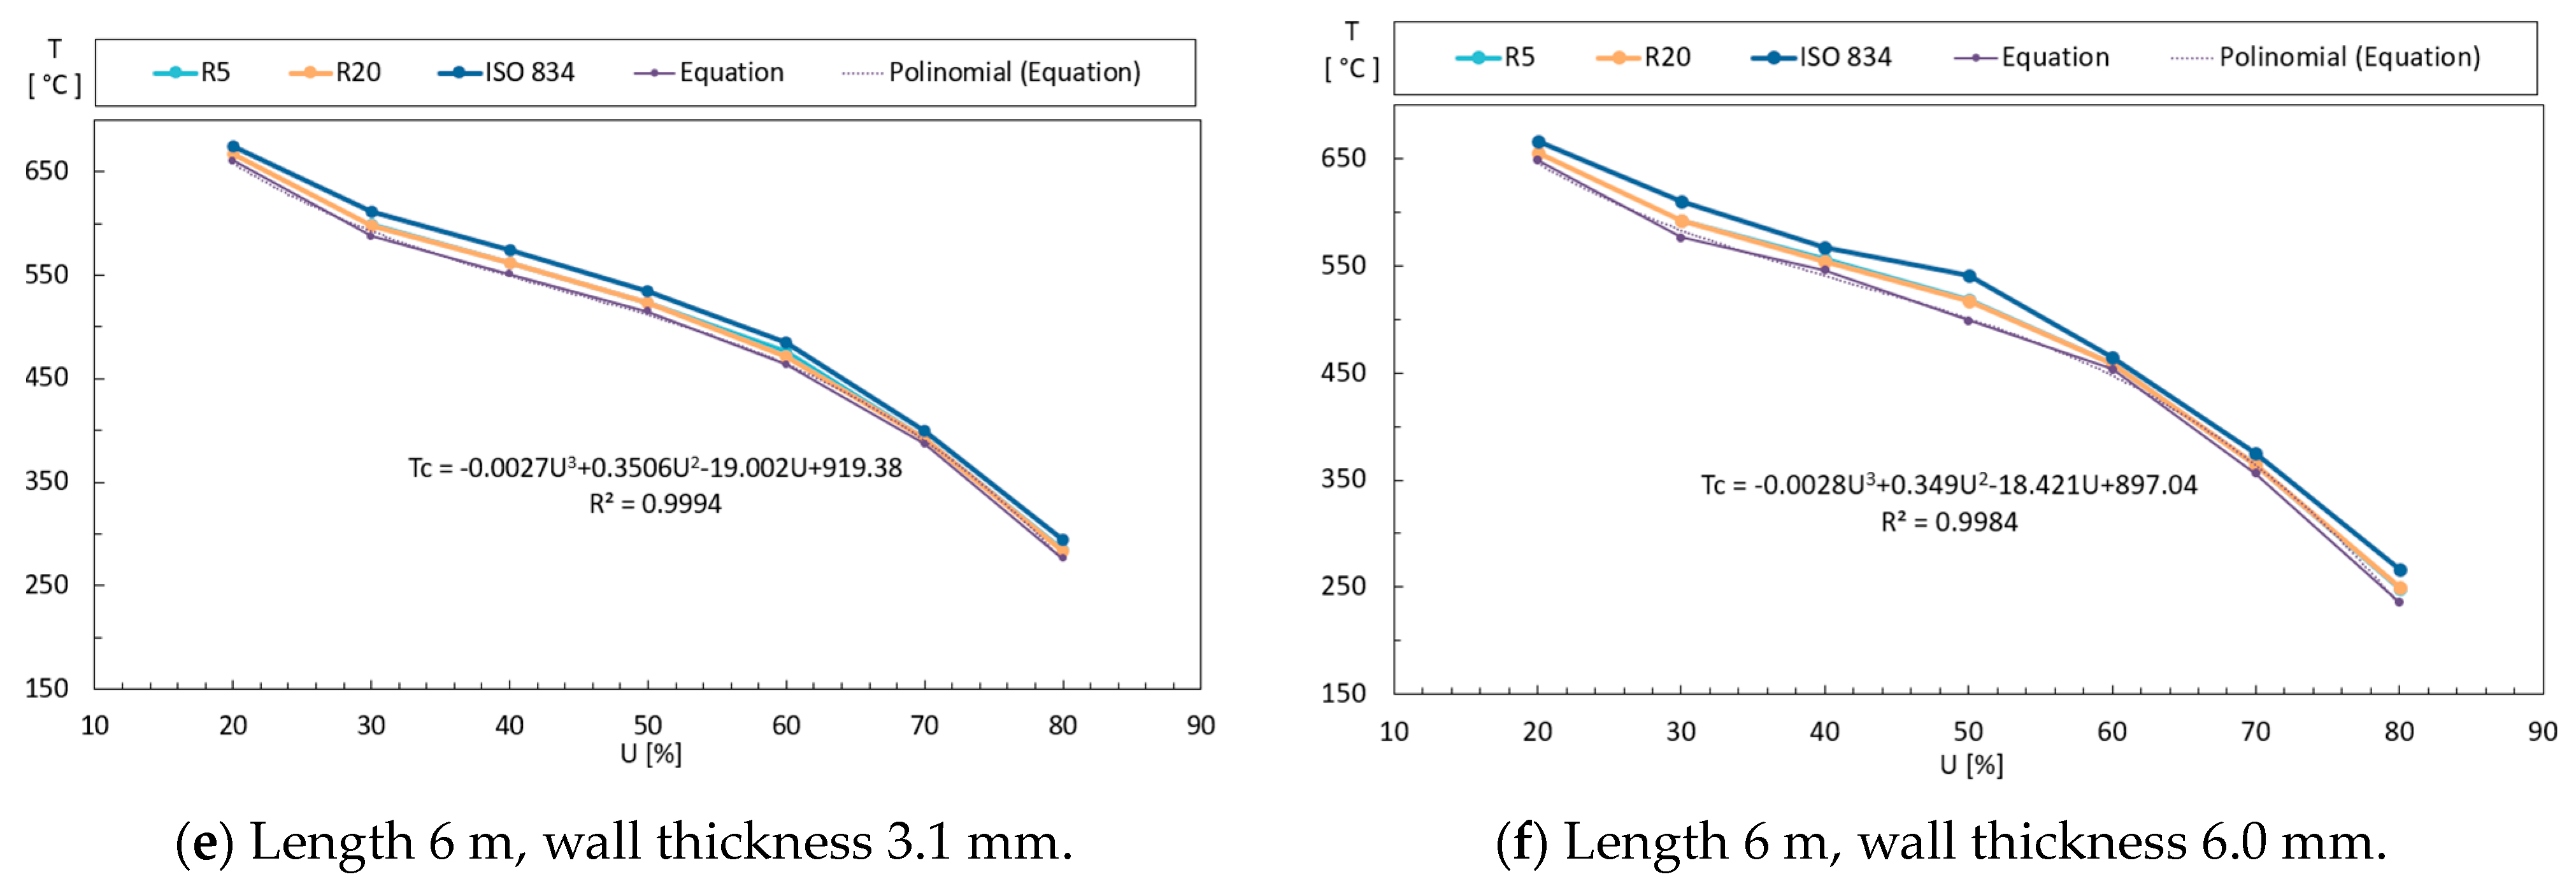
From the results obtained by the simulations to understand the critical temperature behaviour for CHS columns with varying load levels, design curves were developed. These design curves were developed as shown by Equation (9), considering the critical temperature for the three heating regimes used in the study for each load level. These equations are applicable between load levels of 20% and 80%, considering a statistical normal distribution with a 95% confidence interval. The proposed equations are using third-order polynomials, exhibiting a correlation coefficient close to 1.
T C r i t = A v e r a g e 2 S t a n d a r d   D e v i a t i o n
The design curve can be seen in Figure 13, which represents the critical temperature variation with the load level (U) for CHS columns. Figure 13a presents a CHS element with a length of 0.78 m and a thickness of 3.1 mm, while Figure 13b depicts a CHS with the same length but a thickness of 6 mm. Figure 13c,d present the results for the CHS columns with 3 m with thicknesses of 3.1 mm and 6 mm, respectively. Finally, Figure 13e,f depict CHS, using the same thickness values, respectively.
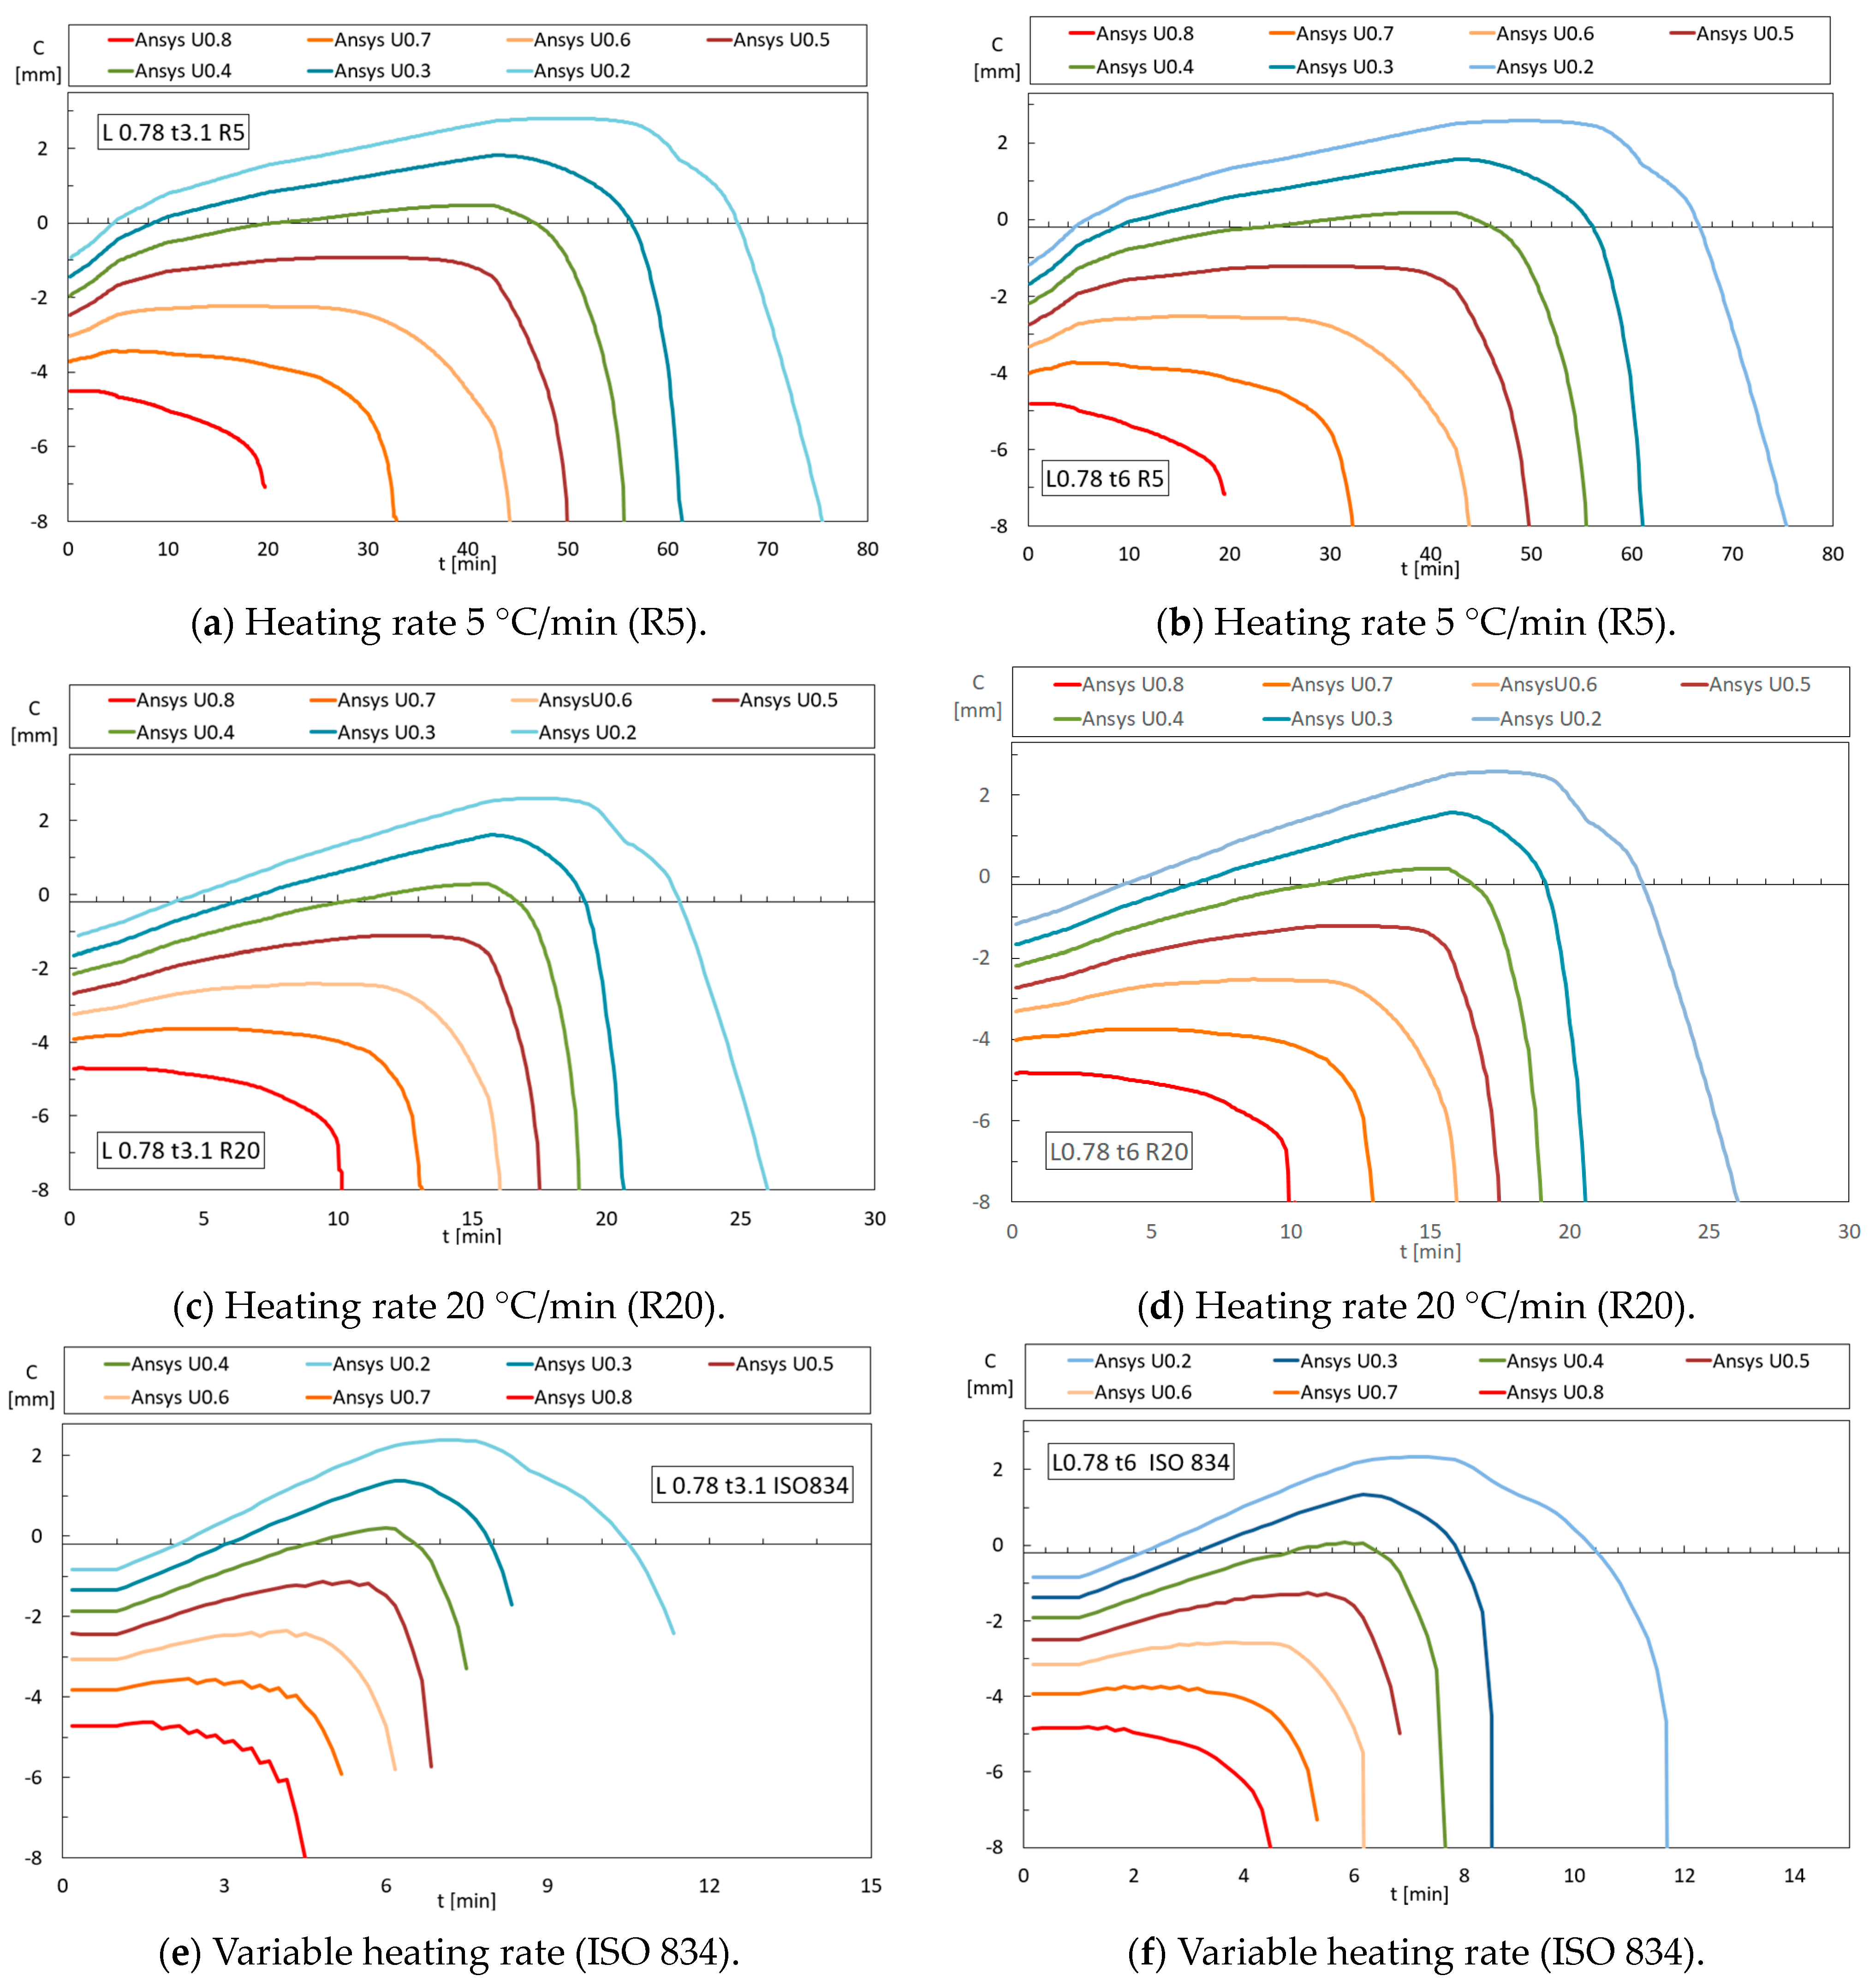
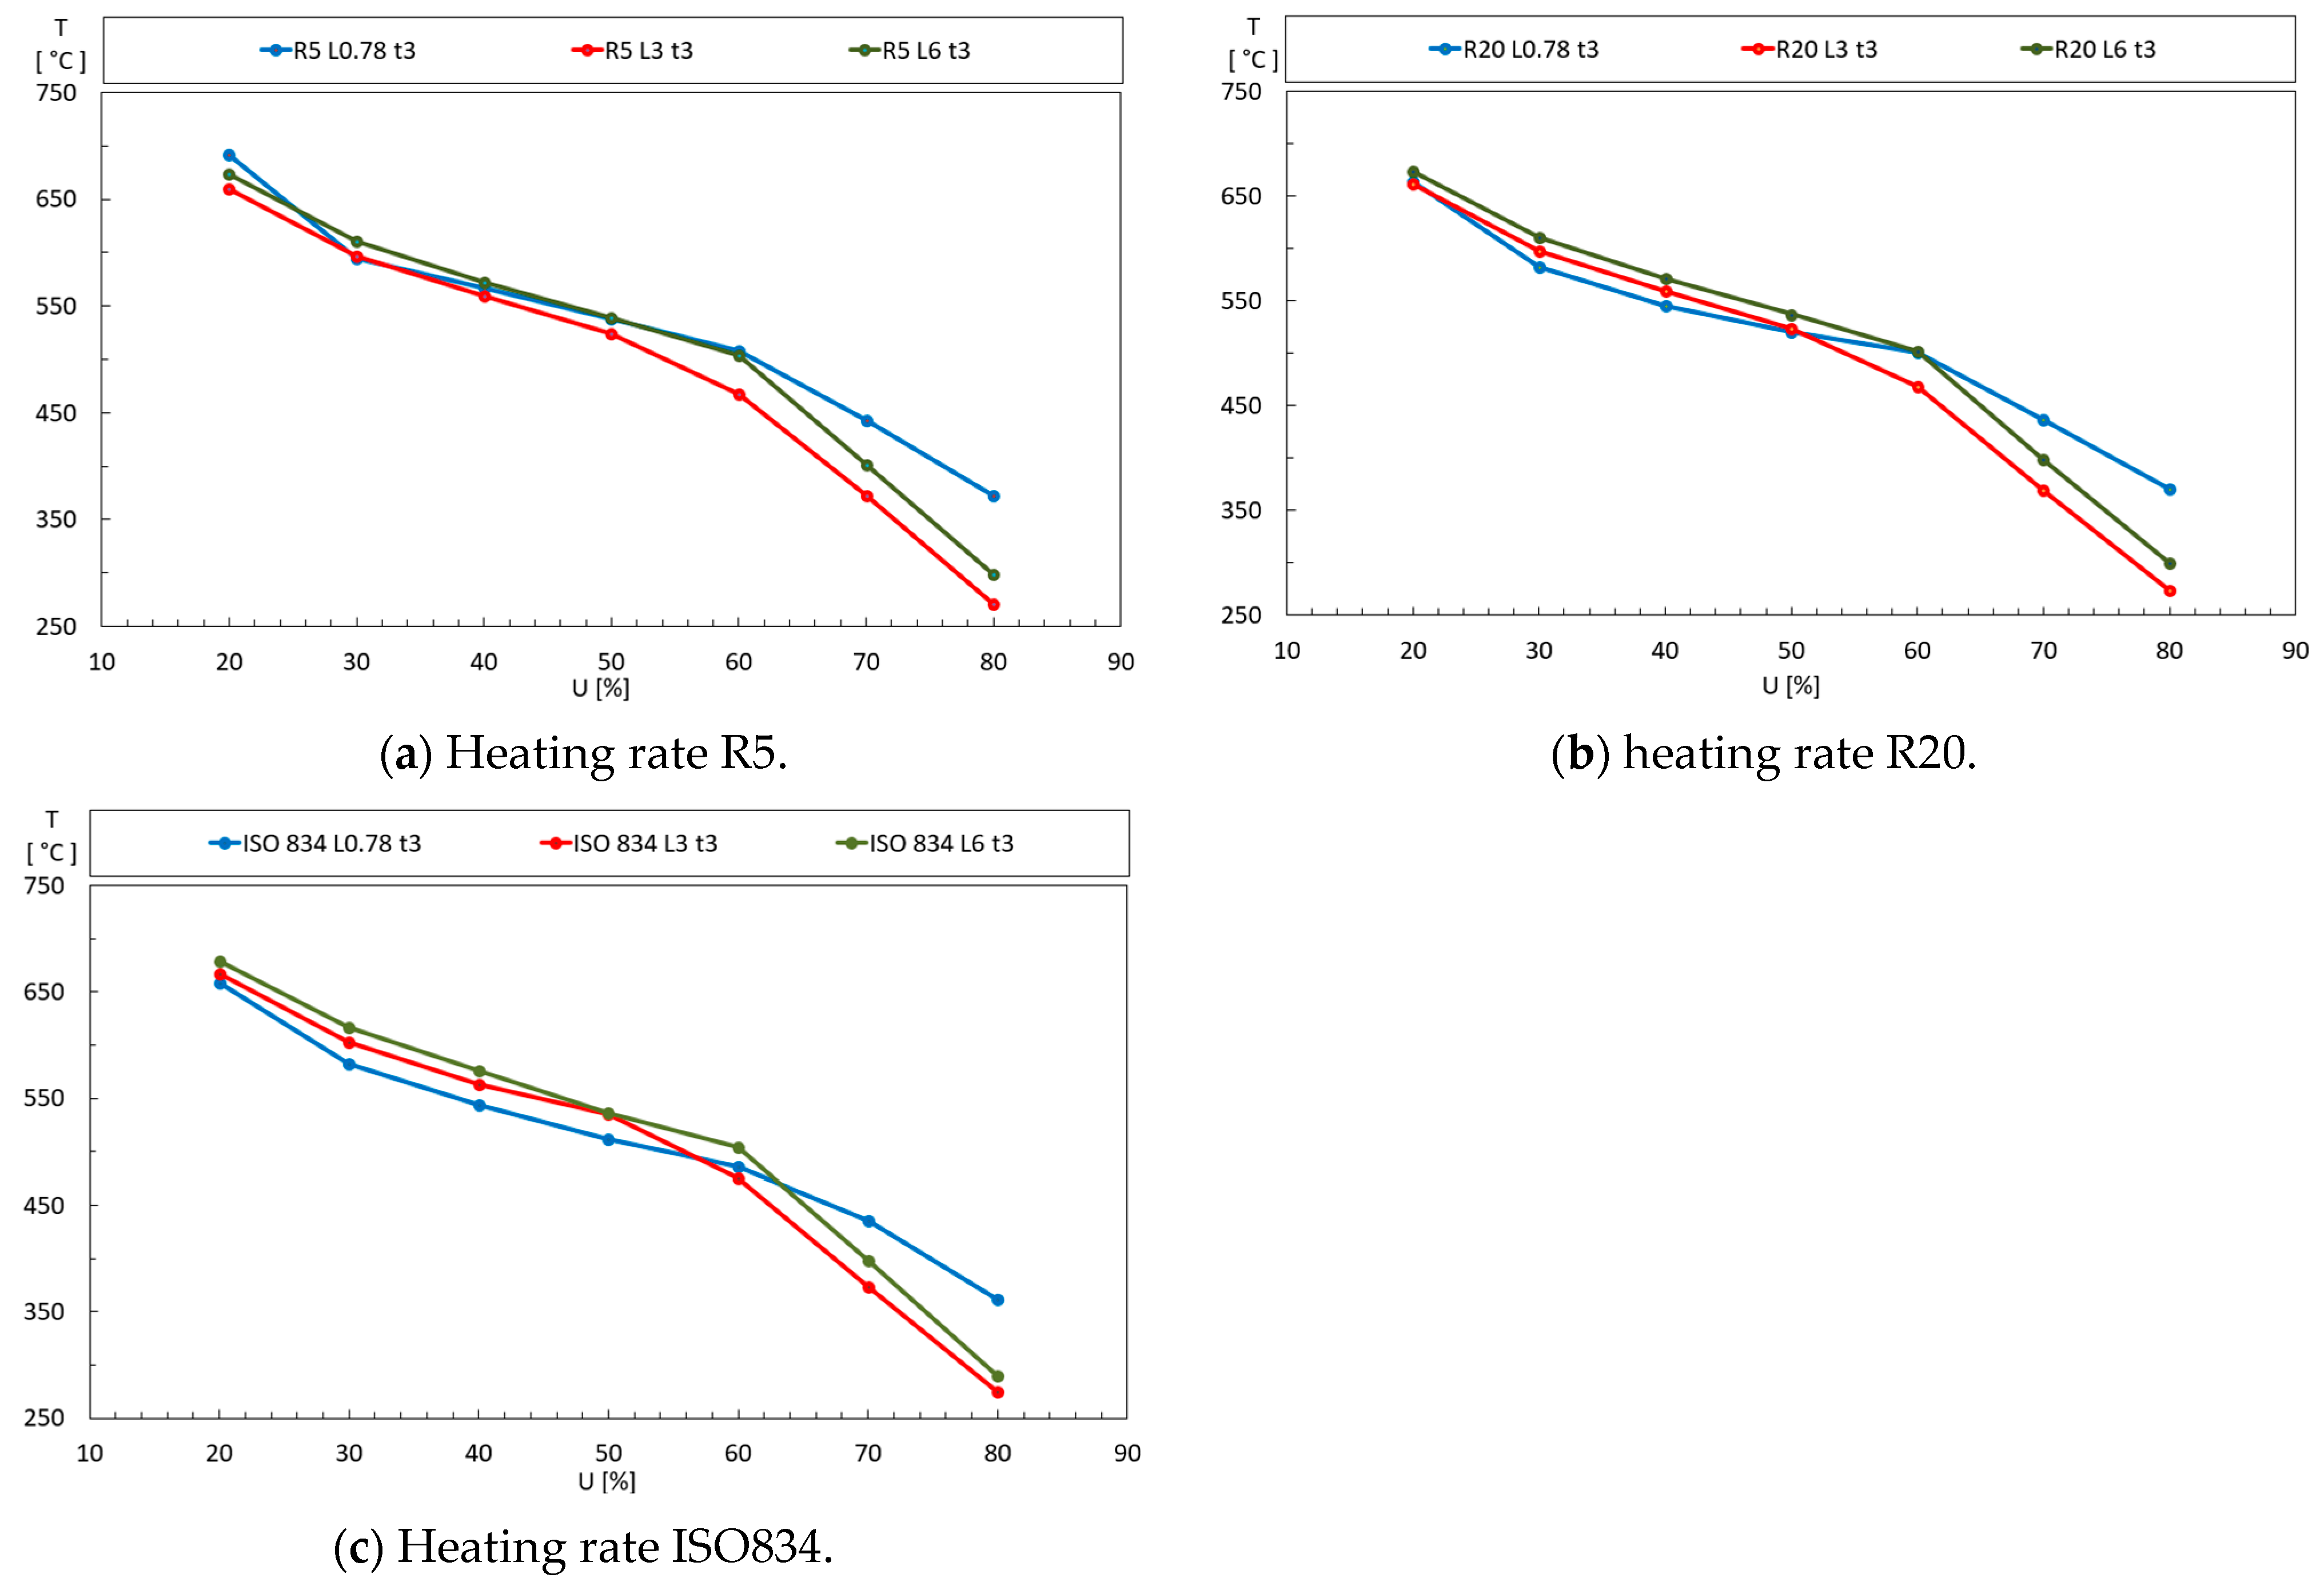
Furthermore, the displacement time history is represented in Figure 14 for different load levels, considering the various heating rates. Across all heating rates, a consistent pattern emerges: an initial contraction displacement due to the mechanical load, followed by thermal expansion in the opposite direction and, finally, a return to contraction, marking the column’s failure mode. This characteristic behaviour is instrumental in defining the fire resistance time, either using the criteria outlined in standard EN1363-1 [15] or using the ultimate load increment to establish the equilibrium (ANSYS).
Figure 14a,c,e correspond to CHS columns with a length of 0.78 m and a thickness of 3.1 mm, with heating rates R5, R20, and ISO 834, respectively. On the other hand, Figure 14b,d,f represent CHS columns with the same length of 0.78 m but a thickness of 6 mm, also with different heating rates R5, R20, and ISO 834, respectively. As shown in Figure 13 and Figure 14, an increase in the load level significantly decreases the critical temperature and the fire resistance time of the column. Furthermore, it is noted that the variation in critical temperature is greater for small and large load levels. It is also noted that the fire resistance time decreases with the heating rate.

3.2. Effect of the Wall Thickness on the Critical Temperature

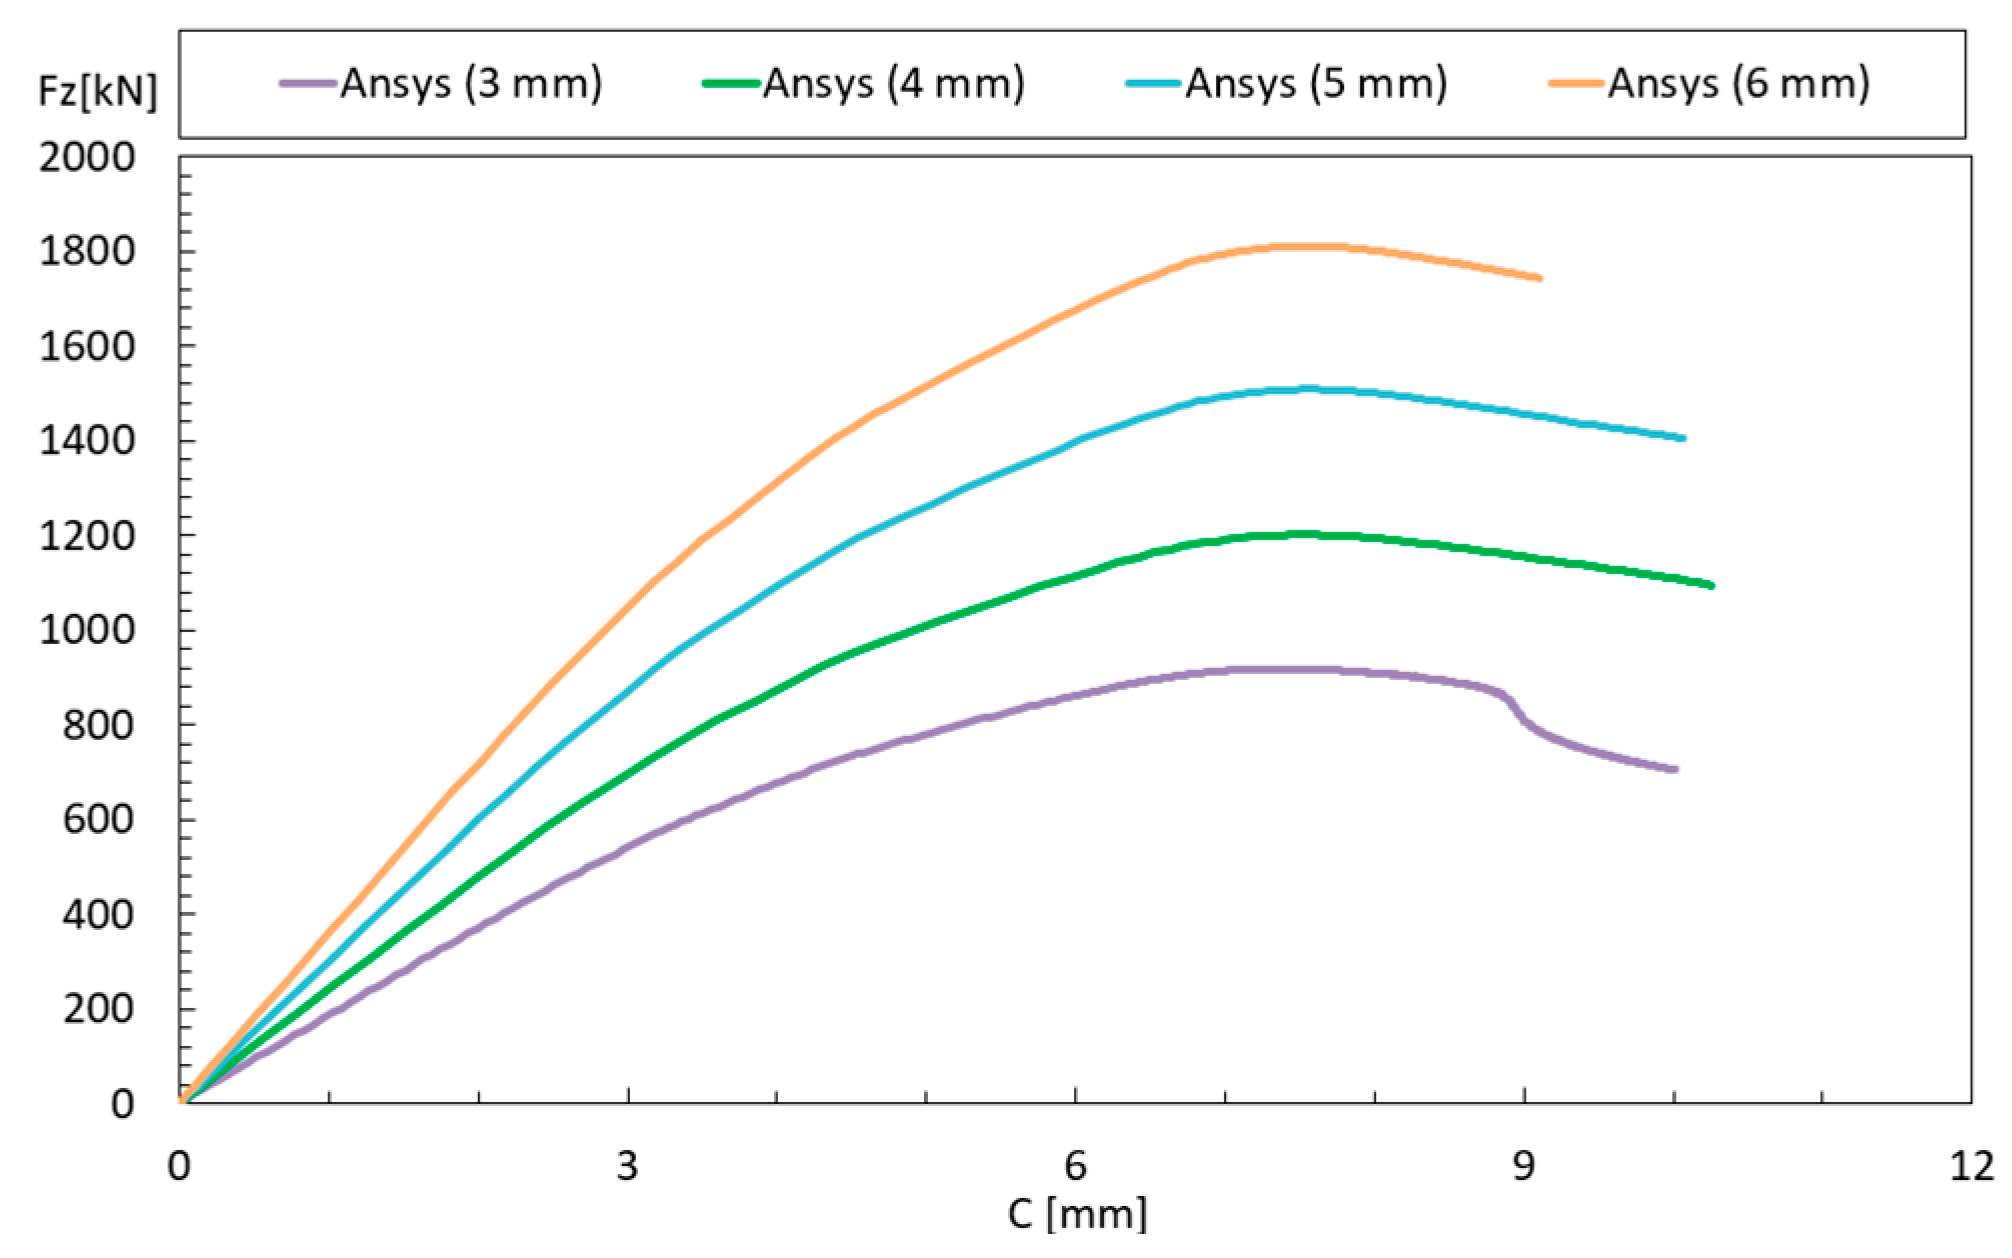
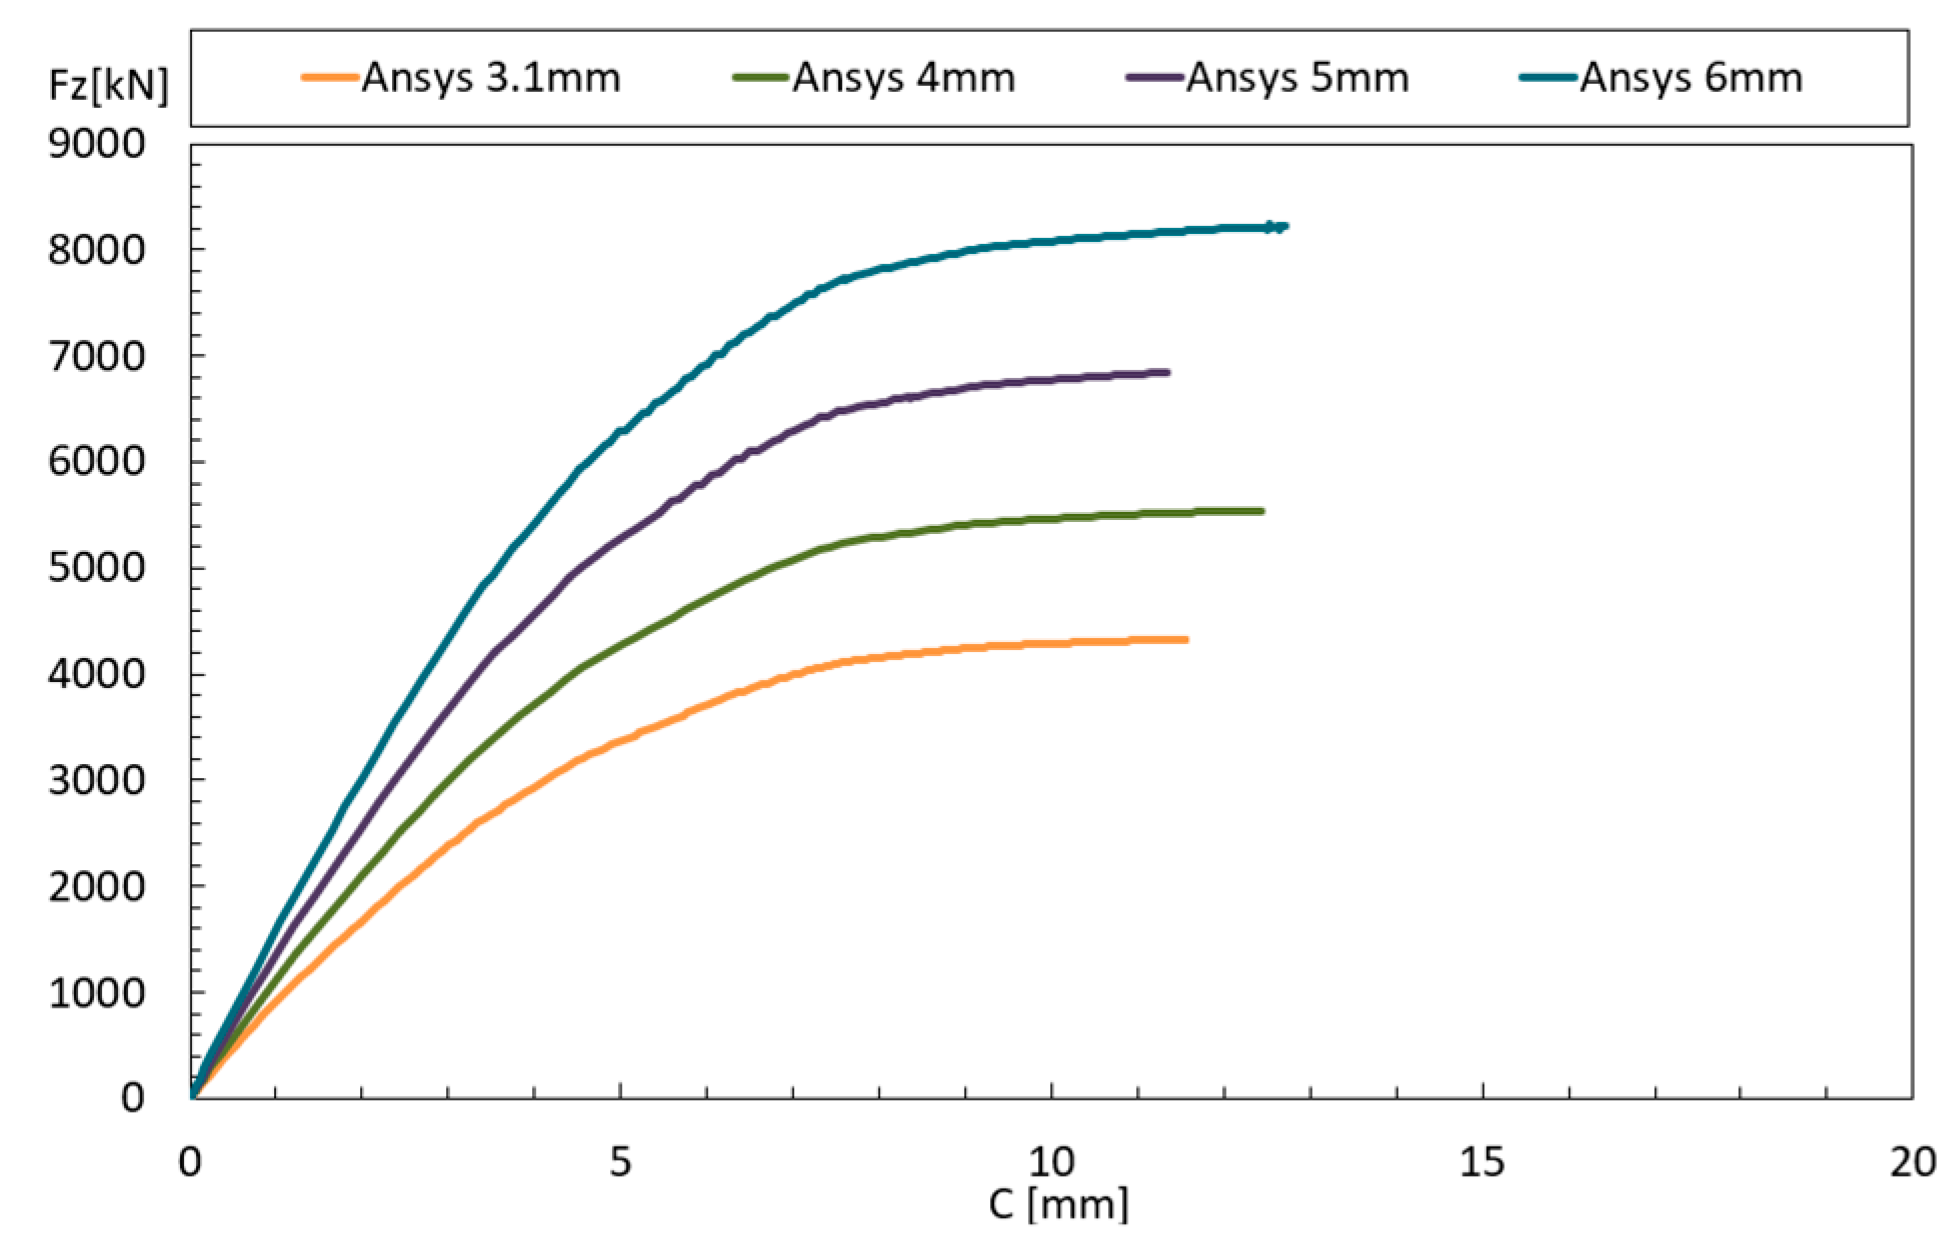
Before conducting the GMNIA analyses at elevated temperatures, it was necessary to perform analyses at room temperature to determine the maximum load-bearing capacity for different thicknesses. The results obtained at room temperature are depicted in Figure 15. Initially, analyses were conducted for four different thicknesses; however, it was decided to focus only on thicknesses of 3.1 mm and 6 mm in the subsequent parametric analysis.
As observed in Figure 13 and Figure 14, in cases where the length is 0.78 m, an increase in thickness did not result in a significant change in critical temperature and time for the same load level. This small effect is attributed to the minor increase in column slenderness, despite the thickness nearly doubling.

3.3. Effect of the Element Length on the Critical Temperature Using Different Heating Rates

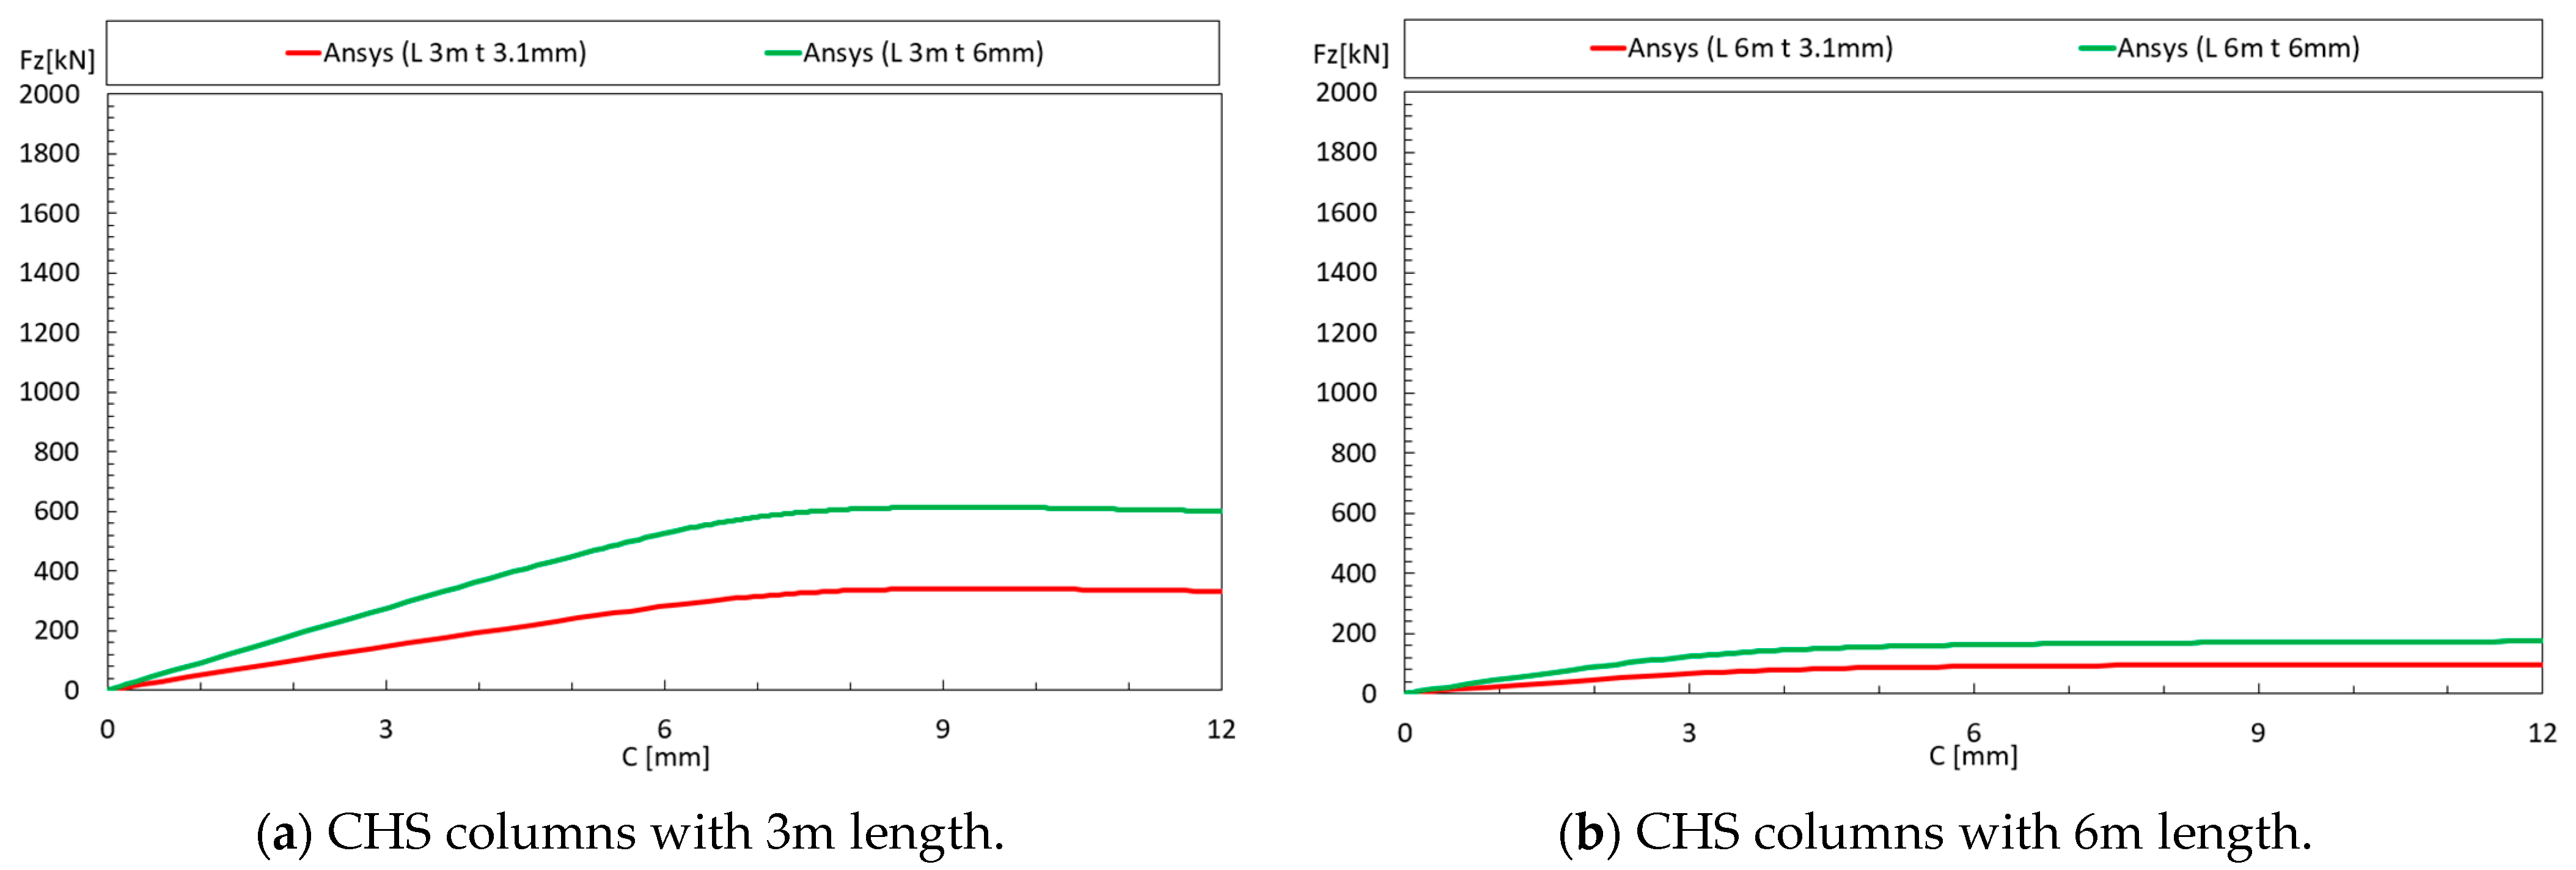
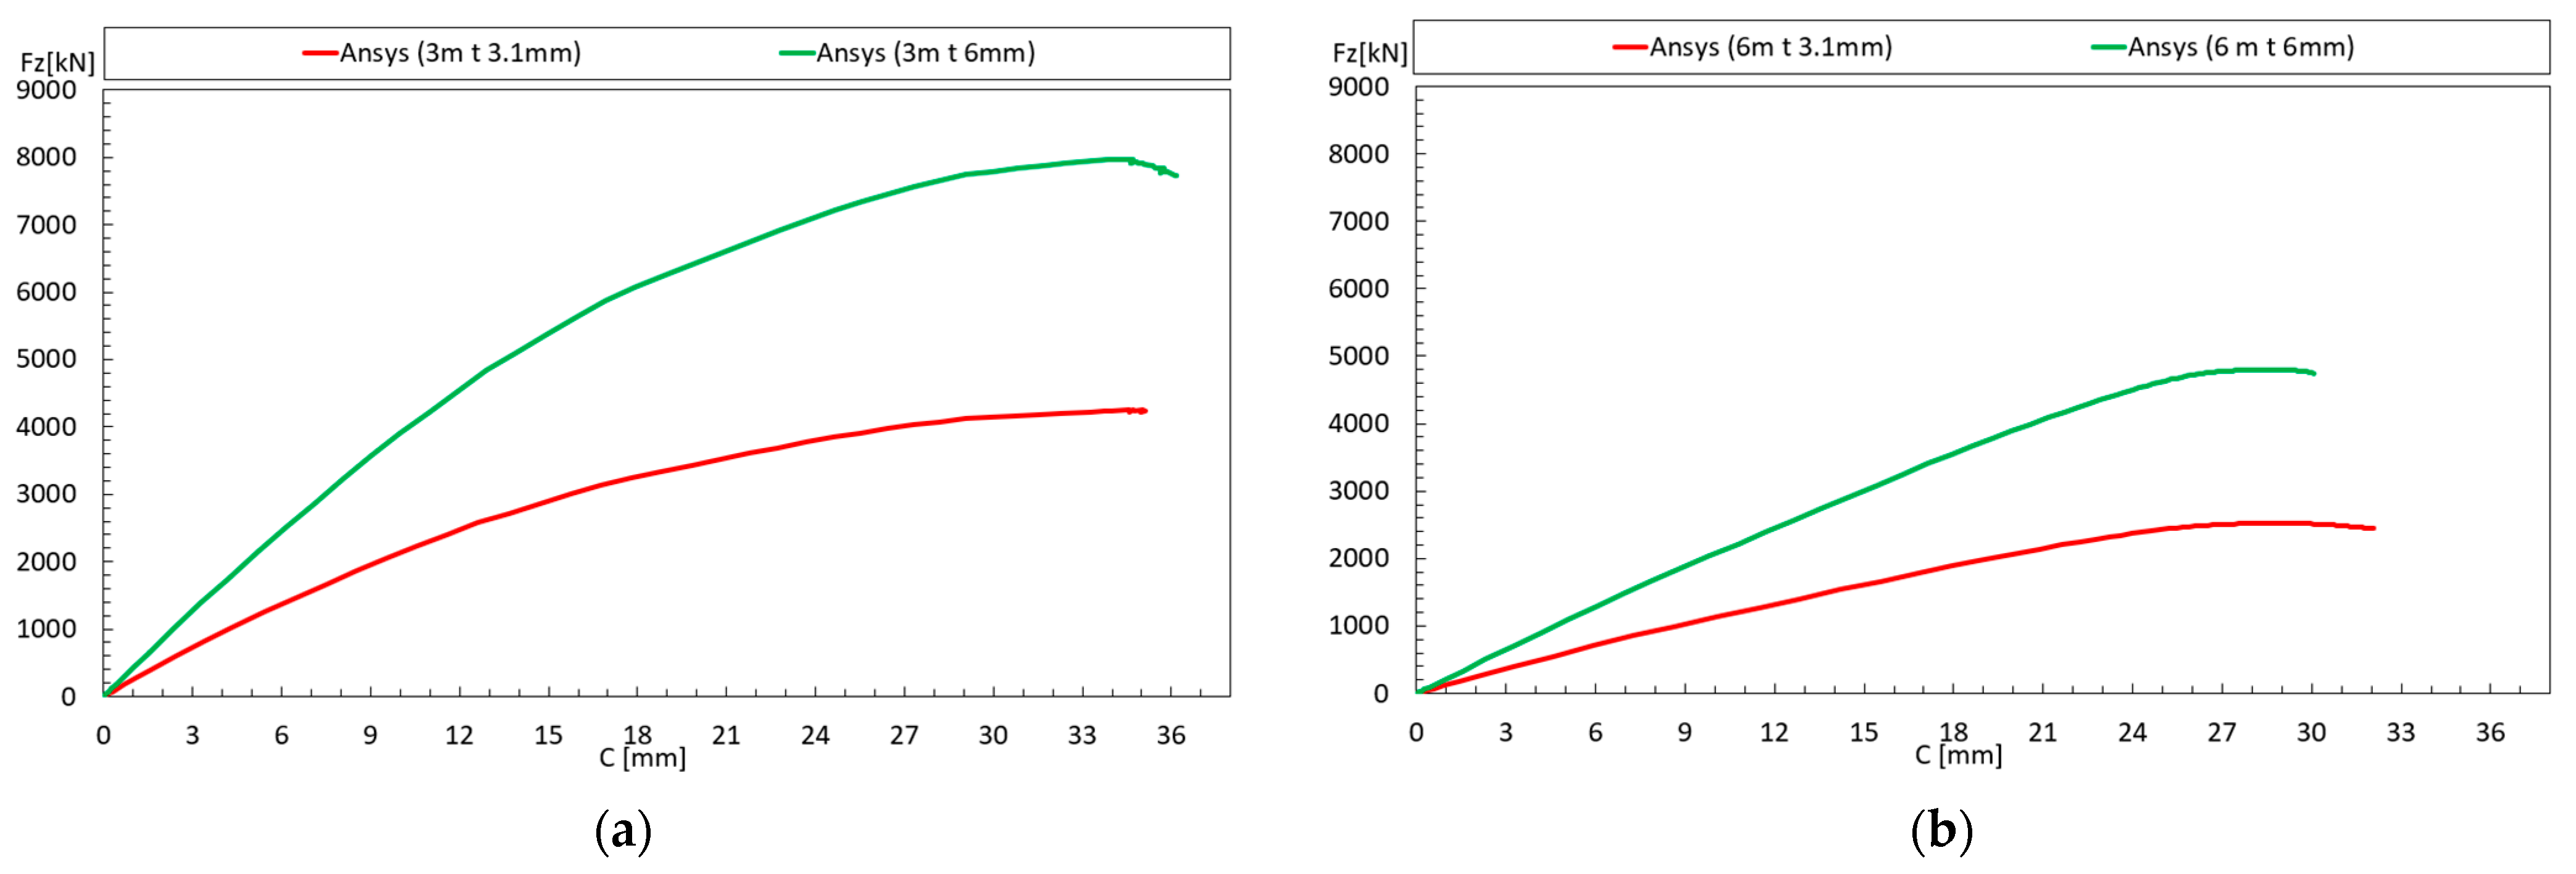
For the parametric analysis involving column length, it was necessary to modify the mesh and reintroduce imperfections. Therefore, for the longer columns, the number of divisions in the direction of their length was increased. The columns with a length of 3 m were divided into 150 elements along their length, resulting in 5440 elements, while the column with a length of 6 m was divided into 300 elements, resulting in 10,240 elements. As for imperfections for these longer lengths, only the global imperfection was used. Moreover, simulations at room temperature were developed, as shown in Figure 16. These simulations were developed to determine the load-bearing capacity; in Figure 16a, the results are presented for CHS columns with length of 3 m, and in Figure 16b, the results are presented for CHS columns with 6m length.
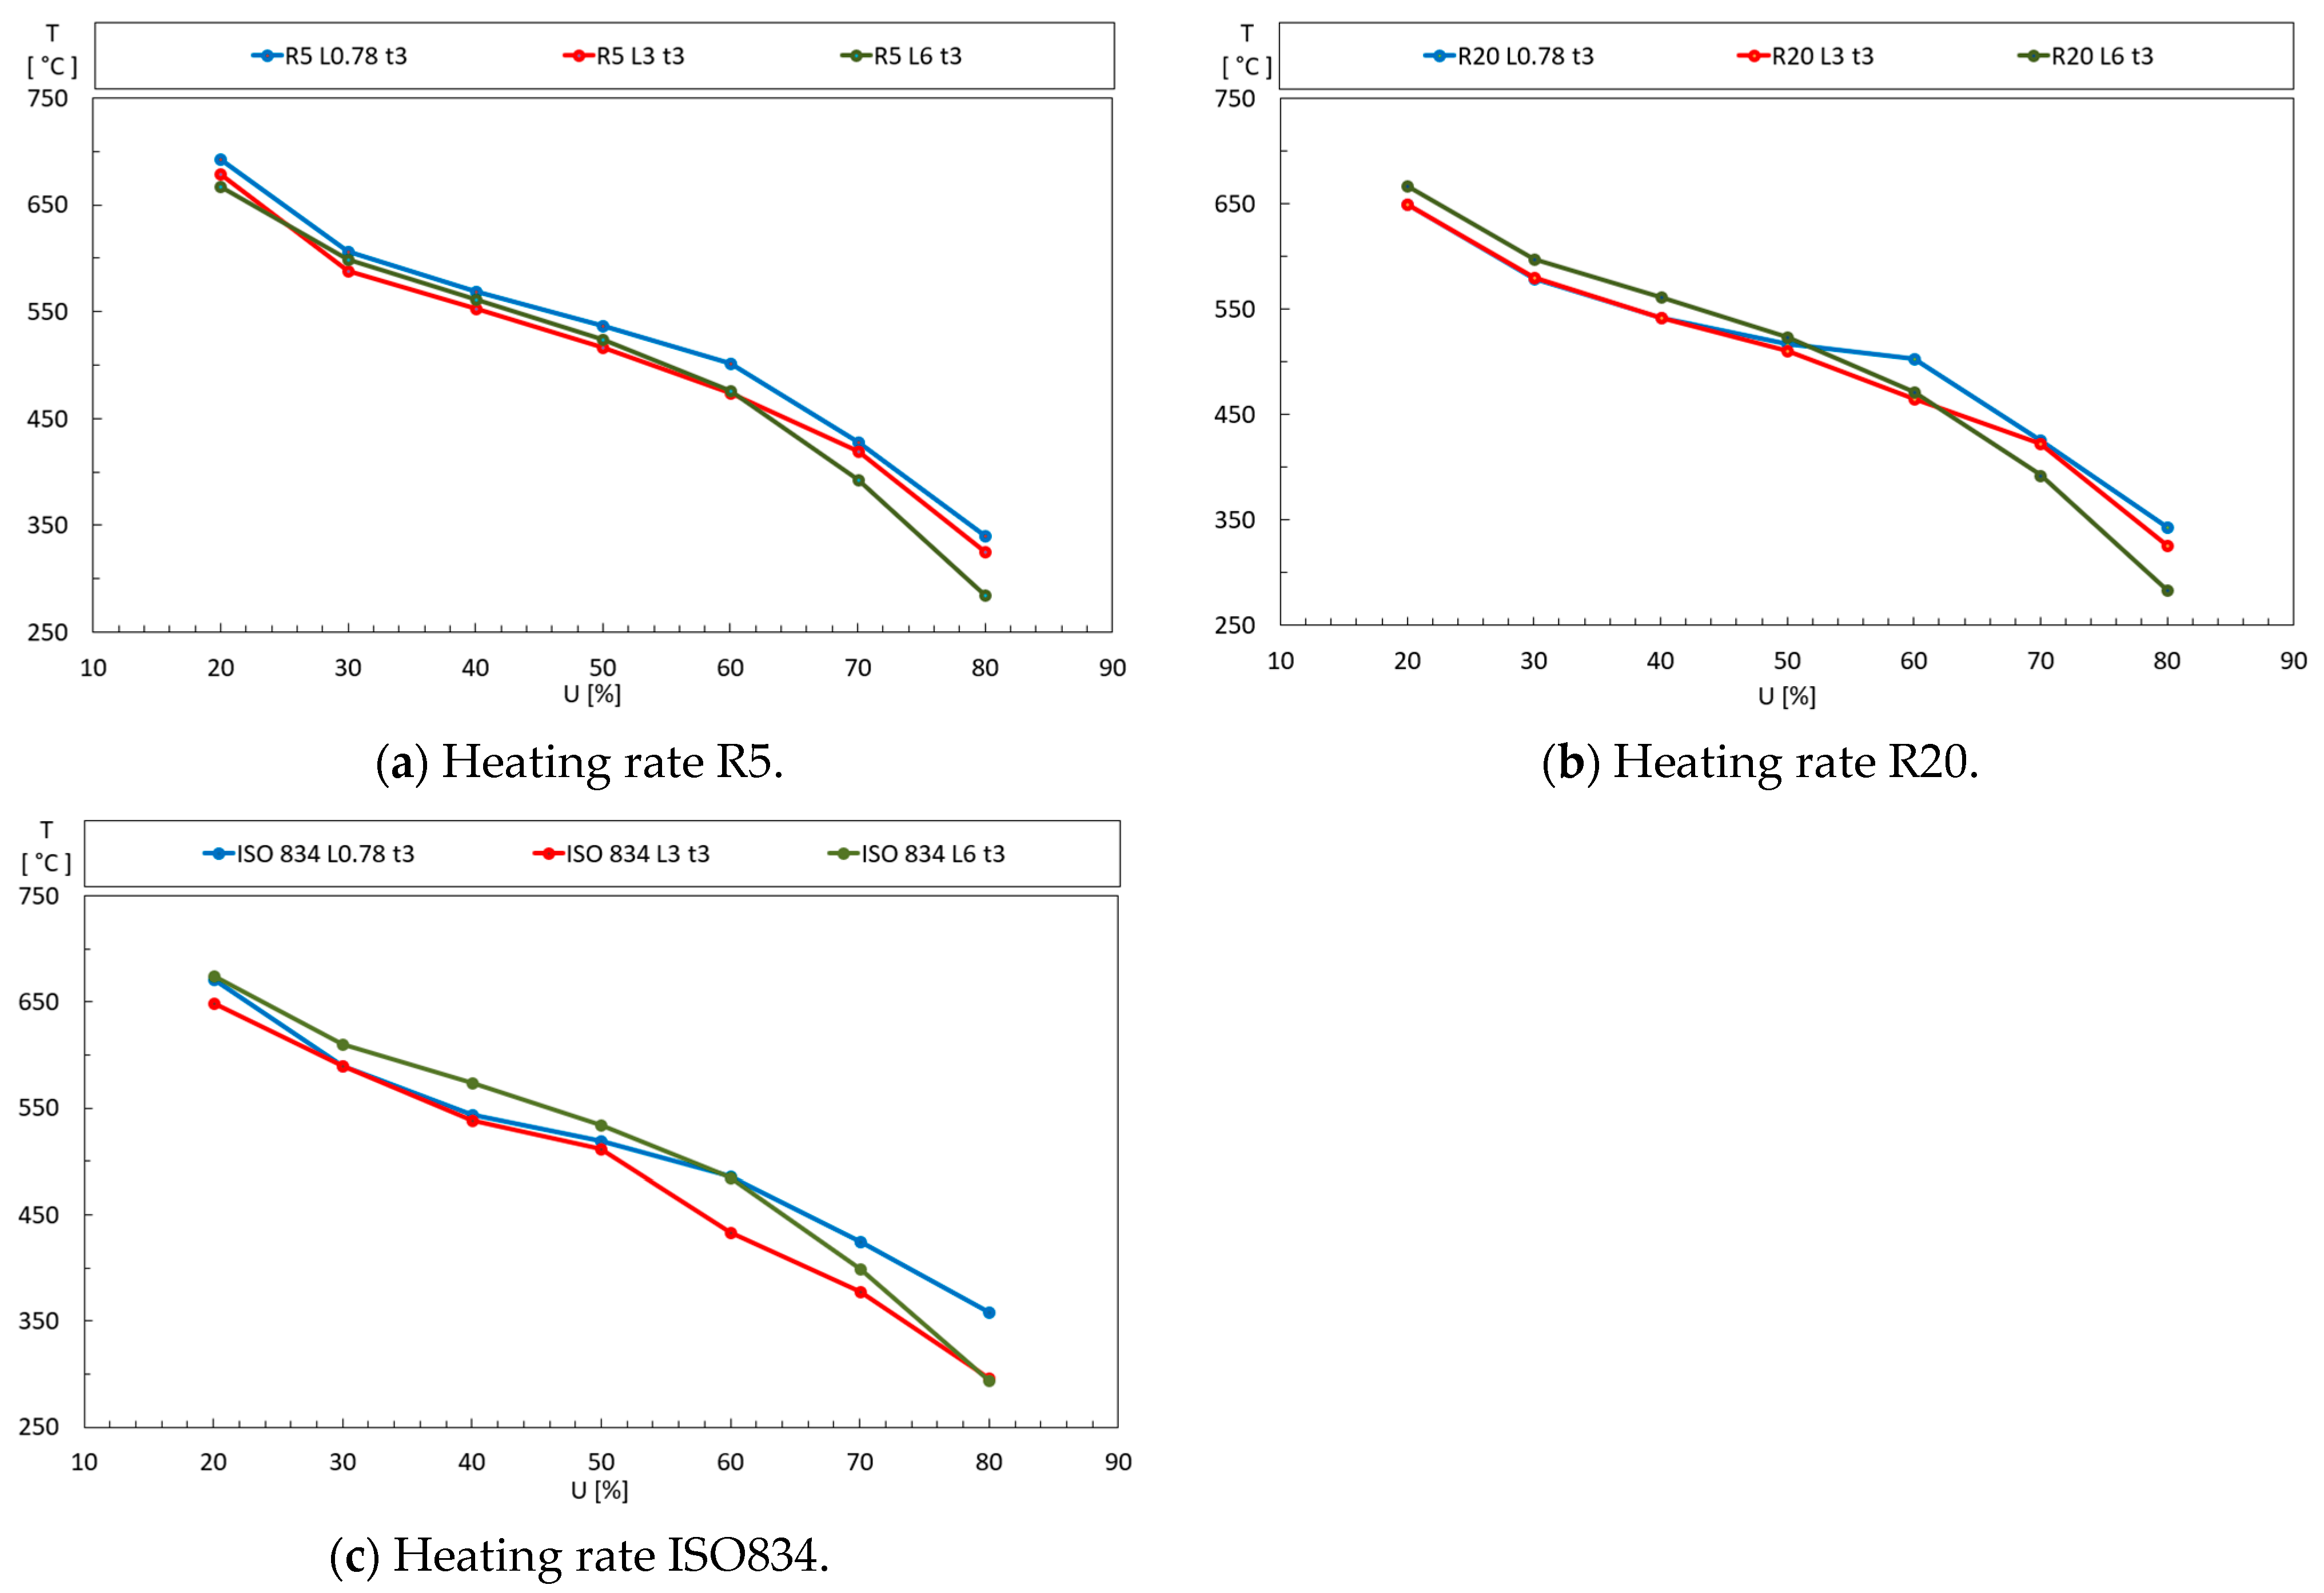
With these simulations completed, the analyses with the three heating regimes were carried out to examine the effect of length on critical temperature, as shown in Figure 17. Figure 17a presents the results for heating rate R5, Figure 17b for heating rate R20 and Figure 17c for ISO 834. The results indicate that the variation in length has a complex impact on critical temperature, which aligns with observations made by Farmani et al. [11]. They also noted the complexity of critical temperature concerning slenderness variation.
Additionally, Farmani et al. [11] mentioned that for load levels below 60%, higher slenderness columns generally led to higher critical temperatures. Conversely, for load levels exceeding 60%, in intermediate slenderness columns exhibited the lowest critical temperature values. These findings are supported by Figure 17.

4. Parametric Analysis of Hybrid Columns

This section presents the parametric study developed on UHSS hybrid columns. Four parameters were considered: tube wall thickness, length, heating rate, and load level, as outlined in Table 15. That makes for six distinct geometries, considering variations in both thickness and length, as outlined in Table 16.

4.1. Effect of the Load Level on the Critical Temperature

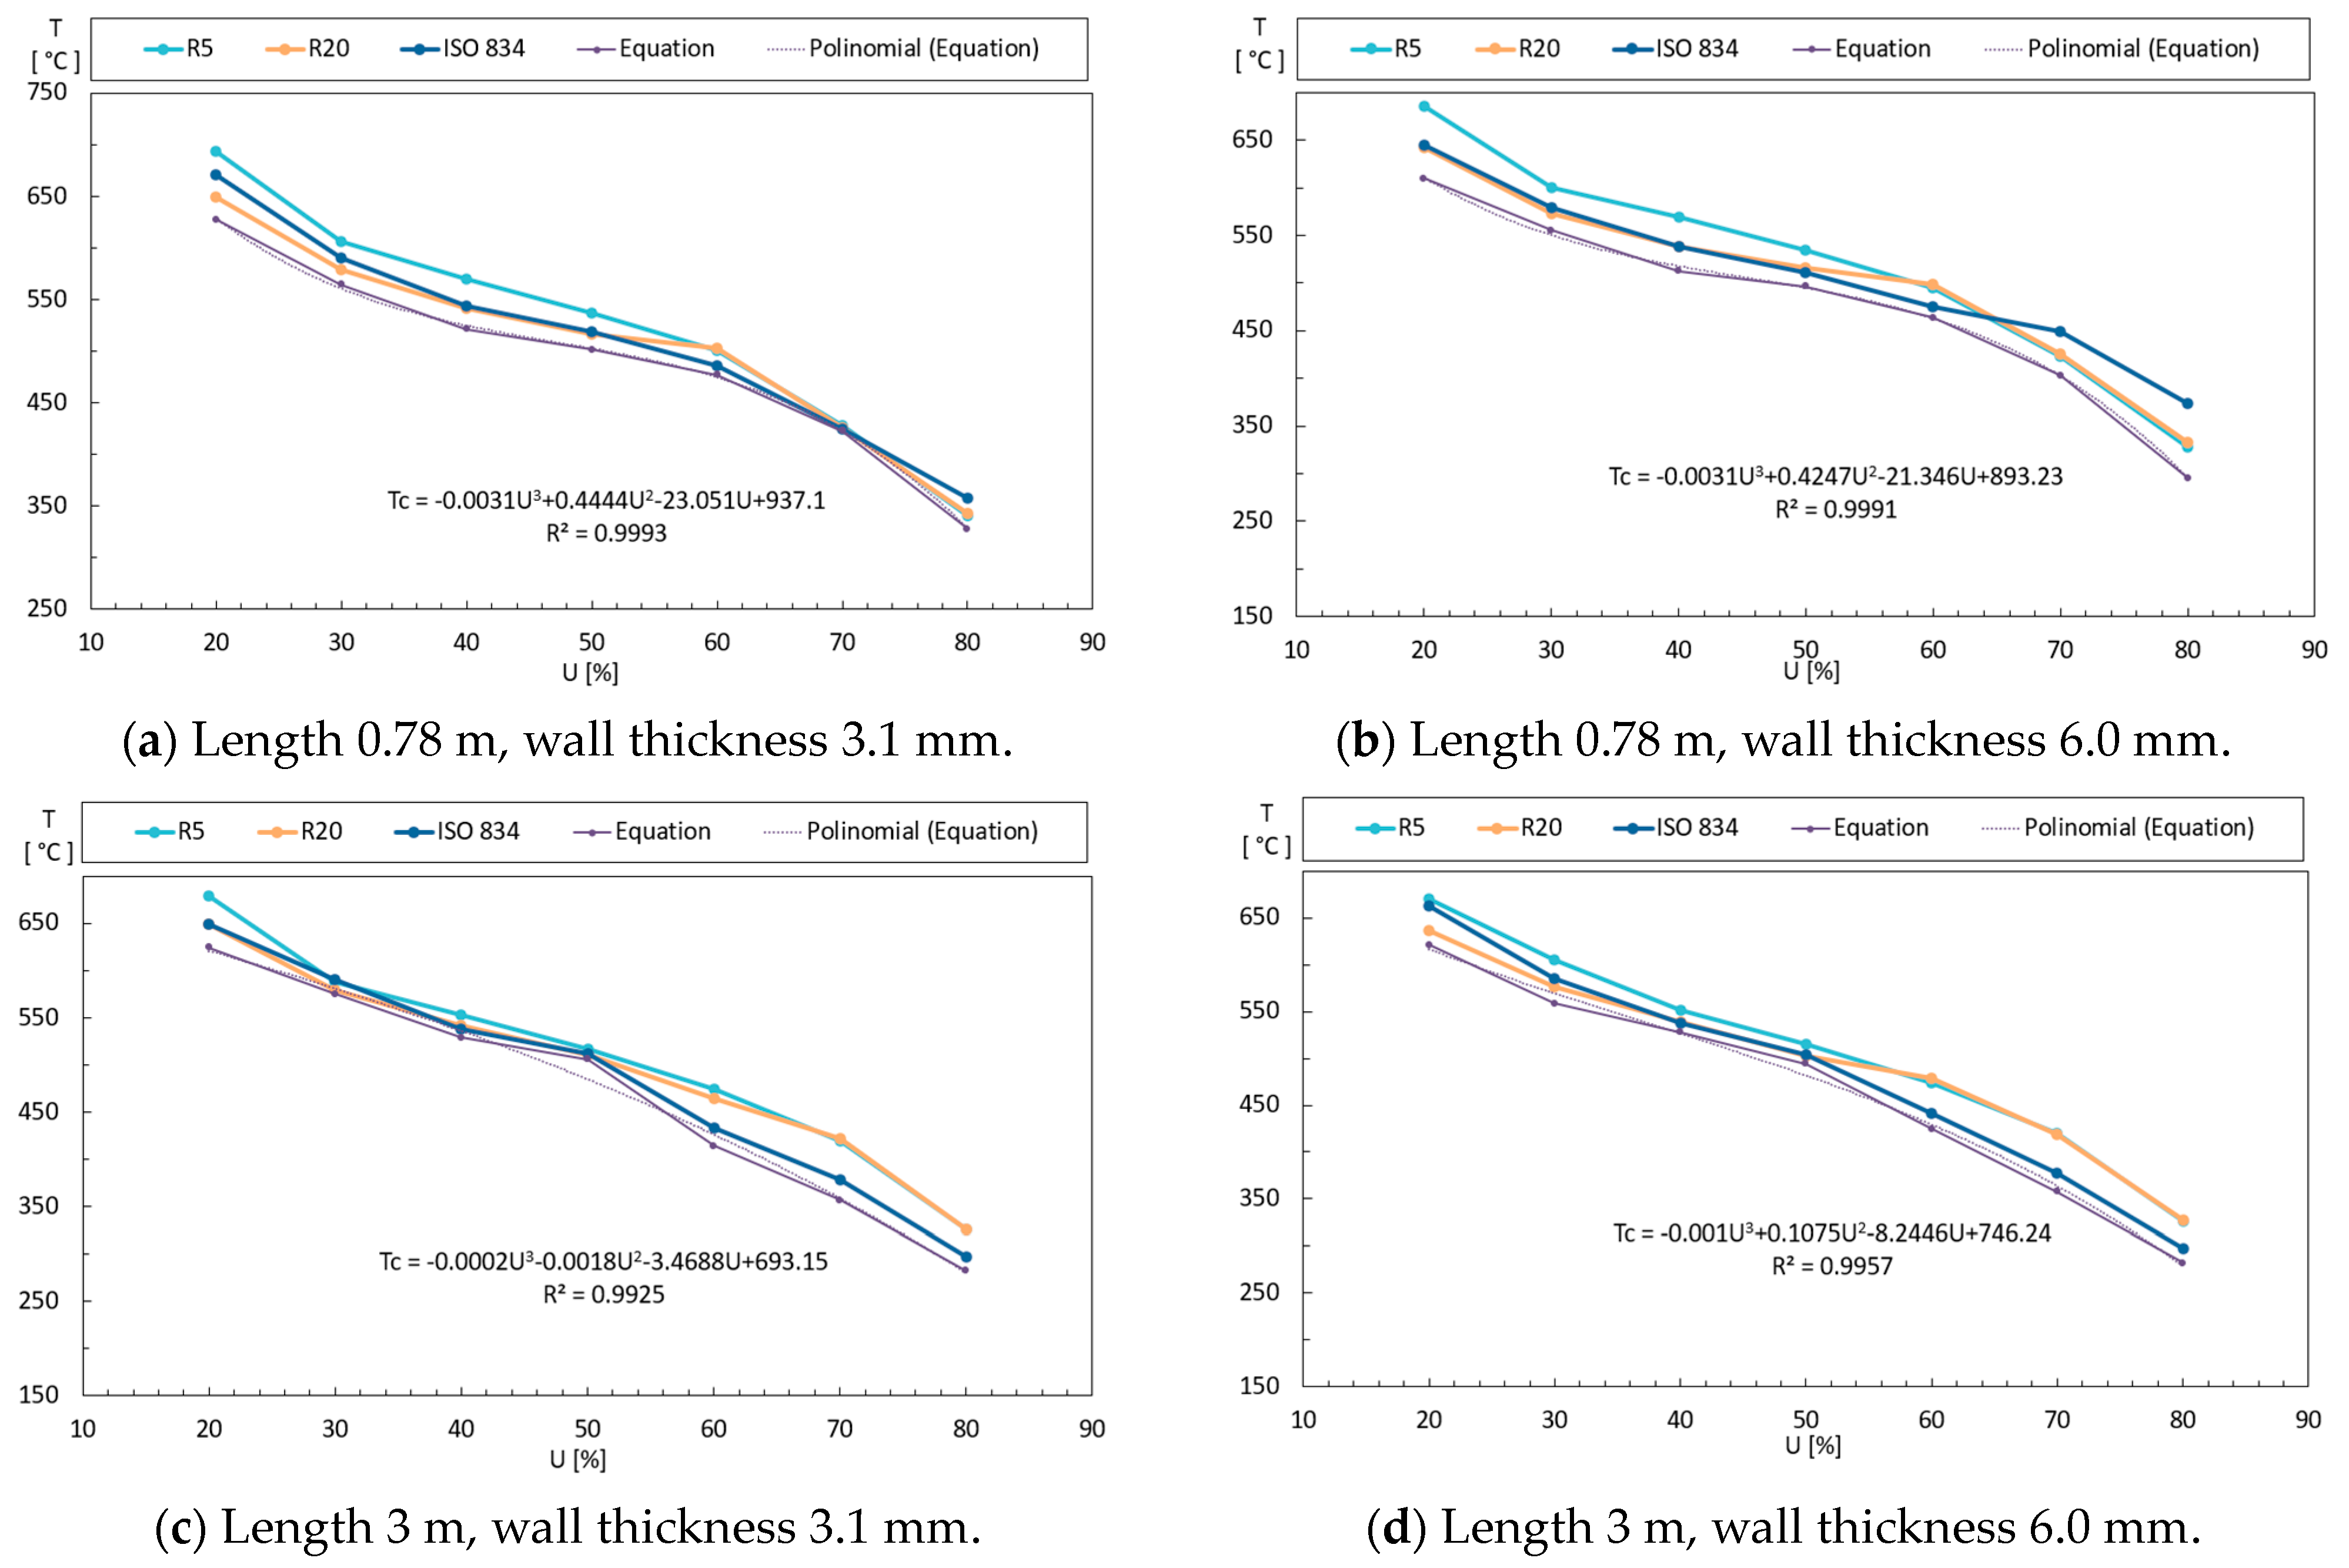
New design curves for the critical temperatures are presented by simulating hybrid columns with varying load levels, using the same procedure developed for CHS columns. The design curves are presented in Figure 18, where the critical temperature is depicted as a function of the load level (U) for hybrid columns. Figure 18a shows the results of hybrid columns with a length of 0.78 m and a thickness of 3.1 mm, while Figure 18b depicts results for the same length but a thickness of 6 mm. Figure 18c,d depict the results for hybrid columns with lengths of 3 m with thicknesses of 3.1 mm and 6 mm, respectively. Finally, Figure 18e,f depict the results for the case of hybrid columns with a length of 6 m and thicknesses of 3.1 mm and 6 mm, respectively. One can conclude that the load level (U) plays a crucial role in determining the critical temperature of columns, regardless of whether they are CHS or hybrid columns.

4.2. Effect of the Wall Thickness on the Critical Temperature

One can expect that the wall thickness also has a small effect on the critical temperature for hybrid columns.
Before conducting the GMNIA analyses at elevated temperatures, simulations were carried out at room temperature to determine the maximum load-bearing capacity of the columns, see Figure 19. The load bearing increases with the wall thickness.

4.3. Effect of the Element Length on the Critical Temperature Using Different Heating Rates

The parametric analysis involving column length requires a modification of the mesh and the introduction of geometric imperfections. Additionally, room temperature simulations were developed to determine load capacities, as seen in Figure 20. The 3 m columns were divided into 150 elements along their length, resulting in 19,440 elements, with only local imperfections used, since no global imperfections emerged in the buckling eigenvalue analysis for this length. On the other hand, the 6 m columns were divided into 200 elements, totalling 25,440 elements. Only global imperfections of L/1000 were used, as mentioned by Farmani et al. [12].
With these simulations completed, analyses with the three heating rates were conducted to verify the effect of length on the critical temperature, as shown in Figure 21. Figure 21a presents the results for the heating rate R5, Figure 21b for R20 and Figure 21c for ISO 834. It is noted that the variation in length affects the critical temperature in a complex manner, with longer columns experiencing a greater decrease in critical temperature, especially for higher load level values.

5. Comparison and Discussion of the Results

In this section, a comparison and discussion about the results of the simulations of CHS and hybrid (HB) columns are presented. It was observed that, for both cases, load level was the parameter that showed the most influence on the critical temperature. In the model, without considering the effect of creep, the heating rate exhibited a significant influence on the critical time but a weaker, yet still important, influence on the critical temperature. This was particularly notable for long columns in both cases, as seen in Figure 13 and Figure 18.
For both cases, long UHSS columns also exhibited a greater reduction in fire resistance for higher load levels (greater than 60%). The effect of thickness was almost negligible, especially for the CHS columns.
Since both column elements use the same material for the tubular element, one can directly compare their thermal and mechanical resistance. This can be observed in Figure 22, which illustrates a comparison between the critical temperature equations, where Figure 22a–c refers to columns with length of 0.78 m, 3 m, and 6 m, respectively.
It is notable that, in most cases, hybrid columns exhibit critical temperature values below those of the CHS columns. However, it is crucial to emphasise that the hybrid columns can endure a significantly higher applied load and experience less resistance loss with increasing length. Additionally, when analysing the results from Figure 16 and Figure 20, it can be observed that hybrid columns (HB) showed less loss of load-bearing capacity in ambient temperature with increasing length compared to CHS columns. While for 3 m and 6 m lengths, CHS columns exhibited 37% and 11% reduction in their capacity obtained at 0.78 m length, respectively, hybrid columns showed 98% reduction at 3 m and 58% at 6 m.
Therefore, while hybrid columns generally display a slightly lower critical temperature than CHS columns, they can withstand a much higher load for the same load level. This difference underscores the robustness and potential advantages of using hybrid columns in structural applications where both thermal and mechanical performance are critical.
Finally, to list the design equations for CHS and hybrid columns, one can refer to Table 17 for CHS columns and Table 18 for hybrid columns.

6. Conclusions

With the completion of all proposed simulations, it was possible to expand the database regarding the behaviour of UHSS columns under different heating rates. This aimed to provide a deeper understanding of the behaviour of these materials in fire conditions. In this context, new design equations for the critical temperature are presented depending on the load level (U). The simulations yielded satisfactory results, although it is crucial to highlight that, for a more precise analysis, it would be necessary to consider the effect of creep, which was not addressed in this study.
It can be noted that both for CHS columns and hybrid ones, the variation in the wall thickness showed small modifications in the critical temperature. On the other hand, columns with longer lengths exhibited inferior performance for higher load levels. The heating effect was less pronounced in longer columns. Furthermore, the load level was the parameter that showed the greatest influence. These considerations are consistent with investigations [4,12].
Regarding the use of hybrid columns when compared to CHS columns, it is observed that hybrid columns generally exhibited lower critical temperature values for the same load level. However, it is crucial to highlight that hybrid columns may be subjected to significantly higher loads. Additionally, they demonstrate less loss of resistance with increasing length, making the use of longer UHSS columns more attractive, especially for high-rise buildings.

Author Contributions

Conceptualization, P.A.G.P.; methodology, P.A.G.P. and A.S.P.; software, P.A.G.P. and A.S.P.; validation, A.S.P.; formal analysis, P.A.G.P. and A.S.P.; investigation, A.S.P.; resources, P.A.G.P.; data curation, A.S.P.; writing—original draft preparation, P.A.G.P., A.S.P. and A.C.M.; writing—review and editing, P.A.G.P., A.S.P. and A.C.M.; visualization, A.S.P.; supervision, P.A.G.P. and A.C.M.; project administration, P.A.G.P. All authors have read and agreed to the published version of the manuscript.

Funding

This research received no external funding.

Institutional Review Board Statement

Not applicable.

Informed Consent Statement

Not applicable.

Data Availability Statement

Data available upon request to the correspondent author.

Conflicts of Interest

The authors declare no conflict of interest.

References

  1. CEN fprEN 1993-1-1:2022; Design of Steel Structures—Part 1-1: General Rules and Rules for Buildings. CEN: Brussels, Belgium, 2021.
  2. Javidan, F.; Heidarpour, A.; Zhao, X.-L.; Minkkinen, J. Application of high strength and ultra-high strength steel tubes in long hybrid compressive members: Experimental and numerical investigation. Thin-Walled Struct. 2016, 102, 273–285. [Google Scholar] [CrossRef]
  3. Nassirnia, M.; Heidarpour, A.; Zhao, X.-L.; Minkkinen, J. Innovative hollow columns comprising corrugated plates and ultra high-strength steel tubes. Thin-Walled Struct. 2016, 101, 14–25. [Google Scholar] [CrossRef]
  4. Wang, F.; Liang, Y.; Zhao, O.; Young, B. Pin-ended press-braked S960 ultra-high strength steel angle section columns: Testing, numerical modelling and design. Eng. Struct. 2021, 228, 111418. [Google Scholar] [CrossRef]
  5. Neuenschwander, M.; Knobloch, M.; Fontana, M. Elevated temperature mechanical properties of solid section structural steel. Constr. Build. Mater. 2017, 149, 186–201. [Google Scholar] [CrossRef]
  6. Azhari, F.; Heidarpour, A.; Zhao, X.L.; Hutchinson, C.R. Post-fire mechanical response of ultra-high strength (Grade 1200) steel under high temperatures: Linking thermal stability and microstructure. Thin-Walled Struct. 2017, 119, 114–125. [Google Scholar] [CrossRef]
  7. Li, H.-T.; Young, B. Mechanical properties of cold-formed high strength steel at elevated temperatures. In Insights and Innovations in Structural Engineering, Mechanics and Computation; CRC Press, Taylor & Francis Group: Boca Raton, FL, USA, 2016; Volume 64, pp. 1022–1027. [Google Scholar]
  8. Qiang, X.; Jiang, X.; Bijlaard, F.S.K.; Kolstein, H. Mechanical properties and design recommendations of very high strength steel S960 in fire. Eng. Struct. 2016, 112, 60–70. [Google Scholar] [CrossRef]
  9. Farmani, M.A.; Heidarpour, A.; Zhao, X.-L. A distinctive approach to testing and modeling thermal creep in ultra-high strength steel. Int. J. Mech. Sci. 2021, 198, 106362. [Google Scholar] [CrossRef]
  10. CEN prEN1993-1.2: 2023; Eurocode 3: Design of Steel Structures—Part 1-2: General Rules—Structural Fire Design. CEN: Brussels, Belgium, 2023; pp. 1–97.
  11. Farmani, M.A.; Heidarpour, A. Development of design equations for ultra-high strength steel CHS columns under transient fire conditions considering thermal creep and axial restraint effects. Fire Saf. J. 2023, 136, 103756. [Google Scholar] [CrossRef]
  12. Farmani, M.A.; Heidarpour, A.; Woo, C. Thermal creep of hybrid steel columns comprising ultra-high strength steel tubes and stainless steel plates under transient fire conditions. Thin-Walled Struct. 2023, 185, 110540. [Google Scholar] [CrossRef]
  13. Madenci, E.; Guven, I. The Finite Element Method and Applications in Engineering Using ANSYS; Springer: New York, NY, USA, 2006. [Google Scholar]
  14. Piloto, P.A.G.; Khetata, M.S.; Ramos-Gavilán, A.B. Analysis of the critical temperature on load bearing LSF walls under fire. Eng. Struct. 2022, 270, 114858. [Google Scholar] [CrossRef]
  15. CEN EN 1363-1; Fire Resistance Tests—Part 1: General Requirements. CEN: Brussels, Belgium, 2020.
  16. CEN EN 13501-2; Fire Classification of Construction Products and Building Elements. CEN: Brussels, Belgium, 2009.
  17. ISO ISO 834-1; Fire Resistance Tests—Elements of Building Construction—Part 1: General Requirements. International Organization for Standardization: Geneva, Switzerland, 1999; p. 25.
  18. CEN EN 10219-2:1997; Cold Formed Welded Structural Hollow Sections of Non-Alloy and Fine Grain Steels—Part 2: Tolerances, Dimensions and Sectional Properties. Deutsche Industrie Norm: Berlin, Germany, 1997.
  19. Crisfield, M.A. An arc-length method including line searches and accelerations. Int. J. Numer. Methods Eng. 1983, 19, 1269–1289. [Google Scholar] [CrossRef]
  20. Fonseca, E.M.M.; Oliveira, C.A.M.; Melo, F.Q. Experimental Validation of a Theoretical Model in Thin-Walled Structures. Exp. Mech. (Port. Assoc. Exp. Mech.) 2002, 8, 41–48. (In Portuguese) [Google Scholar]
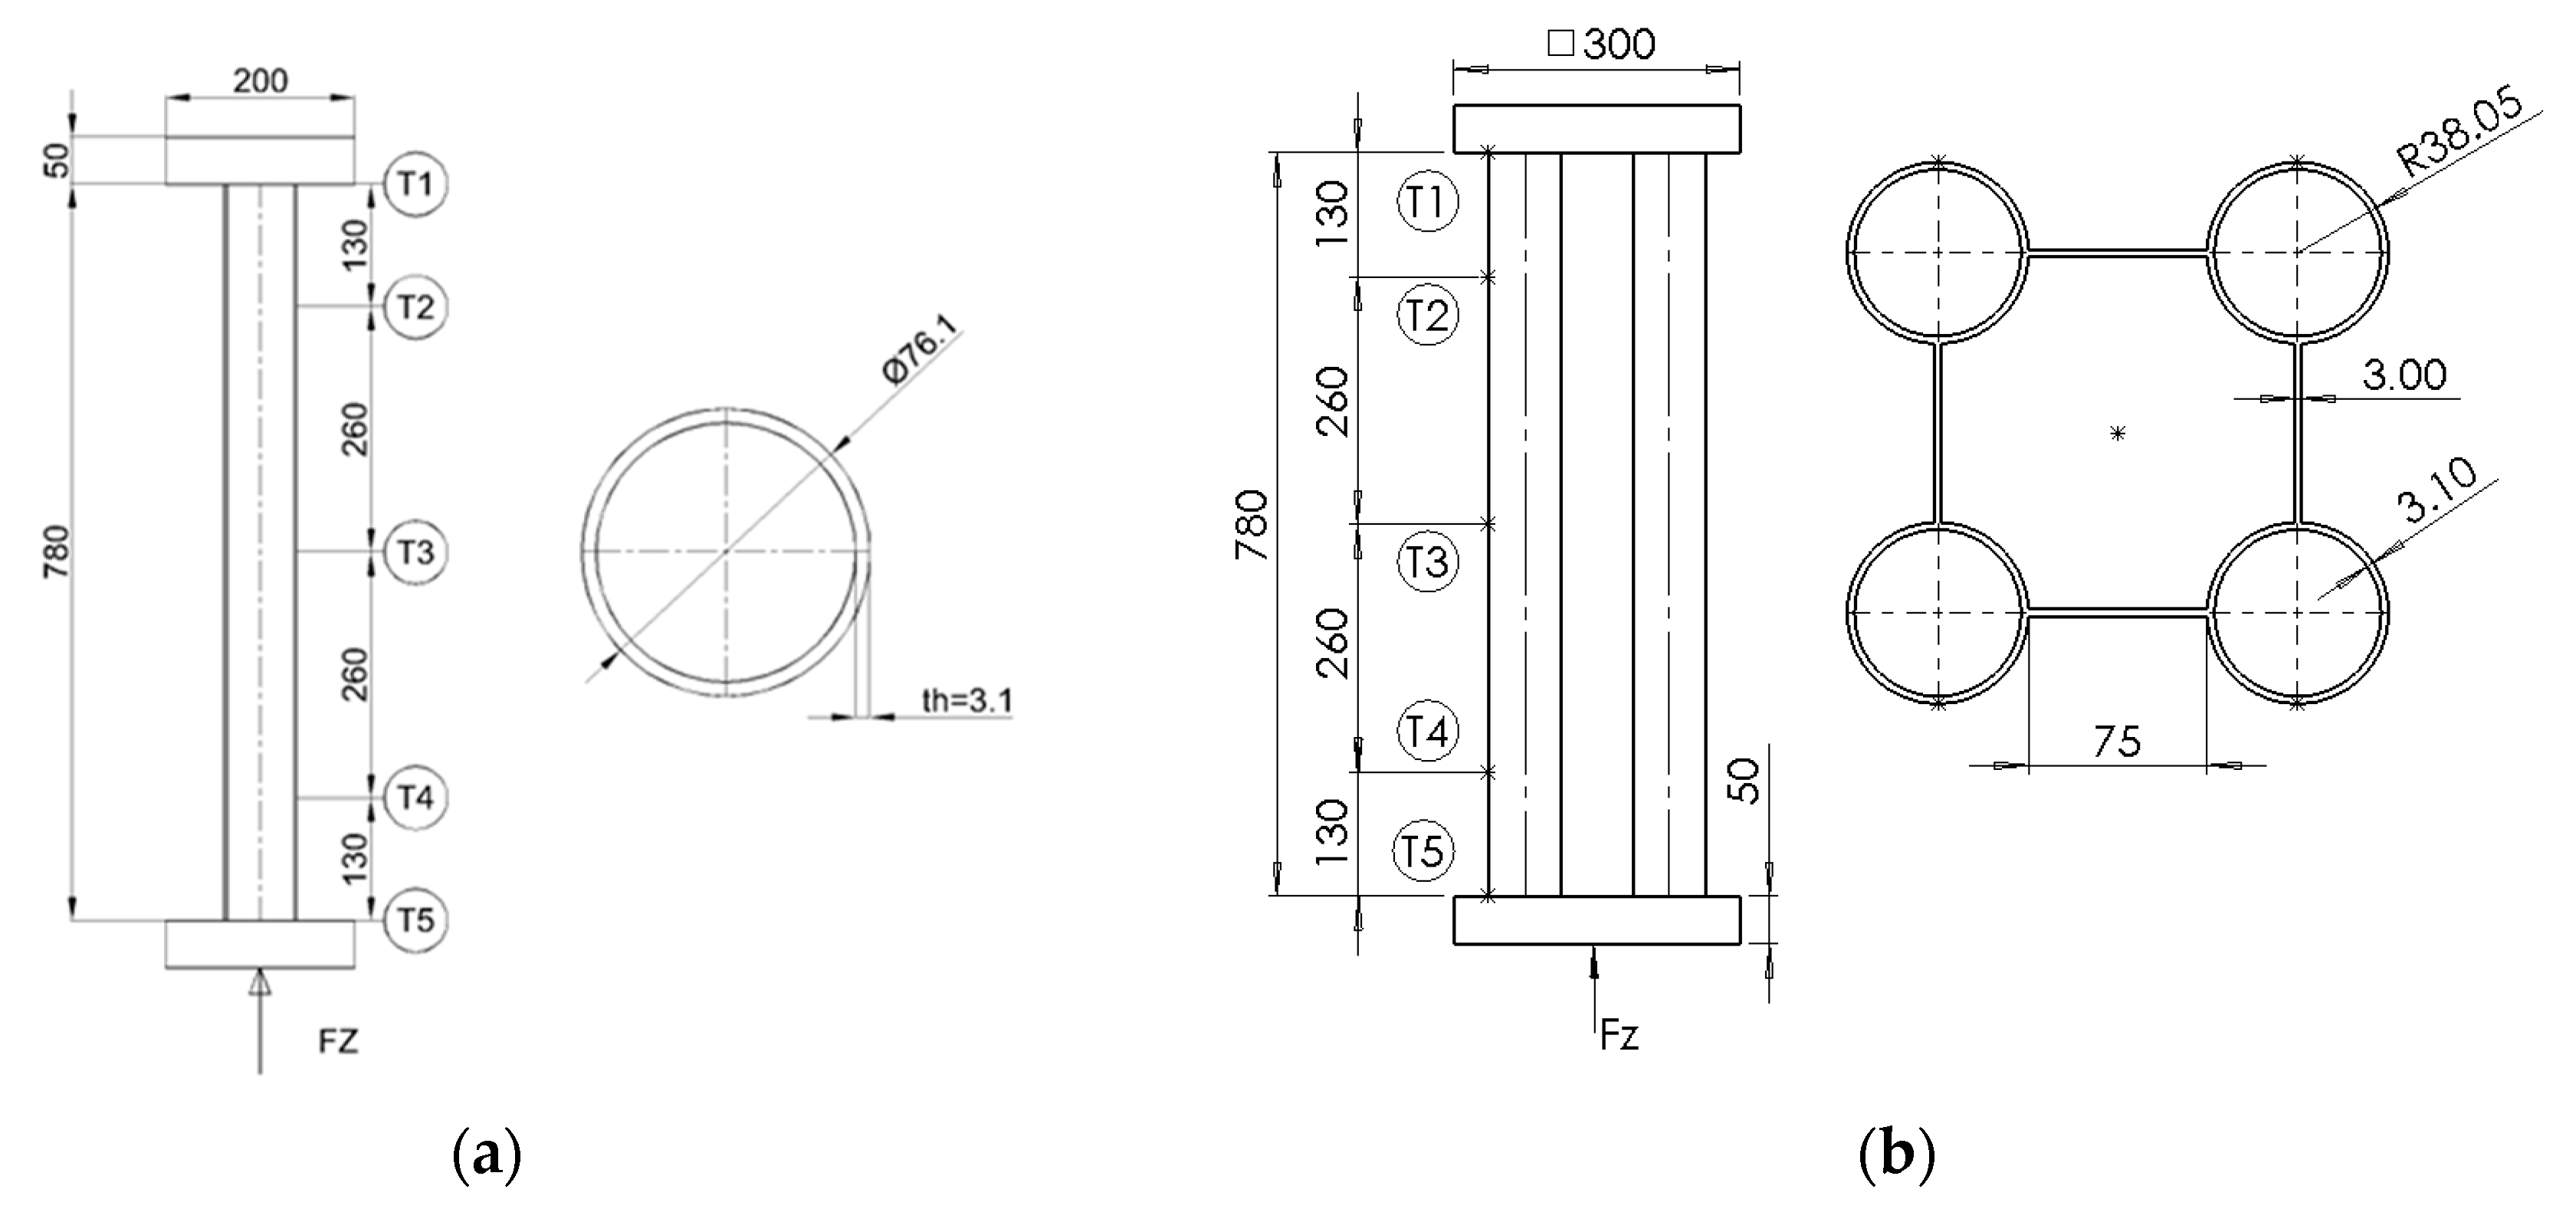
Figure 1. Geometry and thermocouples for: (a) CHS column; (b) Hybrid column.
Applsci 14 04887 g001
Figure 2. Experimental set up: (a) CHS column [11]; (b) Hybrid column [12].
Applsci 14 04887 g002
Figure 3. Boundary conditions for: (a) CHS column; (b) Hybrid column.
Applsci 14 04887 g003
Figure 4. Stress–strain graphs for: (a) UHSS; (b) SS.
Applsci 14 04887 g004
Figure 5. Imperfections for the CHS column.
Applsci 14 04887 g005
Figure 6. Validation of load-bearing capacity of CHS column at room temperature [11].
Applsci 14 04887 g006
Figure 7. Validation for CHS columns for high temperatures [11].
Applsci 14 04887 g007aApplsci 14 04887 g007b
Figure 8. CHS failure modes: (a) Experimental [11]; (b) Ansys.
Applsci 14 04887 g008
Figure 9. Imperfections for the hybrid column.
Applsci 14 04887 g009
Figure 10. Validation of load-bearing capacity of hybrid column at room temperature [12].
Applsci 14 04887 g010
Figure 11. Validation for hybrid columns at high temperatures. Displacement and rate of displacement over time [12].
Applsci 14 04887 g011
Figure 12. Hybrid failure modes: (a) Experimental [12]; (b) Ansys.
Applsci 14 04887 g012
Figure 13. Critical temperature vs. load level for CHS columns.
Applsci 14 04887 g013
Figure 14. Axial displacement vs. critical time graph for CHS with length of 0.78 m.
Applsci 14 04887 g014
Figure 15. Effect of CHS thickness variation on room temperature resistance.
Applsci 14 04887 g015
Figure 16. CHS columns at ambient temperature with (a) length of 3 m (b) length of 6m.
Applsci 14 04887 g016
Figure 17. The effect of the CHC column length.
Applsci 14 04887 g017
Figure 18. Critical temperature versus load level (U) for UHSS hybrid columns.
Applsci 14 04887 g018aApplsci 14 04887 g018b
Figure 19. Effect of tube hybrid thickness variation on room temperature resistance.
Applsci 14 04887 g019
Figure 20. Hybrid columns at ambient temperature with (a) length of 3 m (b) length of 6 m.
Applsci 14 04887 g020
Figure 21. The effect of the hybrid column length.
Applsci 14 04887 g021
Figure 22. Comparison of equations for critical temperature.
Applsci 14 04887 g022
Table 1. Chemical elements of the UHSS CHS [11].
ElementCSiMnPSCrNiMoB
Content (%)0.2300.8001.7000.0250.0151.5001.0000.5000.005
Table 2. Mechanical properties room temperature of the UHSS tubes.
E T   ( G P a ) σ 0.2 , T   ( M P a ) σ u , T   ( M P a )
19812001375
Table 3. Mechanical properties at room temperature of the SS plates.
E T   ( G P a ) σ 0.2 , T   ( M P a ) σ u , T   ( M P a )
193250315
Table 4. Thermal conductivity for UHSS.
Temperature of Steel T [°C]Thermal Conductivity λa (W/(m × K))
20 [°C] < T < 800 [°C] 54 3.33 × 10 2   T
800 [°C] ≤ T ≤ 1200 [°C]27.3
Table 5. Specific heat for UHSS.
Temperature of Steel T [°C] Heat   Capacity   c a (J/(kg × K))
20 [°C] < T < 600 [°C] 425 + 7.73 × 10 1 T 1.69 × 10 3 T 2 + 2.22 × 10 6 T 3
600 [°C] ≤ T ≤ 735 [°C] 666 + 13,002 738 T
735 [°C] ≤ T ≤ 900 [°C] 545 + 17,820 T 731
900 [°C] ≤ T ≤ 1200 [°C]650
Table 6. Experimental results for CHS column.
SpecimenLoad Level
(%)
Load-Bearing
Capacity (kN)
Load
(kN)
Critical Temperature R20 (°C)Critical Temperature R5 (°C)
U0.25 25 936234641617
U0.50 50 936468553522
U0.75 75 936702454431
Table 7. Nonlinear analysis force at elevated temperatures.
Time [s]Force (N)
0 0
10Fz
t s i m Fz
Table 8. Results for CHS column with R20.
SpecimenLoad Level
(%)
Load-Bearing
Capacity (kN)
Load
(kN)
Critical Temperature Ansys (°C)Relative ERROR
(%)
RMSE
(mm)
U0.25 25 917.9229.47627.3−2.131.08
U0.50 50 917.9458.95521.8−5.640.35
U0.75 75 917.9688.43402.1−11.430.31
Table 9. Results for CHS column with R5.
SpecimenLoad Level
(%)
Load-Bearing
Capacity (kN)
Load
(kN)
Critical Temperature Ansys (°C)Relative ERROR
(%)
RMSE
(mm)
U0.25 25 917.9229.47650.25.372.15
U0.50 50 917.9458.95538.43.140.81
U0.75 75 917.9688.43407.4−5.470.49
Table 10. Experimental results for hybrid column.
SpecimenLoad Level
(%)
Load-Bearing
Capacity (kN)
Load
(kN)
Critical Temperature R20 (°C)Critical Temperature R5 (°C)
U0.30 30 41201236626604
U0.45 45 41201854571537
U0.60 60 41202472551483
Table 11. Results for hybrid column with R20.
SpecimenLoad Level
(%)
Load-Bearing
Capacity (kN)
Load
(kN)
Critical Temperature Ansys (°C)Relative ERROR
(%)
RMSE
(mm)
U0.30 30 1298.521298.52579.40.381.95
U0.45 45 1947.781947.78527.92.912.61
U0.60 60 2597.042597.04503.23.760.92
Table 12. Results for hybrid column with R5.
SpecimenLoad Level
(%)
Load-Bearing
Capacity (kN)
Load
(kN)
Critical Temperature Ansys (°C)Relative ERROR
(%)
RMSE
(mm)
U0.30 30 1298.521298.52606.3−7.440.96
U0.45 45 1947.781947.78552.6−7.550.79
U0.60 60 2597.042597.04501.2−1.530.40
Table 13. Parametric study for CHS.
Length [m]Thickness [m]Heating Rate [°C/min]Load Level
[%]
Simulations
0.78/3.0/6.0 3.1 / 6.0 R5/R20/ISO 83420/30/40/50/60/70/80126
Table 14. Geometry for parametric study for CHS.
SpecimenLength [m]Thickness [m]Slenderness
L0.78 t3.1 0.78 3.115.1
L0.78 t6 0.78 615.7
L3 t3.1 3 3.158.1
L3 t63660.3
L6 t3.163.1116.1
L6 t666120.6
Table 15. Parametric study for hybrid.
Length [m]Thickness of Tube [m]Heating Rate [°C/min]Load Level
[%]
Simulations
0.78/3.0/6.0 3.1 / 6.0 R5/R20/ISO 83420/30/40/50/60/70/80126
Table 16. Geometry for parametric study for hybrid.
SpecimenLength [m]Thickness [m]Slenderness
L0.78 t3.1 0.78 3.14.55
L0.78 t6 0.78 64.71
L3 t3.1 3 3.117.49
L3 t63618.12
L6 t3.163.134.98
L6 t66636.24
Table 17. Design equation for critical temperature for CHS columns.
Length [m]Thickness [mm]Design Equation
0.78 3.1 0.0024 U 3 + 0.3547 U 2 20.072 U + 915.51
0.78 6 0.00247 U 3 + 0.404 U 2 22.332 U + 944.7
3 3.1 0.0019 U 3 + 0.2233 U 2 13.009 U + 838.42
36 0.0023 U 3 + 0.2834 U 2 15.564 U + 870.37
63.1 0.003 U 3 + 0.3879 U 2 19.7 U + 931.39
66 0.0028 U 3 + 0.3589 U 2 18.468 U + 915.52
Table 18. Design equation for critical temperature for hybrid columns.
Length [m]Thickness [m]Design Equation
0.78 3.1 0.0031 U 3 + 0.4444 U 2 23.051 U + 937.1
0.78 6 0.0031 U 3 + 0.4247 U 2 21.346 U + 893.23
3 3.1 0.0002 U 3 0.0018 U 2 3.4688 U + 693.15
36 0.001 U 3 + 0.1075 U 2 8.2446 U + 746.24
63.1 0.0027 U 3 + 0.3506 U 2 19.002 U + 919.38
66 0.0028 U 3 + 0.349 U 2 18.421 U + 897.04
Disclaimer/Publisher’s Note: The statements, opinions and data contained in all publications are solely those of the individual author(s) and contributor(s) and not of MDPI and/or the editor(s). MDPI and/or the editor(s) disclaim responsibility for any injury to people or property resulting from any ideas, methods, instructions or products referred to in the content.